Response of Common Bean Genotypes Grown in Soil with Normal or Limited Moisture, with Special Reference to the Nutrient Phosphorus

1
Department of Agriculture, Kyambogo University, P. O. Box 1 Kyambogo, Uganda
2
Department of Agricultural Production, Makerere University, P. O. Box 7062 Kampala, Uganda
3
Department of Soil and Environment, Swedish University of Agricultural Sciences, Nytorgetsgatan 3A, Apt. 1201, SE-981 34 Ornskoldvik, Sweden
*
Author to whom correspondence should be addressed.
Agronomy 2018, 8(8), 132; https://doi.org/10.3390/agronomy8080132
Submission received: 14 June 2018
/
Revised: 13 July 2018
/
Accepted: 20 July 2018
/
Published: 30 July 2018
Abstract
:Drought and phosphorus deficiency in the soil are the major production limitations of common beans (Phaseolus vulgaris L.) in Sub-Saharan Africa. This study measured the yield responses of low phosphorus-tolerant common beans to drought stress. A field experiment was conducted under two drought conditions codenamed, non-drought-stress (NDS) and drought-stress (DS). The former was located at Mukono Zonal Agricultural Research and Development Institute (MUZARDI) in Mukono District, characterised by rainfall of more than 400 mm season−1. The latter was situated at Wabinyonyi in Nakasongola District, characterised by less than 300 mm season−1; both in central Uganda. Treatments included the two study conditions (NDS and DS); and four test bean genotypes, AFR703-1, AFR 708, JESCA, and MCM 2001, against a local check, K131. A water deficit of 156 mm season−1 was observed in the DS site causing a drought intensity index (DII) of 40%. That pattern contrasted considerably in the NDS site where the actual rainfall did not significantly (p > 0.05) vary from the required water by the bean plant. Whereas genotypes AFR703-1 and AFR708 out-yielded the local check in NDS by 213 and 681 kg ha−1, respectively; their grain yield harvested was comparable to the control yield in DS. When grown under DS, low P-tolerant beans, especially the AFR703-1 and AFR708, survived drought stress through faster development by reducing the number of days to flower, reach physiological maturity and develop seeds. AFR703-1 and AFR708 sufficiently withstand drought stress, and are therefore recommended for inclusion in cropping systems that are characteristically constrained by the combined soils’ P deficiency and/or drought.
1. Introduction
The common bean (Phaseolus vulgaris L.) is a major legume crop grown and consumed worldwide. The crop is a staple food in many parts of Sub-Saharan Africa (SSA) where its per capita consumption has been estimated up to more than 60 kg [1]. For low-income households, the crop contributes over 50% of dietary protein, carbohydrates, vitamins and micro-nutrients [2]. Common bean production is principally carried out in marginal rain-fed areas, where drought, caused by inadequate and unreliable rainfall; is a frequent problem, and access to irrigation facilities is limited or not possible [1]. This causes significant crop failure and malnutrition in such areas [3].
Common bean production losses caused by agricultural drought have been estimated at up to 1000 kg ha−1 season−1 in SSA, where the amount of rainfall received is less than 300 mm in 60–120 days of bean cropping cycle [4]. The performance of the crop depends on both the amount of moisture stored in the soil and precipitation of an area. Thus, although it may be transitory, water shortfall may well occur at any stage of the crop’s growth [5]. In general, drought is a function of inconsistencies in the amount and distribution of rainfall, and is considered as the major cause of variability in the grain yield of common beans [4].
Soils prone to drought in SSA are also deficient in phosphorus, as a result of declined P mobility, transpiration and membrane permeability causing a reduced root-absorbing potential of the crop [6]. This in turn exacerbates the negative impact of drought on bean production. However, an adequate supply of P in the soil has been reported to be partly responsible for increased drought resistance in grain legumes [7]. This is because uptake of soil P enhances root development that assists in the exploitation of the available soil moisture. This improves early grain maturation before the onset of soil moisture deficit is triggered by terminal drought [8].
The application of inorganic P-fertilizers would replenish P in P-deficient soil, however damage to the environment triggered by the P disappearing through soil erosion will continue until methods for cleaning the environment are used. Besides, in SSA, the use of inorganic P fertilizers is predominantly restricted by high costs related to the application together with low availability, making farmers apply it only occasionally and sometimes using inadequate amounts below the required rates [9]. Furthermore, most of the P applied to soil can be transformed into inaccessible forms that cannot be exploited by plants [10]. The use of phosphorus efficient genotypes, such as low P-tolerant common beans that can thrive in P-deficient soils with high P acquisition and/or utilization efficiency and good yield compared to P-inefficient ones, would reduce the production costs associated with P fertilizer applications, minimise environmental contamination and maintain scarce P globally. However, the possibility that a low P-tolerant common bean can induce significant performance response to drought stress has not been explored, despite the co-existence of both production constraints. This study aimed at determining the yield responses of low P-tolerant common beans to drought stress.
Theoretical Perception of Drought
In this study, drought was defined as a deficiency in precipitation over a growing season, causing a shortage in water [11] that cannot provide adequate soil moisture required by a growing plant. Drought stress was perceived according to Wortmann, Kirkby [4] and Beebe, Ramirez [12], as the amount of precipitation of less than the range of 350 to 500 mm for a 60–120 day bean production cycle. It was measured based on the fact that (i) inadequately supplied water leads to insufficient soil moisture that cannot restore losses caused by evapotranspiration [13]; and (ii) soil moisture levels influence the crop water requirement for any crop. According to Wilhelmi, Hubbard [14], crop water requirements can be determined based on evapotranspiration (ET0). The significance of ET0 in considerations of drought has been formerly used in determining seasonal crop moisture deficiency [14,15]. The detailed measurement of drought conditions is presented in the section on materials and methods of this paper.
2. Materials and Methods
A field experiment was conducted in the Nakasongola and Mukono districts of central Uganda during the rains of March–June and August–December in 2014. Nakasongola district, located in the cattle corridor, is one of Uganda’s driest districts with relatively low rainfall ranging from 500 to 1000 mm annually and a five-month long dry season. The district experiences extremely spatial and temporal rainfall variability, with highly frequent and severe droughts. By contrast, Mukono district receives a bimodal rainfall regime with a mean annual rainfall 1100–1600 mm. It has minimum annual temperatures of 15 °C to 18 °C and maximum temperatures of 25 °C to 28 °C [16].
Nakasongola which received rainfall in a range of 233 to 241 mm season−1 was considered as the drought-stressed (DS) condition; while Mukono that experienced rainfall of 453 to 476 mm season−1 was designated as the non-drought-stress (NDS) condition. Site soil samples were collected from the study areas for pre-experimental characterisation of soil pH, N, P, and exchange cations (K+, Ca2+ and Na+), organic matter, texture, structure using routine laboratory procedures [17]. The DS site was characterised by a sandy loam soil with a pH (6.3), organic matter (2.2%) and total N (0.16%). Similarly, the soil in NDS site was loamy with a pH (6.1), organic matter (2.4%) and total nitrogen (0.14%). Both the study sites were characteristically deficient in soil P; with less than 10 ppm Bray-1 P: 8.4 and 7.1 Bray-1-P (mg kg−1), respectively; in DS site and NDS site [18].
Treatments included two drought conditions (NDS and DS), and four test common bean genotypes; AFR 703-1, AFR 708, JESCA, and MCM 2001 bean genotypes and K131 as a local check; provided by International Center for Tropical Agriculture (CIAT). The test genotypes were previously characterised as materials that can survive in soil deficient in available P [9,19]. The treatments were laid out in a randomised complete block design with three replicates. For each plot, a buffer of two rows of the same genotype was planted to safeguard the plants grown inside, against hedge effects. Bean seeds used were inoculated with Rhizobium tropici CIAT899 strain (Mak-Bio-N-Fixer), provided by the Biological N2 Fixation Laboratory at the College of Agriculture and Environmental Sciences, Makerere University. Four inoculated seeds were sown manually two days after the onset of seasonal rainfall in each study site, and seedlings were thinned to two plants per hill, 14 days after emergency. The plants were spaced at 60 cm between and 20 cm within rows. Weeding was done manually with hand hoes at 28 and 49 days after planting. Insect pests for common beans such as whiteflies and black bean aphid were controlled using a foliar spray of Tafgor-40-EC (Dimethoate 40% inflammable) at 600 mL ha−1 [3]. Detailed descriptions of the study areas, their soil characteristics and genealogy of plant materials used can be found in [18].
2.1. Data Collection
2.1.1. Climate Parameters
Climate data monitored in the field included the amount of rainfall, number of rainy days and evapotranspiration. Rainfall was recorded under each drought condition using a rain-gauge placed within each study site. The amount of rainfall and number of rainy days were supplemented by data recorded from the regional agro-metrological centres at Mukono Zonal Agricultural Research Development Institute (MUZARDI) and Wabinyonyo for Mukono and Nakasongola Districts, respectively. Evapotranspiration was determined based on the mathematical model of the United Nations Food and Agriculture Organization (FAO) [20], in Equation (1). According to this model, water availability is influenced by temperature, latitude and time of the year, which in turn determine water requirements [20]. The mathematical model using ET0 is given as:
where: ETcrop = the crop water requirement of a given crop in mm per unit of time (mm day−1 or mm season−1); Kc = the crop factor (factor for bean crop); and ET0 = the reference crop evapotranspiration in mm per unit of time (mm day−1 or mm season−1). ET0 was determined by the Blaney–Criddle formula as:
where: T = mean daily temperature (°C); and P = mean daily percentage of annual daytime hours. These values were adopted from (FAO, 1986). Substituting ET0 in Equation (2) into Equation (1),
ETcrop = Kc × ET0
ET0 = P (0.46T + 8)
ETcrop = Kc × P (0.46T + 8)
The values of Kc, a seasonal crop coefficient; in the mathematical model (3), caters for the growth stages of the reference crop including the sowing date, rate of crop development, length of growing season and climate [20].
2.1.2. Atmospheric Temperatures
Daily minimum and maximum atmospheric temperatures were obtained from the neighbouring regional agro-metrological centres that were within the study areas (MUZARDI and Wabinyonyo).
2.1.3. Drought Intensity Index (DII)
As indicated earlier in the introduction of this paper, the drought condition that caused soil water deficit was assessed based on the fact that soil moisture levels influence crop water requirements. Water requirement (ETcrop) was determined using the evapotranspiration (ET0) approach [14,17]; in Equation (3). The drought intensity index (DII) was then determined by comparing daily or seasonal bean plant water requirements with the actual rainfall received according to Sivakumar, Motha [15], as:
Assumptions: Drought stress condition arises if the actual rainfall is less than the water needed by the plant. If DII value is in the range of 26–50, it indicates a moderate drought conditions while a value more than 50 signifies severe drought intensity [15].
2.1.4. Determination of Plant Growth
Leaf area index was measured using a central leaflet width method [21], at 50% flowering. Leaf area index (LAI) was determined by first establishing the leaf area for each plant using the relationship between leaf area and central leaflet width, and then dividing the total leaf area of each plant by the area of the soil surface in plots [21]. Leaf area was measured on fully expanded leaves of five plants randomly selected per plot. Leaf area (LA) was calculated as
where: L is the maximum width of the central leaflet of each leaf in cm.
LA = 2.1371 × L1.9642 − 2.7013
For shoot biomass measurement, five plants were randomly selected at mid-pod formation stage depending on the genotypes. Stems and leaves were removed from the sampled plants and oven dried at 80 °C for 48 h for dry weight measurement, whereas Harvest index (HI) was computed according to Acosta-Díaz, Acosta-Gallegos [22], as the percentage of dry seed weight to the above-ground biomass at harvest.
2.1.5. Bean Plant Phenology
Phenological characteritics included days to flower (DF), physiological maturity (DPM) and seed fill (DSF). Days to flowering was recorded as the number of days (from planting) when 50% of the plants had one open flower. Days to physiological maturity was measured as number of days when 90% of the pods had lost their green pigmentation and DSF was calculated as the difference between DPM and DF [22].
2.1.6. Bean Yield Components
At the end of physiological maturity, bean plants were harvested by hand on the whole plot basis. The number of pods was determined by counting pods on a random sample of five plants in each treatment replicate. On the same sample, the number of seeds on a plant was recorded. The pods were threshed by hand and sundried up to 14% moisture content. Grain yield was determined by a digital electronic balance, with a precision scale of +0.001. Grain yield per treatment replicate was then extrapolated to yield ha−1. The weight of 100 seeds was determined on seeds randomly sub-sampled from the harvested treatment replicate, measured using the same precision scale as above. Means of both grain yield and its components were adjusted based on Randomised Completer Block Design (RCBD). Yield day−1 was also established as grain yield divided by DPM [23].
2.2. Data Analysis
Normality for all the variables was tested by the Shapiro–Wilk test [24]. All the measured variables were normal (p < 0.05). The field data for the two seasons were tested for homogeneity using Bartlett’s test [25] before the combined analysis. According to Bartlett’s test, apart from the grain yield and the number of seeds on a plant; the rest of the measured variables were not homogeneous across the two seasons (p > 0.05). Therefore, a fixed effect model of analysis of variance was carried out for all the variables to cater for randomisation and variations in the data [26]. The StataSe statistical package, 11th edition (StataCorp, College Station, TX, USA), was used for the analysis and means were separated from the control using Dunnett’s test at 5% level of significance by comparing the mean value differences, between the control and non-control, with the Dunnett’s critical value as detailed in Ott and Longnecker [27]. Interactions between drought conditions and genotypes were established graphically in Microsoft Excel 2010; with standard error represented by bars over the mean [23]. Student t-test was also performed to establish whether, during the planting season; water deficit was experienced or not.
3. Results
3.1. Drought Intensity
Results on drought intensity index, actual rainfall and bean plant water requirements in the DS and NDS districts are presented in Table 1. The drought intensity index (DII) of 40% was observed at the DS site. This was caused by actual rainfall of 237 mm received, instead of 393 mm the amount of water a bean plant requires for normal development in a season. Although the actual rainfall was not significantly (p > 0.05) different from the required water by the plant, excess water of 85 mm in the same bean growing cycle was observed in the DS site. Also, the mean rainfall observed in the DS was significantly lower by 227 mm than what was recorded in the NDS. Besides, DS recorded higher mean daily minimum and maximum temperatures than the NDS.
3.2. Growth Parameters
3.2.1. Leaf Area Index (LAI)
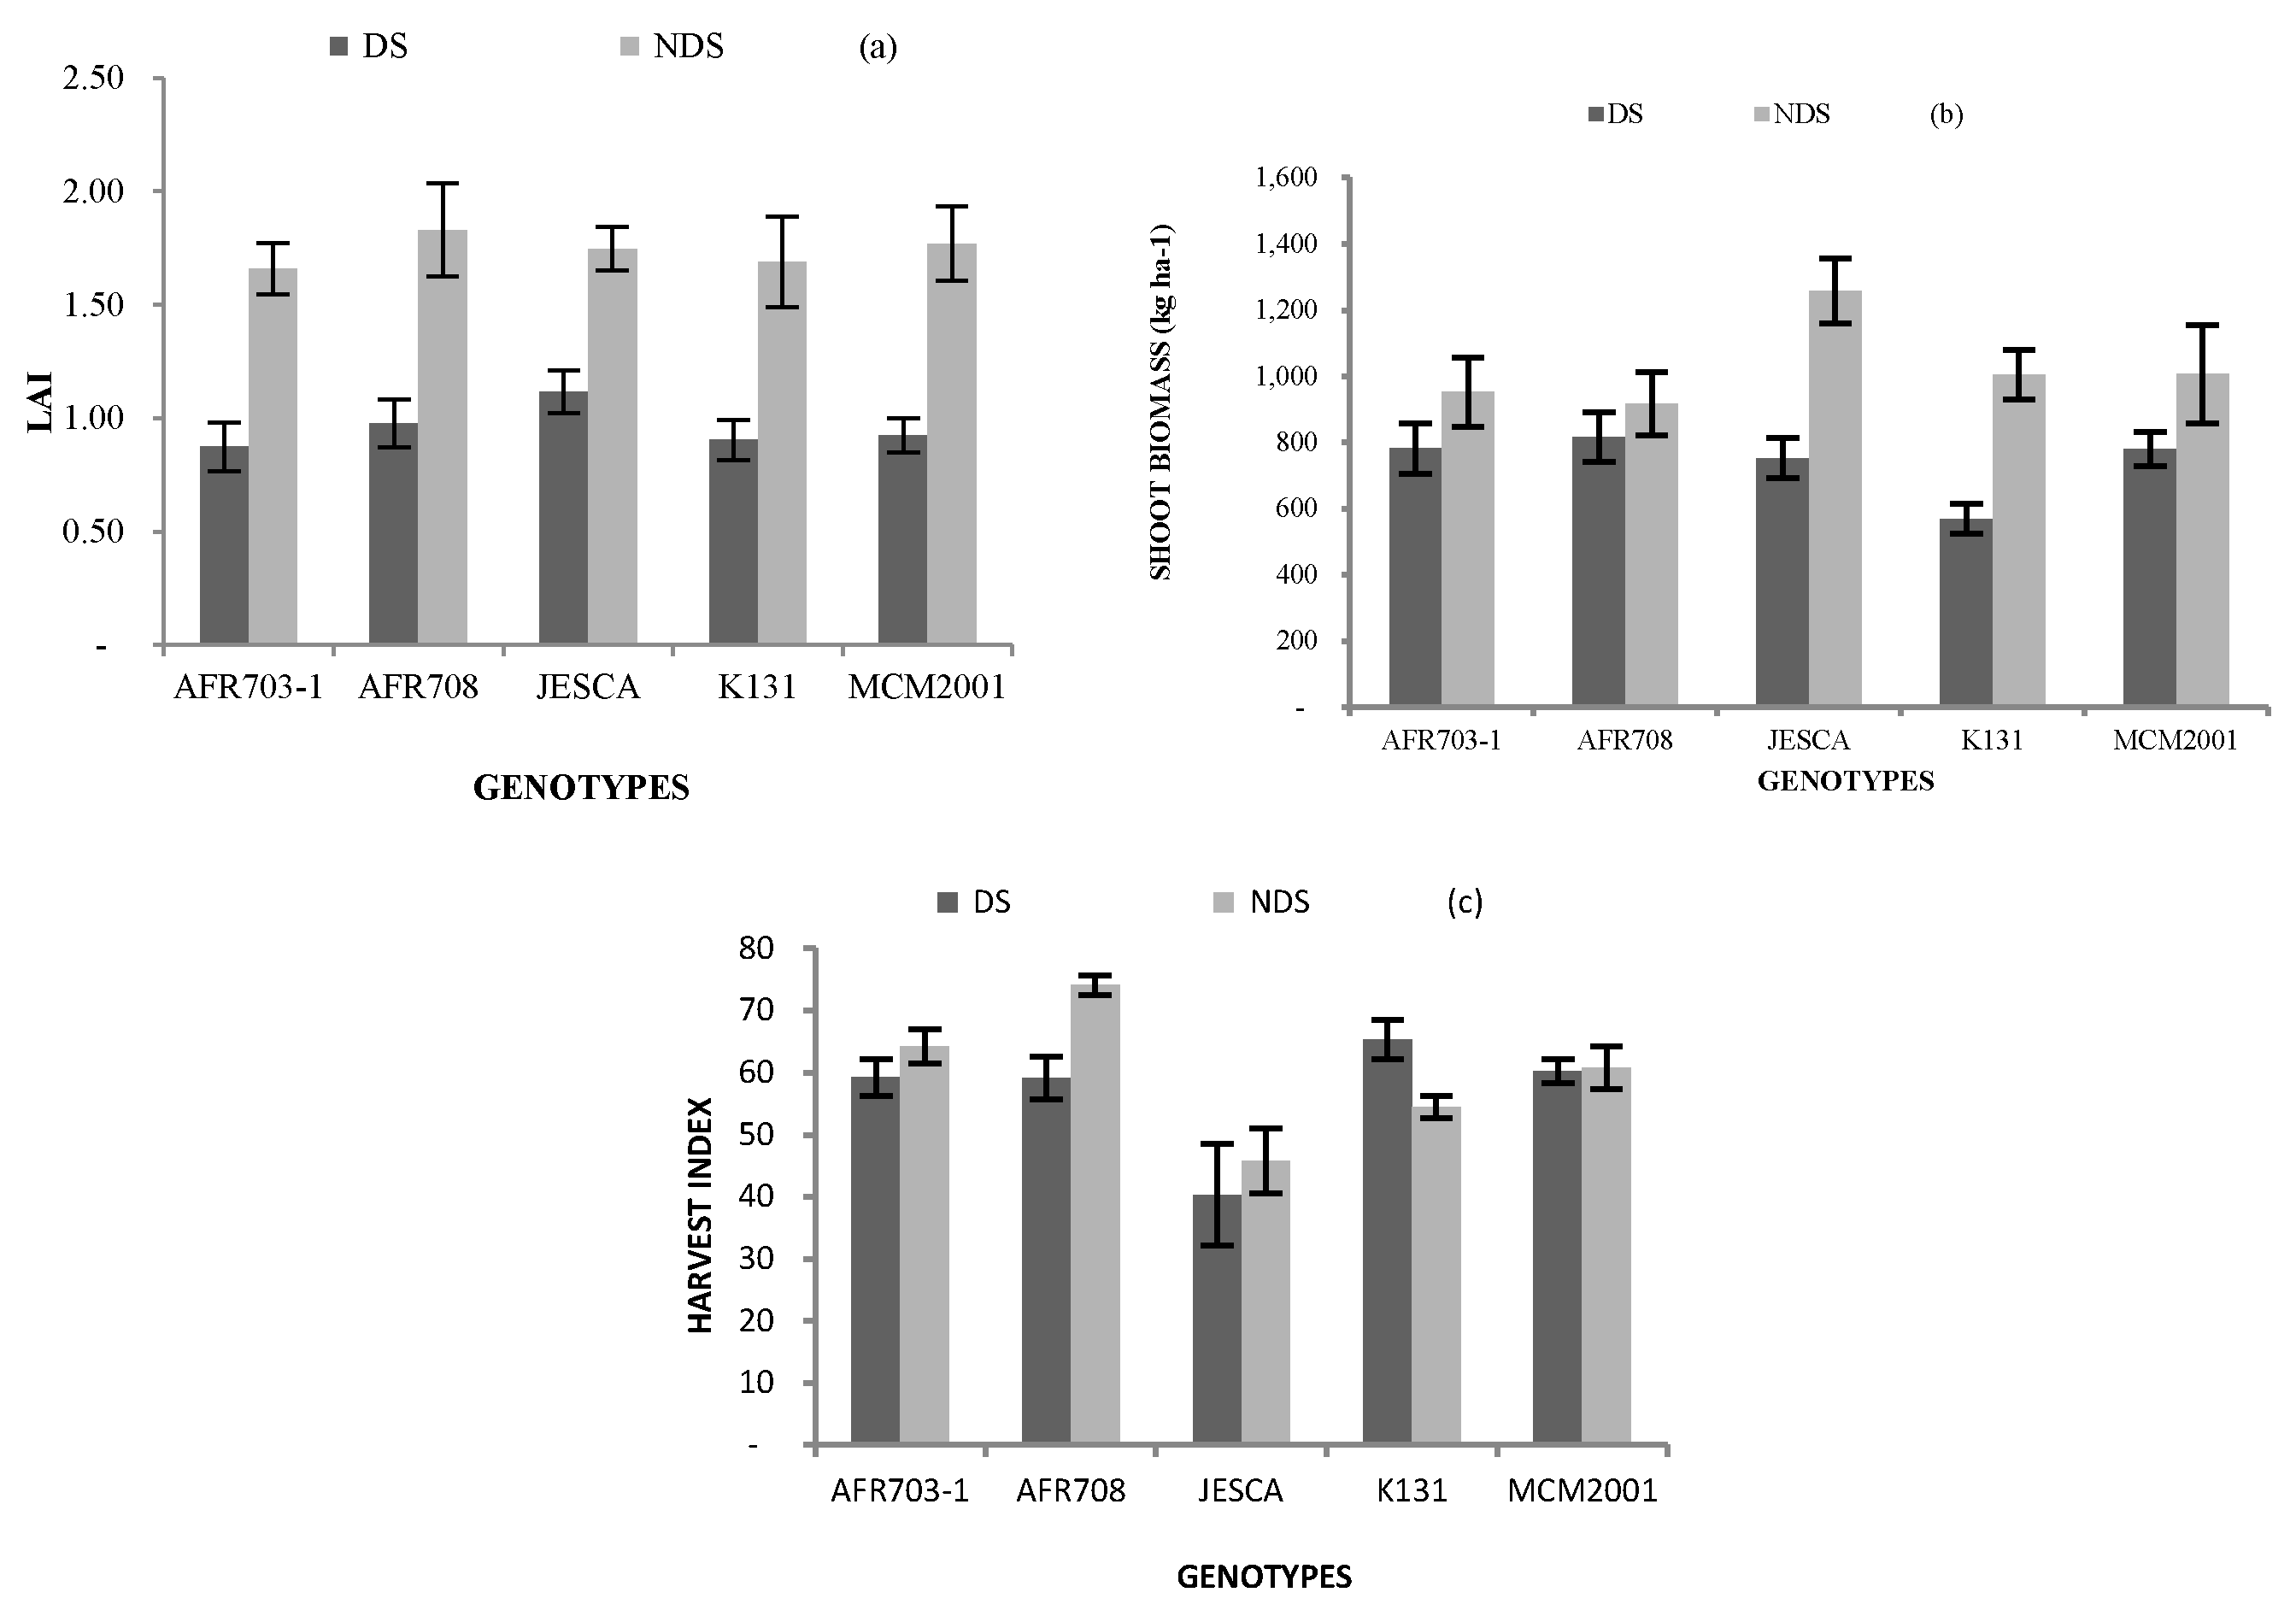
The results of the leaf area index (LAI) are presented in Figure 1a. There was a significant (p < 0.05) influence of the interaction between drought conditions and genotypes on LAI. In all genotypes and the local check, LAI values were constantly higher in the NDS than the value observed in the DS. In relation to the local check, all genotypes were not significantly (p < 0.05) different from the local check either in the DS or NDS. There was also a significant (p < 0.001) effect of drought stress on the LAI, with the DS taking on a lower reading of 0.96 than the recording of 1.7 in the NDS.
3.2.2. Shoot Biomass
As summarised in Figure 1b, a significant (p < 0.05) genotypic differences noticed for shoot biomass was caused by drought conditions. In DS, the genotypes significantly (p < 0.05) produced more shoot biomass than the local check. By contrast, the test genotypes and the local check assessed in NDS were similarly equal (p > 0.05). Across the drought conditions, JESCA produced shoot biomass of 1258 kg ha−1 in NDS compared to 753 kg ha−1 in DS (p < 0.05). Similarly the local check recorded significantly (p < 0.05) more shoot biomass in NDS than in DS, yet the rest of the genotypes produced more-or-less equal shoot biomass in DS as in NDS. Independent of genotypes, shoot biomass of 1028 kg ha−1 recorded in the NDS condition was significantly (p < 0.05) different from 740 kg ha−1 in DS.
3.2.3. Harvest Index (HI)
Results of the harvest index (HI) are also given in Figure 1c. A significantly (p < 0.05) interactive effect of drought conditions and genotype on HI was recorded. Independently in DS, apart from JESCA that statistically recorded lower HI than the local check did; the rest of the genotypes showed similar values to the check. In NDS, AFR703-1 and AFR708 recorded HI of 64 and 74%; respectively. Those values were significantly (p < 0.05) greater than for the local check; contrasting with JESCA that recorded significantly (p < 0.05) less HI (46%) than the local check. Conversely, the local check registered higher HI in DS than in NDS, but the HI recorded in AFR708 grown in NDS was higher than in DS.
3.3. Plant Phenology
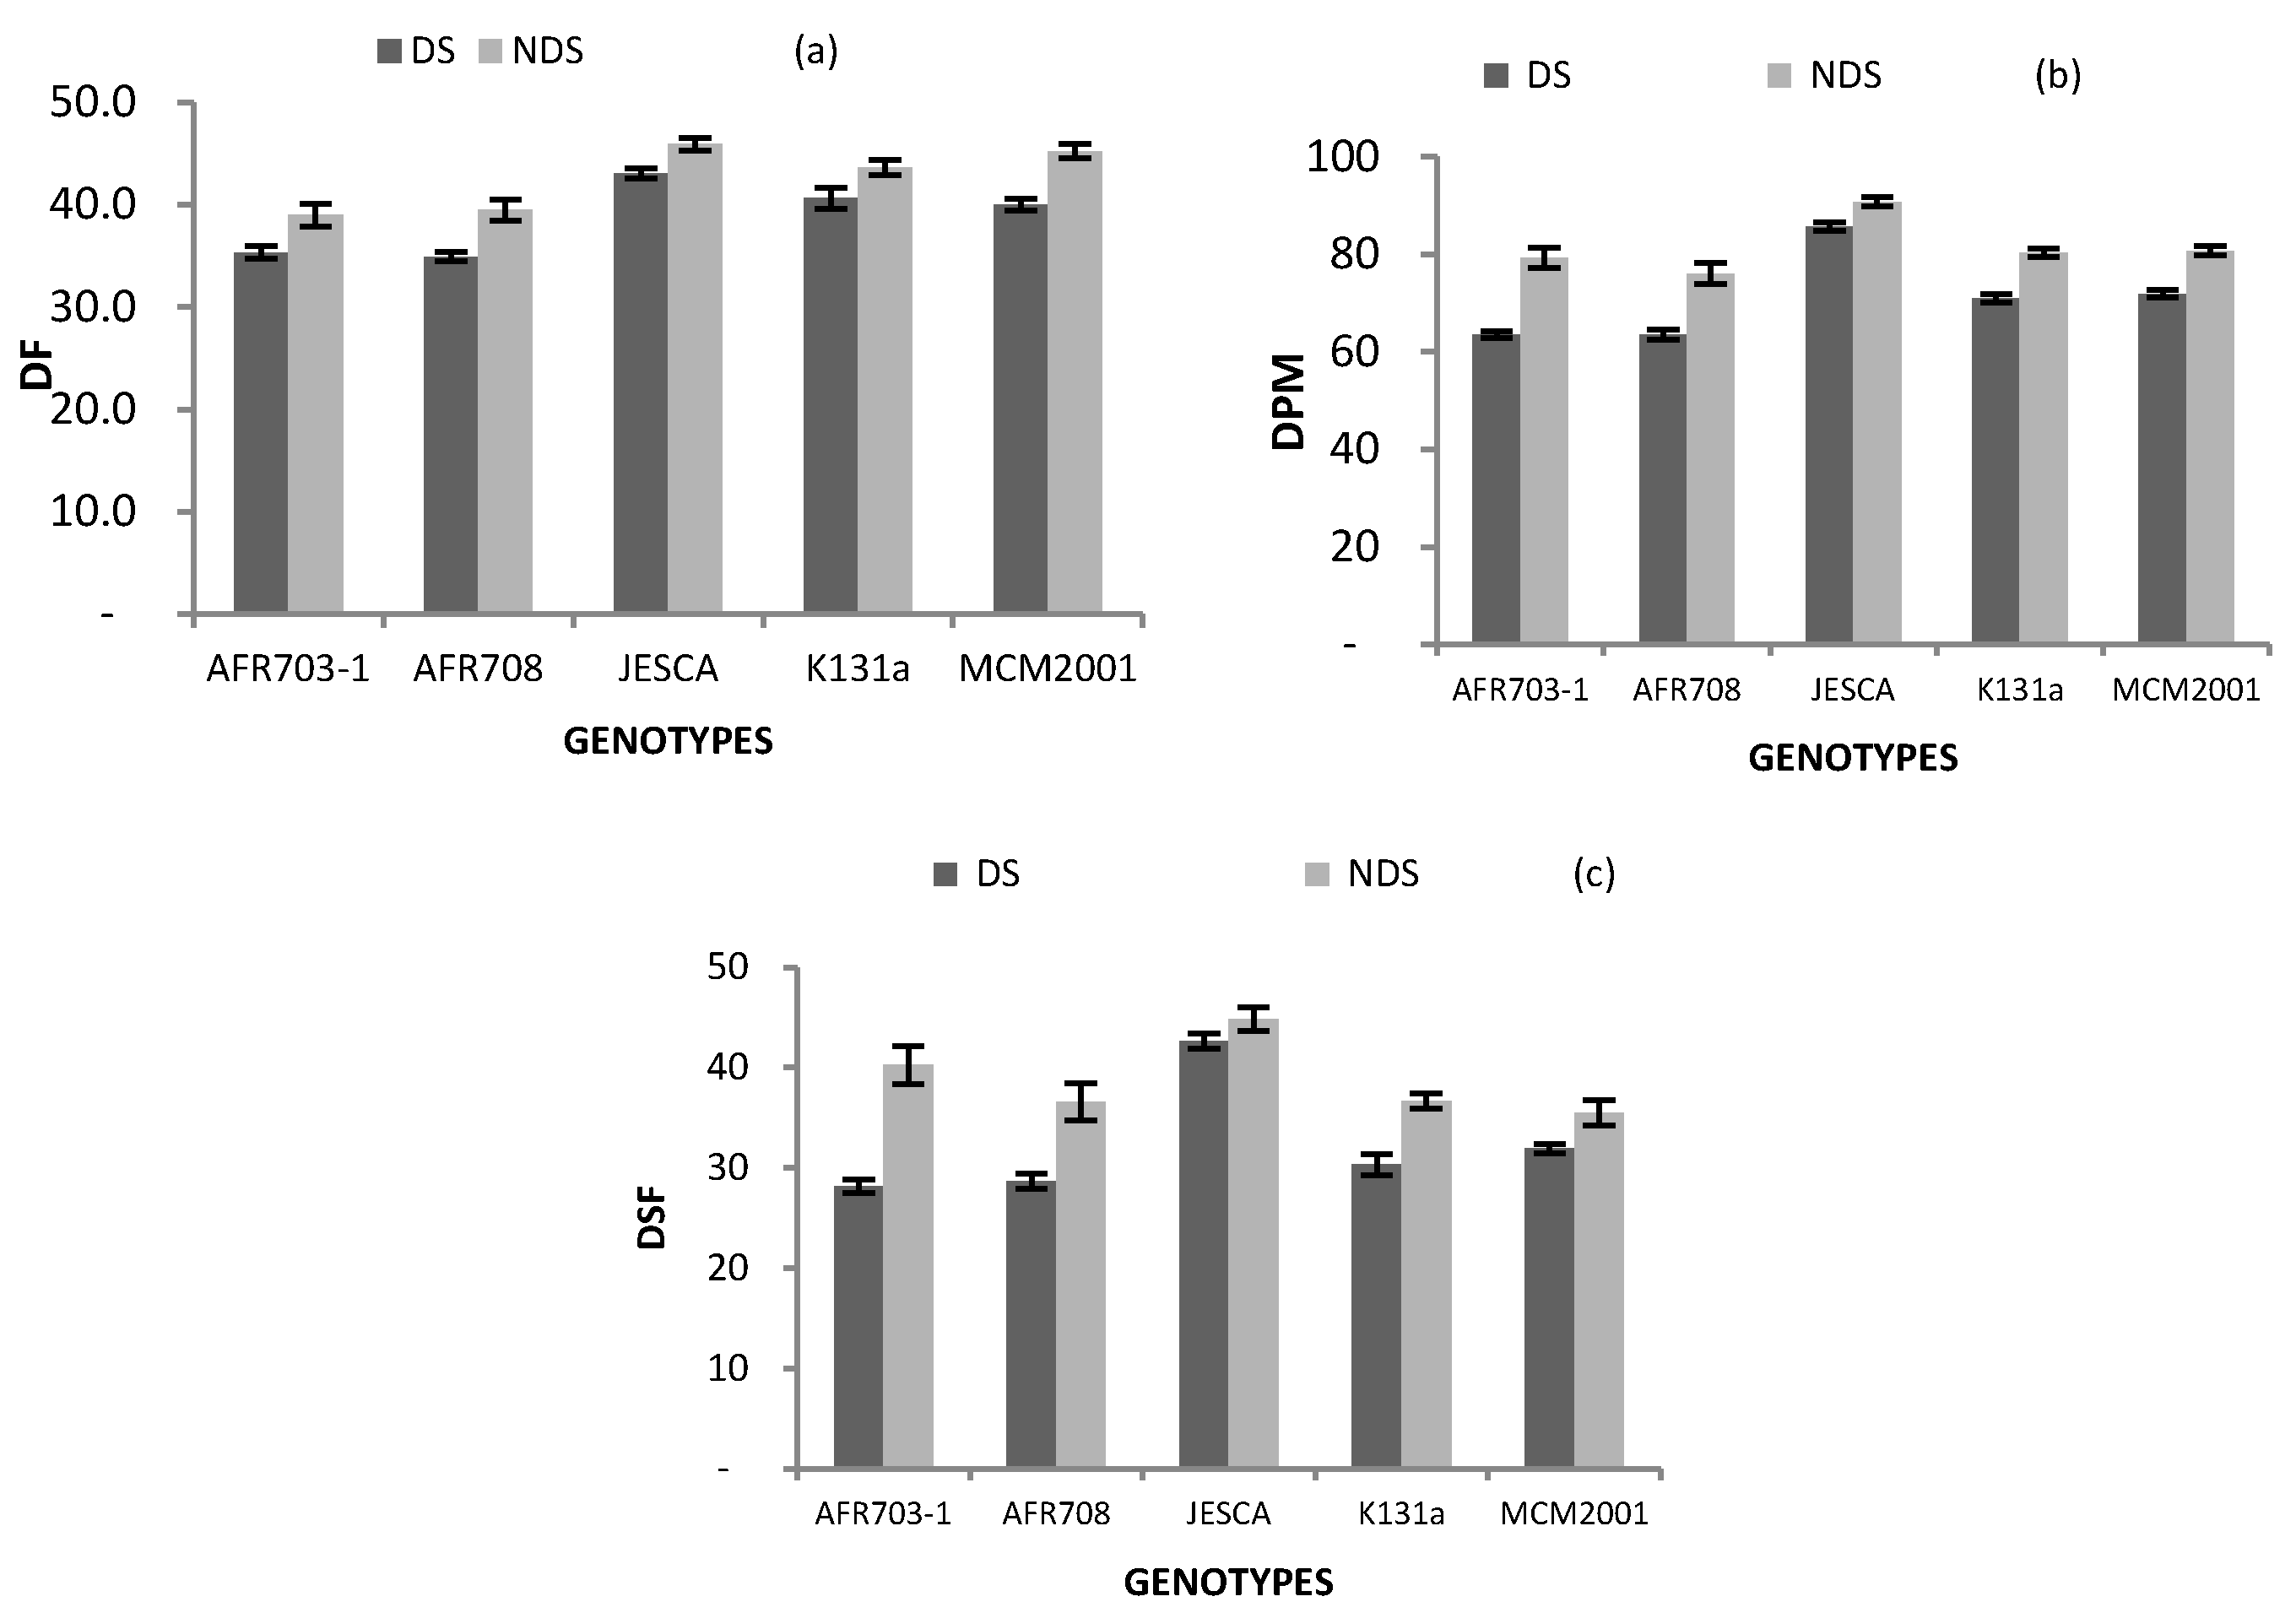
Results on the days the low P materials required to flower, attain physiological maturity and develop seeds under drought conditions are presented in Table 2 and Figure 1. Days to 50% flowering, physiological maturity and seed development were significantly (p < 0.05) varied by the genotypes, drought conditions and the interaction between genotypes and drought conditions. Regardless of genotypes, the mean values under DS were significantly (p < 0.05) less by 4, 10 and 6 days, respectively, for the beans to reach flowering, physiological maturity and seed development than those registered in NDS condition (Table 2). Similarly, genotypes AFR703-1 and AFR708 significantly (p < 0.001) reached flowering and physiological maturity earlier than the local check, yet JEACA significantly (p < 0.05) delayed, irrespective of drought conditions.
A highly significant (p < 0.05) interaction between drought conditions and genotypes on days to flower was observed (Figure 2a). Genotypes AFR703-1 and AFR708 flowered much earlier than the local check plants, whereas JESCA delayed flowering compared to the local check genotype grown in both DS and NDS conditions. All genotypes and the local check significantly (p < 0.05) flowered earlier in the DS than in NDS conditions.
As presented in Figure 2b, the interaction between drought conditions and genotypes for days to reach 90% physiological maturity (DPM) was significant (p < 0.001); while in DS, DPM ranged from 63 days in AFR703-1 to 86 days in JESCA, it ranged from 76 days in AFR708 to 91 days in JESCA in the NDS site. Genotypes AFR703-1 and AFR708 attained DPM by 8 and 7 days, respectively earlier; it took JESCA 15 days later than the local check plants grown in DS. In NDS, AFR708 matured early by 4 days, but JESCA was delayed by 11 days compared to the local check. Across drought conditions, the days to attain 90% physiological maturity was significantly (p < 0.001) influenced by drought conditions in all genotypes and the local check, they all matured earlier in the range of 5–16 days when grown in DS than in NDS.
Days to seed fill was significantly (p < 0.001) varied by the drought conditions × genotypes interaction (Figure 2c). JESCA delayed to develop seeds in both DS and NDS conditions by 12 and 8 days, respectively, in a manner similar to that of the local check. Across drought conditions, apart from JESCA (p > 0.05) the rest of the genotypes and the local check had early seed development. The effect was in the range of 4 to 12 days in DS compared to NDS.
3.4. Yield and Its Components
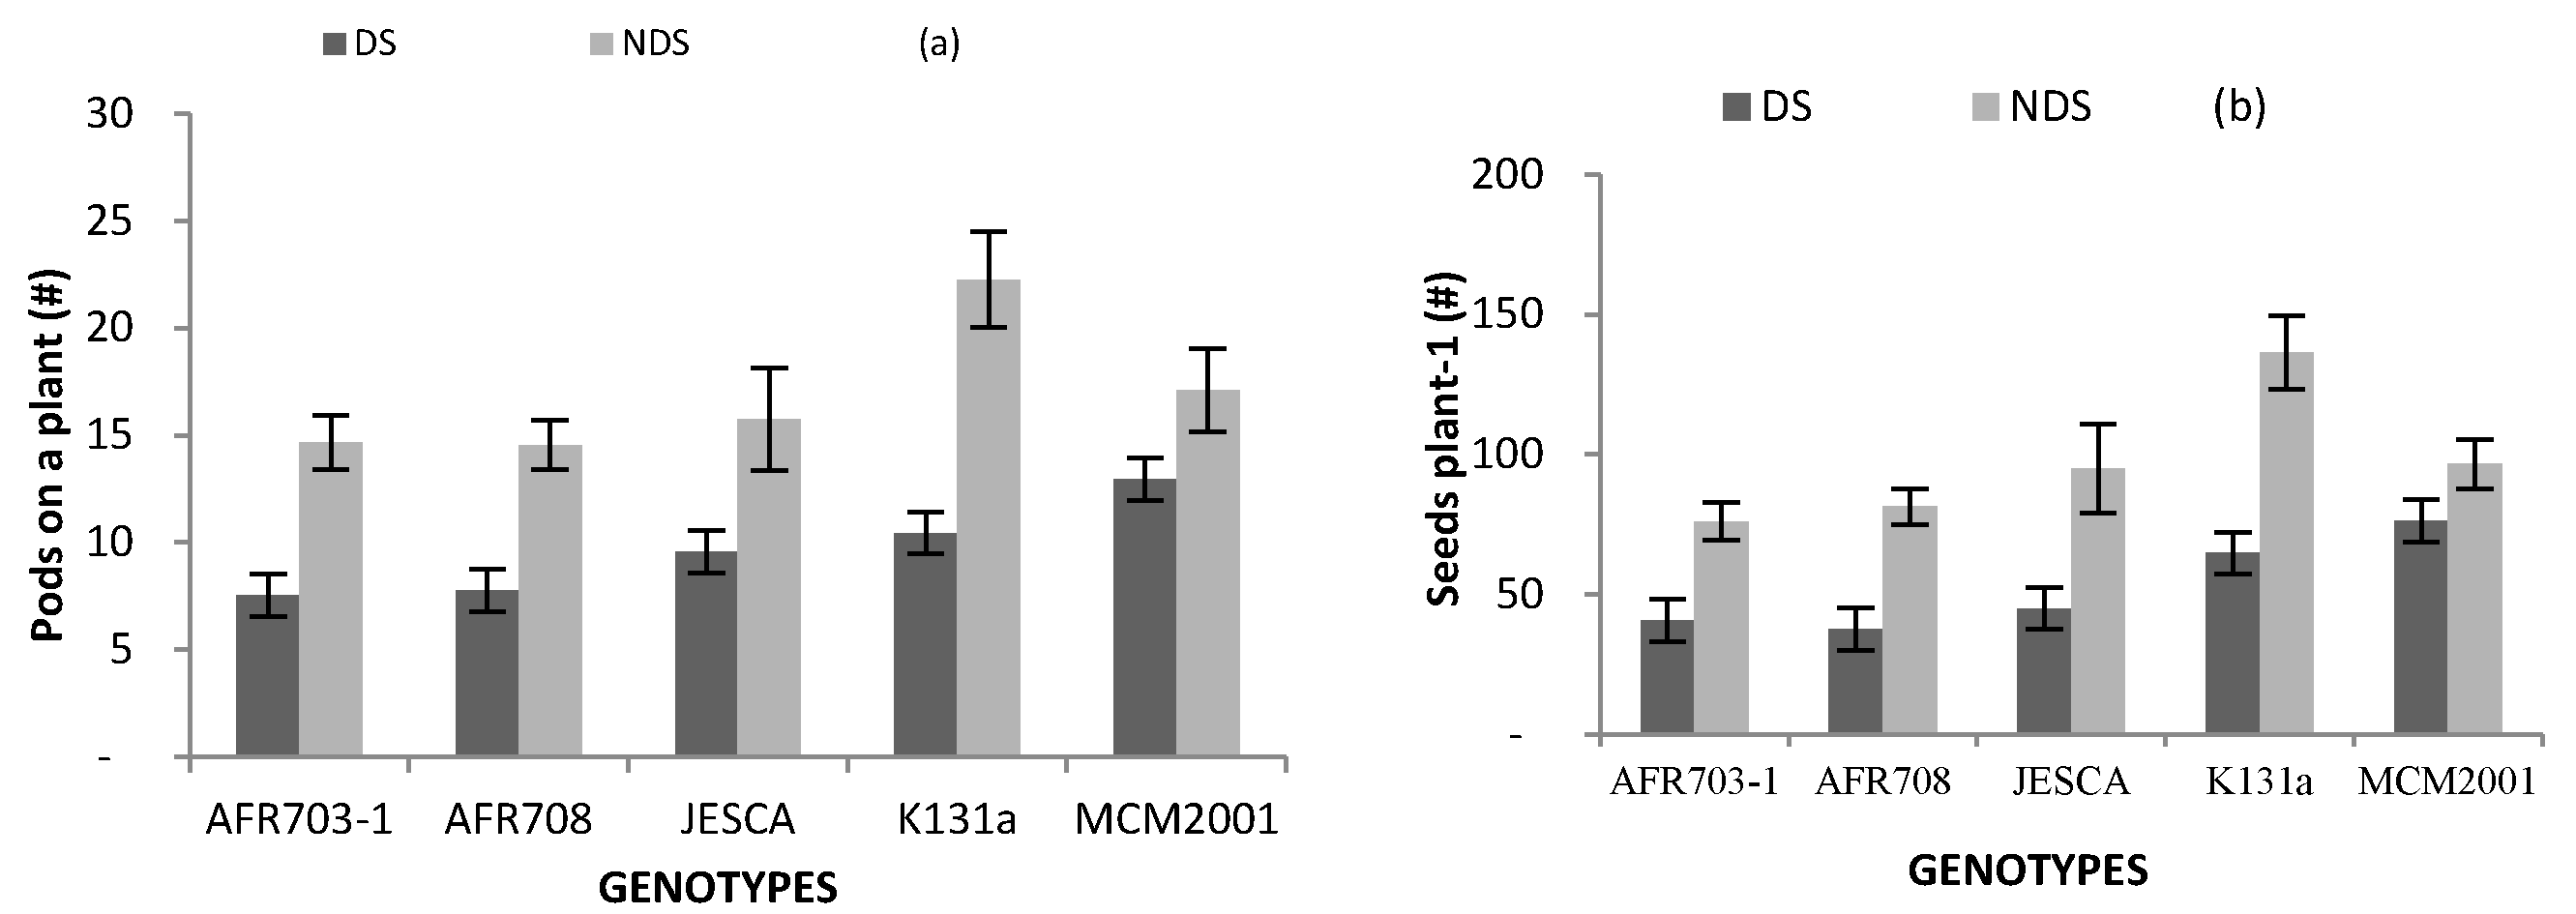
Results on the number of pods and seeds per plant are presented in Figure 3. For both parameters, NDS performed consistently better than DS. All genotypes produced 24–53% fewer pods plant−1 in DS than in NDS (Figure 3a). Similarly, apart from the number of seeds on a plant in MCM2001 that was not significantly (p > 0.05) varied by drought condition, the rest of the genotypes and the local check registered almost 50% fewer seeds on a plant when grown in DS than in NDS (Figure 3b).
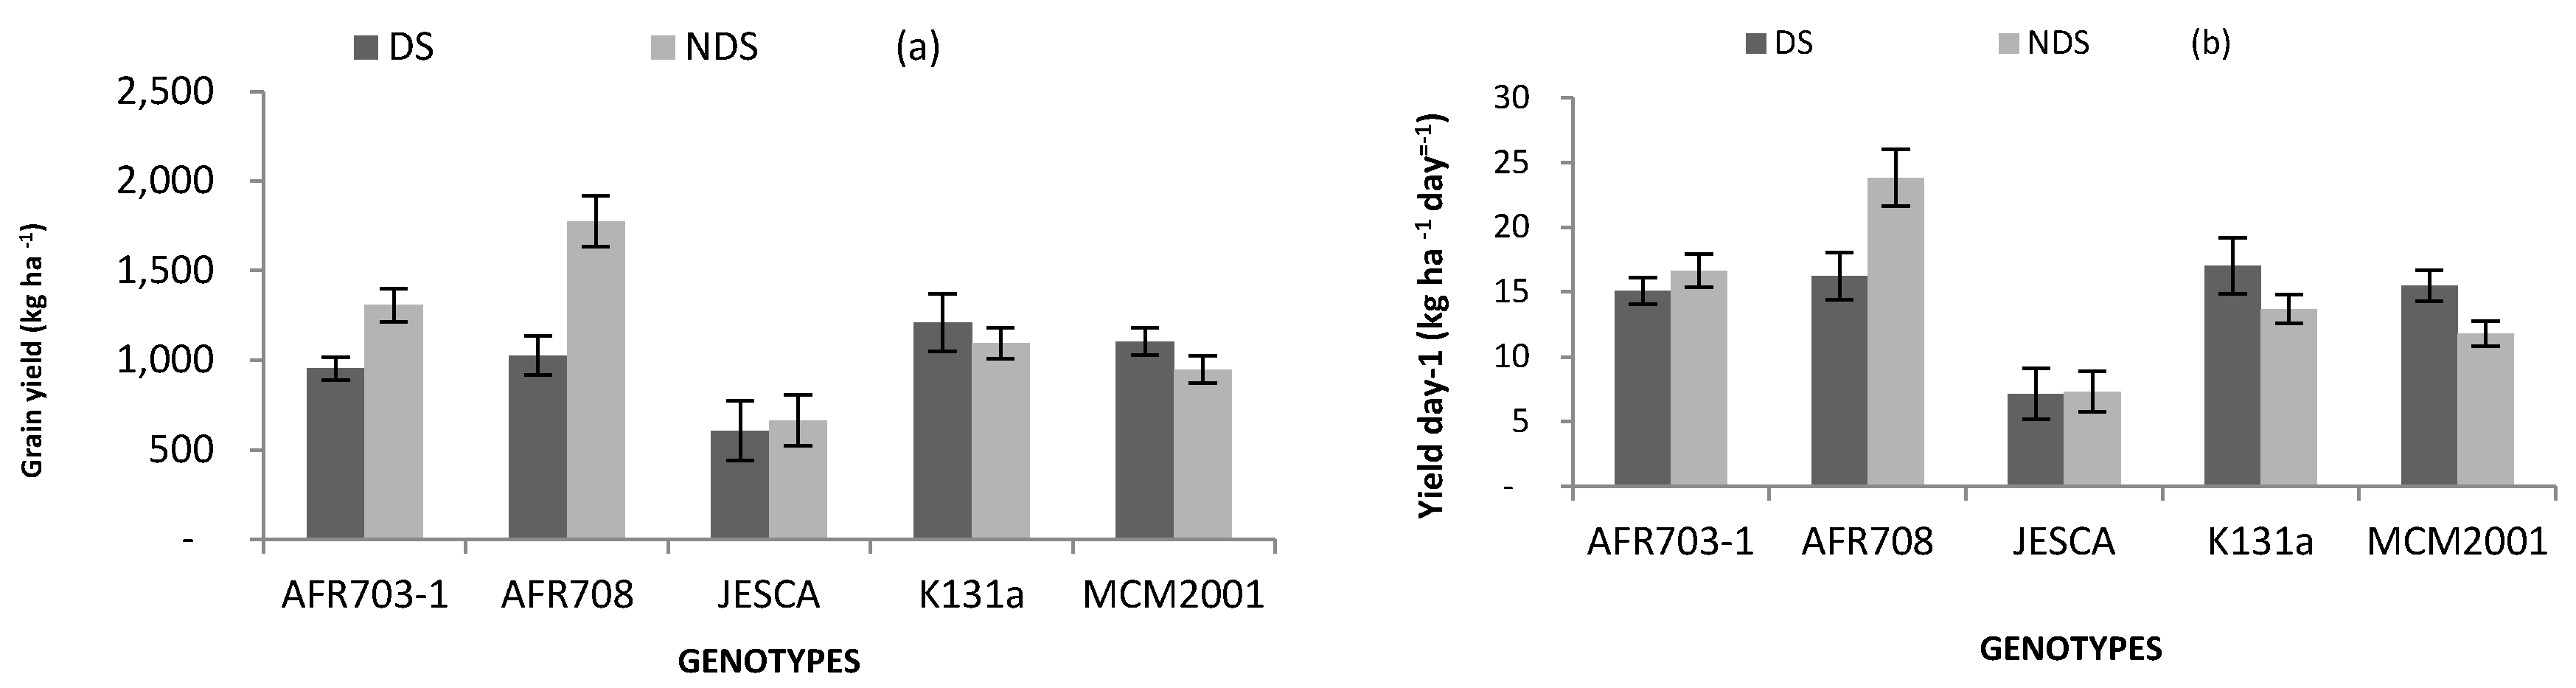
Despite the overall superior performance of NDS over DS in pods plant−1, and seeds on a plant, only genotypes AFR703-1 and AFR708 maintained superiority in grain yields; with NDS standing out over DS. Yield differences for other genotypes were not significant (Figure 4a). AFR708 was particularly superior, with a yield advantage of 38% followed by AFR703-1 with a yield drive of 16% over the local check in NDS condition. Similarly, although AFR708 performed equally well as other genotypes including the local check in DS, it was superior in yield day−1 by recording 24 kg ha−1 day−1 compared to the local check that recorded 14 kg ha−1 day−1 in NDS (Figure 4b). However, JESCA consistently recorded significantly (p < 0.05) lower yield day−1 than the local check in both DS and NDS conditions.
Results on the weight of 100 seeds are presented in Figure 3c. The interactive effect between drought conditions and genotypes was significant (p < 0.05) on the 100 seeds’ weight. When grown in NDS, the 100 seeds in AFR703-1, AFR708 and JESCA was significantly (p < 0.05) heavier by 24, 24 and 8 g, respectively, than that of the local check. When grown in DS, AFR genotypes recorded 44 g per 100 seeds which was superior to 40 g per 100 seeds produced by the same genotypes in NDS condition. Similarly, the local check produced significantly (p < 0.05) heavier 100 seeds in DS than in NDS.
3.5. Correlation of Grain Yield with Measured Parameters
The correlation between grain yield and measured parameters are presented in Table 3. In the NDS condition (Table 3), grain production was significantly influenced by shoot boimass (r = 36%), LAI (r = 62%), HI (r = 72%), number of pods per plant (r = 49%), weight of 100 seeds (r = 56%) and yield day−1 (r = 99%).
In the DS (Table 3), grain production in addition to being influenced by HI (r = 87%), pods plant (r = 51%), weight of 100 seeds (r = 20%) and yield day−1 (r = 98%); it also was correlated to seeds plant−1 (r = 31%). However, in the DS the weight of 100 seeds was negatively correlated to the number of pods plant−1 (r = 51%) and seeds per plant (r = 31%).
4. Discussion
Although the temperature patterns were considerably higher in the DS site than in NDS site, the ranges in both sites were within the recommended common bean production limits [19]. However, the bean plants grown in the DS condition were moderately stressed by drought and this was illustrated by deficits in plant water requirements in relation to the actual rainfall received. This gave rise to a drought intensity index (DII) of 40% refleted in Table 1. The current results compared to the recommended range of 350 to 500 mm for the non-stressed bean growing cycle of up to 120 days [4,25], revealed that rainfall of 237 mm season−1 received in DS; Nakasongola district was not sufficient for growth of the bean plant. However, the NDS, i.e., Mukaono district receiving 464 mm rainfall was in the recommended rainfall range for the normal growth of the common bean. Thus, that rainfall met the water requirement of 380 mm recorded in the field experiment for the bean plant grown in Mukono soil. The sporadic nature of rainfall recorded in the DS condition mirrors the drought stress condition in many rain-fed Sub-Saharan African agricultural production regions.
The negative correlations between LAI and (i) number of pods; and (ii) seeds on a plant in the DS condition suggests that although LAI is a significant contributor of assimilate production, the photosynthetic products formed by the leaves (source) is directed towards the development of pods and seeds at the expense of additional leaf expansion. These results together with the significant positive correlation between grain yield and HI, are indications of the efficiency with which assimilates are translocated from the source to grain yield production. This is a significant mechanism for improved grain yield potential under both DS and NDS conditions.
Current results have also revealed that some low P-tolerant common bean genotypes, especially AFR703-1, AFR708 and MCM2001, have potential to perform equally well in both DS and NDS conditions in relation to the local test. This was confirmed by the statistically similar grain yield observed to what was observed in the local test in DS. Similarly, although the grain yield of AFR 703-1 and AFR708 was significantly lower in DS than in NDS, the same genotypes out-yielded the local check in NDS. In fact, the two genotypes superseded the mean performance of low P-tolerant materials of 1100 kg ha−1 when planted in soil deficient of P under non-drought stress condition [28]. The present findings concur with those of Beebe, Rao [23], who observed that breeding for unfavourable conditions did not deter performance potential of the developed genotypes under favourable conditions.
The 100-seed weight is a significant quality for common beans as heavy seeds have an upper edge for consumer acceptance and fetch high market prices compared to smaller seeds [2]. Genotypes AFR703-1 and AFR708 are large-sized seed genotypes and their weights were not considerably affected by DS. In fact, a positive correlation between grain yield and weight of 100 seeds in both DS and NDS suggests the importance of seed size to grain yield production. However, there was a trade-off between the 100-seed weight and the number of seeds and pods on a plant, indicated by the negative correlation of the 100-seed weight with the number of pods and seeds on a plant. This does not contradict the significant contributions of the three yield variables to grain production, but suggests that heavier seeds are probably a compensation for fewer pods and lesser seeds on a plant. The choice of genotypes based on the three characteristics would be essential for grain yield production in DS. The current results are in agreement with the previous findings in common beans [29].
The low P tolerant genotypes responded to the drought stress by shortening their physiological activities compared to when they were grown in the non-drought stressed site. A short growing cycle has been previously recognised as a significant escape mechanism from drought in common beans [22]. The present results suggest that AFR703-1 and AFR708 are highly adapted to areas that receive low rainfall patterns since they flower, develop seeds and reach physiology maturity earlier than the local check in the DS condition, thus reducing the risk of encountering water deficit conditions during grain filling.
5. Conclusions
Moderate drought stress of DII 40% is a limiting factor for proper agronomic growth and development of low P-tolerant common beans. The low P-tolerant common bean genotypes, especially AFR703-1 and AFR708 sufficiently withstand drought conditions in relation to the local check. They survive drought stress by reducing the number of days to flower, to reach physiological maturity, and to develop large-sized seeds in DS. Therefore, they are recommended for cropping systems that are typically limited by the combined soils’ P deficiency and/or drought.
Author Contributions
M.N. carried out the research design, data collection, data analysis and wrote the manuscript, J.S.T. and E.O. supervised the process of data collection and analysis, and participated significantly in the write up and manuscript improvement.
Funding
This research was funded in part by the Swedish International Development Cooperation Agency (SIDA) and Makerere University, Kampala, Uganda under SIDA grant contribution No: 51180060.
Conflicts of Interest
The authors declare no conflict of interest.
References
- Beebe, E.S.; Rao, I.M.; Blair, M.W.; Acosta-Gallegos, J.A. Phenotyping common beans for Adaptation to drought. Front. Physiol. 2013, 4, 1–20. [Google Scholar] [CrossRef] [PubMed]
- CIAT. Annual Report 2008: Outcome Line SBA-1: Improved Beans for the Developing World; International Center for Tropical Agriculture (CIAT): Cali, Colombia, 2008. [Google Scholar]
- Buruchara, R.; Mukankusi, C.; Ampofo, K.O. Bean Desease and Pest Identification and Mangement. Handbooks for Small-Scale Seed Producers; International Centre for Tropical Agriculture (CIAT): Kampala, Uganda, 2011; Volume 371, p. 67. [Google Scholar]
- Wortmann, S.C.; Kirkby, A.R.; Eledu, AC.; Allen, J.D. (Eds.) Atlas of Common Bean (Phasealus vulgaris L.) Production in Africa; International Centre for Tropical Agriculture (CIAT): Cali, Colombia, 2004. [Google Scholar]
- Namugwanya, M.; Tenywa, J.S.; Otabbong, E.; Mubiru, D.N.; Masamba, T.A. Development of commom bean (Phaseolus vulgaris L.) production under low soil phosphorus and drought in Sub-Saharan Africa: A review. J. Sustain. Dev. 2014, 7, 128–139. [Google Scholar]
- Lambers, H.; Shane, M.W.; Cramer, M.D.; Pearse, S.J.; Veneklaas, E.J. Root Structure and Functioning for Efficient Acquisition of Phosphorus: Matching Morphological and Physiological Traits. Ann. Bot. 2006, 98, 693–713. [Google Scholar] [PubMed] [Green Version]
- Suriyagoda, L.D.B.; Ryan, M.H.; Renton, M.; Lambers, H. Plant responses to limited moisture and phosphorus availability: A meta-analysis. Adv. Agron. 2014, 124, 143–200. [Google Scholar]
- Jin, J.; Lauricella, D.; Armstrong, R.; Sale, P.; Tang, C. Phosphorus application and elevated CO2 enhance drought tolerance in field pea grown in a phosphorus-deficient vertisol. Ann. Bot. 2014, 116, 975–985. [Google Scholar] [PubMed]
- CIAT. Annual Report 2006: Bean Improvement for the Tropics; International Center for Tropical Agriculture (CIAT): Cali, Colombia, 2006. [Google Scholar]
- Balemi, T.; Negisho, K. Management of soil phosphorus and plant adaptation mechanisms to phosphorus stress for sustainable crop production: A review. J. Soil Sci. Plant Nut. 2012, 12, 547–562. [Google Scholar] [CrossRef]
- Kumar, P.V.; Bindi, M.; Crisci, A.; Maracchi, G. Detection of variations in precipitation at different time scales of twentieth century at three locations of Italy. Weath. Clim. Extrem. 2013, 2, 7–15. [Google Scholar] [CrossRef]
- Beebe, E.S.; Ramirez, J.; Jarvis, A.; Rao, M.I.; Mosquera, G.; Bueno, M.J.; Blair, W.M. Genetic improvement of common beans and the challenges of climate change. In Crop Adaptation to Climate Change, 1st ed.; Yadav, S.S., Redden, J.R., Hatfield, L.J., Lotze-Campen, H., Hall, E.A., Eds.; Blackwell Publishing Ltd.: Cali, Colombia, 2011; pp. 356–369. [Google Scholar]
- Keyantash, J.A.; Dracup, J.A. An aggregate drought index: Assessing drought severity based on fluctuations in the hydrologic cycle and surface water storage. Water Resour. Res. 2004, 40, 1–13. [Google Scholar] [CrossRef]
- Wilhelmi, V.O.; Hubbard, G.K.; Wiilhite, A.D. Spatial representation of agro-climatology in a study of agricultural drought. Int. J. Clim. 2002, 22, 1399–1414. [Google Scholar] [CrossRef]
- Sivakumar, V.K.M.; Motha, R.P.; Wilhite, D.A.; Wood, D.A. (Eds.) Agricultural Drought Indices. In Proceedings of the Expert Group Meeting, Murcia, Spain, 2–4 June 2010; World Meteorological Organization: Geneva, Switzerland, 2011; p. 197. [Google Scholar]
- Kisamba-Mugerwa, W. Rangelands management policy in Uganda. In Proceedings of the International Conference on Policy and Institutional Options for the Management of Rangelands in Dry Areas, Kampala, Uganda, 7–11 May 2001; pp. 6–11. [Google Scholar]
- Tabatabai, M.A. Agronomy Monograph 2. In Methods of Soil Analysis Part 2, 2nd ed.; Page, R., Miller, H., Keeney, D.R., Eds.; American Society of Agronomy, Soil Science Society of America: Madison, WI, USA, 1965; p. 577. [Google Scholar]
- Namugwanya, M.; Tenywa, J.S.; Otabbong, E.; Basamba, T.A. Root Architectural Development and Yield Sensitivity of Phosphorus Tolerant Common Bean under Low Soil Phosphorus and Drought. Int. J. Plant Soil Sci. 2016, 9, 1–10. [Google Scholar]
- Lunze, L.; Lunze, L.; Kimani, P.M.; Ngatoluwa, R.; Rabary, B.; Rachier, G.O.; Ugen, M.M.; Ruganza, V.; Awad elkarim, E.E. Bean improvement for low soil fertility adaptation in Eastern and Central Africa. In Advances in Integrated Soil Fertility Management in Sub-Saharan Africa: Challenges and Opportunities; Bationo, A., Waswa, B., Kihara, J., Kimetu, J., Eds.; Springer: Dordrecht, The Netherlands, 2007; pp. 325–332. [Google Scholar]
- Brouwer, C.; Heibloem, M. Irrigation Water Management: Irrigation Water Needs; Food and Agriculture Organization of the United Nations: Rome, Italy, 1986. [Google Scholar]
- De Jesus, W.C.; do Vale, F.X.R.; Coelho, R.R.; Costa, L.C. Comparison of two methods for estimating leaf area index on common bean. Agron. J. 2001, 93, 989–991. [Google Scholar] [CrossRef]
- Acosta-Díaz, E.; Acosta-Gallegos, J.A.; Trejo-López, C.; Padilla-Ramírez, J.S.; Amador-Ramírez, M.D. Adaptation traits in dry bean cultivars grown under drought stress. Agric. Téc. Méx. 2009, 35, 416–425. [Google Scholar]
- Beebe, S.E.; Rao, I.M.; Cajiao, C.; Grajales, M. Selection for drought resistance in common bean also improves yield in phosphorus limited and favorable environments. Crop Sci. 2008, 48, 582–592. [Google Scholar]
- Ghasemi, A.; Zahediasl, S. Normality tests for statistics: A guide for non-statisticans. Int. J. Endocrinol. Metab. 2012, 10, 486–489. [Google Scholar] [CrossRef] [PubMed]
- Bartlett, M.S. Some examples of statistical methods of research in agriculture and applied biology. Suppl. J. R. Statist. Soc. 1937, 4, 137–183. [Google Scholar]
- Field, A. Discovering Statistics Using SPSS; SAGE Publication Inc.: Thiusands Oaks, CA, USA, 2009. [Google Scholar]
- Ott, L.R.; Longnecker, M. An Introduction to Statistical Methods and Data Analysis, 5th ed.; Duxburry Thomson Learning: Toronto, ON, Cadana, 2001. [Google Scholar]
- Salcedo, J.M. Regeneration guidelines: Common bean. In Crop Specific Regeneration Guidelines; Dulloo, M.E., Thormann, I., Jorge, M.A., Hanson, J., Eds.; CGIAR System-Wide Genetic Resource Programm: Rome, Italy, 2008. [Google Scholar]
- Klaedtke, S.M.; Cajiao, C.; Grajales, M.; Polanía, J.; Borrero, G.; Guerrero, A.; Rivera, M.; Rao, I.; Beebe, S.E.; Léon, J. Photosynthate remobilization capacity from drought-adapted common bean (Phaseolus vulgaris L.) lines can improve yield potential of interspecific populations within the secondary gene pool. J. Plant Breed. Crop Sci. 2012, 4, 49–61. [Google Scholar]
Figure 1.
Interaction between genotypes and drought conditions on (a) LAI; (b) shoot biomass and (c) Harvest index. (Bars over the mean indicate standard error). LAI: Leaf area index, DS: Drought stress and NDS: Non-drought stress.
Figure 1.
Interaction between genotypes and drought conditions on (a) LAI; (b) shoot biomass and (c) Harvest index. (Bars over the mean indicate standard error). LAI: Leaf area index, DS: Drought stress and NDS: Non-drought stress.
Figure 2.
Interaction between genotypes and drought conditions on (a) DF; (b) DPM and (c) DSF. (Bars over the mean indicate standard error). DF: 50% days to flower, DPM: Days to physiological maturity, DSF: Days to seed fill, DS: Drought stress and NDS: Non-drought stress.
Figure 2.
Interaction between genotypes and drought conditions on (a) DF; (b) DPM and (c) DSF. (Bars over the mean indicate standard error). DF: 50% days to flower, DPM: Days to physiological maturity, DSF: Days to seed fill, DS: Drought stress and NDS: Non-drought stress.
Figure 3.
Interaction between genotypes and drought conditions on (a) pods plant−1; (b) seeds on a plant and (c) weight of 100 seeds. (Bars over the mean indicate standard error). #: numbers, DF: drought stress, and NDS: non-drought stress.
Figure 3.
Interaction between genotypes and drought conditions on (a) pods plant−1; (b) seeds on a plant and (c) weight of 100 seeds. (Bars over the mean indicate standard error). #: numbers, DF: drought stress, and NDS: non-drought stress.
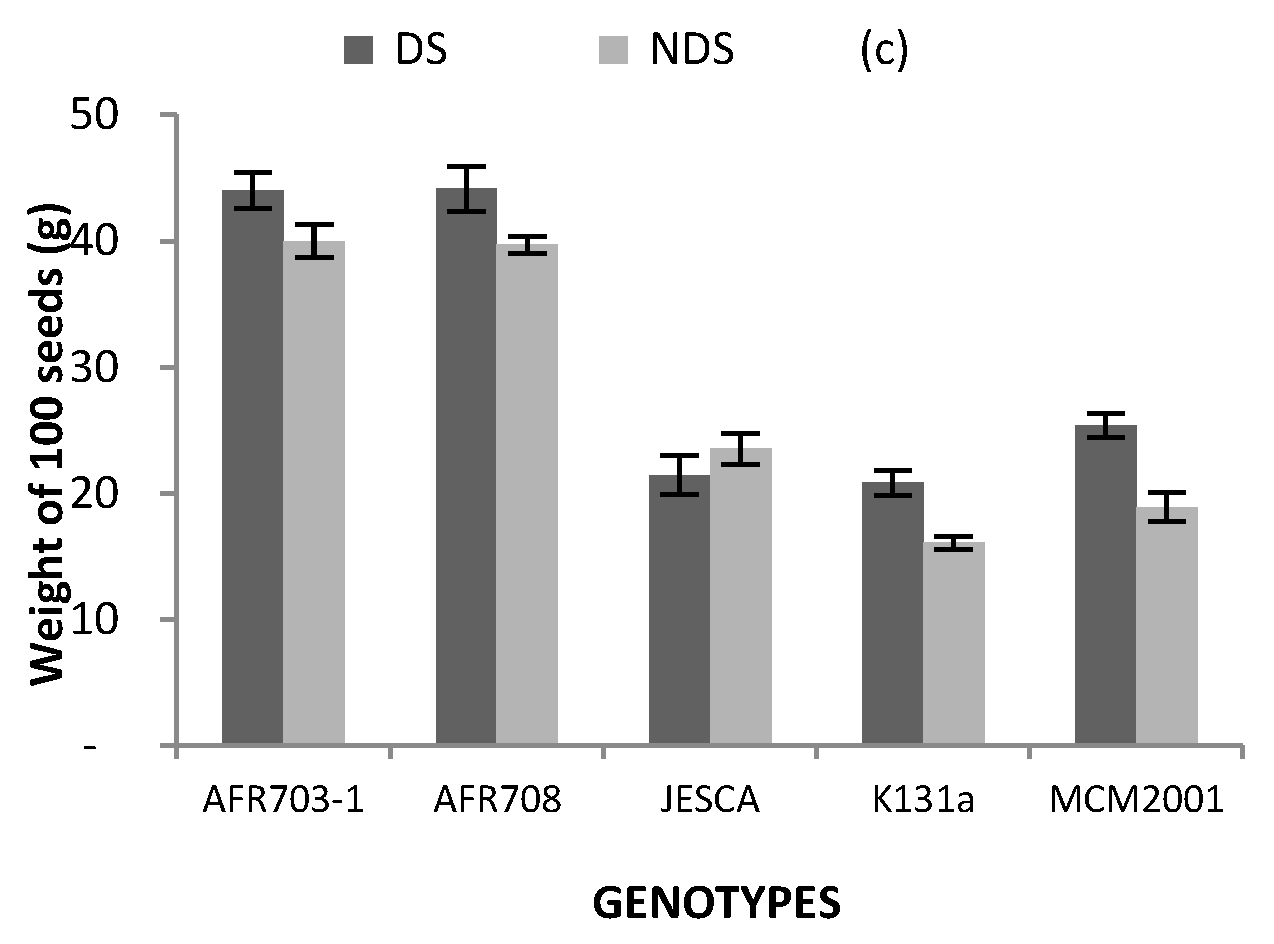
Figure 4.
Interaction between genotypes and drought conditions on (a) grain yield; (b) yield day−1 (bars over the mean indicate standard error). DS: drought stress, and NDS: non-drought stress.
Figure 4.
Interaction between genotypes and drought conditions on (a) grain yield; (b) yield day−1 (bars over the mean indicate standard error). DS: drought stress, and NDS: non-drought stress.


Table 1.
Climate information in as determined in the two drought conditions in 2014, Uganda.
| Weather Parameters | Pooled Mean | Values * |
|---|---|---|
| DS | NDS | |
| Average daily mean min Temp (°C) | 18.2 | 17.6 |
| Average daily mean max Temp (°C) | 29.7 | 27.3 |
| Mean rainy days (#) | 25.5 | 43 |
| Total Rain received (mm season−1) (A) | 237 | 464 |
| Total water need (mm season−1) (B) | 393 | 380 |
| Difference (A-B) | (156) | 84 |
| Mean rainfall received (mm day−1) (C) | 2.37 | 4.65 |
| Mean water requirement (mm day−1) (D) | 3.93 | 3.80 |
| Difference (C-D) | (1.56) (0.0002) | 0.85 (0.15) |
| DII (%) = (C-D/D) × 100 | (40) | 22 † |
t-test was performed and mean differences (bean plant water requirement-actual water received) were based on null hypotheses of H0: difference = 0. Values in parentheses are probability values, # = numbers, DII = drought intensity index, DS = drought-stress, NDS = non-drought-stress. * The pooled mean value is the average of the two seasons in the field; † Though not significant (p > 0.05), NDS experienced an excessive rainfall than required by the bean plant in that site.
Table 2.
Crop phenology of common bean as affected by genotypes and drought conditions in the field, Uganda.
Table 2.
Crop phenology of common bean as affected by genotypes and drought conditions in the field, Uganda.
| Genotypes | DF | DPM | DSF |
|---|---|---|---|
| AFR703-1 | 37 §§§ | 71 §§§ | 34 |
| AFR708 | 37 §§§ | 70 §§§ | 33 |
| JESCA | 45 § | 88 §§§ | 44 §§§ |
| K131 a | 42 | 76 | 34 |
| MCM2001 | 43 | 76 | 34 |
| Drought Conition | |||
| DS | 39 | 71 | 33 |
| NDS | 43 | 81 | 39 |
| Difference | *** | *** | *** |
§, §§, §§§ indicates that genotype effect on a given variable is significantly different from that of local check in the same column at P = 0.05, 0.01 and 0.001, respectively; according Dunnett’s test; a = local check genotype, *, **, *** indicates that the effect of DS on a given variable is significantly different from that of NDS in the same row at P = 0.05, 0.01 and 0.001, respectively; according to T-test based on null hypotheses of H0: difference = 0.
Table 3.
Statistical correlation (r values) of grain yield with other parameters determined in DS and NDS conditions in Uganda.
Table 3.
Statistical correlation (r values) of grain yield with other parameters determined in DS and NDS conditions in Uganda.
| (a) Statistical Correlation (r Values) of Grain Yield with Other Parameters Determined NDS Conditions in Uganda. | ||||||||
|---|---|---|---|---|---|---|---|---|
| Parameters | Grain Yield | Pods Plant−1 | Seeds Plant−1 | 100 Seeds Weight | LAI | Shoot Biomass | Yield Day−1 | HI |
| Grain yield | 1 | |||||||
| Pods plant−1 | 0.49 §§ | 1 | ||||||
| Seeds plant−1 | 0.09 | 0.27 § | 1 | |||||
| Weight of 100 seeds | 0.56 §§§ | −0.17 | −0.41 §§ | 1 | ||||
| LAI | 0.62 §§§ | 0.45 §§ | 0.05 | 0.62 §§§ | 1 | |||
| Shoot biomass | 0.36 § | 0.47 §§§ | 0.14 | 0.17 | 0.21 § | 1 | ||
| Yield day−1 | 0.99 §§§ | 0.45 §§ | 0.06 | 0.73 §§§ | 0.64 §§§ | 0.04 | ||
| HI | 0.72 §§§ | 0.22 § | 0.06 | 0.99 §§§ | 0.26 § | 0.62 §§§ | 0.69 §§§ | 1 |
| (b) Statistical Correlation (r Values) of Grain Yield with Other Parameters Determined in DS Conditions in Uganda. | ||||||||
| Parameters | Grain Yield | Pods Plant−1 | Seeds Plant−1 | 100 Seeds Weight | LAI | Shoot Biomass | Yield Day−1 | HI |
| Grain yield | - | |||||||
| Pods plant−1 | 0.51 *** | - | ||||||
| Seeds plant−1 | 0.31 * | 0.66 *** | - | |||||
| 100 seeds weight | 0.2 * | −0.51 *** | −0.31 * | - | ||||
| LAI | 0.16 | −0.38 ** | −0.56 *** | 0.51 *** | - | |||
| Shoot biomass | −0.01 | 0.15 | 0.16 | 0.17 | −0.31 * | - | ||
| Yield day−1 | 0.98 *** | 0.46 ** | 0.24 * | 0.24 * | 0.18 | −0.00 | - | |
| HI | 0.87 *** | 0.59 *** | 0.44 ** | 0.44 ** | 0.09 | −0.17 | 0.84 *** | - |
§, §§, §§§, correlation coefficient (r) is significant in NDS condition at p = 5%, 1% and 0.1% Bonferroni-adjusted level of significance, respectively. *, **, ***, correlation coefficient (r) is significant in DS condition at p = 5%, 1% and 0.1% Bonferroni-adjusted level of significance, respectively, NDS = non-drought stress and DS = drought stress.
© 2018 by the authors. Licensee MDPI, Basel, Switzerland. This article is an open access article distributed under the terms and conditions of the Creative Commons Attribution (CC BY) license (http://creativecommons.org/licenses/by/4.0/).
Share and Cite
MDPI and ACS Style
Namugwanya, M.; Tenywa, J.S.; Otabbong, E. Response of Common Bean Genotypes Grown in Soil with Normal or Limited Moisture, with Special Reference to the Nutrient Phosphorus. Agronomy 2018, 8, 132. https://doi.org/10.3390/agronomy8080132
AMA Style
Namugwanya M, Tenywa JS, Otabbong E. Response of Common Bean Genotypes Grown in Soil with Normal or Limited Moisture, with Special Reference to the Nutrient Phosphorus. Agronomy. 2018; 8(8):132. https://doi.org/10.3390/agronomy8080132
Chicago/Turabian StyleNamugwanya, Margaret, John Stephen Tenywa, and Erasmus Otabbong. 2018. "Response of Common Bean Genotypes Grown in Soil with Normal or Limited Moisture, with Special Reference to the Nutrient Phosphorus" Agronomy 8, no. 8: 132. https://doi.org/10.3390/agronomy8080132
Note that from the first issue of 2016, this journal uses article numbers instead of page numbers. See further details here.