3.2.2. Thermal Properties
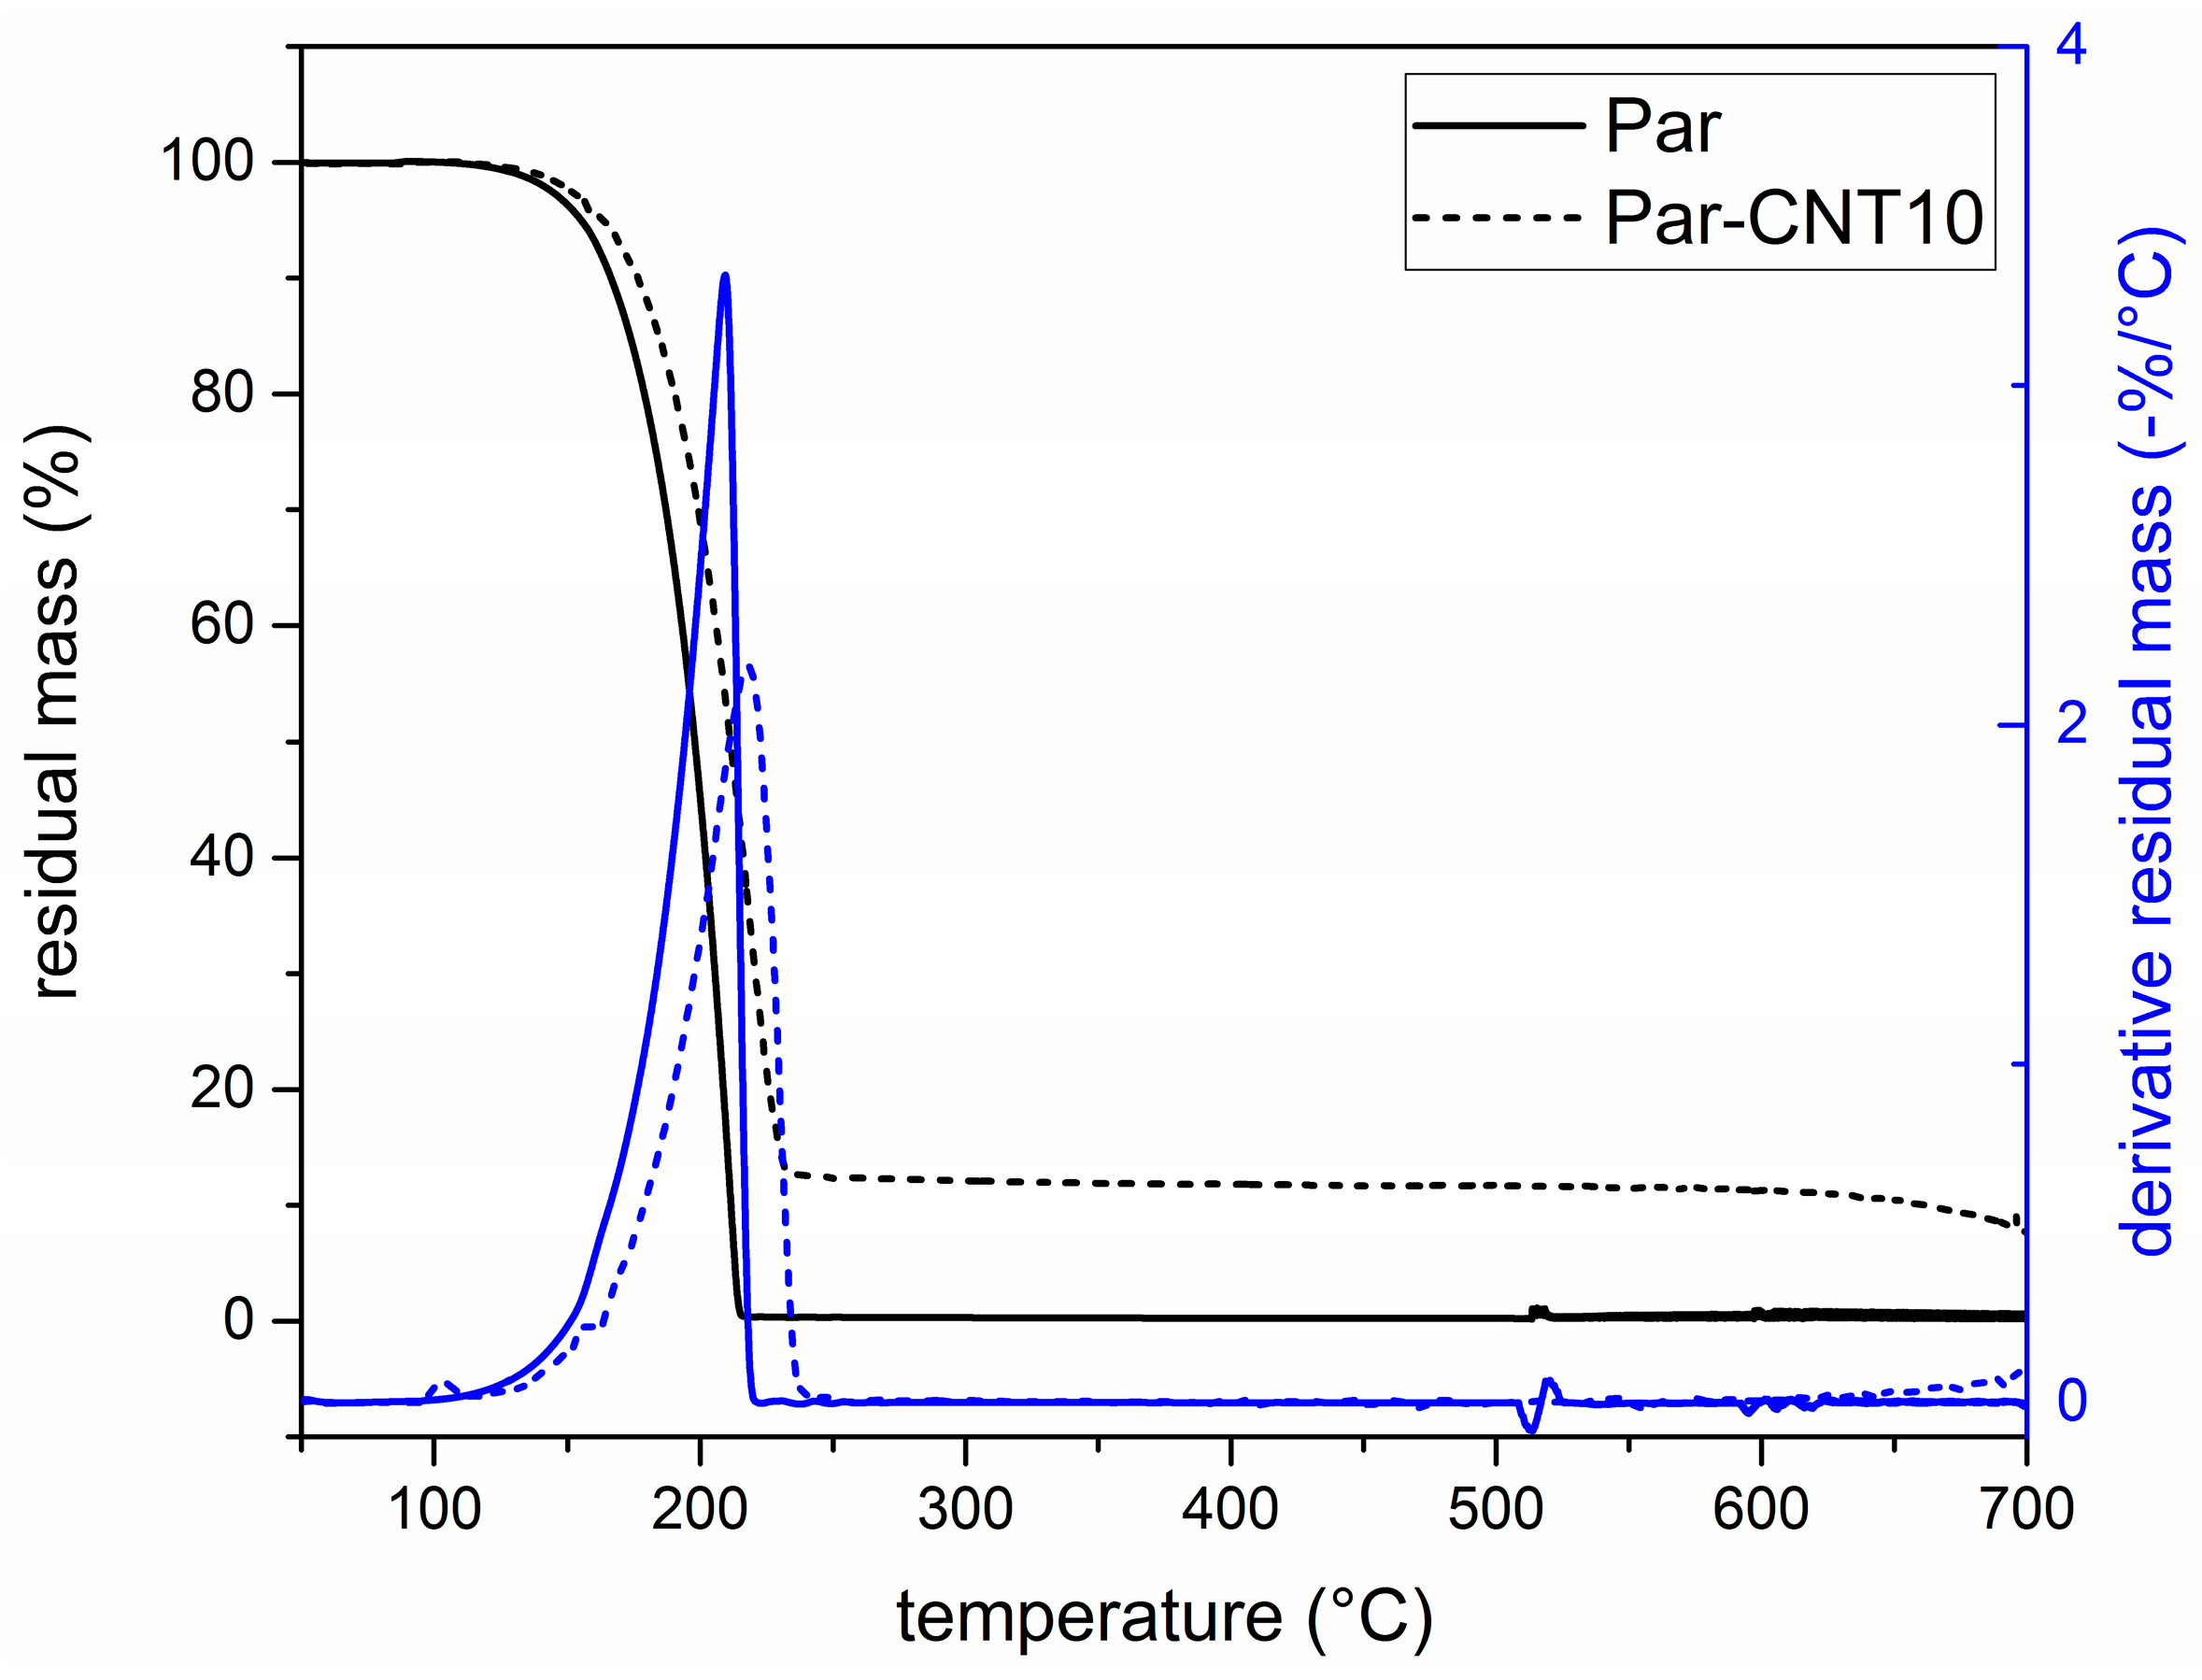
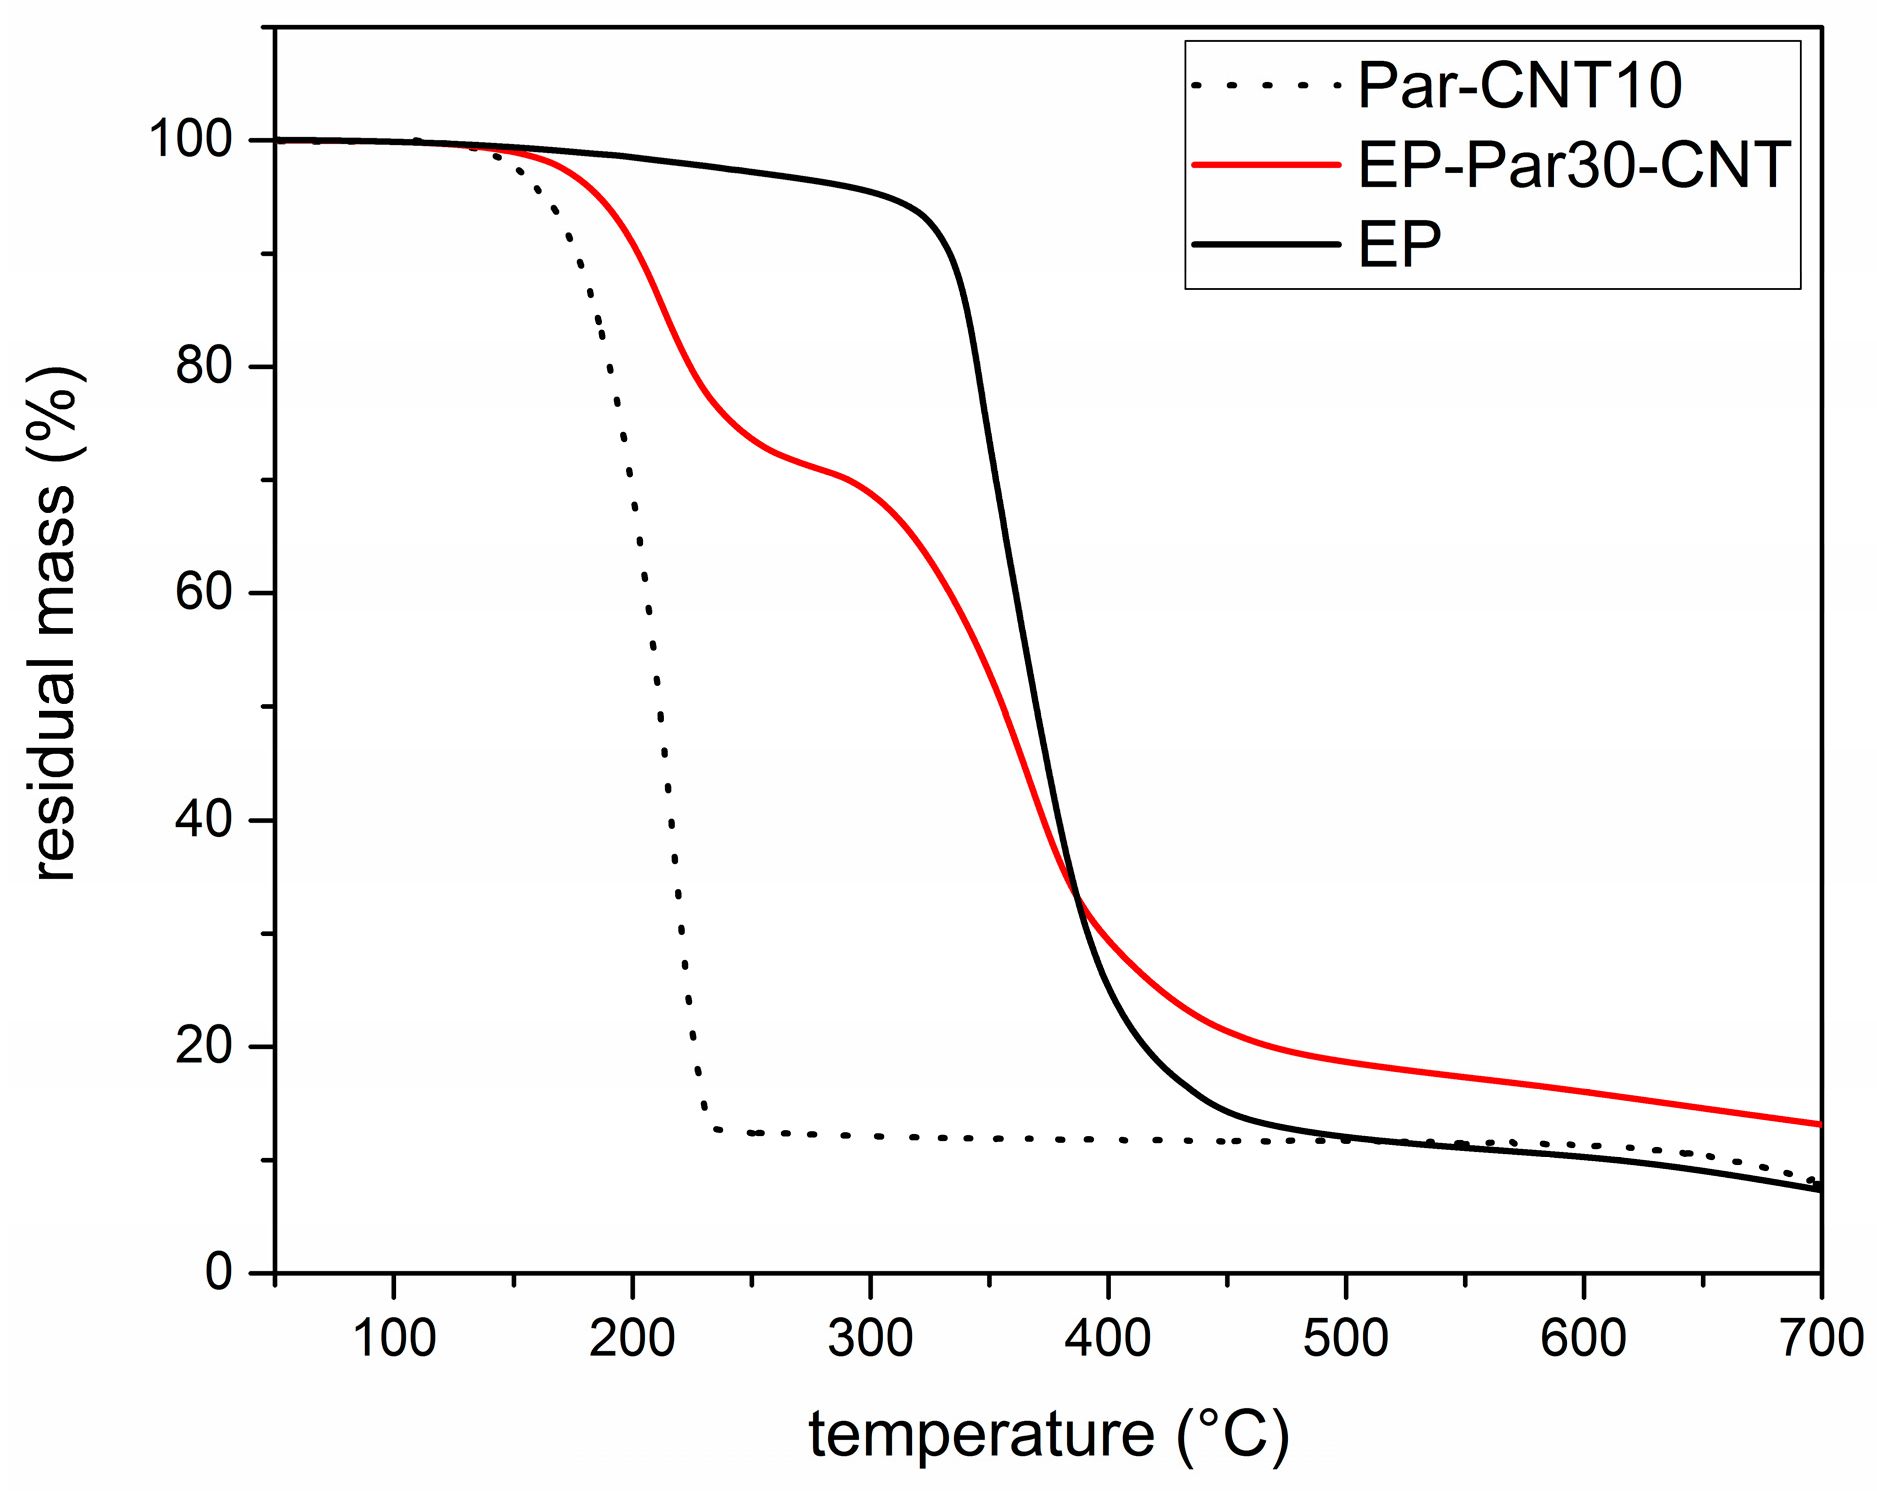
Figure 7 shows the TGA thermograms of Par-CNT10, the neat epoxy resin (EP), and the sample EP-Par30-CNT, reported as an example of the behaviour of the samples EP-ParX and EP-ParX-CNT (X = 20, 30, 40) (the whole set of thermograms is reported in
Supplementary Material Figure S1 and Table S3). The degradation of EP-Par30-CNT occurs in two distinct steps, which can be associated to the degradation of the paraffin and the epoxy resin, respectively. From the degradation step of the paraffin, and considering the mass loss from the epoxy resin fraction at that temperature, it is possible to estimate the actual paraffin amount within the sample.
Table 4 shows the nominal and real paraffin fraction after processing for each sample (see
Supplementary Material Figure S1 and Table S3 for more detailed TGA results).
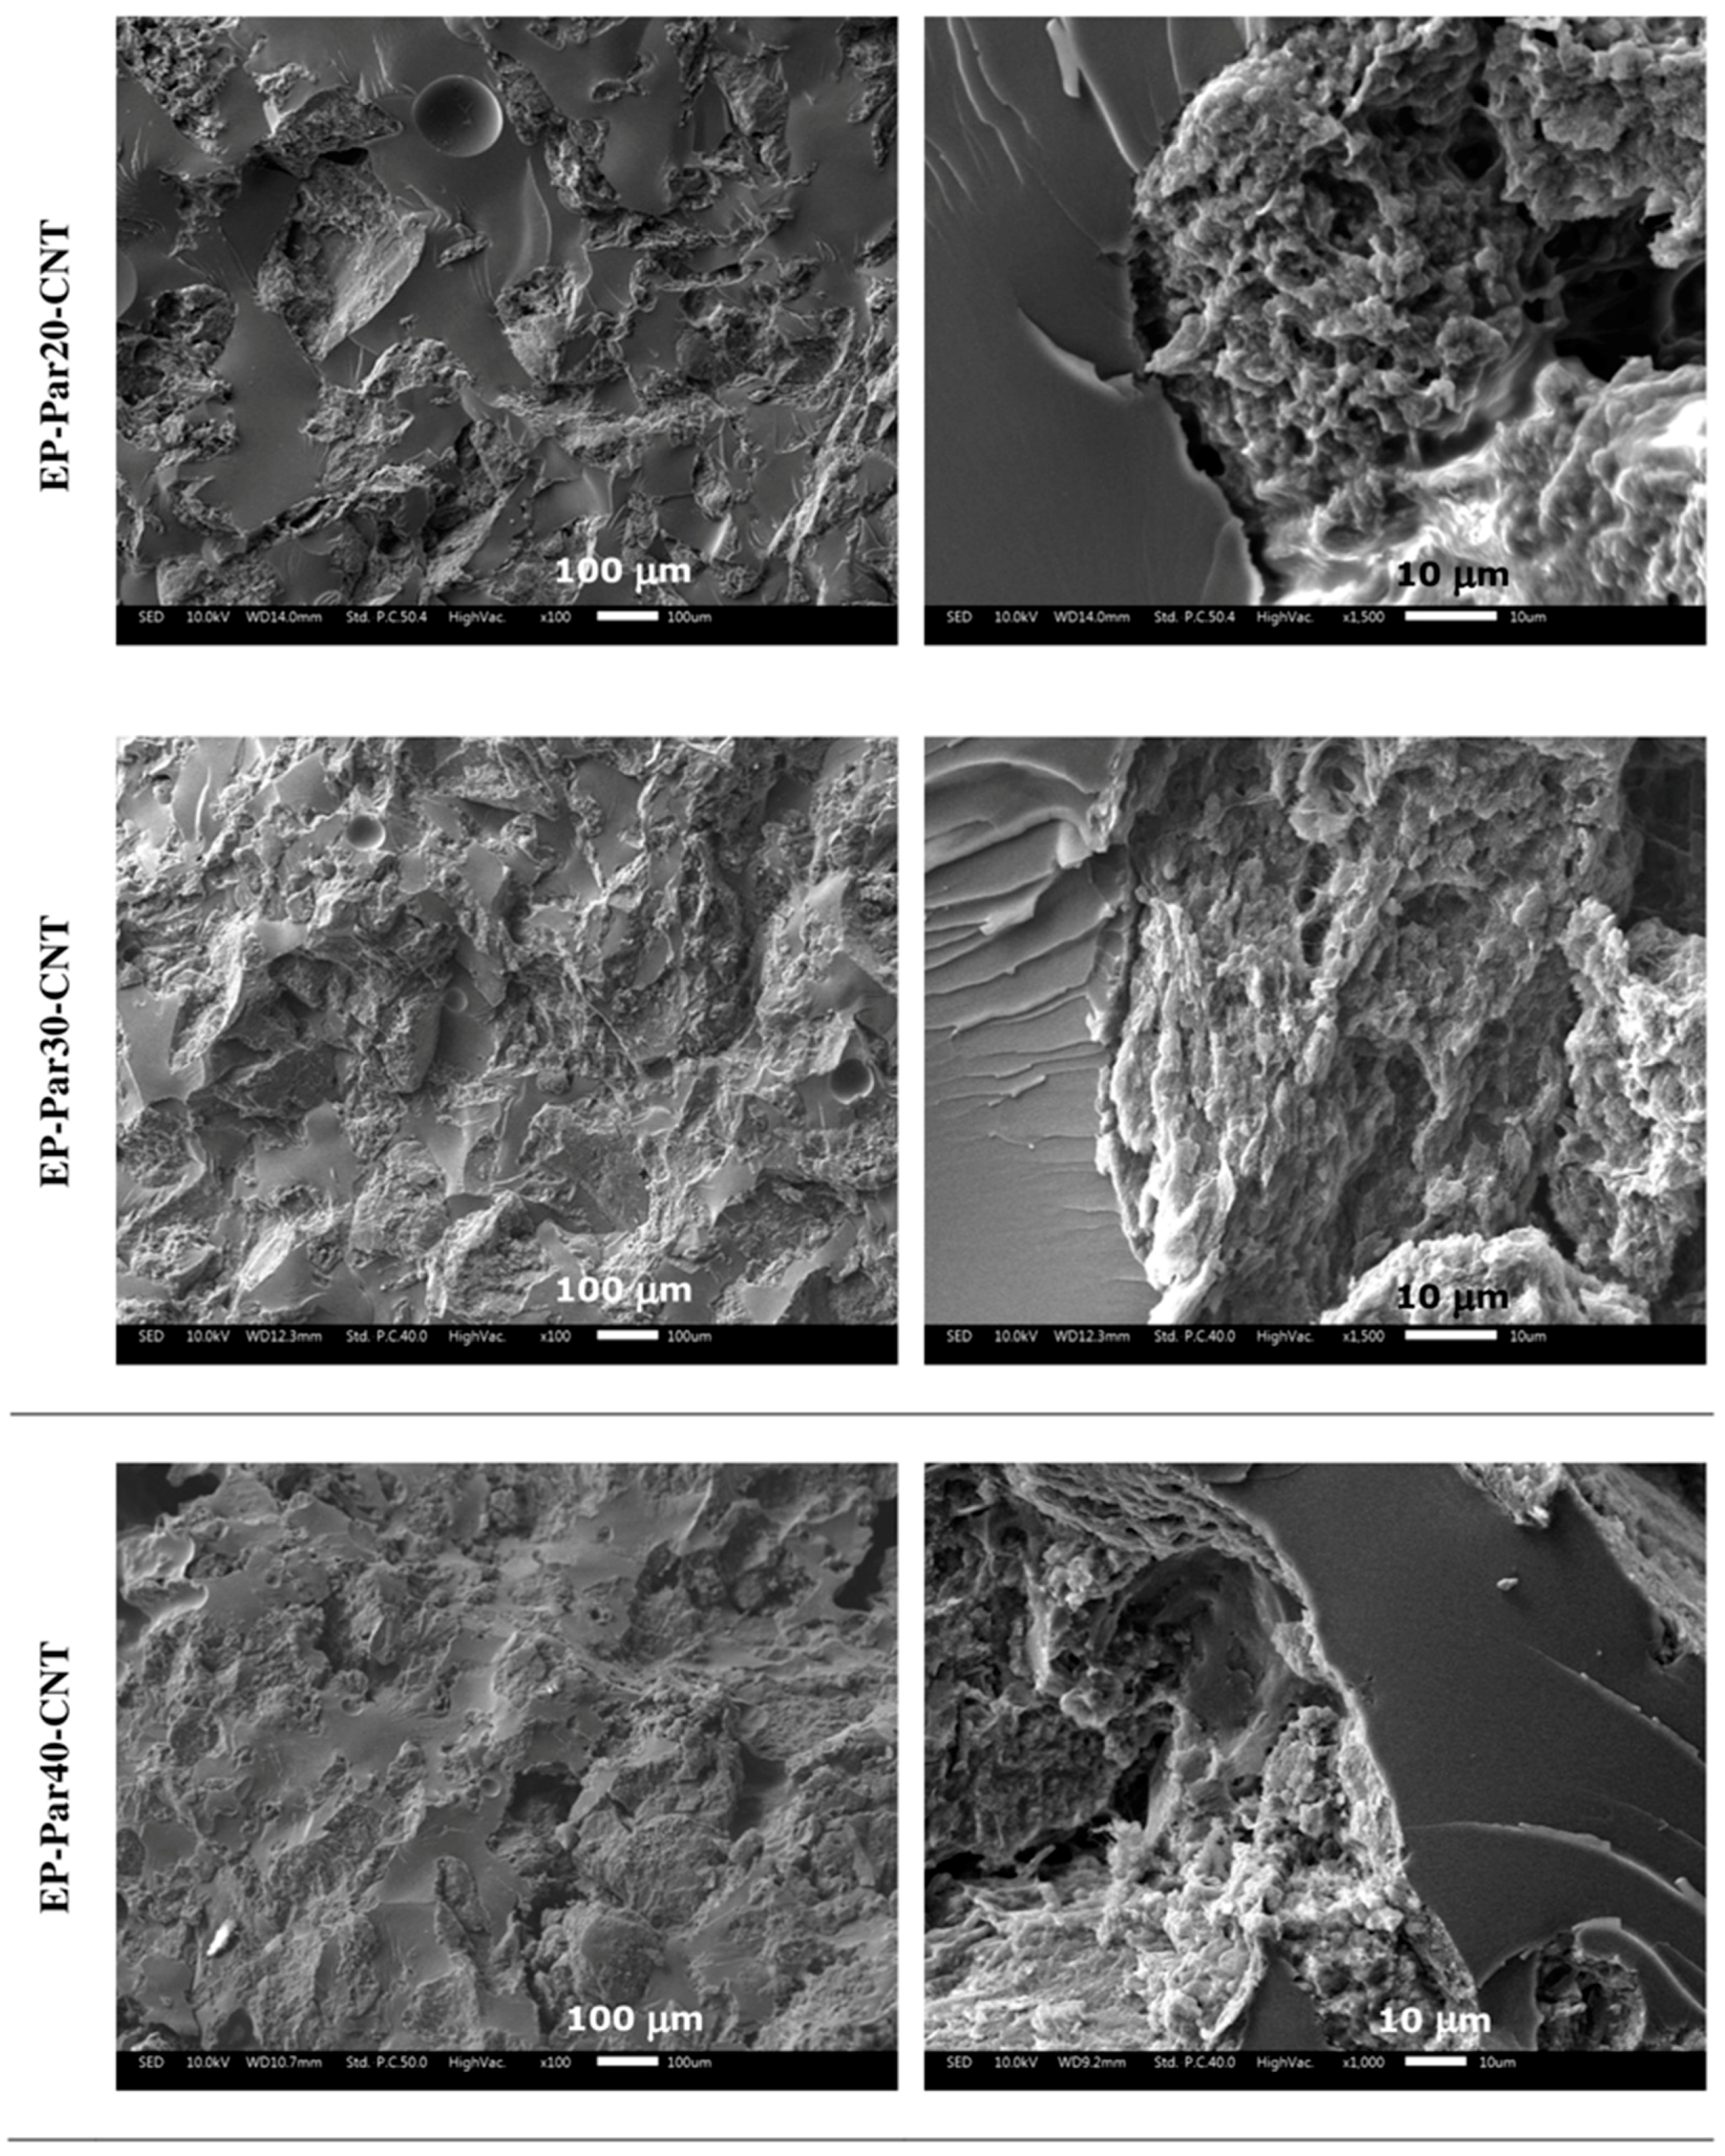
These two values are approximately the same for each EP-ParX-CNT (X = 20, 30, 40) sample, which is an indication that the method adopted for calculating the mass is reliable. In contrast, for the three samples without CNTs, the real paraffin fraction after processing is noticeably lower than the nominal content (tests were repeated to assess sample homogeneity). This is probably due to the partial exudation of the paraffin out of the epoxy matrix during the curing step at 100 °C. In fact, EP-ParX (X = 20, 30, 40) specimens became greasy after that curing step because of the presence of a thin paraffin layer on the upper surface of those specimens. None of these phenomena were observed on the EP-ParX-CNT (X = 20, 30, 40) samples, which suggests that an effective shape-stabilization is performed by the CNTs. In a parallel experiment, it was observed that a phase separation phenomenon can be clearly detected if the curing process of the epoxy resin is entirely carried out above the melting temperature of paraffin (i.e., 10 h at 100 °C). In this case, the paraffin melts and moves toward the upper surface of the specimens before the crosslinking process starts, and two well separated layers of paraffin and fully cured epoxy resin are obtained after curing. By performing the initial phase of the curing cycle at room temperature, below the melting temperature of the paraffin, the phase separation is less evident, probably because paraffin is in the form of solid particles and the epoxy-hardener mixture becomes more and more viscous. However, after 24 h at room temperature, the epoxy resin is not fully crosslinked, and a certain phase separation is still possible. The loss of PCM during the process is also reflected in DSC results.
In
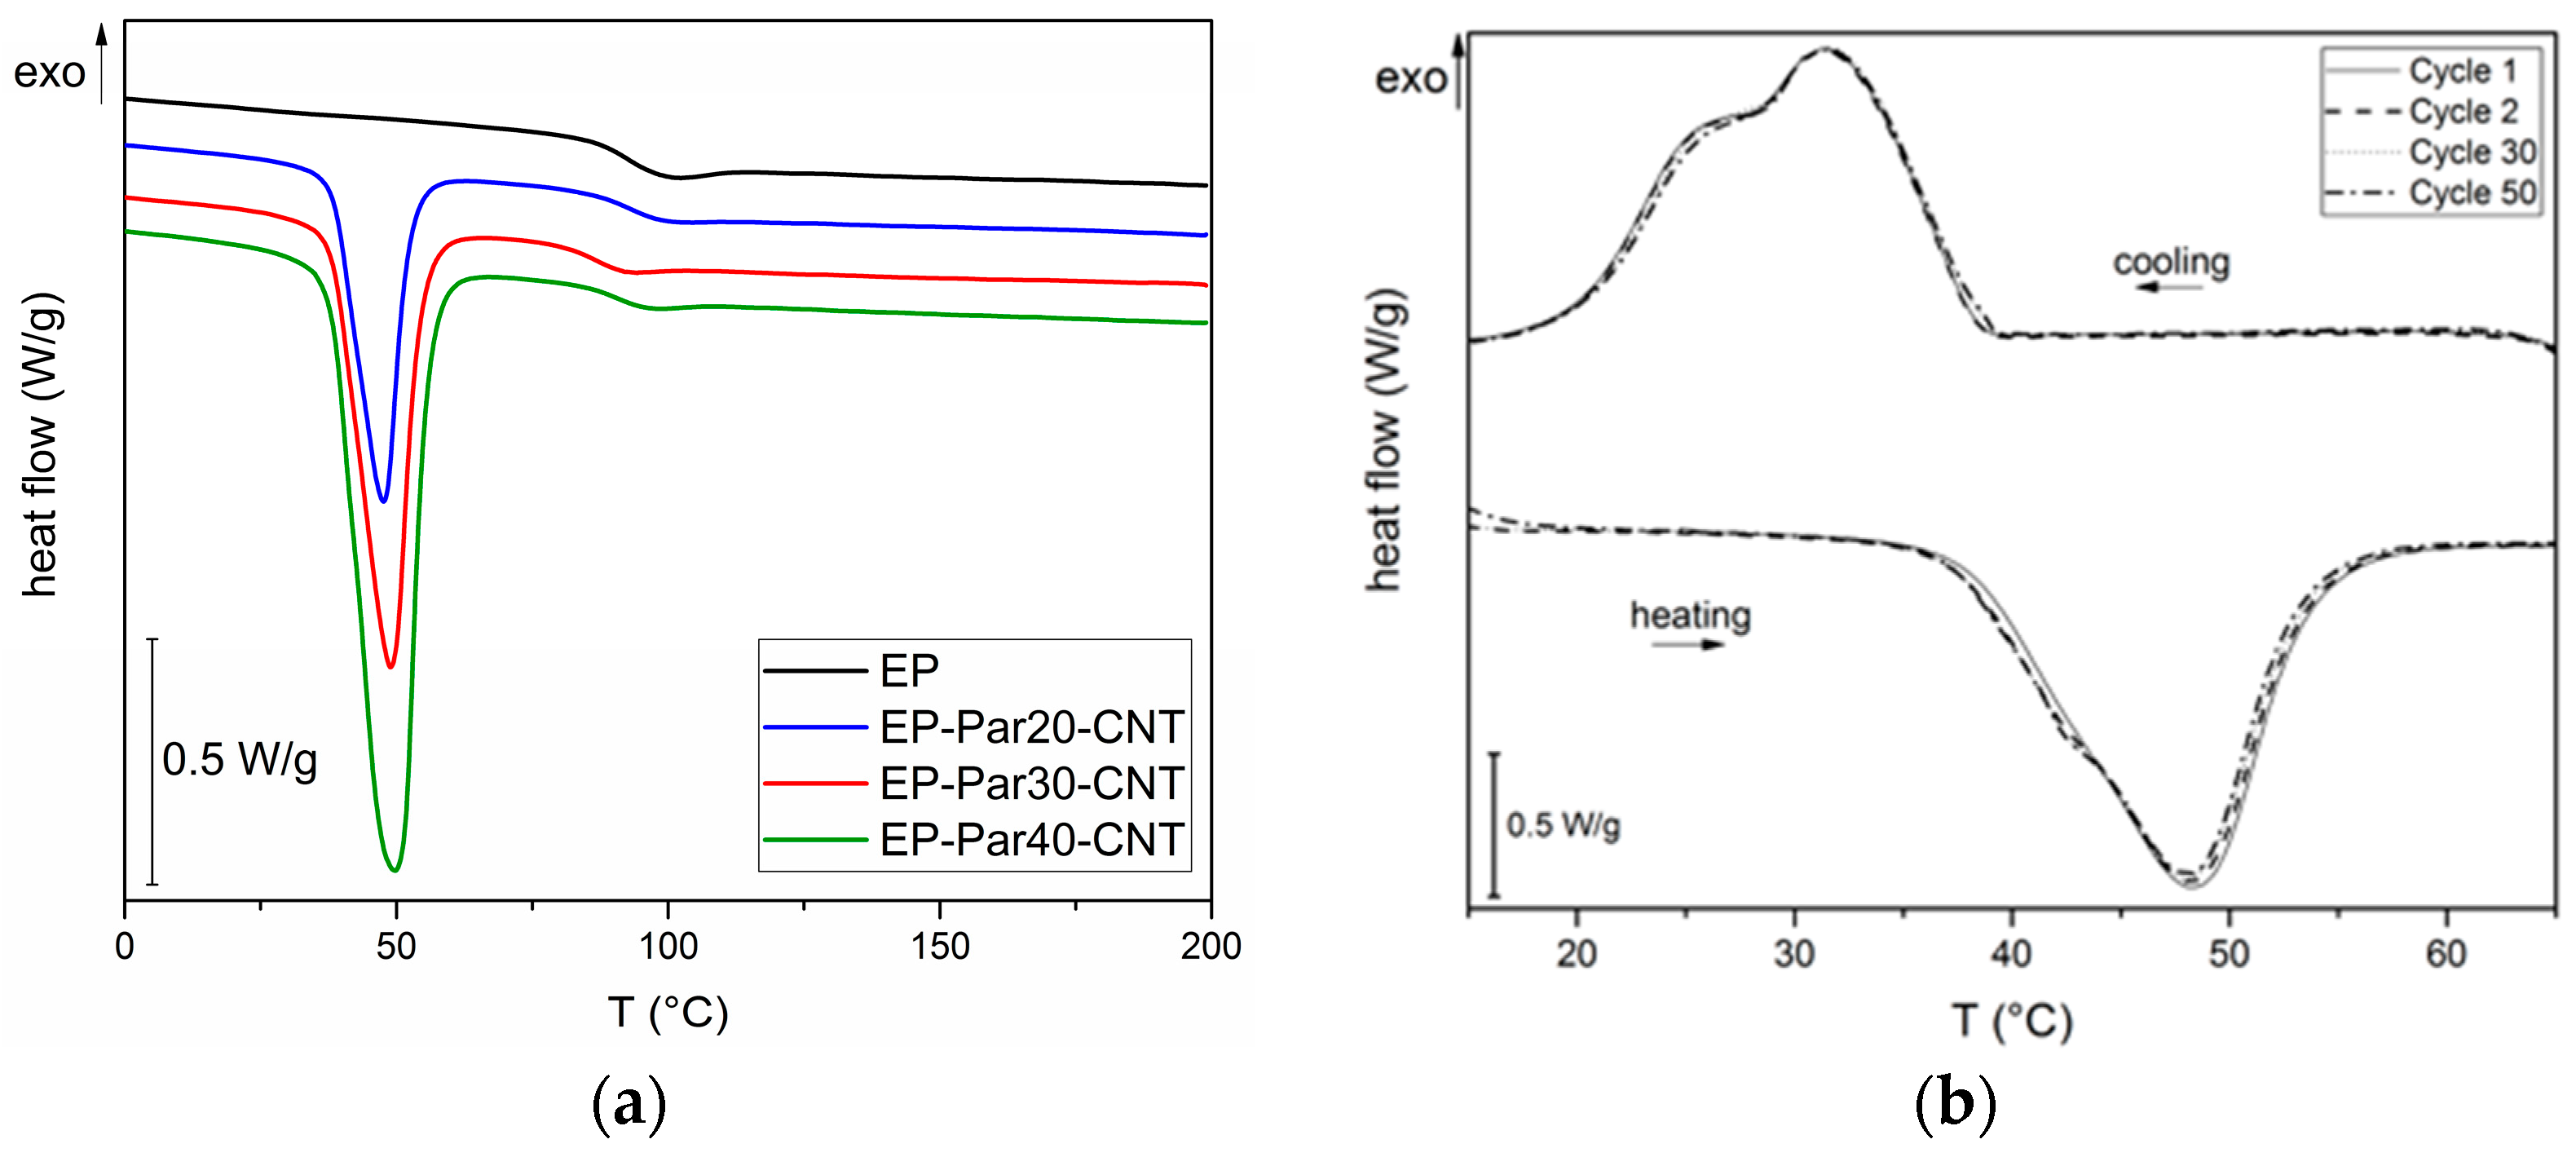
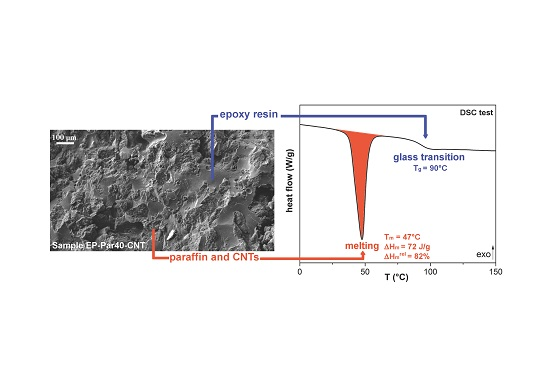
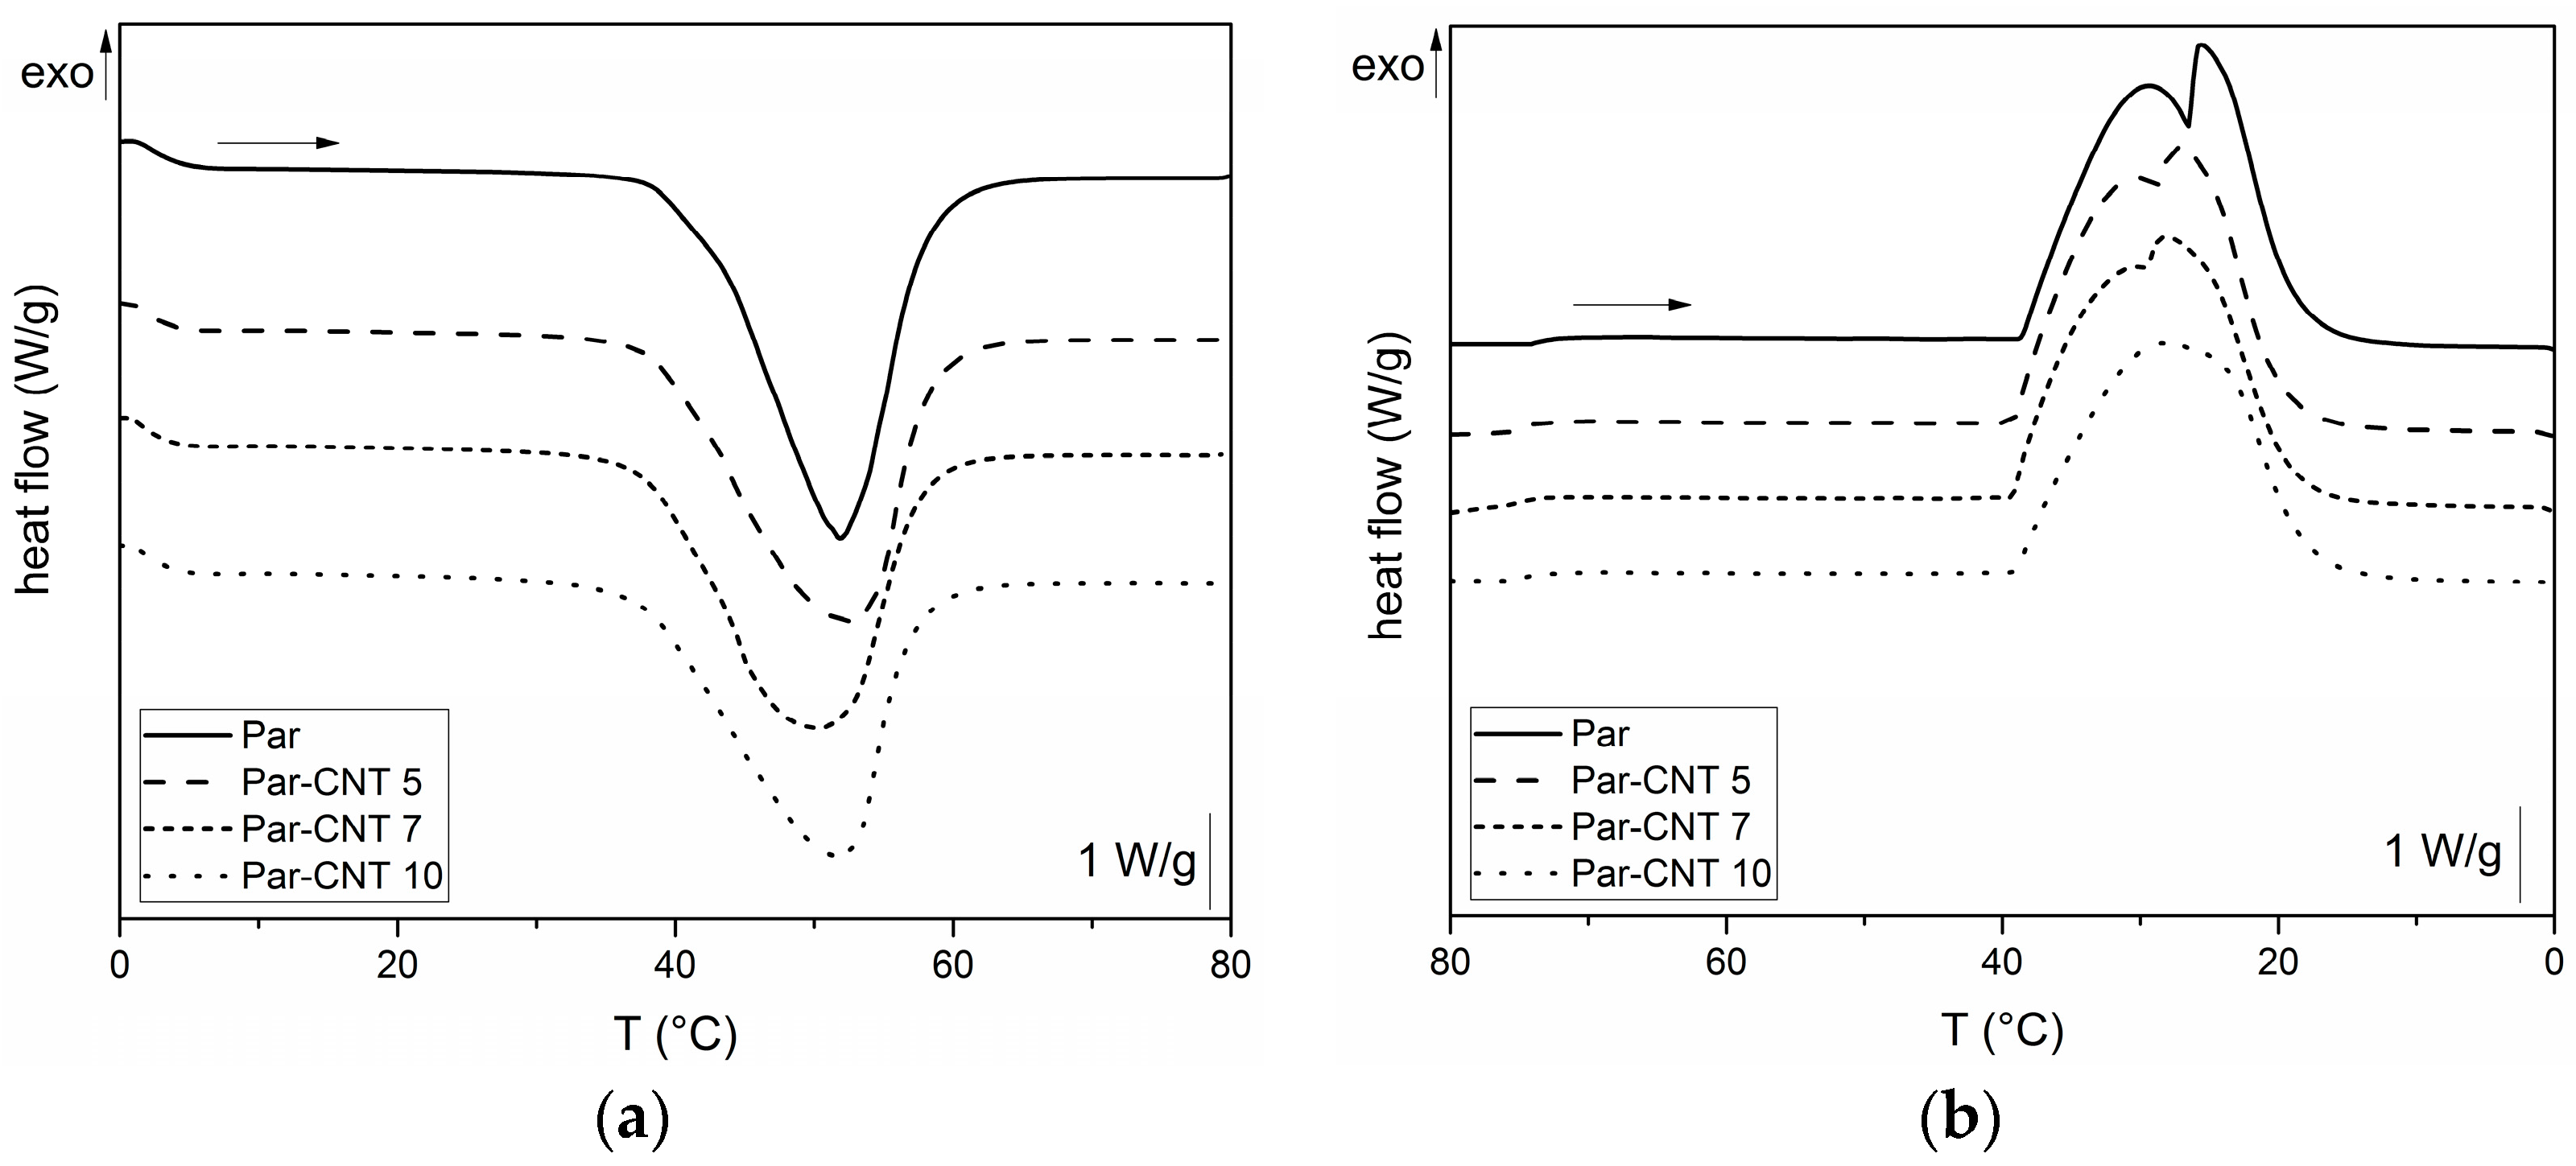
Figure 8a, representative thermograms of EP-ParX-CNT (X = 20, 30, 40) samples during the first heating scan are reported. In
Table 5, the most important results are summarized.
The glass transition temperature (
Tg) of the epoxy is not substantially affected by the presence of paraffin, since the values of
Tg of the EP-ParX and EP-ParX-CNT samples (X = 20, 30, 40) are not significantly different from that found for the neat epoxy resin, which is approximately 92.2 °C. Also, both the melting and crystallization temperatures and intervals of the paraffin are not affected by the presence of the epoxy resin. On the other hand, the effect of the blending process on the melting and crystallization enthalpies can be evaluated by considering the values of relative melting (and crystallization) enthalpies with respect to the nominal paraffin content
(
and to the real paraffin content calculated from TGA tests
For the samples containing neat paraffin (EP-ParX),
and
values are in the range 50–60%, while for the blends with shape-stabilized paraffin (Ep-ParX-CNT),
and
values around 80–85% can be obtained. Similar results were found in literature for other polymer/organic PCM blends [
33]. However, if the enthalpy values are normalized to real paraffin content, all the samples show
and
values close to 80–90%, without any remarkable differences between samples with and without CNTs. These results indicate that the fraction of paraffin contained in the samples is able to melt and crystallize regardless of the presence of CNTs, at least after few thermal cycles. On the other hand, the presence of CNTs is important to prevent exudation of PCM during the production process. As suggested in other studies [
27], multiple thermal cycles are required to further investigate the exudation of paraffin in service conditions and to highlight possible differences between the samples with and without CNTs. Relative melting enthalpy values in the range 80–90% are commonly found in literature for paraffin-based phase change materials embedded in a polymeric matrix [
27,
33]. One of the most common explanations is a non-homogeneous dispersion of the PCM in the matrix [
27], but it is probably not the case of this work, since TGA and DSC analyses on multiple specimens of the same sample gave consistent results. Other possible explanations involve the paraffin macromolecules confinement played by the presence of the surrounding matrix, or the partial dissolution in the matrix of a fraction of paraffin [
33]. However, further tests will be needed to fully understand this aspect.
Lastly, to evaluate the retention of the thermal energy storage/release effect over repeated thermal cycles, cyclic DSC tests were performed on the EP-Par40-CNT sample. In
Figure 8b DSC thermograms during the 1st, 2nd, 30th, and 50th cycles are reported. The thermograms at different cycles are nearly superimposed, and there are no appreciable differences between the phase change temperatures and enthalpies of the sample at different cycles. It can be concluded that the melting and crystallization enthalpy of the epoxy/SS-PCM blends are stable up to 50 cycles in the analyzed temperature range. These results are promising for the future development of a thermally reliable multifunctional composite material.
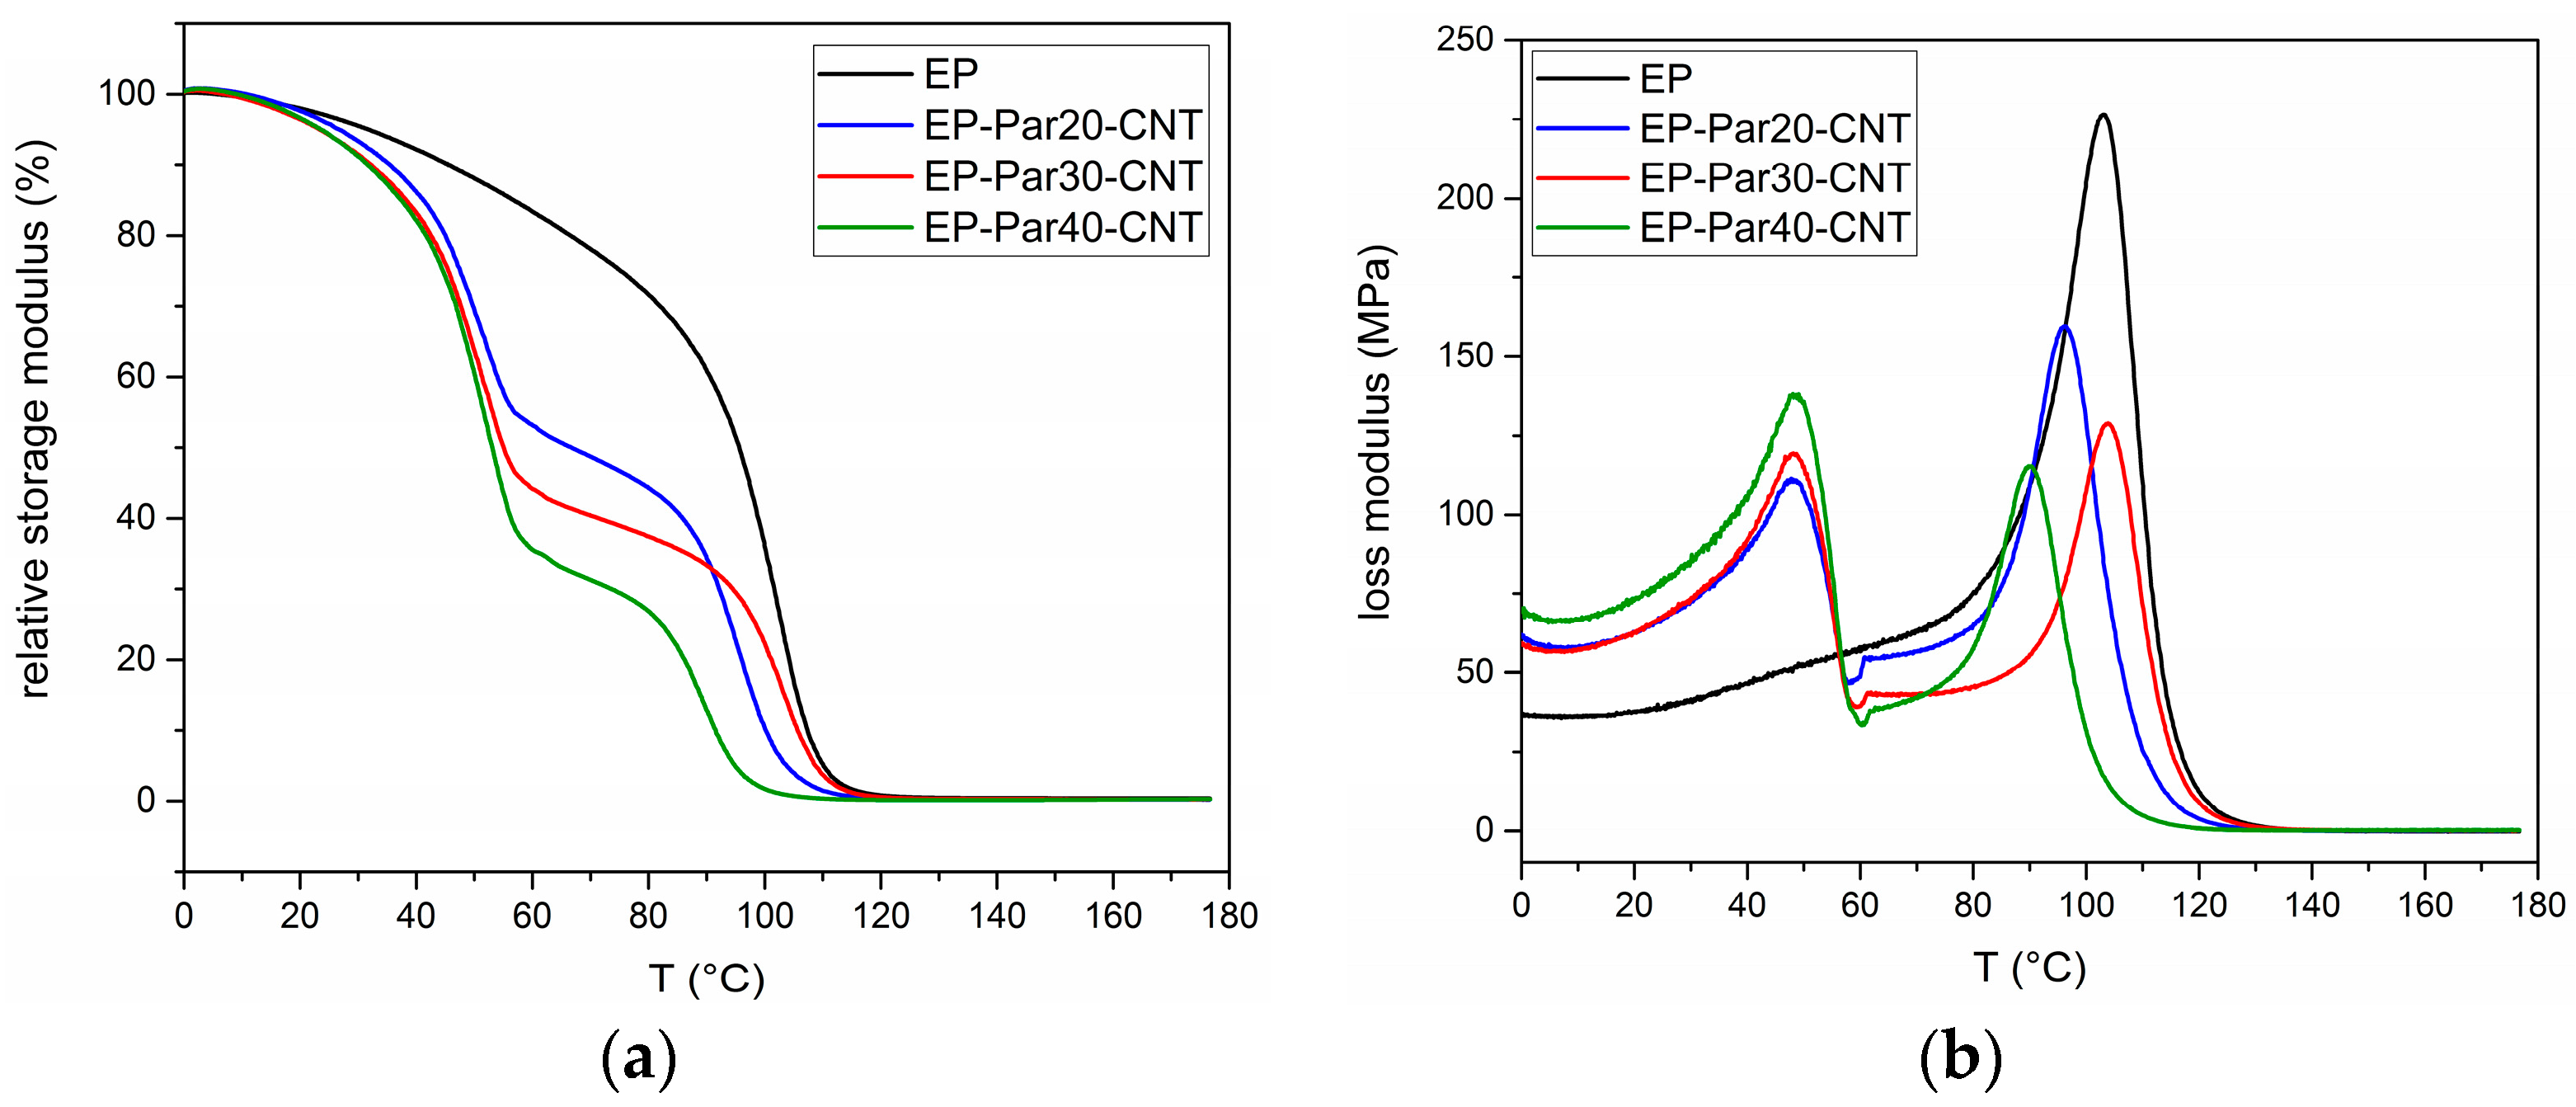
Figure 9a,b shows the main results of DMTA tests. The relative storage modulus (
) (respect to the value at 0 °C) as a function of temperature of the samples EP and EP-ParX-CNT (X = 20, 30, 40) is presented in
Figure 9a.
All the samples present a sharp decrease of
between 85 and 100 °C, in correspondence of the glass transition of the epoxy resin. Additionally, the blends EP-ParX-CNT (X = 20, 30, 40) show a decrease of
at approximately 50 °C, in correspondence of the melting of the paraffin. In the same way, the loss modulus of all the samples in
Figure 9b show peaks between 85 and 100 °C, while in the samples EP-ParX-CNT (X = 20, 30, 40) the melting of the paraffin is indicated by the peaks of the loss modulus at around 50 °C (see
Supplementary Materials Figure S2 and Table S4 for additional information on DMTA results).


