3.1. 0.1 wt % MLG-EP Nanocomposites
The topographical features of 0.1 wt % MLG-EP nanocomposites are shown in
Figure 6 and
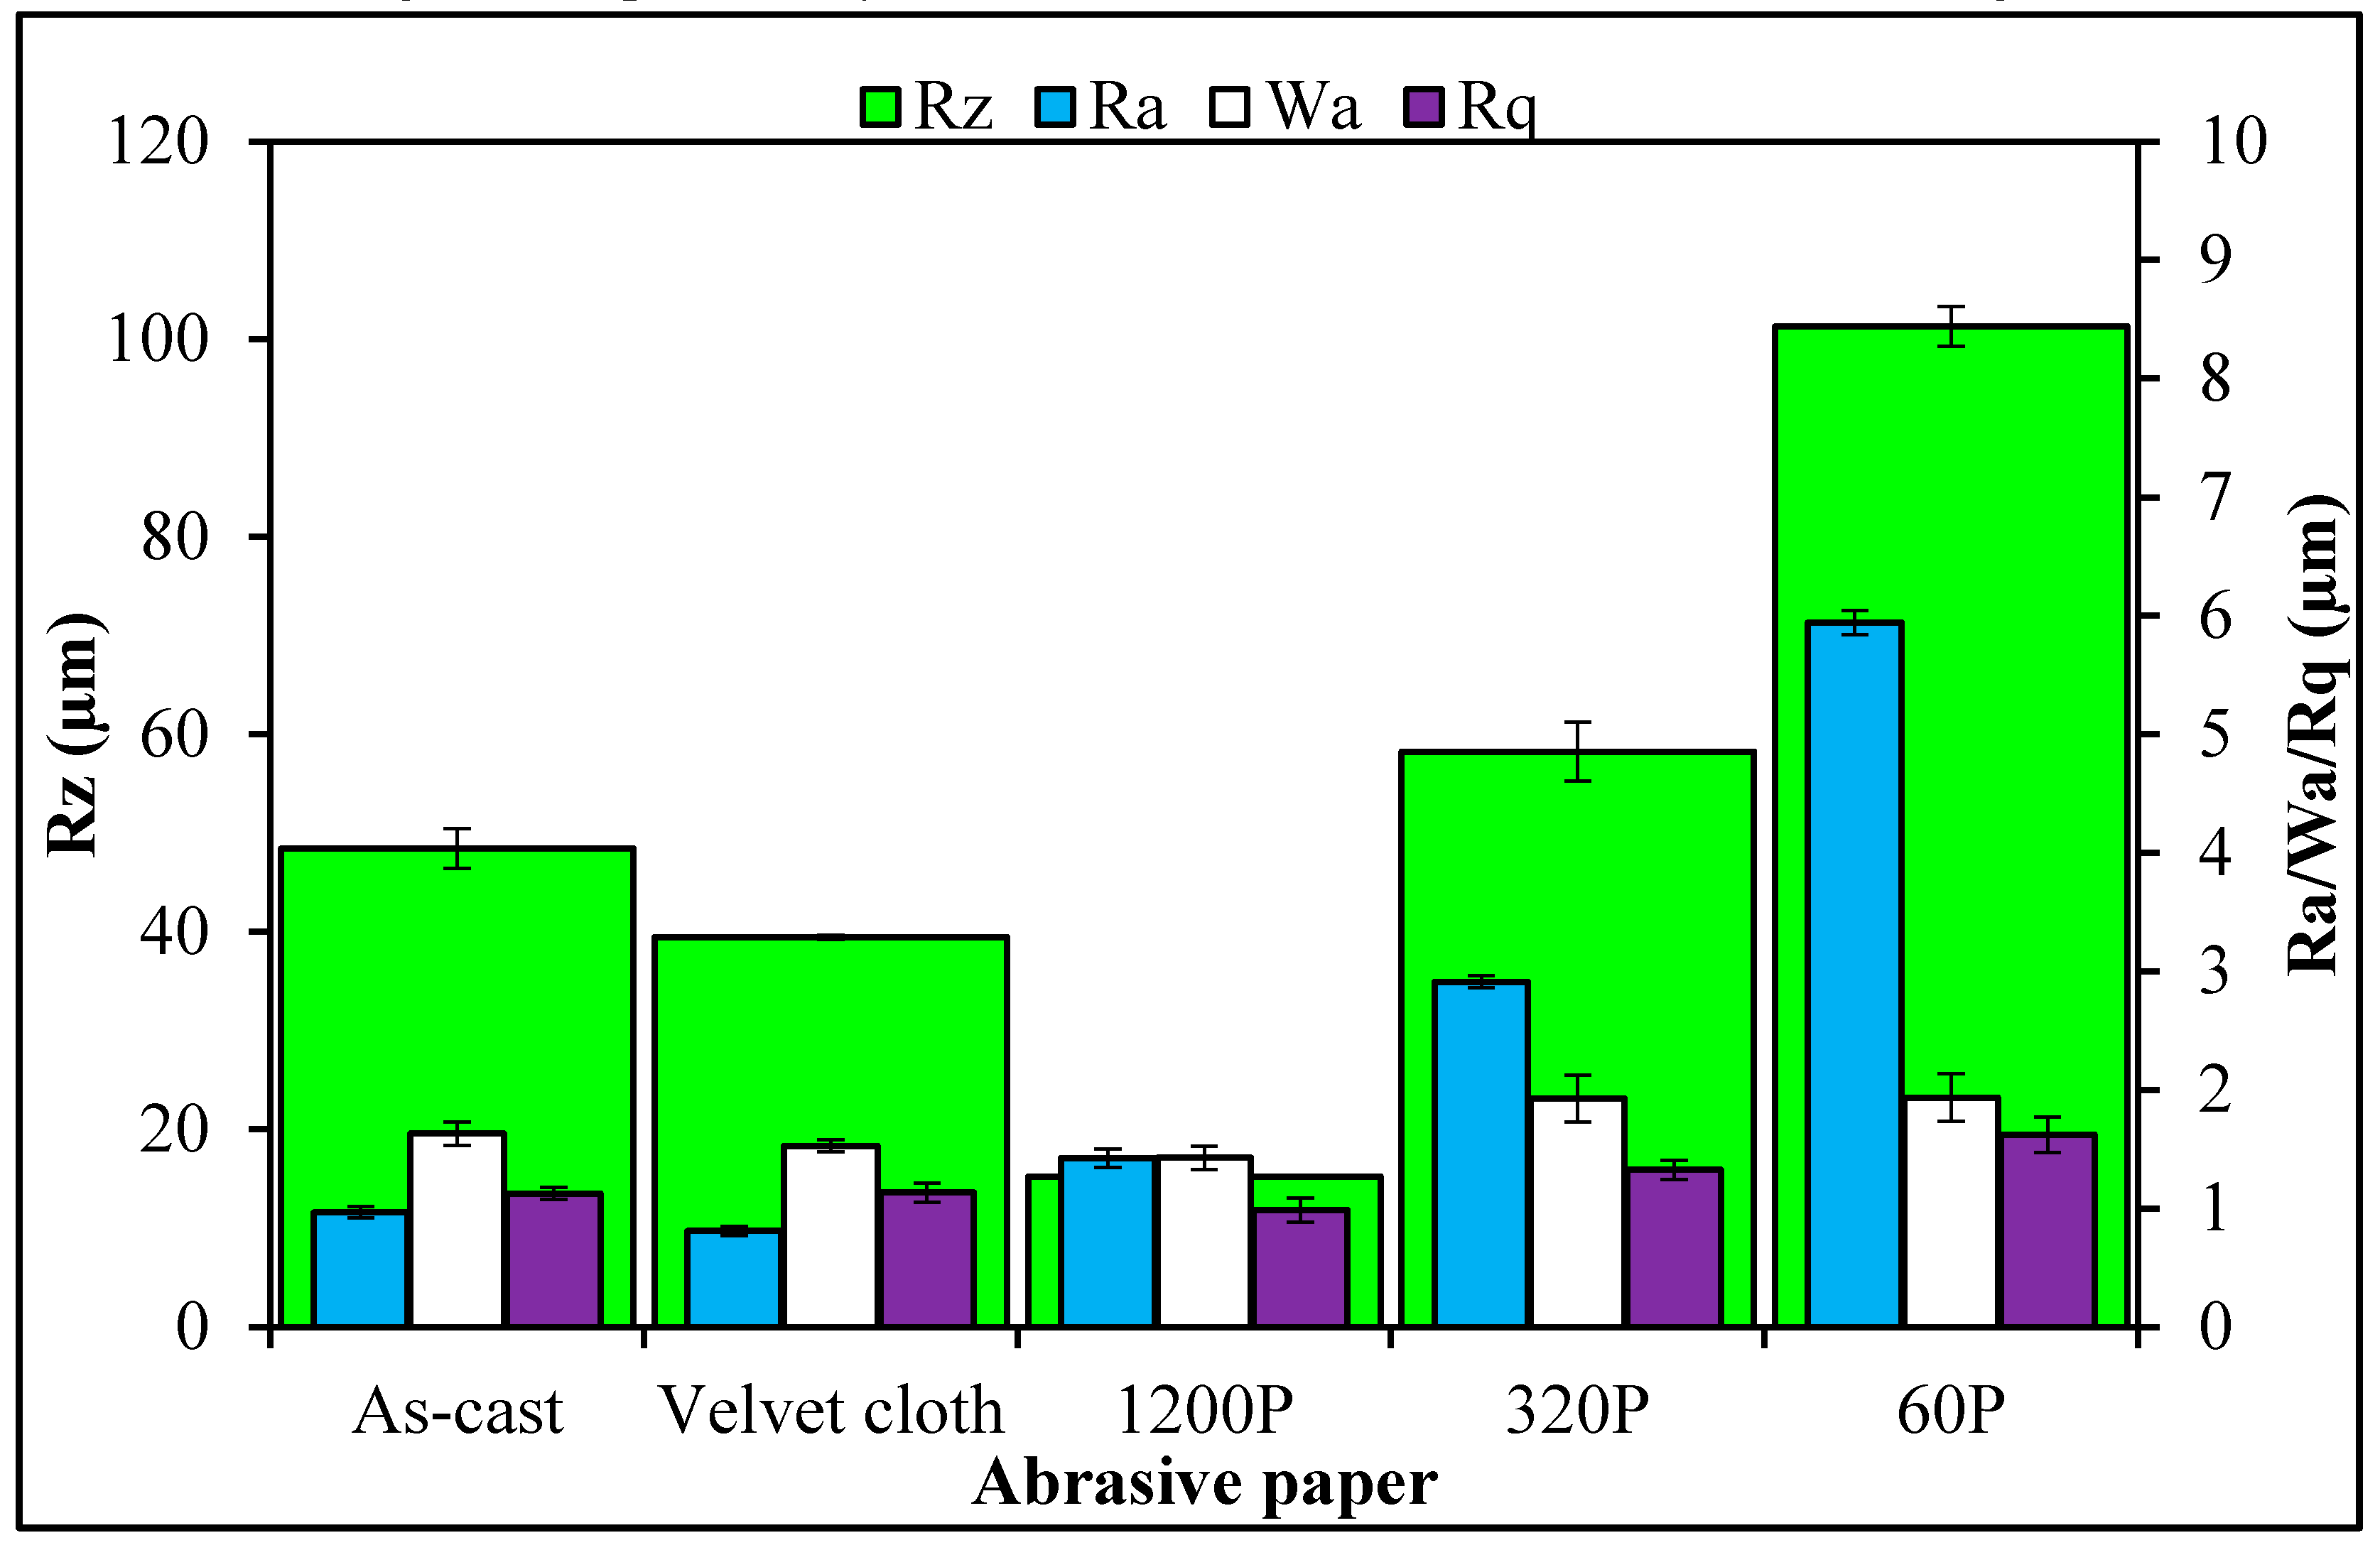
Figure 7. The roughness parameters were decreased by treatment with velvet cloth and 1200P while increased with 320P and 60P.
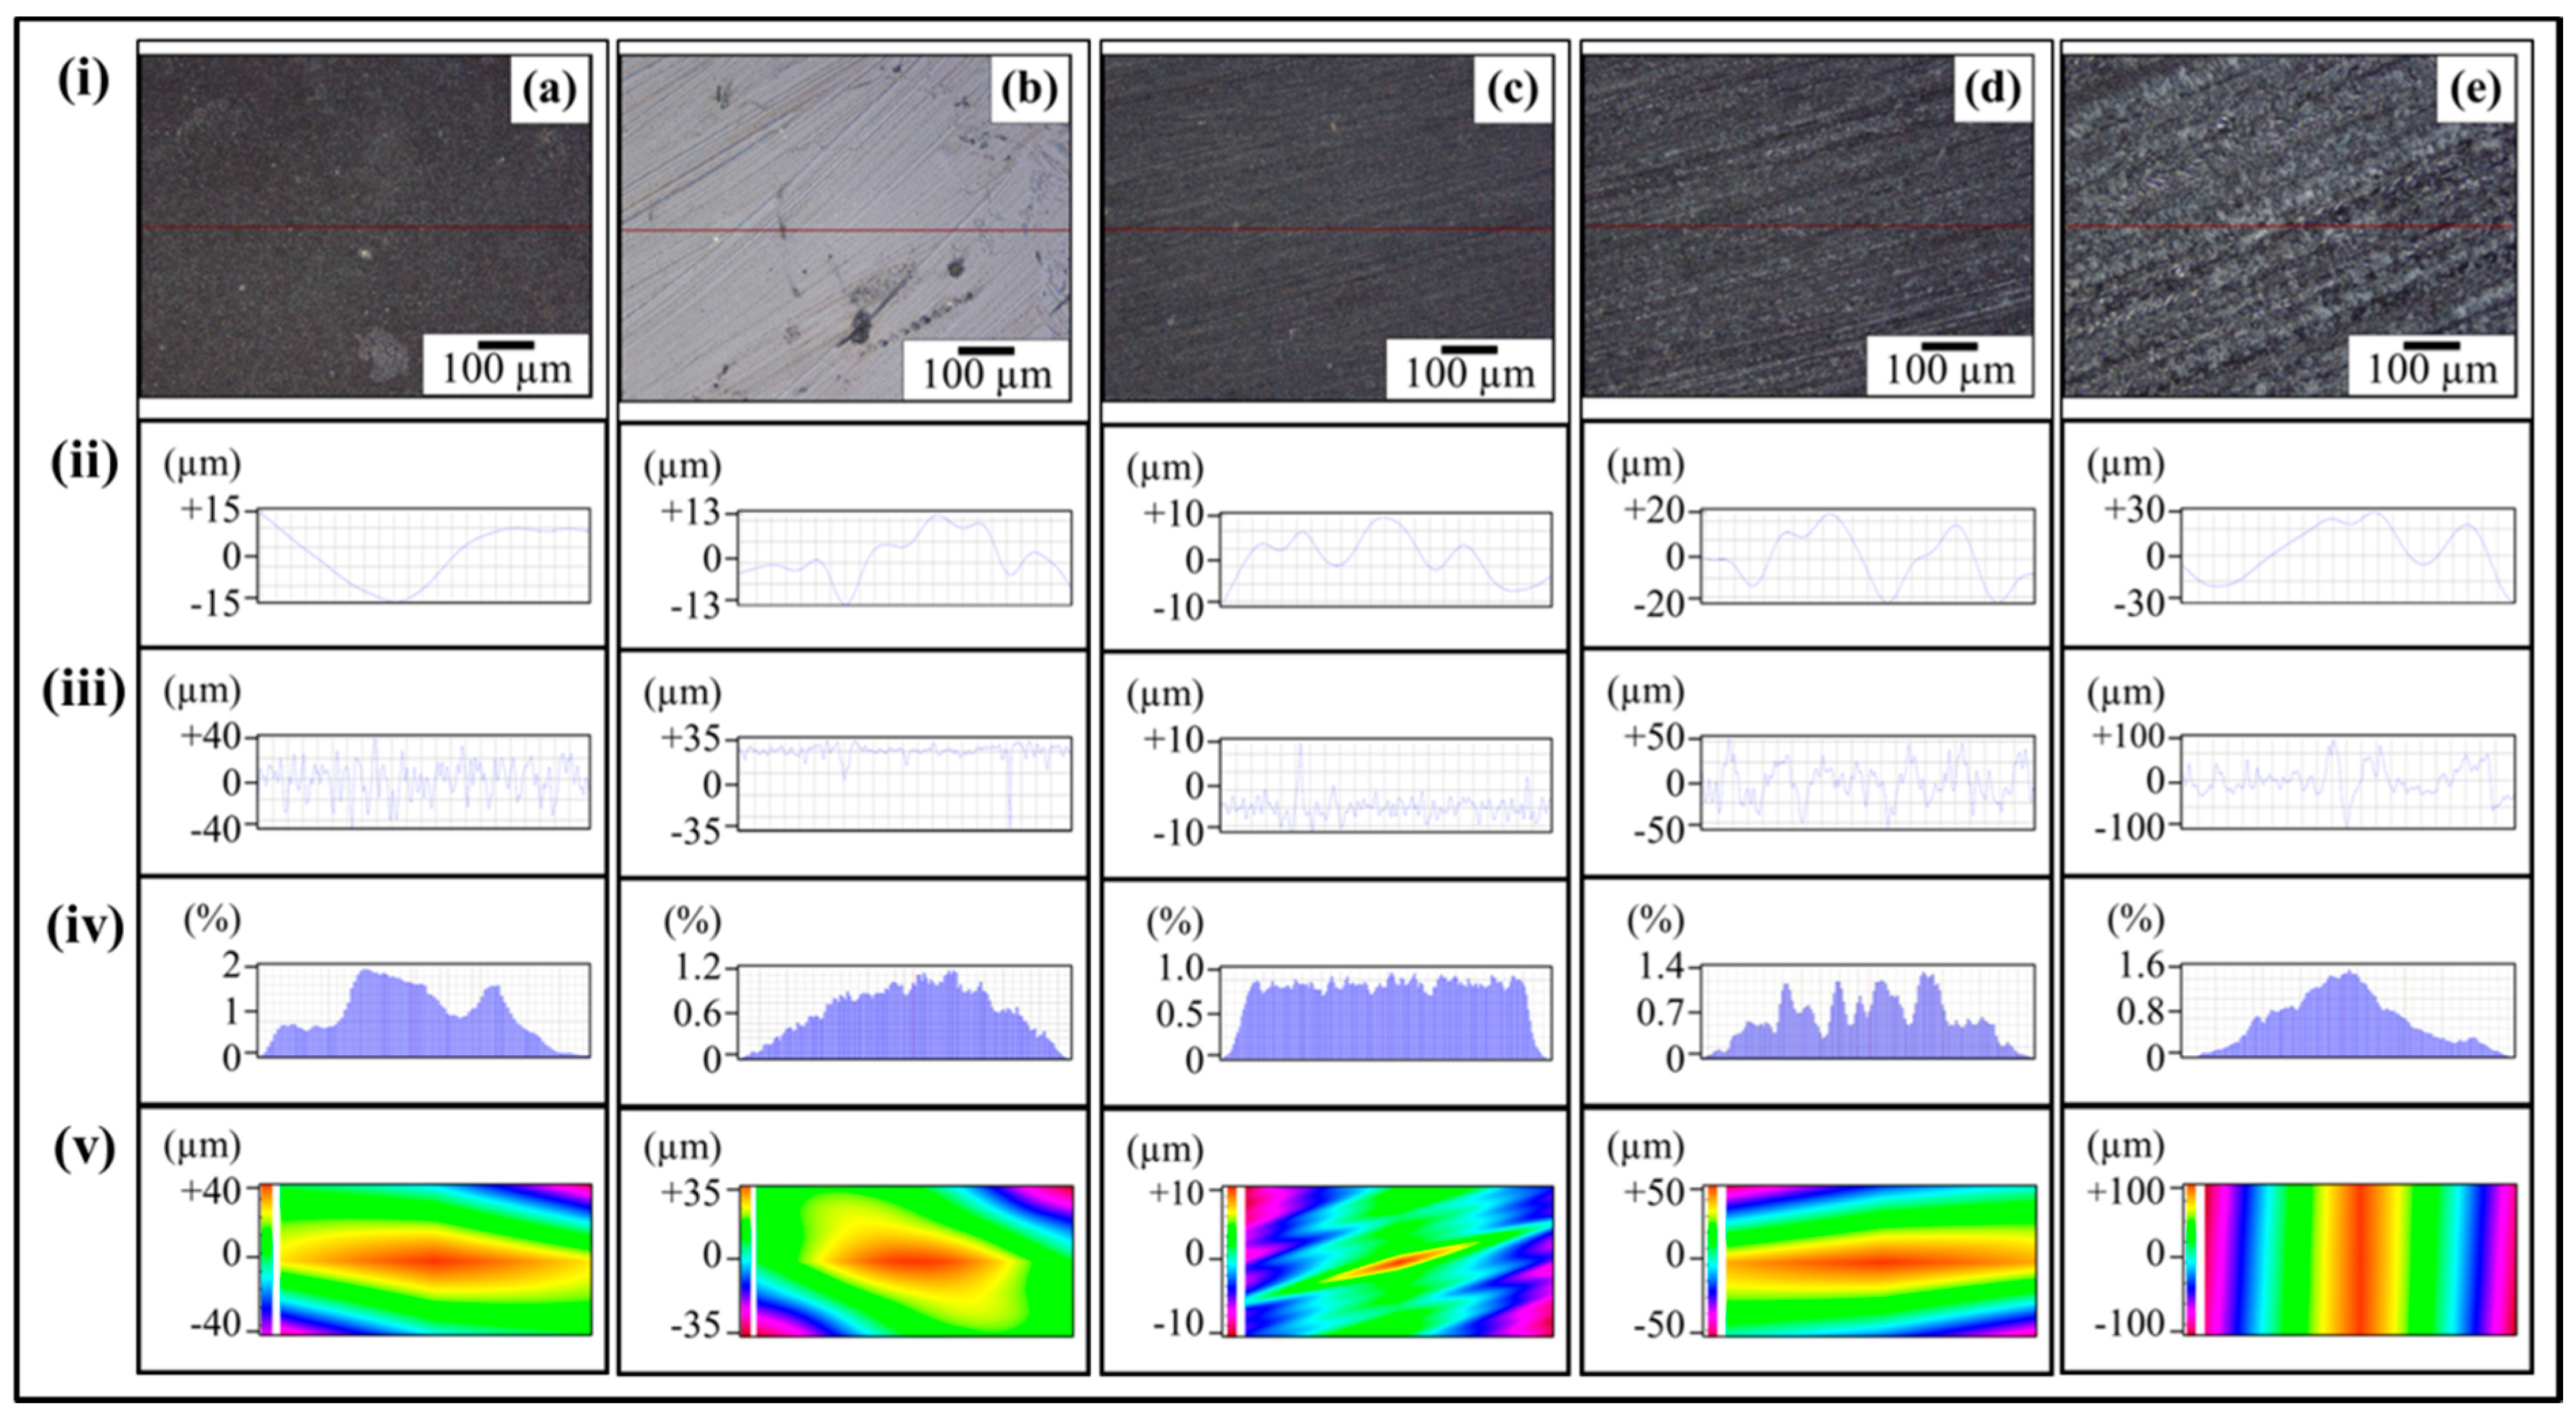
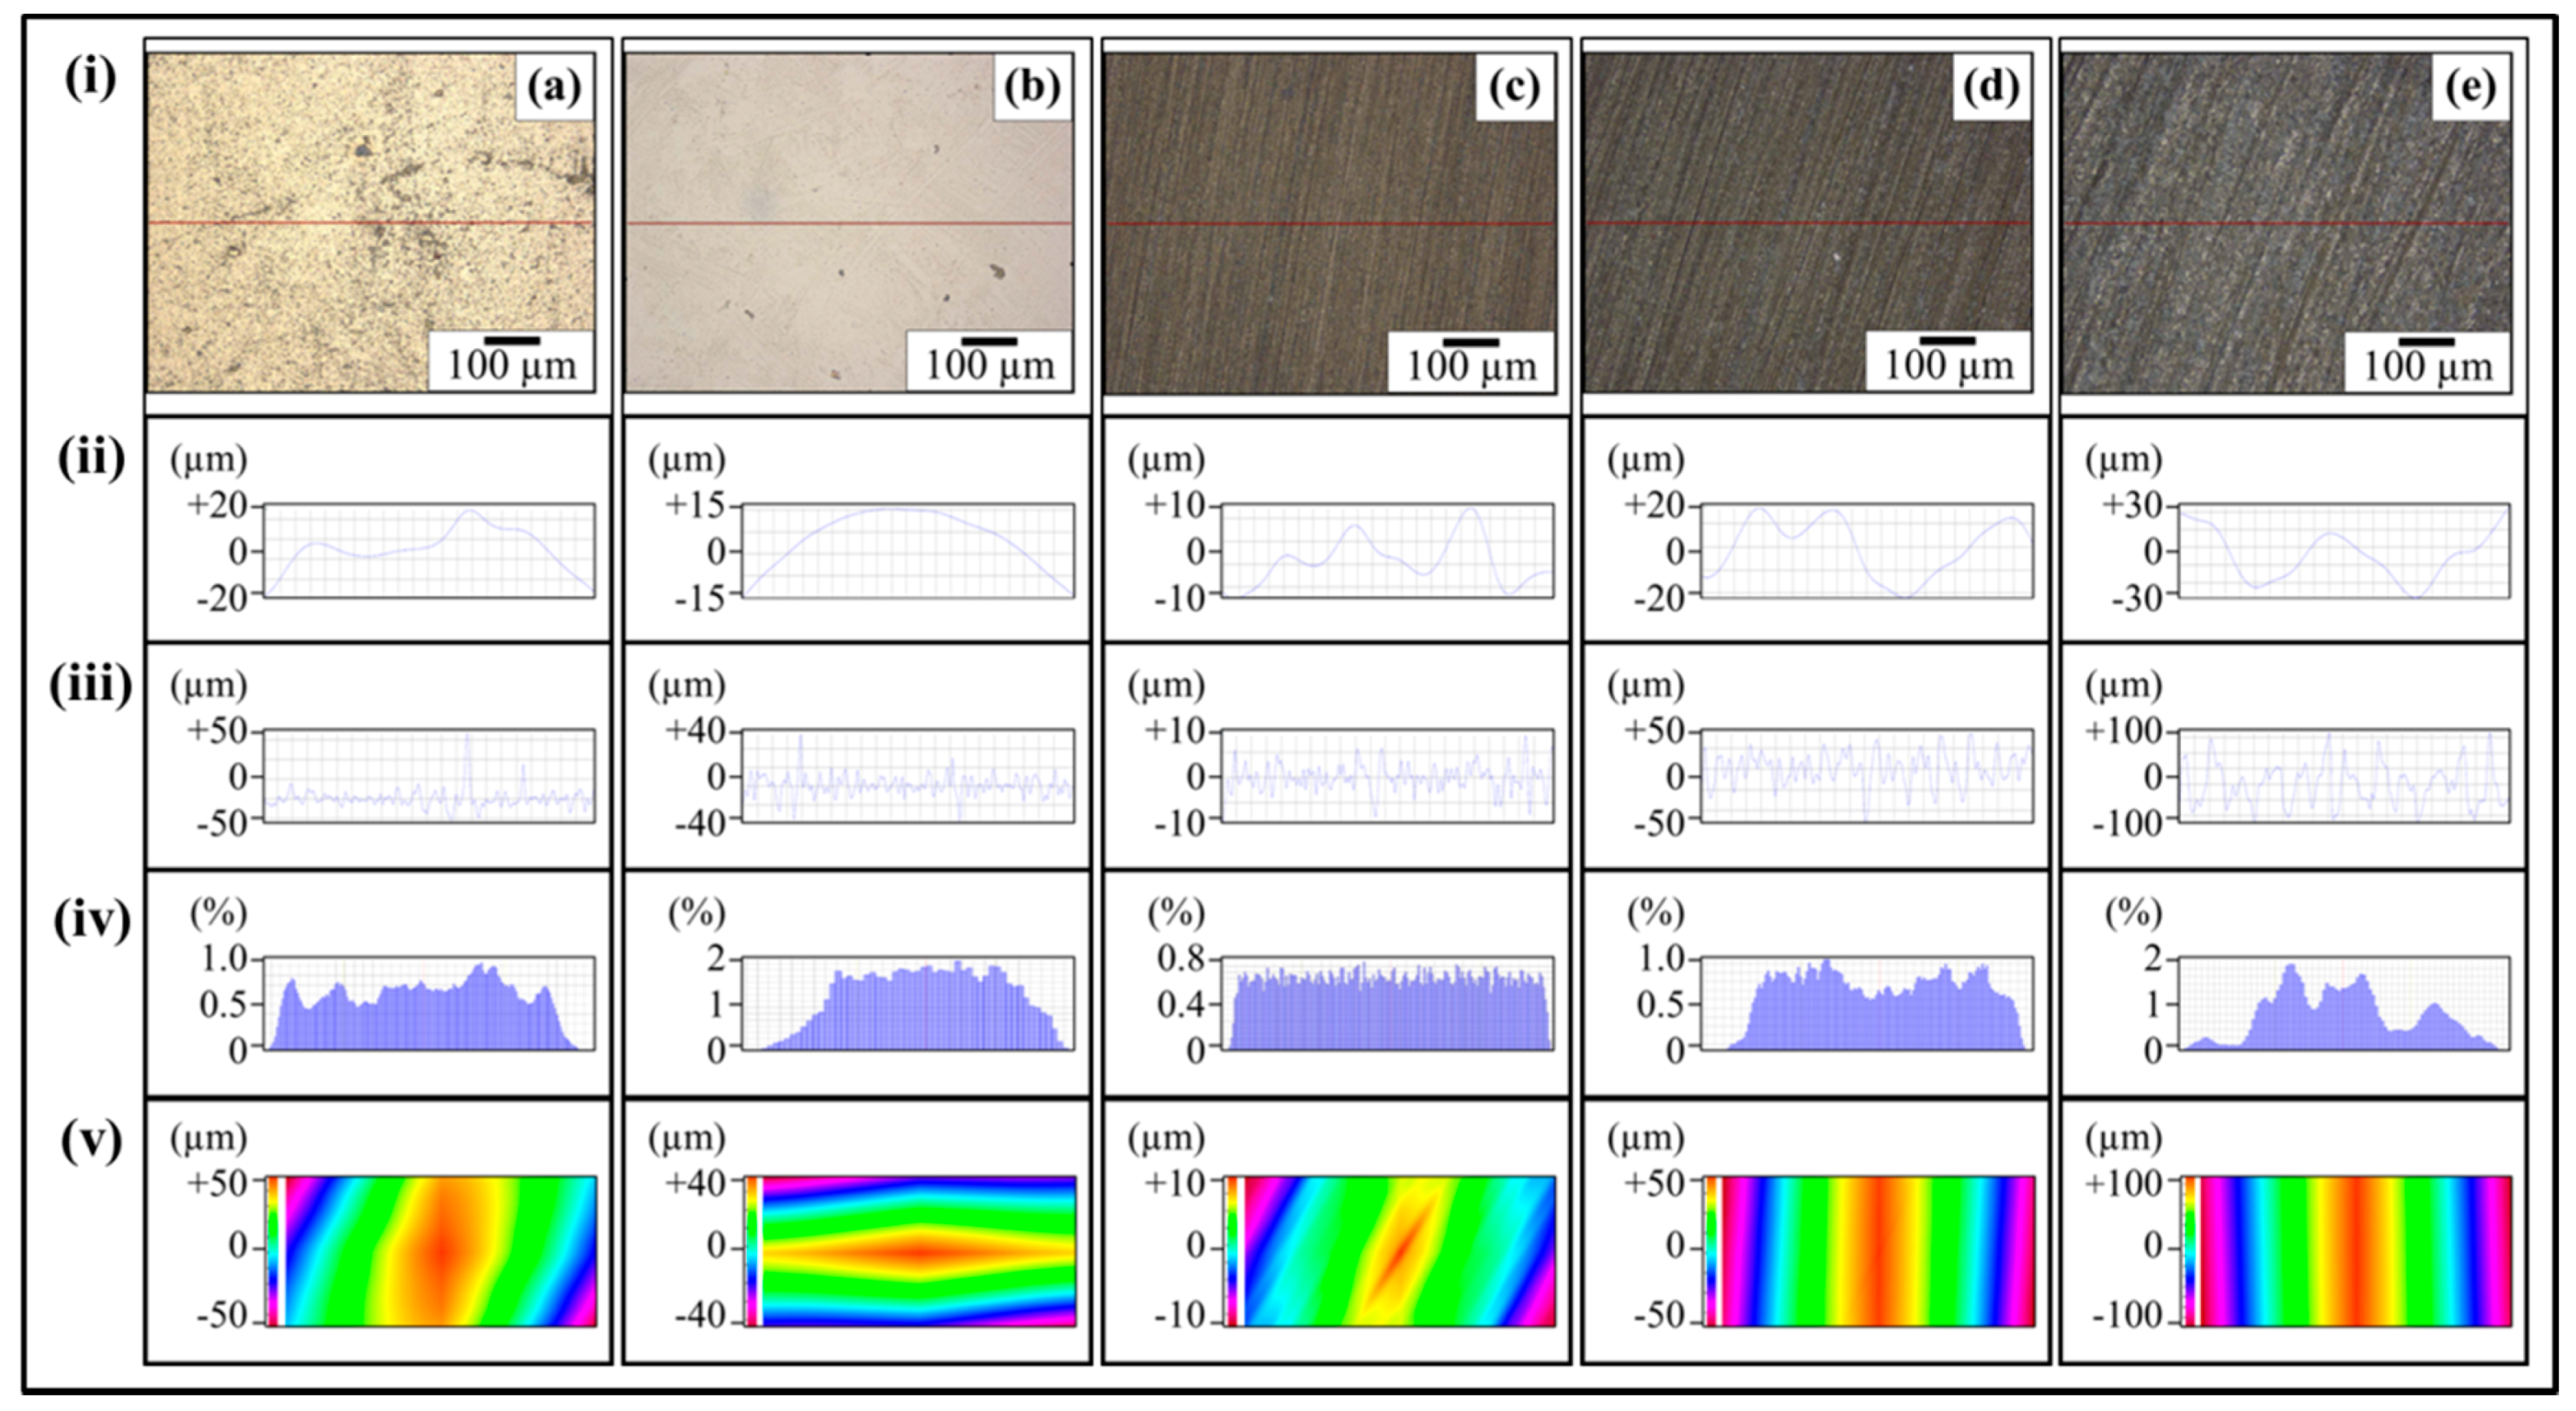
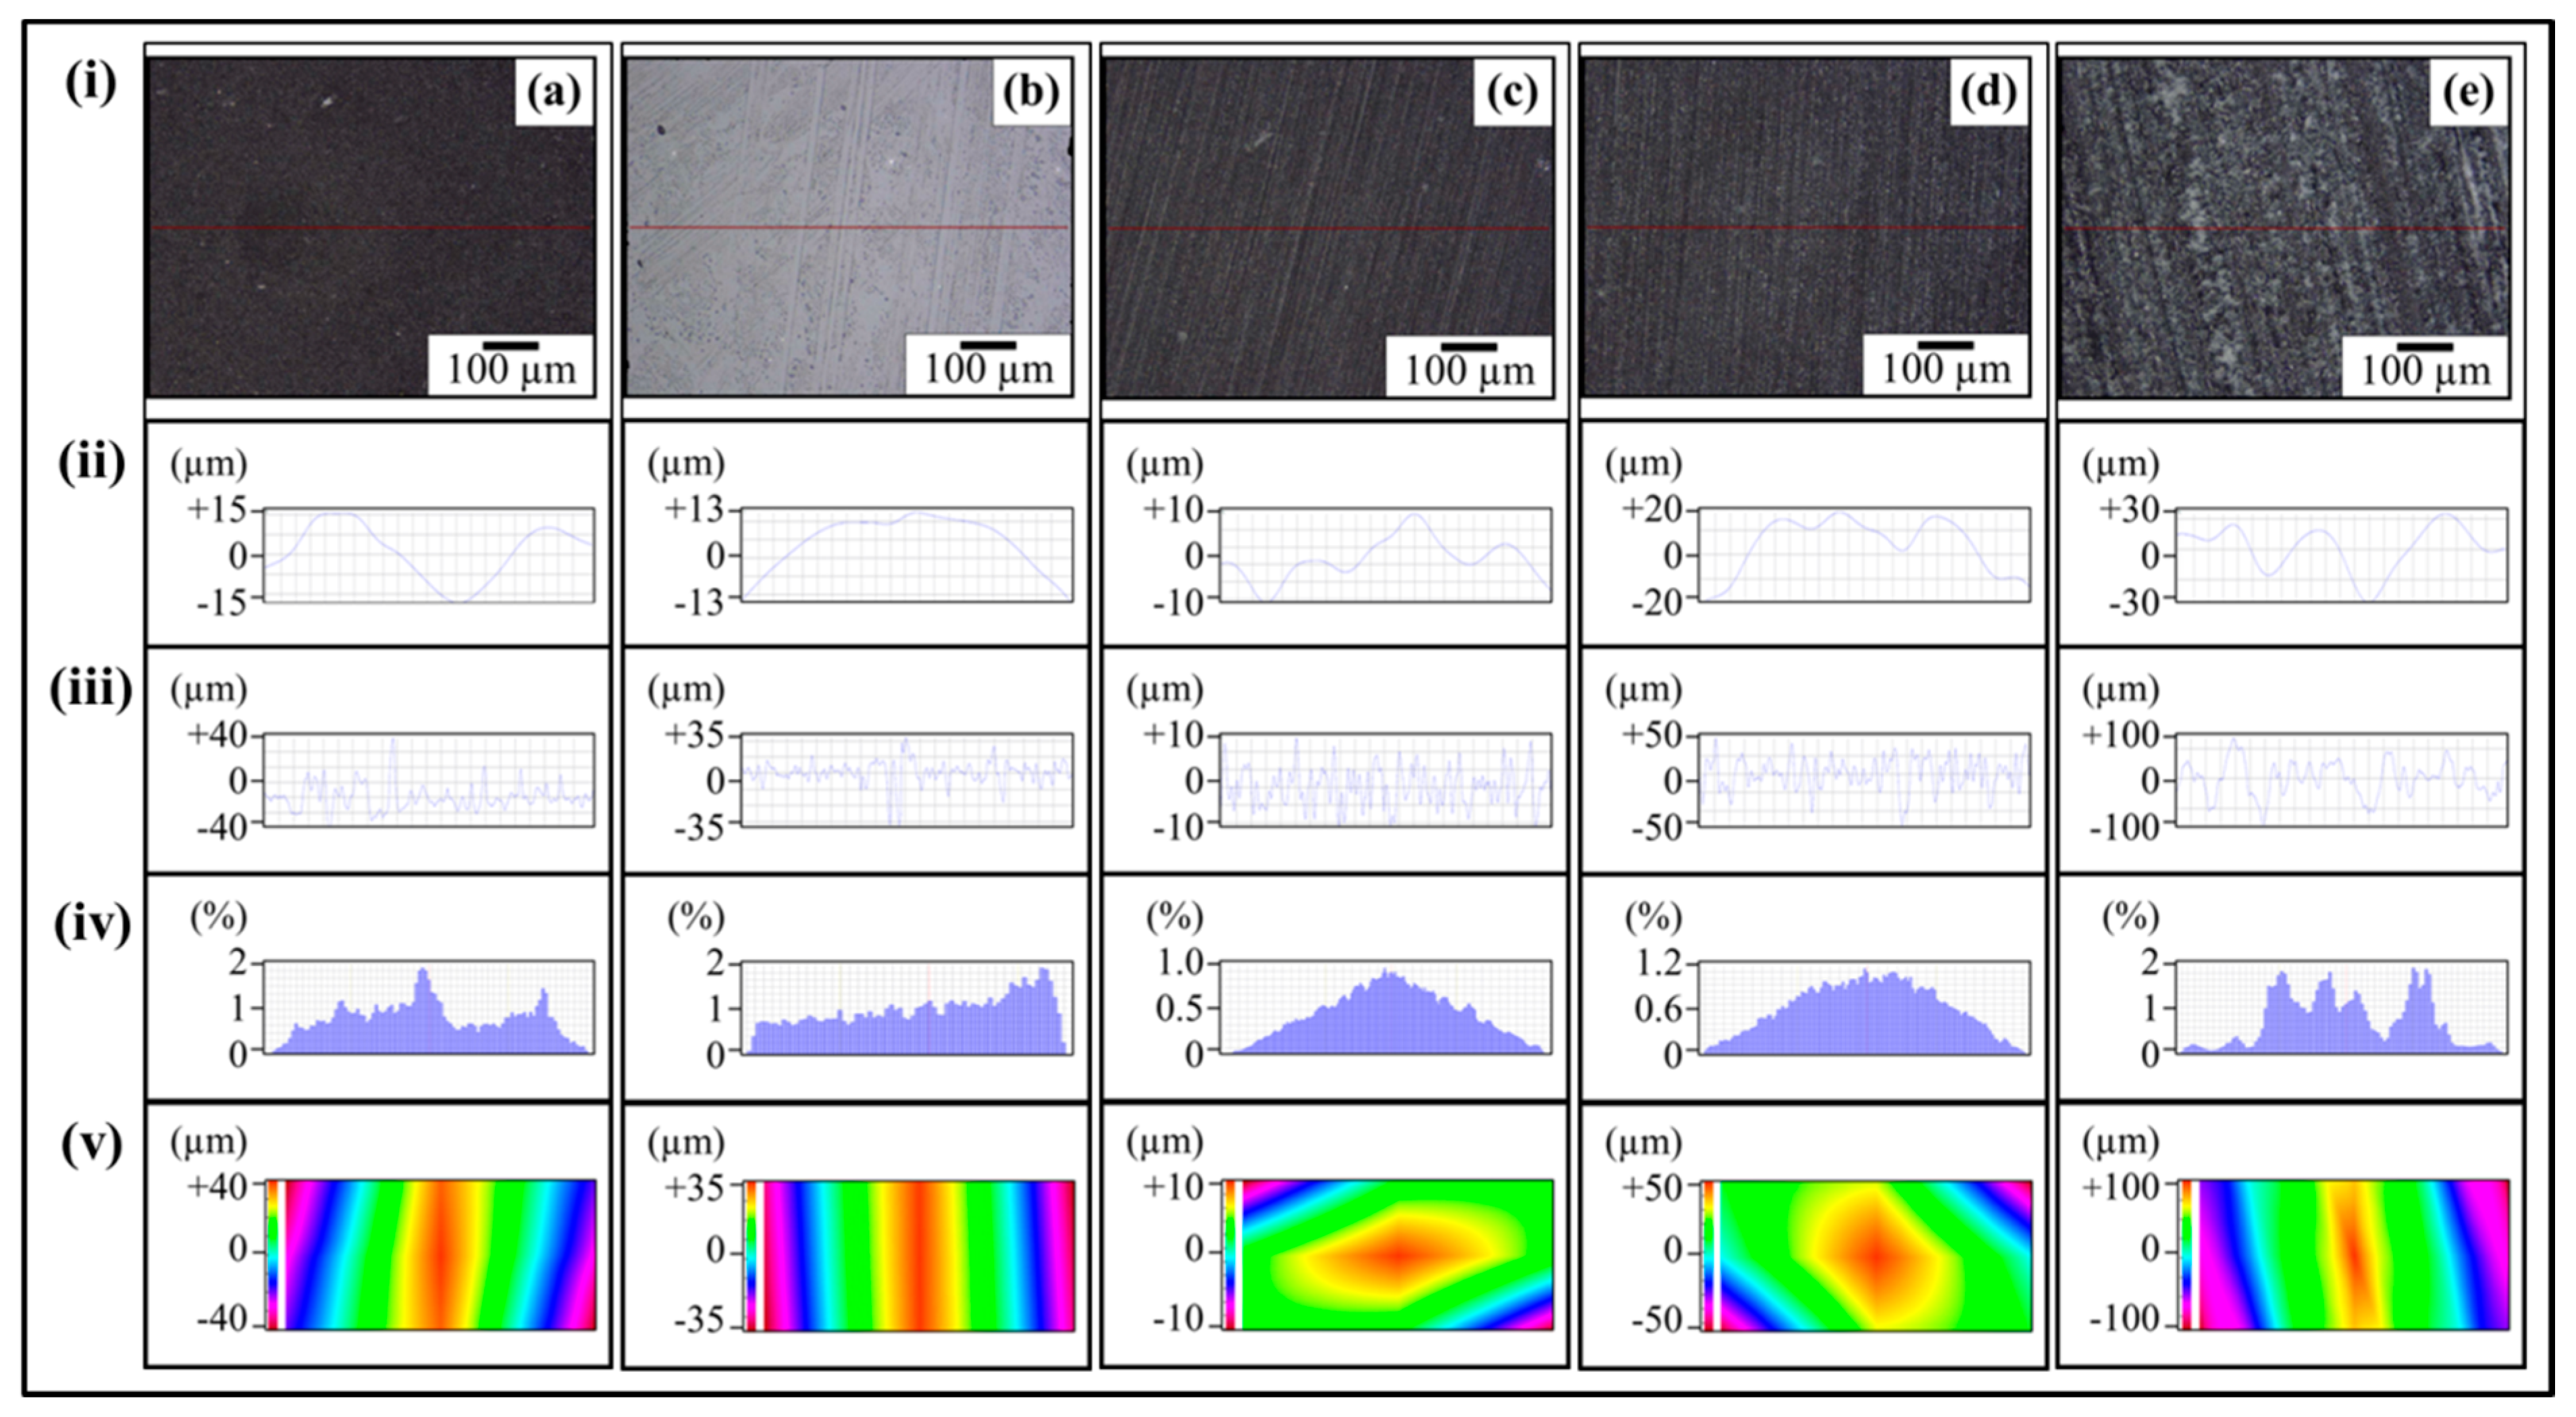
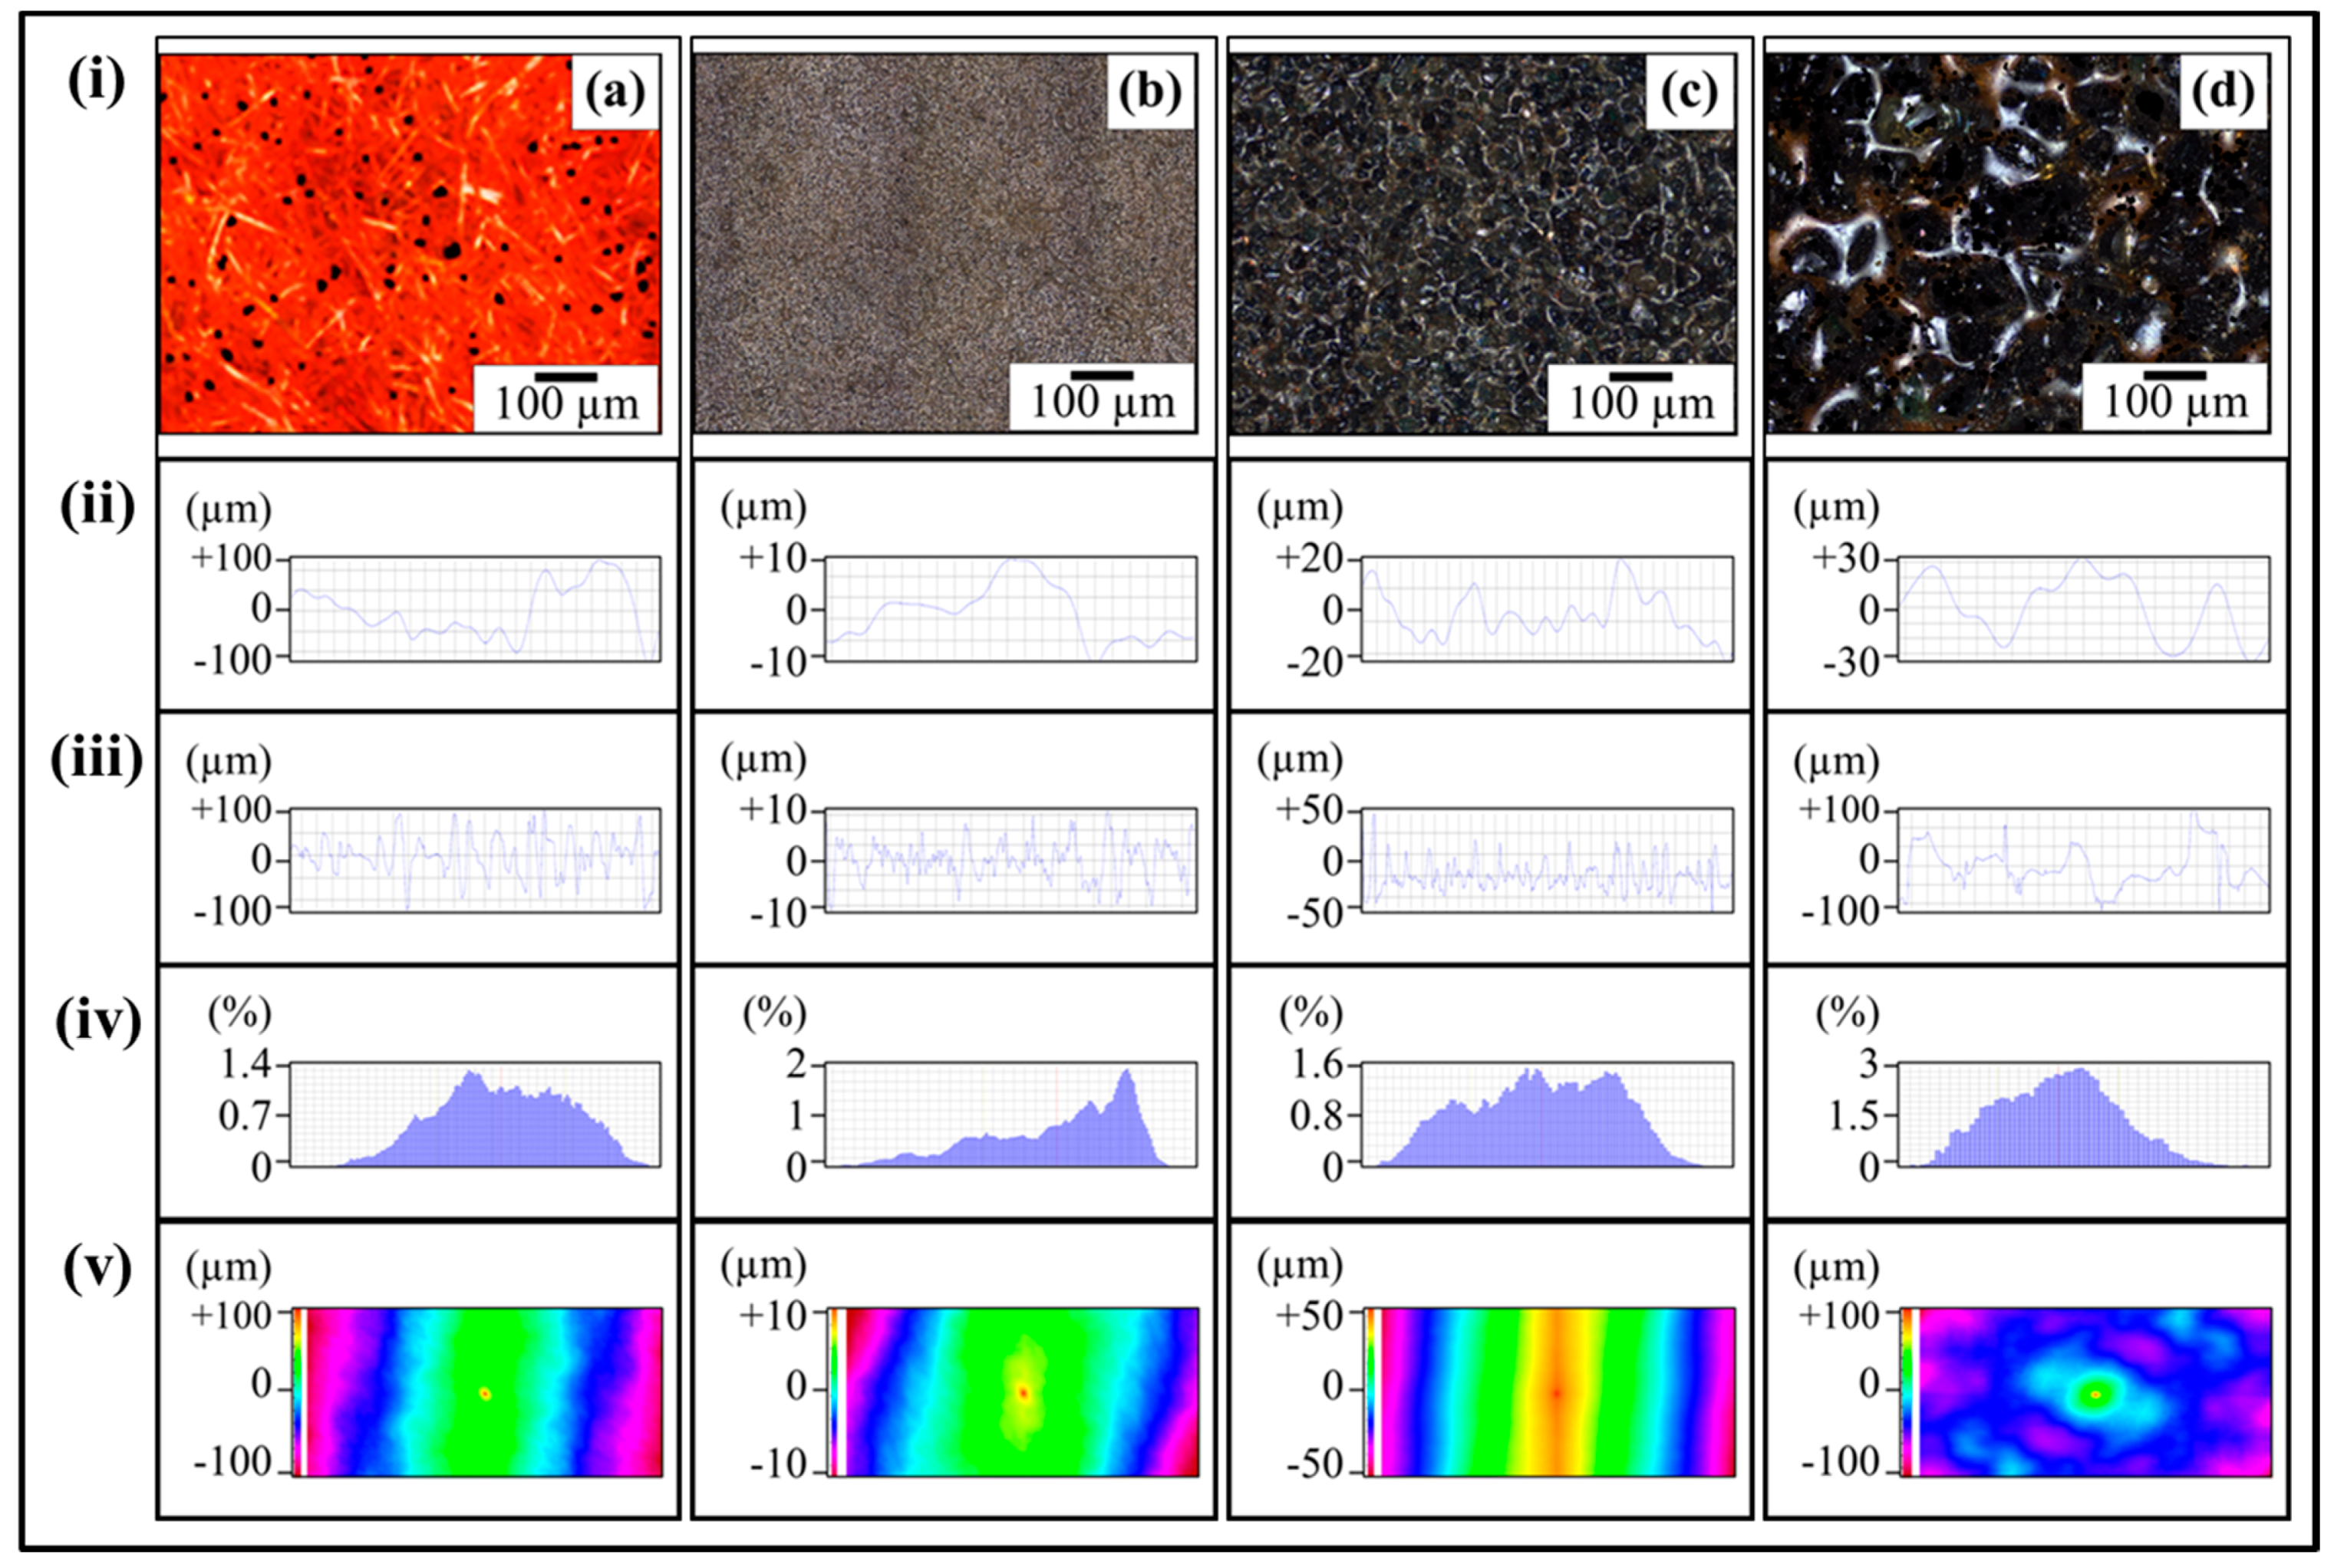
Figure 7ai shows the optical micrograph of as-cast 0.1 wt % MLG-EP sample. The waviness (
Figure 7aii) of the sample varies between ±15 µm while the surface roughness (
Figure 7aiii) varies between ±40 µm. This surface roughness is coming from the mold surface. The surface roughness graph shows that pointed notches of about 40 µm are present on the as-cast 0.1 wt % MLG-EP samples. The Gaussian distribution (
Figure 7aiv) shows that the roughness size is distributed with dominant size fraction of 2%. The roughness profile (
Figure 7av) shows that most of the roughness lies within ±40 µm with a deep notch (red region).
Figure 7bi shows the optical micrograph of 0.1 wt % MLG-EP sample treated with velvet cloth for 1 min (each side) on rotating wheels with rotational speed of 150 rpm. The waviness (
Figure 7bii) varies between ±13 µm while the surface roughness (
Figure 7biii) varies between ±35 µm. The Gaussian distribution (
Figure 7biv) shows that the roughness size is nearly uniformly distributed with dominant size fraction of 1.2%. The large range of surface roughness can be explained on the basis of diamond paste. The diamond paste had average particle size of 3 µm. Therefore, remnant dispersed and agglomerated diamond particles have contributed towards the surface roughness. The roughness profile (
Figure 7bv) shows that the surface roughness slightly decreased compared to as-cast sample (
Figure 7av).
Figure 7ci shows the optical micrograph of 0.1 wt % MLG-EP sample treated with abrasive paper 1200P. The waviness (
Figure 7cii) varies between ±10 µm while the surface roughness (
Figure 7ciii) varies between ±10 µm. The surface roughness fluctuates more quickly than in as-cast and velvet treated samples. However, the sharp notches have decreased. The Gaussian distribution (
Figure 7civ) shows that a nearly uniform distribution of roughness was obtained with a dominant size fraction of 1%. The roughness profile (
Figure 7cv) shows that there are no deep surface notches.
Figure 7di shows the optical micrograph of 0.1 wt % MLG-EP sample were treated with abrasive paper 320P. The scratches of different size and orientation can be observed. The waviness (
Figure 7dii) varies between ±20 µm while the surface roughness (
Figure 7diii) varies between ±50 µm. The Gaussian distribution (
Figure 7div) shows that the dominant roughness fraction is 1.4%.
The roughness profile (
Figure 7dv) shows that deep notches emerged on the sample surface by treatment with 320P.
Figure 7ei shows the optical micrograph of 0.1 wt % MLG-EP sample treated with abrasive paper 60P. A coarse topography can be observed. The waviness (
Figure 7eii) varies between ±30 µm while the surface roughness (
Figure 5eiii) varies between ±100 µm. The deep pointed notches can be observed which can later influence the mechanical properties of the samples. The Gaussian distribution (
Figure 7eiv) shows that dominant roughness fraction is 1.6%. The surface profile of larger sample (
Figure 7ev) shows that coarse topography is present with abruptly changing roughness.
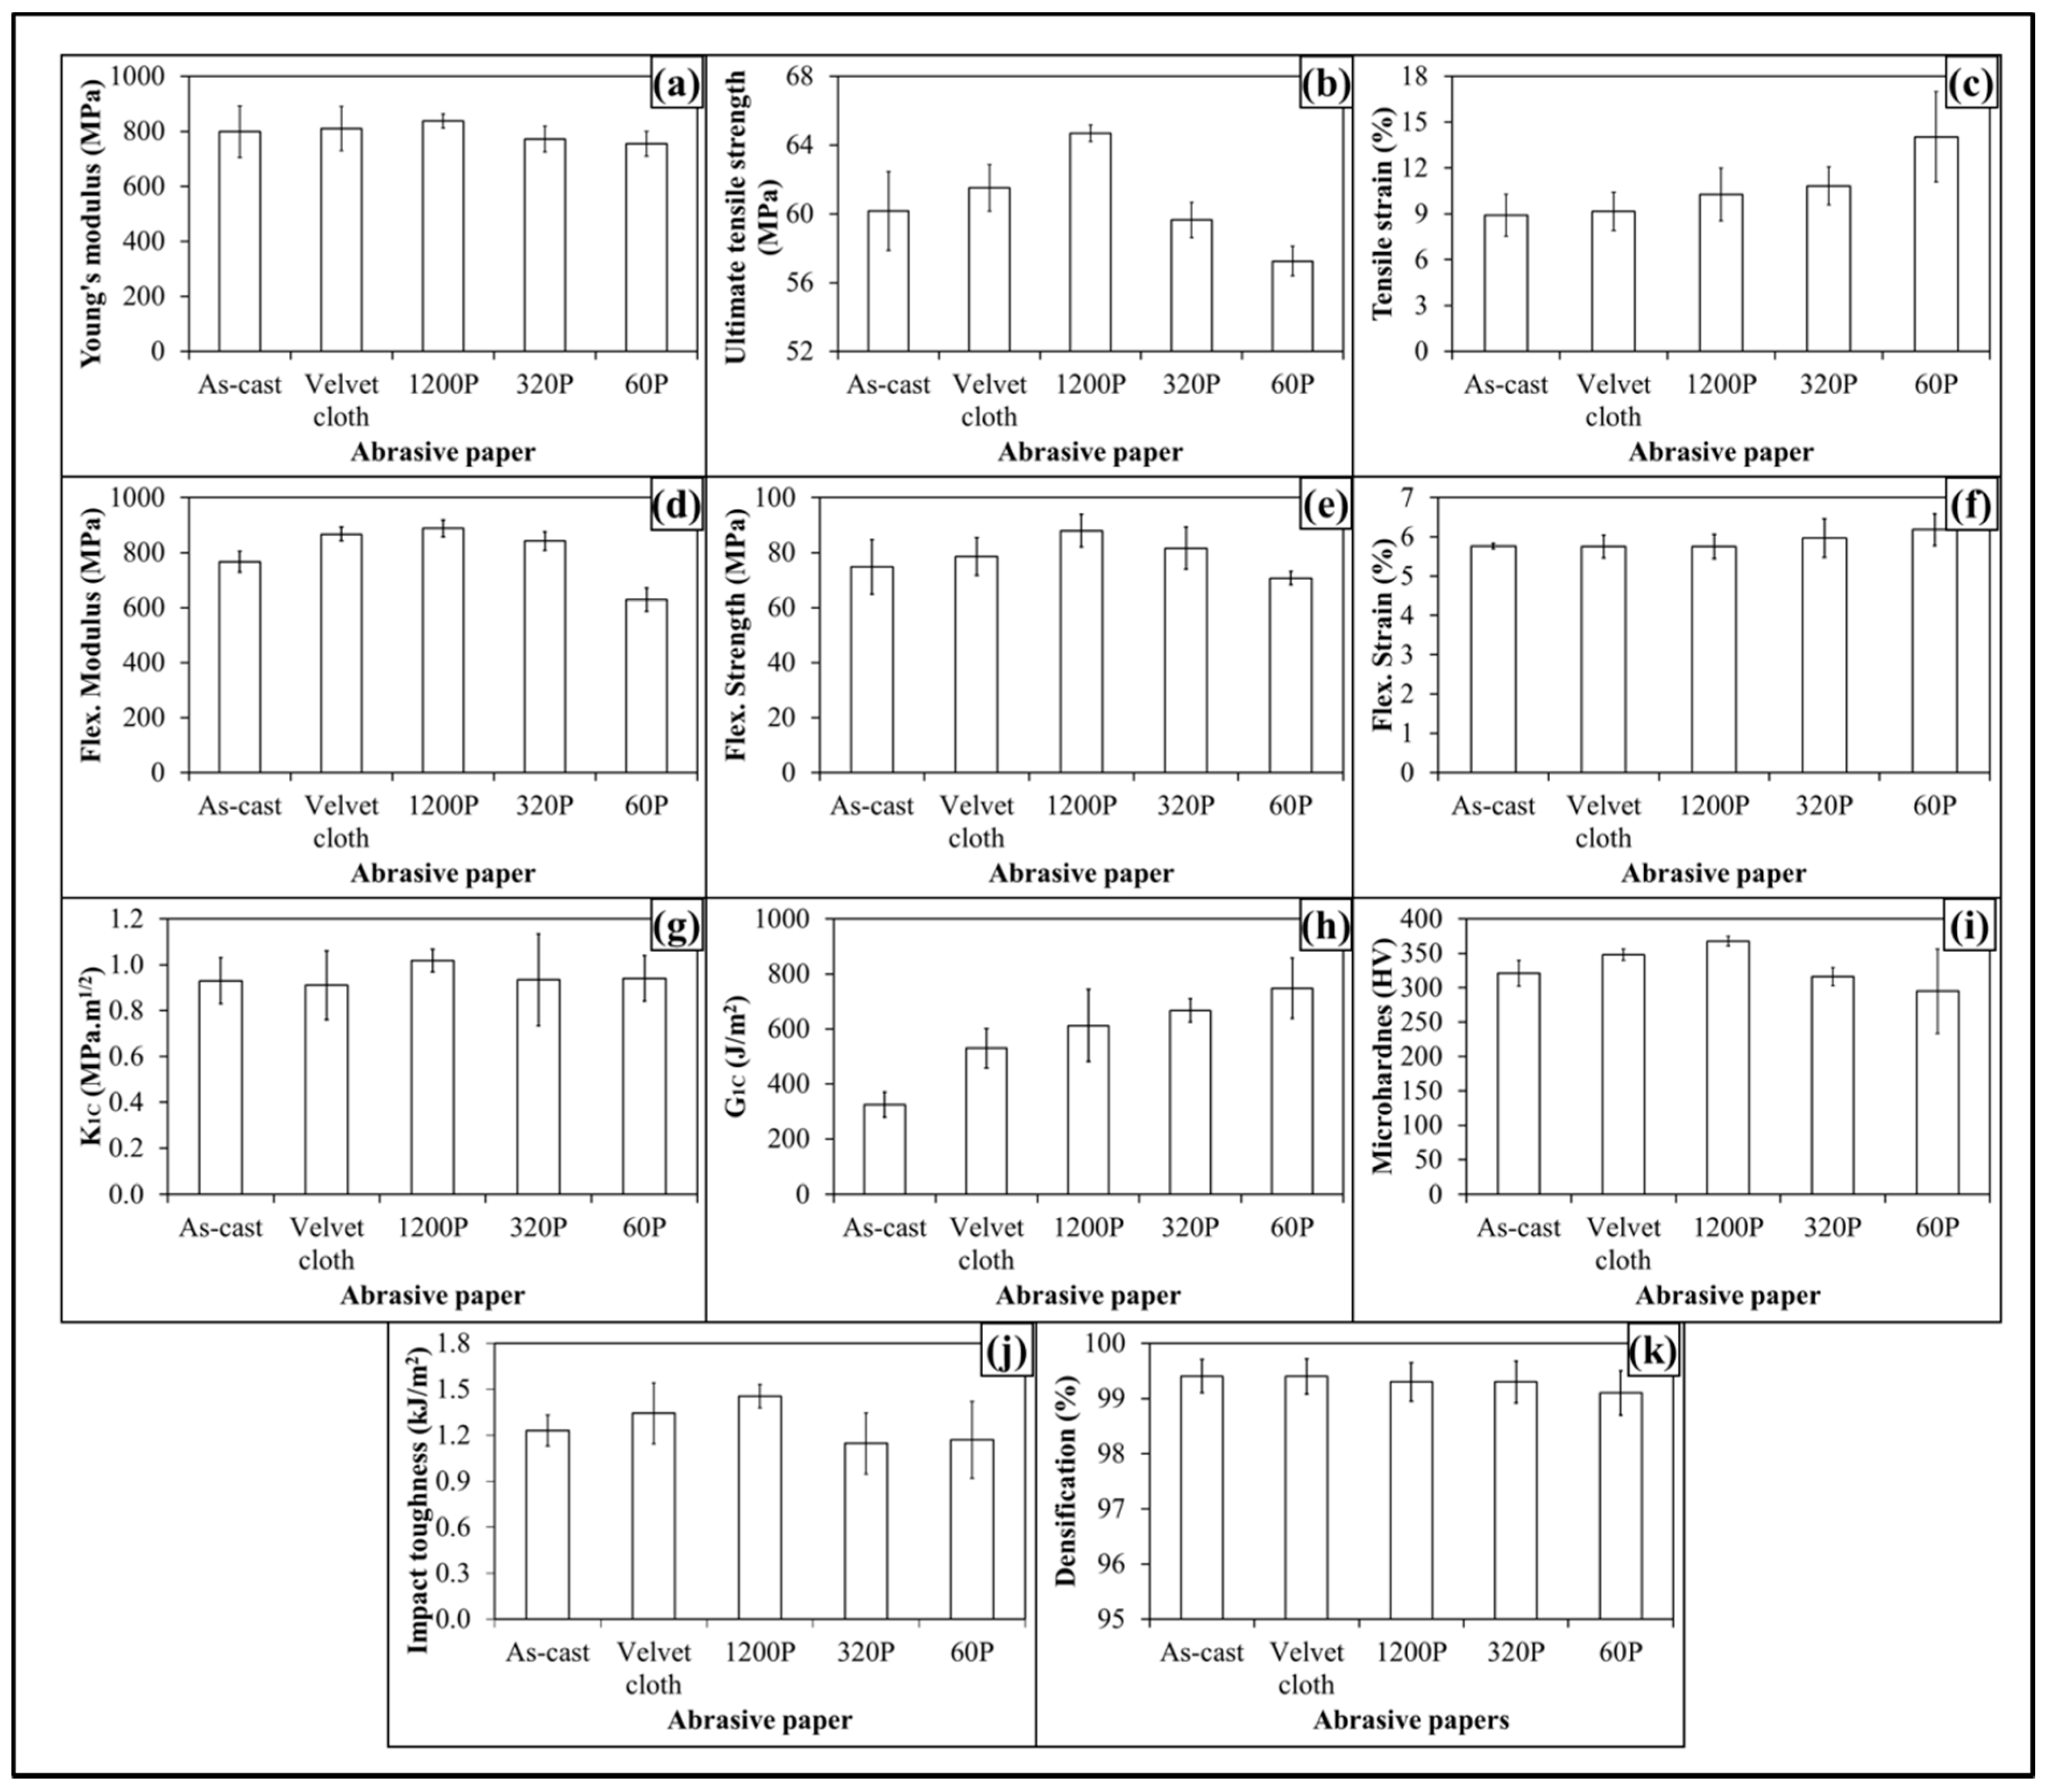
The topographical features influenced mechanical properties of 0.1 wt % MLG-EP samples as shown in
Figure 8. The Young’s modulus (
Figure 8a) increased from 798 MPa to 810 MPa (1.4% increase) when 0.1 wt % MLG-EP nanocomposites were treated with velvet cloth. The Young’s modulus of 0.1 wt % MLG-EP nanocomposites treated with 1200P also increased to 838 MPa (5% increase). However the Young’s modulus of 0.1 wt % MLG-EP nanocomposites treated with 320P decreased to 772 MPa (3.3% decrease). The maximum decrease in Young’s modulus was observed when the samples were treated with abrasive paper 60P and decreased to 755 MPa (5.5% decrease). The values show that Young’s modulus can be increased by treatment with velvet cloth and abrasive paper 1200P and decreased by treatment with abrasive papers 320P and 60P.
The influence of topography on UTS is shown in
Figure 8b. The UTS of 0.1 wt % MLG-EP nanocomposites treated with velvet cloth increased from 60 MPa to 62 MPa (2.2% increase). The maximum increase in UTS of 0.1 wt % MLG-EP nanocomposites was observed when 0.1 wt % MLG-EP nanocomposites were treated with abrasive paper 1200P and UTS increased to 65 MPa (7.5% increase). The UTS of 0.1 wt % MLG-EP nanocomposites treated with abrasive paper 320P decreased to 59 MPa (1% decrease). When treated with abrasive papers 60P, the UTS decreased to 57 MPa (4.8% decrease). The influence of topography on tensile strain is shown in
Figure 8c. The tensile strain kept increasing with the coarser topography which can be attributed to lower stiffness and strength values. The tensile strain did not change much with velvet cloth and slightly increased in the case of abrasive paper 1200P. Therefore, overall better tensile properties can be achieved when samples are treated with velvet cloth and abrasive paper 1200P.
The influence of topography on flexural modulus of 0.1 wt % MLG-EP nanocomposites is shown in
Figure 8d. The flexural modulus of as-cast 0.1 wt % MLG-EP nanocomposites is 767 MPa. When treated with velvet cloth, the flexural modulus increases to 867 MPa (13% increase). The flexural modulus of 0.1 wt % MLG-EP nanocomposites treated with abrasive paper 1200P is 888 MPa (16% increase). The flexural modulus of sample treated with 320P is 842 MPa (10% increase) and that of treated with 60P is 629 MPa which shows a decrease of 18%. The variation in flexural modulus is nearly in accordance with the variation in tensile modulus.
The influence of topography on flexural strength is shown in
Figure 8e. The flexural strength of as-cast 0.1 wt % MLG-EP nanocomposites is 75 MPa. When treated with velvet cloth, the flexural strength increases to 79 MPa (5% increase). The flexural strength of sample treated with abrasive paper 1200P is 88 MPa (18% increase). The flexural strength of sample treated with 320P remained high and was 82 MPa (9% increase). In comparison to tensile strength which increased only to 3%, an increase of 22% in flexural strength indicates that surface roughness up to ±20 µm is not detrimental to flexural strength. The flexural strength of sample treated with abrasive paper 60P is 70 MPa which is slightly lower than that of as-cast sample. In comparison to tensile strength which decreased by 2%, the flexural strength value of sample treated with 60P indicates that surface roughness up to ±30 µm has detrimental effect on tensile strength while flexural strength seems impervious. The influence of topography on flexural strain (%) is shown in
Figure 8f. The flexural strain nearly remained the same till abrasive paper 320P. However, it increased when sample was treated with abrasive paper 60P. This increase in flexural strain can be explained on the basis of decreased flexural modulus and strength.
The influence of topography on fracture toughness (
K1C) is shown in
Figure 8g. No specific trend on
K1C was observed and
K1C remained nearly the same. The values show that standard deviation is different for different samples. This can be because the tip of the notch was sharpened manually with a fresh razor blade which may not generate surfaces of equal length and curvature. In addition, the volume fraction, size, and distribution of porosity can be another factor which can influence the mechanical properties. The variation in
G1C of topographically modified 0.1 wt % MLG-EP samples is shown in
Figure 8h. The trend shows that
G1C increases as the coarseness of topography increases. However, as topography did not show significant influence on
K1C, the authors are skeptical in believing that this increase in
G1C is directly coming from topography. In calculating
G1C,
is divided by Young’s modulus. As Young’s modulus decreased with coarse topography, therefore the increase in G
1C is possibly stemming from decreased Young’s modulus.
The variation in microhardness is shown in
Figure 8i. The hardness of as-cast sample is 321 HV. When treated with velvet cloth, the microhardness increased to 348 HV (8% increase). When treated with abrasive paper 1200P, microhardness increases to 368 HV (14% increase). The microhardness values of samples treated with abrasive papers 320P and 60 were 316 HV (3% decrease) and 265 HV (5% decrease).
The Charpy impact toughness values are shown in
Figure 8j. The Charpy impact toughness value of as-cast 0.1 wt % MLG-EP nanocomposites is 1.2 kJ/m
2. After treatment with velvet cloth, the Charpy impact toughness increased to 1.3 kJ/m
2 (9% increase). The values of samples treated with abrasive papers 1200P, 320P and 60P are 1.5, 1.2, and 1.1 kJ/m
2, respectively. Although there was no significant difference observed in fracture toughness values, however, treatment of 0.1 wt % MLG-EP samples with abrasive papers showed a significant impact on Charpy impact toughness values.
The densification of 0.1 wt % MLG-EP samples is shown in
Figure 8k. The densification of as-cast 0.1 wt % MLG-EP samples is 99.5% (mean value). The densification slightly decreased when the samples were treated with abrasive papers. The mean values of densification were 99.4%, 99.4%, 99.2%, and 99.1%, when treated with velvet cloth, 1200P, 320P, and 60P, respectively. This variation in densification may be either caused by the treatment with abrasive papers or the samples already had the same densification values as the casting technique is not usually considered 100% reproducible like latex technology [
39].
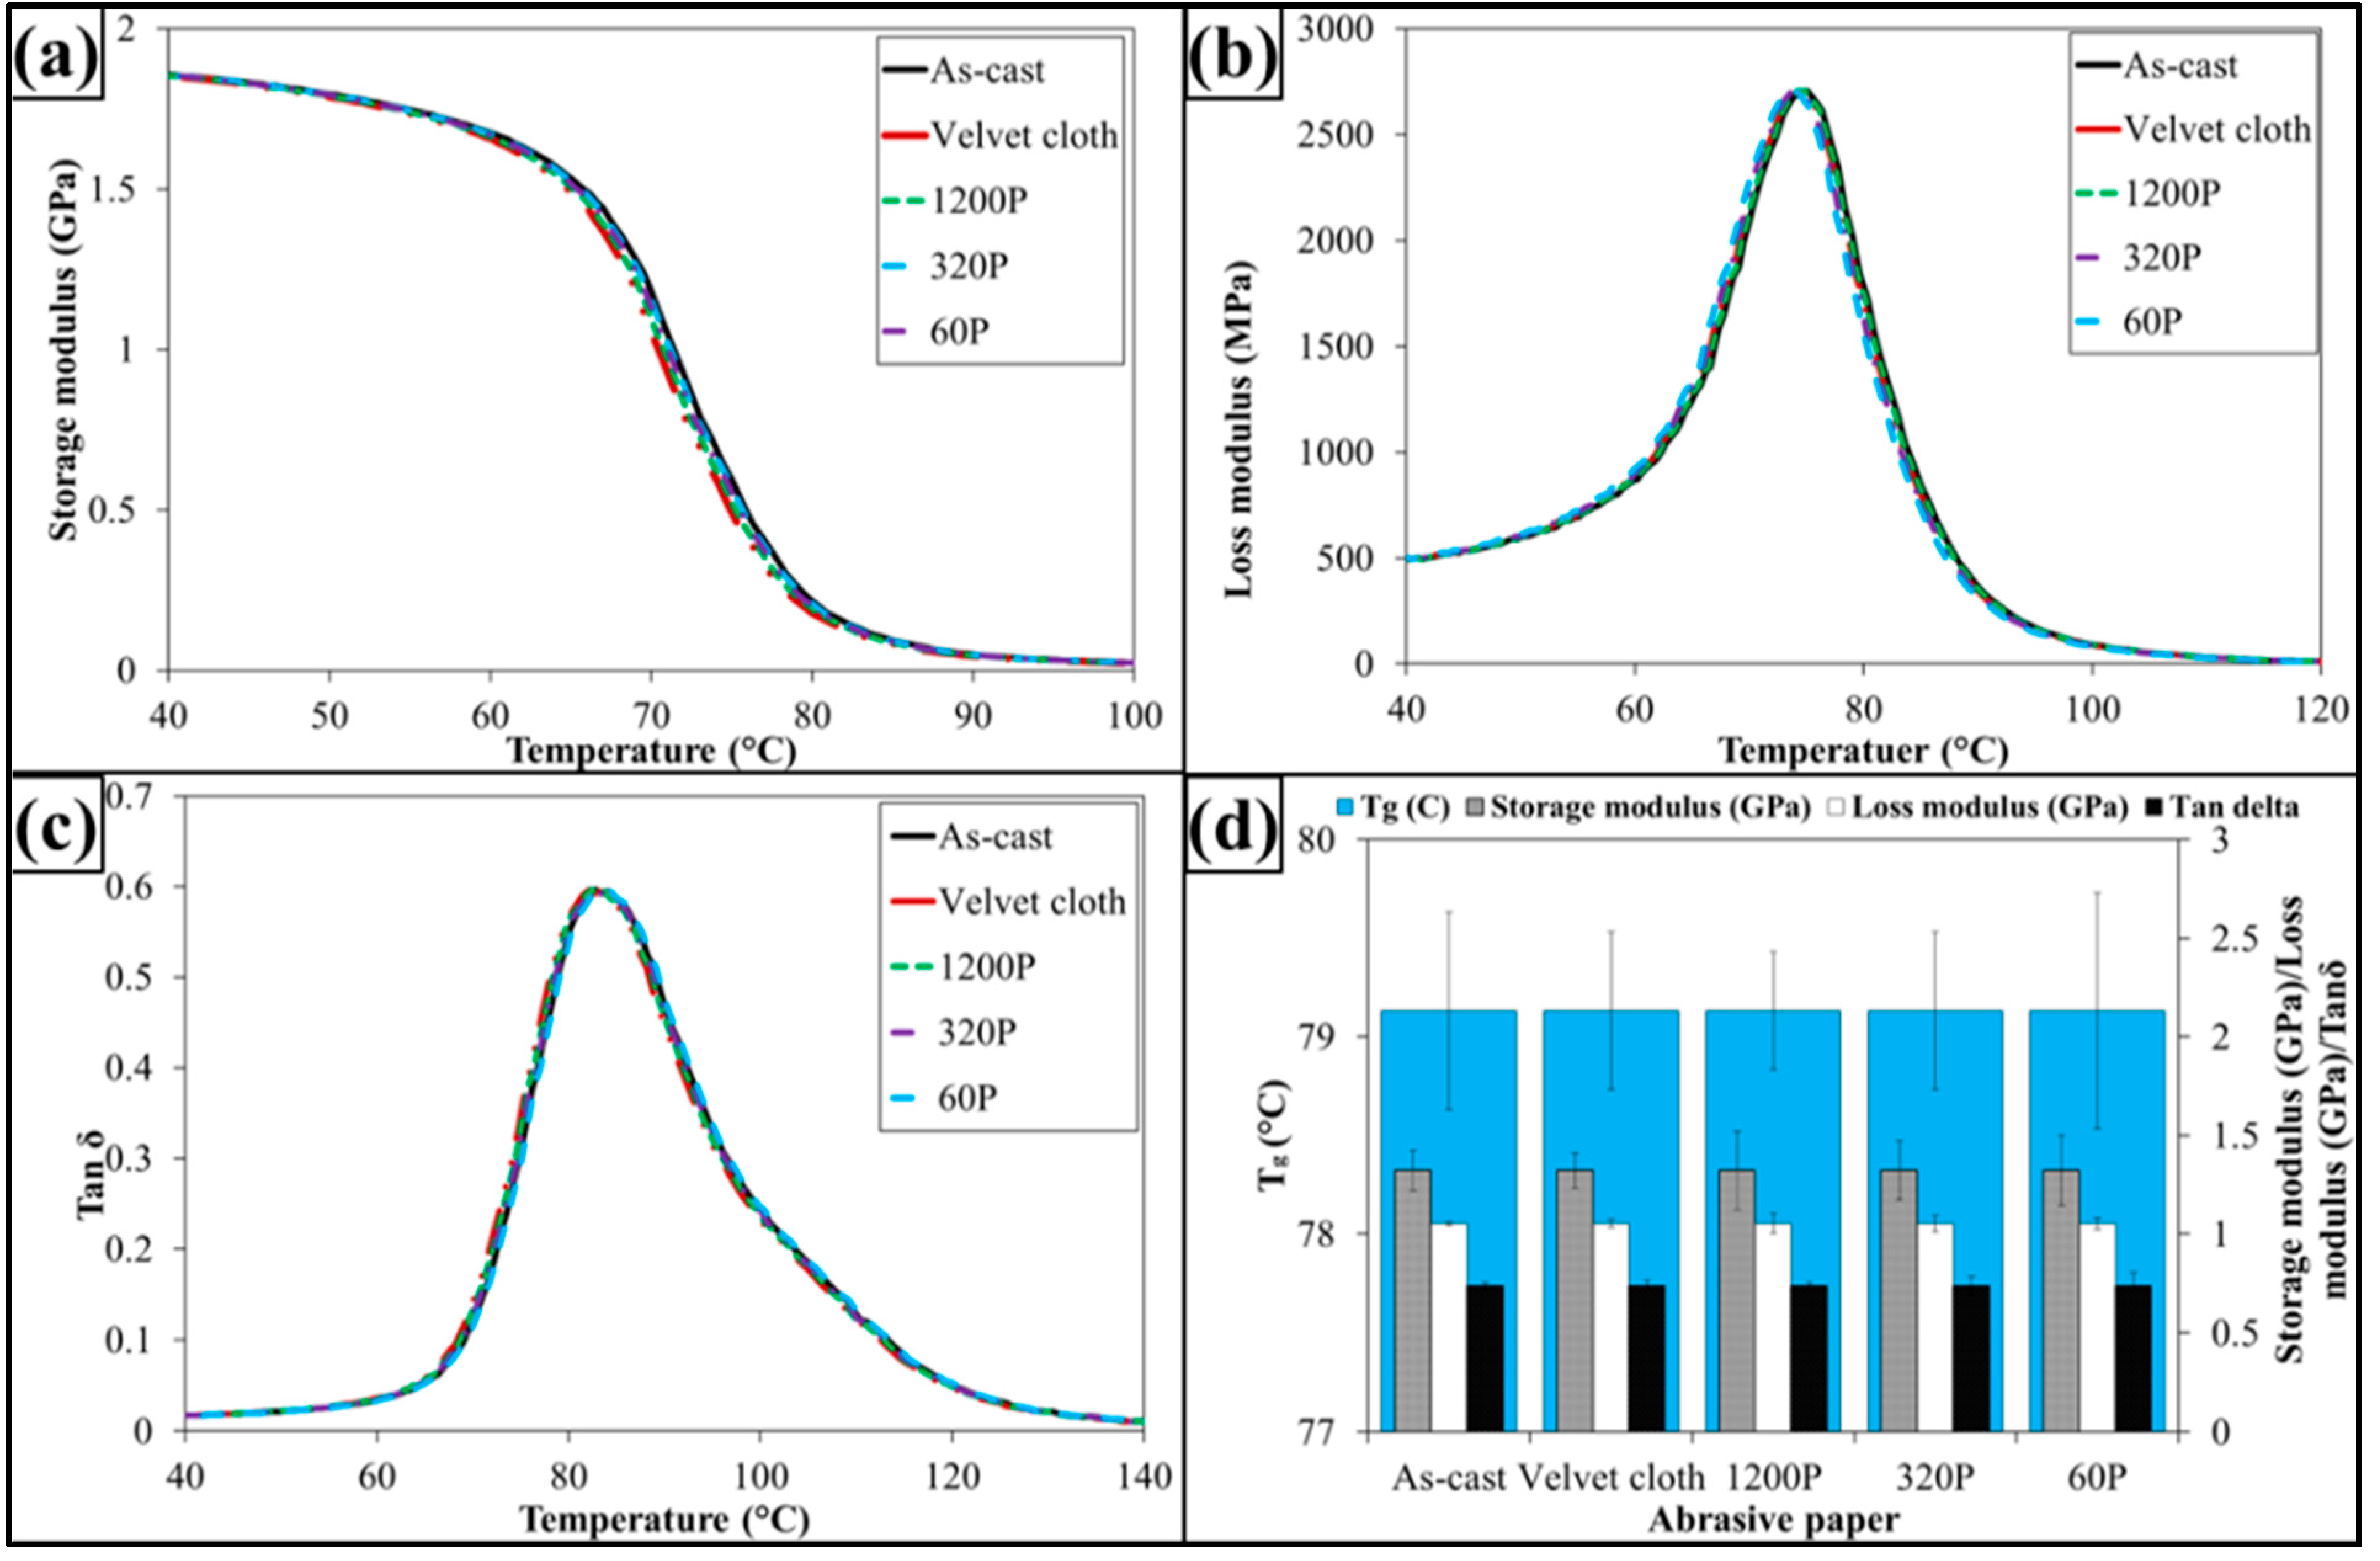
The dynamic mechanical properties are shown in
Figure 9. The treatment with abrasive papers has not influenced dynamic mechanical properties of 0.1 wt % MLG-EP samples. This is because the dynamic mechanical properties are mainly dependent on the structure of the sample. As treatment with abrasive papers did not change structure of the nanocomposites, therefore it did not change the dynamic mechanical properties. It can further be concluded that surface notches up to ±100 µm do not change the dynamic mechanical properties of nanocomposites.
3.2. 0.1 wt % Clay-EP Nanocomposites
The topographical features of 0.1 wt % clay-EP nanocomposites are shown in
Figure 10 and details shown in
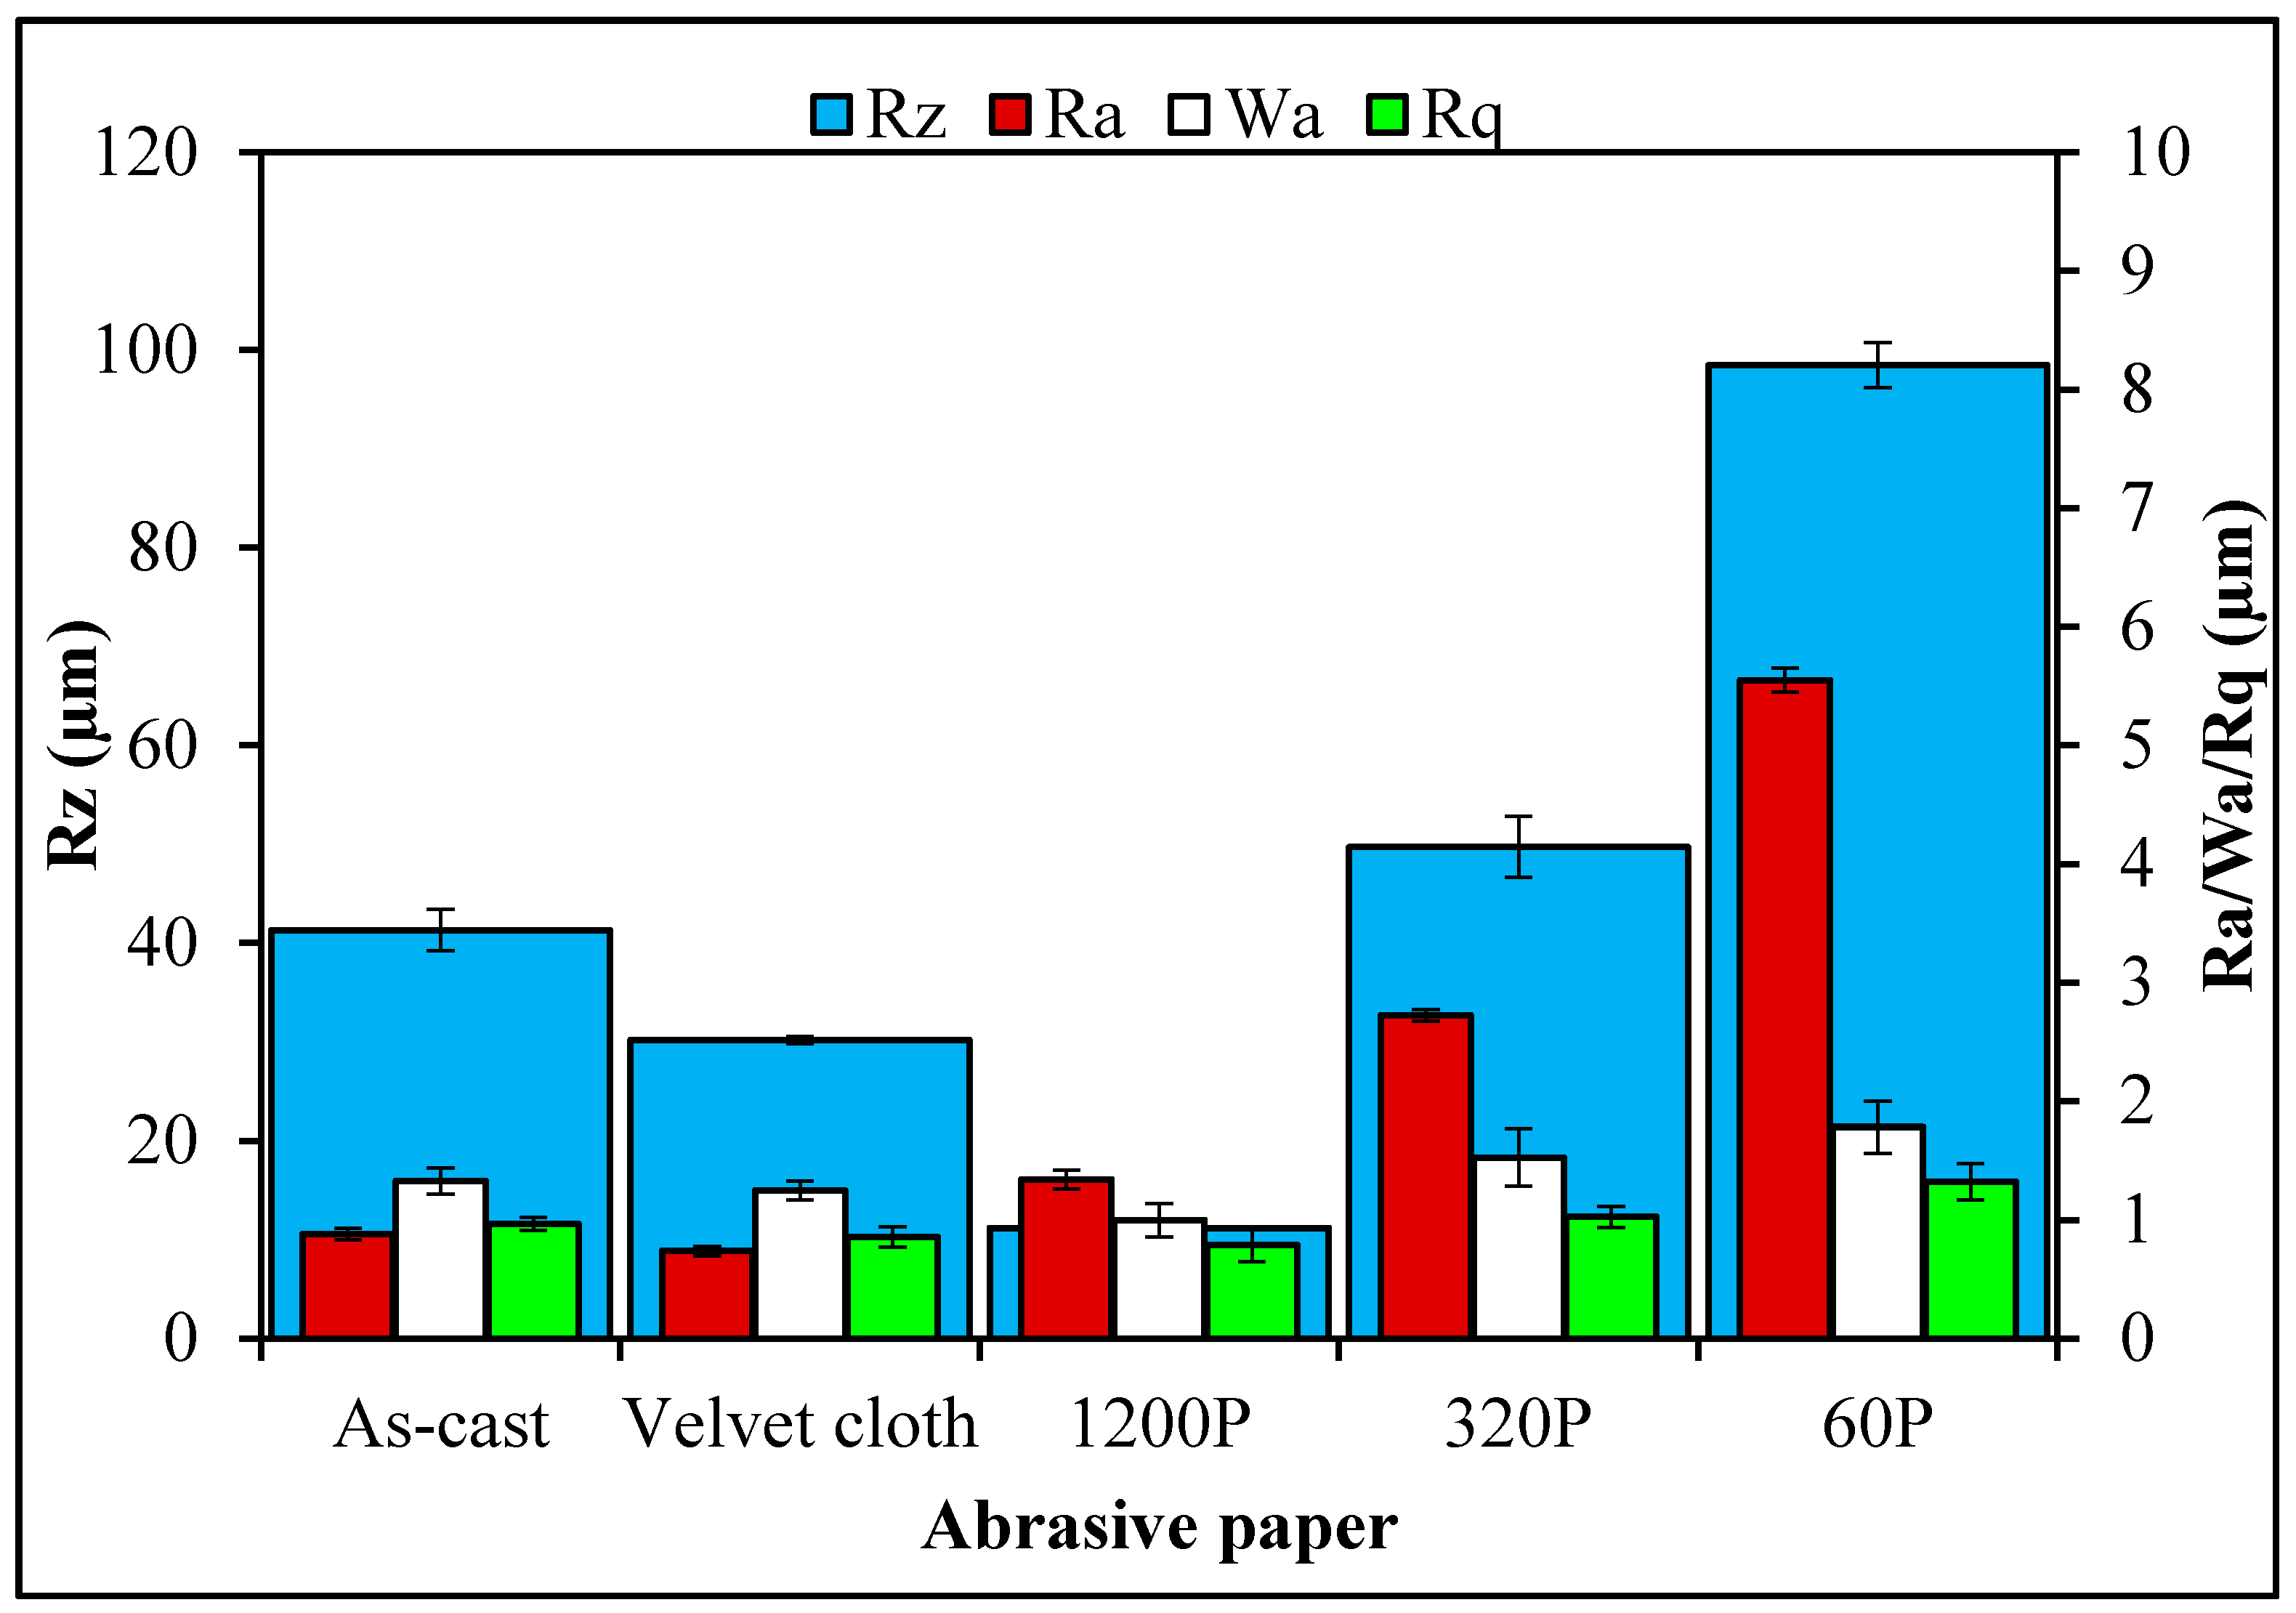
Figure 11. The roughness parameters were decreased by treatment with velvet cloth and 1200P while increased with 320P and 60P.
Figure 11ai shows the optical micrograph of as-cast 0.1 wt % clay-EP sample. The waviness (
Figure 11aii) of the sample varies between ±15 µm while the surface roughness (
Figure 11aiii) varies between ±40 µm. This surface roughness is coming from the mold surface. The surface roughness graph shows that pointed notches of about 40 µm are present on the as-cast 0.1 wt % clay-EP samples. The Gaussian distribution (
Figure 11aiv) shows that the roughness size is distributed with dominant size fraction of 1%. The roughness profile (
Figure 11av) shows that most of the roughness lies within ±40 µm with a deep notch (red region).
Figure 11bi shows the optical micrograph of 0.1 wt % clay-EP sample treated with velvet cloth for 1 min (each side) on rotating wheels with a rotational speed of 150 rpm. The waviness (
Figure 11bii) varies between ±15 µm while the surface roughness (
Figure 11biii) varies between ±35 µm. The Gaussian distribution (
Figure 11biv) shows that the roughness size is nearly uniformly distributed with a dominant size fraction of 2%. The large range of surface roughness can be explained on the basis of diamond paste. The diamond paste had an average particle size of 3 µm. Therefore, remnant dispersed and agglomerated diamond particles contributed toward surface roughness. The roughness profile (
Figure 11bv) shows that the surface roughness slightly decreased compared to as-cast sample (
Figure 11av).
Figure 11ci shows the optical micrograph of 0.1 wt % clay-EP sample treated with abrasive paper 1200P. The waviness (
Figure 11cii) varies between ±10 µm while the surface roughness (
Figure 11ciii) also varies between ±10 µm. The surface roughness fluctuates more quickly than in as-cast and velvet treated samples. However, the sharp notches have decreased. The Gaussian distribution (
Figure 11civ) shows that a nearly uniform distribution of roughness was obtained with a dominant size fraction of 0.8%. The roughness profile (
Figure 11cv) shows that there are no deep surface notches.
Figure 11di shows that the optical micrograph of 0.1 wt % clay-EP sample treated with abrasive paper 320P. The scratches of different size and orientation can be observed. The waviness (
Figure 11dii) varies between ±20 µm while the surface roughness (
Figure 11diii) varies between ±50 µm. The Gaussian distribution (
Figure 11div) shows that the dominant roughness fraction is 1%. The roughness profile (
Figure 11dv) shows that deep notches emerge on the sample surface by treatment with 320P.
Figure 11ei shows the optical micrograph of 0.1 wt % clay-EP sample treated with abrasive paper 60P. A coarse topography can be observed. The waviness (
Figure 11eii) varies between ±30 µm while the surface roughness (
Figure 11eiii) varies between ±100 µm. The deep pointed notches can be observed which can later influence the mechanical properties of the samples. The Gaussian distribution (
Figure 11eiv) shows that the dominant roughness fraction is 2%. The surface profile of the larger sample (
Figure 11ev) shows that coarse topography is present with abruptly changing roughness.
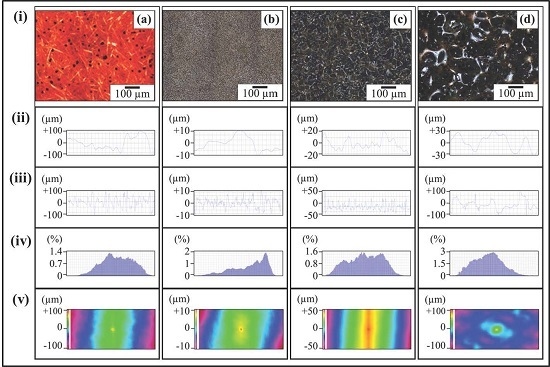
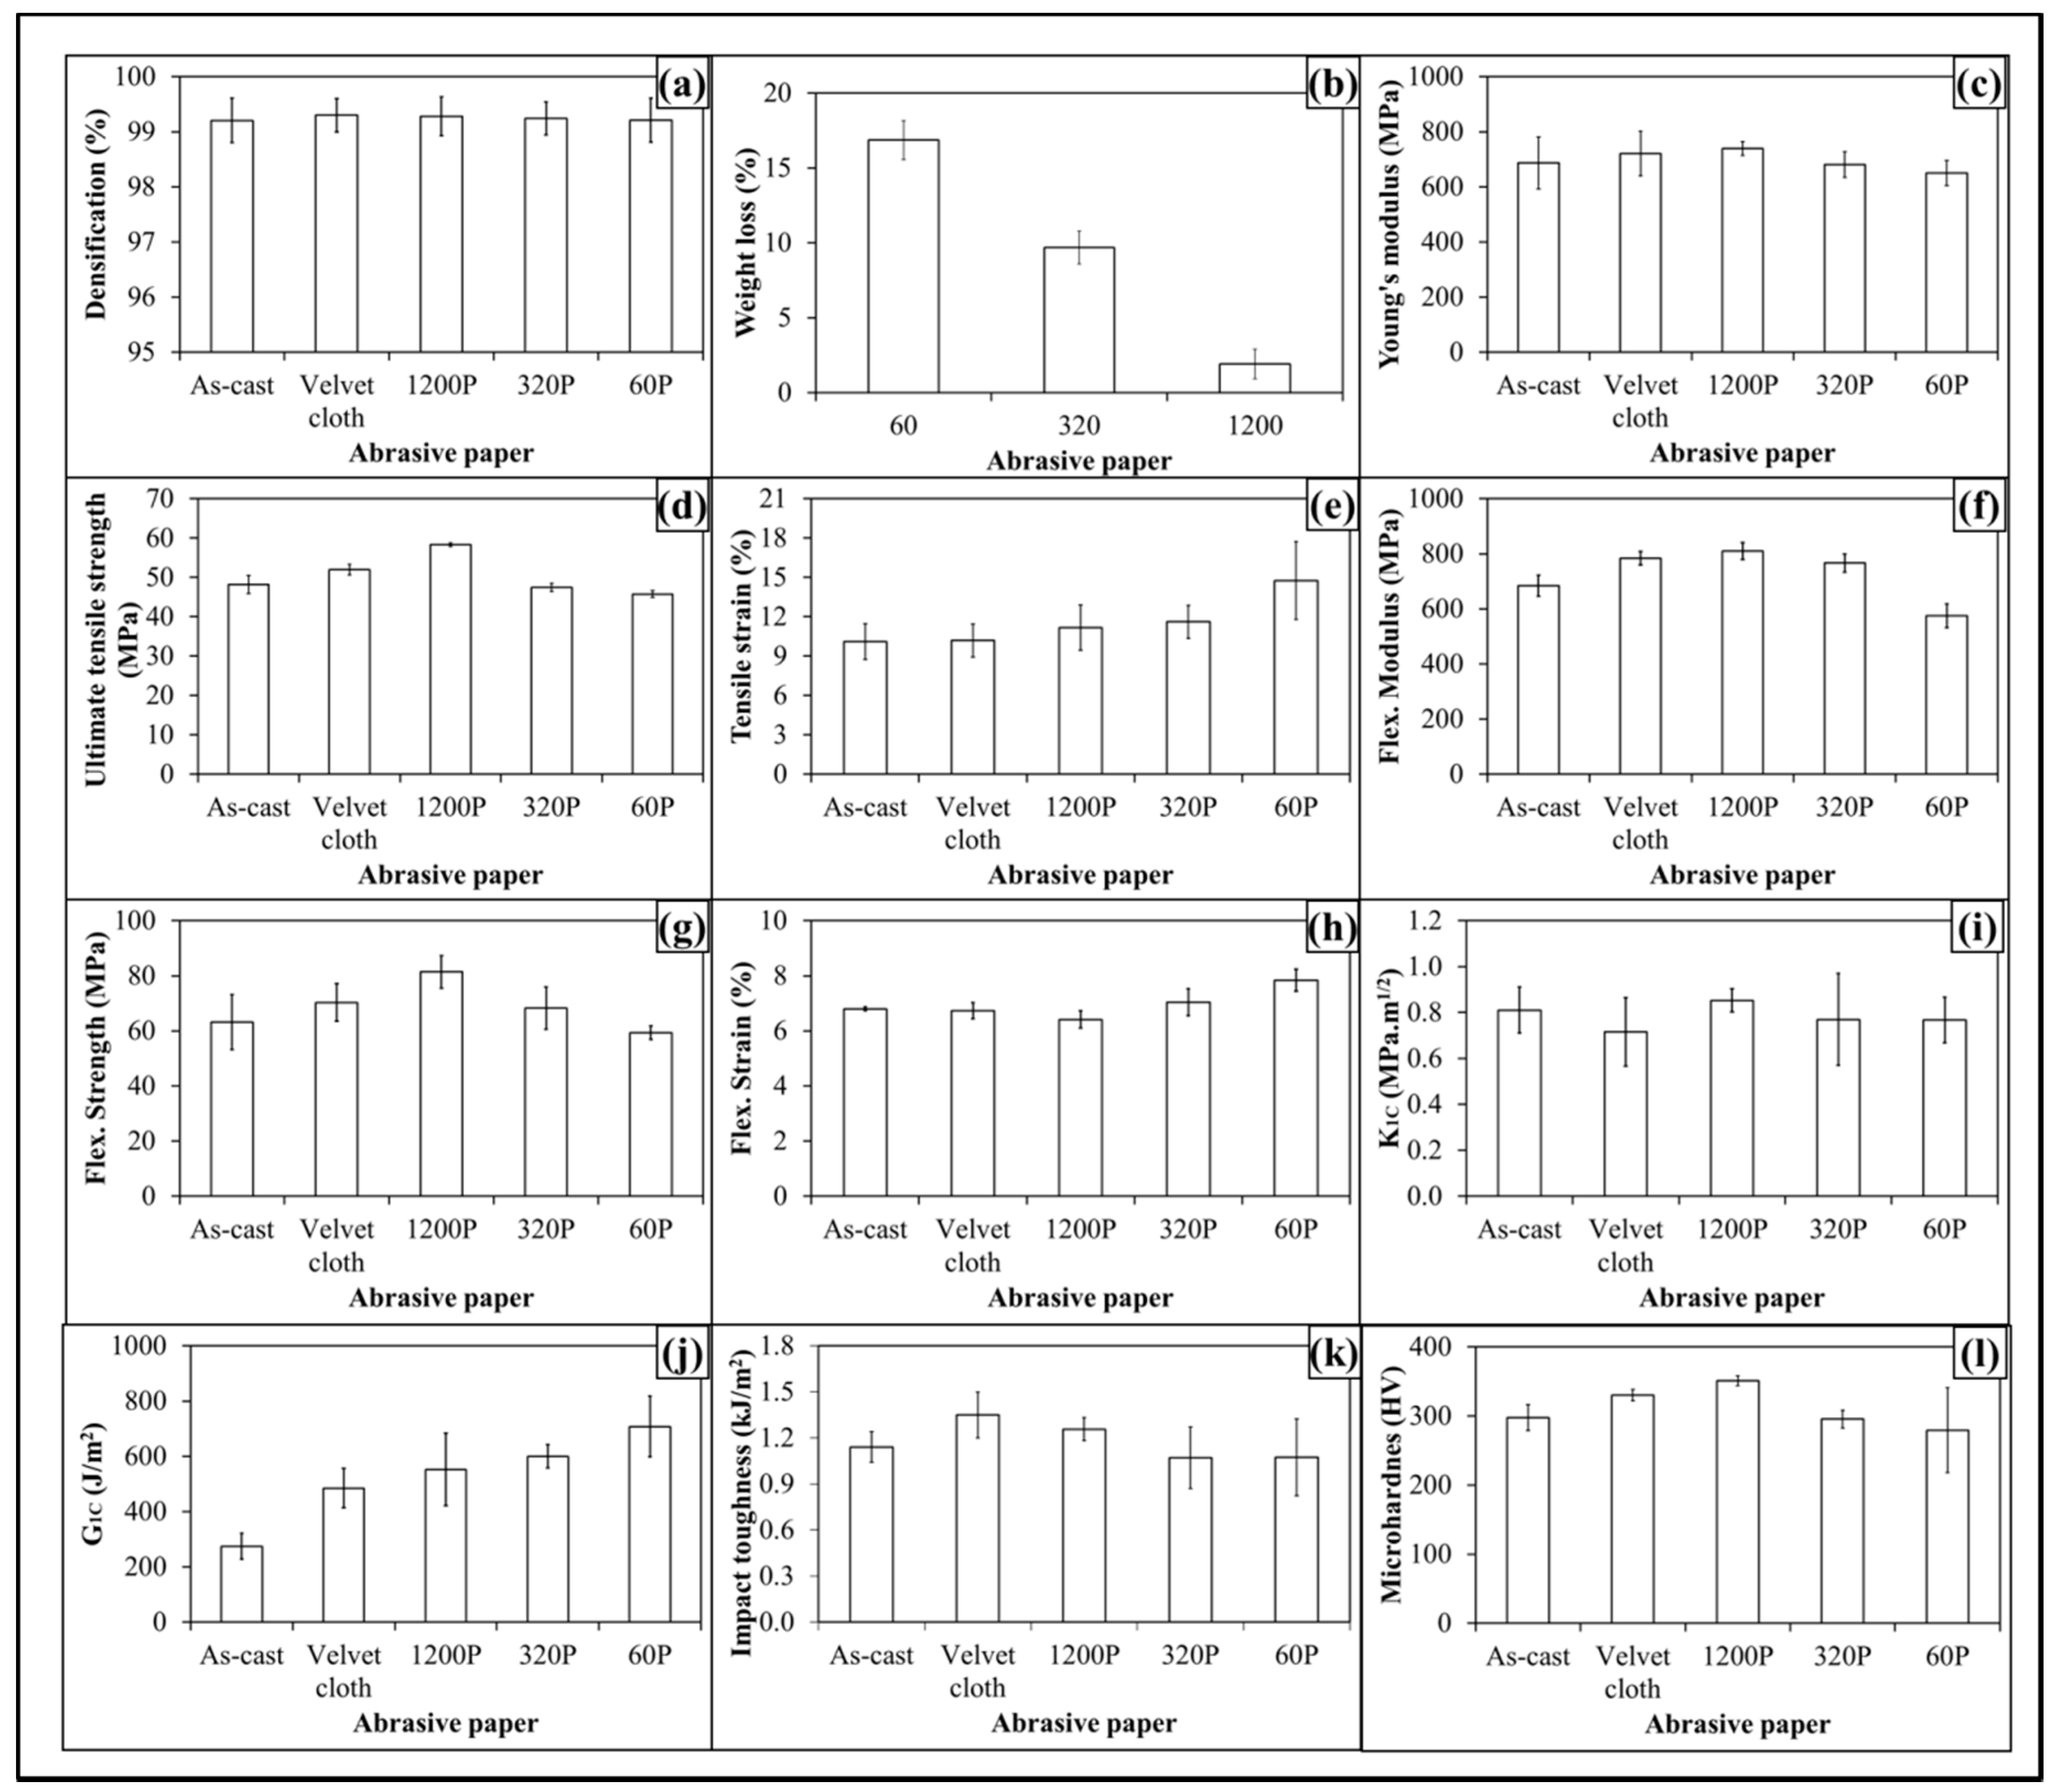
The produced nanocomposites had a densification of about 99.5% (
Figure 12a) and weight loss of about 16% (
Figure 12b) when samples were treated with abrasive paper 60P. The topographical features influenced the mechanical properties of 0.1 wt % clay-EP samples as shown in
Figure 12(c–l). The Young’s modulus (
Figure 12c) increased from 687 MPa to 720 MPa (4.8% increase) when 0.1 wt % clay-EP nanocomposites was treated with velvet cloth. The Young’s modulus of 0.1 wt % clay-EP nanocomposites treated with 1200P also increased to 740 MPa (7.6% increase). However, the Young’s modulus of 0.1 wt % clay-EP nanocomposites treated with 320P decreased to 681 MPa (1% decrease). The maximum decrease in Young’s modulus was observed when the samples were treated with abrasive paper 60P and decreased to 650 MPa (5.8% decrease). The values show that Young’s modulus can be increased by treatment with velvet cloth and abrasive paper 1200P and decreased by treatment with abrasive papers 320P and 60P.
The influence of topography on UTS is shown in
Figure 12d. The UTS of 0.1 wt % clay-EP nanocomposites treated with velvet cloth increased from 48 MPa to 52 MPa (8% increase). The maximum increase in UTS of 0.1 wt % clay-EP nanocomposites was observed when 0.1 wt % clay-EP nanocomposites treated with abrasive paper 1200P and UTS increased to 58 MPa (20% increase). The UTS of 0.1 wt % clay-EP nanocomposites treated with abrasive paper 320P decreased to 47 MPa (1.5% decrease). When treated with abrasive papers 60P, the UTS decreased to 45.8 MPa (5% decrease). The influence of topography on tensile strain is shown in
Figure 12e. The tensile strain kept increasing with the coarser topography which can be attributed to lower stiffness and strength values. The tensile strain did not change much with velvet cloth and slightly increased in the case of abrasive paper 1200P. Therefore, overall better tensile properties can be achieved when samples are treated with velvet cloth and abrasive paper 1200P.
The influence of topography on flexural modulus of 0.1 wt % clay-EP nanocomposites is shown in
Figure 12f. The flexural modulus of as-cast 0.1 wt % clay-EP nanocomposites is 684 MPa. When treated with velvet cloth, the flexural modulus increased to 783 MPa (15% increase). The flexural modulus of 0.1 wt % clay-EP nanocomposites treated with abrasive paper 1200P is 810 MPa (18% increase). The flexural modulus of the sample treated with 320P is 766 MPa (12% increase) and that treated with 60P is 575 MPa which shows a decrease of 16%. The variation in flexural modulus is nearly in accordance with the variation in tensile modulus.
The influence of topography on flexural strength is shown in
Figure 12g. The flexural strength of as-cast 0.1 wt % clay-EP nanocomposites is 63 MPa. When treated with velvet cloth, the flexural strength increases to 70 MPa (11% increase). The flexural strength of the sample treated with abrasive paper 1200P is 81 MPa (29% increase). The flexural strength of the sample treated with 320P remained high and was 68 MPa (8% increase). In comparison to tensile strength which increased only to 3%, an increase of 29% in flexural strength indicates that surface roughness up to ±20 µm is not detrimental to flexural strength. The flexural strength of a sample treated with abrasive paper 60P is 59 MPa which is slightly lower than that of as-cast sample. In comparison to the tensile strength which decreased by 6%, the flexural strength value of the sample treated with 60P indicates that the surface roughness up to ±30 µm has a detrimental effect on tensile strength, while flexural strength seems impervious. The influence of topography on flexural strain (%) is shown in
Figure 12h. The flexural strain nearly remained the same till abrasive paper 320P was used. However, it increased when the sample was treated with abrasive paper 60P. This increase in flexural strain can be explained on the basis of decreased flexural modulus and strength.
The influence of topography on fracture toughness (
K1C) is shown in
Figure 12i. No specific trend on
K1C was observed and
K1C remained nearly the same. The values show that standard deviation is different for different samples. It can be because the tip of notch was sharpened manually by a fresh razor blade which may not generate surfaces of equal length and curvature. In addition, the volume fraction, size and distribution of porosity can be another factor which can influence the mechanical properties. The variation in
G1C of topographically modified 0.1 wt % clay-EP samples is shown in
Figure 12j. The trend shows that
G1C increases as the coarseness of topography increases. However, as topography did not show significant influence on
K1C, the authors are skeptical in believing that this increase in
G1C is directly coming from topography. In calculating
G1C,
is divided by Young’s modulus. As Young’s modulus decreased with coarse topography, therefore the increase in
G1C is possibly stemming from decreased Young’s modulus.
The Charpy impact toughness values are shown in
Figure 12k. The Charpy impact toughness value of as-cast 0.1 wt % clay-EP nanocomposites is 1.2 kJ/m
2. After treatment with velvet cloth, the Charpy impact toughness increased to 1.3 kJ/m
2 (9% increase). The values of samples treated with abrasive papers 1200P, 320P and 60P are 1.5, 1.2, and 1.1 kJ/m
2, respectively. Although there was no significant difference observed in fracture toughness values, however treatment of 0.1 wt % clay-EP samples with abrasive papers showed a significant impact on Charpy impact toughness values.
The variation in microhardness is shown in
Figure 12l. The hardness of as-cast sample is 297 HV. When treated with velvet cloth, the microhardness increased to 329 HV (11% increase). When treated with abrasive paper 1200P, microhardness increased to 351 HV (18% increase). The microhardness values of samples treated with abrasive papers 320P and 60P were 296 HV (1% decrease) and 279 HV (6% decrease).
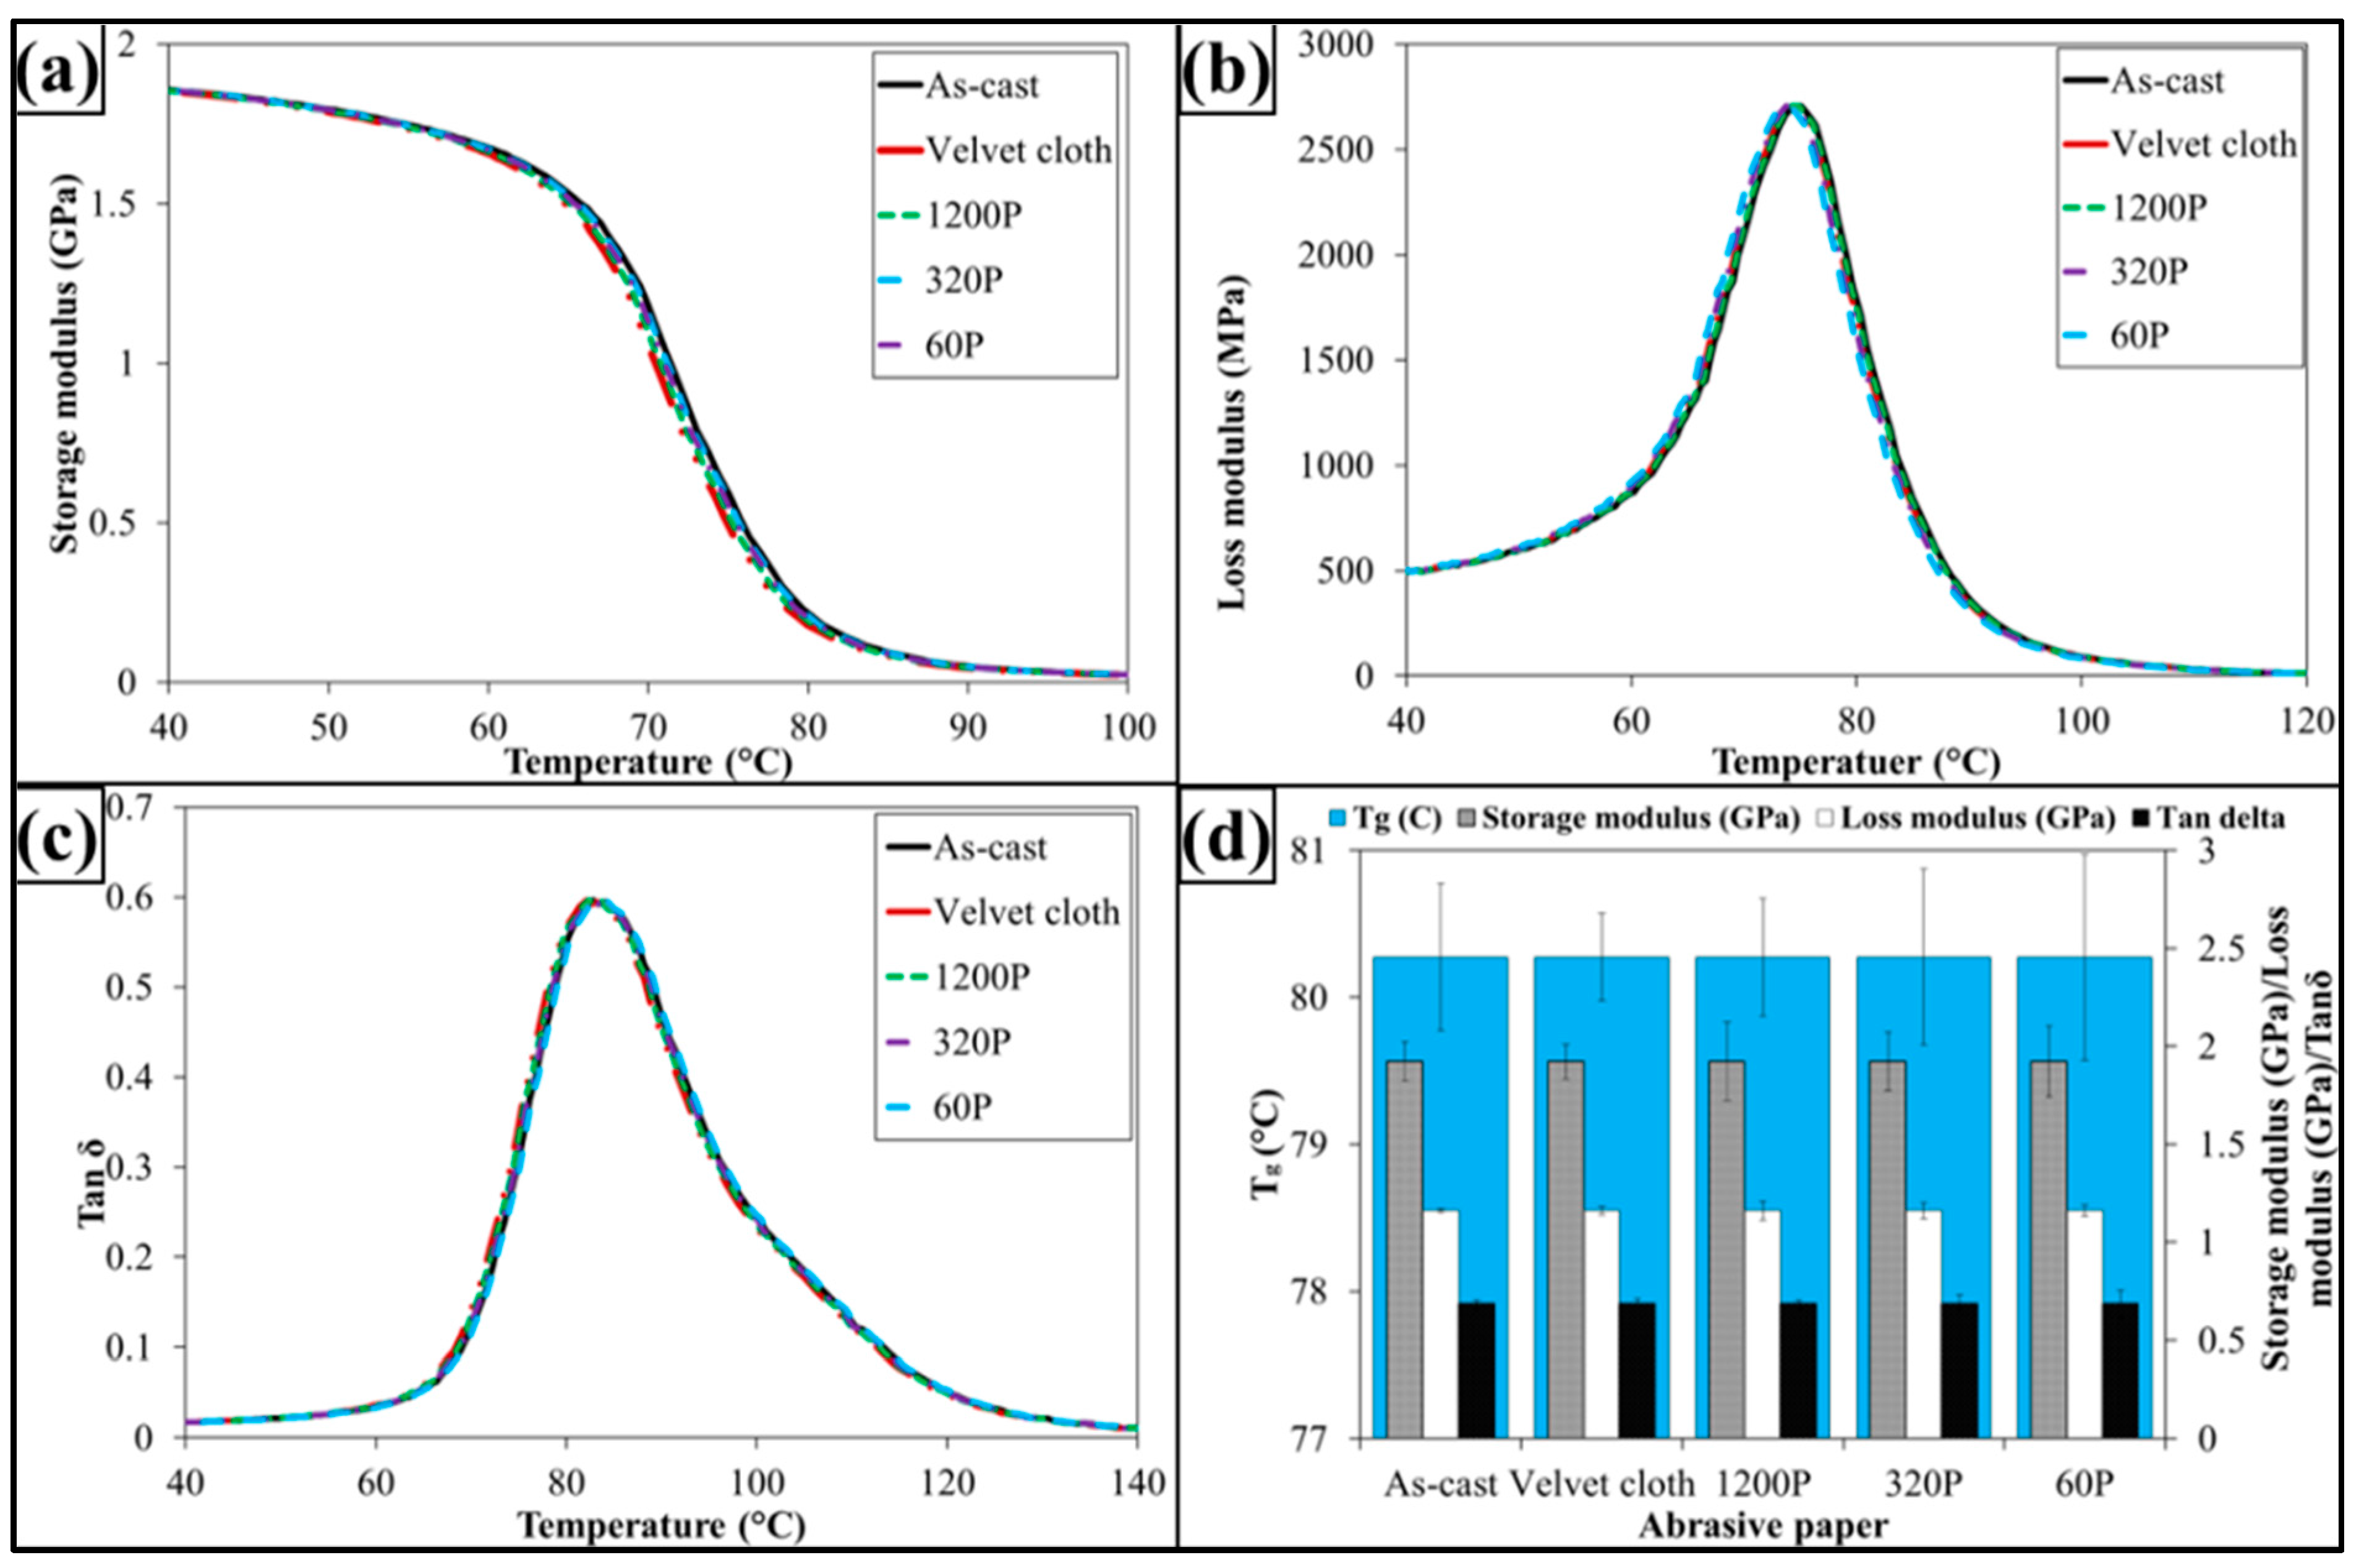
The dynamic mechanical properties are shown in
Figure 13. The treatment with abrasive papers has not influenced dynamic mechanical properties of 0.1 wt % clay-EP samples. It is because the dynamic mechanical properties are mainly dependent on the structure of sample. As treatment with abrasive papers did not change structure of the nanocomposites, therefore it did not change the dynamic mechanical properties. It can further be concluded that surface notches up to ±100 µm do not change the dynamic mechanical properties of nanocomposites.
3.3. 0.05 wt % MLG-0.05 wt % Clay-EP Nanocomposites
The topographical features of 0.05 wt % MLG-0.05 wt % clay-EP nanocomposites are shown in
Figure 14 and details shown in
Figure 15. The roughness parameters were decreased by treatment with velvet cloth and 1200P, while increased with 320P and 60P.
Figure 15ai shows the optical micrograph of as-cast 0.05 wt % MLG-0.05 wt % clay-EP sample. The waviness (
Figure 15aii) of the sample varies between ±15 µm while the surface roughness (
Figure 15aiii) varies between ±40 µm. This surface roughness is coming from the mold surface. The surface roughness graph shows that pointed notches of about 40 µm are present on the as-cast 0.05 wt % MLG-0.05 wt % clay-EP samples. The Gaussian distribution (
Figure 15aiv) shows that the roughness size is distributed with dominant size fraction of 1%. The roughness profile (
Figure 15av) shows that most of the roughness lies within ±40 µm with a deep notch (red region).
Figure 15bi shows the optical micrograph of 0.05 wt % MLG-0.05 wt % clay-EP sample treated with velvet cloth for 1 min (each side) on rotating wheels with rotational speed of 150 rpm. The waviness (
Figure 15bii) varies between ±15 µm while the surface roughness (
Figure 15biii) varies between ±35 µm. The Gaussian distribution (
Figure 15biv) shows that the roughness size is nearly uniformly distributed with dominant size fraction of 2%. The large range of surface roughness can be explained on the basis of diamond paste. The diamond paste had average particle size of 3 µm. Therefore, remnant dispersed and agglomerated diamond particles contributed toward surface roughness. The roughness profile (
Figure 15bv) shows that the surface roughness slightly decreased compared to as-cast sample (
Figure 15av).
Figure 15ci shows the optical micrograph of 0.05 wt % MLG-0.05 wt % clay-EP sample treated with abrasive paper 1200P. The waviness (
Figure 15cii) varies between ±10 µm while the surface roughness (
Figure 15ciii) varies between ±12 µm. The surface roughness fluctuates more quickly than in as-cast and velvet treated samples. However, the sharp notches have decreased. The Gaussian distribution (
Figure 15civ) shows that a nearly uniform distribution of roughness was obtained with dominant size fraction of 0.8%. The roughness profile (
Figure 15cv) shows that there are no deep surface notches.
Figure 15di shows that the optical micrograph of 0.05 wt % MLG-0.05 wt % clay-EP sample treated with abrasive paper 320P. The scratches of different size and orientation can be observed. The waviness (
Figure 15dii) varies between ±20 µm while the surface roughness (
Figure 15diii) varies between ±50 µm. The Gaussian distribution (
Figure 15div) shows that the dominant roughness fraction is 1%. The roughness profile (
Figure 15dv) shows that deep notches emerge on sample surface by treatment with 320P.
Figure 15ei shows the optical micrograph of 0.05 wt % MLG-0.05 wt % clay-EP sample treated with abrasive paper 60P. A coarse topography can be observed. The waviness (
Figure 15eii) varies between ±30 µm while the surface roughness (
Figure 15eiii) varies between ±100 µm. The deep pointed notches can be observed which can later influence the mechanical properties of the samples. The Gaussian distribution (
Figure 15eiv) shows that dominant roughness fraction is 2%. The surface profile of a larger sample (
Figure 15ev) shows that coarse topography is present with abruptly changing roughness.
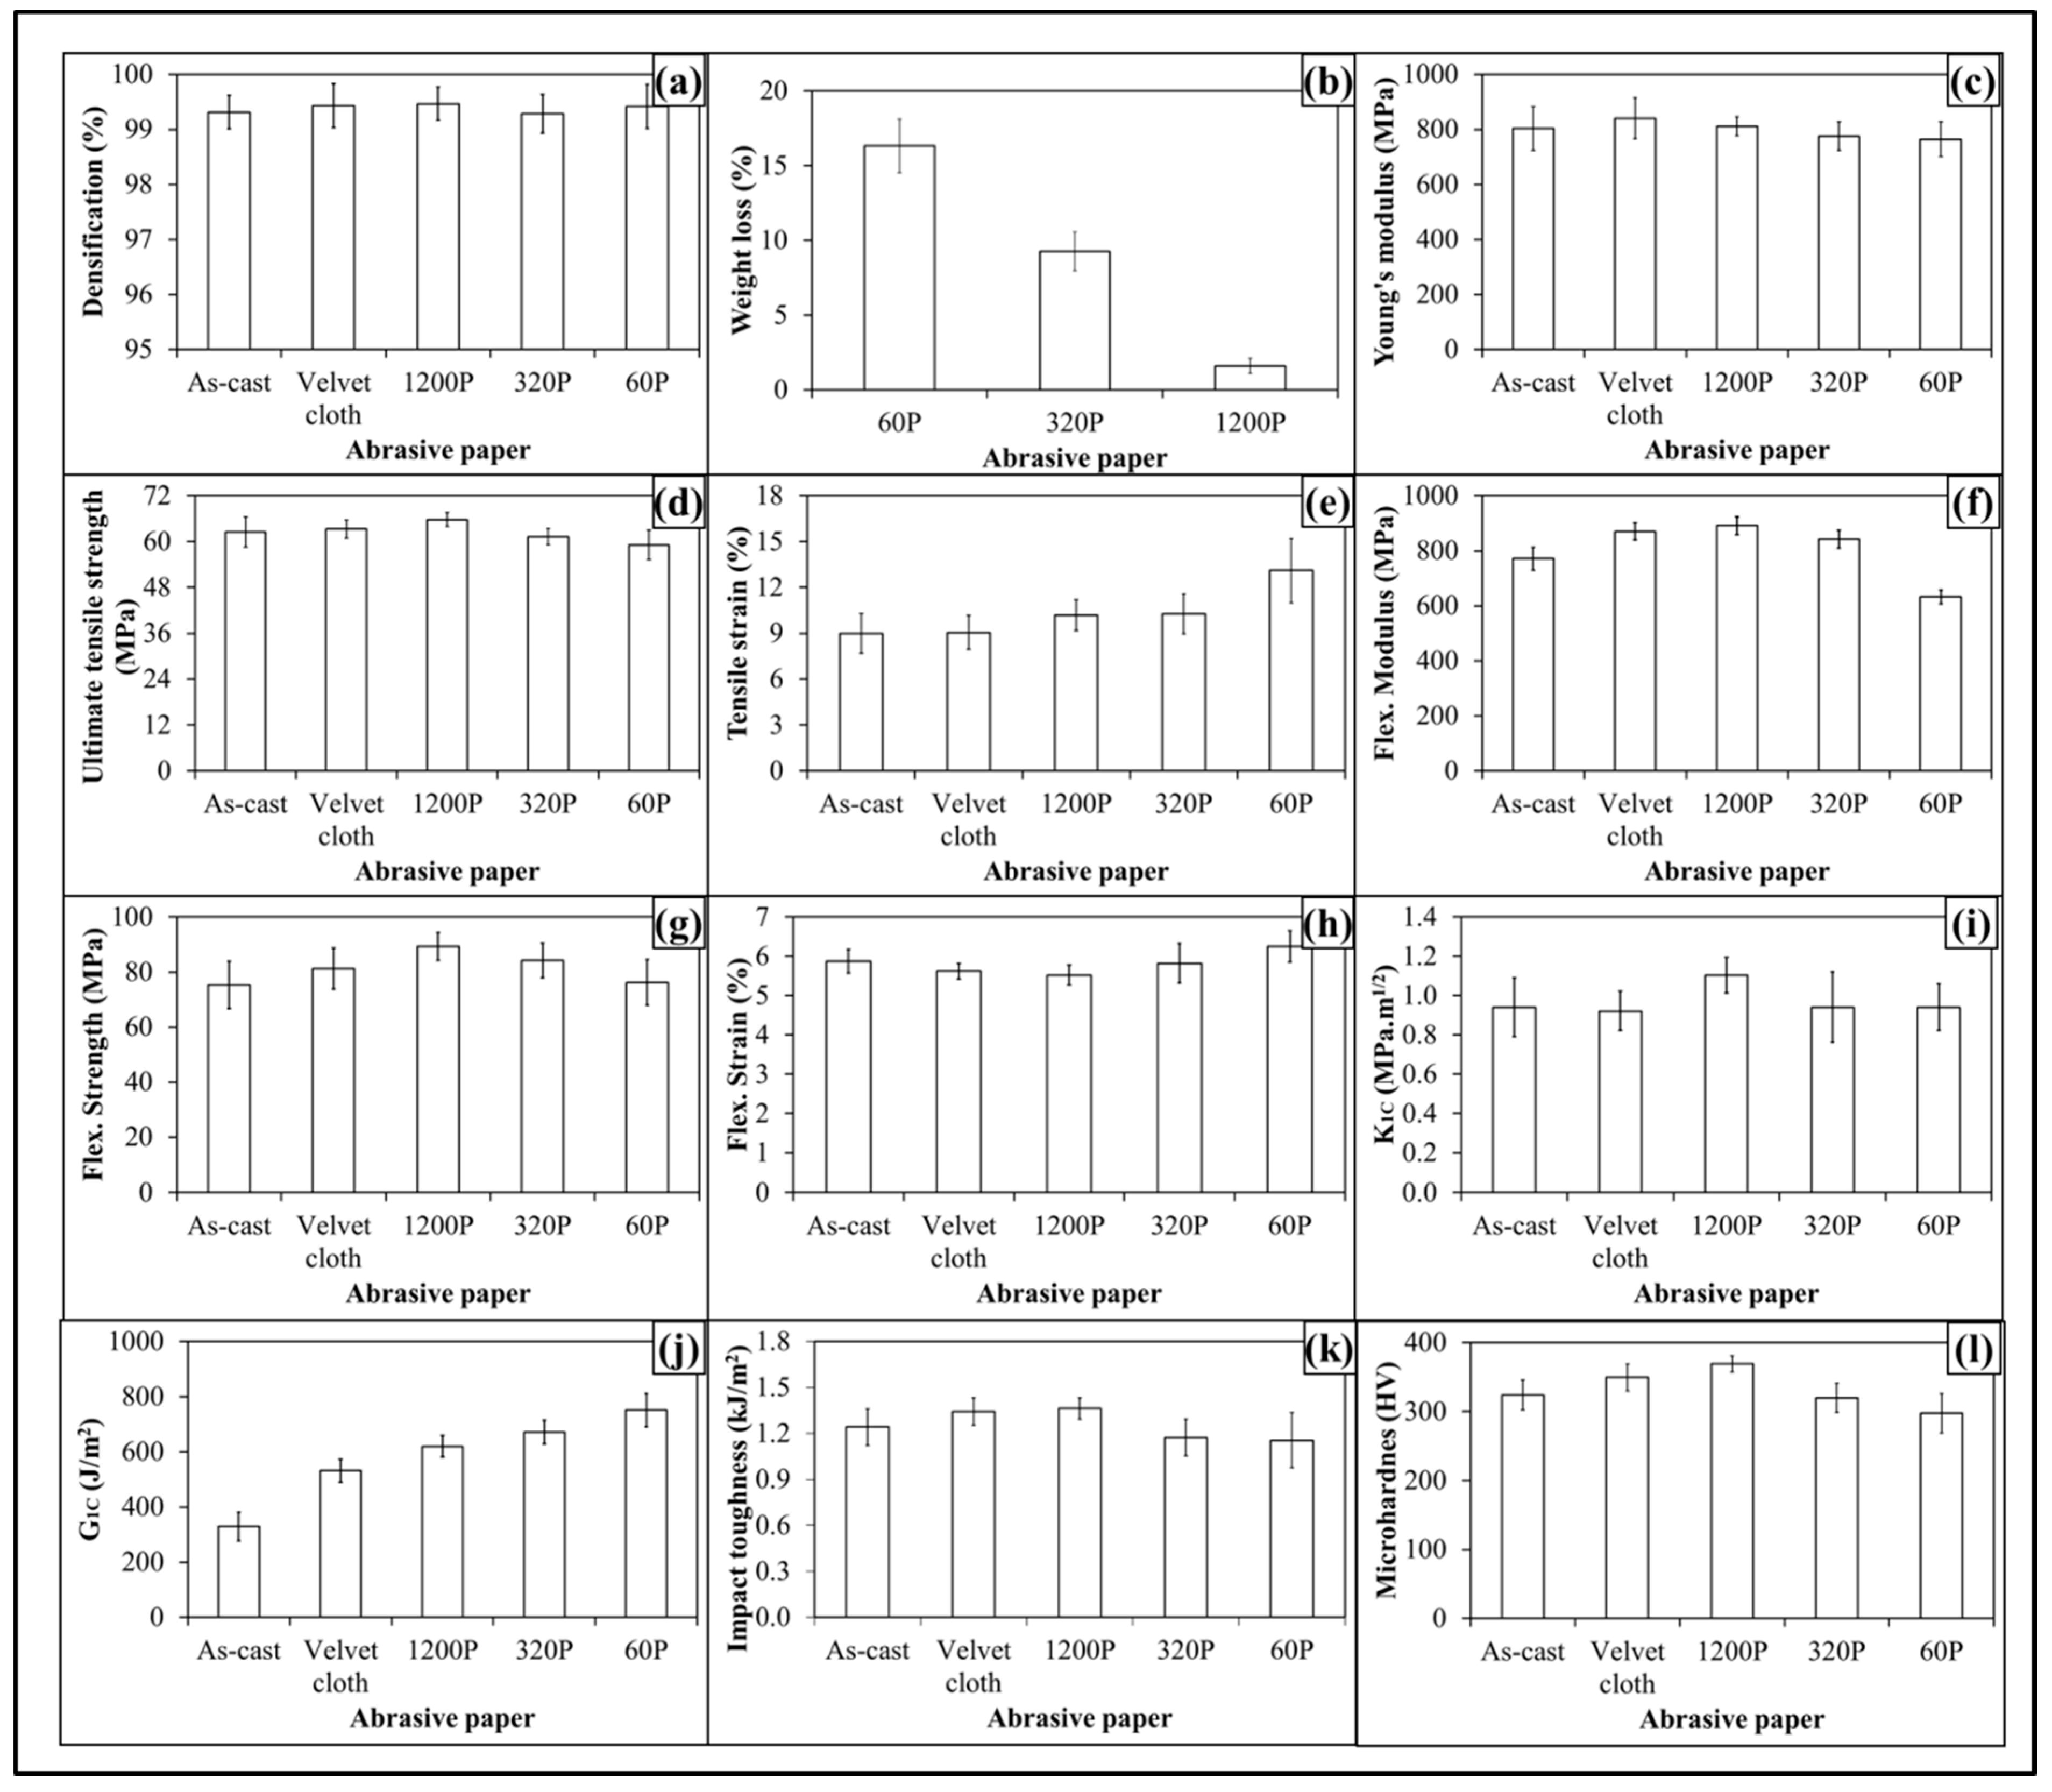
The produced nanocomposites had densification of about 99.5% (
Figure 16a) and weight loss of about 16% (
Figure 16b) when samples were treated with abrasive paper 60P. The topographical features influenced mechanical properties of 0.05 wt % MLG-0.05 wt % clay-EP samples as shown in
Figure 16(c–l). The Young’s modulus (
Figure 16c) increased from 687 MPa to 720 MPa (4.8% increase) when 0.05 wt % MLG-0.05 wt % clay-EP nanocomposites were treated with velvet cloth. The Young’s modulus of 0.05 wt % MLG-0.05 wt % clay-EP nanocomposites treated with 1200P also increased to 740 MPa (7.6% increase). However, the Young’s modulus of 0.05 wt % MLG-0.05 wt % clay-EP nanocomposites treated with 320P decreased to 681 MPa (1% decrease). The maximum decrease in Young’s modulus was observed when the samples were treated with abrasive paper 60P and decreased to 650 MPa (5.8% decrease). The values show that Young’s modulus can be increased by treatment with velvet cloth and abrasive paper 1200P and decreased by treatment with abrasive papers 320P and 60P.
The influence of topography on UTS is shown in
Figure 16d. The UTS of 0.05 wt % MLG-0.05 wt % clay-EP nanocomposites treated with velvet cloth increased from 48 MPa to 52 MPa (8% increase). The maximum increase in UTS of 0.05 wt % MLG-0.05 wt % clay-EP nanocomposites was observed when 0.05 wt % MLG-0.05 wt % clay-EP nanocomposites were treated with abrasive paper 1200P and UTS increased to 58 MPa (20% increase). The UTS of 0.05 wt % MLG-0.05 wt % clay-EP nanocomposites treated with abrasive paper 320P decreased to 47 MPa (1.5% decrease). When treated with abrasive papers 60P, the UTS decreased to 45.8 MPa (5% decrease). The influence of topography on tensile strain is shown in
Figure 16e. The tensile strain kept increasing with coarser topography which can be attributed to lower stiffness and strength values. The tensile strain did not change much with velvet cloth and slightly increased in the case of abrasive paper 1200P. Therefore, overall better tensile properties can be achieved when samples are treated with velvet cloth and abrasive paper 1200P.
The influence of topography on flexural modulus of 0.05 wt % MLG-0.05 wt % clay-EP nanocomposites is shown in
Figure 16f. The flexural modulus of as-cast 0.05 wt % MLG-0.05 wt % clay-EP nanocomposites is 684 MPa. When treated with velvet cloth, the flexural modulus increased to 783 MPa (15% increase). The flexural modulus of 0.05 wt % MLG-0.05 wt % clay-EP nanocomposites treated with abrasive paper 1200P is 810 MPa (18% increase). The flexural modulus of the sample treated with 320P is 766 MPa (12% increase) and that treated with 60P is 575 MPa which shows a decrease of 16%. The variation in flexural modulus is nearly in accordance with the variation in tensile modulus.
The influence of topography on flexural strength is shown in
Figure 16g. The flexural strength of as-cast 0.05 wt % MLG-0.05 wt % clay-EP nanocomposites is 63 MPa. When treated with velvet cloth, the flexural strength increased to 70 MPa (11% increase). The flexural strength of sample treated with abrasive paper 1200P was 81 MPa (29% increase). The flexural strength of sample treated with 320P remained high and was 68 MPa (8% increase). In comparison to tensile strength which increased only to 3%, an increase of 29% in flexural strength indicates that surface roughness up to ±20 µm is not detrimental to flexural strength. The flexural strength of sample treated with abrasive paper 60P is 59 MPa which is slightly lower than that of as-cast sample. In comparison to tensile strength which decreased by 6%, the flexural strength value of sample treated with 60P indicates that surface roughness up to ±30 µm has detrimental effect on tensile strength while flexural strength seems impervious. The influence of topography on flexural strain (%) is shown in
Figure 16h. The flexural strain nearly remained the same till abrasive paper 320P. However, it increased when sample was treated with abrasive paper 60P. This increase in flexural strain can be explained on the basis of decreased flexural modulus and strength.
The influence of topography on fracture toughness (
K1C) is shown in
Figure 16i. No specific trend on
K1C was observed and
K1C remained nearly the same. The values show that a standard deviation is different for different samples. It can be because the tip of notch was sharpened manually by a fresh razor blade which may not generate surfaces of equal length and curvature. In addition, the volume fraction, size and distribution of porosity can be another factor which can influence the mechanical properties. The variation in
G1C of topographically modified 0.05 wt % MLG-0.05 wt % clay-EP samples is shown
Figure 16j. The trend shows that
G1C increases as the coarseness of topography increases. However, as topography did not show significant influence on
K1C, the authors are skeptical in believing that this increase in
G1C is directly coming from topography. In calculating
G1C,
is divided by Young’s modulus. As Young’s modulus decreased with coarse topography, therefore the increase in
G1C is possibly stemming from decreased Young’s modulus.
The Charpy impact toughness values are shown in
Figure 16j. The Charpy impact toughness value of as-cast 0.05 wt % MLG-0.05 wt % clay-EP nanocomposites is 1.2 kJ/m
2. After treatment with velvet cloth, the 0.05 wt % MLG-0.05 wt % clay-EP nanocomposites increased to 1.3 kJ/m
2 (9% increase). The values of samples treated with abrasive papers 1200P, 320P and 60P are 1.5, 1.2 and 1.1 kJ/m
2, respectively. Although there was no significant difference observed in fracture toughness values, however treatment of 0.05 wt % MLG-0.05 wt % clay-EP samples with abrasive papers showed a significant impact on Charpy impact toughness values.
The variation in microhardness is shown in
Figure 16l. The hardness of as-cast sample is 297 HV. When treated with velvet cloth, the microhardness increased to 329 HV (11% increase). When treated with abrasive paper 1200P, microhardness increased to 351 HV (18% increase). The microhardness values of samples treated with abrasive papers 320P and 60P were 296 HV (1% decrease) and 279 HV (6% decrease).
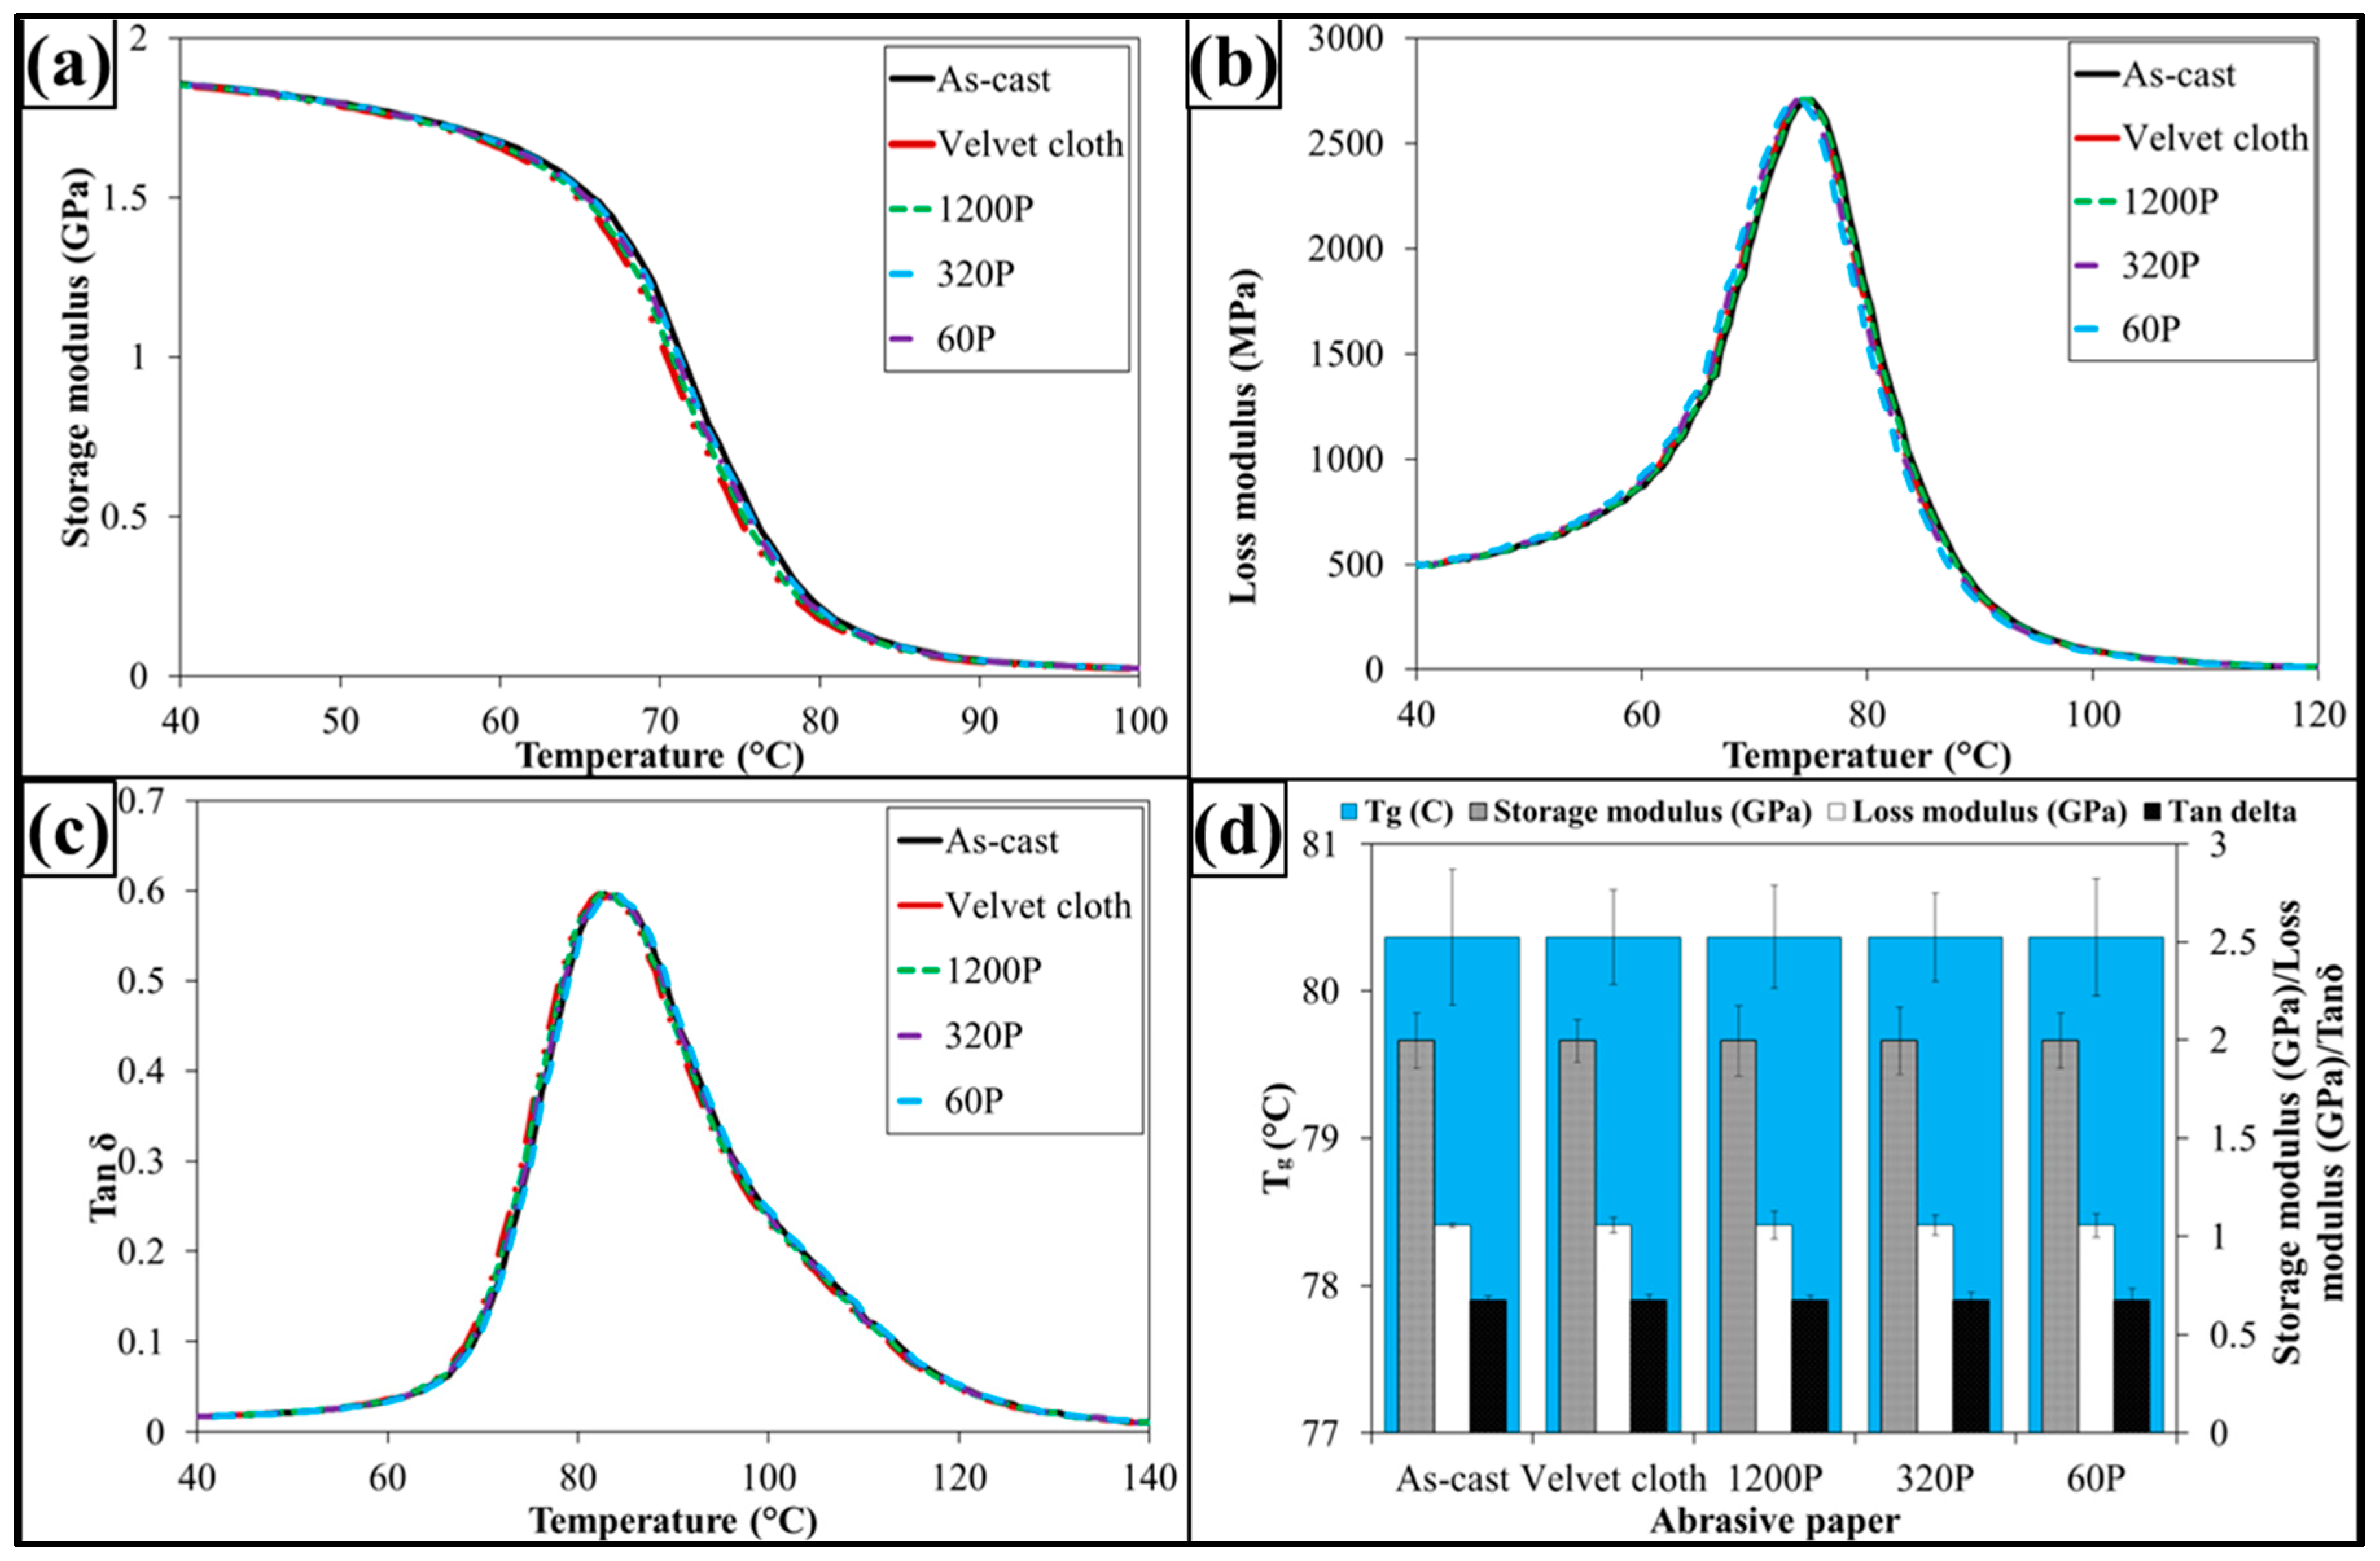
The dynamic mechanical properties are shown in
Figure 17. The treatment with abrasive papers has not influenced dynamic mechanical properties of 0.05 wt % MLG-0.05 wt % clay-EP samples. It is because the dynamic mechanical properties are mainly dependent on the structure of the sample. As treatment with abrasive papers did not change the structure of the nanocomposites, therefore it did not change the dynamic mechanical properties. It can further be concluded that surface notches up to ±100 µm do not change the dynamic mechanical properties of nanocomposites.
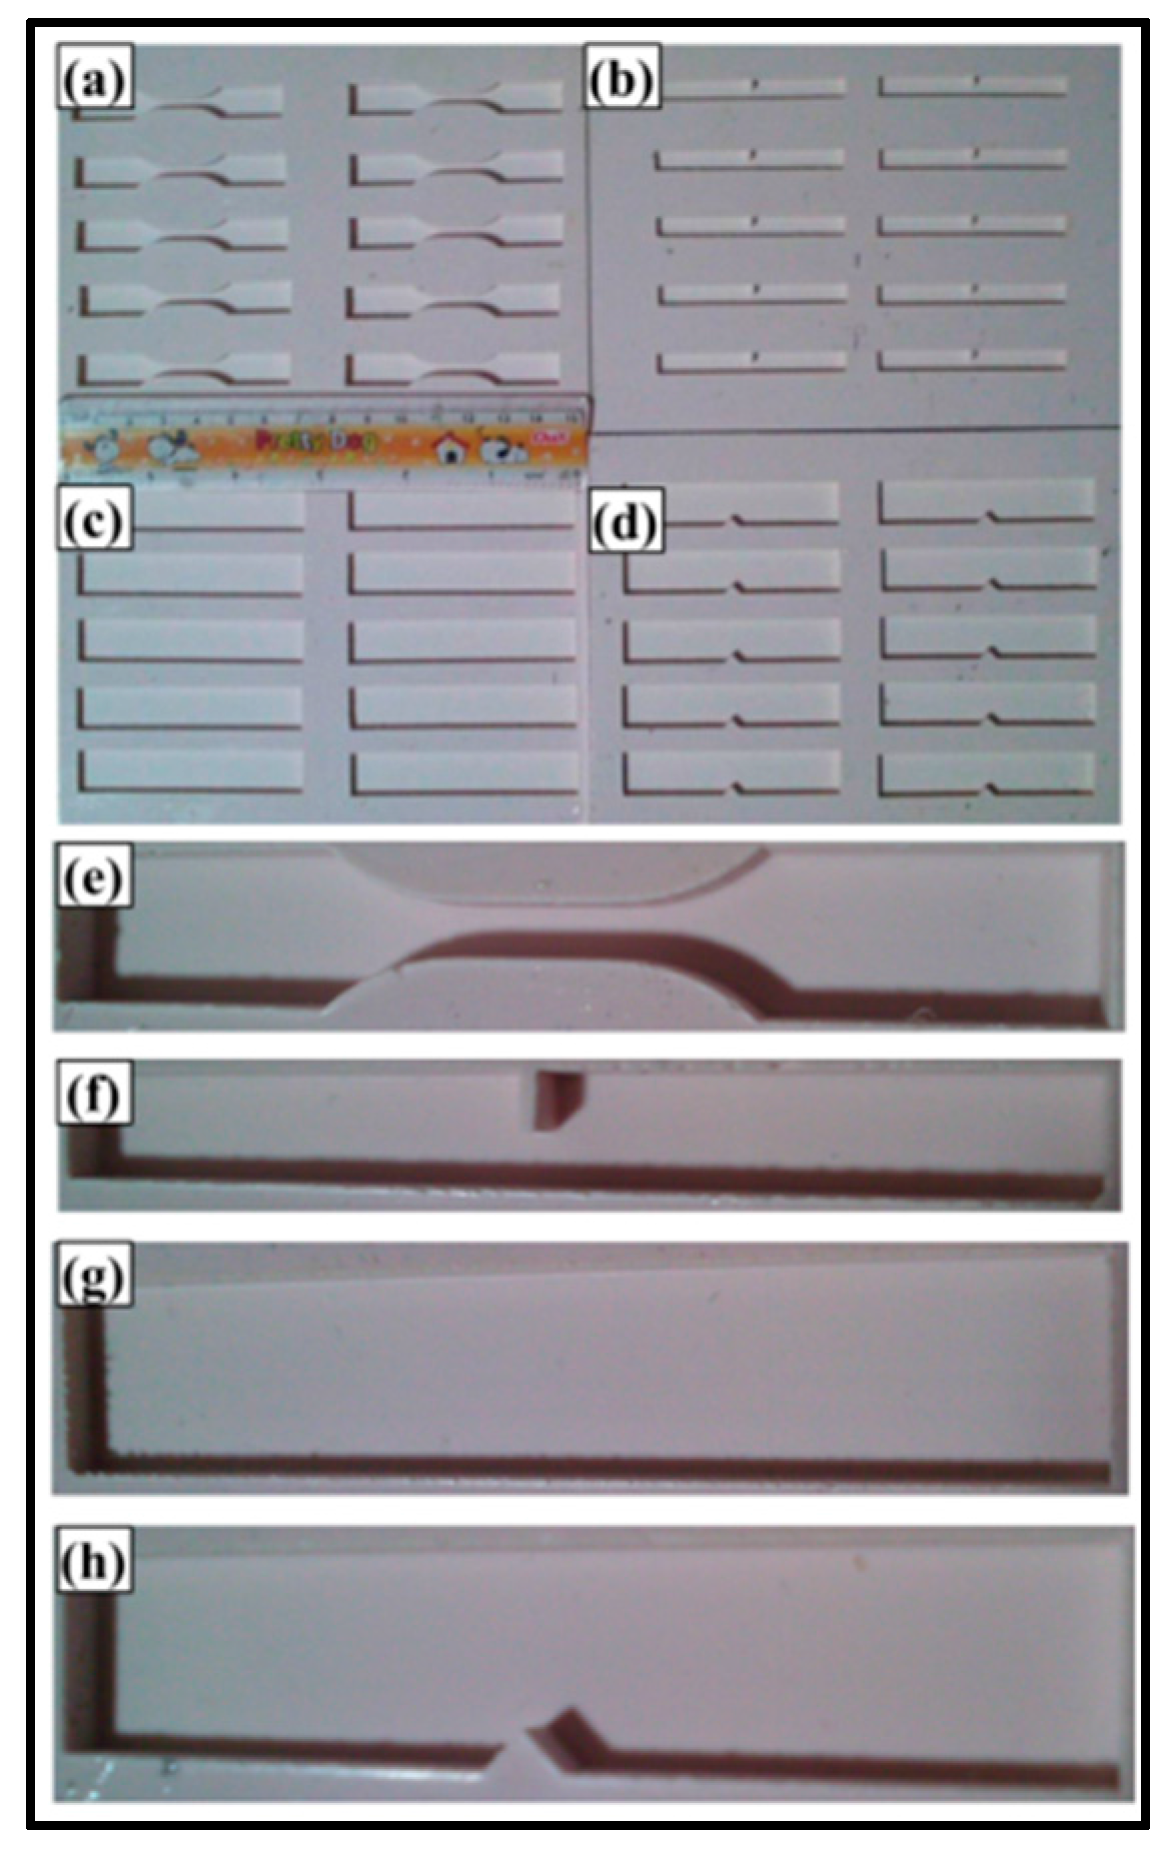
It can be observed that as-cast samples had surface notches stemming from the mold surface as shown in
Figure 18. The surface notches in as-cast samples seem inevitable as vibrations and possible wobbling of machine tool yields notches on the surface of the mold the impression of which is transferred to the surface of samples cast.
The increase in Young’s modulus and UTS with velvet cloth and abrasive paper 1200P can be attributed to the smoothening of the surfaces as as-cast specimens had surface roughness values between ±43 µm. In comparison, the surface roughness of 0.1 wt % MLG/clay-EP nanocomposites treated with velvet cloth varied between ±33 µm and that of abrasive paper 1200P varied between ±13 µm. Therefore, strength and modulus can be increased by treatment with velvet cloth and abrasive paper 1200P. On the contrary, the surface roughness of 0.1 wt % MLG/clay-EP nanocomposites treated with 320P varied between ±52 µm and that of abrasive paper 60P varied between ±103 µm. Therefore, it can be concluded that surface roughness beyond about ±20 µm has detrimental effect on tensile strength and modulus of 0.1 wt % MLG/clay-EP nanocomposites. Accordingly, the surface roughness below about ±20 µm is benign for tensile properties of 0.1 wt % MLG/clay-EP nanocomposites.
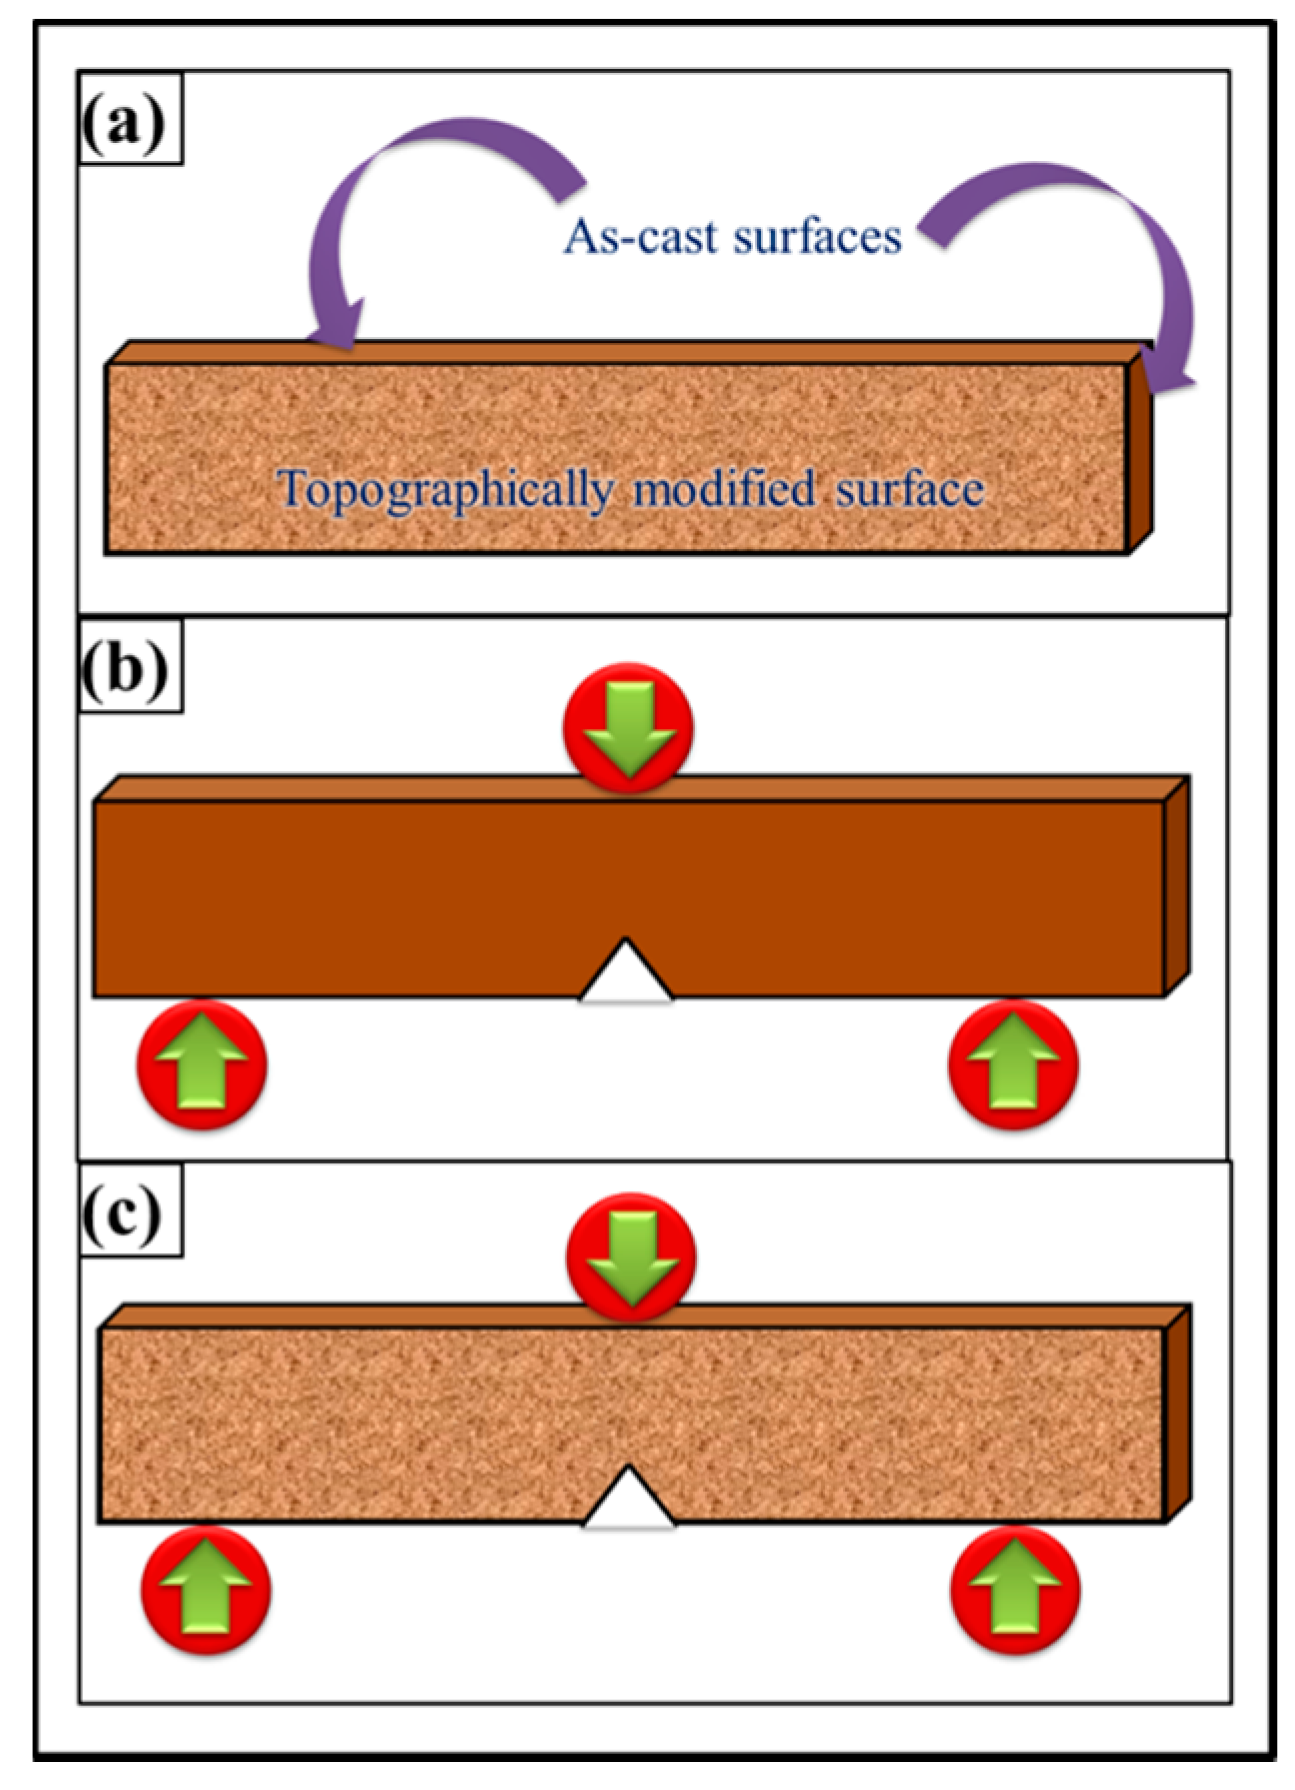
The topographical features did not change the
K1C values in nanocomposites. One reason can be the orientation of topography with respect to notch and loading axis. The samples were treated with abrasive papers only along wider surfaces and not on the sides of the specimens. Therefore, when the samples were subjected to bending loading, the topographically treated surfaces were parallel to the axis of loading (
Figure 19). The deformation and fracture takes place at the tip of notch whose size (3 mm) is much bigger than the surface roughness of topographically modified surfaces. These two reasons may contribute to topography (up to ±100 µm) having no influence on
K1C.
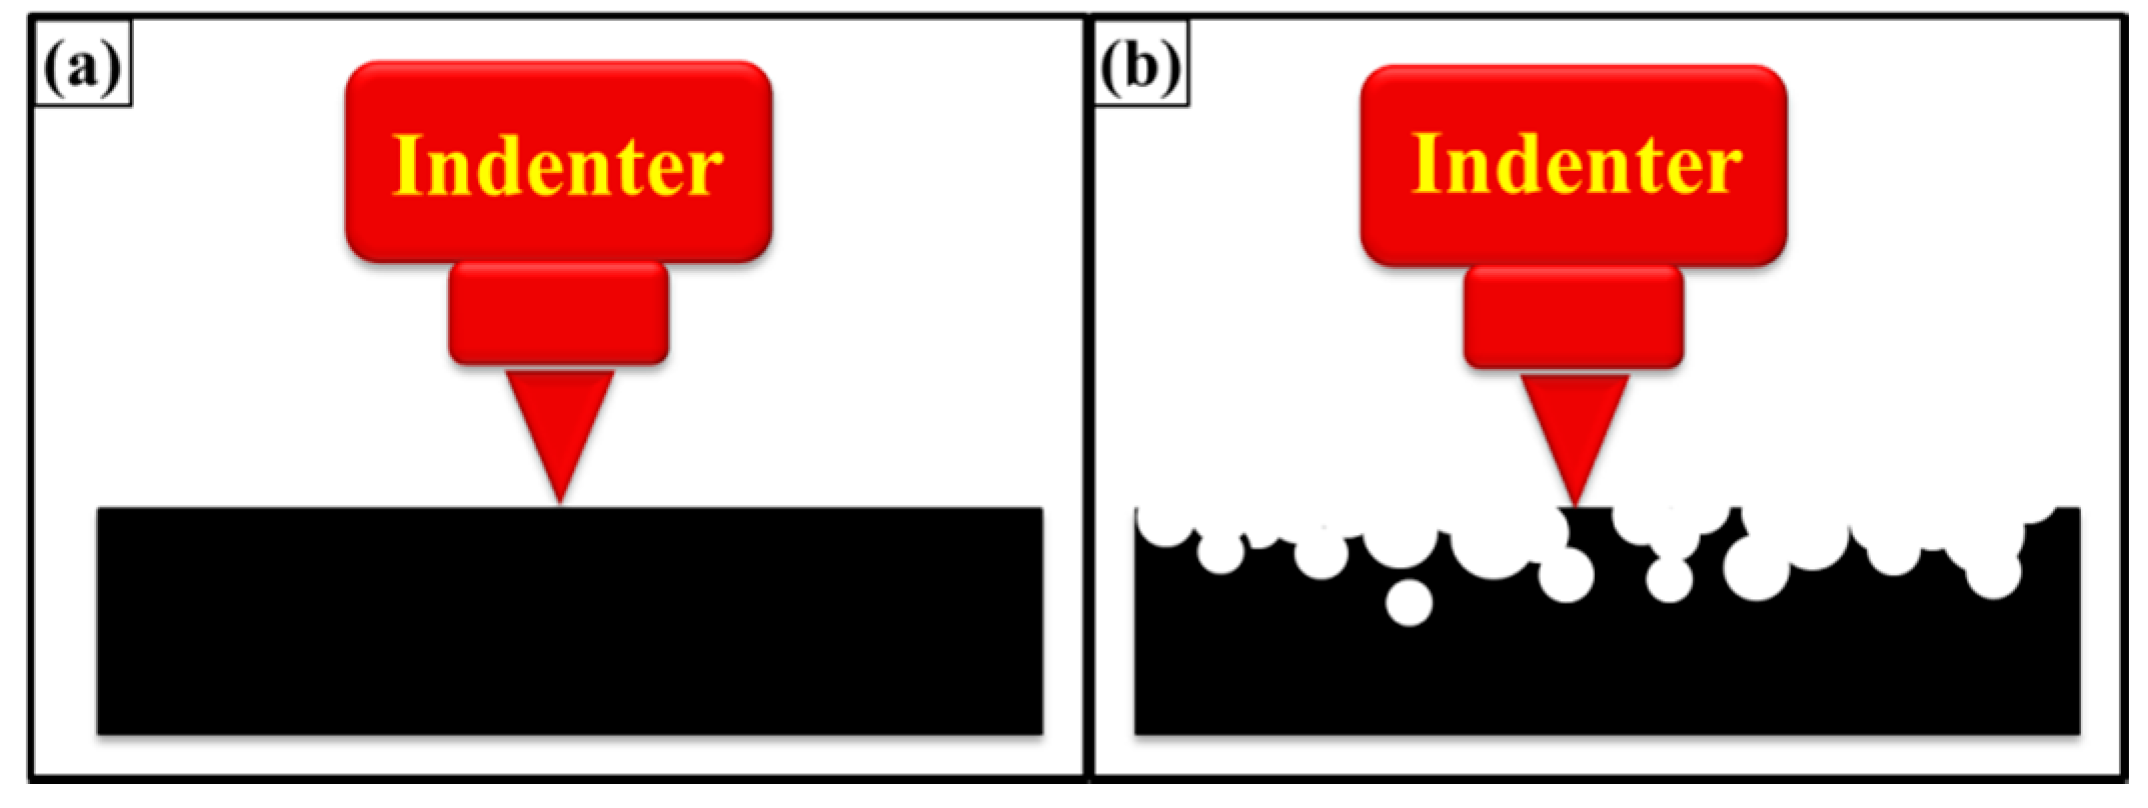
This increase in hardness can be attributed to the smoothness of surfaces. A roughness was observed in as-cast specimens. When specimen contains corrugated surface, the tip of the indenter may or may not sit perfectly on the micro-plateau as shown in
Figure 20. When the indenter sits perfectly on the surface, resistance is offered by the surface underneath and a high value of hardness is observed. On the contrary, when the indenter sits on the edge, lower resistance is offered by the edge and therefore, a lower value of hardness is observed. In samples treated with velvet cloth and abrasive paper 1200P, smoothness increased or at least sharp edges were removed. Therefore, an increase in hardness was observed. The hardness decreased in sample treated with abrasive papers 320P and 60P which shows that indenter faces less resistance due to corrugation of the surfaces. The hardness is also a function of applied load. It is known as indentation size effect according to which, “as load increases, the hardness decreases” [
40]. It is also defined as, “as impression size decreases, the hardness increases”. Jiang
et al. produced non-hydrogenated germanium carbide films by magnetron co-sputtering method in a discharge of Ar [
41]. They observed that topography was significantly influenced by temperature and both hardness and Young’s modulus increased with increasing temperature. The compressive stress on the surface increases with increasing temperature [
41]. Guo
et al. deposited hydrogenated nanocrystalline silicon thin films with high hydrogen dilution ratio by plasma enhanced, chemical vapor deposition technique [
42]. The surface roughness decreased with increasing the hydrogen dilution ratio. The hardness and Young’s modulus increased with finer topography [
42]. A similar trend was observed in the current study where smooth surfaces (treated with velvet cloth and abrasive paper 1200P) caused an increase in modulus and hardness values. On the contrary, the coarser surfaces (treated with abrasive papers 320P and 60P) resulted in a decrease in modulus and hardness values. In metals, alloys and ceramics, the indentation size effect may be attributed to grain size, orientation and phases in the sample. In polymers, it may be because of the degree of crosslinking, orientation of polymer chains and size and distribution of porosity.
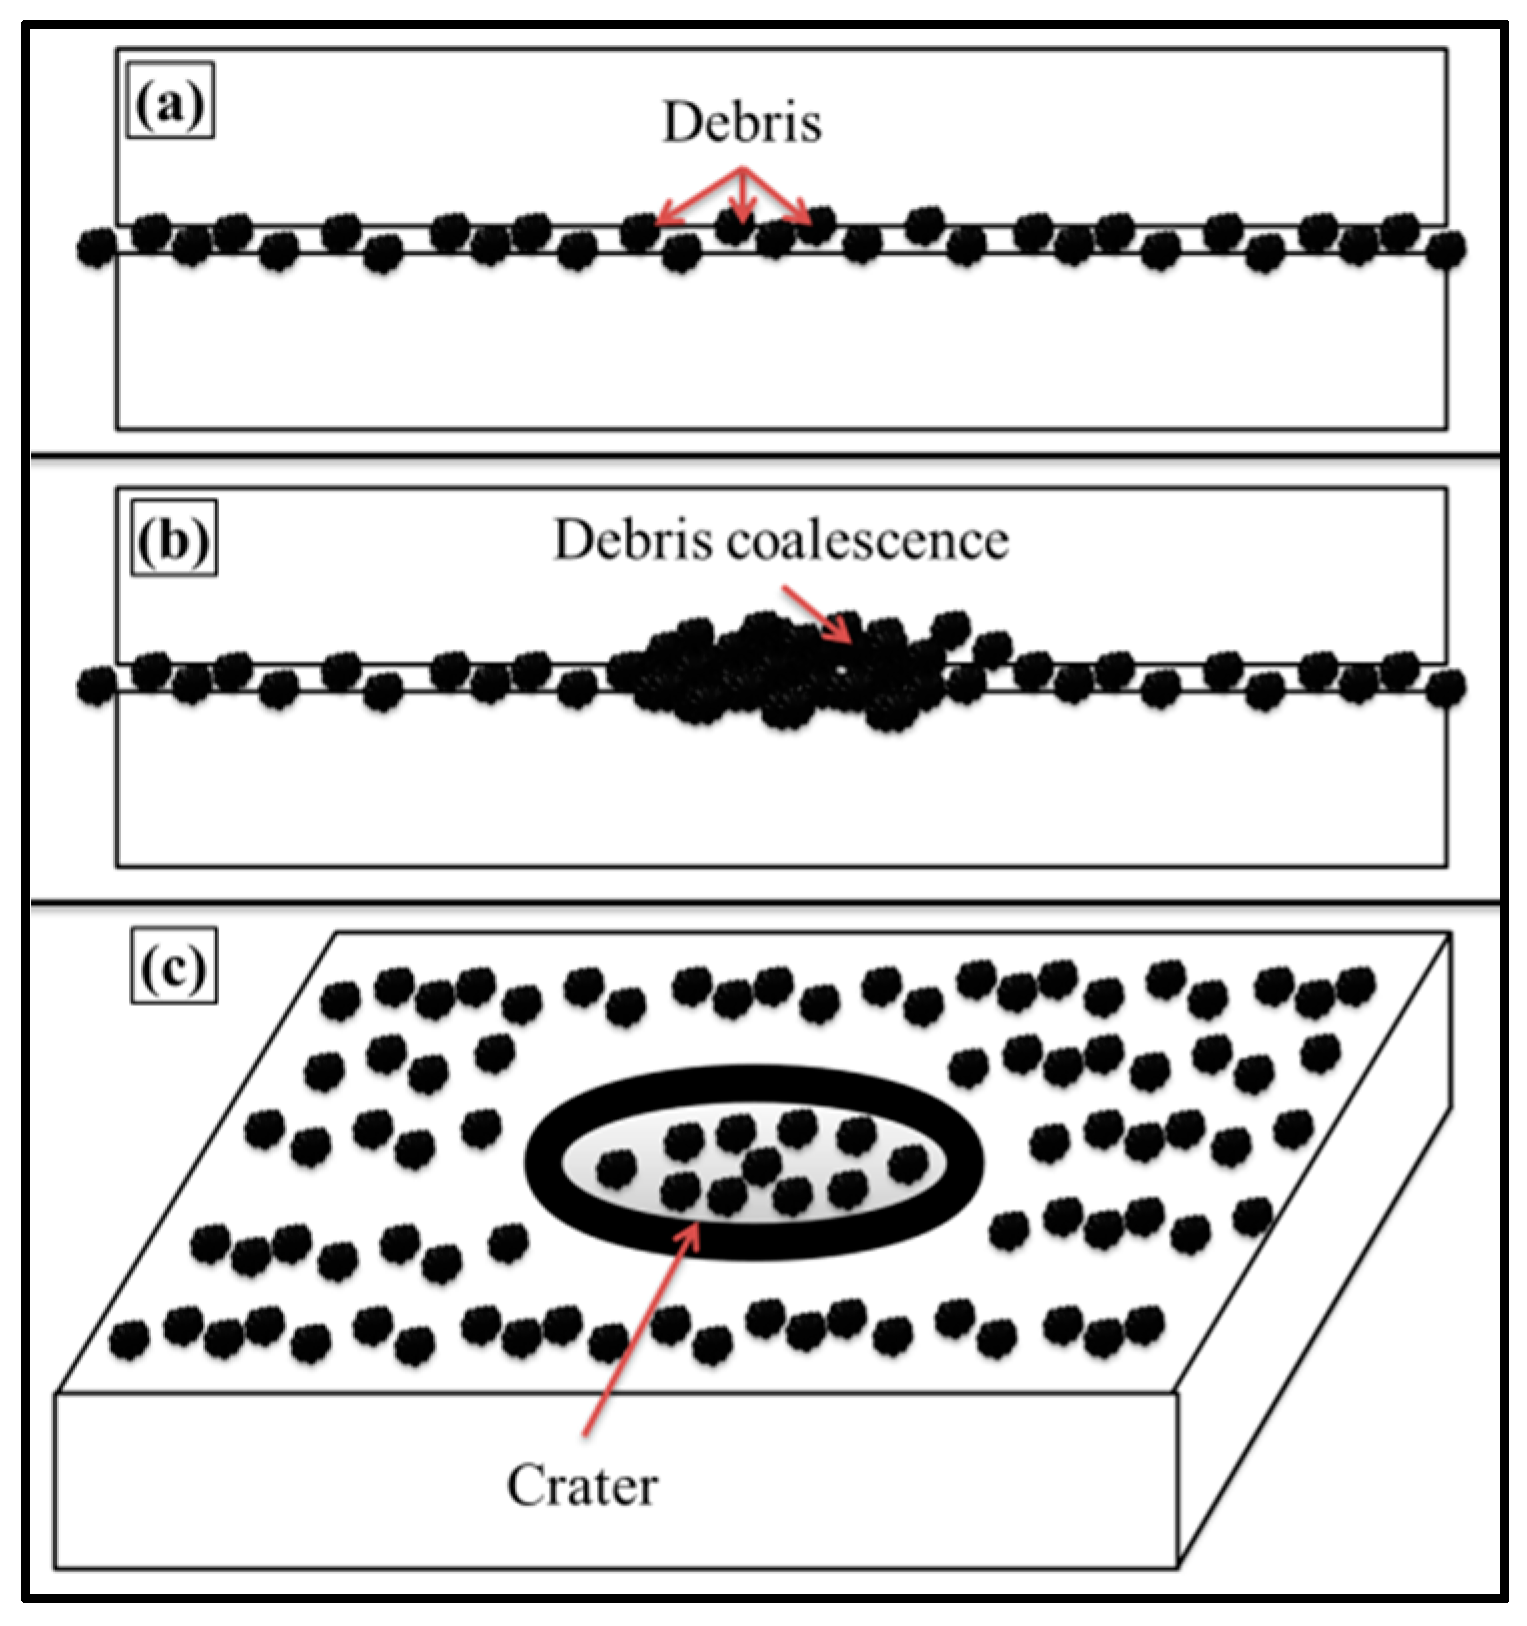
It can be observed from the topographical analysis above that the treatment of 0.1 wt % MLG/clay-EP nanocomposites with abrasive papers produced topography with different size, shape and orientation of notches and corrugations. It can be attributed to varying roughness and particle size distribution of the abrasive papers used. Another important feasible mechanism could be the crater formation. When an abrasive tool slides against the sample surface, elevated temperatures are produced at the contact surface due to the frictional forces. The debris produced as a result of wear may coalesce at high temperature. This coalescence may result from diffusion, dissolution, cold-welding and related possible chemical interactions [
43]. The coalesced particles result in a crater formation on the surface which may significantly deteriorate the mechanical properties as shown in
Figure 21. If crater formation is part of the wear limit criterion, the topography can be analyzed by the depth of the crater or the projected area of the crater [
43].
Surfaces are not completely flat at the microscopic level. At high magnification, even the best polished surface will show ridges and valleys, asperities and depressions. When two surfaces are brought together, they touch intimately only at the tips of a few asperities. At these points, the contact pressure may be close to the hardness of the softer material; plastic deformation takes place on a very local scale and cold welding may form strongly bonded junctions between the two materials. When sliding begins, these junctions have to be broken by the friction force and this provides the adhesive component of the friction. Some asperities may plow across the surface of the mating material and the resulting plastic deformation or elastic hysteresis contribute to the friction force; additional contributions may be due to wear by debris particles that become trapped between the sliding surfaces [
44].
The smooth surfaces are necessary in sliding contact. When the surfaces contain high roughness and are slid against each other, wear takes place. The pointed debris formed as a result of wear, and if unable to find a place to escape, may cause cratering on the surface. The crater may act as a high stress concentration site due to the notch effect. This stress concentration may significantly deteriorate the mechanical properties of the bulk material. This effect may be further pronounced in the case of brittle polymers such as epoxy, as there are no intrinsic mechanism available to stop the crack advancement [
10]. During sliding contact, thermal stresses are produced which can give rise to peculiar topographical features. In case of polymers, the thermal stresses may influence the degree of cross-linking. This altered degree of crosslinking at the surface may influence the overall mechanical properties of polymers [
10]. In general, the mechanical properties improve with increased crosslinking. However, it was shown that fracture toughness decreases with increasing crosslinking [
45].
The improvement in mechanical properties with the incorporation of MLG and nanoclay depend on many factors such as dispersion state and interfacial interactions. The maximum improvement in tensile strength is as high as 108% [
46] and tensile modulus up to 103% [
47]. Graphene was also found to improve flexural properties of nanocomposites. Naebe
et al. produced covalent functionalized epoxy/graphene nanocomposites and reported an 18% and 23% increase in flexural strength and modulus, respectively [
48]. Qi
et al. produced graphene oxide/epoxy nanocomposites and reported an increase up to 53% in flexural strength [
49]. The impact strength and hardness were also significantly improved by graphene in epoxy nanocomposites. For example, Ren
et al. applied a combination of bath sonication, mechanical mixing and shear mixing to disperse GO in cyanate ester-epoxy and produced nanocomposites using in-situ polymerization [
50]. They reported an increase of 31% in impact strength. Qi
et al. produced graphene oxide/epoxy nanocomposites and reported an increase in impact strength up to 96% [
51] whereas Lu
et al. produced GO/epoxy nanocomposites and reported an increase in impact strength up to 100% [
52]. Shen
et al. produced GNS/epoxy nanocomposites and reported an increase in impact strength up to 11% [
53] and Bao
et al. reported an increase in hardness up to 35% [
54]. The
G1C also improved with the incorporation of graphene in epoxy nanocomposites. Meng
et al. produced epoxy/graphene nanocomposites and reported an increase in
G1C up to 597% [
55].
The nanocomposites can be modeled and simulated to estimate the influence of nanofillers on mechanical, thermal and electrical properties of nanocomposites. Various theoretical and computational approaches have been employed to explore the effect of nanofillers on the performance of polymer nanocomposites, including but not limited to quantum mechanical-based methods [
56], Continuum Mechanics (CM) [
57], Molecular Mechanics (MM) [
58], Molecular Dynamics (MD) [
59], atomistic modeling [
60], Density Functional Theory (DFT) [
61] and multiscale modeling [
62]. For example, some of the authors have shown that MLG is very efficient in scattering and dissipation of thermal flux in epoxy nanocomposites [
26].


