3.1. Morphology of Single Crystals of PES 9,7, PES 9,9, and COPES 9,7/9 Samples
Lamellar crystals of both PES 9,7 and PES 9,9 homopolyesters were obtained by isothermal crystallization in dilute diol solutions and a narrow temperature range (i.e., 30–50 °C). This range was limited due to the relatively low melting point of the considered polyesters (i.e., 65–66 °C) and the degree of supercooling that was necessary to get feasible nucleation and crystal growth processes. Our best results were specifically attained using 1,6-hexanediol since isolated crystals with large dimensions were predominant in the considered temperature interval for both samples.
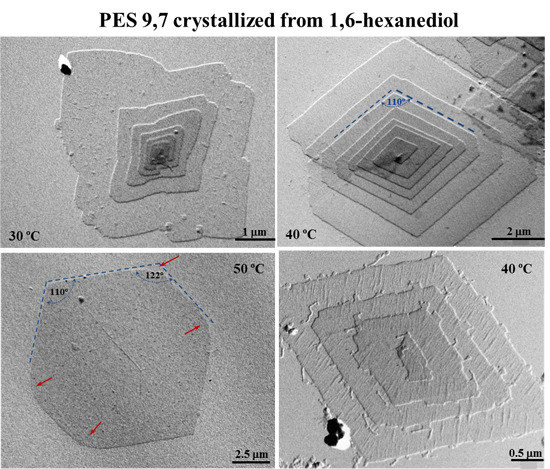
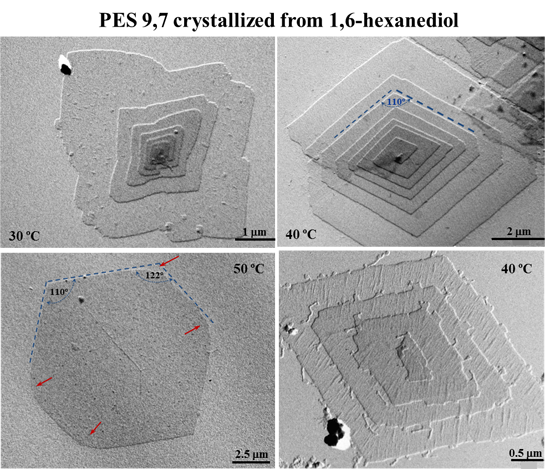
Morphology of single crystals was clearly dependent on the crystallization temperature as shown in
Figure 2 for PES 9,7. Thus, irregular crystals became predominant at the lowest assayed crystallization temperature (
i.e., 30 °C) as a consequence of a microsectorization derived from the increased instability of the characteristic growth faces (
Figure 2a). This feature is typical of high degrees of supercooling where the diffusion of molecules to the growth front controls the crystallization process in such a way that leads to the formation of dendrites [
36].
Figure 2.
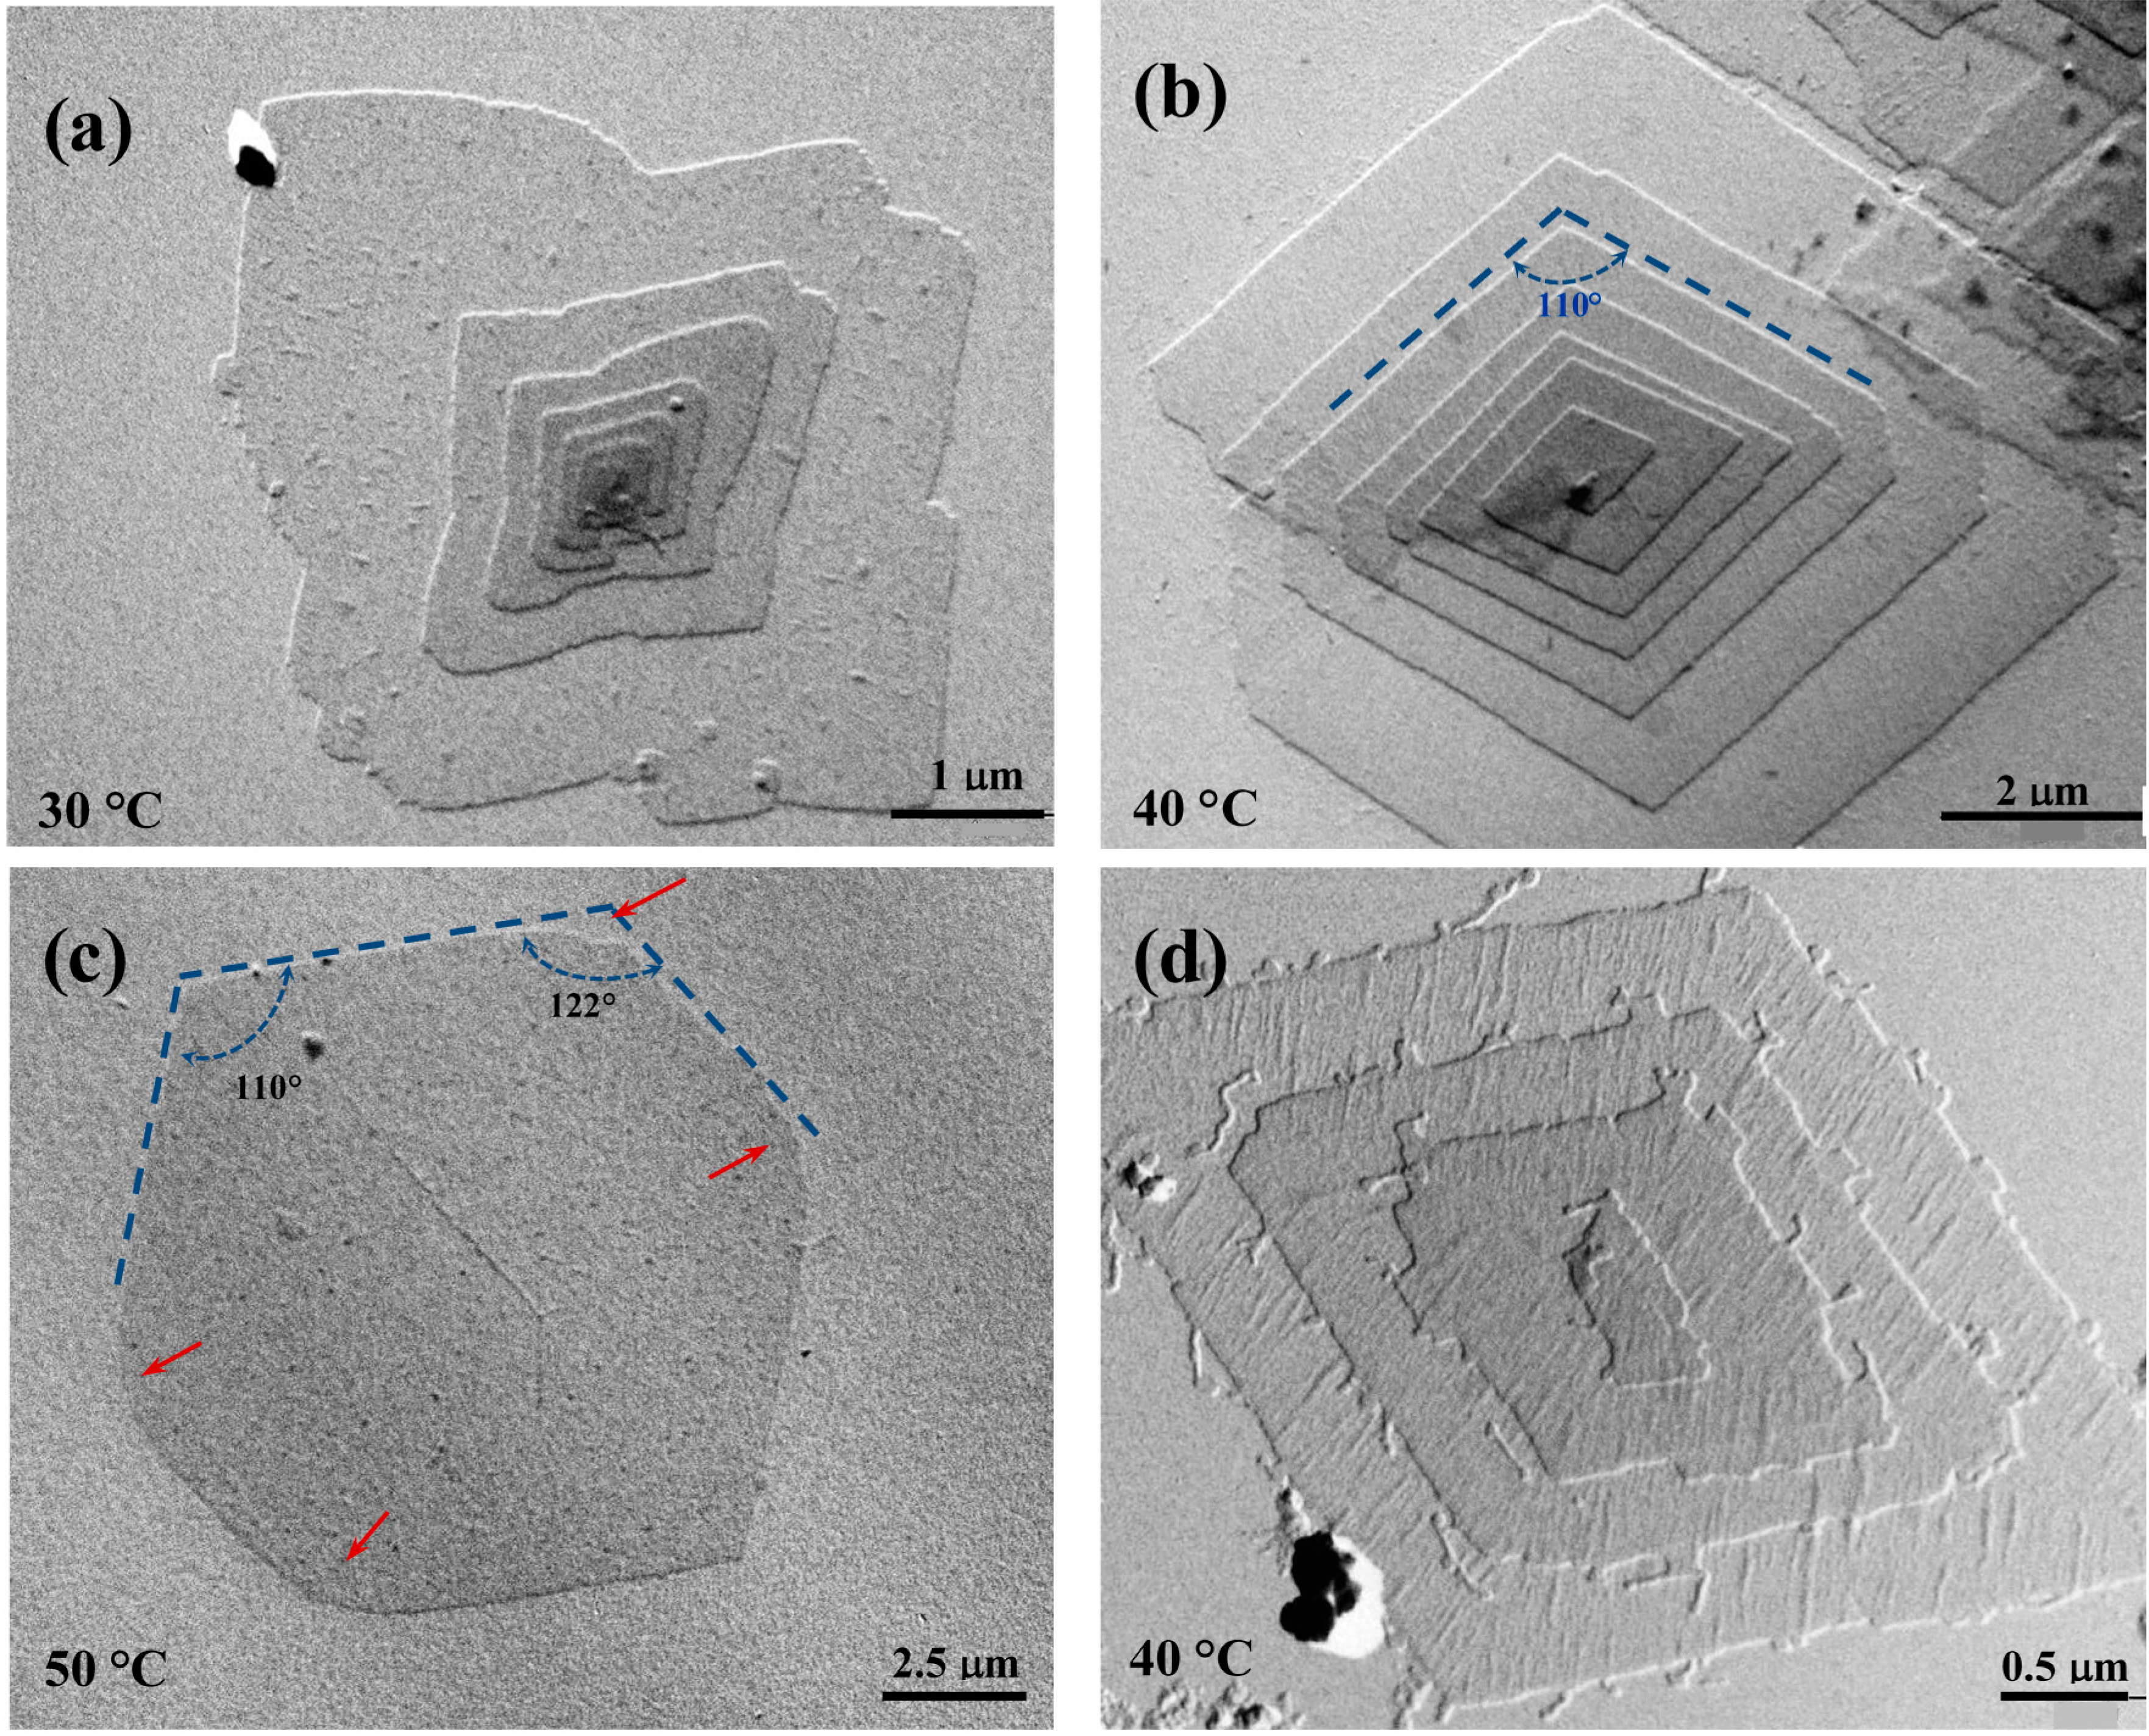
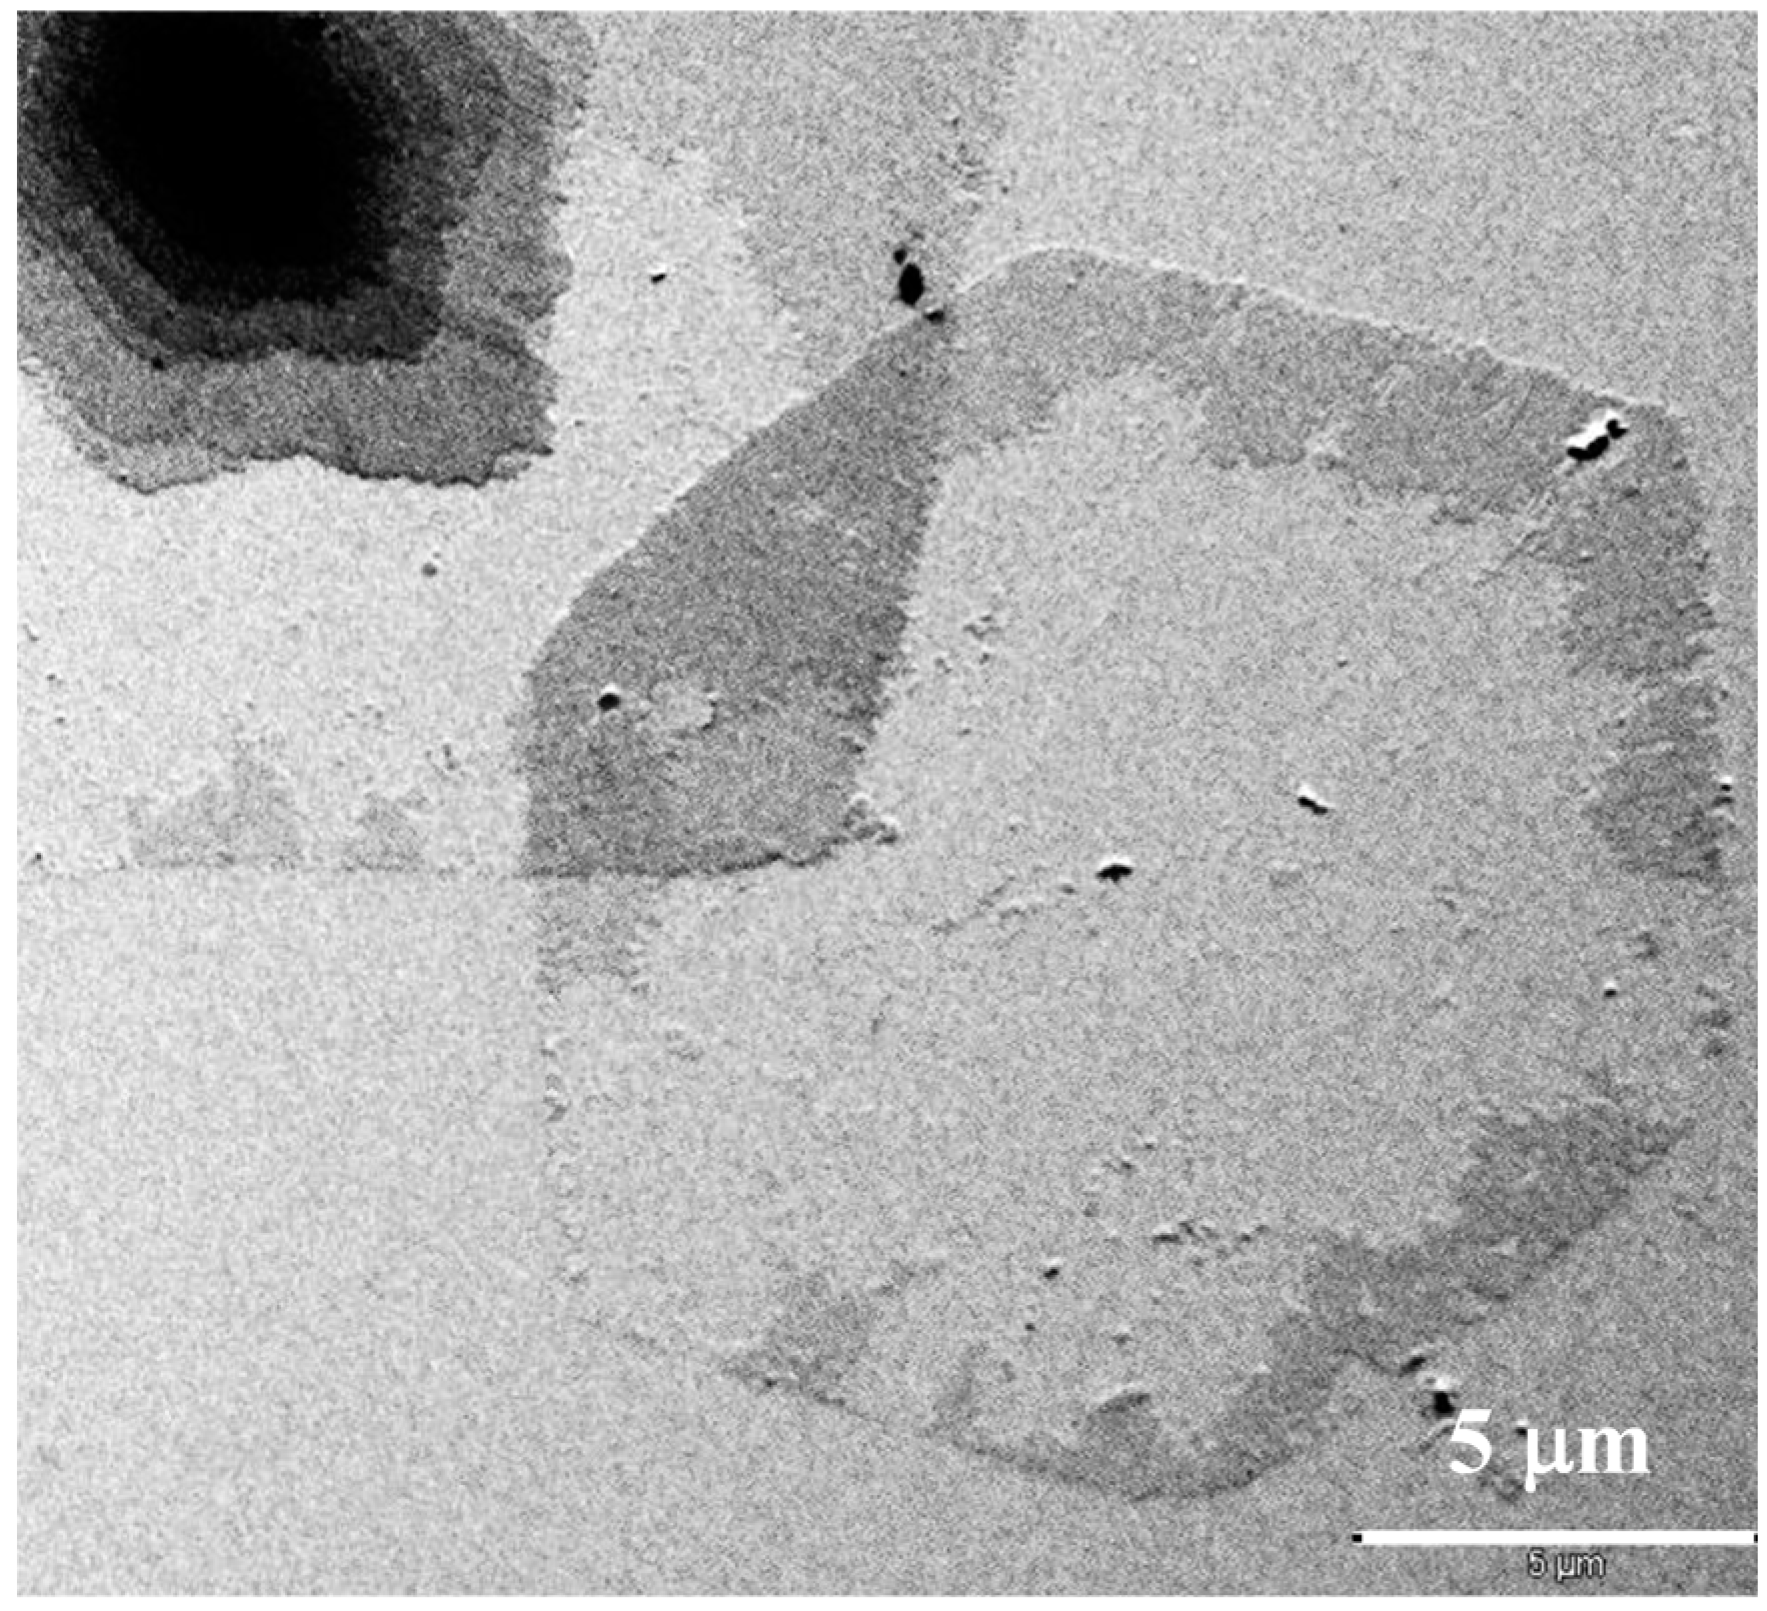
Transmission electron micrographs showing lamellar crystals of PES 9,7 crystallized from 1,6-hexanediol at 30 °C (a); 40 °C (b,d); and 50 °C (c).
Figure 2.
Transmission electron micrographs showing lamellar crystals of PES 9,7 crystallized from 1,6-hexanediol at 30 °C (a); 40 °C (b,d); and 50 °C (c).
A slight increase of temperature led to highly regular lamellar crystals with a lozenge morphology, with the angle between the most developed growth faces (
i.e., the {110} faces as will be explained) close to 110° (
Figure 2b). In general, slightly truncated multi-layered crystals were observed, with the thickness of each individual layer being between 1.0 and 1.3 nm as deduced from the corresponding shadows. Lamellar overgrowths usually emanated from right and left handed helical dislocations, which appeared in a similar ratio as expected from the achiral molecular structure. The face dimension of the basal crystal usually reached a maximum value close to 5 µm. Terrace growths (
Figure 2d) were also frequently observed under these experimental conditions, with clearly detected crystallographic coherence between successive layers (
i.e., no rotation was observed between crystals that appeared in a crystallographic register).
Isolated and well developed lamellae were frequently found when the crystallization temperature was raised to 50 °C. The lateral habit changed significantly and a close to hexagonal morphology was derived (
Figure 2c). Therefore, the length of the truncated faces increased with crystallization temperature although at 50 °C was still shorter than that measured for the {110} faces.
Figure 2c shows also that the {110} faces tend to curve (see red arrows) on approaching the truncated faces. Nevertheless, an angle close to 122° could be estimated between {110} and the truncated faces if this curvature was neglected.
Crystal growth faces became more irregular and frequent striations appeared on the lamellar surface (
Figure 2d) when synthesized polymer samples were non-purified by precipitation (
i.e., samples contained low molecular weight fractions). Striations highlighted the sectorization of crystals and always formed an angle between 60° and 70° with the {110} growth faces. The origin of these defects is not clear although they have frequently been reported for different polyesters, requiring explanations based on the aggregation of microcrystals or the existence of different chain-packing states in the crystal.
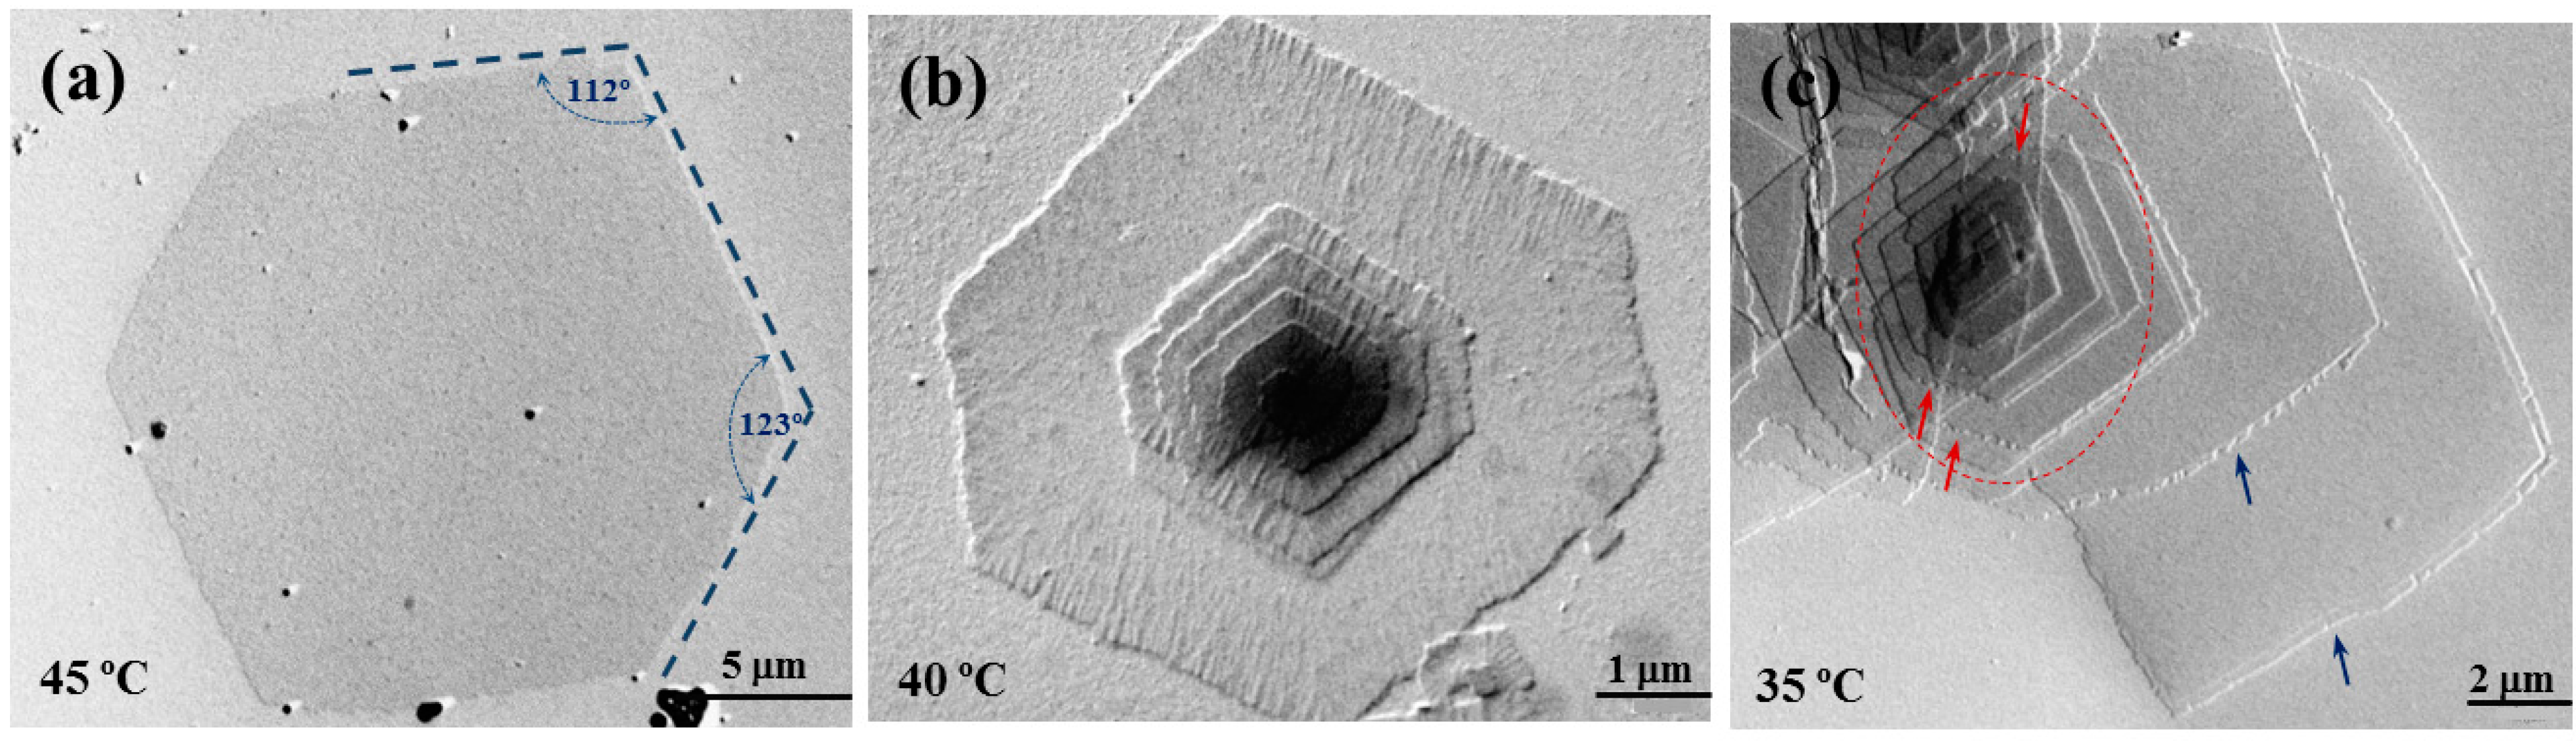
Similar morphologic features were found in the crystallization experiments carried out with PES 9,9 (
Figure 3). Angles between the predominant growth faces slightly changed to 112° and 123° as shown in
Figure 3a. In general, truncation was favored for the azelate derivative since the pseudohexagonal morphology was reached at lower temperatures. Note the high similarity between single lamellar crystals obtained at 50 °C (
Figure 2c) and 45 °C (
Figure 3a) with the pimelate and azelate derivatives, respectively. Differences concerning the degree of truncation are clearer when crystals prepared at 40 °C are compared (
Figure 2b and
Figure 3b).
Figure 3.
Transmission electron micrographs showing lamellar crystals of PES 9,9 crystallized from 1,6-hexanediol at 45 °C (a); 40 °C (b); and 35 °C (c).
Figure 3.
Transmission electron micrographs showing lamellar crystals of PES 9,9 crystallized from 1,6-hexanediol at 45 °C (a); 40 °C (b); and 35 °C (c).
Crystals of PES 9,9 showed also typical defects such as the presence of striations on the lamellar surface. These according to
Figure 3b seems to develop preferentially over the {110} sectors. In addition, the {010} growth faces tend to be serrated when the temperature decreased (e.g., down to 35 °C) contrasting with the more regular growth that can still be detected for the {110} faces.
Figure 3c shows the presence of lozenge aggregates (inside the red ellipsoid) with even significantly developed truncated faces. In this case, the serrated morphology was clearly detected (see red arrows) since microsectorization was favored and the {010} growth face became more instable. Large lamellae with non-well-defined crystalline habit, rounded faces and peculiar edges (e.g., see blue arrows in
Figure 3c) were also detected in the different crystallizations.
Results obtained from both homopolymers were in agreement with a decrease in the degree of truncation by decreasing the crystallization temperature (i.e., by increasing the supercooling degree). However, the differences between the single crystal morphology of homopolymers at a given temperature should be caused by a better solvent affinity of PES 9,9 since both homopolymers had a similar melting temperatures (i.e., 65.7 and 65.6 °C determined from DSC experiments for azelate and pimelate derivatives, respectively).
Large single crystals of the random copolyester COPES 9,7/9 could also be prepared from 1,6-hexanediol dilute solutions despite its high comonomer content (
i.e., 47 mol %). Although melt crystallization of random poly(alkylene dicarboxylate)s have been extensively studied in recent years [
16,
17,
18,
19,
20,
21,
22], this is the first time to our knowledge that single crystal morphology of such random copolymers has been evaluated.
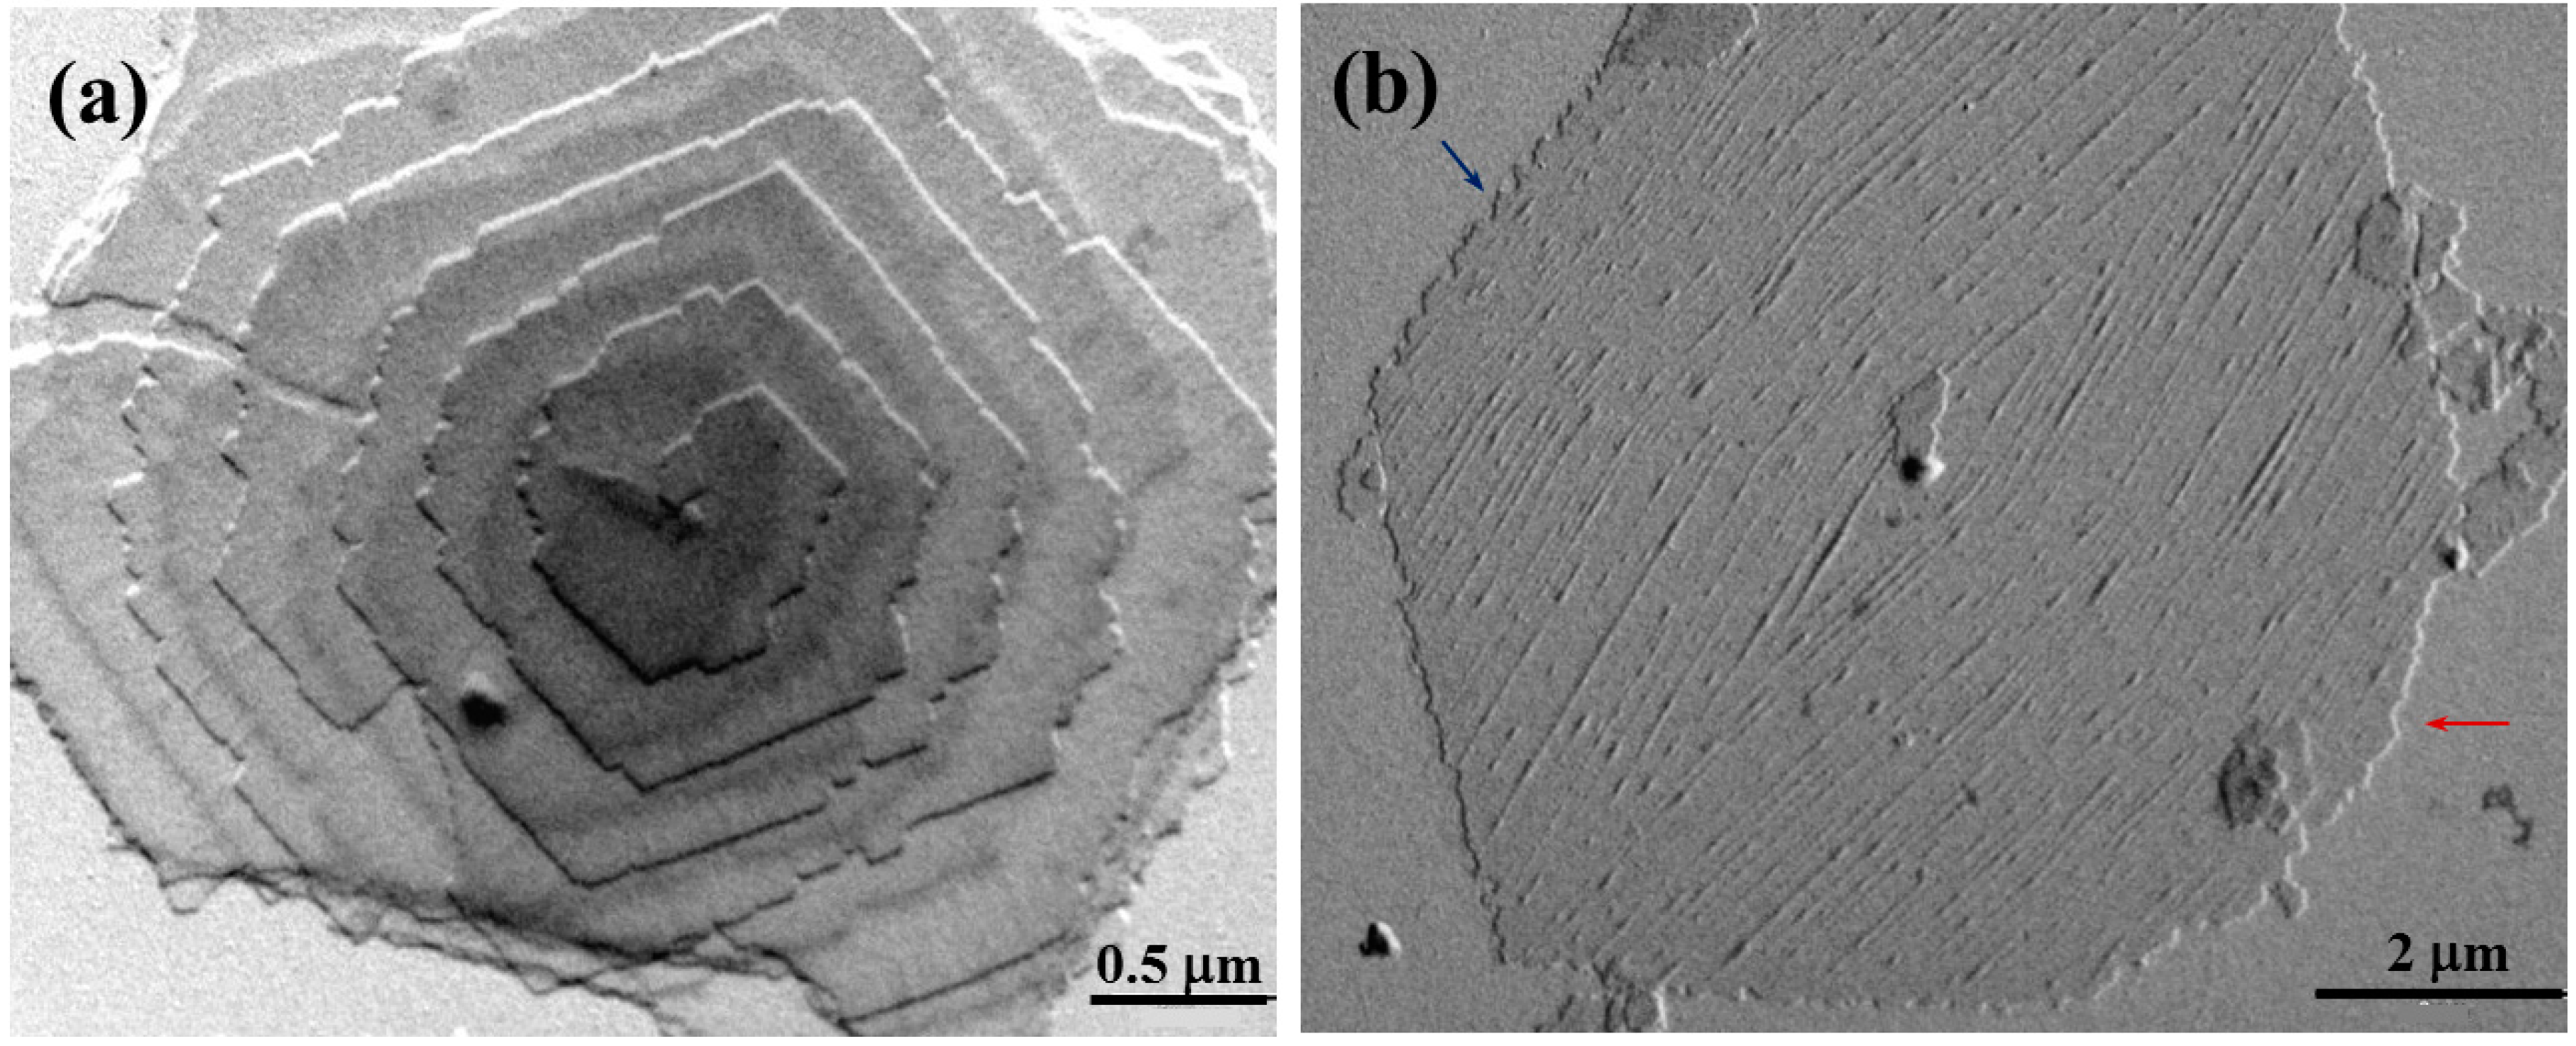
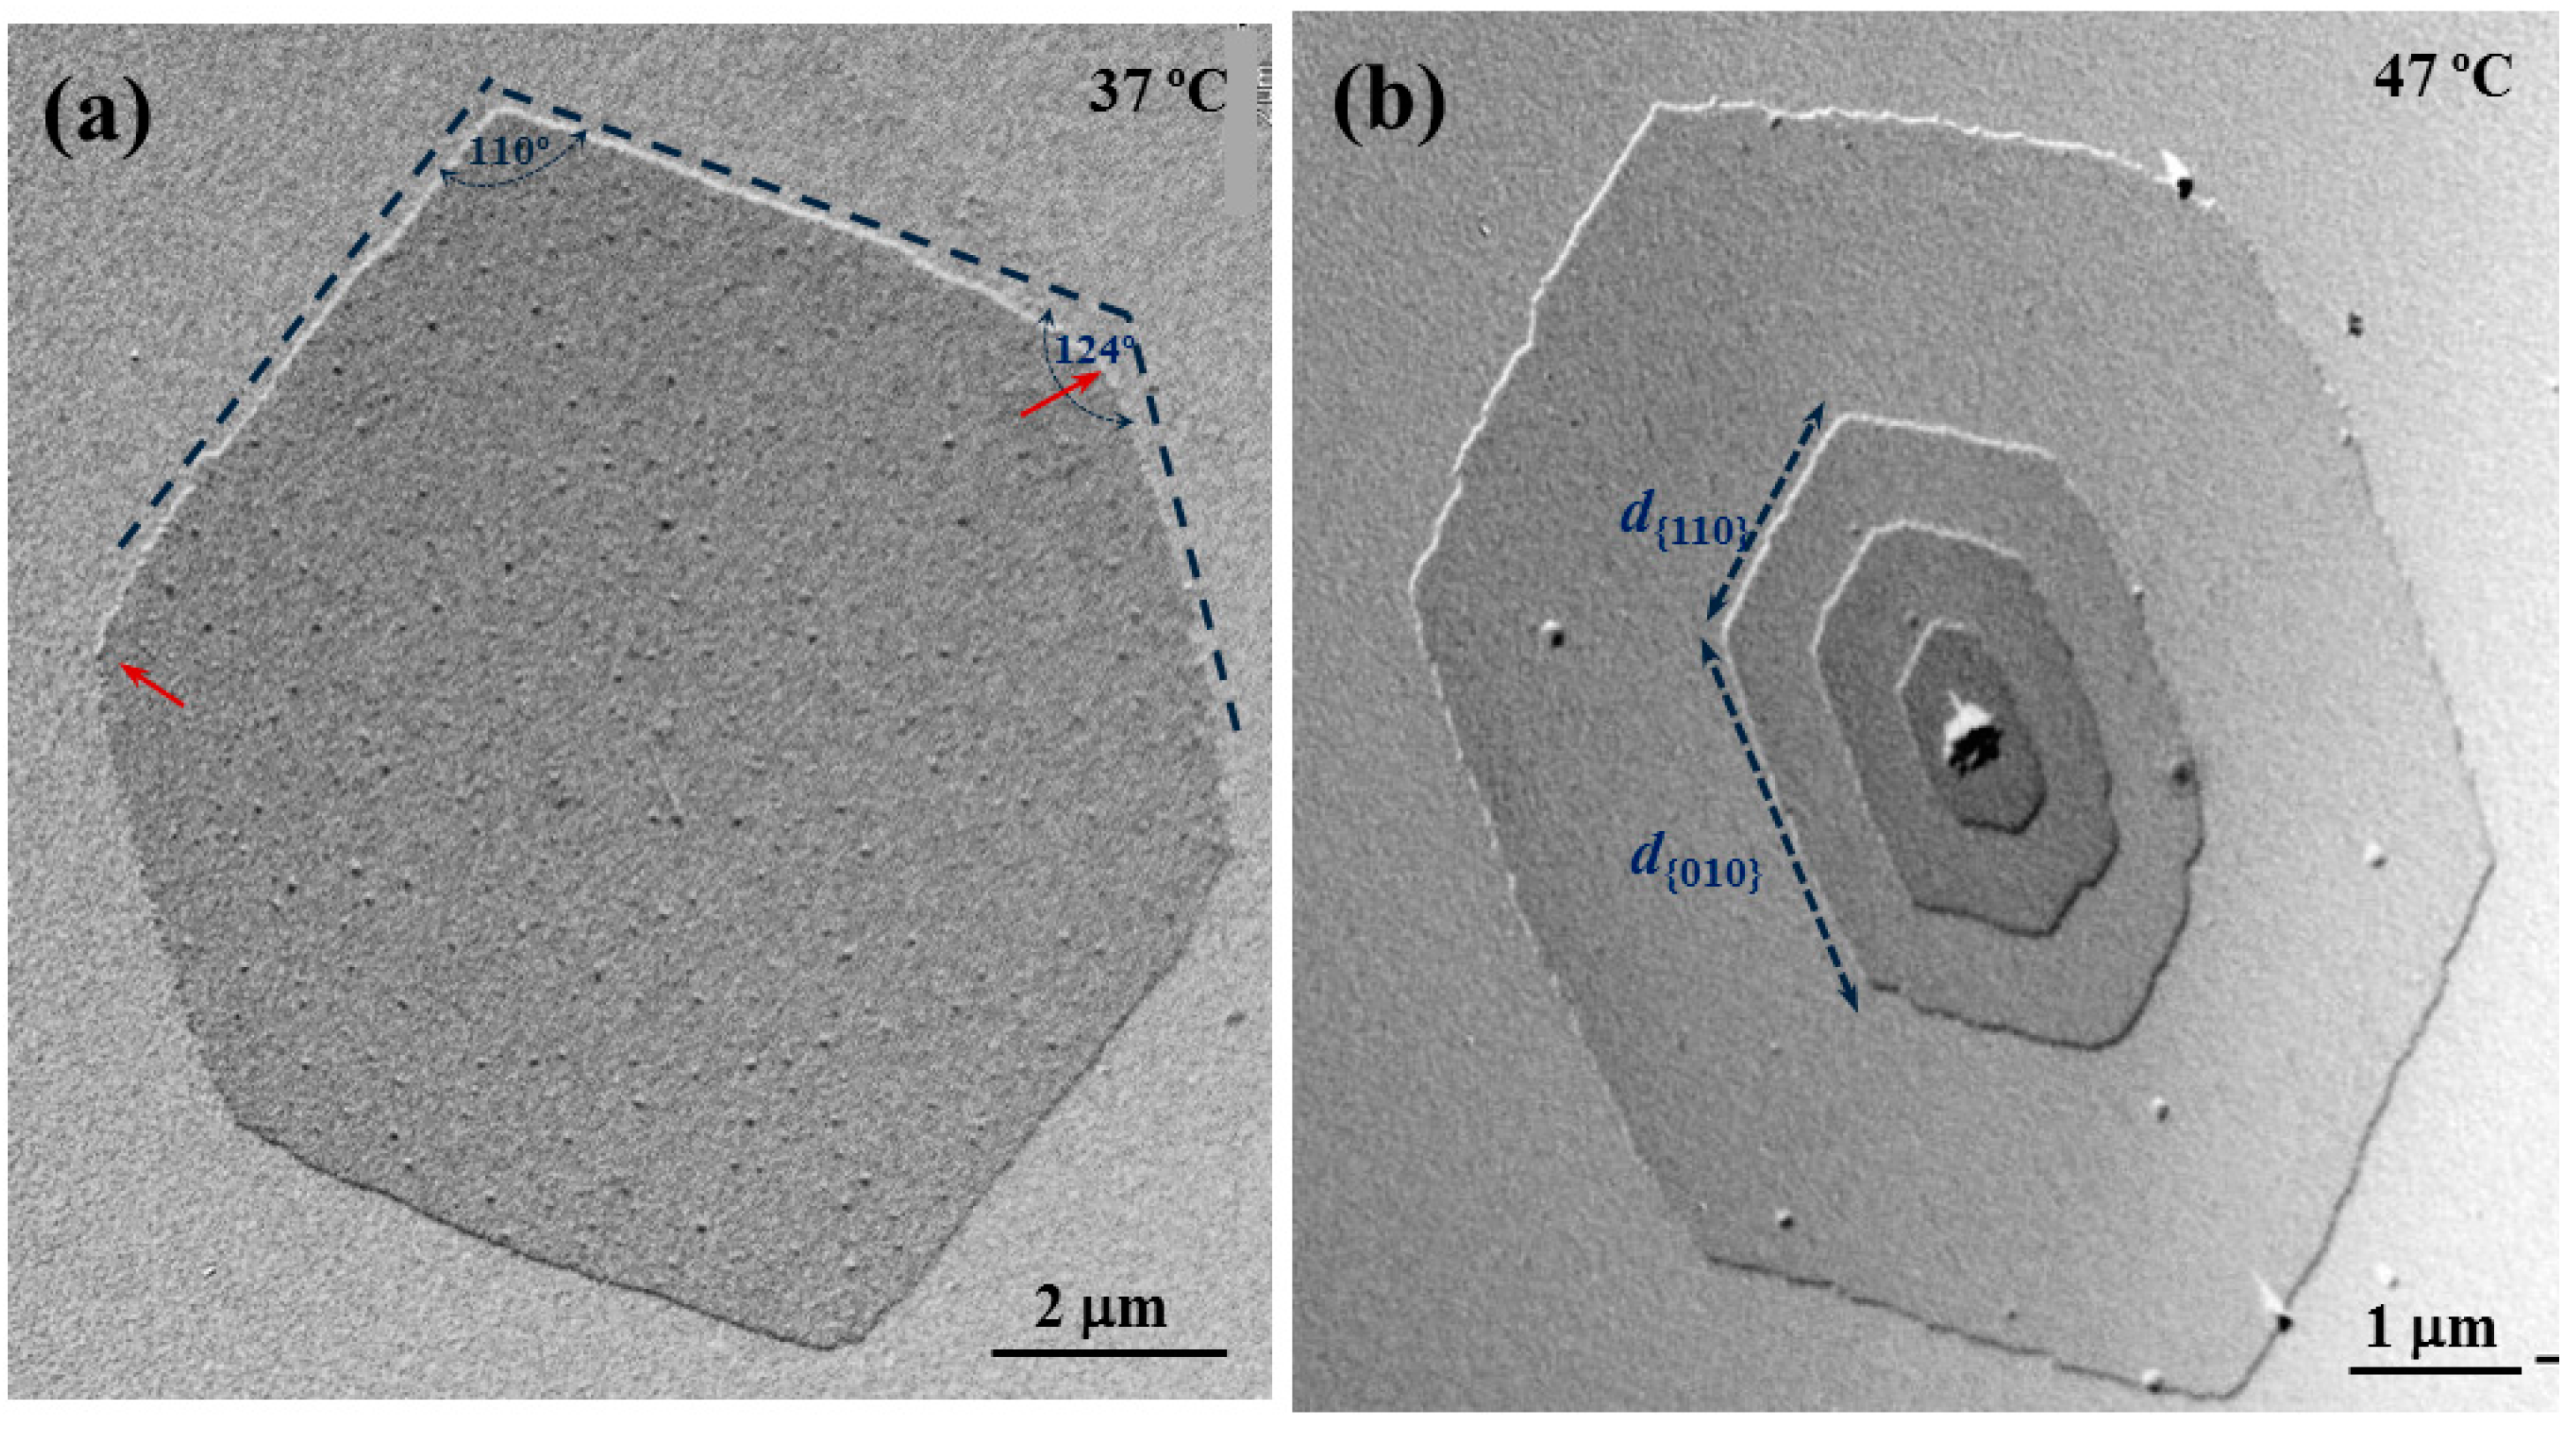
Figure 4a clearly shows pseudohexagonal lamellae of COPES 9,7/9 with identical morphology and dimensions to those crystals corresponding to the two homopolyesters that are shown in
Figure 2c and
Figure 3a. Note that angles of 110° and 124° could be measured between the characteristic faces of COPES 9,7/9 single crystals, a slight curvature can be detected in the {010}–{110} face junction (red arrow) and the ratio between the lengths of these faces (
i.e.,
d{010}/
d{110}) was always close to 0.7 as could be also measured for the homopolyesters. It is interesting to note that this morphology was attained for the random copolymer at a remarkable lower temperature than for the homopolymers (
i.e., 37 °C compared to 45–50 °C) since it corresponds to a similar supercooling degree. Note that the melting temperature of the copolymer was significantly lower than determined for homopolyesters (
i.e., 61.1 °C compared to 65.6–65.7 °C).
Figure 4b precisely shows that elongated crystals with
d{010}/
d{110} equal to 1.6 were typical of COPES 9,7/9 crystals prepared at 47 °C, which is in the middle of the temperature range (45–50 °C) where the above mentioned PES 9,7 and PES 9,9 crystals with
d{010}/d
{110} equal to 0.7 were grown (45–50 °C).
Figure 4.
Transmission electron micrographs showing lamellar crystals of COPES 9,7/9 crystallized from 1,6-hexanediol at 37 °C (a) and 47 °C (b).
Figure 4.
Transmission electron micrographs showing lamellar crystals of COPES 9,7/9 crystallized from 1,6-hexanediol at 37 °C (a) and 47 °C (b).
These clear differences between morphologies of copolymer and homopolymer crystals, developed at a given temperature, support a distinction at a molecular level as expected from random or blocky microstructures. Namely, crystals obtained from COPES 9,7/9 could not be a simple mixture of PES 9,9 and PES 9,7 crystals since in this case similar morphologies as found with homopolyesters should be observed. On the contrary, COPES 9,7/9 crystals seem truly derived from a random copolymer and consequently both azelate and pimelate units should be incorporated into lamellae without provoking a significant distortion of the crystalline lattice as can be explained from diffraction data analysis. Nevertheless, it is possible that azelate and pimelate comonomer units were differently distributed between the lamellar core and the lamellar surface. This observation means that the crystalline part may correspond mainly to one of the two homopolyester structures and therefore the observed regular and well-formed crystals could be better justified. The foreign comonomer units should be in this case preferentially incorporated onto the amorphous lamellar surface despite some proportion also being found in the dominant crystalline structure.
COPES 9,7/9 single crystals may also show the typical irregularities previously described for samples of homopolymers as depicted in
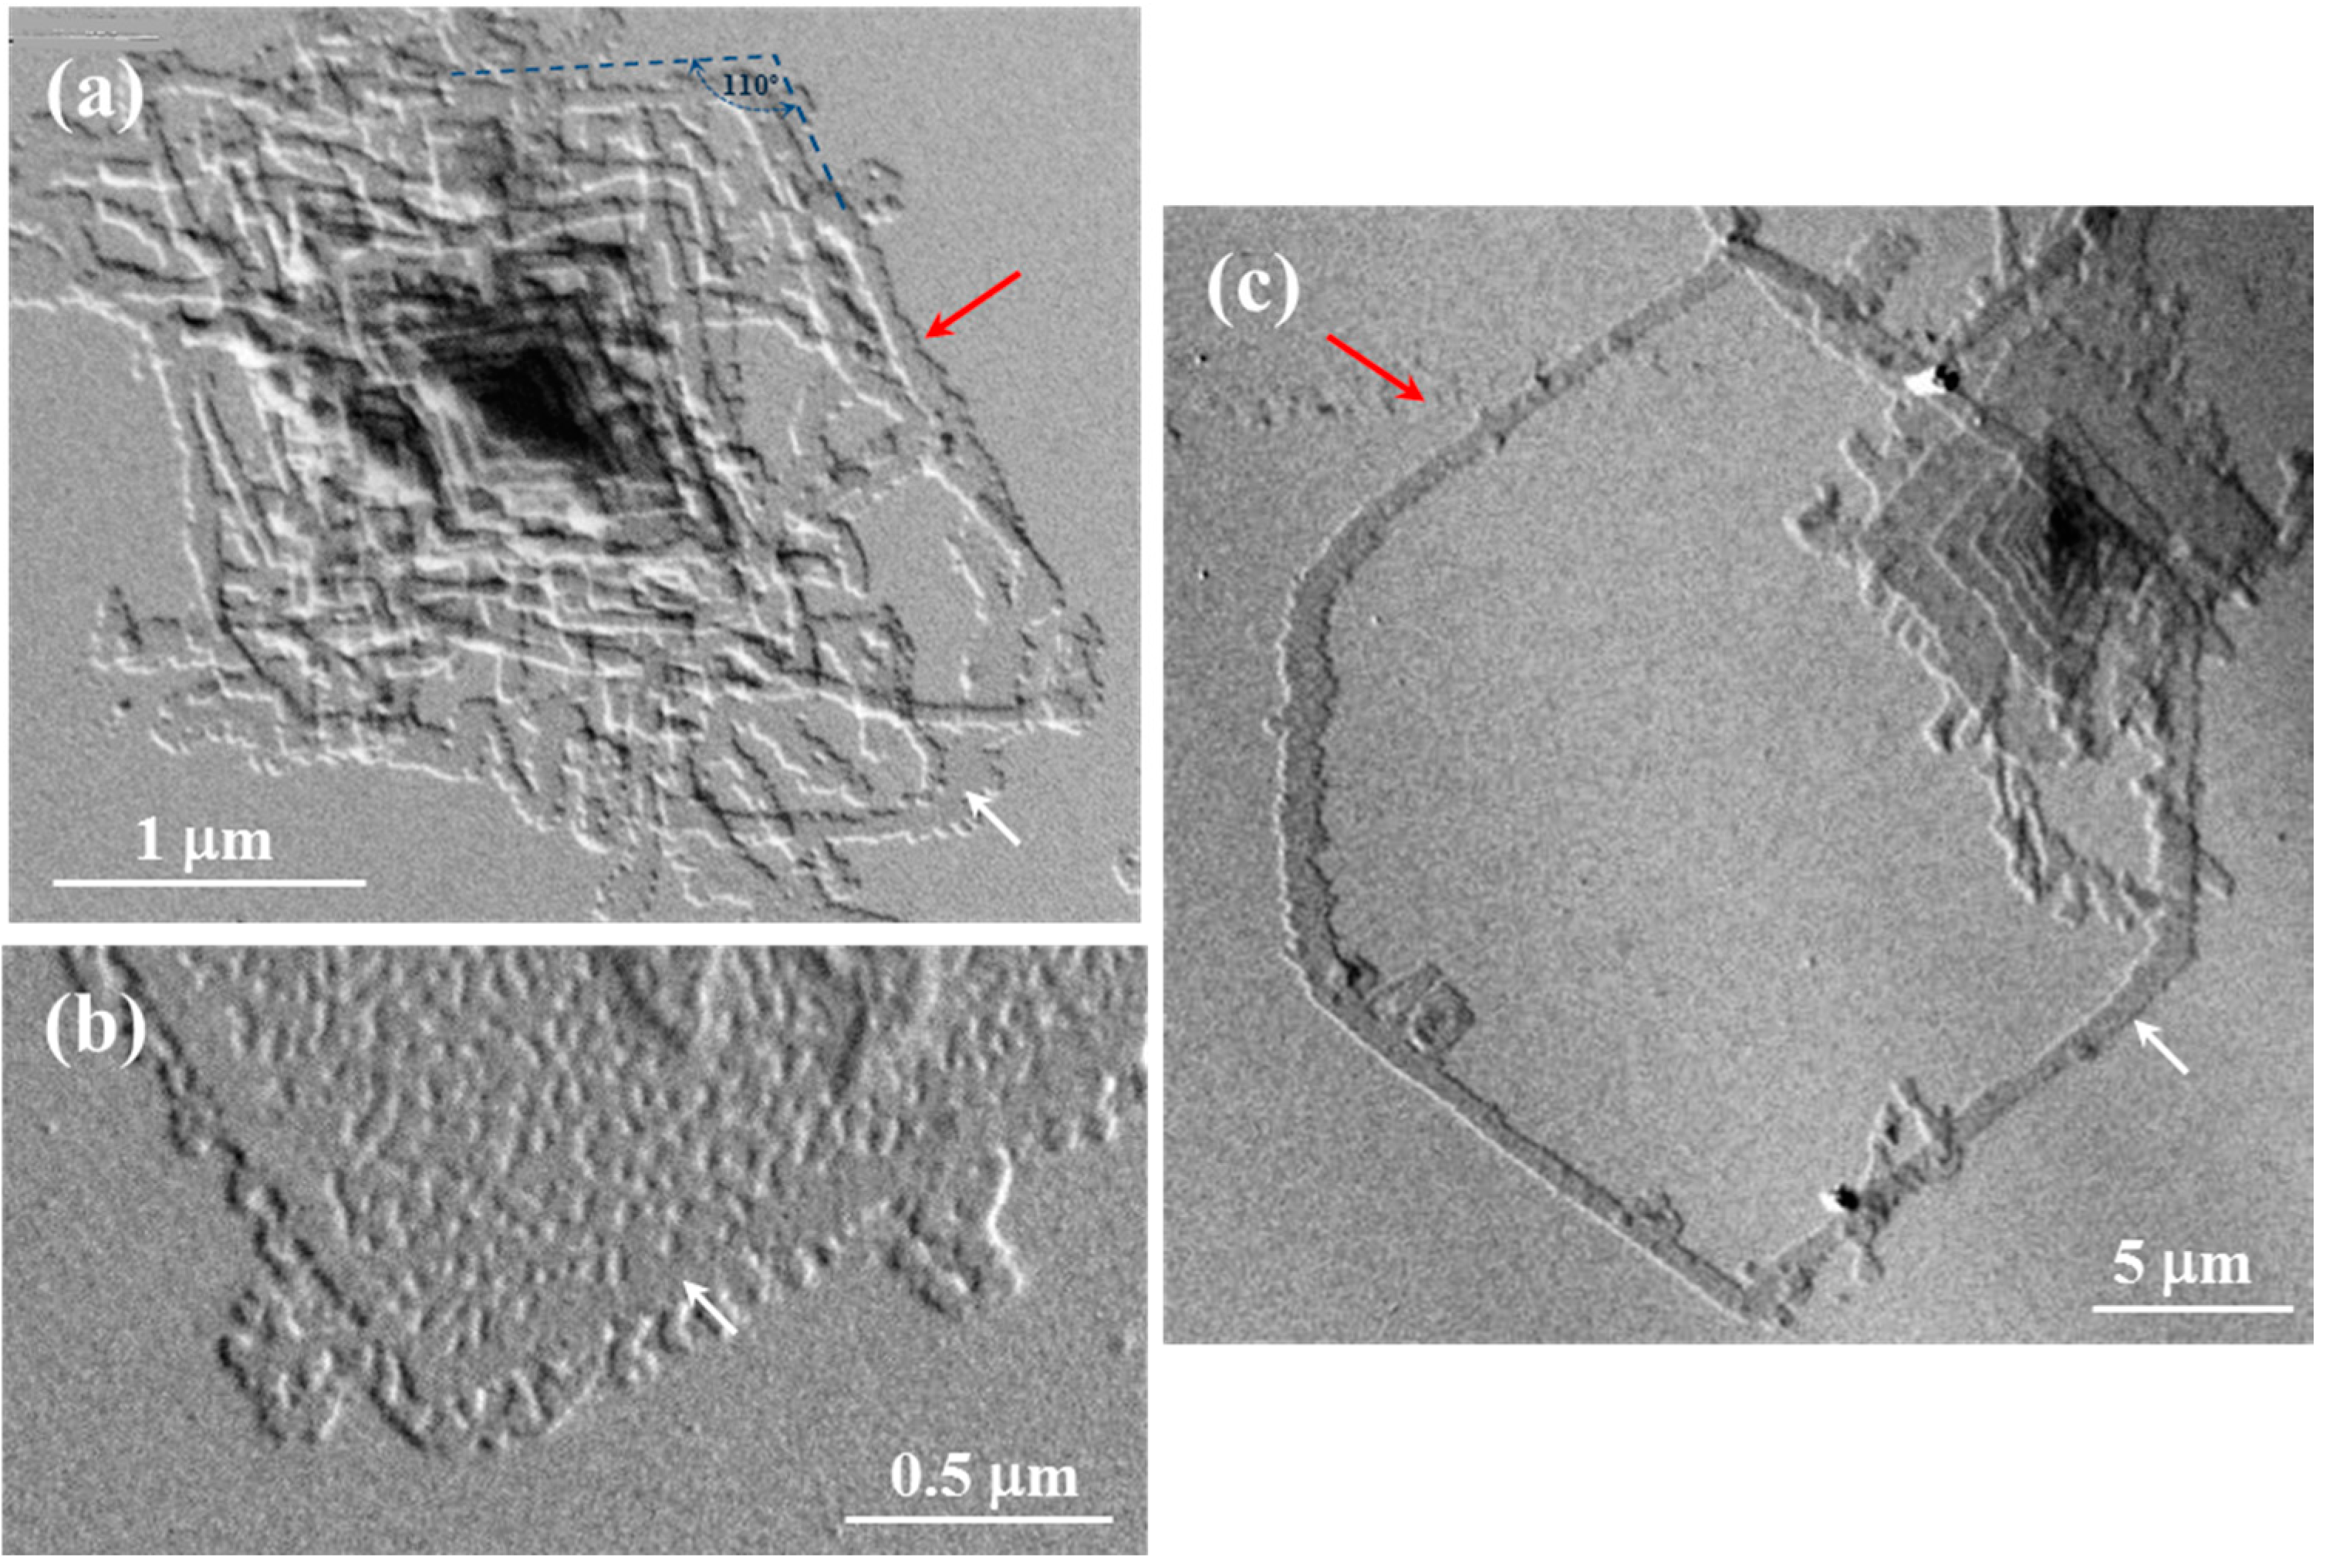
Figure 5. Note for example that the spiral growth of lamellar crystals shown in
Figure 5a is characterized by the presence of irregular edges and specifically the truncated faces appeared highly serrated as a consequence of the above indicated microsectorization. Striations on lamellar surfaces were also frequently observed (
Figure 5b). Specifically, they appeared only on the {110} sectors and formed an angle close to 45° with the corresponding growth face. This value differs from the angle detected in PES 9,9 single crystals (
Figure 3b), a feature that may suggest a different folding topology.
Figure 5b also shows the instability of the {010} growth faces, which appeared again more serrated (blue arrow) or clearly curved (red arrow).
Figure 5.
Transmission electron micrographs showing lamellar crystals of COPES 9,7/9 crystallized from 1,6-hexanediol at 37 °C having highly irregular {010} faces (a) and frequent striations onto the lamellar surface (b).
Figure 5.
Transmission electron micrographs showing lamellar crystals of COPES 9,7/9 crystallized from 1,6-hexanediol at 37 °C having highly irregular {010} faces (a) and frequent striations onto the lamellar surface (b).
3.2. Electron Diffraction Data of PES 9,7, PES 9,9, and COPES 9,7/9 Samples
A single type of electron diffraction (ED) pattern was observed for both homopolyesters and even for the copolyester with similar azelate/pimelate ratio (
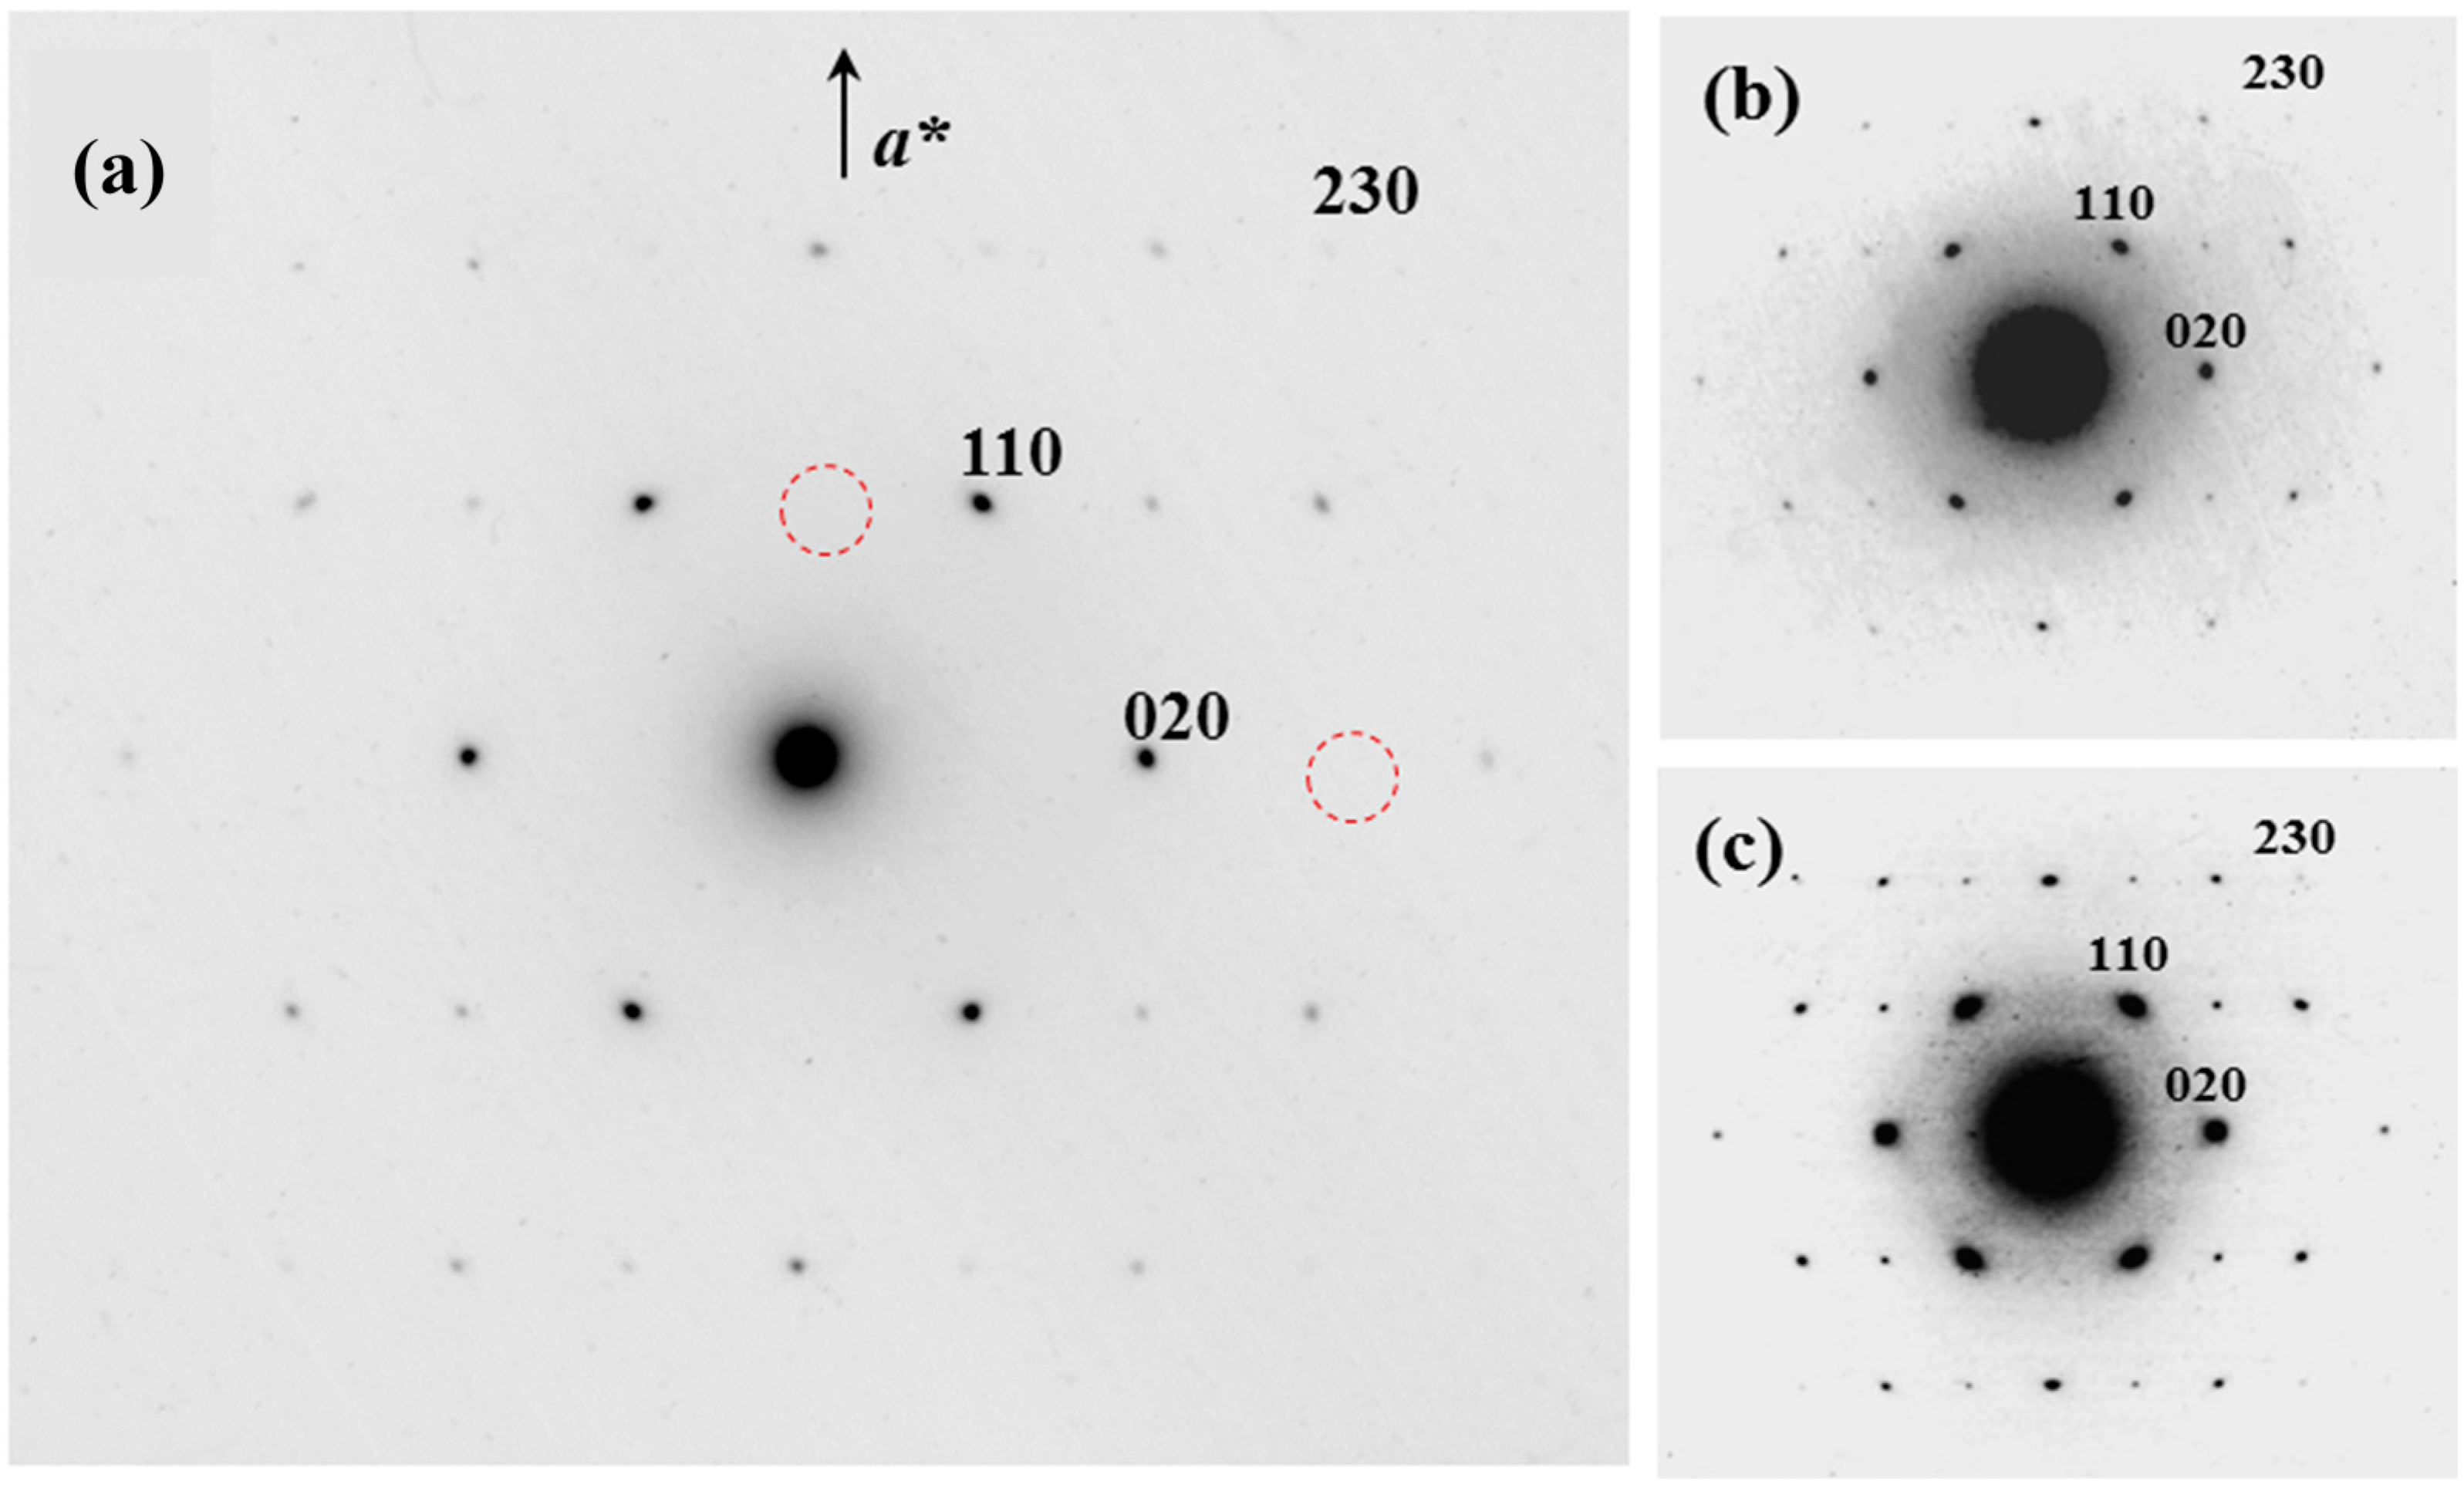
Figure 6) despite the relatively wide range of assayed crystallization conditions and solvents. Polymorphism must therefore be discarded for the three studied samples. Electron diffraction patterns showed only
hk0 reflections and pointed out a typical molecular chain orientation perpendicular to the crystal basal plane. Consequently, a molecular folding can be inferred by considering the molecular weight of the samples and the relatively small lamellar thickness deduced from the crystal shadows.
Figure 6.
The hk0 electron diffraction pattern of PES 9,7 (a); COPES 9,7/9 (b); and PES 9,9 (c) lamellar crystals obtained from 1,6-hexanediol solutions at crystallization temperatures of 50, 37, and 45 °C for (a), (b) and (c), respectively. Systematic absences are observed for h00 and 0k0 reflections with odd values for the h and k indices as shown by the red dashed circles in (a).
All reflections observed in the ED patterns could always be indexed according to rectangular unit cells (
Table 1) with dimensions similar to those of polyethylene and polyesters defined by an all-trans molecular conformation and a unit cell containing only two molecular chains. Thus,
a and
b parameters were close to 0.500 and 0.740 nm, respectively. In all cases, the patterns were characterized by systematic
h00 and 0
k0 absences for odd
h and
k values that indicate the existence of translational symmetry elements.
Table 1.
Calculated and measured electron diffraction spacings d (nm) for PES 9,7, PES 9,9, and COPES 9,7/9.
Table 1.
Calculated and measured electron diffraction spacings d (nm) for PES 9,7, PES 9,9, and COPES 9,7/9.
| Index a | dcalc | dmeasured b | dmeasured b | dmeasured b |
|---|
| PES 9,7 | PES 9,9 | COPES 9,7/9 |
|---|
| 110 | 0.414 | 0.416 vs | 0.413 vs | 0.416 vs |
| 020 | 0.370 | 0.370 vs | 0.370 vs | 0.370 vs |
| 120 | 0.297 | 0.298 w | 0.297 w | 0.298 w |
| 200 | 0.250 | 0.247 m | 0.250 m | 0.247 m |
| 210 | 0.234 | 0.233 vw | 0.237 vw | 0.233 vw |
| 130 | 0.221 | 0.222 m | 0.219 m | 0.222 m |
| 220 | 0.207 | 0.208 w | 0.208 w | 0.208 w |
| 040 | 0.185 | 0.185 w | 0.186 w | 0.185w |
| 230 | 0.176 | 0.176 vw | 0.178 vw | 0.176 vw |
| 310 | 0.163 | 0.162 vw | 0.165 vw | 0.163 vw |
Correlation of bright field micrographs and selected area electron diffraction patterns indicates that single crystals were bounded by four {110} faces with two truncated {010} faces of variable dimensions, as aforementioned. The {110} growth faces formed angles between 110° and 112°, whereas a value close to 122–124° was measured between the {110} and {010} faces. Both angles are in agreement with those calculated from the dimensions of the planar unit cells (i.e., 112 and 124°).
3.3. Annealing and Degradation of Single Crystals
Single crystals of the studied polyesters were obtained at temperatures very close to their dissolution temperature. Thus, solution-grown lamellae suspended in the selected solvent could be annealed in a very restricted temperature range (e.g., 55 °C for the two homopolyesters and 50 °C for the copolyester).
Figure 7a,c show lamellae of PES 9,7, as a representative sample, after being submitted to the indicated annealing process. Interestingly, framed crystals (see white arrows) were observed independently of the initial lamellar morphology (
i.e., the slightly truncated rhombic crystals and the pseudohexagonal crystals obtained at 40 °C and 50 °C, respectively) as a consequence of both a limited thickening, that only involved the crystal edges, and the complete dissolution of the thinner and inner part of the lamellae. At intermediate annealing times a partial dissolution was produced (
Figure 7b) and holes were clearly detected inside the crystals while edges remained logically practically unaltered.
Figure 7.
Transmission electron micrographs showing lamellar crystals of PES 9,7 crystallized from 1,6-hexanediol at 40 °C (a,b) and 50 °C (c) after being kept for 3 (a,c) and 2 (b) days in the crystallization media at 55 °C. Red arrows point out the characteristic rhombic and pseudohexagonal crystals developed at each crystallization temperature. Note that only the corresponding frames can be observed after the annealing process.
Enzymatic degradation of polymer single crystals can be initiated by a fast attack at the chain folds in the amorphous lamellar surfaces to evolve subsequently at a slower rate when the dense lamellar core is reached. Alternatively or simultaneously, degradation can also be initiated from the crystal edges, leading to a systematic decrease of the crystal size in the lamellar plane. In some cases, lamellar sectors evidenced a different susceptibility to enzymatic attack, a feature that was related to the existence of distinct chain folds [
34].
Enzymatic degradation of the lamellar crystals was followed in a lipase medium, a similar pattern for the studied copolyester and the two homopolymers being observed.
Figure 8 shows the morphology of a representative pseudohexagonal crystal with well-developed {110} and {010} sectors after being exposed for 3 h to the degradation medium. Lamellar edges can be clearly detected despite the crystal being practically fully degraded, a feature that is in agreement with their high stability as deduced from annealing experiments. Enzymatic attack was therefore initiated in the lamellar surface giving rise to the complete dissolution of the inner part of the lamellae at the last stage of degradation. The selected enzyme was able to degrade the close packed crystalline region and furthermore did not show a preferential attack over the {110} or {010} sectors. In this way, the expected differences in the chain folding on the indicated sectors were not relevant for the studied samples.
Figure 8.
Transmission electron micrograph of PES 9,9 lamellar crystals crystallized from 1,6-hexanediol at 45 °C and exposed for 3 h to the enzymatic degradation medium.
Figure 8.
Transmission electron micrograph of PES 9,9 lamellar crystals crystallized from 1,6-hexanediol at 45 °C and exposed for 3 h to the enzymatic degradation medium.
3.4. X-ray Fiber Diffraction Data of PES 9,7, PES 9,9, and COPES 9,7/9 Samples
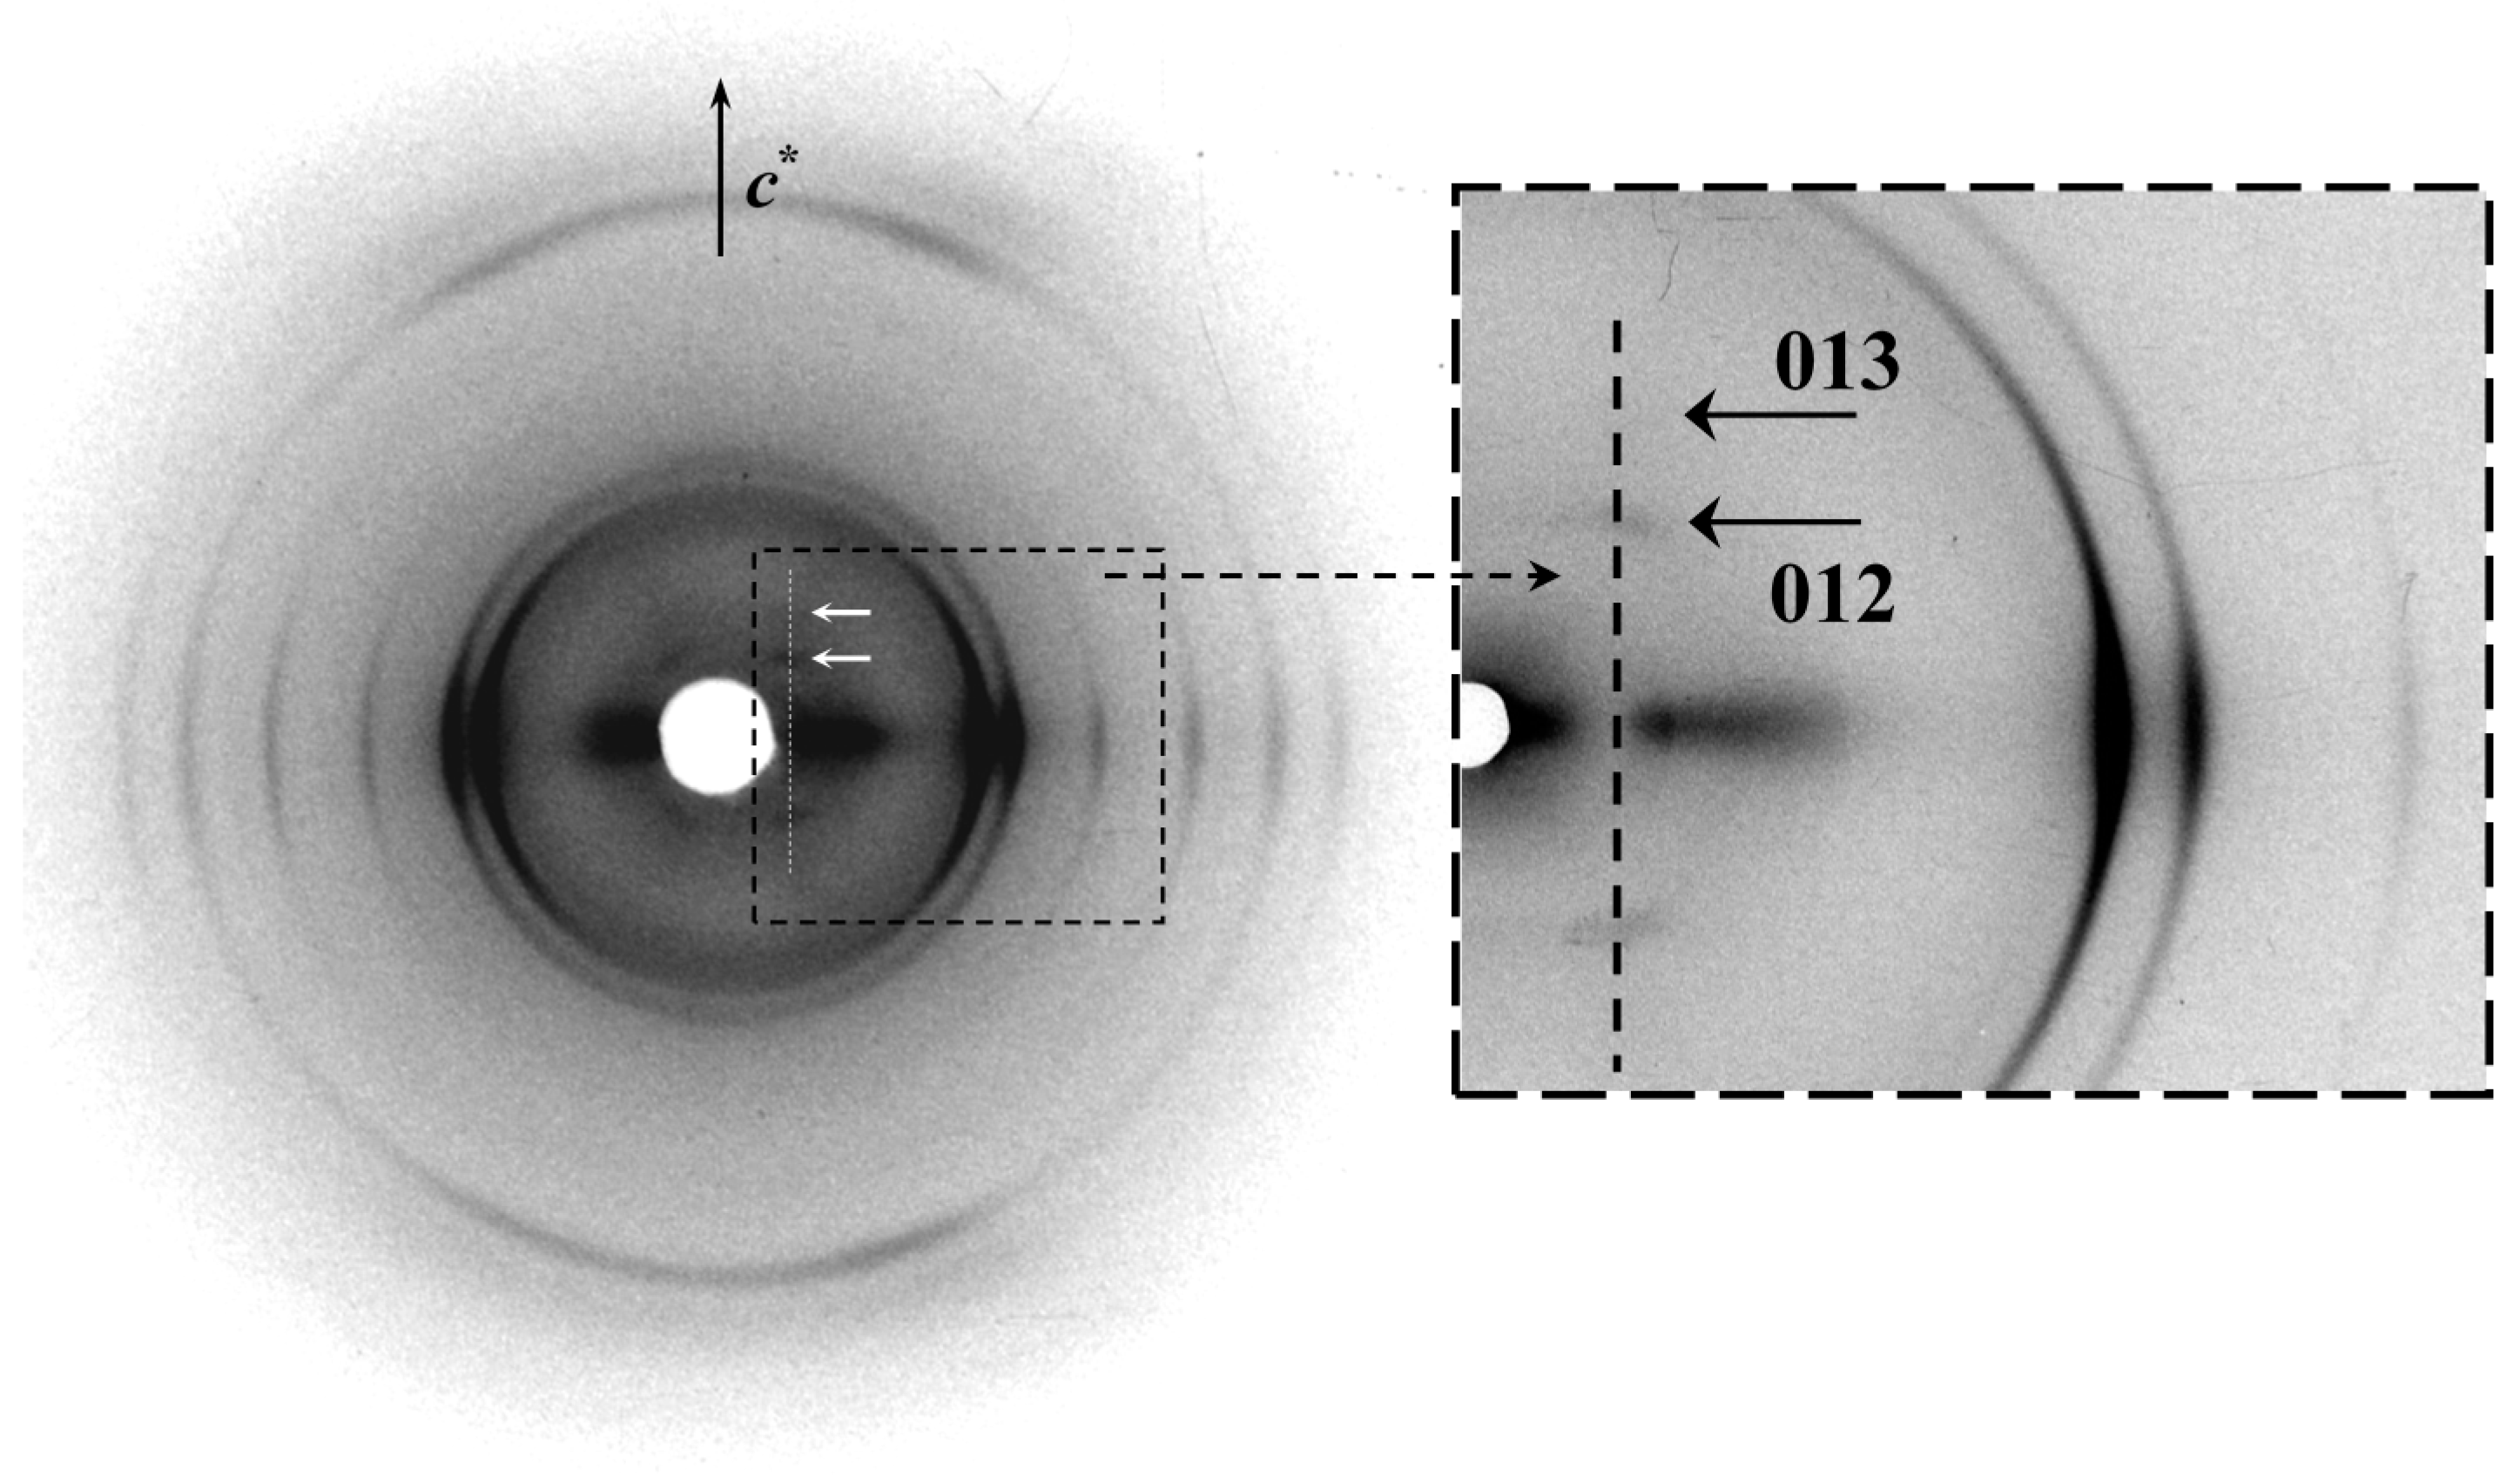
X-ray diffraction patterns of annealed fibers of the two homopolymers showed a high degree of orientation (
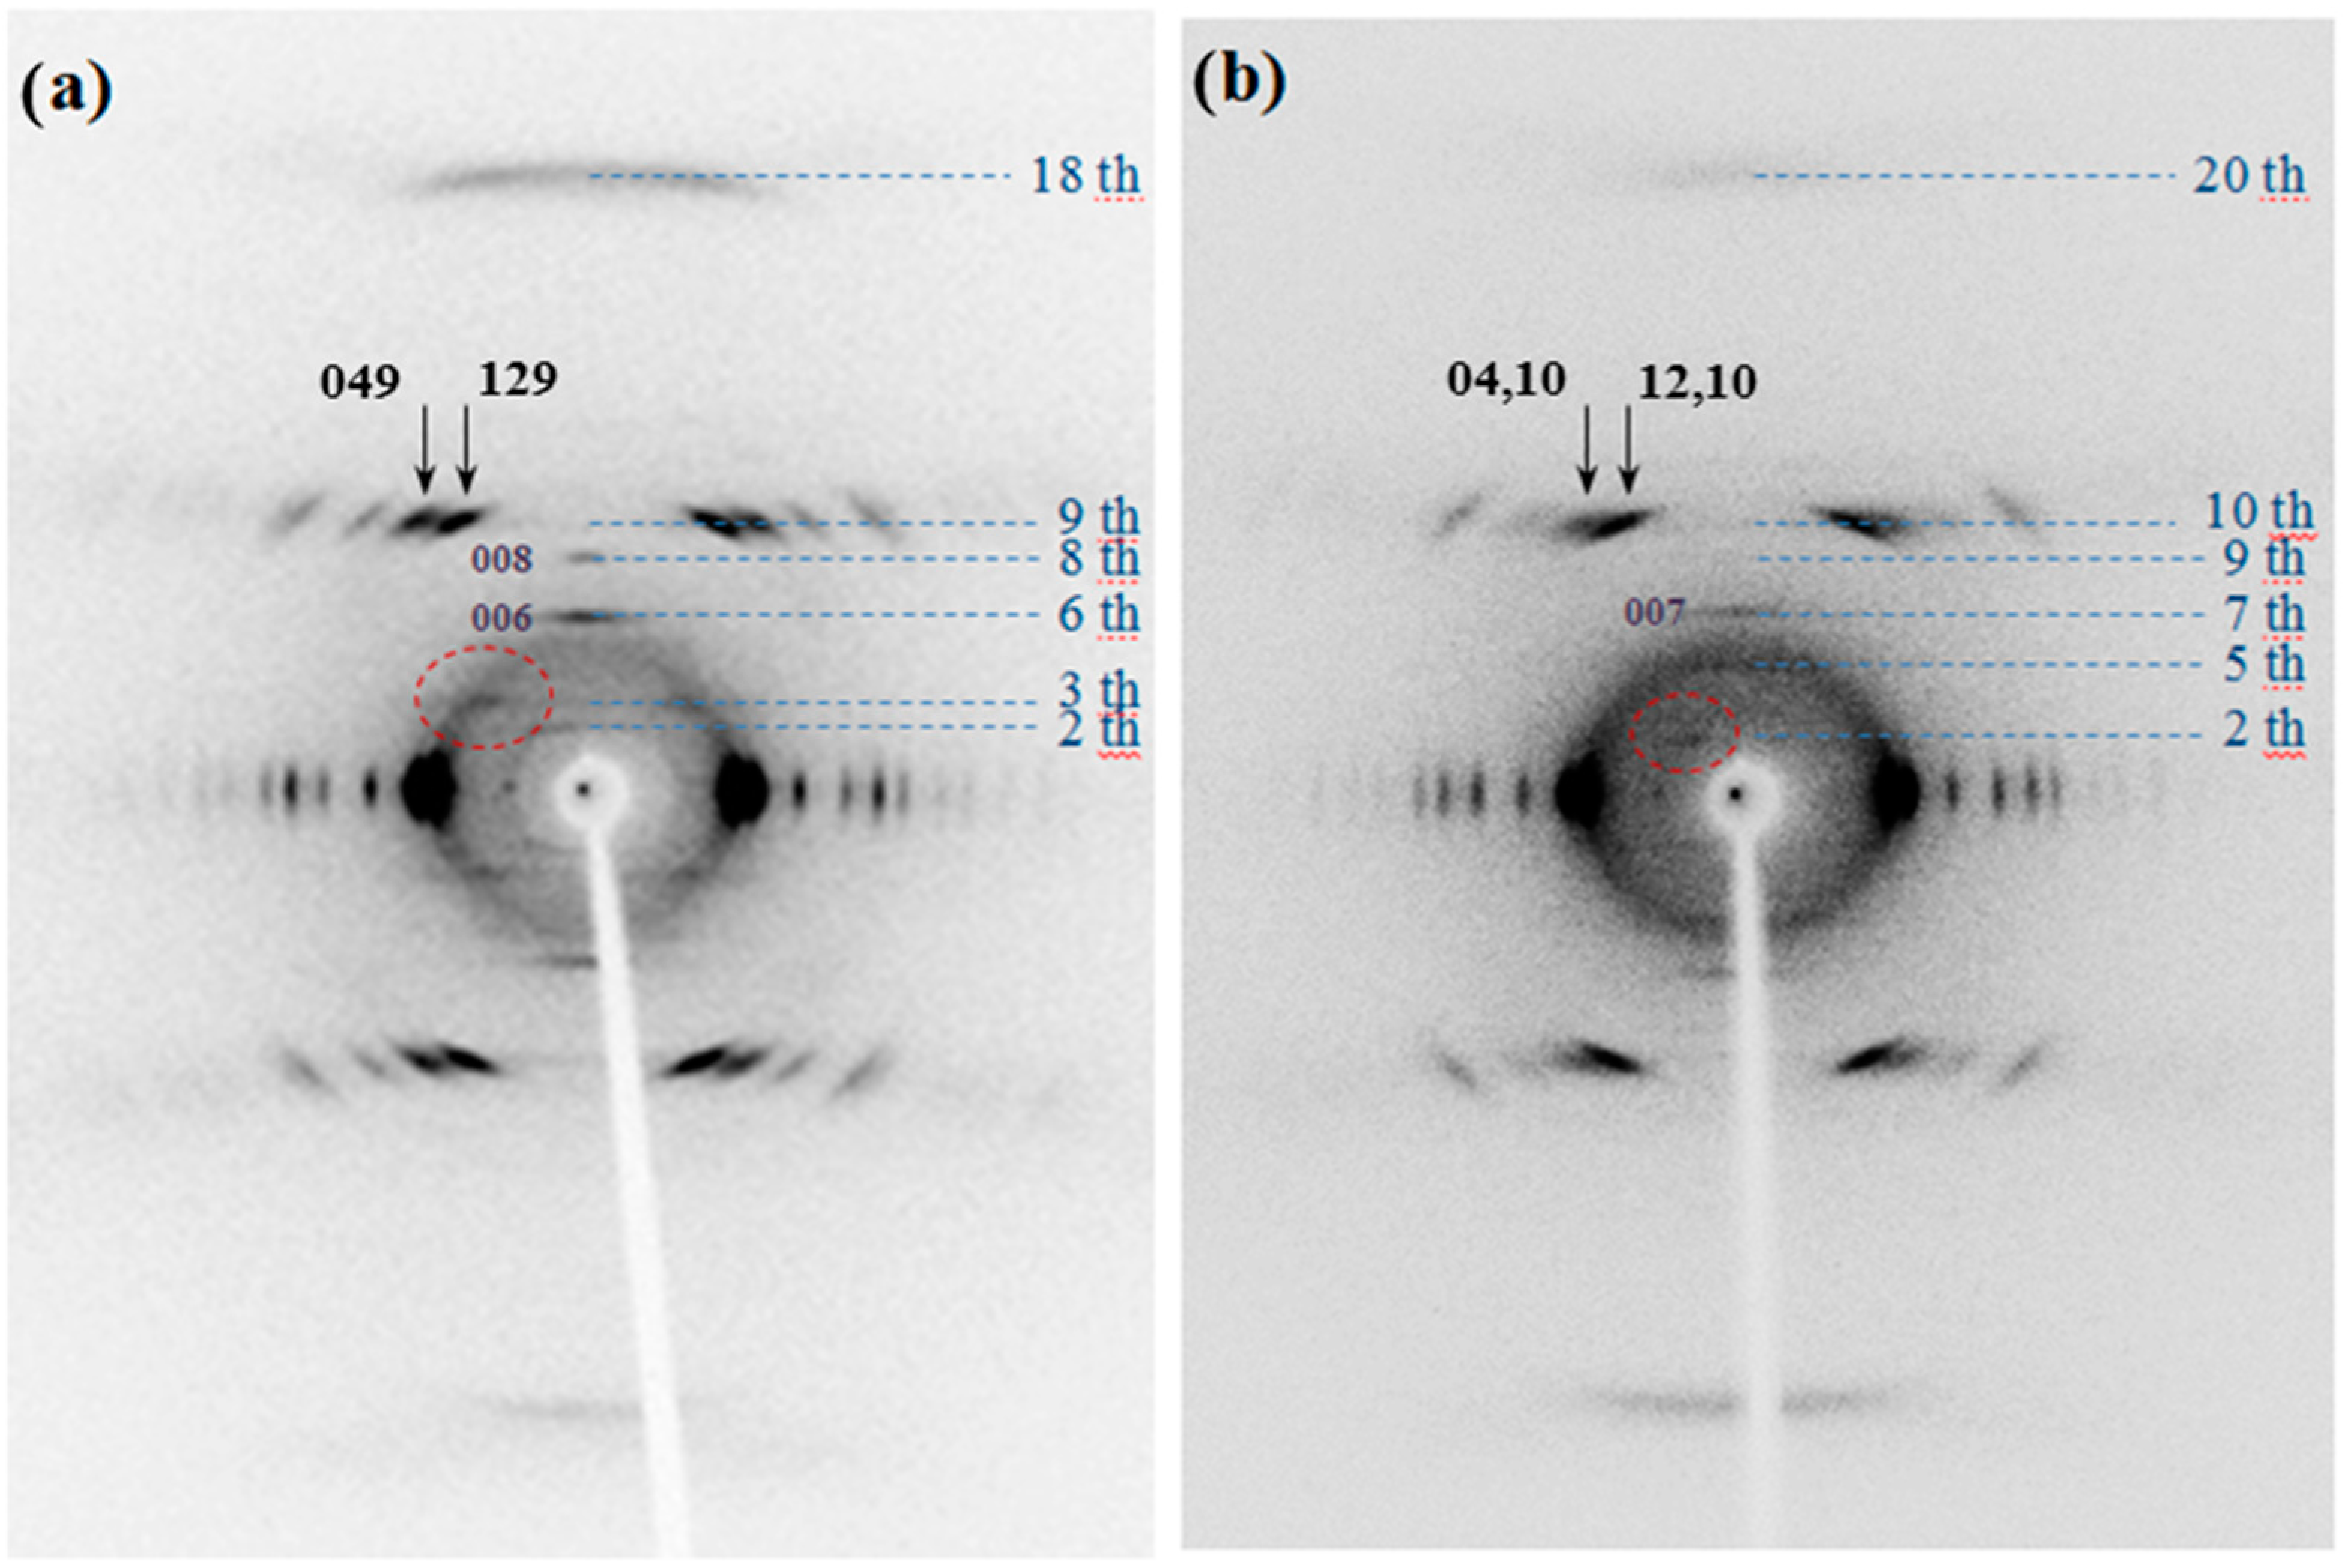
Figure 9). Reflections extended over a considerable number of layer lines and revealed some structural disorder along the chain axis. The weak streaks that can be detected in the different layer lines must be highlighted, although high intense and well defined spots were also characteristic for the 9th and 10th layer lines of PES 9,7 (
i.e.,
hk9 reflections) and PES 9,9 (
i.e.,
hk10 reflections), respectively. The high intensity of reflections appearing on these layer lines are related to the typical zig-zag nature of polymethylene chains with an extended conformation (
i.e., 0.240–0.250 nm should correspond to the layer line spacing). In addition, close to meridional reflections on the 18th and 20th layer lines were also detected with high intensity due to the indicated zig-zag molecular conformation.
Figure 9.
Fiber X-ray diffraction patterns of melt spun PES 9,7 (a) and PES 9,9 (b) fibers.
Figure 9.
Fiber X-ray diffraction patterns of melt spun PES 9,7 (a) and PES 9,9 (b) fibers.
Patterns also show some well-defined meridional reflections that suggest an orthorhombic unit cell. Note the 006 and 008 reflections in the fiber pattern of PES 9,7 (
Figure 9a) and the 005 and 007 reflections in the pattern of PES 9,9 (
Figure 9b). Spacings of the indicated reflections pointed out chain axis periodicities close to 2.25 and 2.50 nm for the pimelate and azelate derivatives, respectively. These values are in full agreement with an all-trans molecular conformation and a chain axis periodicity that involves only one chemical repeat unit.
Strong
hk0 equatorial reflections appear at practically the same spacings (
Table 2) as those appearing in electron diffraction patterns and consequently conventional polyester orthorhombic unit cells with
a and
b parameters close to 0.50 and 0.74 nm, respectively can be postulated. Nevertheless, the streaks and the relatively weak reflections observed in some layer lines (see red circles in
Figure 9) suggest a cell with greater dimensions as previously reported for some poly(alkylene dicarboxylate)s [
26,
27,
28,
29]. Note also that these off meridional reflections can clearly be detected in diffraction patterns recorded from oriented films due to their greater intensity (
Figure 10). Specifically, significant reflections that agree with an orthorhombic lattice with a double
b axis parameter (
i.e., 1.48 nm) were detected and consequently the final indexing summarized in
Table 2 is based on the larger unit cell. In addition, it should be indicated that medium-angle equatorial signals with superlattice values have also been reported for other polyester lamellar crystals, with in these cases a rippling nature to the fold surface suggested as a potential explanation [
37,
38].
The chain axis projected structures of the two studied odd-odd polyesters are highly similar considering the intensities of hk0 reflections observed in the electron diffraction patterns and in the equator of the X-ray fiber patterns. Note also that the chain axis projection of the smaller (b = 0.74 nm) and the larger unit (b = 1.48 nm) cells should be equivalent.
Table 2.
Calculated and measured fiber X-ray diffraction spacings d (nm) for studied polyesters.
Table 2.
Calculated and measured fiber X-ray diffraction spacings d (nm) for studied polyesters.
| PES 9,7 | PES 9,9 |
|---|
| Index a | dcalc | dmeasured b | Index c | dcalc | dmeasured b |
|---|
| 120 | 0.414 | 0.416 vs E | 120 | 0.414 | 0.416 vs |
| 040 | 0.370 | 0.370 vs E | 040 | 0.370 | 0.370 vs |
| 140 | 0.297 | 0.298 w | 140 | 0.297 | 0.298 w |
| 200 | 0.250 | 0.247 m | 200 | 0.250 | 0.247 m |
| 220 | 0.234 | 0.233 vw | 220 | 0.234 | 0.233 vw |
| 160 | 0.221 | 0.222 m | 160 | 0.221 | 0.222 m |
| 240 | 0.207 | 0.208 w | 240 | 0.207 | 0.208 w |
| 080 | 0.185 | 0.185 w | 080 | 0.185 | 0.185w |
| 260 | 0.176 | 0.176 vw | 260 | 0.176 | 0.176 vw |
| 320 | 0.163 | 0.162 vw | 320 | 0.163 | 0.163 vw |
| 006 | 0.375 | 0.373 m | 005 | 0.500 | 0.505 vw |
| 008 | 0.281 | 0.283 w | 007 | 0.357 | 0.357 w |
| 129 | 0.214 | 0.214 s | 12,10 | 0.214 | 0.214 vs |
| 049 | 0.207 | 0.209 s | 04,10 | 0.207 | 0.209 m |
| 149 | 0.191 | 0.192 w | 14,10 | 0.191 | 0.194 vw |
| 229 | 0.172 | 0.170 m | 22,10 | 0.172 | 0.172 m |
| 00,18 | 0.125 | 0.123 m | 00,20 | 0.125 | 0.122 m |
Figure 10.
Fiber X-ray diffraction pattern of an oriented film of PES 9,9 with labelling of significant 01l reflections. The inset corresponds to a low intensity pattern that allows the two strongest equatorial reflections to be distinguished at 0.414 and 0.370 nm.
Figure 10.
Fiber X-ray diffraction pattern of an oriented film of PES 9,9 with labelling of significant 01l reflections. The inset corresponds to a low intensity pattern that allows the two strongest equatorial reflections to be distinguished at 0.414 and 0.370 nm.
Reflections detected in the strong 9th and 10th layerlines of PES 9,7 and PES 9,9 showed a remarkable distinctive feature concerning their relative intensities. Thus, 129 and 049 reflections had relatively similar intensities whereas 12,10 reflection was clearly more intense than 04,10 (see arrows in
Figure 9).
The measured densities of PES 9,7 and PES 9,9 fibers were 1.07 g/mL and 1.06 g/mL, respectively, which were fairly close to the values calculated (1.13 and 1.12 g/mL) from the deduced cell dimensions and a cell content of four chain segments. Nevertheless, some amorphous content logically exists as can be inferred from the lower experimental densities.
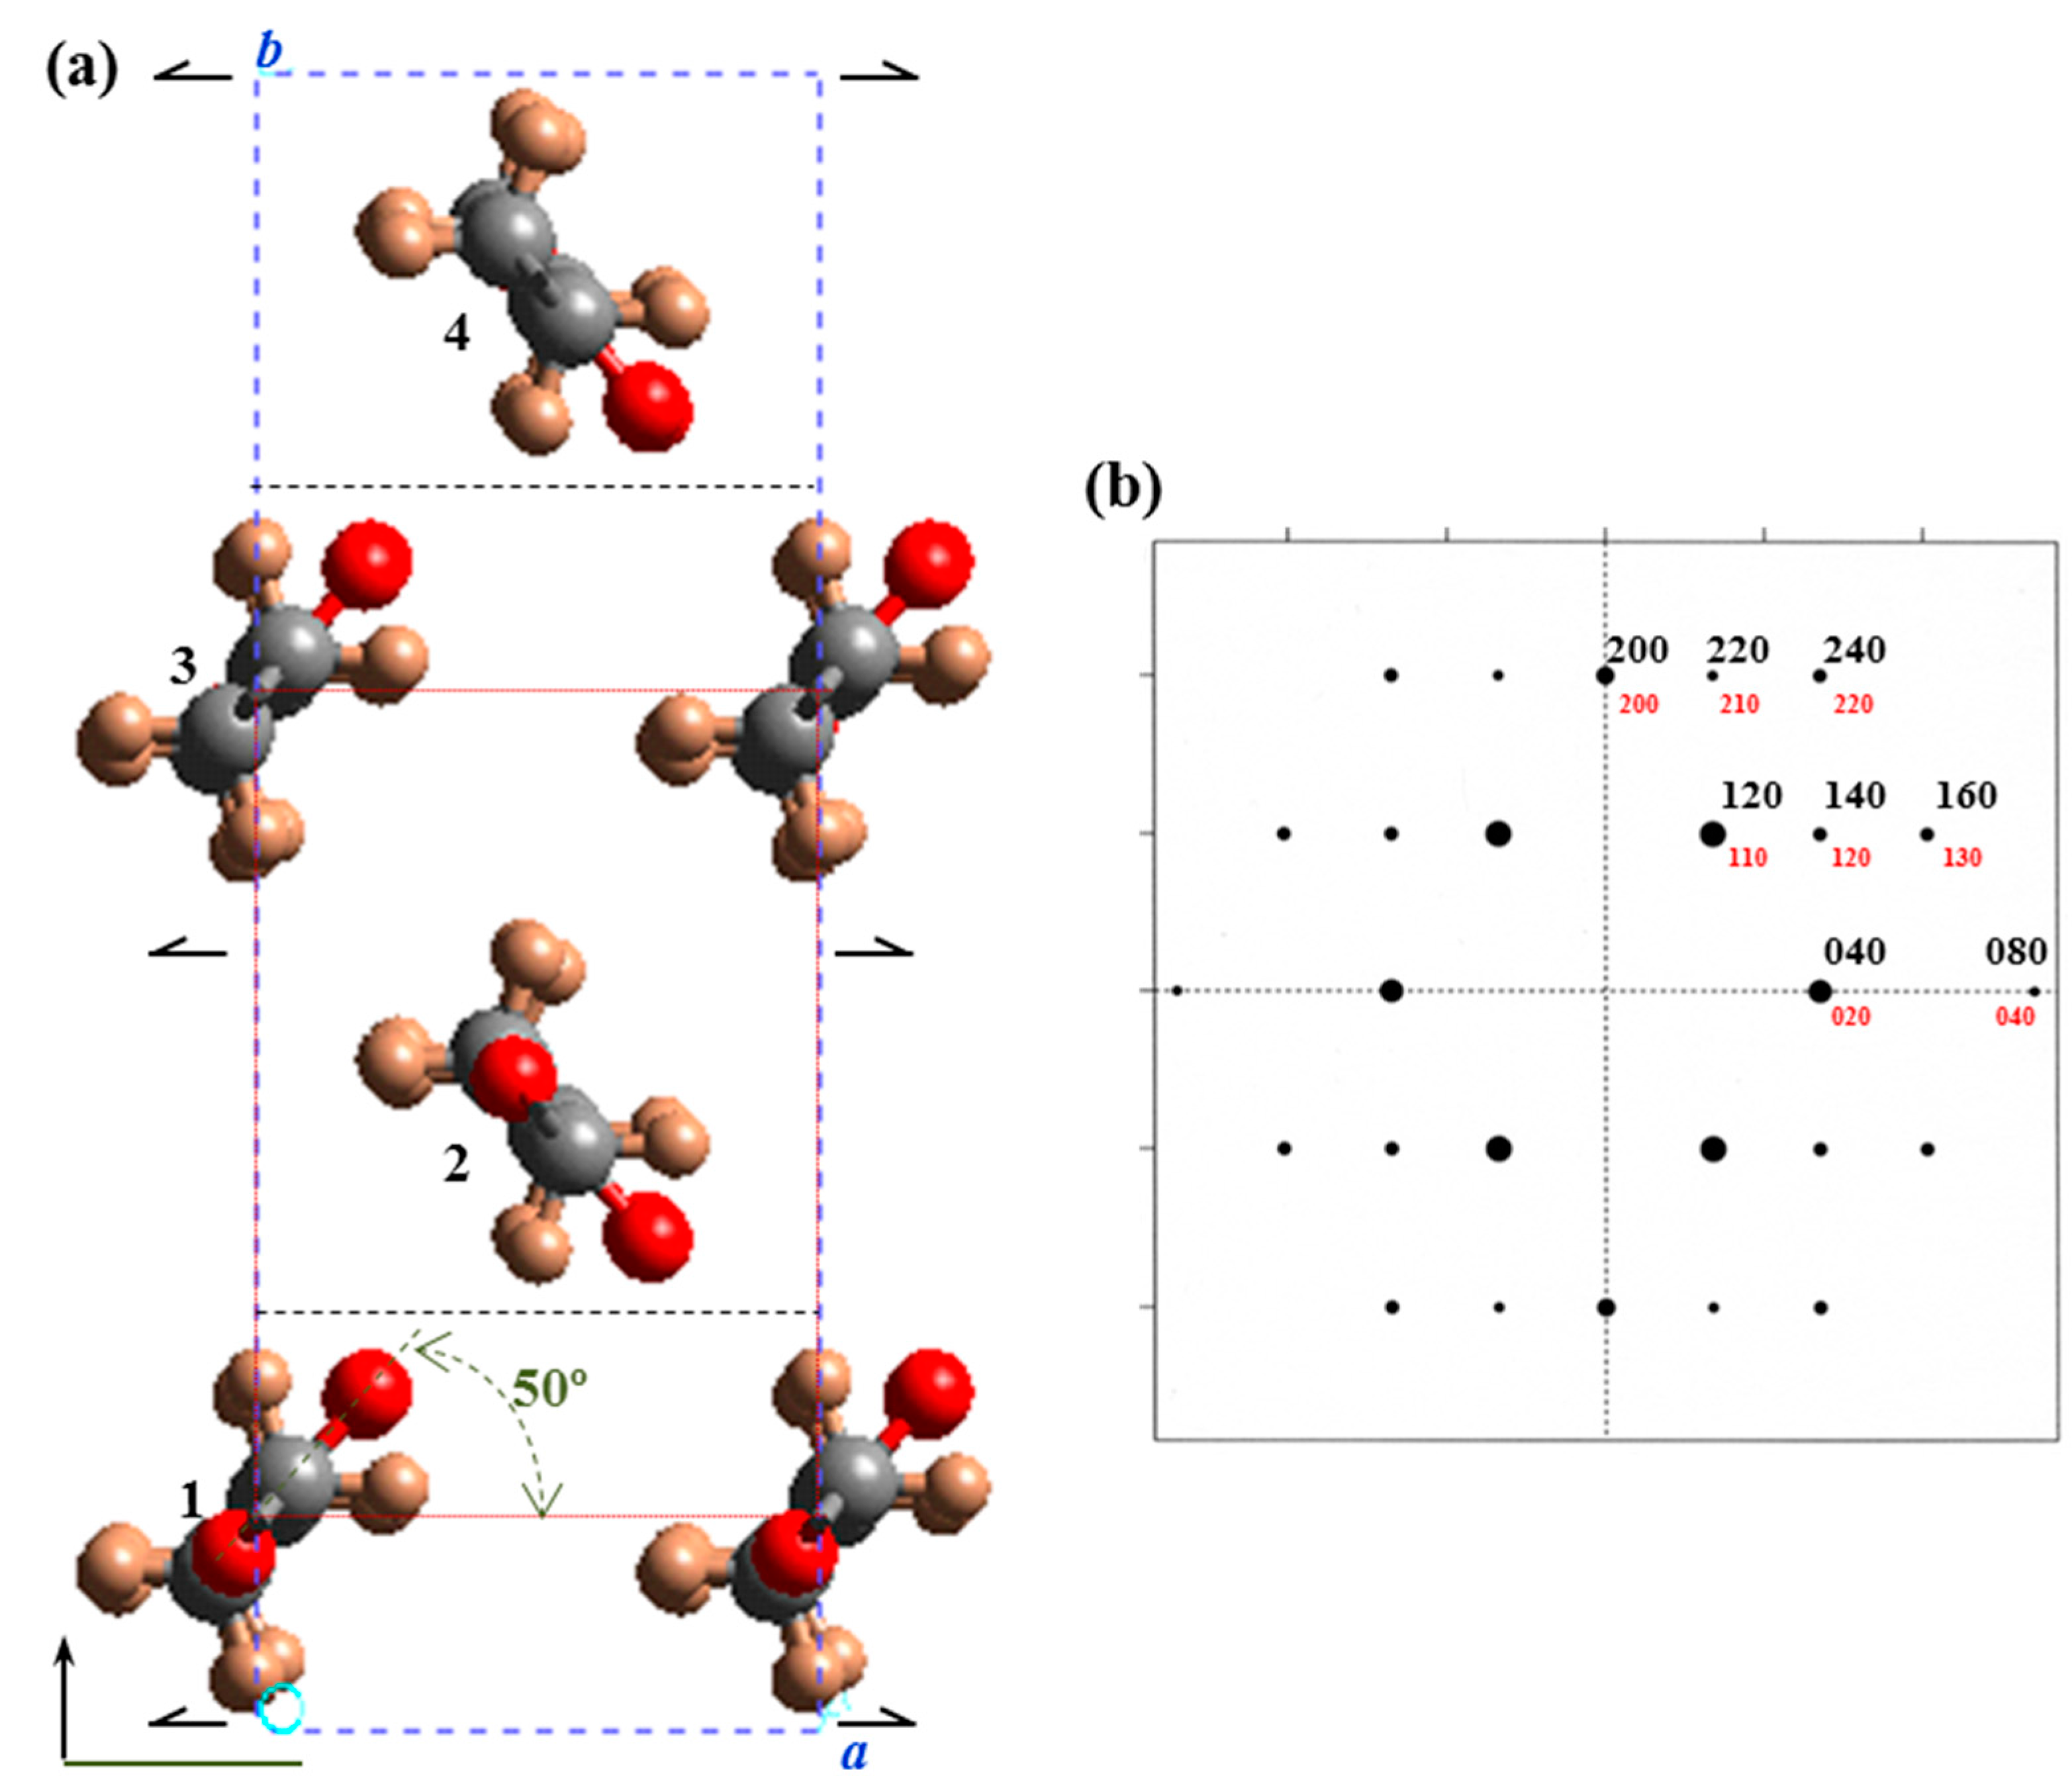
Odd-odd polyester molecules displaying an all-trans conformation have a 2
mm molecular symmetry with binary axes perpendicular to the molecular chain through the middle of diol and dicarboxylic acid units. Only one chemical repeat unit is involved in the chain axis periodicity due to the lack of translational symmetry elements (e.g.,
21 screw axis or
c glide plane). These molecules have all carbonyl groups pointing in the same direction unlike even-even, odd-even, and even-odd polyesters. In a rough approximation molecular packing was simulated considering the
hk0 electron diffraction pattern and the single rectangular unit cell (
b = 0.74 nm) containing only two molecular segments related by a binary axis and having an all-trans molecular conformation (
Figure 11). A relative good agreement between experimental and theoretical intensities was found for a setting angle close to ±50° with respect to the
a axis.
Figure 11.
(a) Projection along the c-axis of the molecular packing of PES 9,7 defined by a P21ab space group. For the sake of completeness the smaller unit cell containing only two molecular segments is also drawn (dotted red lines). Color code: Carbon, grey; oxygen, red; hydrogen, light brown. (b) Simulated hk0 electron diffraction pattern for the crystalline structure of PES 9,7 defined by a molecular setting angle of ±50°.
Fiber diffraction data and the observed systematic absences points out to a large unit cell (
b = 1.48 nm) and a
P21ab space group that implies a polar structure and allows the packing energy to be minimized by varying the chain axis shift between molecules 1 and 3 (
Figure 11a). Note that this feature is not possible with the smaller cell (
b = 0.74 nm and
P21am space group) since the indicated chains are not shifted. This restriction also precluded achieving a minimum concordance between simulated and experimental diffraction patterns when the small unit cells were considered.
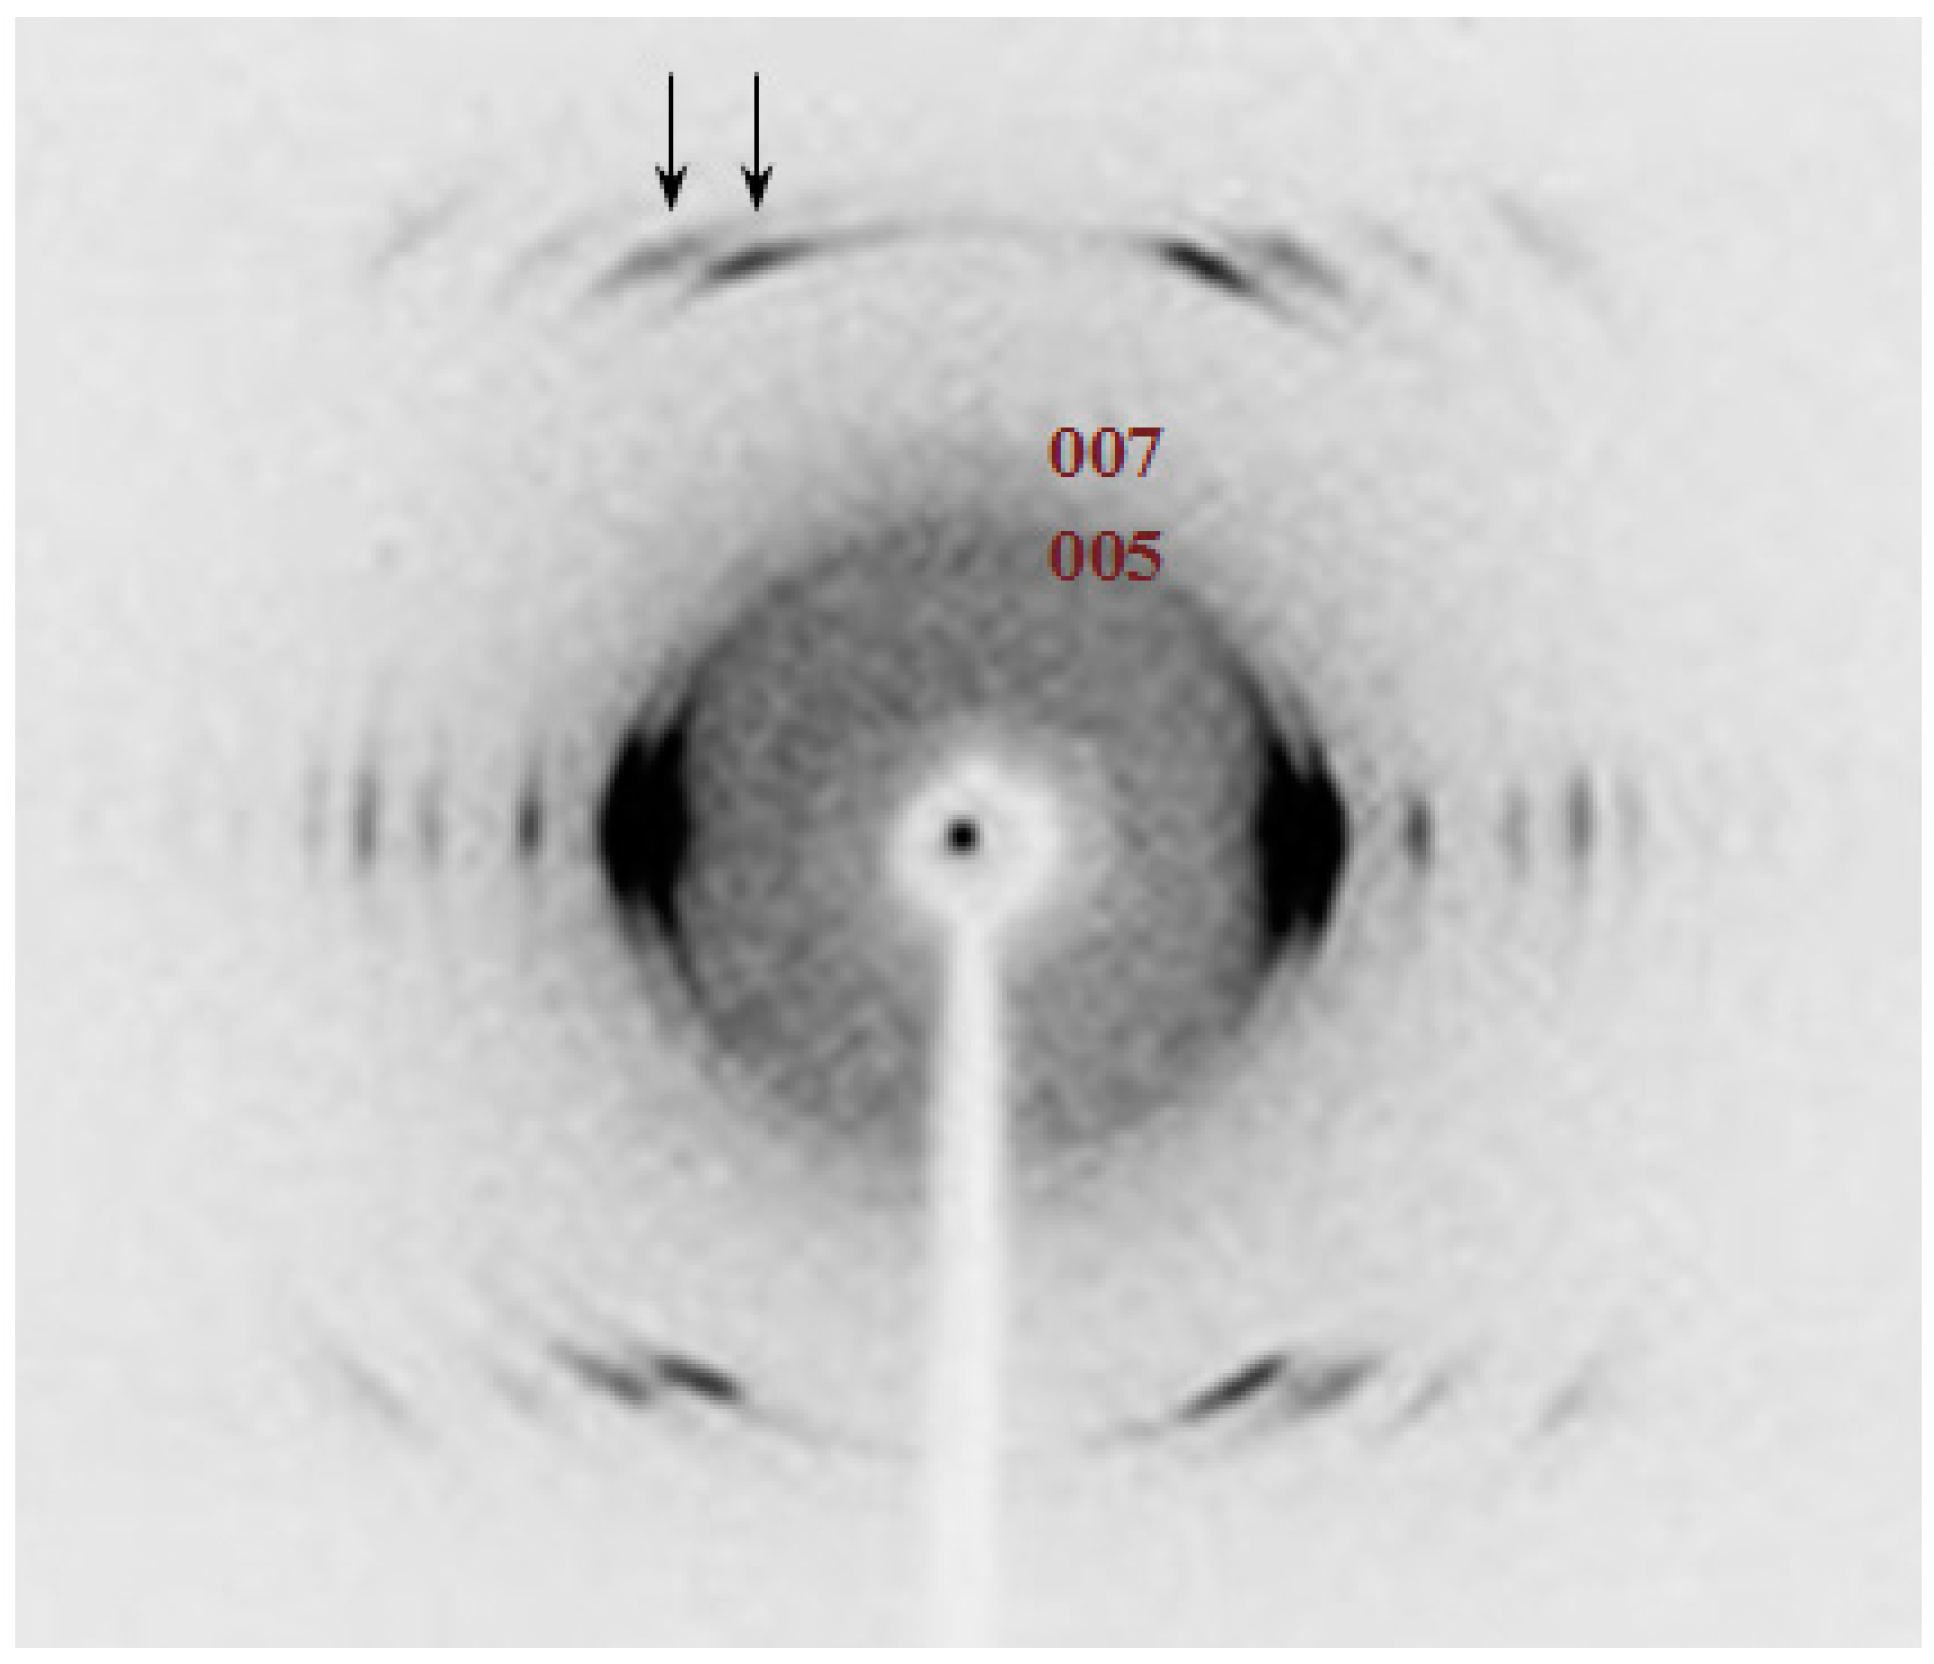
Figure 12 shows the X-ray diffraction pattern of the COPES 9,7/9 copolymer. It is interesting to remark the well-defined
hk0 reflections that indicate an ordered arrangement in chain axis projection as expected from the regular lamellar crystals and the corresponding electron diffraction patterns.
Figure 12.
Fiber X-ray diffraction patterns of a melt spun COPES 9,7/9 fiber. Arrows point out the 12l and 04l reflections.
Figure 12.
Fiber X-ray diffraction patterns of a melt spun COPES 9,7/9 fiber. Arrows point out the 12l and 04l reflections.
A disorder that concerns the disposition of molecular chains along the c axis is also observed since hk0 reflections of inner layer lines practically disappeared. Nevertheless, 00l weak reflections at spacings of 0.500 and 0.375 nm (i.e., at similar values of 005 and 007 reflections of PES 9,9) could be detected suggesting that the copolymer structure was mainly determined by the azelate units. In the same way, the relative intensity between 12l and 04l reflections observed in the 9th or 10th strongest layerline (9th or 10th depending on which was the dominant structure) was closer to that determined for PES 9,9 (i.e., the 04l reflection was much weaker than the 12l reflection).
3.5. FTIR Spectroscopic Data of PES 9,7, PES 9,9, and COPES 9,7/9 Samples
The random copolyester COPES 9,7/9 easily crystallizes from the melt state, as revealed by the oriented fiber patterns, and also from dilute solutions giving rise as explained above to highly regular lamellar crystals. Diffraction data points towards a predominant crystalline structure defined by the azelate units, but results are not fully conclusive. Therefore, FTIR spectra were recorded since well differentiated bands could be associated to the crystalline structure of each homopolyester (
Figure 13).
Figure 13.
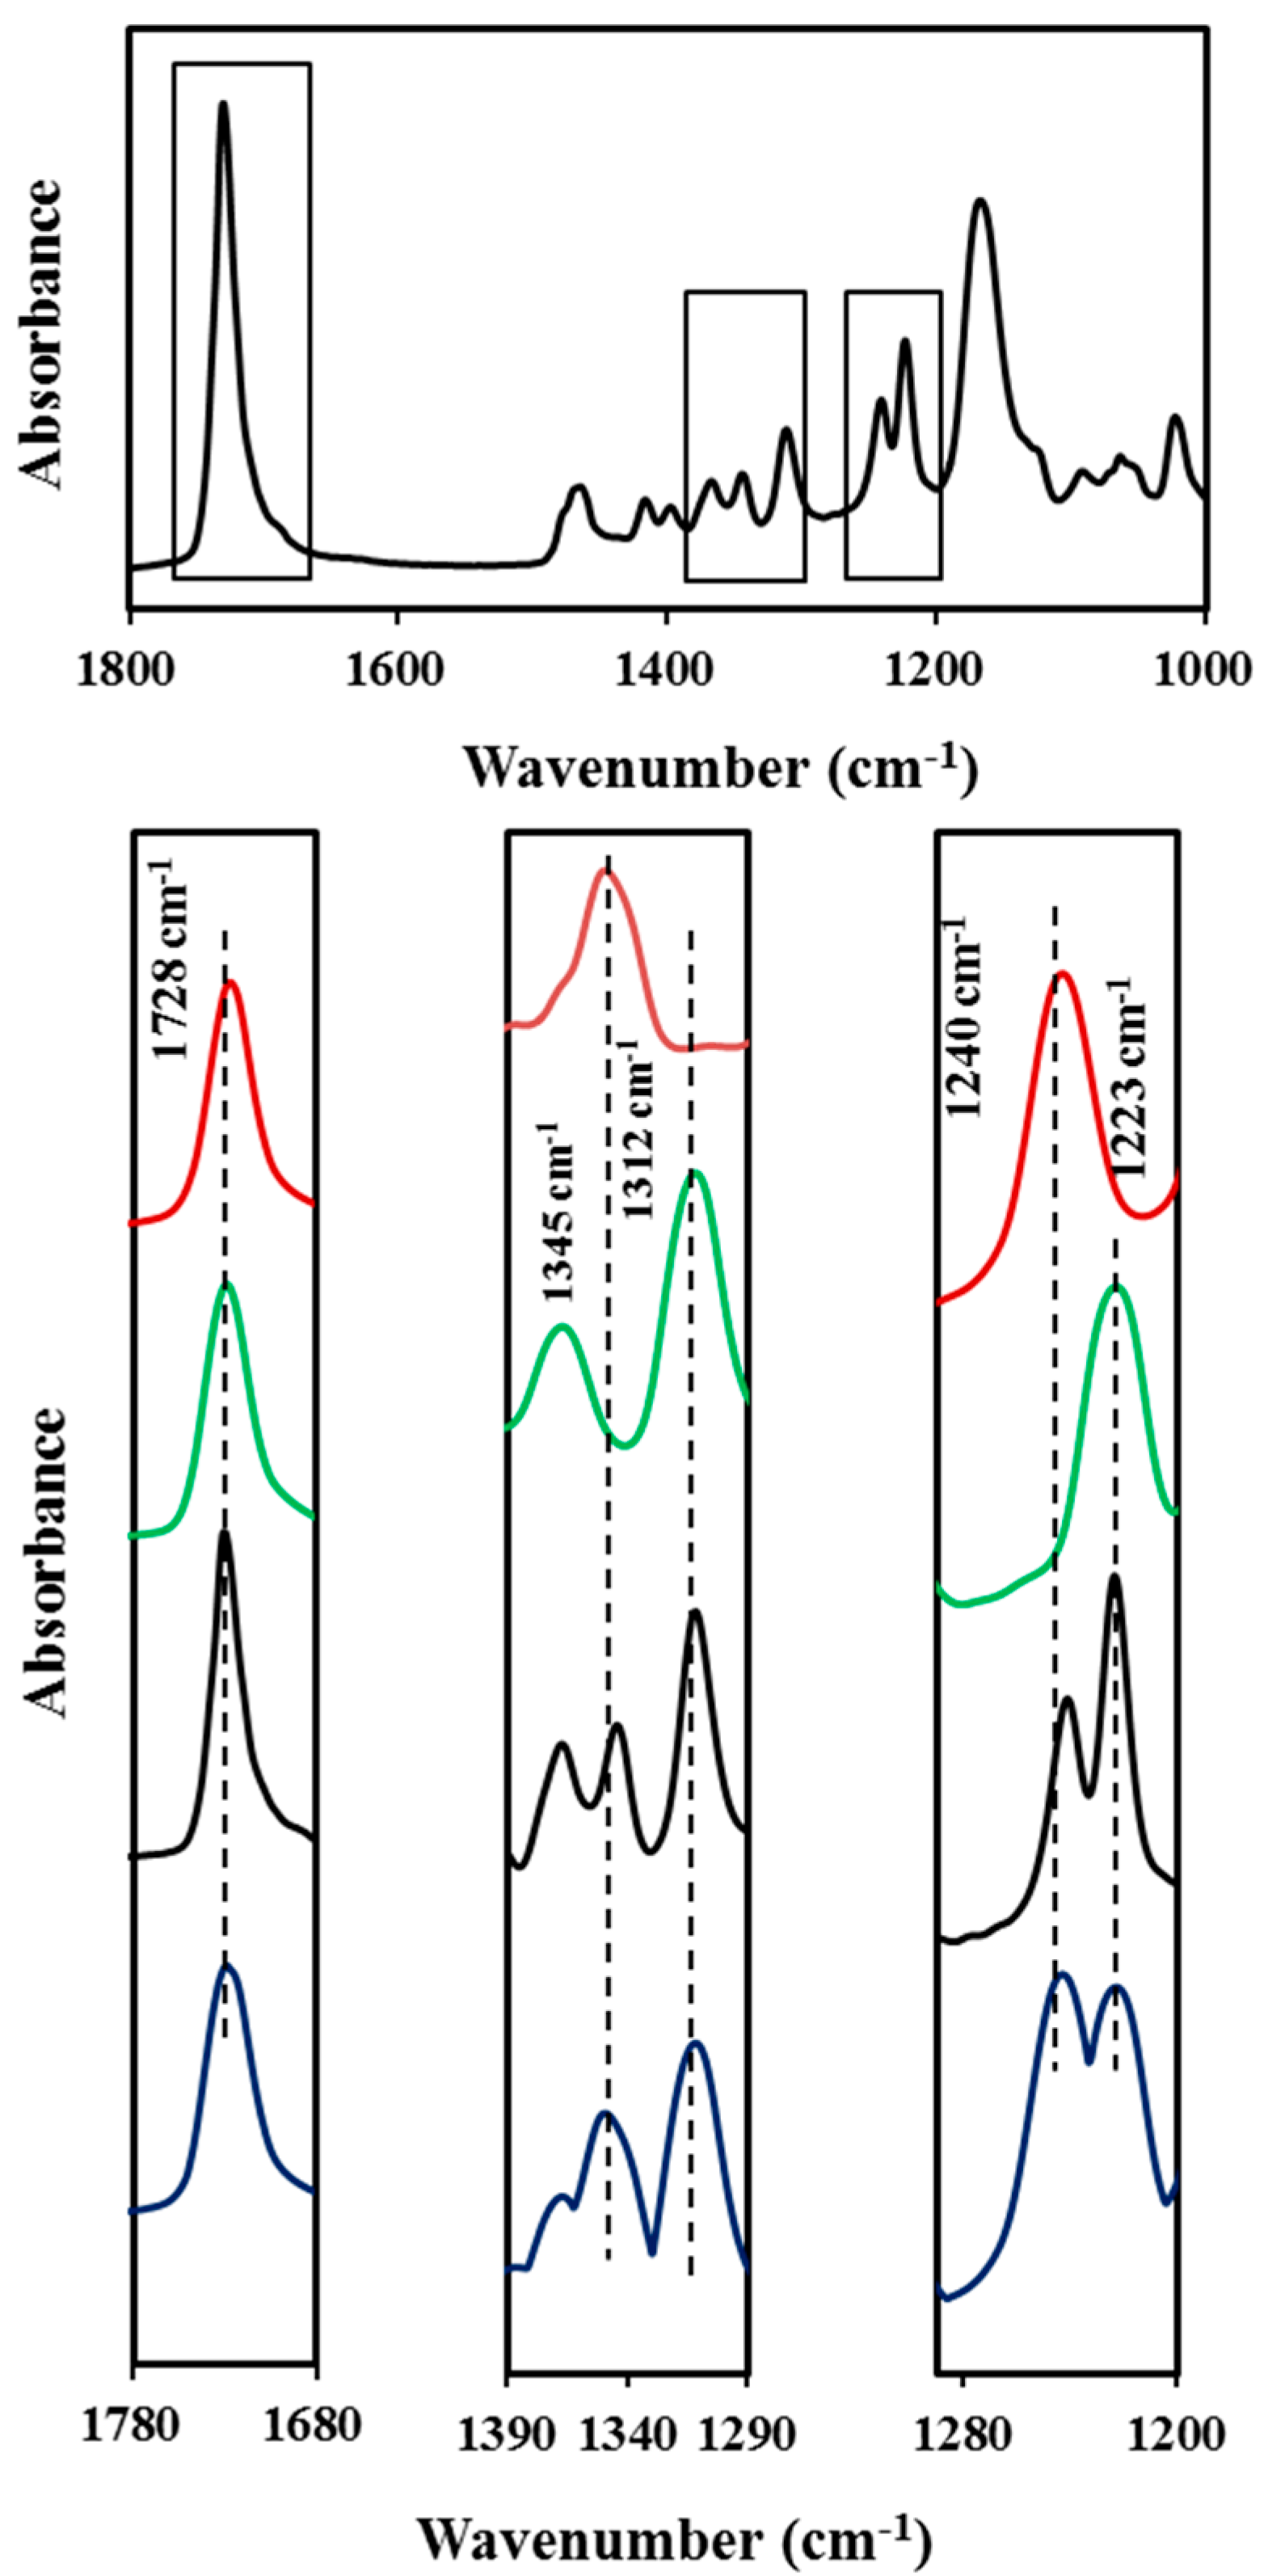
Absorbance FTIR spectra (1800–1000 cm−1 region) of COPES 9,7/9. Insets compare the common C=O band at 1728 cm−1 (left), the characteristic bands for azelate and pimelate derivatives at 1345 and 1312 cm−1 (medium) and the characteristic bands at 1240 and 1223 cm−1 (right) for pimelate and azelate derivatives. Absorbance scale has been increased in the medium and right insets in order to show more clearly the different peaks. Profiles correspond to PES 9,7 (red), PES 9,9 (green), COPES 9,7/9 (black) and an equimolar mixture of PES 9,7 and PES 9,9 (blue).
Figure 13.
Absorbance FTIR spectra (1800–1000 cm−1 region) of COPES 9,7/9. Insets compare the common C=O band at 1728 cm−1 (left), the characteristic bands for azelate and pimelate derivatives at 1345 and 1312 cm−1 (medium) and the characteristic bands at 1240 and 1223 cm−1 (right) for pimelate and azelate derivatives. Absorbance scale has been increased in the medium and right insets in order to show more clearly the different peaks. Profiles correspond to PES 9,7 (red), PES 9,9 (green), COPES 9,7/9 (black) and an equimolar mixture of PES 9,7 and PES 9,9 (blue).
The spectra of all samples was characterized by the very strong stretching band of the C=O group at 1728 cm
−1 that appeared in both semicrystalline and completely amorphous samples (
i.e., in the spectra recorded at a temperature higher than the polymer melting point). However, the spectra of lamellar crystal samples of PES 9,7 and PES 9,9 have some distinctive and isolated bands that are only associated with crystalline domains and appear at different wavenumbers for each homopolymer. Thus, the 1345 and 1240 cm
−1 bands seem characteristic of the pimelate derivative, whereas the 1312 and 1223 cm
−1 bands are characteristic of the azelate derivative. For example, the asymmetric stretching band of the C–O group seems clearly susceptible to small changes on the intermolecular interactions between neighboring chains (namely on slight differences between crystalline structure of both polyesters) and specifically varied from 1240 to 1223 cm
−1. Absorbance ratios between the characteristic crystalline bands and the common band at 1728 cm
−1 could be taken for further quantitative analyses. Thus, values of 0.15 and 0.30 were found for
A1345/
A1728 and
A1240/
A1728 ratios in the PES 9,7 spectrum, whereas values of 0.21 and 0.24 were determined for
A1312/
A1728 and
A1223/
A1728 ratios in the PES 9,9 spectrum. The indicated four crystalline bands were observed in the spectrum of the copolymer sample but PES 9,9 signals were more intense than expected for a crystalline sample having an equal content of azelate and pimelate units, as can be verified by comparison with the experimental spectrum of a mixture having a 50 mol % of both homopolymers (
Figure 13) and also from the values determined for the above indicated absorbance ratios. Thus, ratios involving PES 9,7 and PES 9,9 bands were smaller and greater, respectively than half the corresponding values determined for the homopolyesters. Specifically,
A1345/
A1728 and
A1240/
A1728 ratios were 0.055 and 0.11 (
i.e., smaller than 0.15/2 and 0.30/2, respectively) and
A1312/
A1728 and
A1223/
A1728 ratios were 0.14 and 0.17 (
i.e., greater than 0.21/2 and 0.24/2, respectively). These observations clearly point out that the lamellar core of the copolymer sample was predominantly constituted by azelate units (
i.e., 65 mol % instead of the theoretical value of 50 mol % ) and that probably the pimelate units were mainly excluded in the amorphous lamellar surface.
3.6. SAXS Data and Analysis of Correlation Function of PES 9,7, PES 9,9, and COPES 9,7/9 Samples Crystallized from the Melt State
In order to get insight into the lamellar structure SAXS peaks were analyzed by means of the correlation function that allowed morphologic parameters to be distinguished like: (a) long period,
Lγ, (b) amorphous layer thickness,
la, and (c) crystalline lamellar thickness,
lc, (calculated as
Lγ−
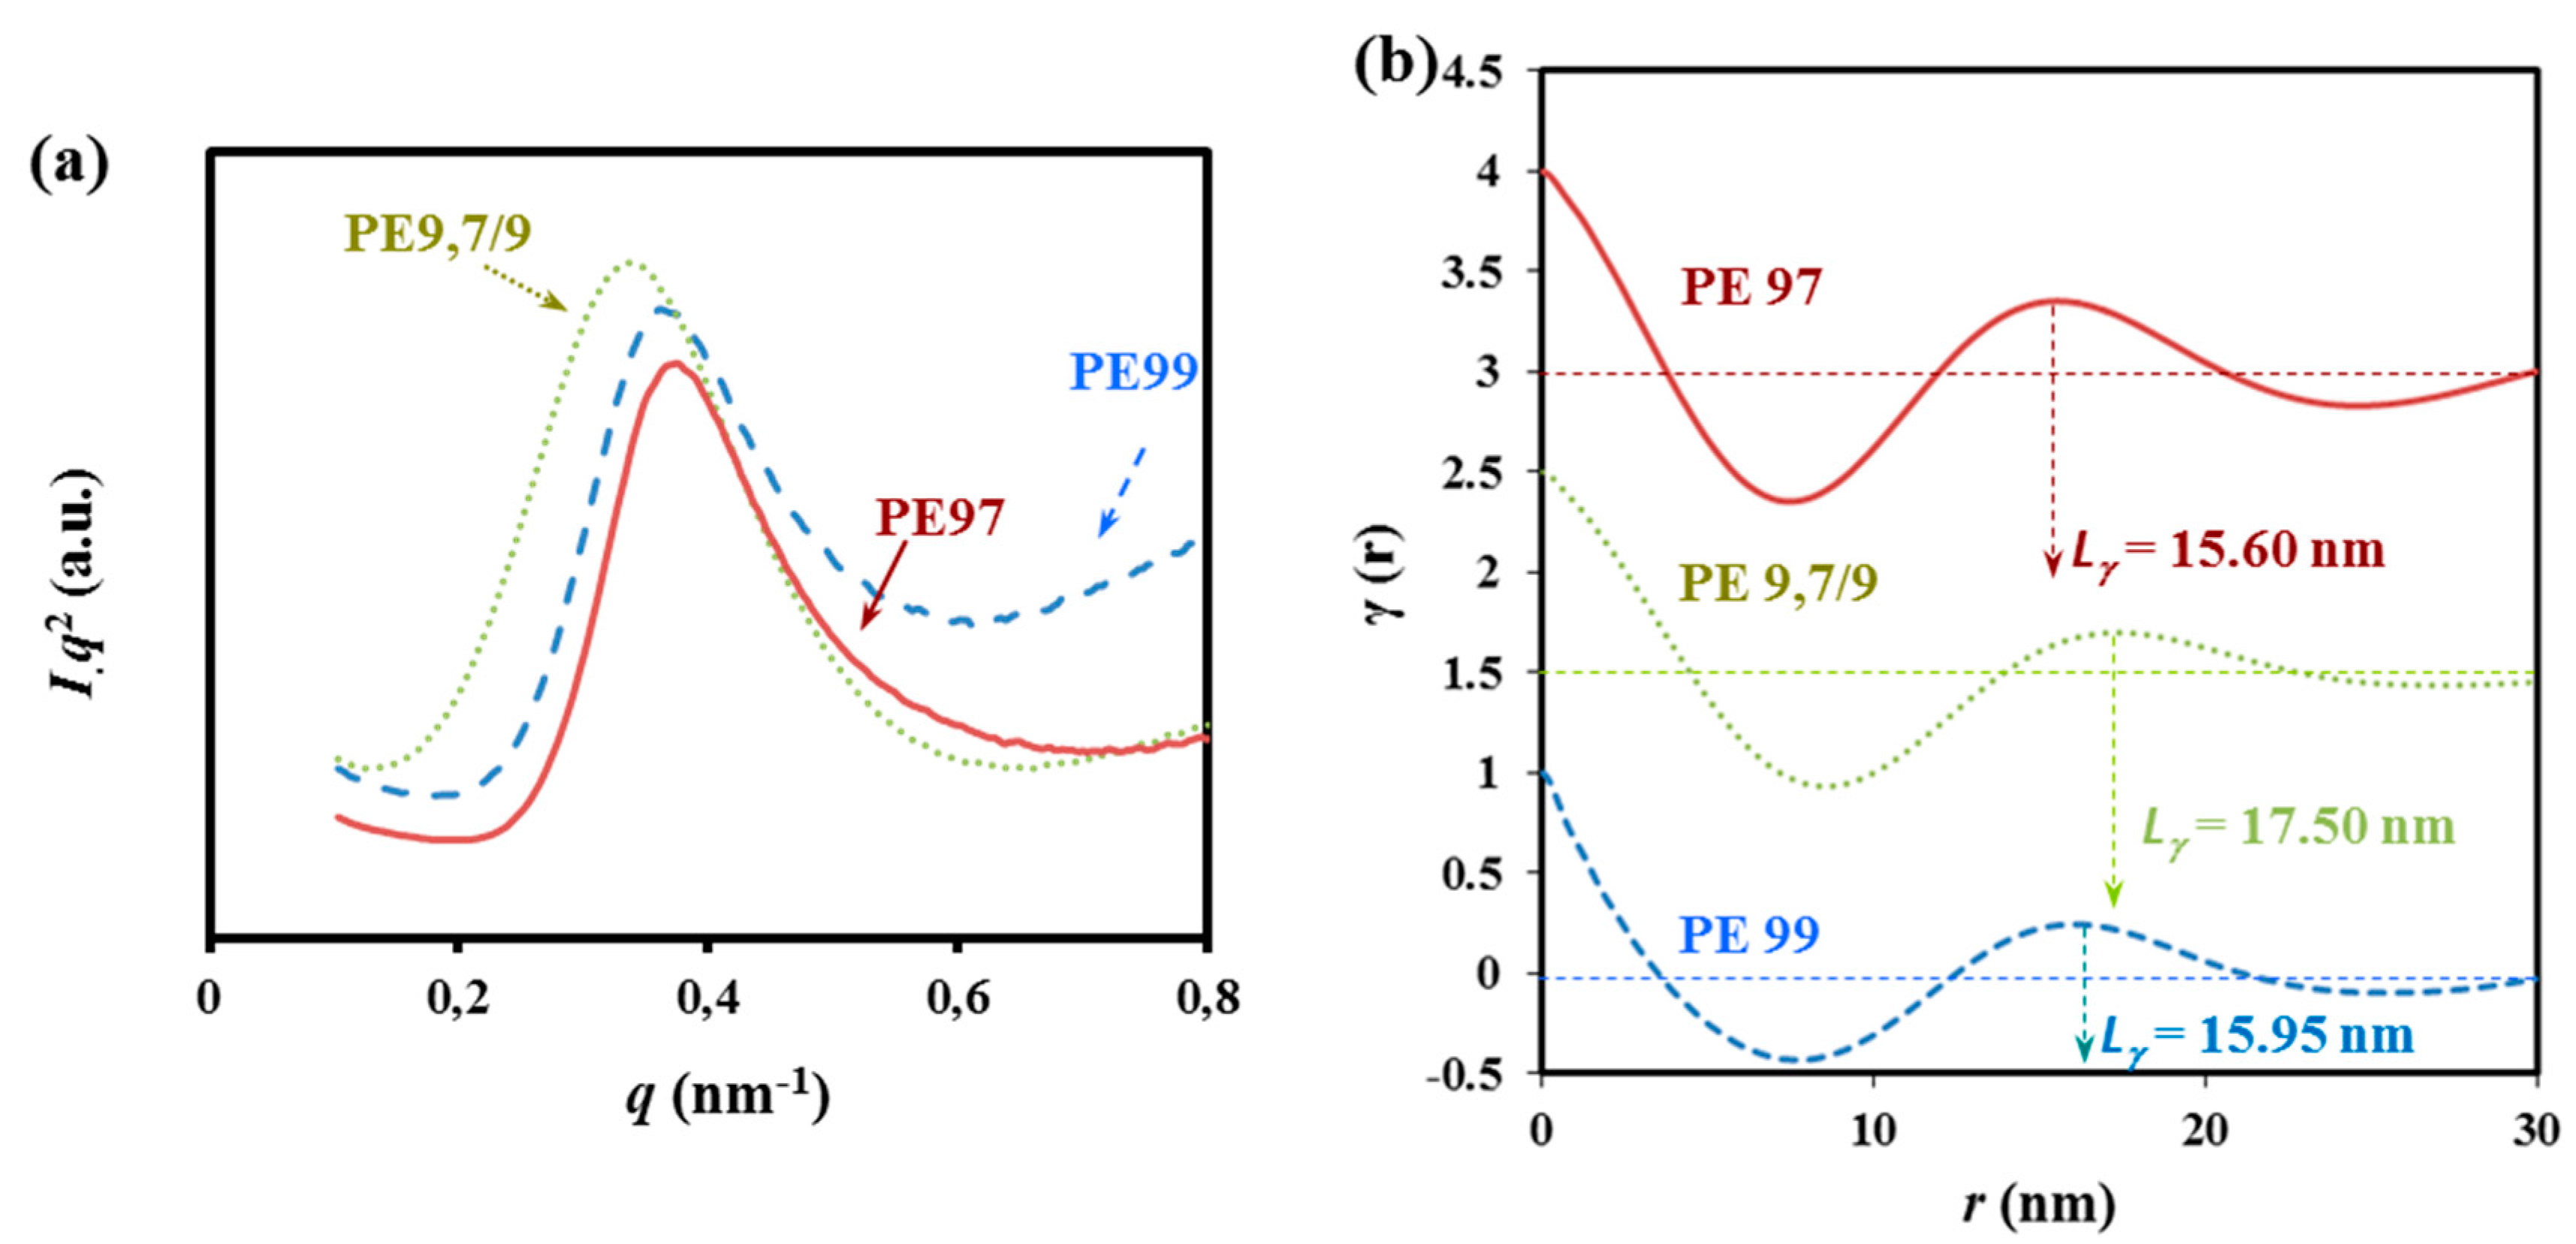
la). Therefore, the lamellar structure of polymers non-isothermally crystallized from the melt state at a cooling rate of 3 °C/min was analyzed from the SAXS profiles taken at room temperature (
Figure 14a).
Figure 14.
SAXS profiles (a) and corresponding correlation functions (b) for non-isothermally crystalized PES 9,7, PES 9,9, and COPES 9,7/9 samples.
Figure 14.
SAXS profiles (a) and corresponding correlation functions (b) for non-isothermally crystalized PES 9,7, PES 9,9, and COPES 9,7/9 samples.
The SAXS long period peak is clearly seen at a value of the scattering vector, q = 2πsinθ/λ, in the 0.35–0.38 nm−1 range after subtraction of the empty sample background observed near the beam stop. This peak, which can be attributed to the lamellar structure of the spherulites, revealed clear differences between the lamellar thicknesses of the three samples, the highest and lowest values corresponding to COPES 9,9/7 and PES 9,7, respectively.
Normalized one-dimensional correlation function [
39,
40], γ(
r), was calculated from Equation (1) and by considering extrapolations to low and high
q values by using Vonk’s model and Porod’s law, respectively.
Correlation functions calculated for the three samples from SAXS profiles are shown in
Figure 14b. In all cases, the
r values of the first maximum,
Lγ, were close to twice the value of the first minimum, suggesting a narrow distribution of the layer widths of the major component (
i.e., the crystal phase). Clear differences were found in the long period values between the copolymer (17.50 nm) and the two homopolymers (15.95 and 15.60 nm for PES 9,9 and PES 9,7, respectively).
Analyses of the correlation function also verifies that changes on the amorphous layer thickness were more significant. Specifically, 7.17, 6.24 and 4.25 nm were calculated for COPES 9,7/9, PES 9,7, and PES 9,9 samples, respectively. Crystallization of PES 9,7 and PES 9,9 homopolymers was also characterized by well differentiated lc and la values despite that the crystals had similar long periods. In particular, higher and lower lc and la thicknesses were determined for PES 9,9 (i.e., 11.7 and 4.25 nm), which means a considerably higher crystallinity within the lamellar stacks. These crystallinities, XcSAX, can be calculated as lc/Lγ which results in 0.74 and 0.60 for PES 9,9 and PES 9,7, respectively. It seems therefore that irregular molecular folds on the lamellar surface should involve larger segments when the polymer is constituted by the slightly more rigid pimelate units.
The greatest amorphous layer thickness was observed for the copolymer, indicating that chain defects caused by the presence of comonomer units could be placed in the amorphous interlamellar regions. Similar XcSAXS values were found for PES 9,7 and COPES 9,7/9 samples (i.e., 0.60 and 0.59, respectively) since the difference between the amorphous layer thickness was compensated by the lower crystalline lamellar thickness of the homopolymer. Results suggest that crystallization of COPES 9,7/9 should start by arrangement of the azelate rich moieties and therefore the pimelate units seem to be mainly incorporated as defects in the interlamellar amorphous region giving rise to the observed increase in the corresponding spacing. In fact, and as explained above, FTIR spectra revealed also that crystalline bands associated with PES 9,9 were predominant in the copolymer sample.


