Article

Epirubicin-Complexed Polypeptide Micelle Effectively and Safely Treats Hepatocellular Carcinoma

1
Department of Gastroenterology, The First Hospital of Jilin University, Changchun 130021, China
2
Key Laboratory of Polymer Ecomaterials, Changchun Institute of Applied Chemistry, Chinese Academy of Sciences, Changchun 130022, China
3
Department of Pathology, The First Hospital of Jilin University, Changchun 130021, China
*
Author to whom correspondence should be addressed.
Polymers 2015, 7(11), 2410-2430; https://doi.org/10.3390/polym7111521
Submission received: 17 October 2015 / Revised: 7 November 2015 / Accepted: 19 November 2015 / Published: 24 November 2015
(This article belongs to the Special Issue Functional Polymers for Medical Applications)

Abstract

:
Hepatocellular carcinoma (HCC) is the third leading cause of cancer-related mortality worldwide. Epirubicin (EPI) once acted as a main agent for HCC chemotherapy. However, the dosage-dependent side effects seriously limit its application in clinic. The purpose of this study is to develop an effective nanocarrier to improve the efficacy and overcome the limitations of EPI. In this regard, the EPI-complexed micelle (i.e., mPEG-b-PGA/EPI) was prepared via the electrostatic interaction between the amino group in EPI and the carboxyl group in PGA segment of methoxy poly(ethylene glycol)-block-poly(l-glutamic acid) (mPEG-b-PGA), and the subsequent hydrophobic interaction among PGA/EPI complexes. The micelle appeared spherical with a diameter at around 90 nm and possessed a pH-sensitive release property of payload. The cytotoxicity and hemolysis assays in vitro, and the maximum tolerated dose tests in vivo confirmed that mPEG-b-PGA was a kind of safe material with excellent biocompatibility, while the drug-loaded micelle could obviously improve the tolerance of EPI. In addition, mPEG-b-PGA/EPI possessed significantly enhanced antitumor efficacy and security toward the H22-xenografted HCC murine model at macroscopic and microscopic levels compared with free EPI. All these results strongly indicate that mPEG-b-PGA/EPI may be a promising nanoplatform for EPI delivery in the chemotherapy of HCC.

Graphical Abstract

1. Introduction

Hepatocellular carcinoma (HCC) is one of the most common malignancies worldwide and the third leading cause of cancer-related mortality with more than 700,000 deaths occurring every year [1]. Although the five-year survival rate has been improved greatly with the development of diagnostic techniques and surgical intervention, the percentage of patients who can get effective therapy remains low [2]. For most of the HCC patients presenting the advanced stages at diagnosis, chemotherapy is an important treatment protocol to extend the survival [3]. However, with the properties of low specific biodistribution and short circulating half-life, the traditional chemotherapy agents are difficult to form an effective concentration in tumor to kill the lesion cells. In addition, the intolerable side effects for HCC patients with basic diseases are another problem holding back the applications of chemotherapy agents [4]. Recently, the molecularly targeted therapies attract much attention in the advanced HCC, which may benefit the efficacy of chemotherapy. However, sorafenib, a first-line treatment agent for the advanced HCC, only upregulates the median survival time by no more than three months compared to placebo, and the phase III clinical trials of other molecularly targeted therapeutic agents even fail to reach the expected efficacy [5,6]. Therefore, some more effective therapeutic strategies are urgently needed for the treatment of HCC.
Nanomedicine, as an emerging pharmacy, provides a potential solution to exceed the limitations of traditional chemotherapy agents [4]. Especially, the polymeric nanoparticles, which are more stable, and possess higher drug loading content (DLC) and drug loading efficiency (DLE) than the other nanocarriers like liposome and protein nanoparticle, may be an ideal choice for controlled agent delivery [7]. With nanoscale dimension and the protection from biocompatible macromolecule, the nanoscale polymeric nanomedicines show the optimized pharmacokinetics than free ones [7]. In addition, the polymeric nanomedicines exhibit more accumulation of agents in tumor site via the enhanced permeability and retention (EPR) effect and/or active targeting strategies [7,8]. What is more, the stimuli-sensitive nanoparticles designed based on intratumoral or intracellular microenvironment can realize the smart release of therapeutic agents, which achieve quick release in targeted areas while slow or even no release in peripheral circulation [9]. Thus, the efficacies are improved, and the systemic toxicities of chemotherapy are reduced greatly.
The amphiphilic block copolymers could self-assemble into micelles in aqueous media forming a shell–core structure and acting as an important kind of polymeric nanocarriers [10]. The hydrophilic shell is able to form an effective protection from plasma proteins, which decrease the clearance of nanoparticle by the reticuloendothelial system (RES), and realize the prolonged circulation half-life [11]. Meanwhile, an effective drug encapsulation can be achieved by the hydrophobic core as a reservoir. With these properties, the nanoscale polymeric micelles could significantly improve the water solubility of hydrophobic drugs, such as curcumin and paclitaxel [12,13]. Among the amphiphilic matrices of micelles, the polypeptide-based copolymers have been a research hotspot for their excellent biodegradability, precise secondary structures, and facile modifiability [14,15]. There are many studies have verified the security and effectiveness of such copolymer-based drug-loaded micelles in the chemotherapy of various tumors, including HCC, and so on [16,17,18].
Once acting as a main agent for HCC chemotherapy, epirubicin (EPI) exerts cytotoxic effect through disturbing the deoxyribonucleic acid (DNA) and ribonucleic acid (RNA) syntheses, and suppressing topoisomerase II (Topo II). However, the relevant side effects, especially cardiotoxicity, seriously limit its application in clinic [19]. In recent years, there were several successful examples in HCC treatment by employing the EPI-loaded micelles to improve efficacies and reduce systemic toxicities [18,20]. However, it is worth noted that the loading procedures of hydrophobic drugs involve the use of organic solvents, which may potentially do harm to human bodies [16]. To address this problem, the utilization of electrostatic interaction between cationic drugs, such as EPI and doxorubicin (DOX), and anionic polymers in aqueous media may be a promising approach, and a few attempts have been succeeded [16,21]. More meaningfully, the drug-loaded micelles based on this technique show pH-sensitive dissociation and can realize the targeting cargo delivery to tumor tissue or cells, where the microenvironment is acidic [16,22].
In this study, the diblock methoxy poly(ethylene glycol)-block-poly(l-glutamic acid) (mPEG-b-PGA) copolymer was synthesized through the ring-opening polymerization (ROP) of γ-benzyl-l-glutamate N-carboxyanhydride (BLG NCA) initiated by the amino-terminated mPEG (mPEG-NH2) and the subsequent deprotection of benzyl group in the BLG unit. Then, for treatment of HCC, the EPI-loaded micelle (i.e., mPEG-b-PGA/EPI) was prepared via electrostatic interaction between cationic EPI and anionic mPEG-b-PGA, and subsequent intramolecular and intermolecular hydrophobic interactions among PGA/EPI complex segments (Scheme 1). Then, the pH-sensitive EPI release, effective cellular uptake, time- and concentration-dependent cytotoxicity, and good hemocompatibility in vitro, and elevated maximum tolerated dose (MTD), improved tissue distribution of drug, and significantly enhanced HCC growth inhibition effect and security of mPEG-b-PGA/EPI compared to free EPI were systematically confirmed with relative experiments. All these results indicate that this kind of drug-loaded micelle may be a better formulation for HCC chemotherapy.
Scheme 1. Schematic illustration for self-assembly, in vivo circulation, selective accumulation in tumor tissue, and final pH-triggered intracellular EPI release after intravenous injection of mPEG-b-PGA/EPI.
Polymers 07 01521 g015

2. Materials and Methods

2.1. Materials

mPEG (Mn = 5000 g·moL−1), 3-(4,5-dimethyl-thiazol-2-yl)-2,5-diphenyl tetrazolium bromide (MTT), 4′,6-diamidino-2-phenylindole dihydrochloride (DAPI), and Alexa Fluor 488 phalloidin (Alexa 488) were purchased from Sigma-Aldrich (Shanghai, China). mPEG-NH2 and BLG NCA were synthesized as described in our previous studies [21]. Epirubicin hydrochloride (EPI·HCl) was obtained from Beijing HuaFeng United Technology Co., Ltd. (Beijing, China). High glucose Dulbecco’s modified Eagle’s medium (HG-DMEM) and fetal bovine serum (FBS) were purchased from Gibco (Grand Island, NY, USA). Terminal deoxynucleotidyl transferase-mediated dUTP nick-end labeling (TUNEL) and hematoxylin and eosin (H&E) kits were purchased from Roche Company (Mannheim, Germany). The cleaved caspase-3 and Ki-67 antibodies were purchased from Abcam (Cambridge, UK). All the other chemicals were of analytical grade and purchased from Beijing Chemical Plant (Beijing, China).

2.2. Synthesis of mPEG-b-PGA

The mPEG-b-PGA diblock copolymer was synthesized through the ROP of BLG NCA with mPEG-NH2 as a macroinitiator, and the subsequent deprotection of benzyl group. In detail, the solution of mPEG-NH2 (5.0 g, 1.4 mmol) and BLG NCA (5.26 g, 28.0 mmol) in 50.0 mL of dry N,N-dimethylformamide (DMF) in a flame dry flask was stirred for 3 days at 25 °C. Then, the reaction solution was slowly added dropwise in the excess of cold diethyl ether to precipitate the resultant methoxy poly(ethylene glycol)-block-poly(γ-benzyl-l-glutamate) (mPEG-b-PBLG) block copolymer, and the product was purified by being redissolved in chloroform and settled in cold diethyl ether for 2 times. Afterwards, 5.0 g of mPEG-b-PBLG was dissolved into 50.0 mL of dichloroacetic acid, and 9.0 mL of hydrogen bromide (HBr)/acetic acid (33 wt %) solution was added subsequently. The reaction was performed at 25 °C for 1 h with magnetic stirring. Subsequently, the product was precipitated with excessive diethyl ether, and dialysis was further carried out with cellulose acetate dialysis bag (molecular weight cut-off (MWCO) = 3500 Da). Finally, the final product was freeze-dried, yielding a white solid.

2.3. Preparation of mPEG-b-PGA/EPI

mPEG-b-PGA/EPI was prepared by dialysis. In brief, PEG-b-PGA (50.0 mg) and EPI·HCl (10.67 mg) were dissolved in 2.0 mL of deionized water, respectively. The two solutions were mixed and stirred for 24 h in the dark. And then, the mixture was dialyzed (MWCO = 3500 Da) against deionized water for 24 h with water change every 4 h to remove excess EPI. Eventually, the product was lyophilized and conserved from light. For detection of DLC and DLE, the aqueous solution of PEG-b-PGA/EPI was prepared and measured by ultraviolet-visible (UV–Vis) spectrometer (Shimadzu, UV-1800, Kyoto, Japan) at 480 nm. The calculations of DLC and DLE were performed by Equations (1) and (2), respectively.
DLC  ( wt % ) = Amount of loaded drug Amount of drug-loaded micelle × 100 %
DLE  ( wt % ) = Amount of loaded drug Total amount of feeding drug × 100 %

2.4. Measurements

Proton nuclear magnetic resonance spectroscopy (1H NMR) spectra were recorded on a Bruker AV 300 NMR spectrometer (Bruker AV 300, Rheinstetten, Germany) using deuterated trifluoroacetic acid (TFA-d) as a solvent and tetramethylsilane as an internal standard. Fourier-transform infrared (FT-IR) spectra were performed on a Bio-Rad Win-IR instrument (Bio-Rad, FTS-6000, Cambridge, MA, USA) using potassium bromide method. Dynamic laser scattering (DLS) measurements were performed on a vertically polarized He-Ne laser (DAWN EOS, Wyatt Technology, Santa Barbara, CA, USA). The size and morphology of PEG-b-PGA/EPI were observed by transmission electron microscopy (TEM; JEOL, JEM-1011, Tokyo, Japan).

2.5. In Vitro EPI Release

The EPI release profiles of free EPI and mPEG-b-PGA/EPI were performed at 37 °C in phosphate-buffered saline (PBS) with different pH values of 5.5, 6.8, and 7.4. Ten milliliters of free EPI or mPEG-b-PGA/EPI solution was placed in dialysis bag (MWCO = 3500 Da). The dialysis bag was immersed in 100.0 mL of release medium with constant shaking of 75 rpm in the dark at 37 °C. At specified time intervals, 2.0 mL of external release medium was periodically collected, and then an equal volume of fresh release medium was replaced. The amount of released EPI was determined using fluorescence analysis with standard curve method. The emission spectra were recorded from 480 to 592 nm.

2.6. Stability Assessments

The stability of mPEG-b-PGA/EPI in the PBS and 30.0 mg·mL−1 PBS-buffered bovine serum albumin (BSA/PBS) solution of pH 7.4 at a concentration of 0.1 mg·mL−1, 25 °C was tested by DLS at different time points.

2.7. Cell Culture

Human HCC HepG2 cells were cultured in complete HG-DMEM containing 10% (v/v) FBS, streptomycin (50.0 IU·mL−1), and penicillin (50.0 IU·mL−1) at 37 °C in a 5% (v/v) carbon dioxide (CO2) atmosphere. Mouse HCC H22 cells were cultivated and amplified in the ascites of BALB/c mouse.

2.8. Evaluation of Intracellular EPI Release

The cellular uptake efficiency and intracellular EPI release of mPEG-b-PGA/EPI were observed by both confocal laser scanning microscopy (CLSM) and flow cytometry (FCM) toward HepG2 cells.
For CLSM assays, HepG2 cells were seeded on the coverslip in a 6-well plate (2 × 10⁵ cells per well) and incubated in 2.0 mL of complete HG-DMEM for 12 h at 37 °C. Then, the original medium was replaced with free EPI or mPEG-b-PGA/EPI solution in HG-DMEM at a final EPI concentration of 10.0 μg·mL−1. The coincubation was carried out for 2 or 6 h, respectively. Subsequently, after the culture medium was removed, the cells were washed three times with PBS and fixed with 4% (w/v) PBS-buffered formaldehyde for 20 min at 25 °C. The counterstain was carried out with DAPI (blue) for nucleus and Alexa 488 (green) for cytoskeleton following the manufacturer’s introductions. The cellular microimages were visualized on a CLSM (Carl Zeiss, CLSM 780, Jena, Germany).
For FCM tests, HepG2 cells were seeded in a 6-well plate with a density of 1 × 10⁵ cells per well, and the culture procedure was the same as that of CLSM tests. And then, the cells were harvested through trypsinization and washed three times with cold PBS. After the last wash, the collected cells were resuspended in 300.0 μL of PBS, and FCM was performed using a flow cytometer (BD Biosciences, San Jose, CA, USA).

2.9. Cytotoxicity Assays

The cytotoxicities of free EPI, mPEG-b-PGA/EPI, and mPEG-b-PGA to HepG2 cells were studied by a MTT assay. The cells were seeded in a 96-well plate (5.0 × 10³ cells per well) and cultured with 200.0 µL of complete HG-DMEM for 12 h at 37 °C. Then, fresh media containing free EPI, mPEG-b-PGA/EPI, or mPEG-b-PGA at different concentrations were used to replace the original ones. The drug treatment continued for another 24, 48, or 72 h. After that, the cultivation with 200.0 µL of PBS solution of MTT (5.0 mg·mL−1) for 4 h and following 100.0 µL of dimethyl sulfoxide (DMSO) for 10 min were carried out at 37 °C in the dark. Finally, a Bio-Rad 680 microplate reader (Hercules, CA, USA) was employed to measure the absorbency of above solution at 490 nm. The cell viability was calculated based on Equation (3).
Cell viability  ( % ) = A sample A control × 100
In Equation (3), Asample and Acontrol represented the absorbencies of sample and control wells, respectively.

2.10. Hemolysis Activity Tests

The hemolytic activities of free EPI, mPEG-b-PGA, and mPEG-b-PGA/EPI were evaluated by the spectrophotometry based on the established standard: ISO 10993-4 [23]. Briefly, the fresh rabbit blood obtained from the Experimental Animal Center of Jilin University was stabilized with heparin in normal saline (NS). Red blood cells (RBCs) were separated from the blood by centrifugation at 2500 rpm for 10 min, and then carefully washed and diluted with NS. The suspended RBCs at a final concentration of 2% (v/v) were incubated with free EPI, mPEG-b-PGA/EPI, or mPEG-b-PGA of different concentrations for 3 h at 37 °C. Triton X-100 (a lysing agent of RBCs) and NS were used as positive and negative controls, respectively. After taking photos, RBCs were separated by centrifugation at 3000 rpm for 10 min, and then 100.0 μL of supernatant of each sample was collected and added into a 96-well plate. Free hemoglobin in the supernatant was measured with a Bio-Rad 680 microplate reader at 540 nm. The hemolytic ratio of RBCs was calculated based on Equation (4).
Hemolytic ratio  ( % ) = A sample A negative control A positive control A negative control × 100
In Equation (4), Asample, Anegative control, and Apositive control were denoted as the absorbencies of sample, negative, and positive controls, respectively.

2.11. Animal Procedures

All mice used in this study were purchased from the Laboratory Animal Center of Jilin University. All procedures of animals were approved by the Institutional Animal Care and Use Committee of Jilin University complied with the “Guide for the Care and Use of Laboratory Animals” published by the National Academy Press (NIH Publication No. 85-23, revised 1996), and all efforts were made to minimize suffering. The tumor-bearing BALB/c mouse model was constructed by the subcutaneous injection of H22 cell suspension (1.5 × 10⁶ cells per mouse in 0.1 mL of PBS) in the right flank.

2.12. MTD Test

Six-week-old Kunming mice at equal amount of male and female were used to determine the MTD of free EPI, mPEG-b-PGA/EPI, or mPEG-b-PGA with a single dose administration via intravenous injection. The mice were divided into 3 main groups and 12 subordinate groups by injection matrices and doses (n = 10 for each subordinate group). The injected doses of free EPI and mPEG-b-PGA/EPI were 5.0, 10.0, 15.0, or 20.0 mg per kg body weight (mg·(kg·BW)−1) at EPI equivalent, while those of mPEG-b-PGA were 250.0, 500.0, 750.0, or 1000.0 mg·(kg·BW)−1, respectively. After injection, body weights, survival rates, and the amounts of diet were monitored for 10 days. The MTDs of EPI and mPEG-b-PGA/EPI were estimated according to the threshold, at which all animals survived and the loss of body weight was below 15% after administration [24].

2.13. Ex Vivo Fluorescence Imaging

The tissue distribution of EPI after intravenous injections of various formulations was assessed by ex vivo EPI fluorescence imaging. In detail, free EPI or mPEG-b-PGA/EPI at 5.0 mg·(kg·BW)−1 EPI equivalent were injected into H22 HCC-bearing mice through lateral tail vein. The mice were sacrificed at 6 or 12 h post-injection, and tumors and major organs (i.e., heart, liver, spleen, lung, and kidney) were excised followed by washing with NS three times. The ex vivo imaging of EPI fluorescence was performed on a Maestro 500FL in vivo Imaging System (Cambridge Research & Instrumentation, Inc., Woburn, MA, USA). The contribution of autofluorescence could be identified, separated, and removed in the analyzed image, and the quantification of average signal was also carried out utilizing Maestro 2.4 software (Cambridge Research & Instrumentation, Inc., Woburn, MA, USA).

2.14. In Vivo Antitumor Efficiency and Security

The H22 HCC-xenografted mouse model was used in these assays. When the tumor volume reached around 100 mm3, the mice were randomly divided into 4 groups (n = 10 for each group). The mice in drug treatment group received 8.0 mg·(kg·BW)−1 of free EPI or mPEG-b-PGA/EPI at EPI equivalent trough intravenous injection, while mPEG-b-PGA at the corresponding material dose in the mPEG-b-PGA/EPI group was administration in the mPEG-b-PGA group. The NS was injected as control. The therapies were repeated every 4 days for 16 days, and the first day was marked as Day 0. The tumor volumes and body weights of mice were measured every day. At the last day, the mice were sacrificed. The tumors and major organs (i.e., heart, liver, spleen, lung, and kidney) were excised and weighted, and then were preserved in formalin solution for further studies. The tumor volume, tumor inhibitory rate, and tumor or organ index were calculated using the Equations (5)–(7), respectively.
V   ( mm 3 ) = L × S 2 2
In Equation (5), L and S (mm) were the largest and smallest diameters of tumor, respectively.
Tumor inhibition rate  ( % ) = V control V sample V control × 100
In Equation (6), Vcontrol and Vsample were denoted as the tumor volumes in the control and sample groups at the last day of detection, respectively.
Organ indice ( mg g 1 ) = W organ   ( mg ) W body   ( g )
In Equation (7), Worgan (mg) and Wbody (g) were denoted as the weight of tumor or organ, and body weight at the last day of detection, respectively.

2.15. Histopathological and Immunohistochemical Analyses

The tumors and major organs preserved in formalin solution overnight were embedded in paraffin. The paraffin-embedded tissues were cut into 5 μm slices and further analyzed by H&E staining and immunohistochemical analyses. For immunohistochemical analyses, the cleaved caspase-3 and Ki-67 antibodies were used by antigen retrieval methods. The microimages of H&E staining were obtained by microscope (Nikon TE2000U, Tokyo, Japan), while that of immunofluorescence analyses by CLSM, and following analyses were performed with ImageJ software (National Institutes of Health, Bethesda, MD, USA).

2.16. In Situ Cell Apoptosis Detections

In order to detect the cell apoptosis in ex vivo tumor tissues, a TUNEL assay was performed with a commercial kit following the manufacturer's instructions (Roche, Mannheim, Germany). The fluorescence microimages of tumor sections were obtained through a CLSM, and the optical density was analyzed with ImageJ software.

2.17. Statistical Analyses

All experiments were performed at least three times and expressed as mean ± standard deviation (SD). Data were analyzed for statistical significance using SPSS 14.0 (SPSS Inc., Chicago, IL, USA). * p < 0.05 was considered statistically significant, and # p < 0.01 and & p < 0.001 were considered highly significant.

3. Results and Discussion

3.1. Preparations and Characterizations of mPEG-b-PGA and mPEG-b-PGA/EPI

The mPEG-b-PGA diblock copolymer was prepared by deprotecting the benzyl group in mPEG-b-PBLG, which was synthesized through the ROP of BLG NCA with mPEG-NH2 as a macroinitiator. The 1H NMR and FT-IR spectra were employed to confirm the successful synthesis of mPEG-b-PGA (Figure 1). As shown in Figure 1A of 1H NMR spectra, the signals assigned to the protons in mPEG-b-PBLG were well assigned and demonstrated the successful synthesis of mPEG-b-PBLG. Compared with that of mPEG-b-PBLG, the disappearance of resonances at δ = 7.2 and 5.1 ppm in the 1H NMR spectrum of mPEG-b-PGA, which represented the methyl protons and phenyl protons, respectively, indicated the complete deprotection of benzyl group. In FT-IR spectra (Figure 1B), the signals of 1656 and 1555 cm−1, respectively, assigned to the stretching vibrations of C=O and C−N in amide bond of PGA, and the signals of 1114 cm−1 assigned to the C−O−C bond of PEG further confirmed the chemical structure of mPEG-b-PGA.
Figure 1. 1H NMR (A) and FI-IR spectra (B) of mPEG-b-PBLG (I) and mPEG-b-PGA (II).
Polymers 07 01521 g001
As shown in Scheme 1, the drug-loaded micelle (i.e., mPEG-b-PGA/EPI) was prepared through a dialysis protocol in aqueous medium, utilizing the electrostatic interaction between the positively charged EPI and negatively charged mPEG-b-PGA, and the subsequent hydrophobic interaction among PGA/EPI segments. The DLC and DLE of mPEG-b-PGA/EPI were 14.7 and 72.5 wt %, respectively, which indicated that the anionic polypeptide copolymer could load the traditional cationic chemotherapy agents efficiently. As shown in Figure 2, the micelle exhibited homogeneously spherical with an average diameter of around 80 nm in TEM micrograph, while the hydrodynamic diameter (Dh) quantitatively detected by DLS was about 90 nm. A smaller apparent size in TEM detection than that determined by DLS should be attributed to the dehydration of micelle in the process of TEM specimen preparation. As the size of nanoparticle is one of the most important impact factors on the EPR effect, around 100 nm may be the most appropriate scale, and mPEG-b-PGA/EPI in this study is well consistent with the demand of passive targeting [25,26].
Figure 2. Typical TEM micrograph (inset) and Dh of mPEG-b-PGA/EPI in PBS. Scale bar: 200.0 nm.
Polymers 07 01521 g002

3.2. pH-Sensitive EPI Release in Vitro and Optimized Biocompatibility of mPEG-b-PGA/EPI

In order to confirm the acid-sensitivity of mPEG-b-PGA/EPI, the 
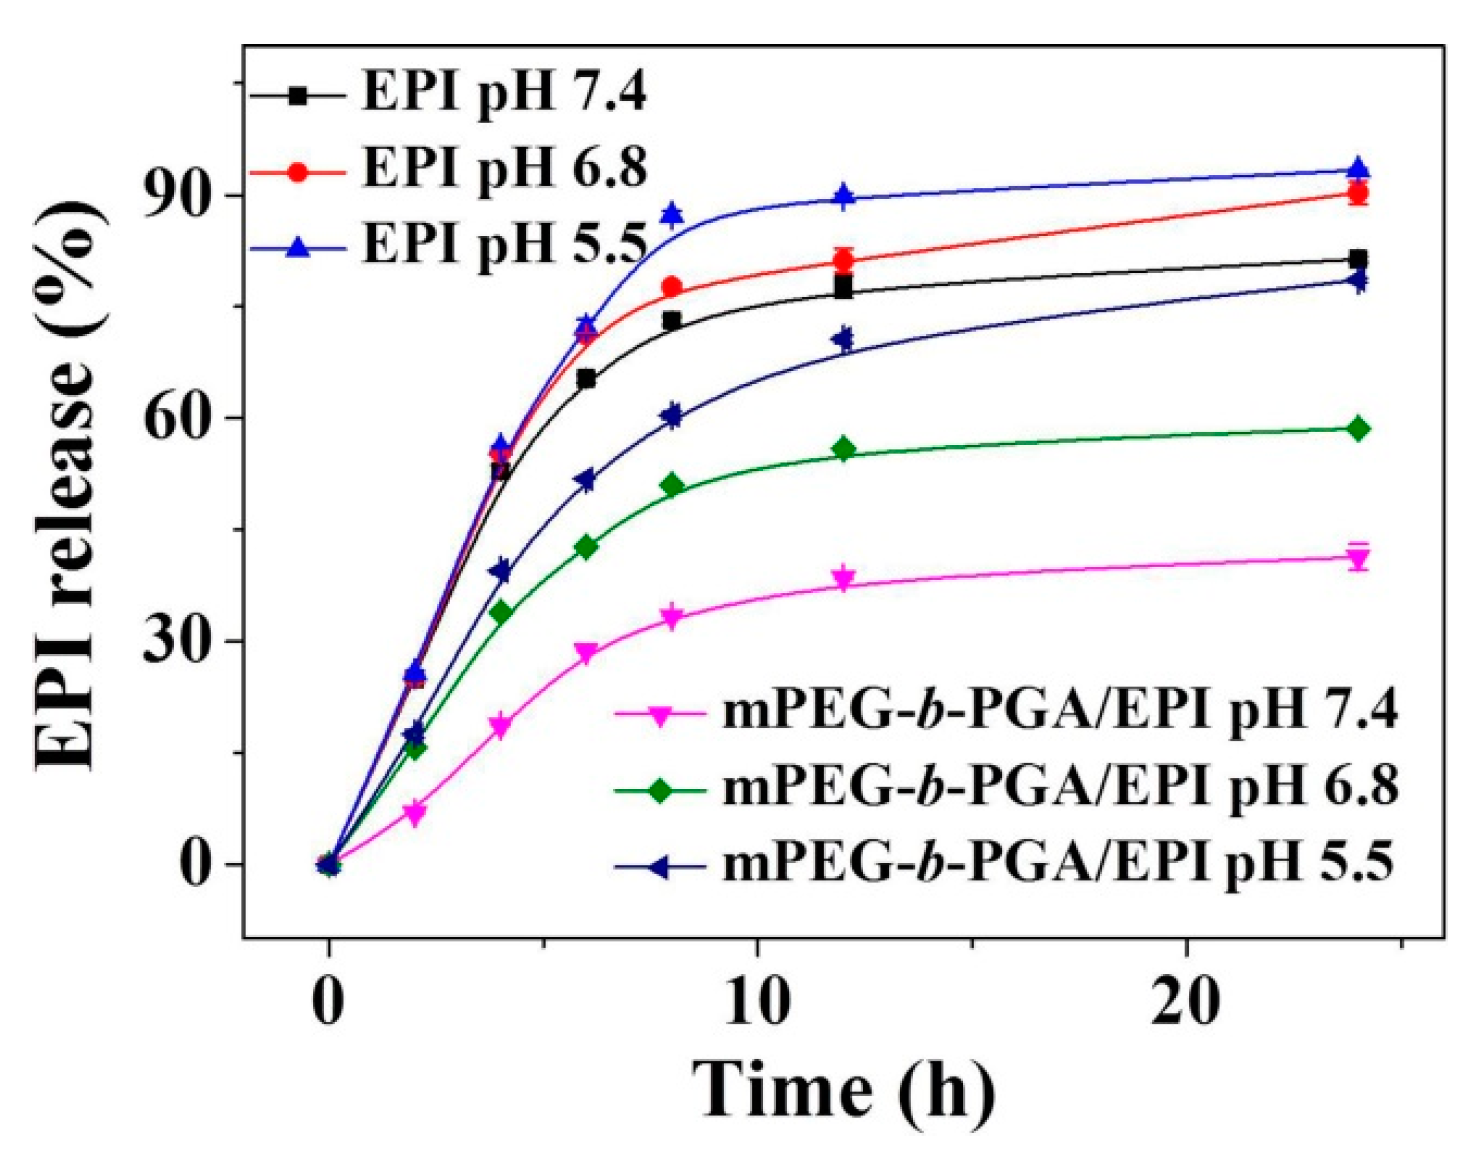
in vitro release experiments of EPI were carried out in PBS at pH 5.5, 6.8, and 7.4, 37 °C. As shown in Figure 3, the free DOX release from dialysis bag was more than 70% in PBS at all the test pHs within 8 h, indicating the feasibility of release proposal. The cumulative release of EPI in different conditions from mPEG-b-PGA/EPI gradually increased in a time-dependent manner, and was obviously slower than that of free EPI. Furthermore, the complex micelle release EPI more rapidly, and the cumulative release was obviously higher as the decrease of pH. In physiological pH environment (i.e., pH 7.4), only 41.3% of loaded EPI released after 24 h incubation, while the cumulative release reached 58.6 and 78.5%, respectively, for the same duration at pH 6.8 and 5.5, which mimicked the intratumoral and intracellular acidic microenvironments. These results might attribute to the disruption of electrostatic interaction between EPI and mPEG-b-PGA because of the deionization of PGA moiety (pKa = 4.5) and ionization of EPI (pKa = 7.7) as the decrease of pH [16,27]. In addition, the increased hydrophilicity of EPI in acid condition, which was much lower than the pKa of EPI, also resulted in the acidity-accelerated drug release [16]. Thus, mPEG-b-PGA/EPI with pH-sensitive property could realize the controlled drug release and might perform better pharmacokinetic characteristics in vivo compared with free EPI. In addition, the limited premature EPI release and relative stability of mPEG-b-PGA/EPI in PBS and BSA/PBS of pH 7.4 at 25 °C were confirmed by monitoring the Dh through DLS. As shown in Supplementary Figure S1, the laden micelle exhibited nearly constant diameters during the incubation in both PBS and BSA/PBS solutions for 72 h, which indicated that the encapsulated drug less released prematurely from mPEG-b-PGA/EPI at pH 7.4.
Figure 3. Time- and pH-dependent EPI release profiles of free EPI and mPEG-b-PGA/EPI in PBS of pH 7.4, 6.8, and 5.5 at 37 °C. Data were presented as mean ± SD (n = 3).
Polymers 07 01521 g003
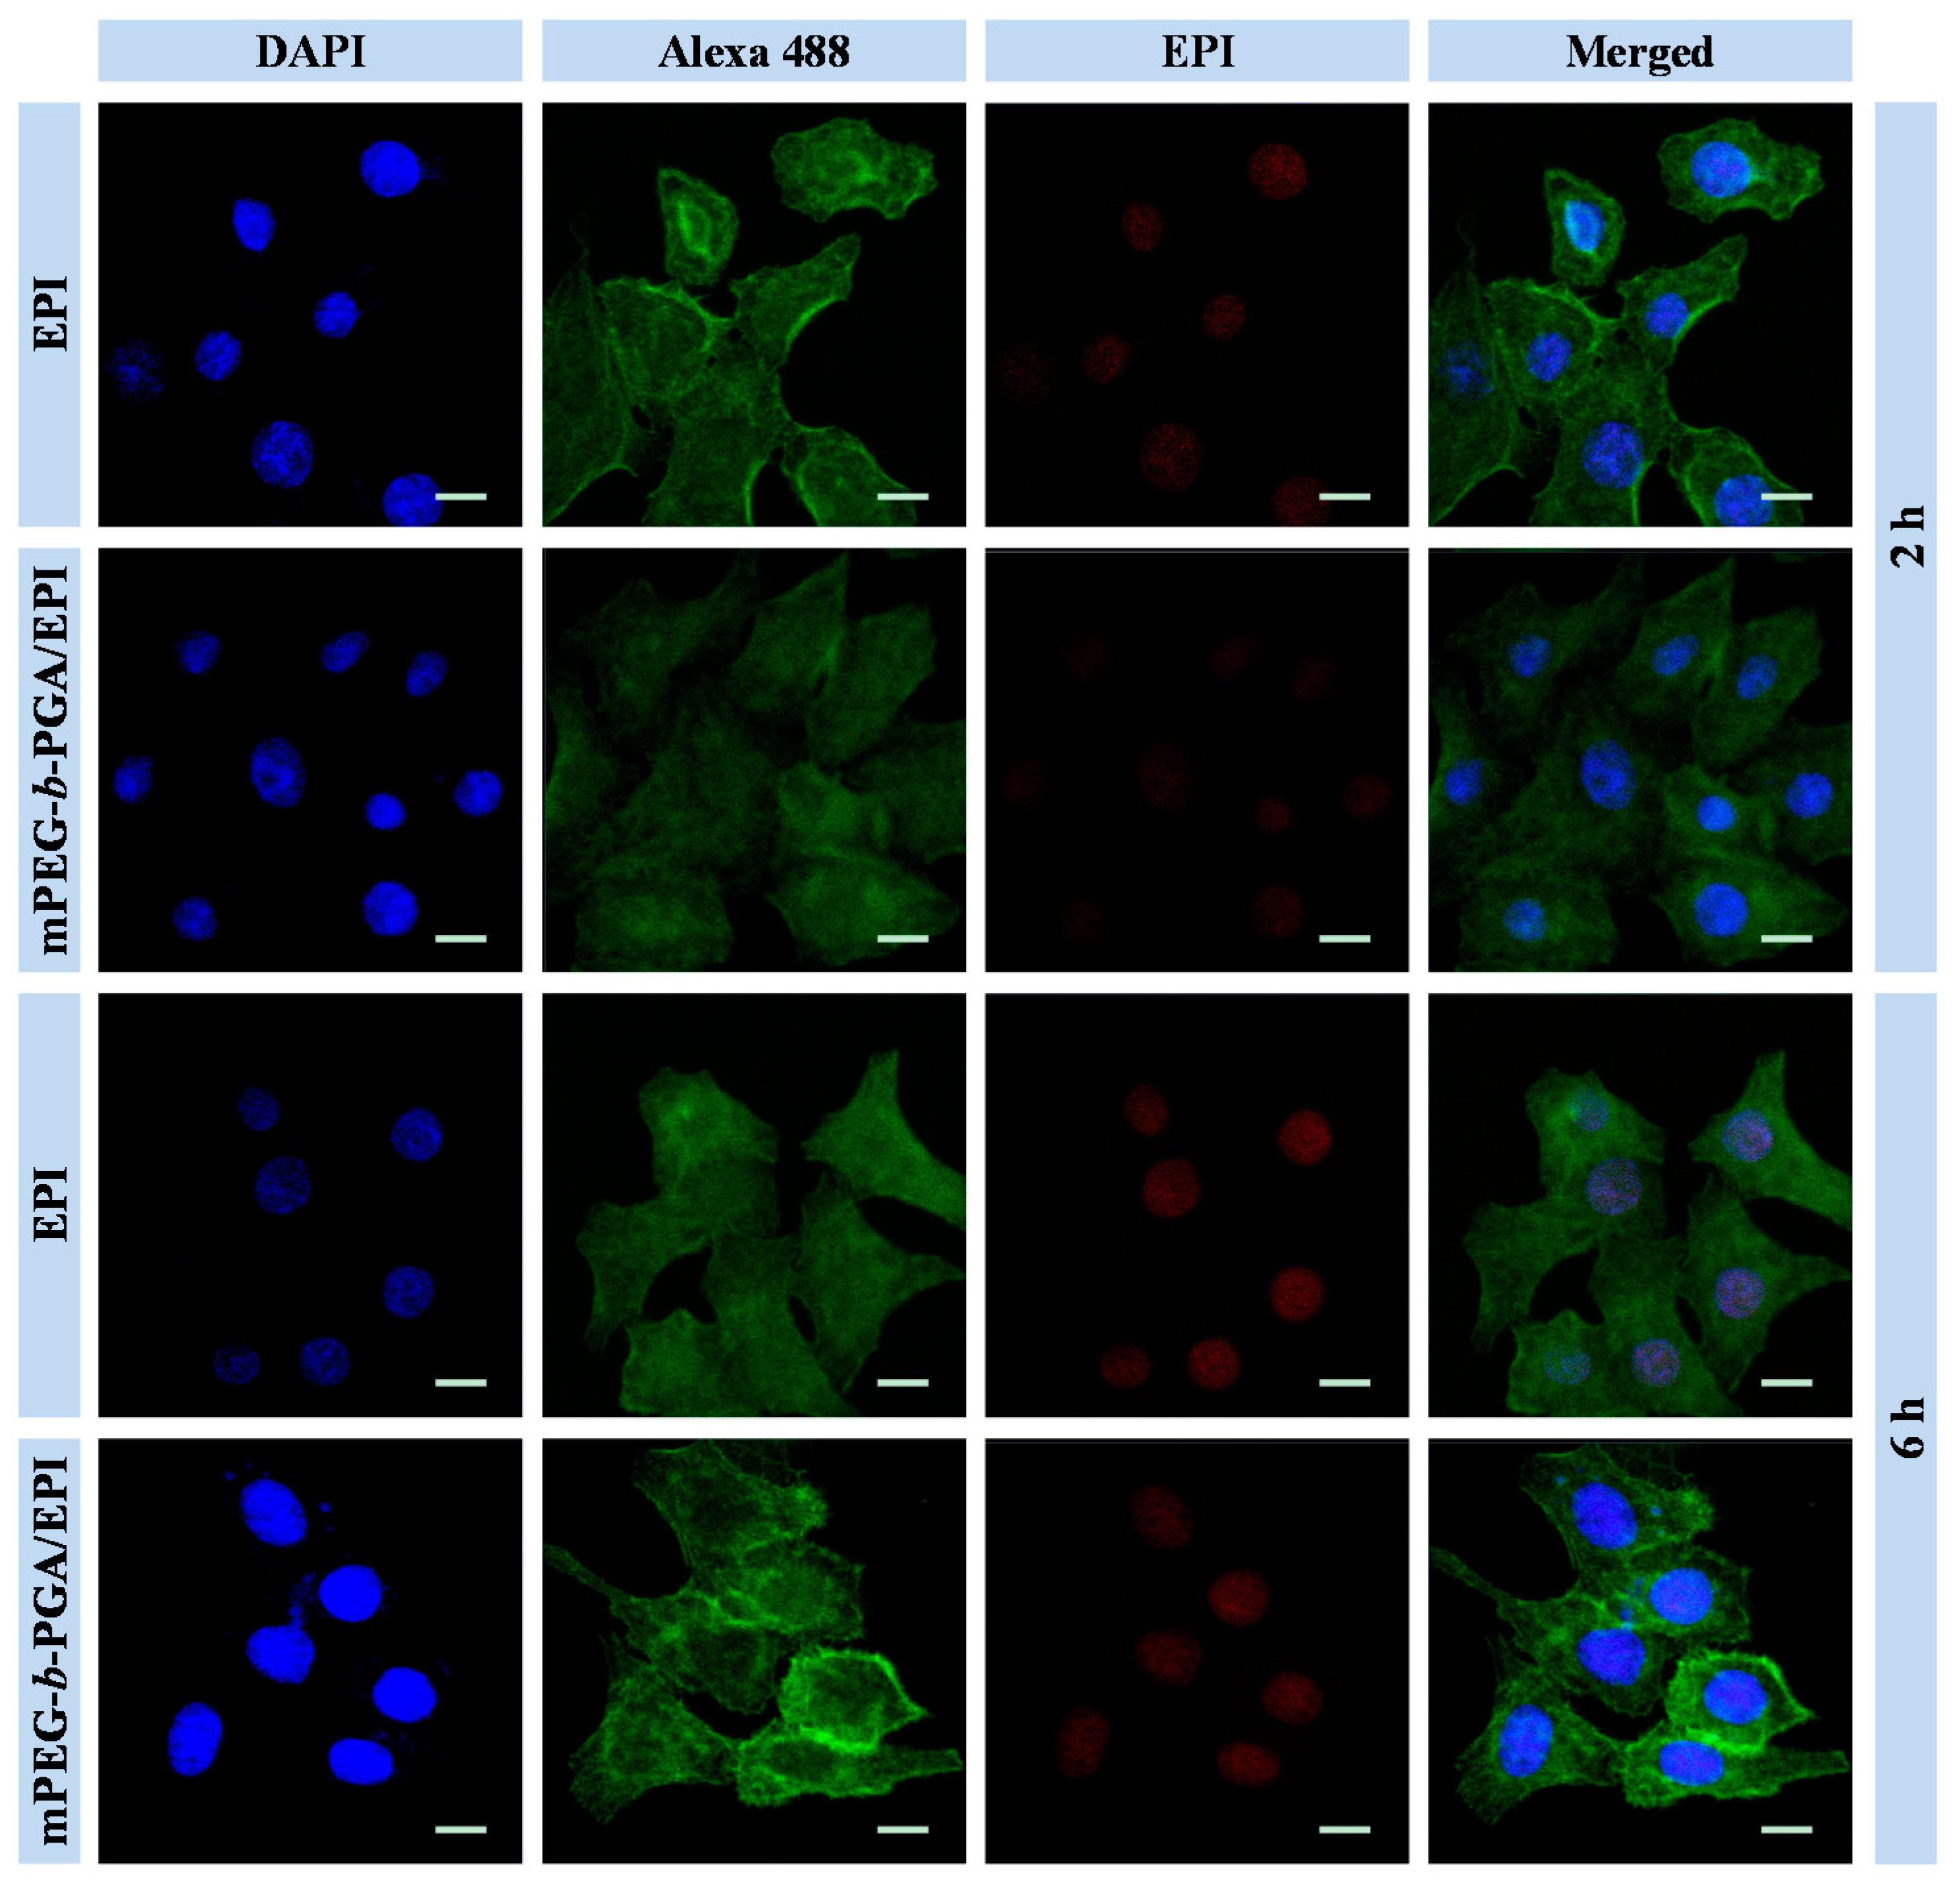
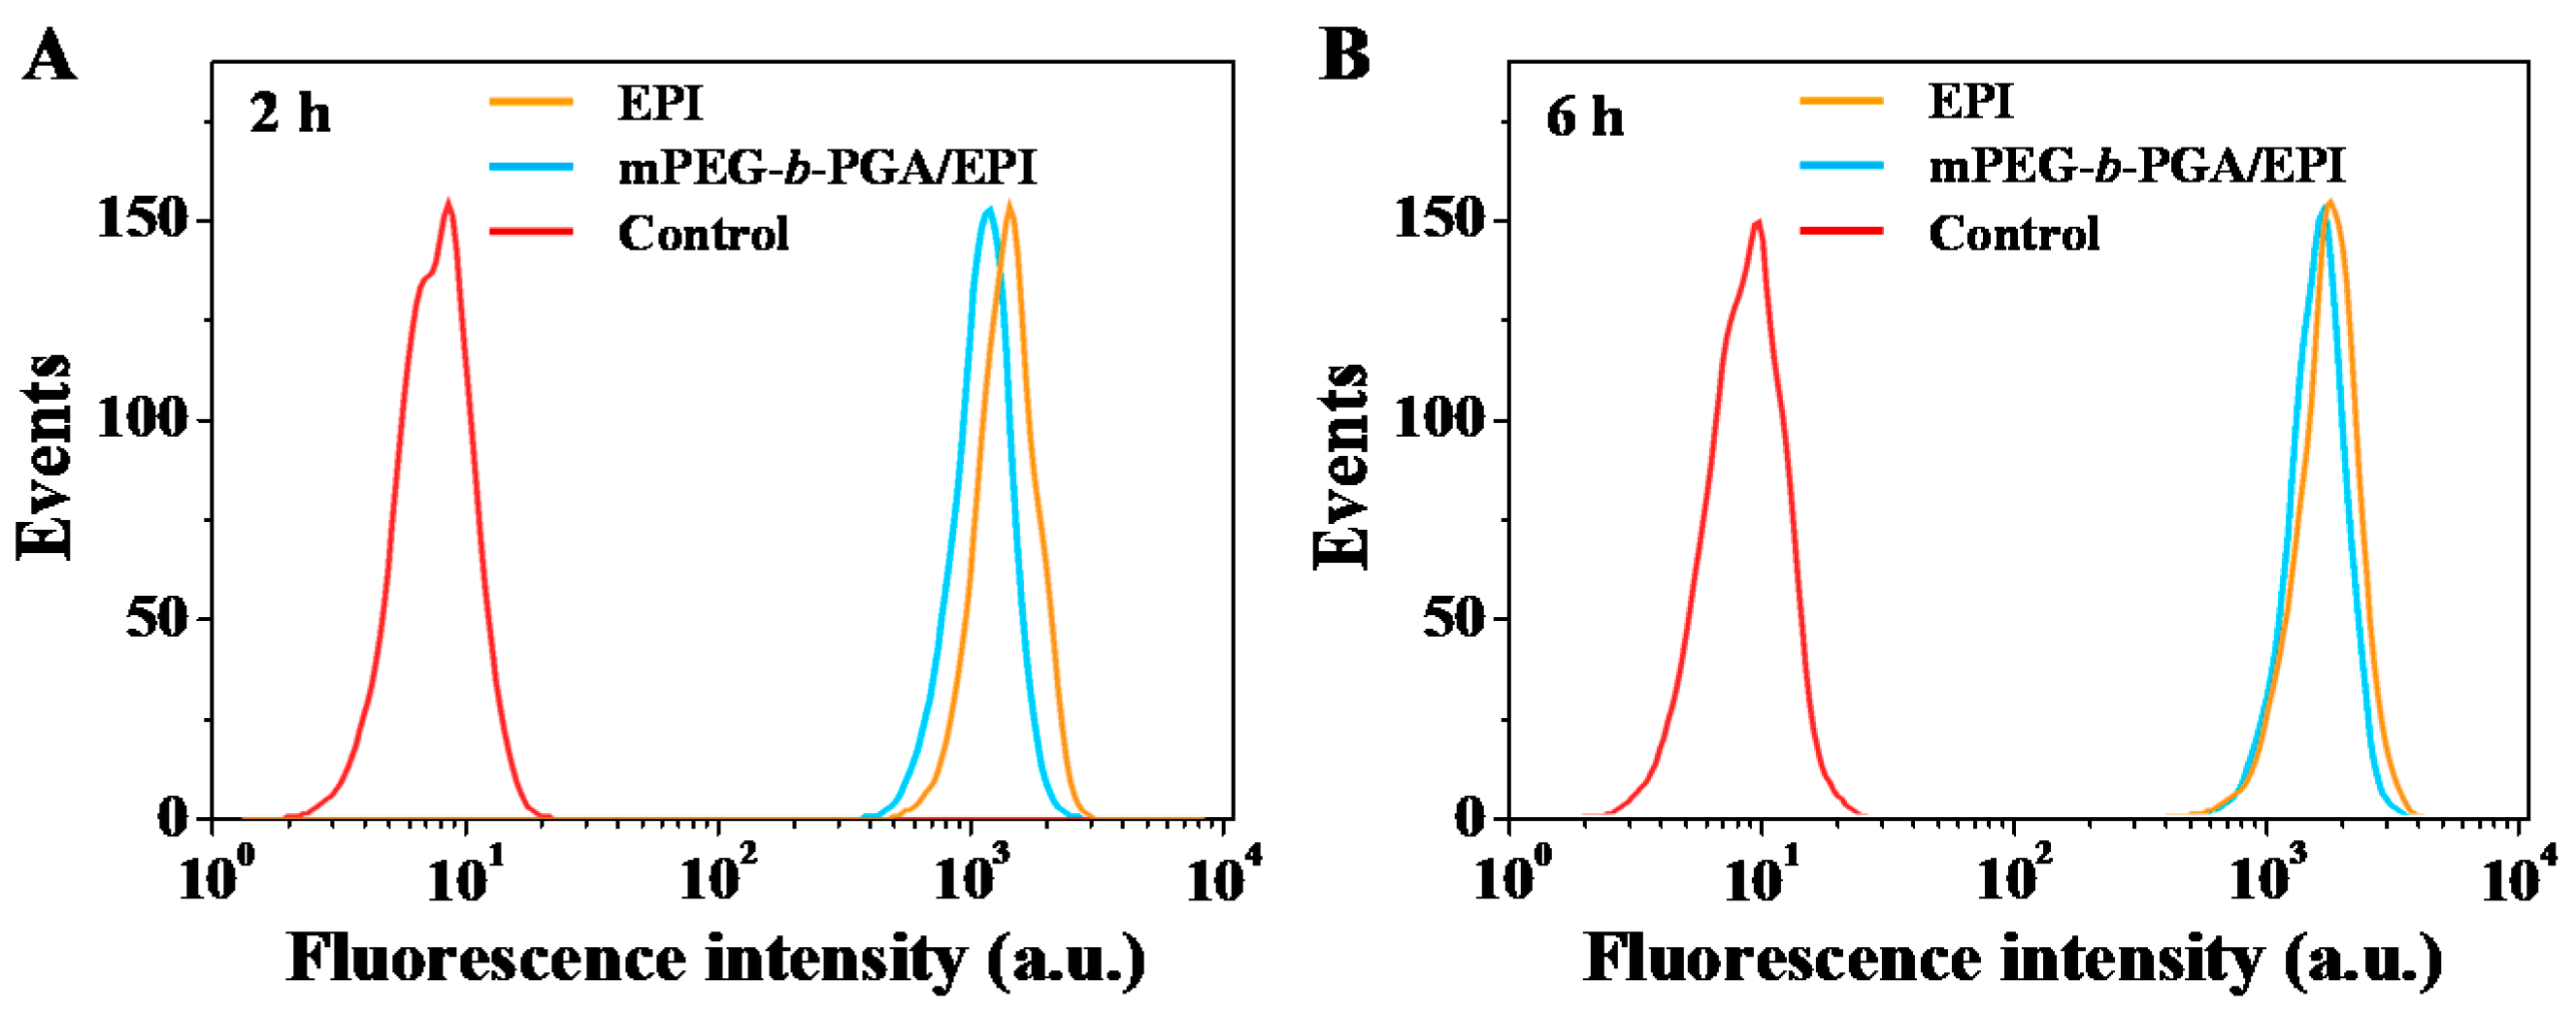
Both CLSM and FCM were employed to detect the cellular uptake and intracellular EPI release from mPEG-b-PGA/EPI. HepG2 cells were cultivated with free EPI or mPEG-b-PGA/EPI at an EPI equivalent dose of 10.0 μg·mL−1 for 2 or 6 h. As shown in CLSM results in Figure 4, the red EPI fluorescence of the two forms of EPI mainly concentrated in the nuclei of HepG2 cells, coinciding with the location of DAPI (blue). After 2 h culture, the red fluorescence intensity of HepG2 cells in the free EPI group is obviously higher than that in the mPEG-b-PGA/EPI group, indicating free EPI could be uptake faster. There may be two reasons causing these results. For the first, the polymeric nanoparticles are mainly uptaken by cells via endocytosis pathway, while the small molecule agents via diffusion approach, which was energy-independent and easily coming up [28]. For the other one, the EPI in the hydrophobic core of nanoparticles exhibits weaker fluorescence intensity due to the self-quenching effect of fluorescent molecules compared with free EPI at the same concentration [25,29]. When the culture period was extended to 6 h, the red fluorescence intensity in both of the two groups increased somewhat. However, the increase amplitude in the mPEG-b-PGA/EPI group, whose red fluorescence intensity was nearly close to that of free EPI group, was more obviously. This might attribute to the increased endocytosis of loading micelle and the rapid EPI release in endosomes where the pH is much lower than that in normal physiological microenvironment, while free EPI effused quickly after uptake [30]. The date of FCM further confirmed the results of CLSM (Figure 5). The signal intensity of EPI in HepG2 cells dealt with mPEG-b-PGA/EPI was lower than that with free EPI at both of the test durations (i.e., 2 and 6 h). Additionally, at the 6 h point-in-time, the signal intensities of the two drug formulation groups were much closed.
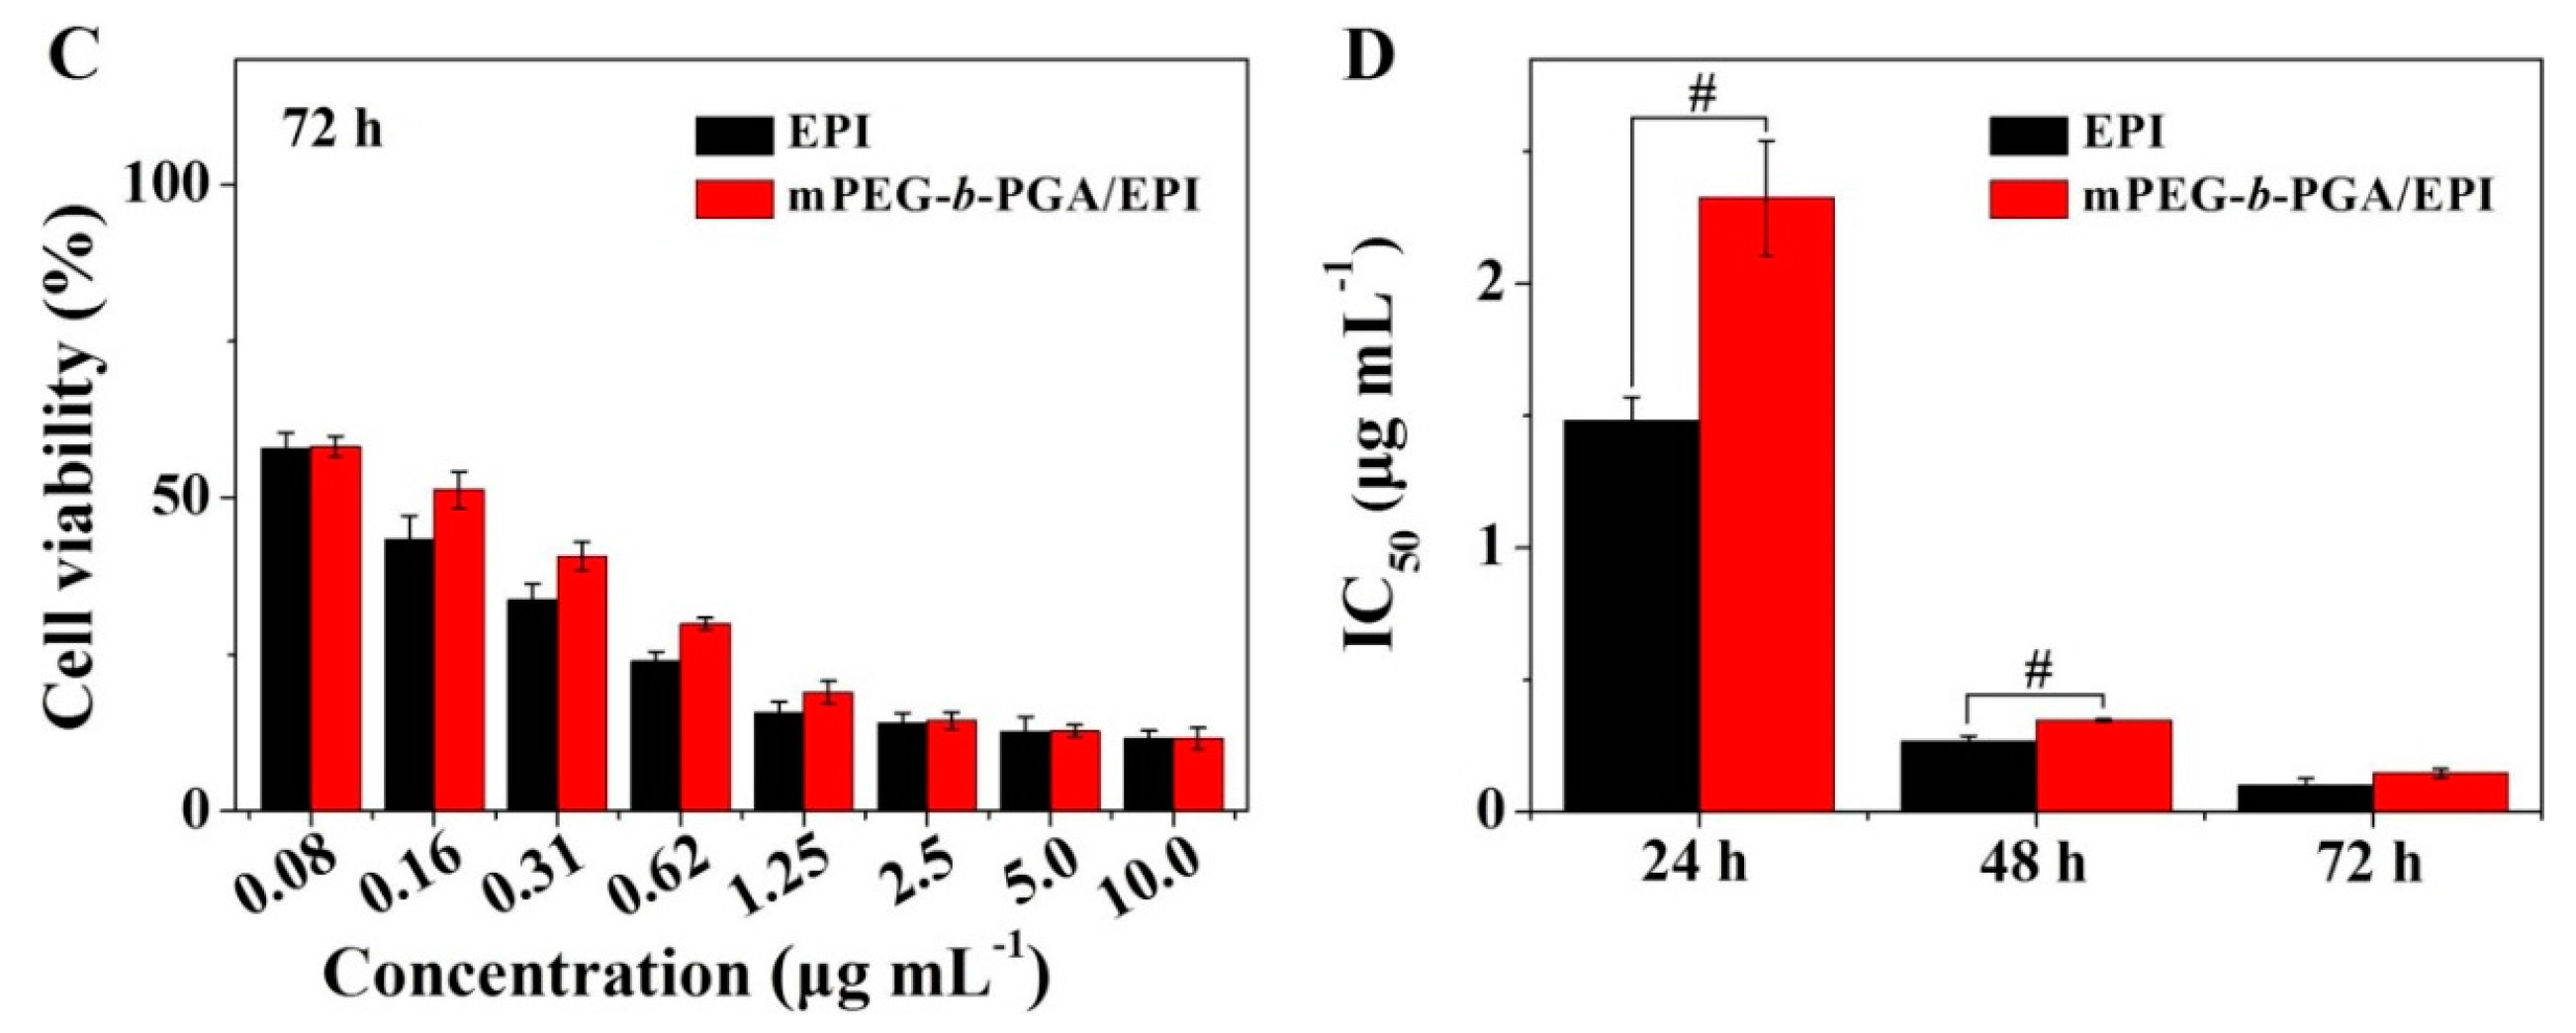
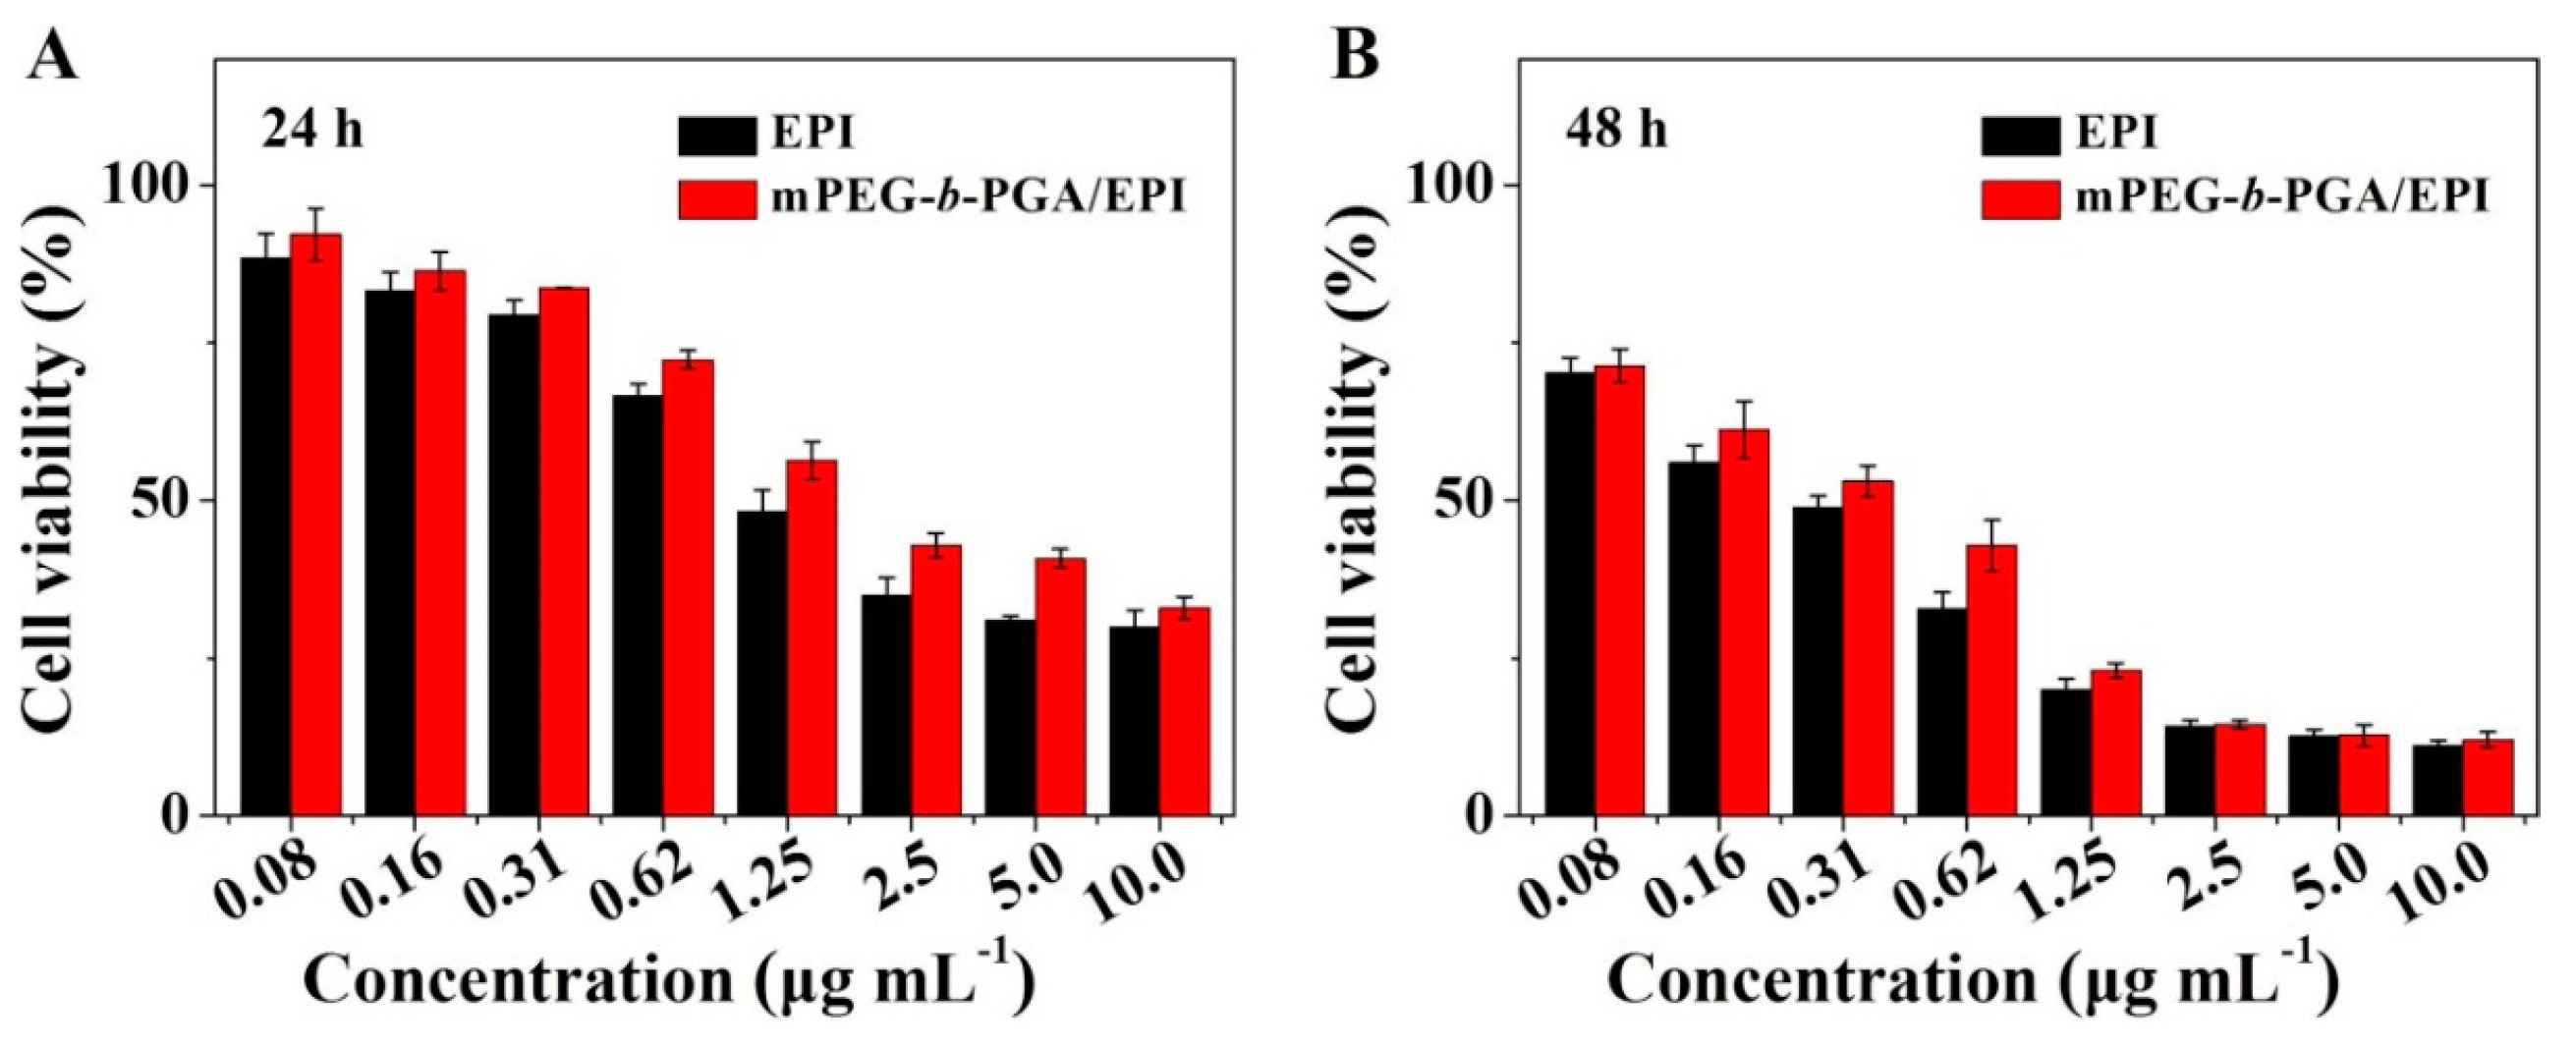
The MTT colorimetric assay was universally used to detect the cytotoxicity of materials and drugs in vitro. In this study, MTT assay was also carried out toward HepG2 cells. As shown in Supplementary Figure S2, mPEG-b-PGA possessed nice cytocompatibility. Even dealt with the maximum concentration of 100.0 μg·mL−1 for 72 h, the cells could keep their viability for more than 90%. It indicated that the polypeptide-based block copolymer was a kind of safe materials for nanocarrier construction as reported previously [14,30]. On drug-related MTT assay, both free EPI and mPEG-b-PGA/EPI exhibited typically time- and agent concentration-dependent cytotoxicity effects (Figure 6). It was worth noted that mPEG-b-PGA/EPI revealed a weaker cell viability inhibition effect compared with free EPI at equivalent drug concentration and test time (i.e., 24, 48, or 72 h), which may be led by the slow agent release rate and cellular uptake as shown in the EPI release and cellular uptake experiments. However, this gap diminished gradually with the extension of time, especially in the groups cultured with high concentrations of EPI (≥2.5 μg·mL−1). The half-maximal inhibitory concentration (IC50) values of different drug formulations also confirmed the above declarations. The IC50 values of mPEG-b-PGA/EPI at 24 and 48 h were 2.3 and 0.3 μg·mL−1, respectively, which were significantly higher than those of free EPI at 1.5 and 0.2 μg·mL−1 (p < 0.01), respectively, whereas the difference of IC50 values between mPEG-b-PGA/EPI and free EPI was not significant at 72 h, which might be caused by the sustained drug release from the micelle and increased intracellular drug accumulation with time.
Figure 4. Cellular uptake microimages of HepG2 cells after incubation with free EPI or mPEG-b-PGA/EPI for 2 or 6 h. Scale bar: 25.0 μm.
Polymers 07 01521 g004
Figure 5. FCM profiles of HepG2 cells incubated with free EPI, mPEG-b-PGA/EPI, or PBS (as control) for 2 (A) or 6 h (B).
Polymers 07 01521 g005
Figure 6. In vitro cytotoxicities of free EPI and mPEG-b-PGA/EPI toward HepG2 cells after incubation for 24 (A); 48 (B); or 72 h (C); and the corresponding IC50 values (D). Data were presented as a mean ± SD (n = 3; # p < 0.01).
Polymers 07 01521 g006aPolymers 07 01521 g006b
The excellent blood compatibility of drug-loaded nanoparticles is an important premise for their clinical applications, because most of them will be administrated through intravenous injection [31]. Several studies have verified that the polypeptide-based block copolymer can improve the blood compatibility of free drugs [32,33]. In this study, the hemolysis assay was performed through spectroscopy based on the previous report [32]. As shown in Supplementary Figure S3C, there was no hemolysis in the mPEG-b-PGA group of various dosages, and the hemolysis ratio was nearly 0% even at the highest polymer concentration of 5.0 mg·mL−1. What is more, mPEG-b-PGA/EPI could relieve the hemolysis induced by high dosages of free EPI (> 0.03 mg·mL−1) and exhibited excellent blood compatibility (Supplementary Figure S3A,B). The ameliorative effect might be attributable to the protection of hydrophilic shell and the negatively charged surface [16].

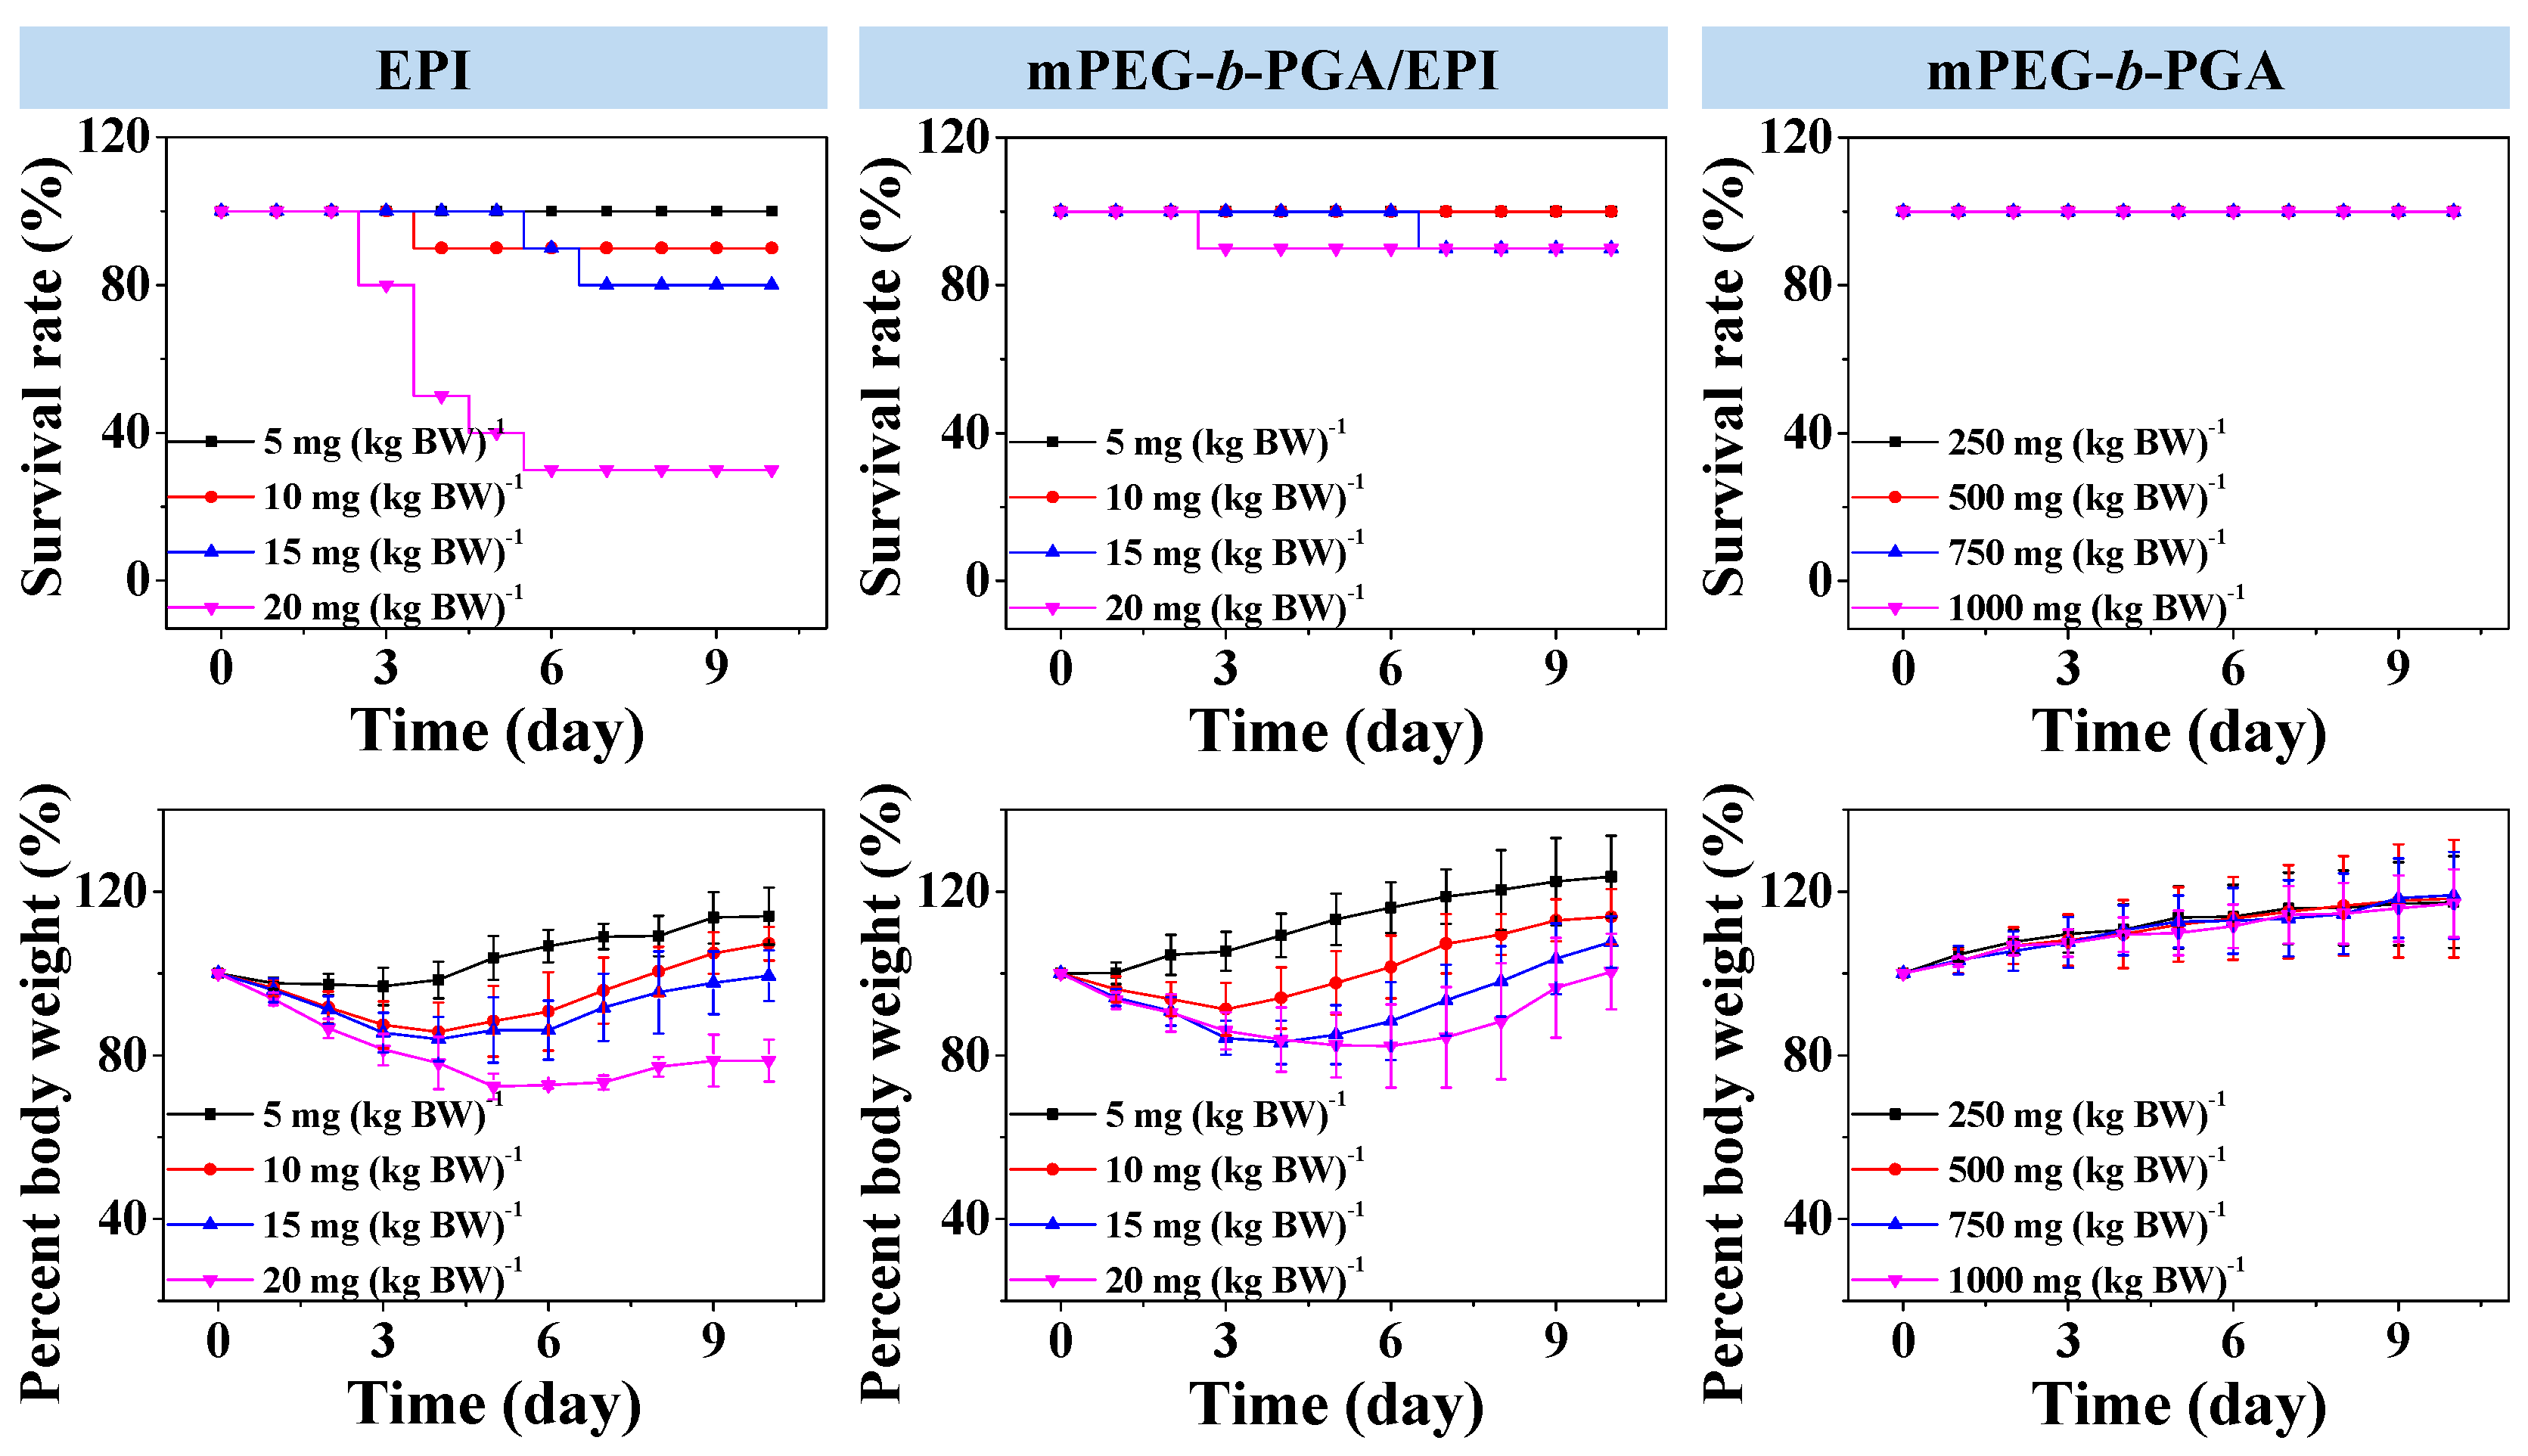
3.3. Upregulated Tolerability of mPEG-b-PGA/EPI in Vivo

MTD, which reflects the toxicity and tolerability, is one of the most important indices for the in vivo applications of various therapeutic agents. Usually, a higher MTD predicts better efficacy. In this study, the MTDs were estimated by a single intravenous injection of mPEG-b-PGA at doses of 250.0, 500.0, 750.0, and 1000.0 mg per kg body weight (mg·(kg·BW)−1), and free EPI and mPEG-b-PGA/EPI at 5.0, 10.0, 15.0, and 20.0 mg EPI equivalent per kg body weight to Kunming mouse. The survival rates and body weights of mice were monitored for 10 days after intravenous injection.
The survival rate and body weight change situations in MTD tests were showed in Figure 7. In terms of survival rate, no death appeared in various doses of mPEG-b-PGA group. The survival rates of free EPI group at doses of 5.0, 10.0, 15.0, and 20.0 mg·(kg·BW)−1 were 100%, 90%, 80%, and 30%, respectively, at the end of all the tests. In contrast, there were no dead animals in the mPEG-b-PGA/EPI group at both low and medium doses (i.e., 5.0 and 10.0 mg·(kg·BW)−1), while the survival rates of high dose groups (i.e., 15.0 and 20.0 mg·(kg·BW)−1) were both high, up to 90% after the same observation period. In terms of body weight, a stable increase could be seen in the mPEG-b-PGA group, while there were various decrease levels of body weights in the drug-treated groups except low dose of mPEG-b-PGA/EPI group (i.e., 5.0 mg·(kg·BW)−1). However, the decrease extent of mPEG-b-PGA/EPI group was smaller, and the recovery was more rapid compared with that of free EPI group. At the end of all the tests, the percentage body weights to the original values of mPEG-b-PGA/EPI group at dose of 5.0, 10.0, 15.0, and 20.0 mg·(kg·BW)−1 were 123.6% ± 10.0%, 113.9% ± 6.8%, 107.7% ± 6.3%, and 100.5% ± 9.3%, respectively, which were significantly higher than those of free EPI group at the equivalent dose (i.e., 114.0% ± 7.0%, 107.2% ± 4.1%, 99.4% ± 6.1%, and 78.7% ± 5.1%, respectively). The MTD was estimated according to the threshold at which all animals survived and the loss of body weight was below 15% [24]. The MTD of free EPI was determined to be between 5.0 to 10.0 mg·(kg·BW)−1, which was lower than that in previous studies due to different animal species in tests [34]. However, mPEG-b-PGA/EPI was able to upregulate the MTD of EPI to between 10.0 and 15.0 mg·(kg·BW)−1, which was nearly two times higher than that of free drug. Therefore, mPEG-b-PGA possessed excellent biocompatibility, and mPEG-b-PGA/EPI was a better formulation than free EPI for clinical use. In addition, the diets of mice were quantified during the MTD test. As shown in Supplementary Figure S4, the variation trend of food and water in all groups were consistent with the change of body weight, which further confirmed the biocompatibility of mPEG-b-PGA and the advantage of mPEG-b-PGA/EPI.
Figure 7. Survival rates and percent body weights of Kunming mice after intravenous injection of free EPI or mPEG-b-PGA/EPI at EPI equivalent dose of 5.0, 10.0, 15.0, or 20.0 mg·(kg·BW)−1, or mPEG-b-PGA at dose of 250.0, 500.0, 750.0, or 1000.0 mg·(kg·BW)−1 (n = 10).
Polymers 07 01521 g007

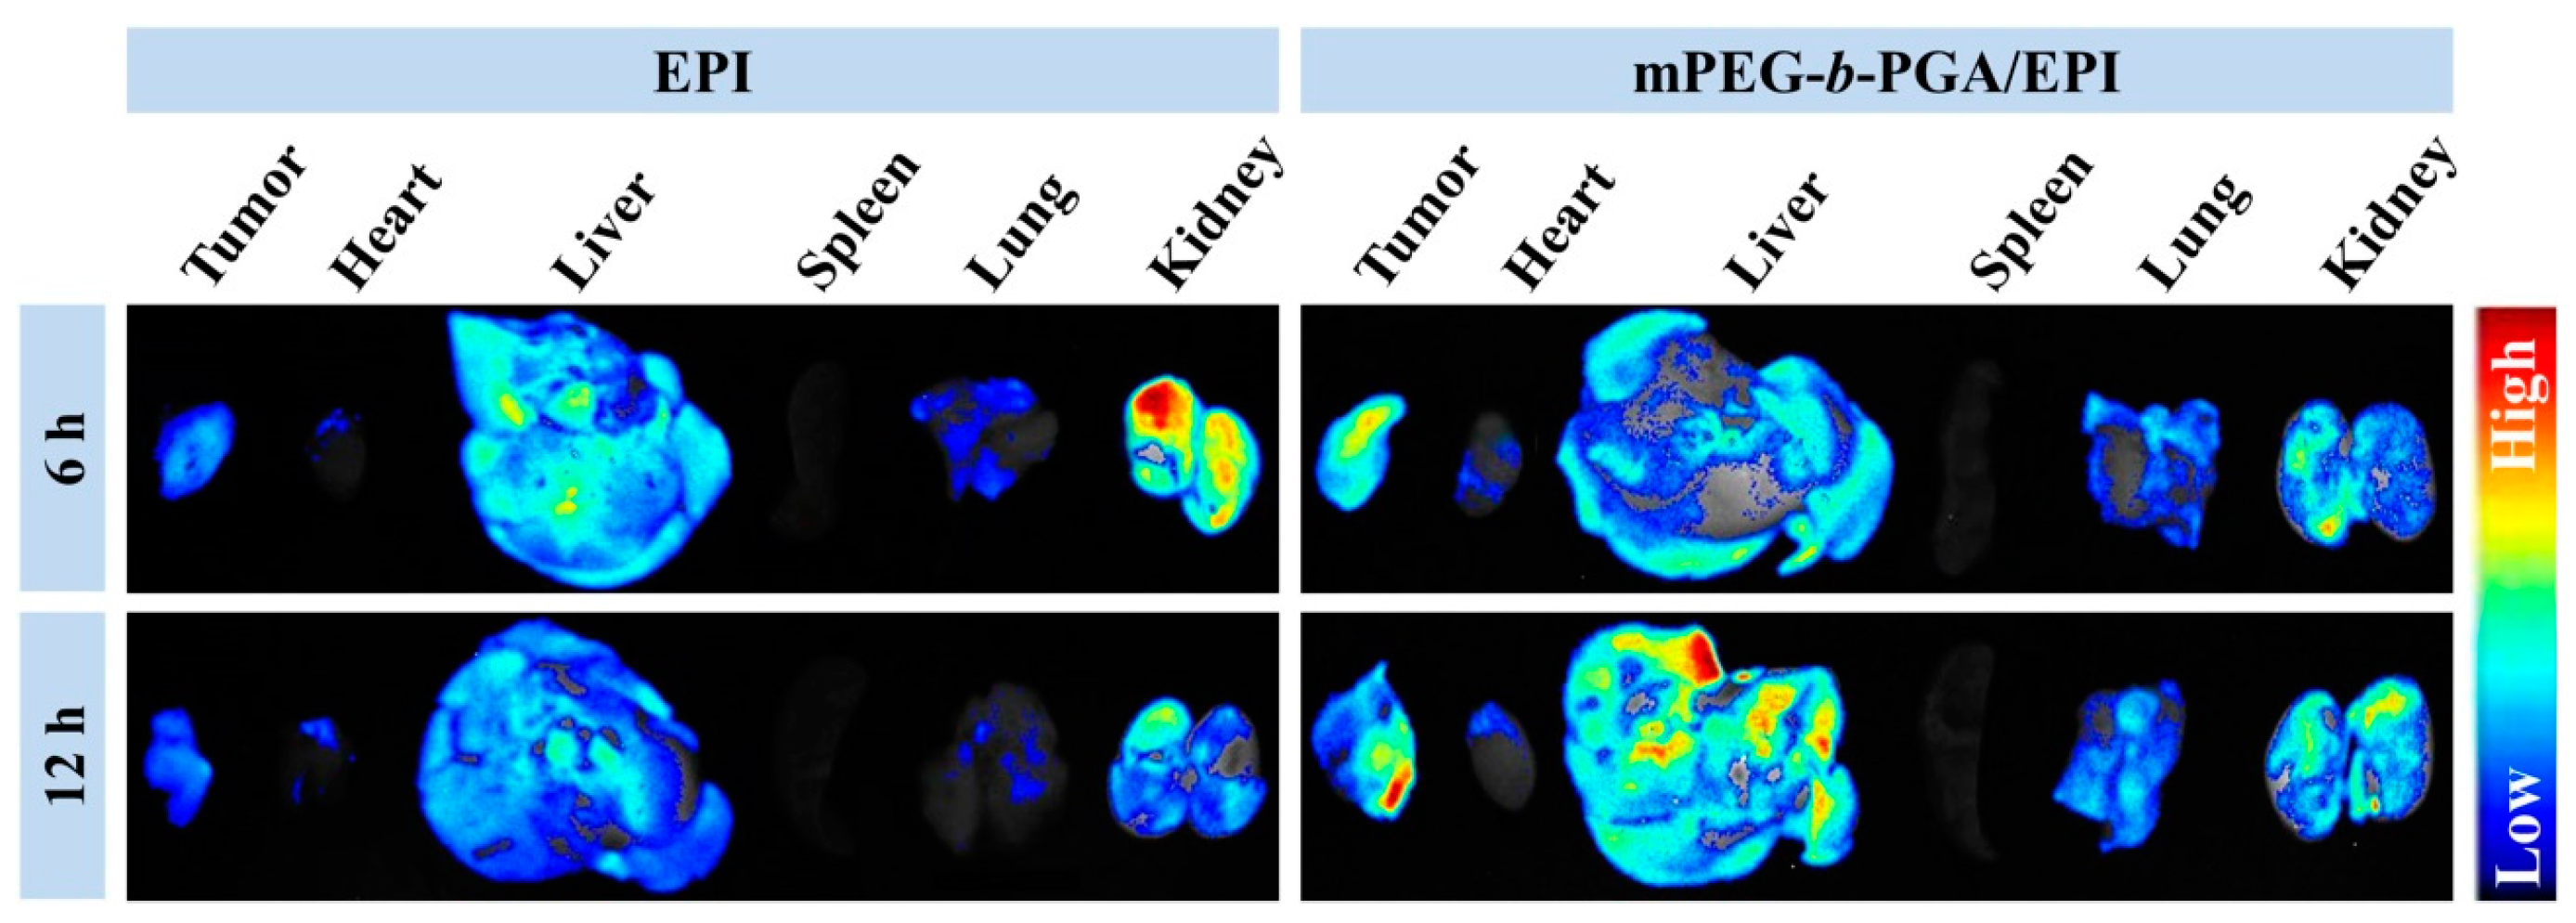
3.4. Improved Tissue Distribution and Enhanced Antitumor Efficacy of mPEG-b-PGA/EPI in Vivo

The tissue biodistribution of antitumor pharmaceuticals is a crucial factor on therapy efficacy and side effects. To detect the influence of mPEG-b-PGA on the biodistribution of EPI, the ex vivo fluorescence imaging tests of isolated tumors and major organs (i.e., heart, liver, spleen, lung, and kidney) were performed at 6 or 12 h post-injection into H22 HCC-xenografted BALB/c mice. As shown in Figure 8, liver and kidney appeared strong EPI fluorescence after the administration of EPI formulations, suggesting that both of them were mainly metabolized by liver and kidney [17,30]. It is worth mentioning that the fluorescence intensities of tumor and test organs were observed to fall in the free EPI group when the time extended from 6 to 12 h, while that in the mPEG-b-PGA/EPI group increased somewhat. The different changes indicated that the micellization was able to improve the pharmacokinetic character of free drug and made them metabolize longer [16,35]. More meaningfully, the tumor fluorescence intensity of mouse treated with mPEG-b-PGA/EPI for 6 h is stronger than that with free EPI, and the distinction was more obvious at 12 h post-injection.
Figure 8. Ex vivo EPI fluorescence images showing tissue distribution of free EPI and mPEG-b-PGA/EPI in tumors and major organs (i.e., heart, liver, spleen, lung, and kidney) of H22 HCC-xenografted BALB/c mice at 6 or 12 h post-injection (n = 3).
Polymers 07 01521 g008
The semi-quantitative analysis of fluorescence intensity was carried out by Maestro™ 2.4 software (CRi Inc., Woburn, MA, USA). As shown in Figure 9, the average signals, i.e., photon numbers per unit area, were calculated. Generally, the average signals of organs in the free EPI group were relative higher than those of mPEG-b-PGA/EPI group at 6 h post-injection. As the time extended from 6 to 12 h, the variation tendency of average signals in both free EPI and mPEG-b-PGA/EPI groups were opposite as general observation above. More fascinatingly, the average signals of tumors in the mPEG-b-PGA/EPI group were 105.3 ± 15.1 and 123.2 ± 9.5 at 6 and 12 h post-injection, respectively, which were significantly higher than 78.3 ± 5.4 and 66.3 ± 12.4 of free EPI group (p < 0.05 for 6 h, and p < 0.01 for 12 h). The increased agent accumulation in tumor may depend on the EPR effect and predict the increased anticancer efficacy [36].
Figure 9. Average signals collected from the tumors and major organs (i.e., heart, liver, spleen, lung, and kidney) in H22 HCC-xenografted BALB/c mice at 6 or 12 h after intravenous injection of free EPI or mPEG-b-PGA/EPI. Data were presented as a mean ± SD (n =3; * p < 0.05, # p < 0.01).
Polymers 07 01521 g009
The improvement of antitumor efficacy and reduction of side effects from traditional chemotherapy agents are the ultimate goals of polymer nanomedicines. Due to the targeted delivery and increased tolerability of antitumor drugs, mPEG-b-PGA/EPI might possess superior antitumor efficacy with decreased side effects. In this study, H22 cells were chosen as the tumor source to establish the subcutaneous HCC murine model, and then the chemotherapy efficacies of free EPI and mPEG-b-PGA/EPI were assessed. Based on the results of MTD tests, free EPI and mPEG-b-PGA/EPI at EPI equivalent dose of 8.0 mg·(kg·BW)−1, or mPEG-b-PGA at the corresponding material dose in the mPEG-b-PGA/EPI group were administrated through intravenous injection. As shown in 
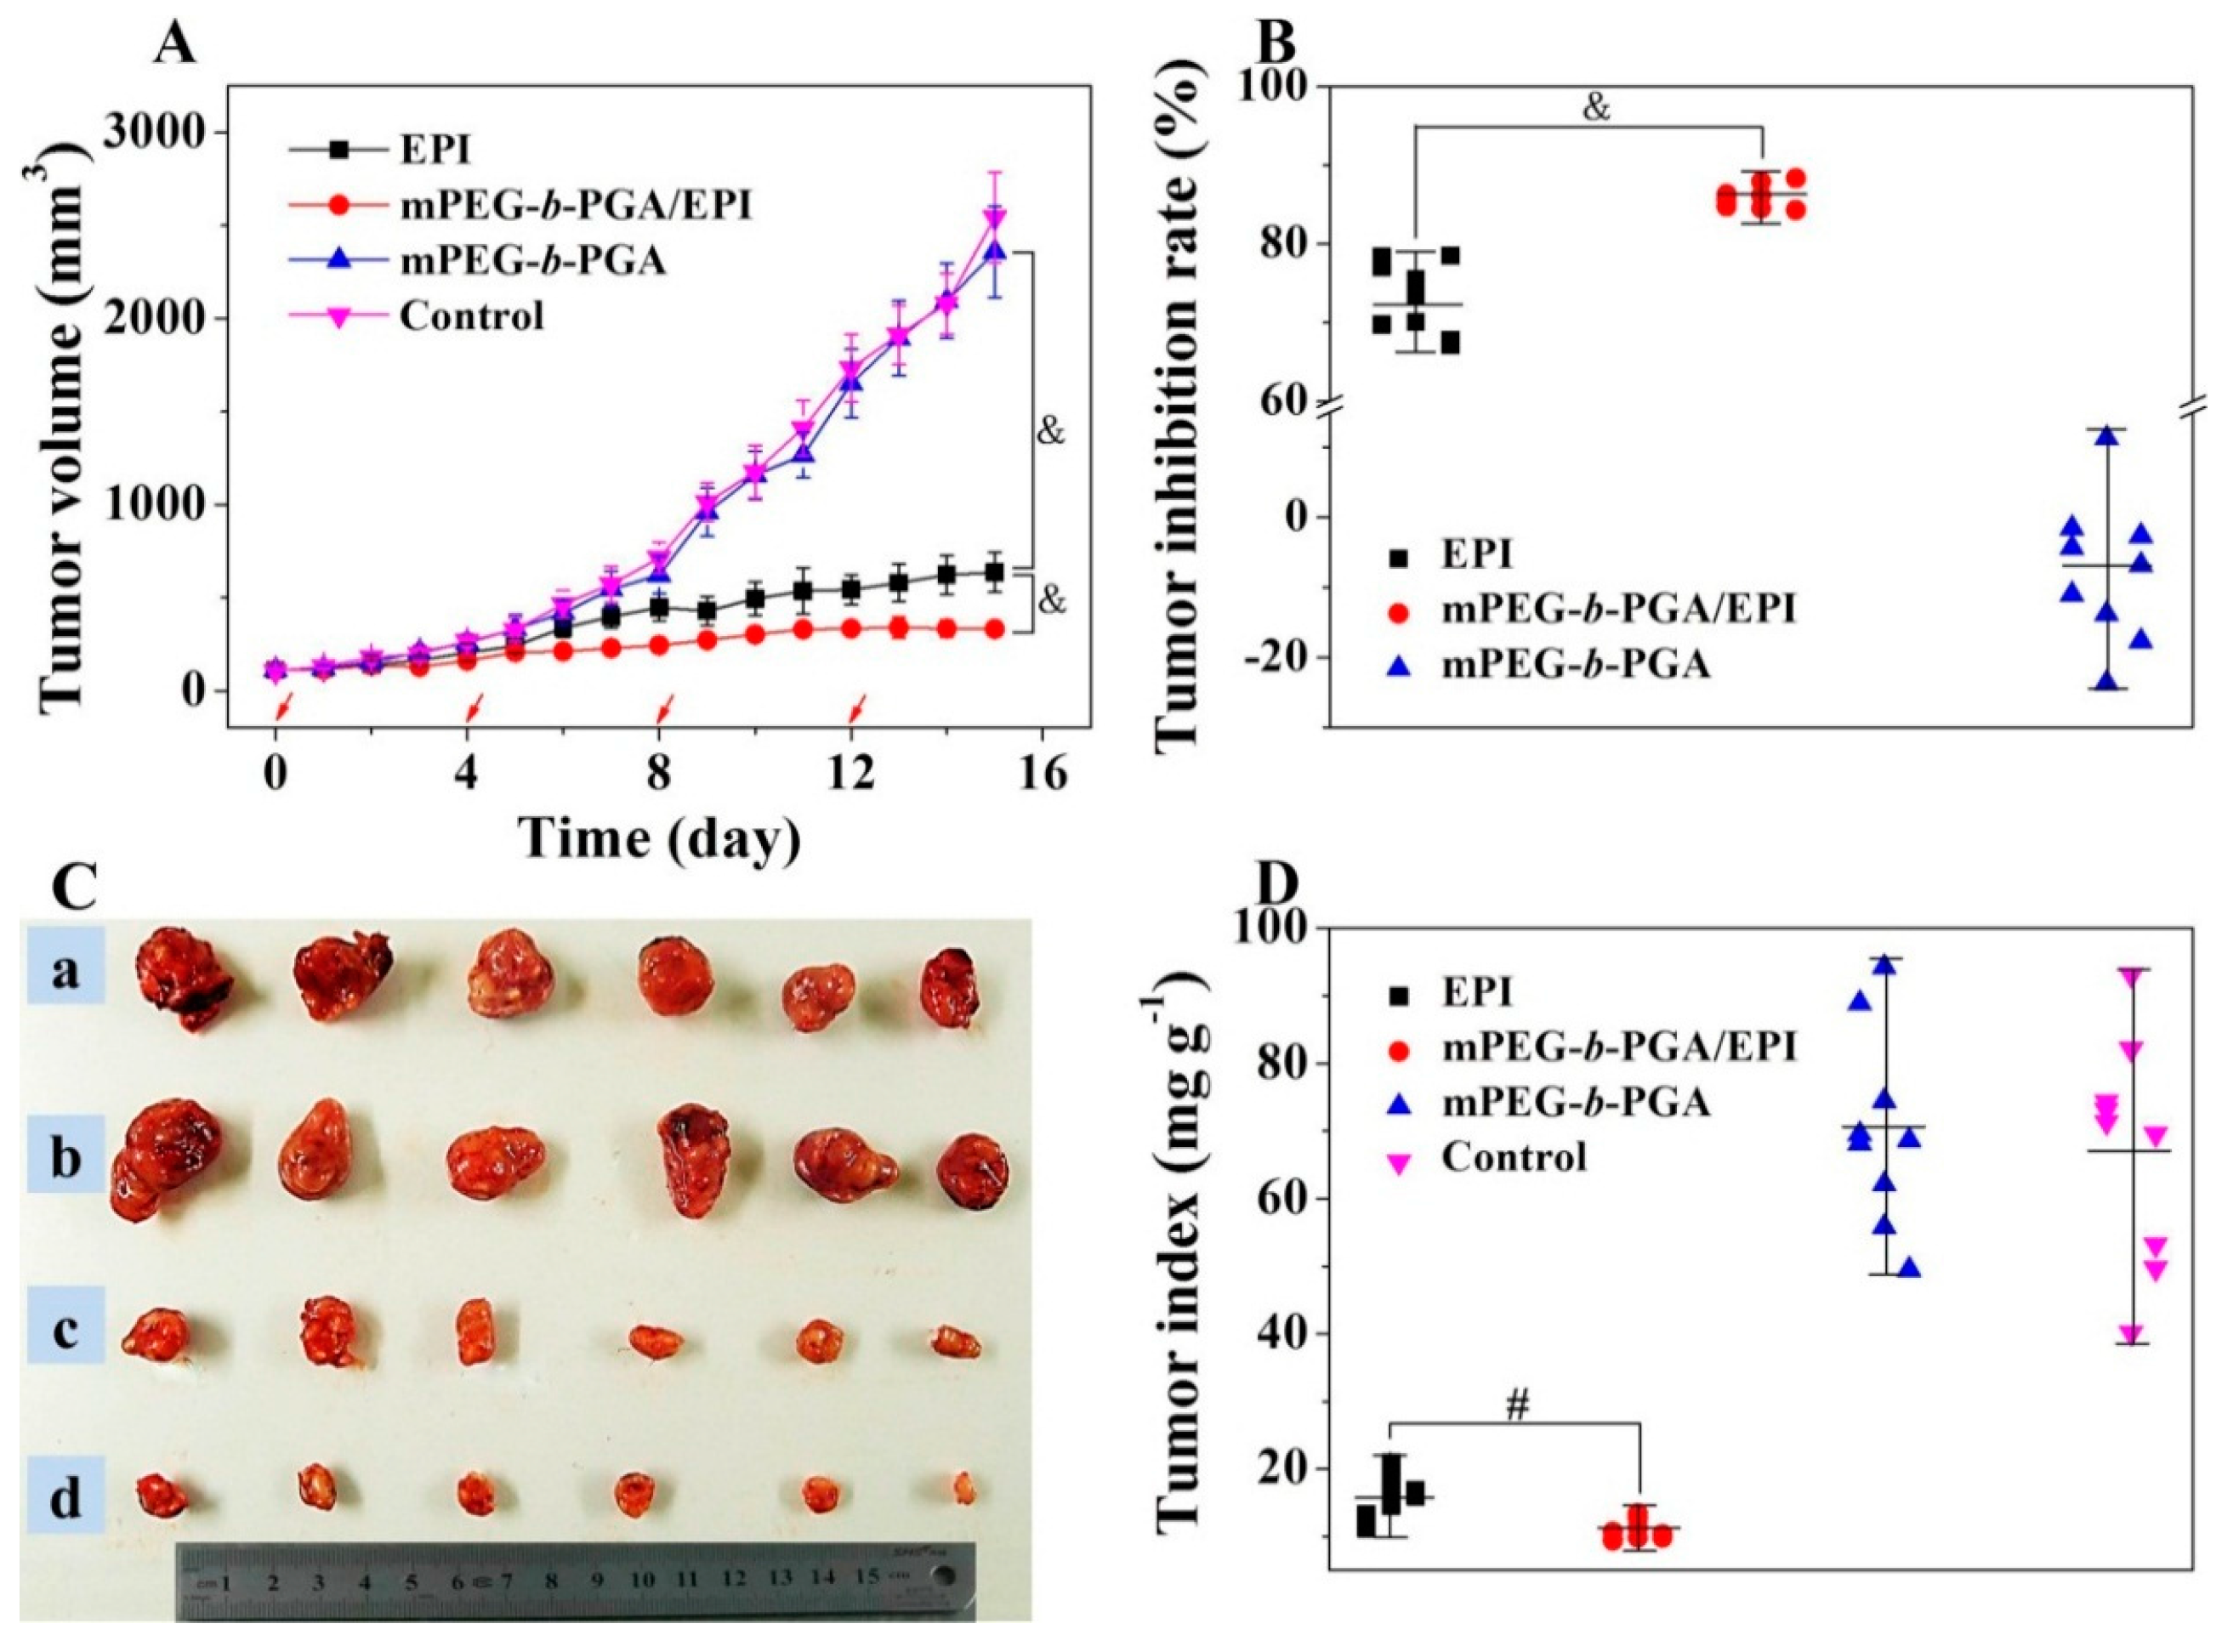
Figure 10, the growth of tumors in the mPEG-b-PGA and control groups was extremely fast, and both of the average tumor volumes exceeded 2000 mm3 within 16 days, indicating the copolymer is not effective against tumor. Although the two EPI formulations both inhibited the growth of tumor compared with NS, the treatment of mPEG-b-PGA/EPI showed a significantly better efficacy than that of free EPI. The average tumor volume in the mPEG-b-PGA/EPI group (i.e., 330.1 ± 35.5) was just half of that in the free EPI group (i.e., 635.1 ± 106.5) at the end of experiment (p < 0.001; Figure 10A). As shown in Figure 10B, the tumor inhibitory rate of mPEG-b-PGA/EPI is about 13% higher than that of free EPI (73.1 ± 4.5 vs. 86.0 ±1.5, p < 0.001). At the end of all treatments, mice were sacrificed, and the tumors were isolated and weighted to observe the tumor suppression effects generally, and tumor indices were calculated. As shown in Figure 10C, the tumor volumes of mPEG-b-PGA and control groups were obviously bigger than those of drug-treated groups, and the mPEG-b-PGA/EPI group had the smallest tumor volume. The results of tumor indices showed that the mass rate of tumor and mouse (mg·kg−1) in the mPEG-b-PGA/EPI group was 10.8 ± 1.4, which was significantly lower than 15.6 ± 3.1 of free EPI group (Figure 10D, p < 0.01). The enhanced antitumor efficacy of mPEG-b-PGA/EPI could be explained with the following two reasons. First, the slow and pH-sensitive drug release could be realized with the protection of mPEG-b-PGA, so the blood circulation time and effective action time to tumor were prolonged [37]. Second, micellization created a higher agent concentration in tumor site by the EPR effect, and the tumor toxicity was enhanced.
Figure 10. Tumor volumes (A); tumor inhibitory rates (B); tumor macroscopical images (C); and tumor indices (D) of H22 HCC-xenografted mice after treatment with free EPI, mPEG-b-PGA/EPI, or mPEG-b-PGA with NS as control. The red arrows in (A) meant the treatment times. Tumors in a, b, c, and d of (C) were from control, mPEG-b-PGA, free EPI, and mPEG-b-PGA/EPI groups, respectively. Data were presented as mean ± SD (n = 10; # p < 0.01, & p < 0.001).
Polymers 07 01521 g010
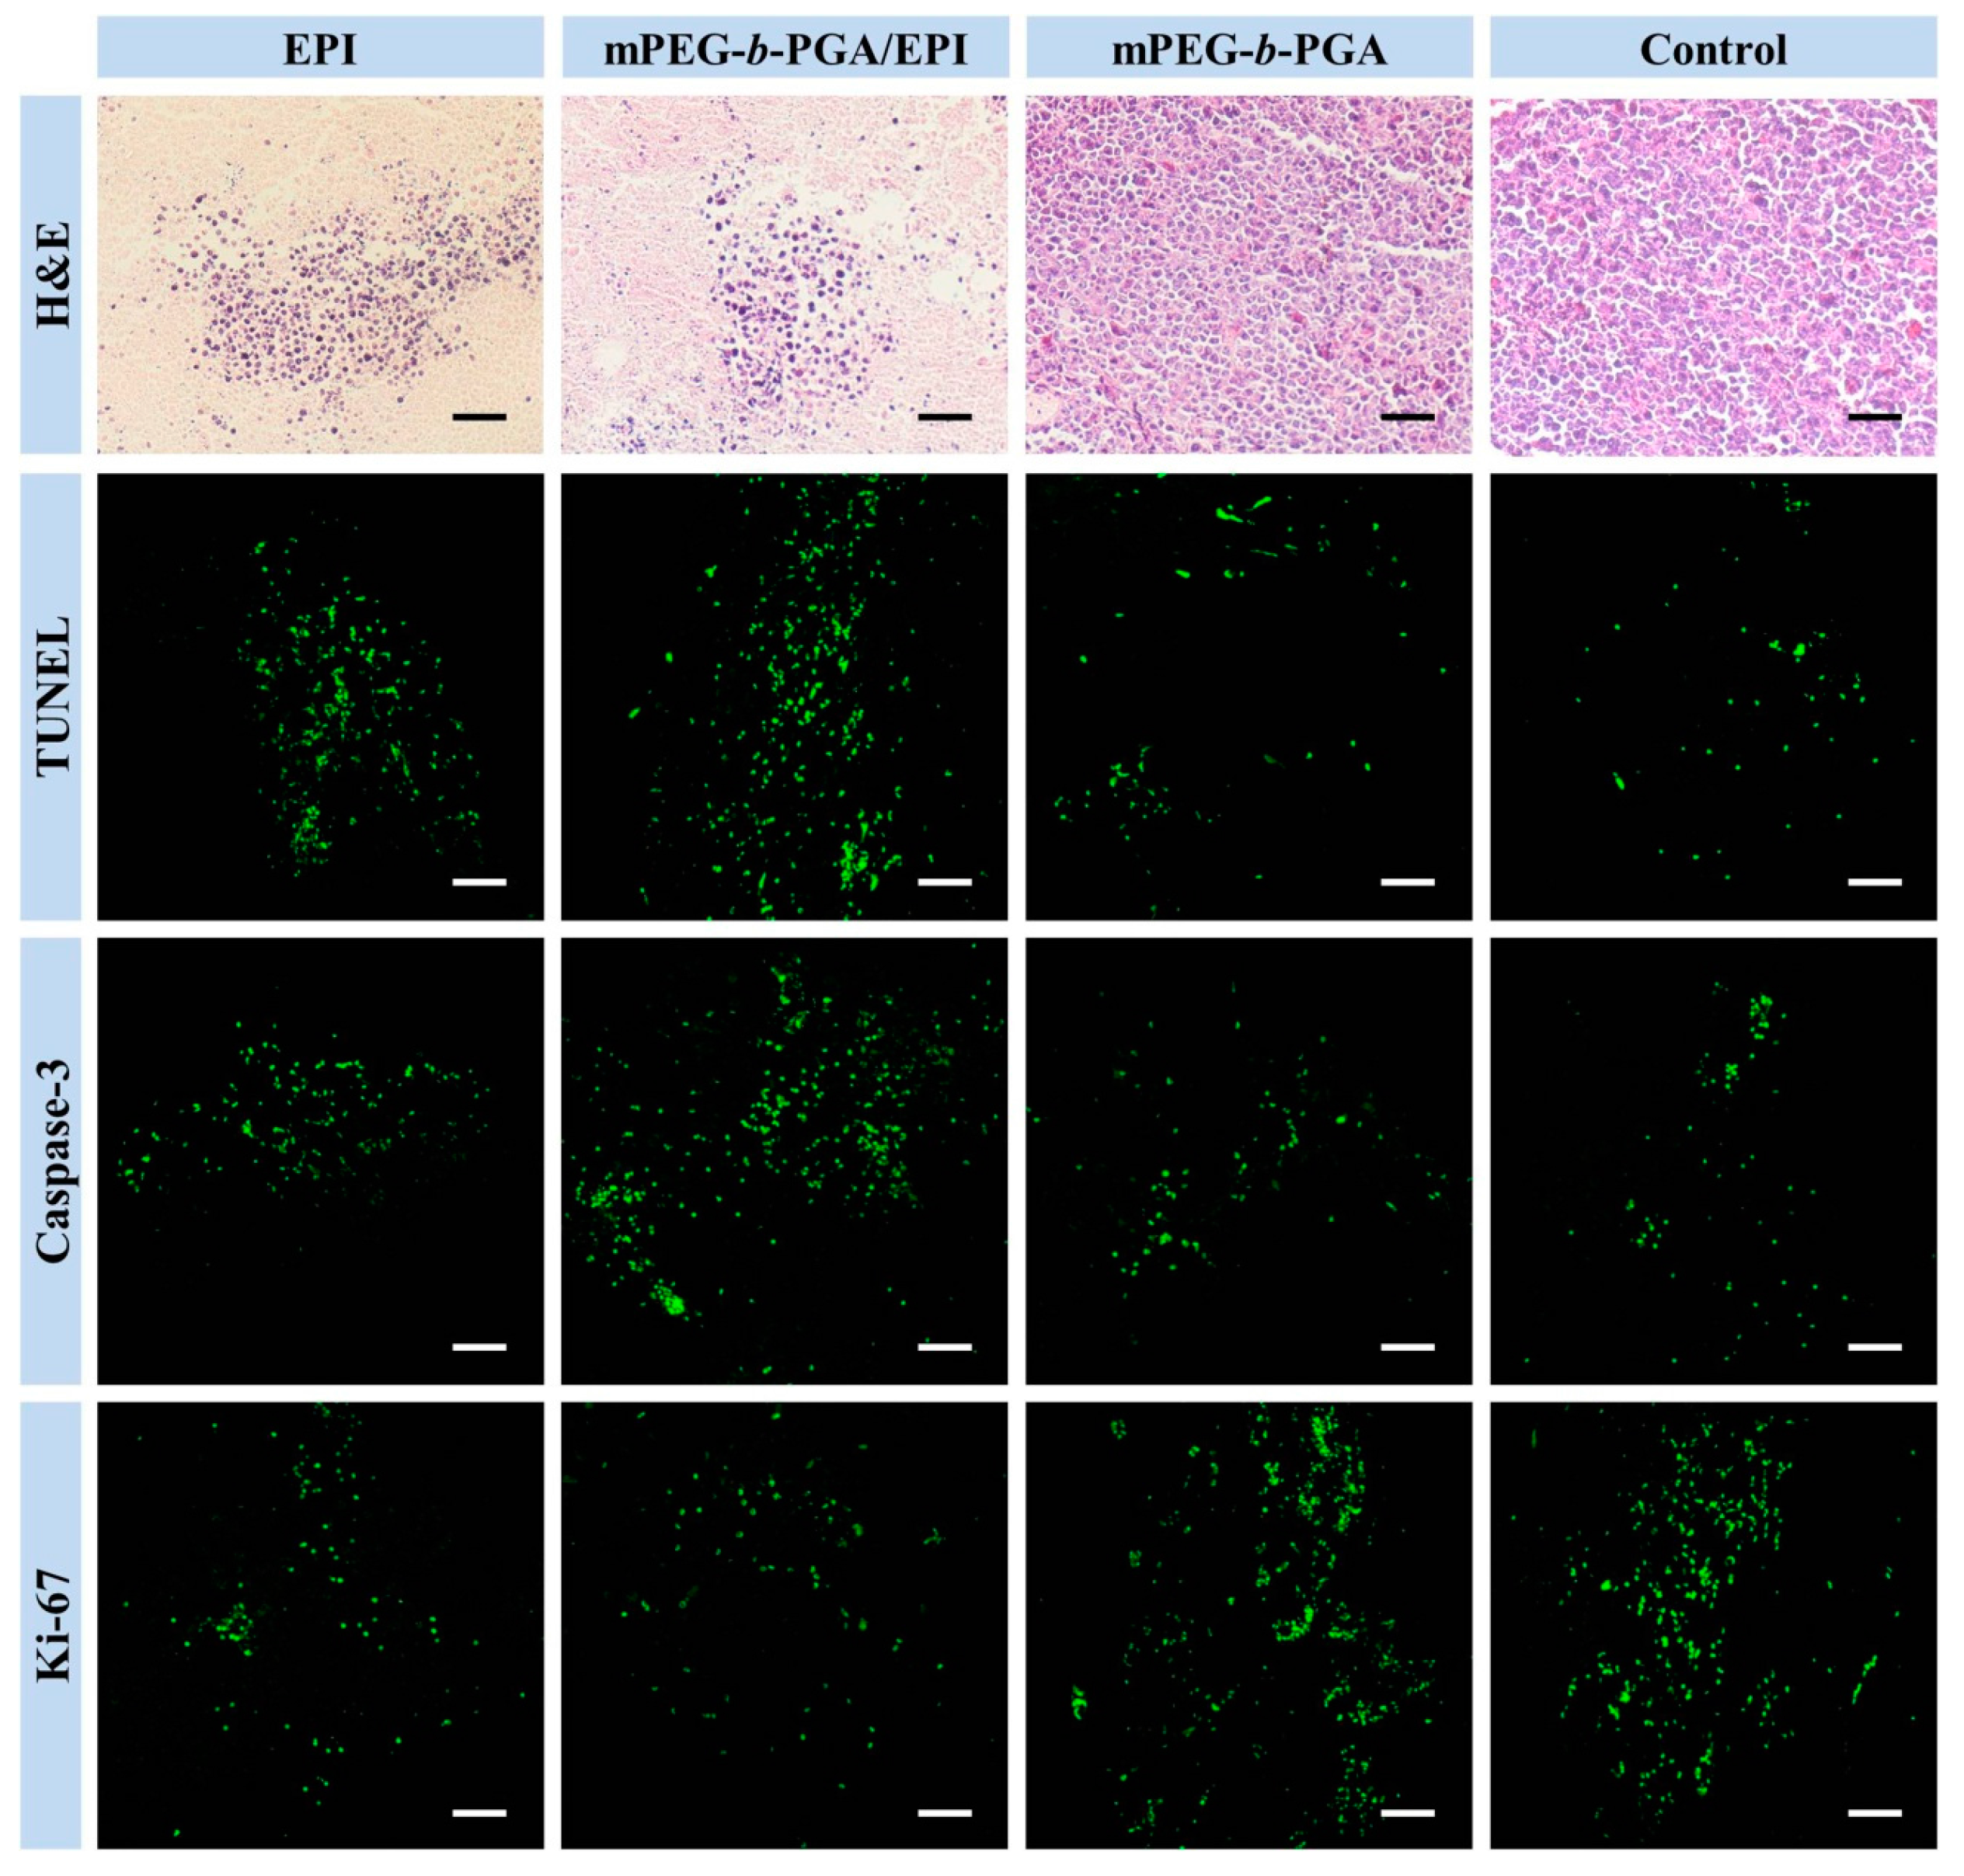
Besides the macroscopic observation, the microscopic examinations were also necessary to evaluate the antitumor efficacies. For this purpose, the histopathological assay, in situ apoptosis, and immunohistochemical assays of isolated tumors were carried out at the end of all treatments (Figure 11).
Figure 11. Histopathological (i.e., H&E), in situ cell apoptosis (i.e., TUNEL), and immunohistochemical analyses (i.e., cleaved caspase-3 and Ki-67) of tumor sections after treatment with free EPI, mPEG-b-PGA/EPI, mPEG-b-PGA, or NS as control. Scale bar: 50.0 μm.
Polymers 07 01521 g011
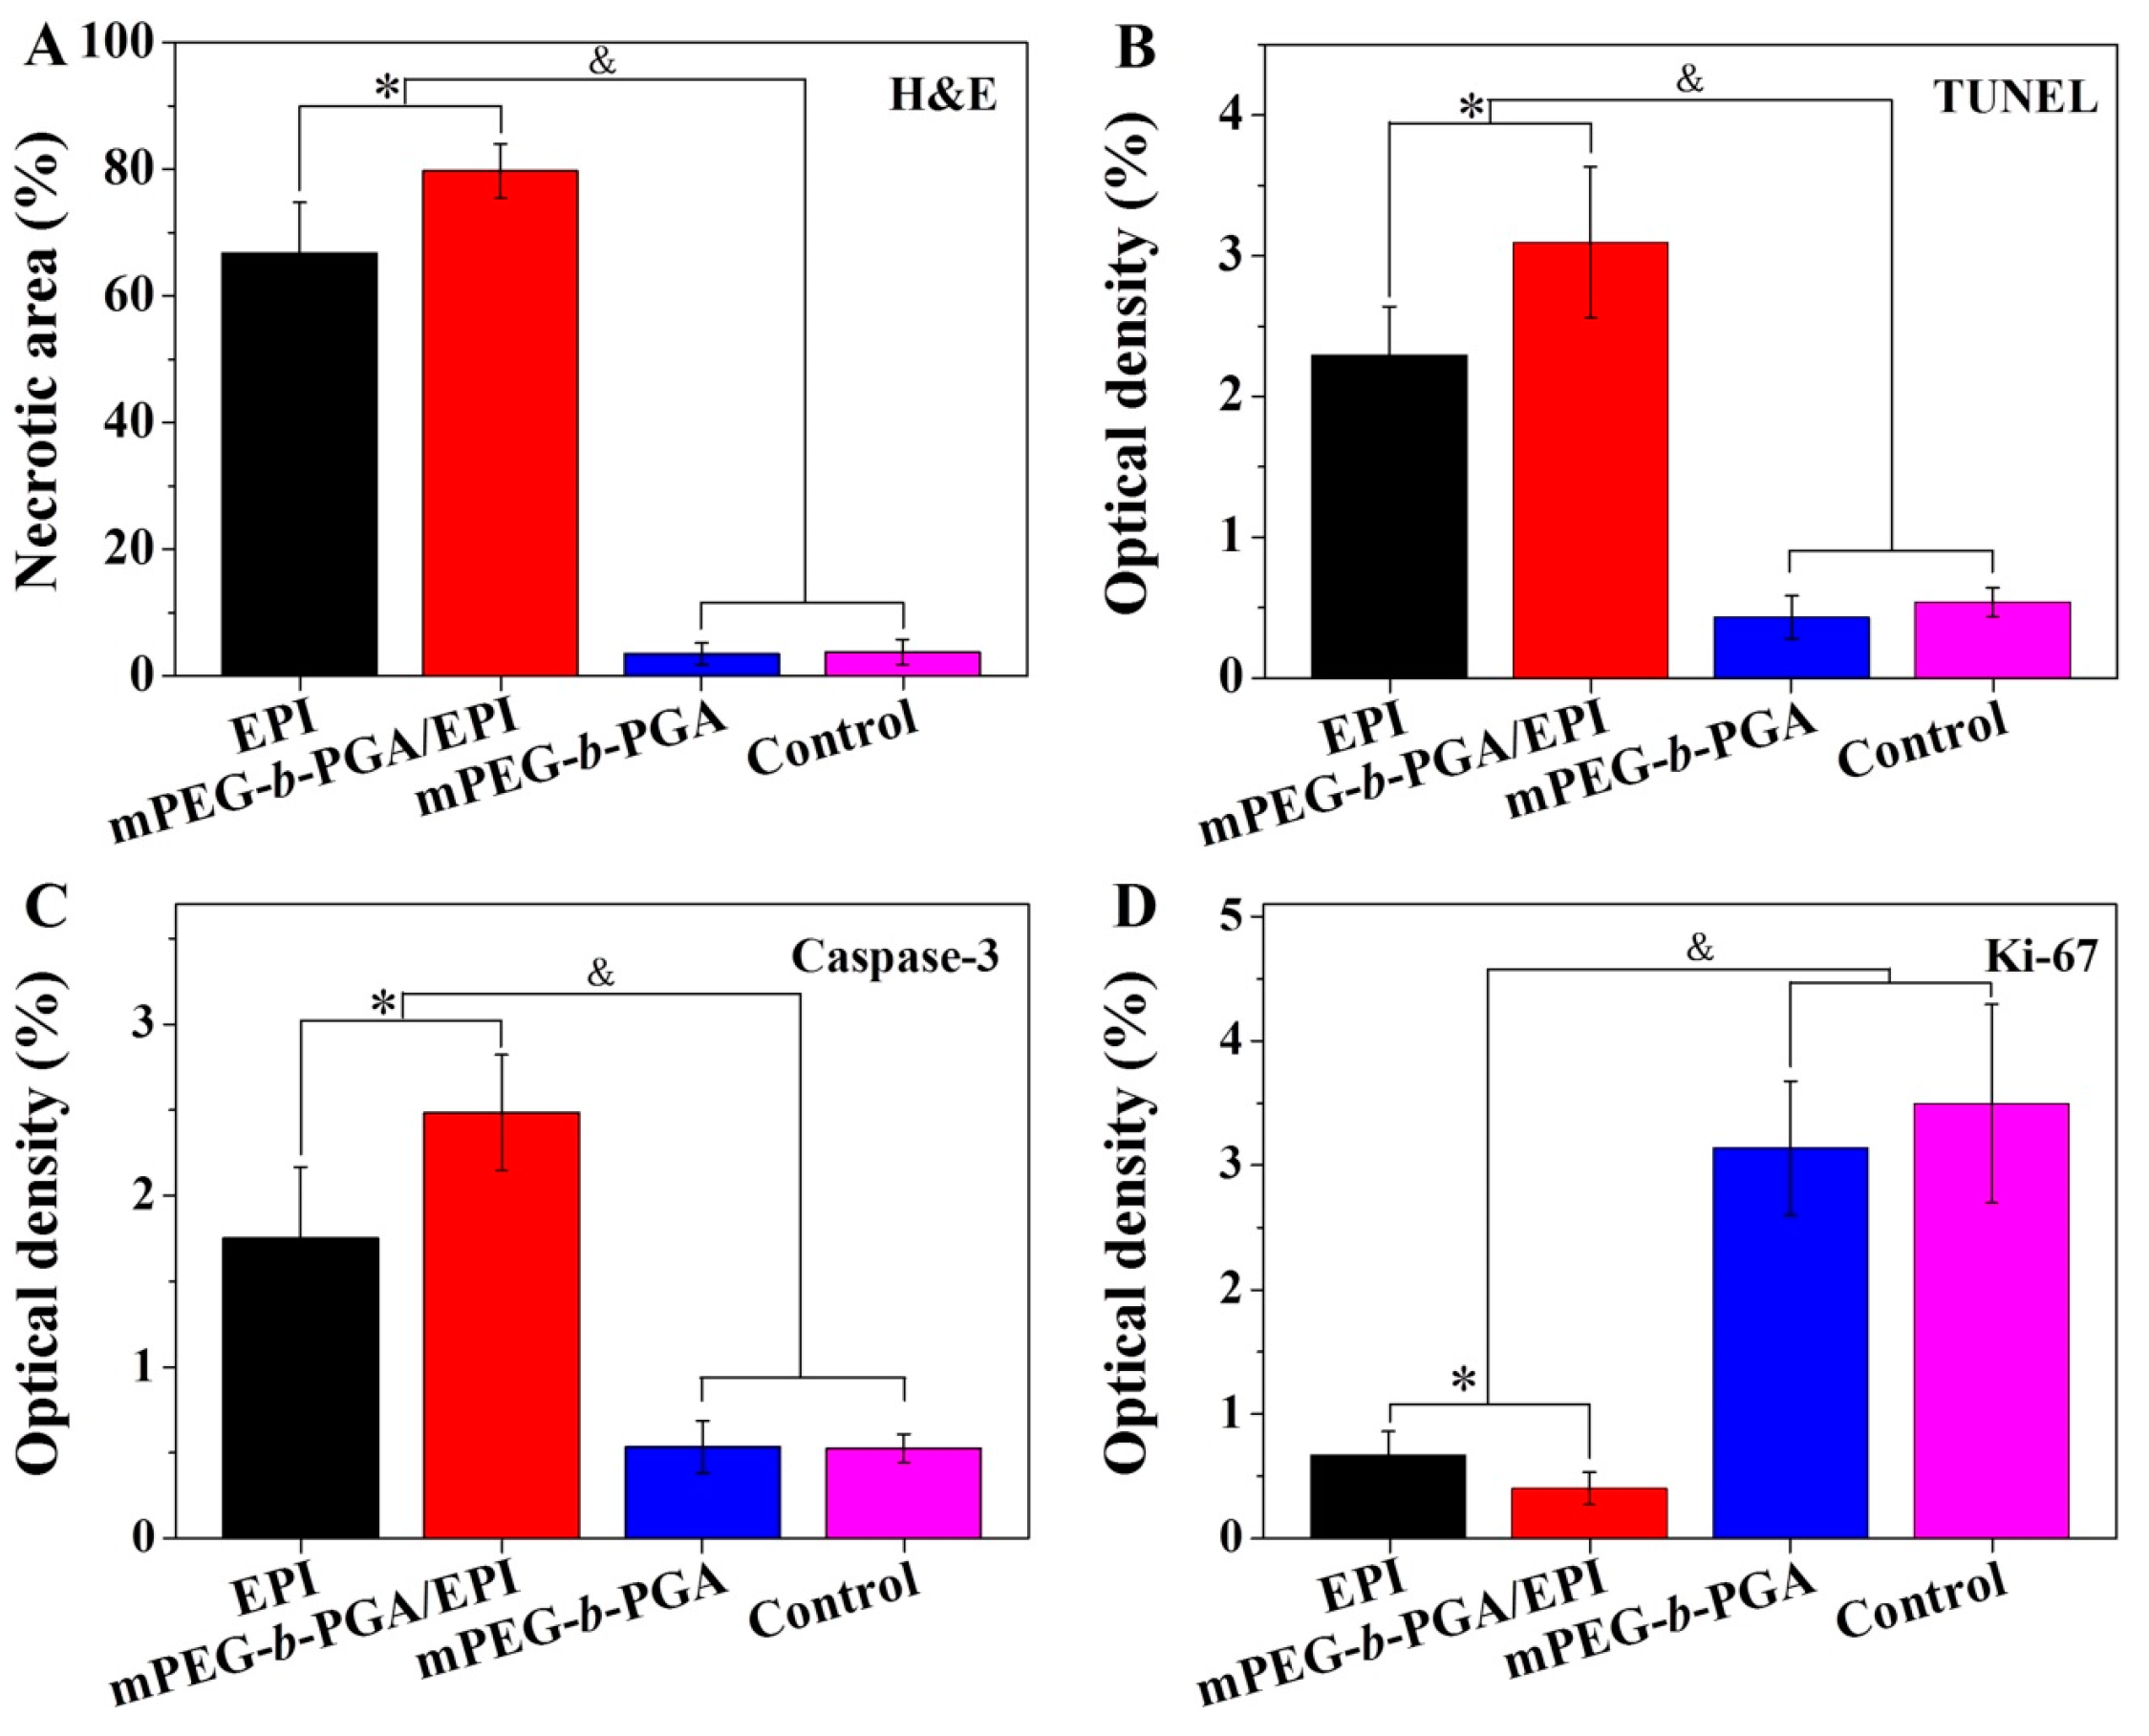
H&E staining, a gold standard for diagnoses of many diseases, including malignancy, etc., is widely used in the observation and identification of cell apoptosis and tissue necrosis. In normal tissues, the cell nuclei will be stained bluish violet by alkaline hematoxylin, while the extracellular matrix and cytoplasm present varying degrees of pink for the reaction between protein and acidic eosin. On contrast, necrotic cells loss their normal cellular morphologies, and nuclear pyknosis, fragmentation, and even disappearance appeared. The results of H&E staining in this study showed that there almost no pathological changes in the tumors of both mPEG-b-PGA and control groups, while large areas of amorphous substance could be seen in the groups of therapeutic agents (Figure 11). The semi-quantitative calculation of tumor necrosis areas with NIS-Elements BR Imaging Software (Nikon Instruments SpA, Florence, Italy) showed that the mPEG-b-PGA/EPI group exhibited the highest necrosis degree among all the test groups, and its relative tumor necrosis area, i.e., 79.7% ± 4.2%, was about 13% higher than that of free EPI group (Figure 12A). All these results are consistent with those from the macroscopic observation and conformed again a better therapeutic efficacy of mPEG-b-PGA/EPI.
Apoptosis is an important pathway of cell death and can be induced by chemotherapy effectively. During the process of apoptosis, the activated endogenous nucleic acid enzyme can cut genomic DNA into fragments of different sizes, which can be labeled by green fluorescein isothiocyanate (FITC) in TUNELkit. The results of TUNEL staining toward the tumor sections of different treatment groups are similar to those of histopathological tests (Figure 11). There are only a few scattered fluorescent signals in the tumor sections of both mPEG-b-PGA and control groups, indicating a small number of physiologic apoptosis. In contrast, the fluorescent signals in the groups with the injections of both EPI formulations obviously increased. The sorting of average relative optical densities in various groups calculated with ImageJ software was as follow: mPEG-b-PGA/EPI > free EPI > mPEG-b-PGA ≈ NS as control (p < 0.05; Figure 12B). In details, the signal of mPEG-b-PGA/EPI group was 3.1% ± 0.5%, about 1.3-fold higher than that of free EPI group, i.e., 2.3% ± 0.3%. The results of TUNEL tests declared that free EPI could inhibit the growth of HCC though the manner of inducting apoptosis, and this manner could be enhanced by mPEG-b-PGA/EPI.
Figure 12. Relative necrotic areas of tumor sections from H&E staining (A); and relative optical densities of tumor sections from TUNEL assay (B); cleaved caspase-3 (C); and Ki-67 analyses (D) after treatment of free EPI, mPEG-b-PGA/EPI, mPEG-b-PGA, or NS as control. Data were presented as mean ± SD (n =3; * p < 0.05, & p < 0.001).
Polymers 07 01521 g012
Caspase 3 plays an important role in the apoptosis pathway and is the executor of cell apoptosis. A lot of key enzymes for keeping cellular activity were the substrates of cleaved caspase-3, that is, an activated form of caspase-3 [38]. The expression level of cleaved caspase-3 is an index of cellular apoptosis. Cytotoxic drugs can activate caspase-3 through multiple signaling pathways and further induce the apoptosis of tumor cells [39]. To further confirm a higher apoptosis-inducing potentiation of mPEG-b-PGA/EPI compared to that of free EPI, the cleaved caspase-3 levels in tumors of all groups were detected by immunohistochemistry. The point-like or flake-like green particles under CLSM represent the expression of this activated protein. Compared with control, both of the EPI formulations could obviously increase the expression of cleaved caspase-3, and the effect of mPEG-b-PGA/EPI was stronger (Figure 11). The situation of average relative optical densities in various groups was the same as those of TUNEL tests (Figure 12C). More specifically, the mPEG-b-PGA/EPI group had the highest relative optical density, and the value was 2.6% ± 0.5%, which was about 1.5-fold higher than that of free EPI group, i.e., 1.7% ± 0.4%. These results confirmed the advantage of mPEG-b-PGA/EPI on another side.
Ki-67 is a kind of nuclear nonhistone protein, which is expressed widely in proliferating cells but lack in quiescent ones. The level of cellular proliferation is able to be illustrated by the Ki-67 detection. It is suggested that Ki-67 may be a predictive factor for the development and prognosis of malignant tumors, and high levels of Ki-67 are often associated with poor prognosis [40]. As shown in Figure 11, there was vast Ki-67 fluorescence signal in the tumor sections of both mPEG-b-PGA and control groups, indicating the vigorous proliferation of tumor cells. As expected, the administration of agents could reverse this situation and the lowest fluorescence signal appeared in the mPEG-b-PGA/EPI group (Figure 11). To explain this situation in more details, the relative optical density of survivin was counted with a similarly above-mentioned embodiment as TUNEL and caspase 3. As shown in Figure 12D, the sorting of apoptosis area was as follow: mPEG-b-PGA ≈ NS (as control) > free EPI > PEG-b-PGA/EPI (p < 0.05). The relative optical densities of tumors treated with free EPI and PEG-b-PGA/EPI were 0.6% ± 0.2% and 0.4% ± 0.1%, respectively, and the rate was about 0.7. Therefore, the fact was verified that mPEG-b-PGA/EPI had a better tumor inhibition effect than free EPI.

3.5. Excellent Security of mPEG-b-PGA/EPI in Vivo

The problem of side effects cannot be ignored in the applications of various drugs, and the security test must be considered in the development of new antitumor drug formulations [41]. EPI possesses the reduced side effects comparing with DOX, but its dose-dependent cardiotoxicity, hepatotoxicity, and myelosuppression are still principal elements to limit its application seriously. To detect the impact of mPEG-b-PGA on EPI side effects, the security assessments in vivo were designed in this study. The contents included body weight changes, organ index detections, and organ pathology assays.
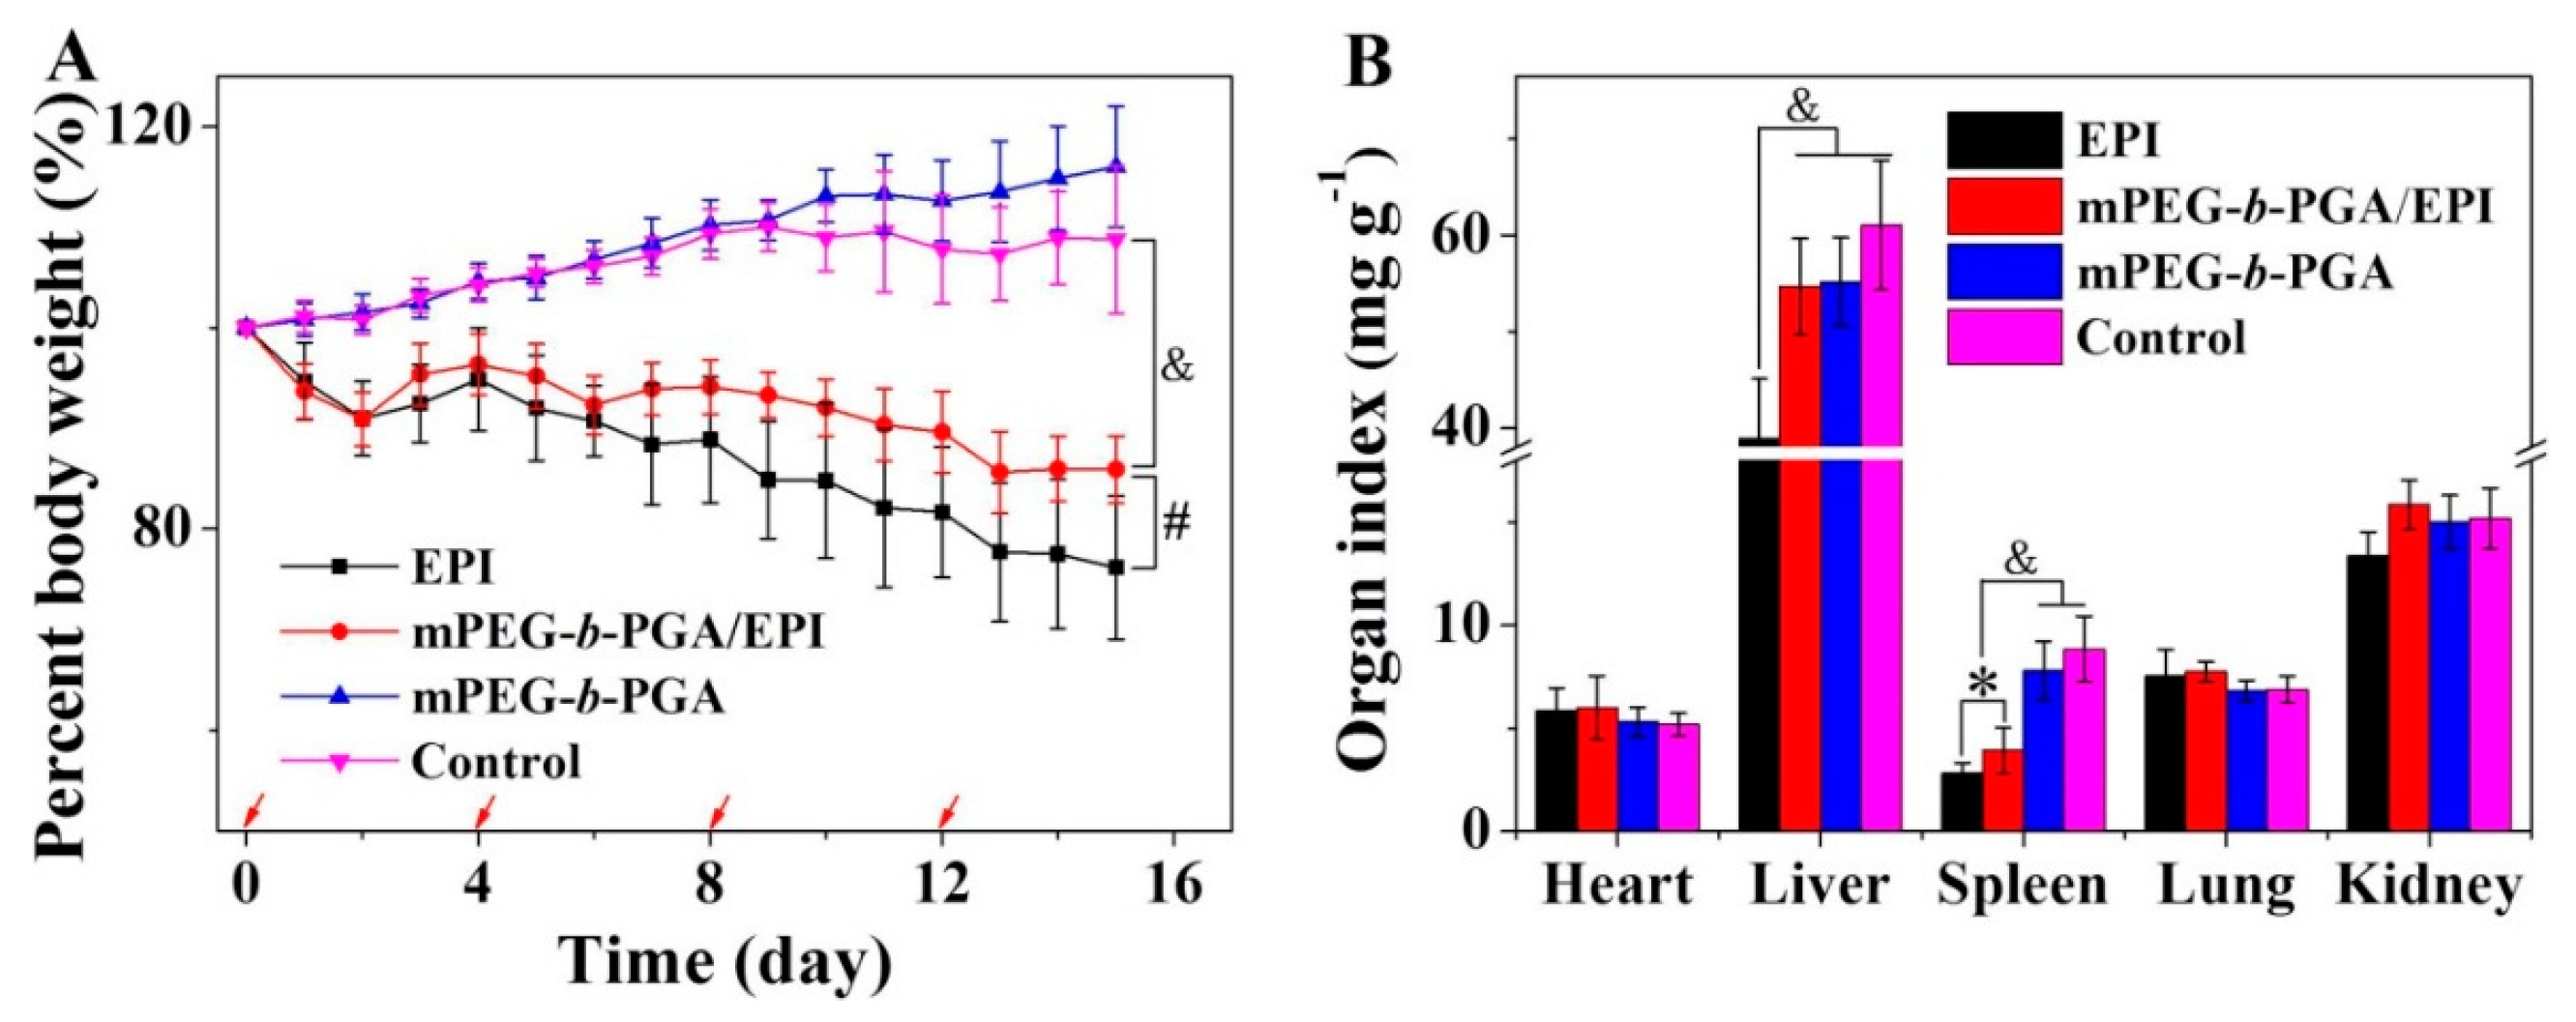
The body weight change is a visualized and important index, which can reflect the systemic toxicity of drugs. Figure 13A depicted the changes of mouse body weights during treatments. Similarly as that of control group, the repeated injection of mPEG-b-PGA did not influence the growth of mouse body weight, indicating its excellent biocompatibility and safety for in vivo application again. More meaningful, the use of mPEG-b-PGA/EPI significantly relieved the body weight loss situation caused by free EPI. The percentage of body weight decrease in the free EPI group was about 23.9%, while that in the mPEG-b-PGA/EPI group was only 14.1% (p < 0.01). This result suggested that this kind of micellar EPI might be a more secure formulation.
Organ indices, the ratios of organs (mg) and body weight (g), is a common index in toxicology experiment and can reflect the organ toxicity of agents partially. In this study, the major organs (i.e., heart, liver, spleen, lung, and kidney) were isolated at the end of all treatments, and organ indices were obtained. As shown in Figure 13B, the major organ indices of mPEG-b-PGA group were nearly same as that of control group. Meanwhile, the dramatically decreased spleen index of mice treated with mPEG-b-PGA/EPI or free EPI was observed, and the value was 3.9 ± 1.1 or 2.8 ± 0.5 mg·kg−1, respectively. However, the former degree is significantly slighter by comparing (p < 0.05). In addition, mPEG-b-PGA/EPI almost completely reversed the liver index decrease in the free EPI group. The liver index in the mPEG-b-PGA/EPI group was 54.7 ± 5.0 mg·kg−1, which was very close to that in the control group (i.e., 61.0 ± 6.7 mg·kg−1) and was significantly higher than that in the free EPI group (i.e., 38.9 ± 6.2 mg·kg−1, p < 0.001). All these results prompted that the protection of mPEG-b-PGA could reduce the organ side effects of free drug.
Figure 13. Body weight changes (A) and organ indices of H22 HCC-xenografted mice (B) after treatment of free EPI, mPEG-b-PGA/EPI, or mPEG-b-PGA with NS as control. The red arrows of (A) meant the treatment times. Data were presented as mean ± SD (n = 10; * p < 0.05, # p < 0.01, & p < 0.001).
Polymers 07 01521 g013
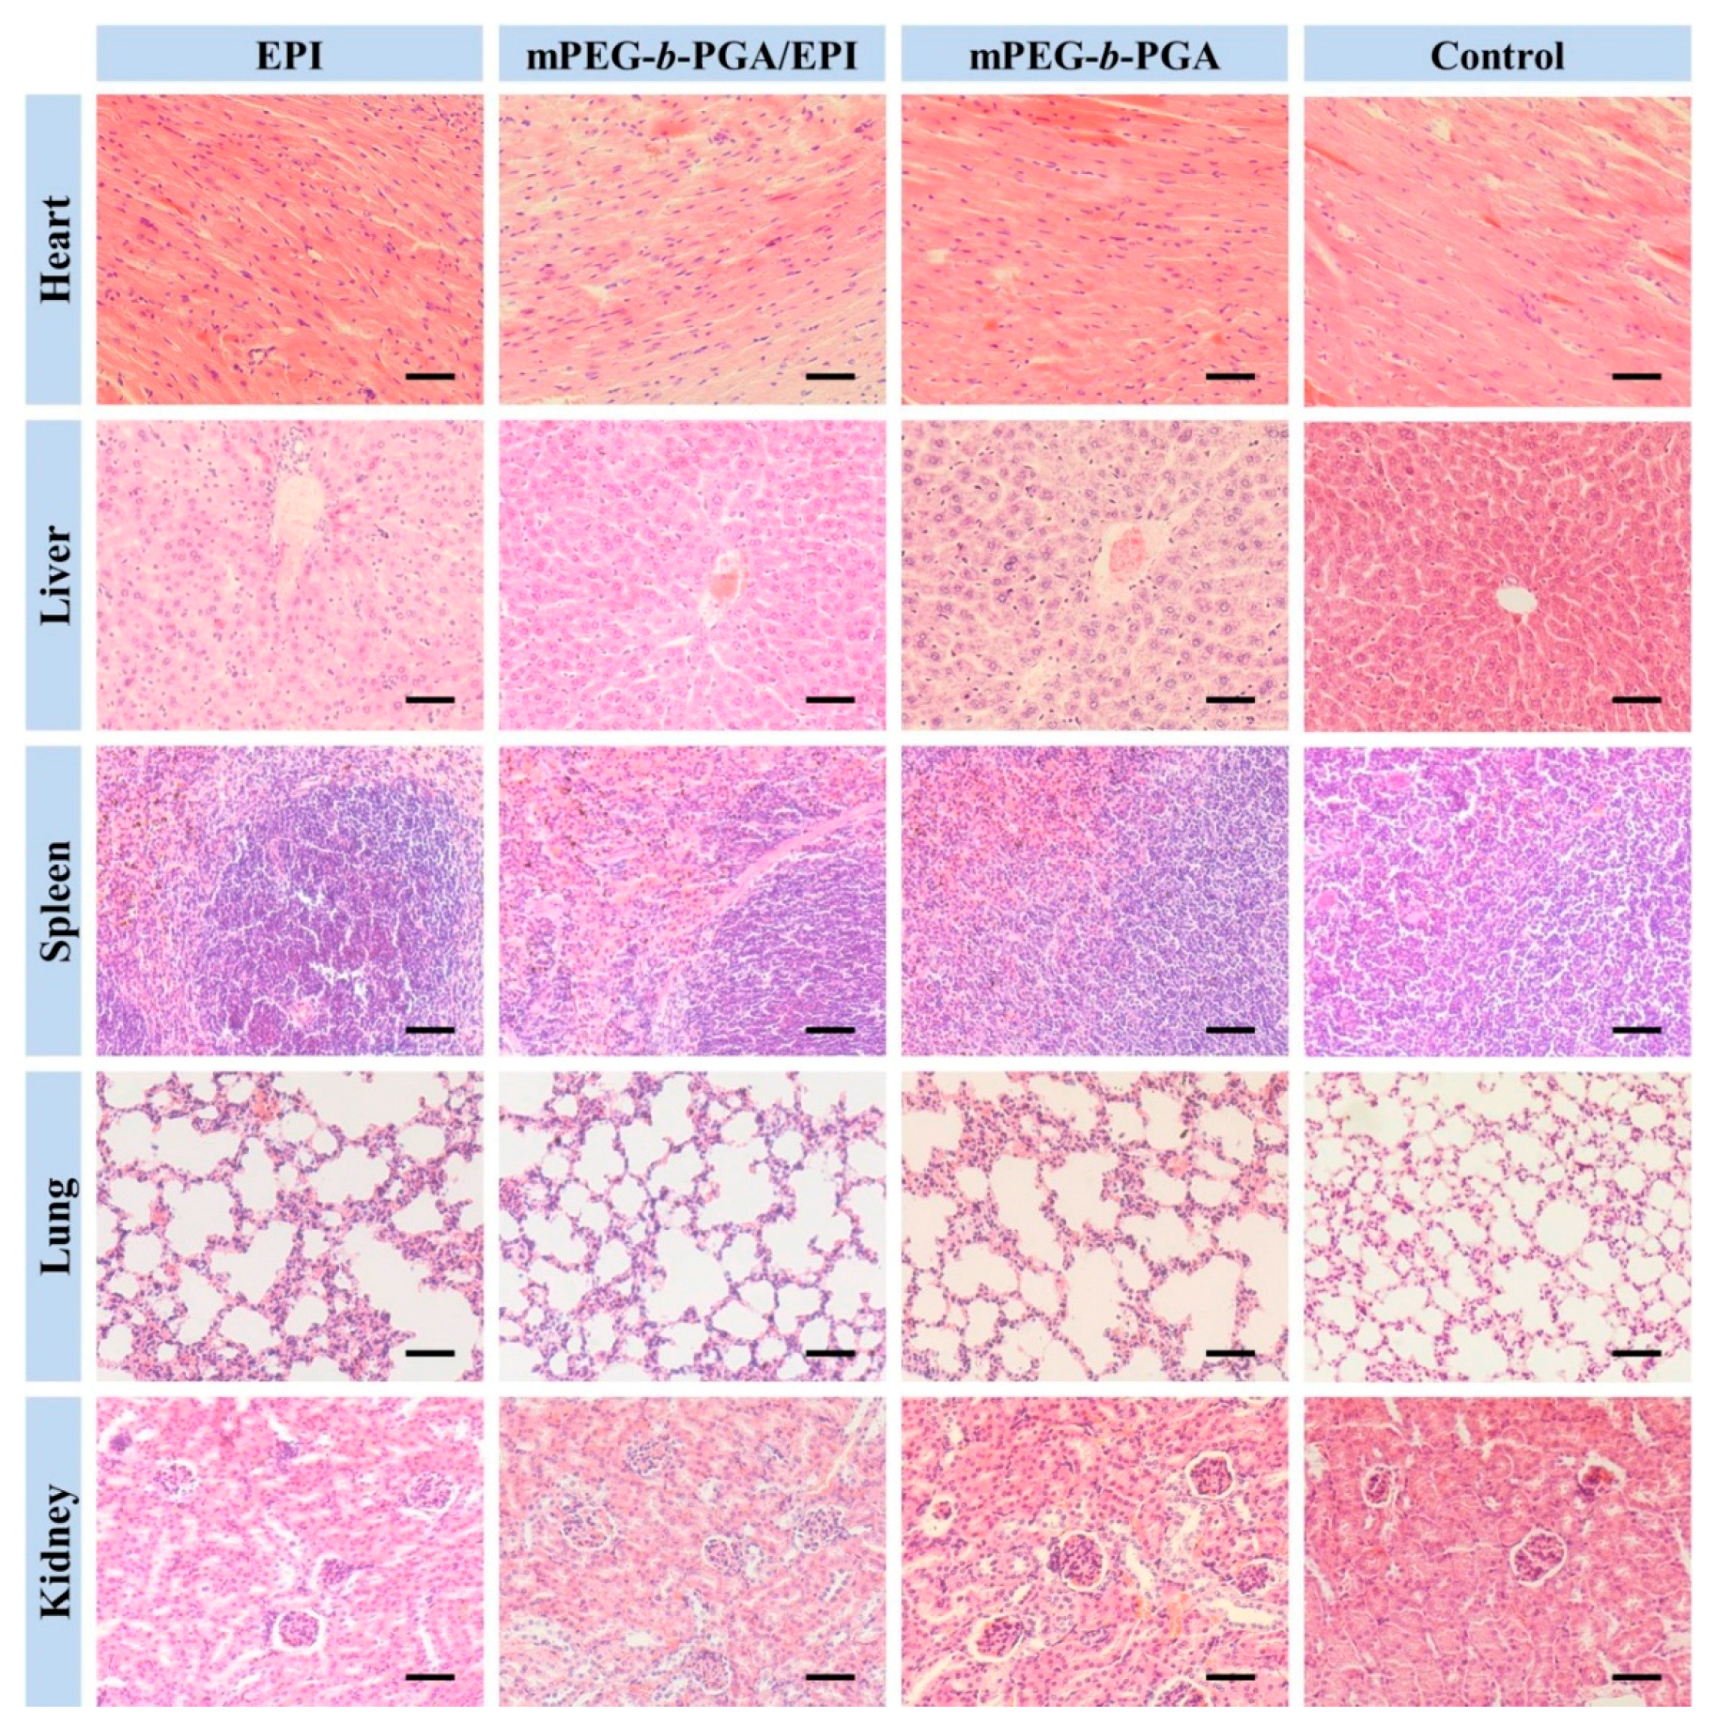
To further verify the advantages of mPEG-b-PGA/EPI on security, the H&E staining of major organs were carried out. The results were showed in Figure 14. There were almost no histopathological changes in the organs of both mPEG-b-PGA and control groups, while varying degree of organ micro-morphological changes, especially in heart, liver, and kidney, could be observed in the EPI formulation groups. Acting as anthracycline antitumor drug, the organ damages of EPI in this study were very similar to those of DOX [42]. The main pathological features included: (i) partial myocardial cells disordered and degenerated with inflammatory cell infiltration more or less; (ii) liver tissue appeared congestion with scattered inflammatory cells, and atrophic and eosinophilic hepatocytes could be seen; and (iii) renal interstitial hyperemia occurred, and some renal capsule shrank or even disappeared. Fortunately, all these changes in the mPEG-b-PGA/EPI group were more moderate compared with those in the free EPI group.
Figure 14. Histological analyses of main organs (i.e., heart, liver, spleen, lung, and kidney) from H22 HCC-xenografted mice after treatment of free EPI, mPEG-b-PGA/EPI, or mPEG-b-PGA with NS as control. Scale bar: 50.0 μm.
Polymers 07 01521 g014
In summary, mPEG-b-PGA/EPI possessed better security than free EPI and could be safely applied in vivo. The improved security might benefit from the structure of micelle, which improved the pharmacokinetic and biodistribution characteristics of free drug [43]. Besides, the pH-sensitive micelle could obviously reduce the payload release in normal tissue, which was also an important reason.

4. Conclusions

The pH-sensitive mPEG-b-PGA/EPI could be developed through a dialysis method by the combination of electrostatic and hydrophobic interactions to efficiently treat HCC. The results of cellular internalization and cytotoxicity tests showed that mPEG-b-PGA/EPI could effectively enter HepG2 cells and exert time- and concentration-dependent cytotoxic effect. With the protection of hydrophilic shell and pH-sensitive cargo release property, the EPI-loaded micelle possessed lower toxicity, more excellent hemocompatibility, and better tolerance than free EPI in toxicological analyses. Further benefited from the proper size, the micellar EPI exhibited the significantly increased agent accumulation in HCC site via the EPR effect compared with free drug. Finally, the significantly improved antitumor efficacy and security of mPEG-b-PGA/EPI compared to free EPI were confirmed using a H22 HCC-xenografted murine model. Considering all these advantages, the EPI-loaded polypeptide-based micelle holds great potential for the clinical chemotherapy of HCC.

Supplementary Materials

The following are available online at www.mdpi.com/2073-4360/7/11/1521/s1. Supplementary Figures: Figure S1. Dh changes of mPEG-b-PGA/EPI in PBS and BSA/PBS of pH 7.4 at 25 °C versus time; Figure S2. In vitro cytotoxicity of mPEG-b-PGA toward HepG2 cells after incubation for 72 h; Figure S3. Hemolysis of free EPI (A), mPEG-b-PGA/EPI (B), and mPEG-b-PGA (C); Figure S4. Diet amounts (e.g., food and water intake amount) of Kunming mice after intravenous injection of free EPI or mPEG-b-PGA/EPI at EPI equivalent dose of 5.0, 10.0, 15.0, or 20.0 mg·(kg·BW)−1, or mPEG-b-PGA at dose of 250.0, 500.0, 750.0, or 1000.0 mg·(kg·BW)−1.

Acknowledgments

This research was financially supported by the National Natural Science Foundation of China (Nos. 51303174, 51233004, 51390484, 51321062, 51473165, 51203153, 51273196, and 21104076), and the Scientific Development Program of Jilin Province (Nos. 20140520050JH, 20140309005GX, and 20130206058GX).

Author Contributions

Qinglin Zhang and Chenwei Lv performed experiments, analyzed results, and wrote the manuscript with the help of Weiguo Xu and Xun Sun. Jianxun Ding and Xiangwei Meng conceived the original idea, managed the throughout research, and revised manuscript.

Conflicts of Interest

The authors declare no conflict of interest.

References

  1. Flores, A.; Marrero, J.A. Emerging trends in hepatocellular carcinoma: Focus on diagnosis and therapeutics. Clin. Med. Insights Oncol. 2014, 8, 71–76. [Google Scholar] [PubMed]
  2. Torre, L.A.; Bray, F.; Siegel, R.L.; Ferlay, J.; Lortet-Tieulent, J.; Jemal, A. Global cancer statistics, 2012. CA Cancer J. Clin. 2015, 65, 87–108. [Google Scholar] [CrossRef] [PubMed]
  3. Palmer, D.H.; Hussain, S.A.; Johnson, P.J. Systemic therapies for hepatocellular carcinoma. Expert Opin. Investig. Drugs 2004, 13, 1555–1568. [Google Scholar] [CrossRef] [PubMed]
  4. Cho, K.; Wang, X.; Nie, S.; Chen, Z.G.; Shin, D.M. Therapeutic nanoparticles for drug delivery in cancer. Clin. Cancer Res. 2008, 14, 1310–1316. [Google Scholar] [CrossRef] [PubMed]
  5. Cheng, A.L.; Kang, Y.K.; Chen, Z.; Tsao, C.J.; Qin, S.; Kim, J.S.; Luo, R.; Feng, J.; Ye, S.; Yang, T.S.; et al. Efficacy and safety of sorafenib in patients in the Asia-Pacific region with advanced hepatocellular carcinoma: A phase III randomised, double-blind, placebo-controlled trial. Lancet Oncol. 2009, 10, 25–34. [Google Scholar] [CrossRef]
  6. Llovet, J.M.; Hernandez-Gea, V. Hepatocellular carcinoma: Reasons for phase III failure and novel perspectives on trial design. Clin. Cancer Res. 2014, 20, 2072–2079. [Google Scholar] [CrossRef] [PubMed]
  7. Kamaly, N.; Xiao, Z.; Valencia, P.M.; Radovic-Moreno, A.F.; Farokhzad, O.C. Targeted polymeric therapeutic nanoparticles: Design, development and clinical translation. Chem. Soc. Rev. 2012, 41, 2971–3010. [Google Scholar] [CrossRef] [PubMed]
  8. Danhier, F.; Feron, O.; Preat, V. To exploit the tumor microenvironment: Passive and active tumor targeting of nanocarriers for anti-cancer drug delivery. J. Control. Release 2010, 148, 135–146. [Google Scholar] [CrossRef] [PubMed]
  9. Li, Y.; Gao, G.H.; Lee, D.S. Stimulus-sensitive polymeric nanoparticles and their applications as drug and gene carriers. Adv. Healthc. Mater. 2013, 2, 388–417. [Google Scholar] [CrossRef] [PubMed]
  10. Mikhail, A.S.; Allen, C. Block copolymer micelles for delivery of cancer therapy: Transport at the whole body, tissue and cellular levels. J. Control. Release 2009, 138, 214–223. [Google Scholar] [CrossRef] [PubMed]
  11. Vonarbourg, A.; Passirani, C.; Saulnier, P.; Benoit, J.P. Parameters influencing the stealthiness of colloidal drug delivery systems. Biomaterials 2006, 27, 4356–4373. [Google Scholar] [CrossRef] [PubMed]
  12. Lv, L.; Shen, Y.; Li, M.; Xu, X.; Li, M.; Guo, S.; Huang, S. Preparation and in vitro evaluation of novel poly(anhydride-ester)-based amphiphilic copolymer curcumin-loaded micelles. J. Biomed. Nanotechnol. 2014, 10, 324–335. [Google Scholar] [CrossRef] [PubMed]
  13. Hamaguchi, T.; Matsumura, Y.; Suzuki, M.; Shimizu, K.; Goda, R.; Nakamura, I.; Nakatomi, I.; Yokoyama, M.; Kataoka, K.; Kakizoe, T. Nk105, a paclitaxel-incorporating micellar nanoparticle formulation, can extend in vivo antitumour activity and reduce the neurotoxicity of paclitaxel. Br. J. Cancer 2005, 92, 1240–1246. [Google Scholar] [CrossRef] [PubMed]
  14. Lalatsa, A.; Schatzlein, A.G.; Mazza, M.; Le, T.B.; Uchegbu, I.F. Amphiphilic poly(l-amino acids)—New materials for drug delivery. J. Control. Release 2012, 161, 523–536. [Google Scholar] [CrossRef] [PubMed]
  15. Bae, Y.; Kataoka, K. Intelligent polymeric micelles from functional poly(ethylene glycol)–poly(amino acid) block copolymers. Adv. Drug Deliv. Rev. 2009, 61, 768–784. [Google Scholar] [CrossRef] [PubMed]
  16. Li, M.; Song, W.; Tang, Z.; Lv, S.; Lin, L.; Sun, H.; Li, Q.; Yang, Y.; Hong, H.; Chen, X. Nanoscaled poly(l-glutamic acid)/doxorubicin-amphiphile complex as pH-responsive drug delivery system for effective treatment of nonsmall cell lung cancer. ACS Appl. Mater. Interfaces 2013, 5, 1781–1792. [Google Scholar] [CrossRef] [PubMed]
  17. Ding, J.; Li, C.; Zhang, Y.; Xu, W.; Wang, J.; Chen, X. Chirality-mediated polypeptide micelles for regulated drug delivery. Acta Biomater. 2015, 11, 346–355. [Google Scholar] [CrossRef] [PubMed]
  18. Takahashi, A.; Yamamoto, Y.; Yasunaga, M.; Koga, Y.; Kuroda, J.; Takigahira, M.; Harada, M.; Saito, H.; Hayashi, T.; Kato, Y.; et al. Nc-6300, an epirubicin-incorporating micelle, extends the antitumor effect and reduces the cardiotoxicity of epirubicin. Cancer Sci. 2013, 104, 920–925. [Google Scholar] [CrossRef] [PubMed]
  19. Bonadonna, G.; Gianni, L.; Santoro, A.; Bonfante, V.; Bidoli, P.; Casali, P.; Demicheli, R.; Valagussa, P. Drugs ten years later: Epirubicin. Ann. Oncol. 1993, 4, 359–369. [Google Scholar] [PubMed]
  20. Yamamoto, Y.; Hyodo, I.; Koga, Y.; Tsumura, R.; Sato, R.; Obonai, T.; Fuchigami, H.; Furuya, F.; Yasunaga, M.; Harada, M.; et al. Enhanced antitumor effect of anti-tissue factor antibody-conjugated epirubicin-incorporating micelles in xenograft models. Cancer Sci. 2015, 106, 627–634. [Google Scholar] [CrossRef] [PubMed]
  21. Ding, J.; Xiao, C.; Li, Y.; Cheng, Y.; Wang, N.; He, C.; Zhuang, X.; Zhu, X.; Chen, X. Efficacious hepatoma-targeted nanomedicine self-assembled from galactopeptide and doxorubicin driven by two-stage physical interactions. J. Control. Release 2013, 169, 193–203. [Google Scholar] [CrossRef] [PubMed]
  22. Chen, J.; Ding, J.; Zhang, Y.; Xiao, C.; Zhuang, X.; Chen, X. Polyion complex micelles with gradient pH-sensitivity for adjustable intracellular drug delivery. Polym. Chem. 2015, 6, 397–405. [Google Scholar] [CrossRef]
  23. Seyfert, U.T.; Biehl, V.; Schenk, J. In vitro hemocompatibility testing of biomaterials according to the iso 10993-4. Biomol. Eng. 2002, 19, 91–96. [Google Scholar] [CrossRef]
  24. Banzato, A.; Bobisse, S.; Rondina, M.; Renier, D.; Bettella, F.; Esposito, G.; Quintieri, L.; Melendez-Alafort, L.; Mazzi, U.; Zanovello, P.; et al. A paclitaxel-hyaluronan bioconjugate targeting ovarian cancer affords a potent in vivo therapeutic activity. Clin. Cancer Res. 2008, 14, 3598–3606. [Google Scholar] [CrossRef] [PubMed]
  25. Xu, W.; Ding, J.; Xiao, C.; Li, L.; Zhuang, X.; Chen, X. Versatile preparation of intracellular-acidity-sensitive oxime-linked polysaccharide-doxorubicin conjugate for malignancy therapeutic. Biomaterials 2015, 54, 72–86. [Google Scholar] [CrossRef] [PubMed]
  26. Iyer, A.K.; Khaled, G.; Fang, J.; Maeda, H. Exploiting the enhanced permeability and retention effect for tumor targeting. Drug Discov. Today 2006, 11, 812–818. [Google Scholar] [CrossRef] [PubMed]
  27. Ding, J.; Zhuang, X.; Xiao, C.; Cheng, Y.; Zhao, L.; He, C.; Tang, Z.; Chen, X. Preparation of photo-cross-linked pH-responsive polypeptide nanogels as potential carriers for controlled drug delivery. J. Mater. Chem. 2011, 21, 11383–11391. [Google Scholar] [CrossRef]
  28. Pu, Y.; Chang, S.; Yuan, H.; Wang, G.; He, B.; Gu, Z. The anti-tumor efficiency of poly(l-glutamic acid) dendrimers with polyhedral oligomeric silsesquioxane cores. Biomaterials 2013, 34, 3658–3666. [Google Scholar] [CrossRef] [PubMed]
  29. Ding, J.; Shi, F.; Xiao, C.; Lin, L.; Chen, L.; He, C.; Zhuang, X.; Chen, X. One-step preparation of reduction-responsive poly(ethylene glycol)–poly(amino acid)s nanogels as efficient intracellular drug delivery platforms. Polym. Chem. 2011, 2, 2857–2864. [Google Scholar] [CrossRef]
  30. Li, C.; Xu, W.; Ding, J.; Zhang, Y.; Wang, J.; Zhuang, X.; Chen, X. Micellization of antineoplastic agent to significantly upregulate efficacy and security. Macromol. Biosci. 2015, 15, 328–341. [Google Scholar] [CrossRef] [PubMed]
  31. Wang, J.; Xu, W.; Ding, J.; Lu, S.; Wang, X.; Wang, C.; Chen, X. Cholesterol-enhanced polylactide-based stereocomplex micelle for effective delivery of doxorubicin. Materials 2015, 8, 216–230. [Google Scholar] [CrossRef]
  32. Ding, J.; Zhao, L.; Li, D.; Xiao, C.; Zhuang, X.; Chen, X. Thermo-responsive “hairy-rod” polypeptides for smart antitumor drug delivery. Polym. Chem. 2013, 4, 3345–3356. [Google Scholar] [CrossRef]
  33. Adams, M.L.; Andes, D.R.; Kwon, G.S. Amphotericin b encapsulated in micelles based on poly(ethylene oxide)-block-poly(l-amino acid) derivatives exerts reduced in vitro hemolysis but maintains potent in vivo antifungal activity. Biomacromolecules 2003, 4, 750–757. [Google Scholar] [CrossRef] [PubMed]
  34. Mayhew, E.G.; Lasic, D.; Babbar, S.; Martin, F.J. Pharmacokinetics and antitumor activity of epirubicin encapsulated in long-circulating liposomes incorporating a polyethylene glycol-derivatized phospholipid. Int. J. Cancer 1992, 51, 302–309. [Google Scholar] [CrossRef] [PubMed]
  35. Ding, J.; Chen, L.; Xiao, C.; Chen, L.; Zhuang, X.; Chen, X. Noncovalent interaction-assisted polymeric micelles for controlled drug delivery. Chem. Commun. 2014, 50, 11274–11290. [Google Scholar] [CrossRef] [PubMed]
  36. Lee, A.L.; Venkataraman, S.; Sirat, S.B.; Gao, S.; Hedrick, J.L.; Yang, Y.Y. The use of cholesterol-containing biodegradable block copolymers to exploit hydrophobic interactions for the delivery of anticancer drugs. Biomaterials 2012, 33, 1921–1928. [Google Scholar] [CrossRef] [PubMed]
  37. Liu, J.; Huang, Y.; Kumar, A.; Tan, A.; Jin, S.; Mozhi, A.; Liang, X.J. pH-sensitive nano-systems for drug delivery in cancer therapy. Biotechnol. Adv. 2014, 32, 693–710. [Google Scholar] [CrossRef] [PubMed]
  38. Fernandes-Alnemri, T.; Litwack, G.; Alnemri, E.S. Cpp32, a novel human apoptotic protein with homology to Caenorhabditis elegans cell death protein Ced-3 and mammalian interleukin-1 beta-converting enzyme. J. Biol. Chem. 1994, 269, 30761–30764. [Google Scholar] [PubMed]
  39. Okada, H.; Mak, T.W. Pathways of apoptotic and non-apoptotic death in tumour cells. Nat. Rev. Cancer 2004, 4, 592–603. [Google Scholar] [CrossRef] [PubMed]
  40. Yerushalmi, R.; Woods, R.; Ravdin, P.M.; Hayes, M.M.; Gelmon, K.A. Ki67 in breast cancer: Prognostic and predictive potential. Lancet Oncol. 2010, 11, 174–183. [Google Scholar] [CrossRef]
  41. Ferrari, M. Cancer nanotechnology: Opportunities and challenges. Nat. Rev. Cancer 2005, 5, 161–171. [Google Scholar] [CrossRef] [PubMed]
  42. Li, M.; Tang, Z.; Lv, S.; Song, W.; Hong, H.; Jing, X.; Zhang, Y.; Chen, X. Cisplatin crosslinked pH-sensitive nanoparticles for efficient delivery of doxorubicin. Biomaterials 2014, 35, 3851–3864. [Google Scholar] [CrossRef] [PubMed]
  43. Deng, C.; Jiang, Y.; Cheng, R.; Meng, F.; Zhong, Z. Biodegradable polymeric micelles for targeted and controlled anticancer drug delivery: Promises, progress and prospects. Nano Today 2012, 7, 467–480. [Google Scholar] [CrossRef]

