Spectroscopic Investigation of Composite Polymeric and Monocrystalline Systems with Ionic Conductivity

Abstract
: The conductivity mechanism is studied in the LiCF3SO3-doped polyethylene oxide by monitoring the vibrations of sulfate groups and mobility of Li+ ion along the polymeric chain at different EO/Li molar ratios in the temperature range from 16 to 90 °C. At the high EO/Li ratio (i.e., 30), the intensity of bands increases and a triplet appears at 1,045 cm−1, indicating the presence of free anions, ionic pairs and aggregates. The existence of free ions in the polymeric electrolyte is also proven by the red shift of bands in Raman spectra and a band shift to the low frequency Infra-red region at 65 < T < 355 °C. Based on quantum mechanical modeling, (method MNDO/d), the energies (minimum and maximum) correspond to the most probable and stable positions of Li+ along the polymeric chain. At room temperature, Li+ ion overcomes the intermediate state (minimum energy) through non-operating transitions (maximum energy) due to permanent intrapolymeric rotations (rotation of C, H and O atoms around each other). In solid electrolyte (Li2SO4) the mobility of Li+ ions increases in the temperature range from 20 to 227 °C, yielding higher conductivity. The results of the present work can be practically applied to a wide range of compact electronic devices, which are based on polymeric or solid electrolytes.1. Introduction
The physics and chemistry of solid electrolytes requires expanding investigations in a new way due to the fabrication of devices of which they are the basis. Solid electrolytes (superionic conductors or solids with rapid ionic conductivity) are solids, which exhibit ionic conductivity comparable with that of electrolyte solutions or melted salts. Solids with rapid ionic conductivity have various applications from direct fuel cells [1], the improved ecological value of auto cars [2], and electrochemical capacitors [3]. The challenge in the application of solid electrolytes is in the bridging of the material structure with its physical properties, as well as the determination of ionic conductivity mechanisms; and their control over temperature and pressure. Ionic conductors can be divided into several classes according to the mechanism of conductivity.
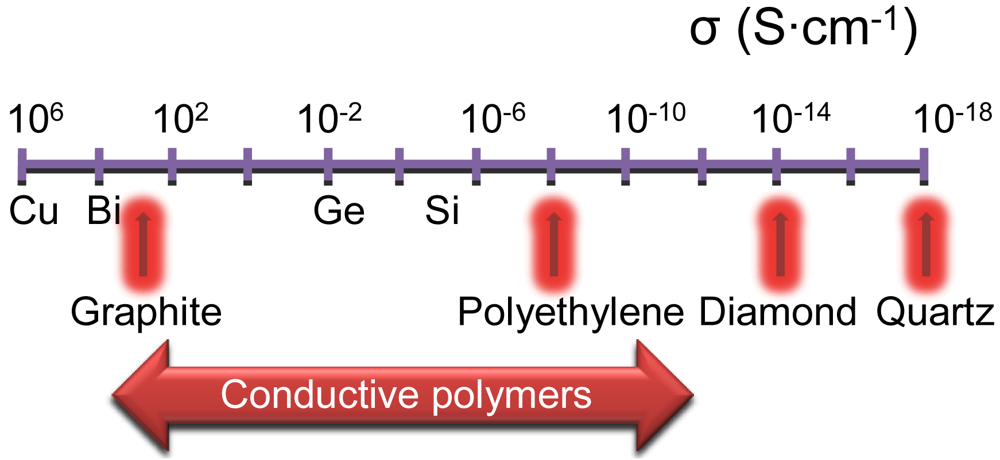
Common ionic crystals or semiconductors (e.g., NaCl, AgCl, etc.) with conductivity < 10−3 S·cm−1 due to thermal Frenkel-Schottky defects or impurity ions with minor quantities.
Solid electrolytes or ionic superconductors (e.g., α-AgI, α-Li2SO4, metal containing complexes of phosphates and silica phosphate, sour sulfates of base metals, etc.) with conductivity < 10−2 S·cm−1 due to the different structural disorder of one of the ionic sublattices.
Polymeric electrolytes with conductivity in the 10−3 to 10−1 S·cm−1 region due to the transport of impurity cations along the polymeric chains with structural disorders [4].
As the first class of solid electrolytes is well studied [5-10], the electrical and optical properties of solid electrolytes of the second class are being intensively investigated. Among them are high temperature phases of α-Li2SO4 (586–860 °C), α -Ag2SO4 (412–660 °C) sulfates of one-valent metals (Li+, Na+ and Ag+) and also solids Li2SO4-Na2SO4 and Li2SO4- Ag2SO4, Na2SO4. Lithium α-orthosilicate has an ionic conductivity of 3 S·cm−1 and is temperature sensitive, when doped with the metal oxides (e.g., titanium, zinc, magnesium or aluminum). The third class of polymeric electrolytes, which are polymers with lithium salt (e.g., LiCF3SO3), is least studied. Their conductivity is controlled by the change of the polymeric matrix, impurity salt and temperature [11-16].
Polyethylene oxide (PEO) as a simple polyether can be chosen as the polymeric matrix due to its low molecular weight and an ease of solubility in water. The solubility of the polymer in water is decreased with the increase of molecular weight, firmness and melting temperature. This fragment of structural formula of PEO is shown in Figure SI.1 (supporting information). Pristine PEO is a good dielectric in comparison to the other materials (Figure 1), but exhibits conductive properties when it is co-doped with sodium or lithium salts [17].
The physico-chemical properties of lithium and sodium salts are actively studied with the large interest in phase transitions of LiASO4 with A as the base cation (e.g., Li, Na, K, Rb and Cs) [18-20]. Small cationic compounds such as Li2SO4 and LiNaSO4 undergo superionic phase transitions at high temperatures. These structures have a cubic symmetry beyond the phase transitions and are characterized by complicated rotational disorders of sulfate anions, which is typical for plastic metals. The phase transitions of these structures were studied due to the orientation of one of the sulfate groups in the wide temperature range [21]. The high temperature phase of Li2SO4 is described as a plastic phase (i.e., a phase characterized by extensive orientation disorder of SO42− ions). In addition, monocrystal Li2SO4 exhibits rapid ionic conductivity. The low temperature phase (T = 190 K) of the crystal corresponds to the freezing process of orientation disorder of vibrations of sulfate ions, yielding a decrease in the electroconductivity of the substance [22].
The investigation of high temperature phases of the Li2SO4 structure is very interesting due to the fact that Li2SO4 is a monohydrate crystal with a monoclinic system at room temperature. The crystal belongs to the space group with symmetry C22 and is centric and cubic at T < 848 K and at melting temperature Tmelt = 1,133 K. As the chain length of Li-O can vary from 1.09 to 1.9 Å, Li2SO4 can be used for an accurate determination of the size and configuration of the sulfate group. A small radius of lithium ions allows for a close approach to the hydrogen atoms in order to examine the deformations of the sulfate group [23].
The main factor which limits the ionic conductivity of such a conductor is the nature of coupling and aggregation of ions in polymeric electrolytes [24-28]. Completely amorphous polymeric electrolyte systems with conductivity at room temperature were invented as an alternative to solid polyelectrolytes. Solutions of lithium salts in polymers such as polyphosphate with ethylene oxide groups or polymers from ethylene oxide and methylene oxide are amorphous conductors. The conductivity of these materials is controlled by the temperature, the nature of polymers and the concentration of lithium ions. The disadvantage of such compounds relates to the instability of sizes. However the electrolytes, which are formed from the polyethylene oxide, exhibit mechanical stability at high ionic conductivity and temperature, which is far below melting point [29,30].
The main purpose of our work is to study ionic species (e.g., SO42− and Li+) in two conductive systems—polymeric and solid electrolytes. The vibrations of sulfate groups are examined by Raman and Infra-red spectroscopy in the temperature region from 65 to 355 ° C. At room temperature the presence of free ions or ionic aggregates is studied at different molar ratios of ethylene oxide to LiCF3SO3 salt (EO/Li) in the polymeric electrolyte with 2, 3 and 11 chain lengths of dimethyl ethylene glycol ((EG)nDME). The mobility of the Li+ cation is modeled by a modified quantum mechanical method of molecular and atomic orbitals in the polyelectrolyte and spectroscopically studied solid electrolytes in the temperature region from 293 to 500 K.
2. Results and Discussion
2.1. Spectroscopy of Polymeric Electrolytes Based on LiCF3SO3 and Polyethylene Oxide
Raman spectroscopy is employed to examine vibrations of ions in polymeric electrolytes because triflate anions CF3SO3− are very sensitive to coordination state. Three bands at 1,033, 1,043 and 1,053 cm−1 are assigned to free anions, ionic couples and ionic aggregates, respectively. Free ions dominate in solutions of LiCF3SO3 in H-[OCH2CH2]n-OH (n = 1–4), while the number of ionic couples is small due to the presence of ionic associates [28].
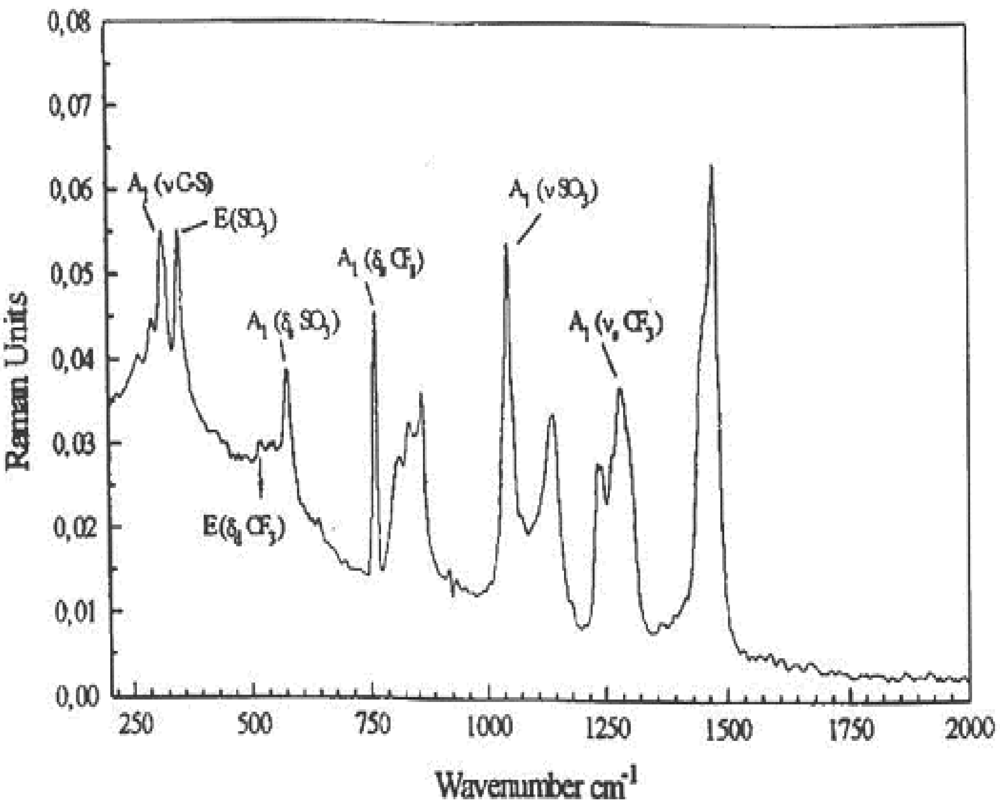
The Raman spectrum of pristine LiCF3SO3 at room temperature is shown in Figure SI.5 (supporting information) and the peaks of corresponding vibrations are listed in the Table 1. From the spectra of pure LiCF3SO3 (Figure SI.5) the symmetric vibration of anion SO3− at 1,034 cm−1 is the most interesting. Nonperturbed CF3SO3− ion has pyramidal symmetry (C3v) with the sum of the normal vibrational modes 3A1+A2+6E. Seven vibrations, which are observed for LiCF3SO3 solutions in (EG)11DME in Raman spectra are shown in Figure 2. The vibration of SO3− is very sensitive to the medium due to the characteristic band of free CF3SO3− near 1,032 cm−1 in a strongly diluted LiCF3SO3.
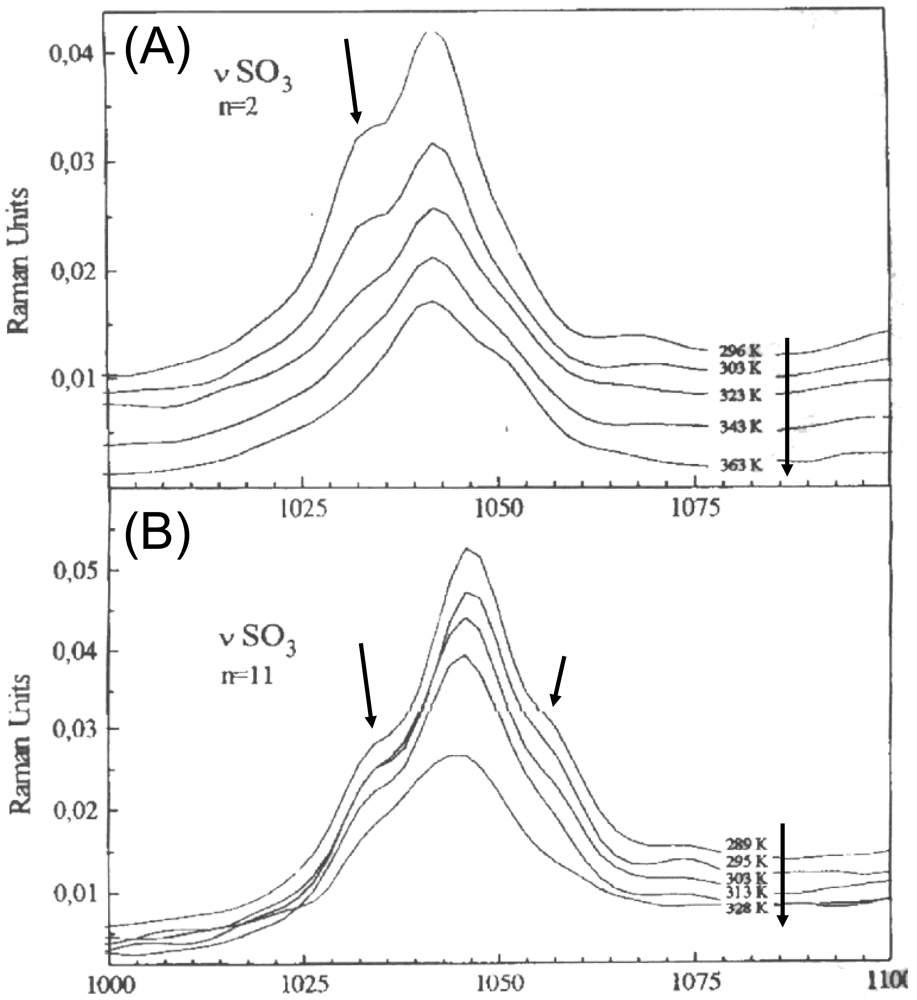
Raman bands of SO3− in LiCF3SO3 + (EG)nDME with n = 2 and 11 in the range from 289 K to 363 K are shown in Figure 3. Both bands are broad with a distinct peak near 1,047 cm−1 and shoulders at 1,034 cm−1 with both chain lengths (n = 2 and 11). Raman band of SO3− in LiCF3SO3 + (EG)2DME acquire a shoulder near 1,053 cm−1 at the highest temperature 363 K (Figure 3(A)) and near 1,058 cm−1 with n = 11 (Figure 3(B)).
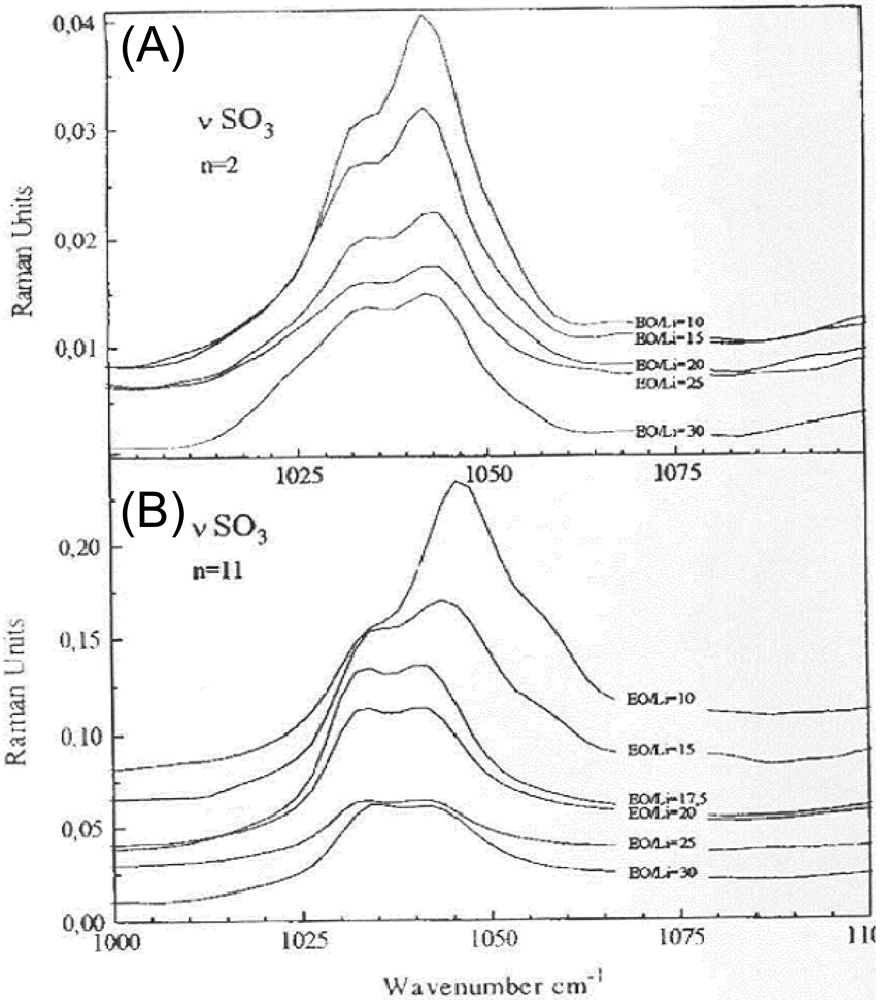
The bands become broader with lower intensity due to the temperature increase, indicating formation of ionic aggregates. Raman spectra of LiCF3SO3 + (EG)nDME (n = 2 and 11) at a concentration of EO/Li from 10 to 30 at room temperature show a relatively broad band with two maxima in the range of 1,025 cm−1 to 1,050 cm−1 (Figure 4). Both bands with LiCF3SO3 + (EG)nDME (n = 2 and 11) exhibit maximum shoulders near 1,037 cm−1 and near 1,043 cm−1 (Figure 4(A) and 4(B)). The intensity of LiCF3SO3 + (EG)2DME band at 1,045 cm−1 increases with the receding of EO/Li from 30 to 10 (Figure 4(A)), while the band of LiCF3SO3 + (EG)11DME at 1,043 cm−1 is shifted to 1,047 cm−1 at EO/Li = 15 and to 1,047 cm−1 at EO/Li = 10 (Figure 4(B)), indicating changes in the number of free ions, ionic pairs and aggregates.
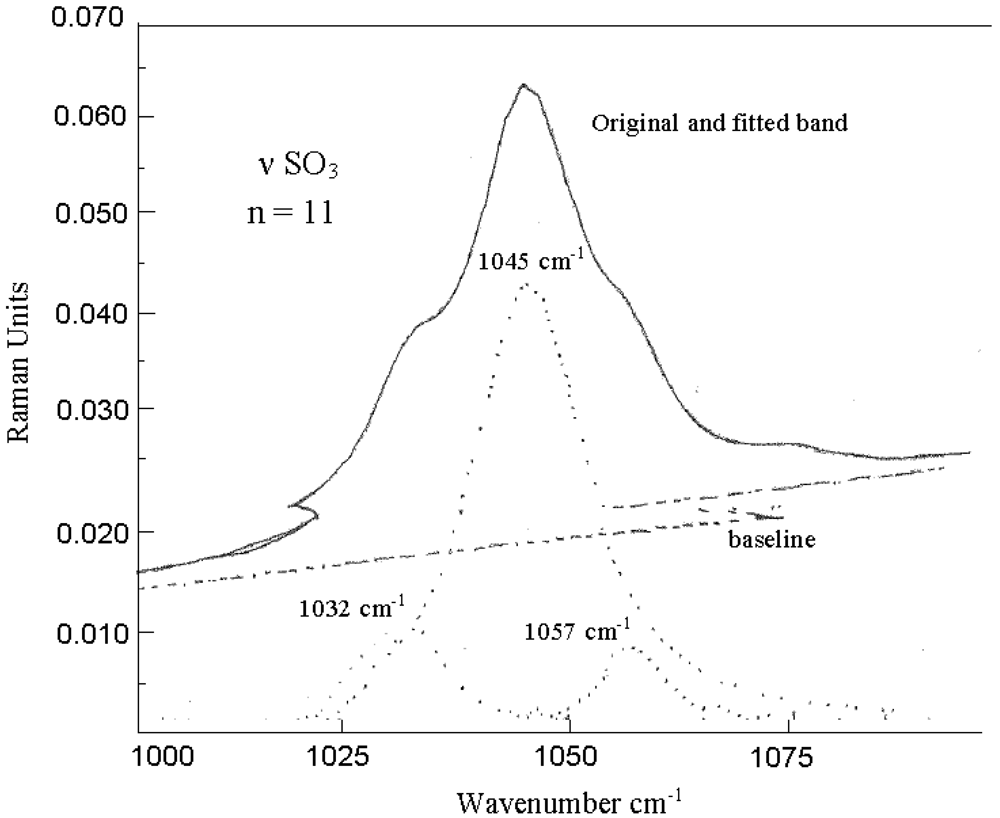
In LiCF3SO3 + (EG)11DME at EO/Li = 10 additional peaks appear at 1,045 cm−1 and 1,054 cm−1, which are assigned to ionic pairs and associates like {CF3SO3−…Li+}, {Li+…CF3SO3−…Li+} and {CF3SO3−…Li+…CF3SO3−} (Figure 5). Based on the literature, the triplet, which is observed at 1,045 cm−1 is attributed to free ions, ionic pairs and ionic aggregates at the higher frequency region [24]. Therefore, one can deduce that the concentration of free anions (i.e., CF3SO3− and SO3−) in LiCF3SO3 + (EG)11DME at EO/Li = 10 and EO/Li = 30 is increased [31]. The Raman frequencies of (EG)nDME (n = 2 and 11) with interpretations are listed in Table 2 (supporting information) and are in a good agreement with the literature [22,23,32,33].
Free ions, ionic pairs and ionic aggregates can be studied in polyethylene oxide doped LiCF3SO3 by examination of the shape of Raman bands. For instance, spectral vibrations of anion SO3− become broader if the temperature is increased from 289 to 363 K, indicating ionic aggregates. Later, the Raman spectral bands of either free or aggregated tetrahedral SO42−anions, surrounded by Li+ or Na+ cations, are studied at a higher temperature region of 328 to 573 K.
2.2. Spectral Features of Ionic Conductors, Which Are Based on Na2SO4 and Li2SO4
Raman Spectra of Li2SO4 at Different Temperatures
Single lattice Li2SO4 contains 28 atoms, which correspond to the 84 degrees of freedom vibrations. All of the two or three-dimensional presentations split up the one-dimensional presentation A due to the low side symmetry (C1). Group factor C2h transforms any group presentation into Ag+Bg+Au+Bu. The minimal structure presentation of the vibrational modes in Li2SO4 can be introduced as follows (Equations 1–4).
Translational and rotational degrees of freedom become lattice modes in the crystal Li2SO4. For a Li+ ion any translational degree of freedom corresponds to A, and the correlation group factor is considered as the minimal presentations of Li+ ion movement (Equation 5).
The most intense peak (Ag) in Raman spectra is assigned to ν1SO3− at 1,014 cm−1 [34]. Less intense peaks (Ag) at 1,127, 1,123 and 1,194 cm−1 and three peaks (Bg) symmetry at 1,116, 1,150 and 1,204 cm−1 are attributed to the free ν3SO3− ion. The intramolecular movement ν4 generates two modes in Ag presentation at 617 and 666 cm−1 and three modes in Bg symmetry at 623, 649 and 666 cm−1. Shoulder at 650 cm−1 is assigned to Ag geometry of scattering. It is difficult to find the differences between effects of shift and peak positions at ∼650 and ∼666 ccm−1 in both (Ag and Bg) presentations. The intramolecular mode ν2 of E symmetry in the isolated ion split into two Ag and Bg modes in the crystal. There are two modes at 513 and 446 cm−1 in Ag presentation and those at 516 and 451 cm−1 in the Bg scattering symmetry. The intensities of Ag modes, which are observed in the XY geometry, are much weaker than those in YY [23]. The bandwidths corresponding to Ag and Bg at higher frequencies (i.e., 513 and 516 cm−1, respectively) of ν2 vibrations are broader than those which correspond to the other intramolecular modes in Li2SO4. In addition, the bands at 513 and 516 cm−1 are relatively high for ν2 components in comparison to other sulfate crystals. Normally ν2 components are in the region of 460 to 480 cm−1 in the Li2SO4·H2SO4, LiNaSO4 and LiKSO4, where one of the Ag components is observed at 513 cm−1 and of Bg components is at 516 cm−1. Several translational modes of Li+ ion can be connected due to their presence in the region of 400–450 cm−1 and the appearance of a group factor component ν2 with the corresponding symmetry.
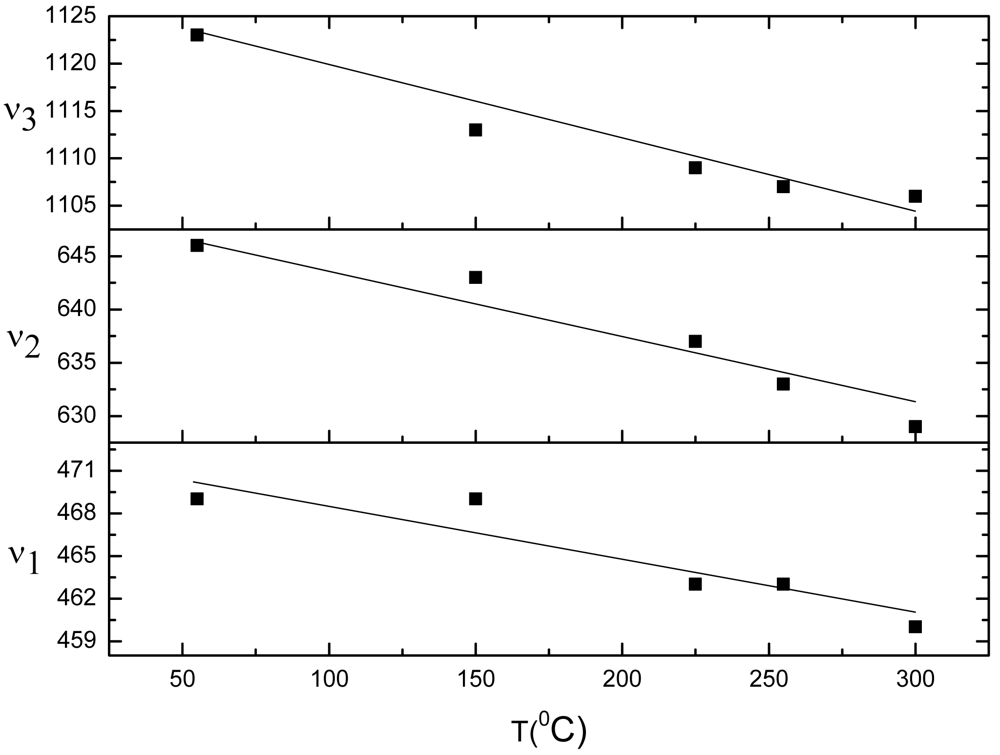
Figure 6 shows the dependence of ν1 (469 cm−1), ν2 (646 cm−1) and ν3 (1,123 cm−1) vibrations of Li2SO4 on temperature in the range from 55 to 300 °C. As the temperature increases, the vibration bands are shifted to the lower frequency range. The bandshifts of ν1 and for each ν2 and ν3 vibrations are 9 and 17 cm−1.
2.3. Interpretation of Raman Spectra of Na2SO4
Free tetrahedral SO42− ion has four types of fundamental vibrations ν1SO4, ν2SO4, ν3SO4, ν4SO4 with corresponding wavenumbers (Table 3). The most intense bands of SO42− ion vibrations are the following: i) 994 cm−1 for the all components of ν1SO4 tensor; ii) 450 and 456 cm−1 for the YY and ZZ components of polarization ν2SO4 tensor, respectively; iii) 1,103, 1,133 and 1,156 cm−1 for the XY, YZ and ZX components of polarization ν3SO4 tensor, respectively; iv) 633 and 651 cm−1 for the ZX and YZ components of polarization ν4SO4, respectively [35].
In the table, XX, YY, ZZ, XY, YZ, ZX indicate a symmetry of vibration, which is determined from the investigation of experimental tensors of Raman spectra. The characteristics of the bands intensity are illustrated in arbitrary units: ‘vw’ (very weak, <103), ‘w’ (weak, 1–2 × 10³), ‘m’ (medium, 4–8 × 10³), ‘ s’ (strong, 8–10 × 103) and ‘vs’ (very strong, >10 × 103). The vibrations of the crystal lattice are given as ‘T’ (translational) and ‘L’ (libratory), while that of SO42−and Na atom are indicated by an ‘S’ and an ‘A’, respectively. The vibrations of SO42 are assigned by ν1SO4 as the most intense and fully symmetric nondegenerate, ν2SO4 and ν3SO4 are twice and thrice degenerate vibrations, while ν4SO4 is ascribed as a deformation vibration.
The symmetry of vibrations in the Table 3 is determined from experimental tensors of Raman spectra (Equation 6).
The components of the tensor are relative intensities of Raman bands for different crystal orientations, positions of the analyser and polarizers (Table 4).
The symmetry of Ag, B1g, B2g and B3g vibrations is shown in Equation 7.
Free isolated SO42−ion is a tetrahedron of Td symmetry. Both the theory and experiments mark out four fundamental vibrations v1(A1) = 983 cm−1, v2(E) = 450 cm−1, v3(F1) = 1,105 cm−1 and v4(F2) = 611 cm−1, which are observed in Raman and Infra-red spectra (e.g., A1 and E only in Raman and F2 in both Raman and Infra-red). The interaction between SO42− ions and neighboring cations yields the change of SO42− vibration symmetry due to the degeneration of vibrations in the lower symmetry. The crystal Na2SO4 has D2h symmetry, while SO42− ion is positioned with the D2 local symmetry [35], yielding a vibration symmetry change and the splitting of bands. For example, ν2(E)→2Ag; ν3(F1) → B1g + B2g + B3g and ν4(F2)→B1g+B2g+B3g (Table 4), which are observed in Raman and only 2Au with B1u + B2u + B3u —in Infra-red spectroscopy. Band splits of ν2(E) and ν4(F2) are observed by Raman spectra, which are more informative than those in Infra-red with only a ν3(F1) band.
When the temperature increases from 55 to 300 °C the vibration bands of SO42− are shifted to a lower frequency range, indicating interactions between sulfate groups and Li+ cations as well as the presence of aggregated species. In addition, the vibration symmetry of SO42− changes with the bands splitting due to interaction with neighboring cations. Later the mobility of Li+ cations is modeled in polyelectrolytes at room temperature and experimentally examined in solid electrolytes within a temperature range of 20 to 227 °C.
2.4. Results of Modeling of Polymeric Electrolytes by the MNDO/d Method
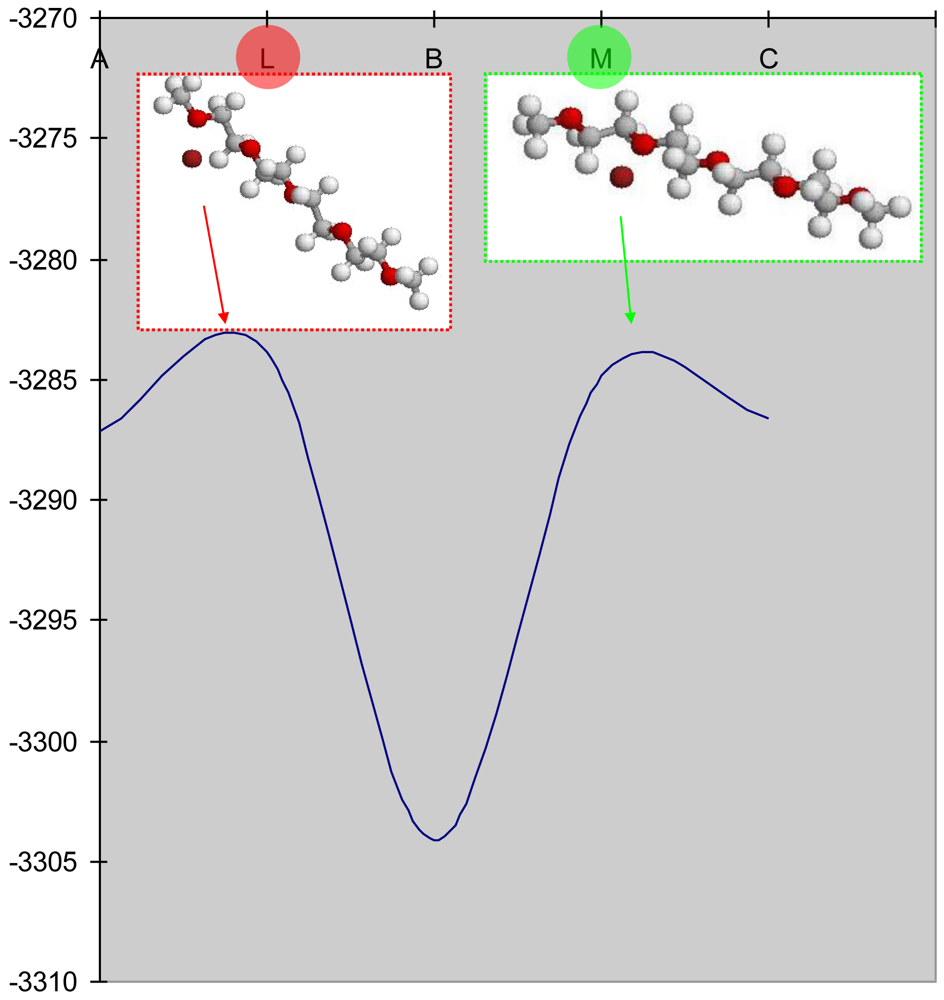
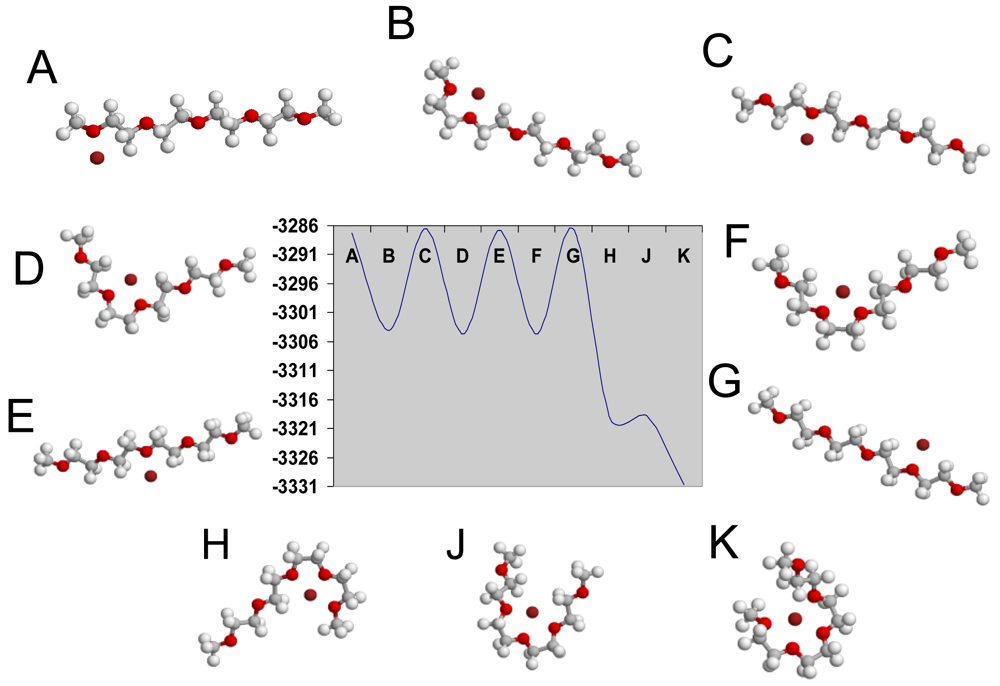
The modeling of polyelectrolytes is introduced by the examination of the movements of Li+ ion along the polymeric chain [CH2-CH2-O]4 through a quantum mechanical calculation in order to determine the conductivity mechanism of polymeric electrolytes (LiCF3SO3+(EG)nDME, n = 2 and 11). From the beginning, the positions of Li+ ion are considered nearby the first oxygen (model A in Figure 7). The configuration of the ‘A’ system is stable because it is a state at local minimum energy (EA = −3,287.18 kkal·mol−1). If the polyelectrolyte chain is deflected to the right or left, up or down, the configuration becomes unstable and the Li+ ion either goes back or approaches its initial position. Later the Li+ ion sits between the first and second oxygen atom (i.e., it is shifted to intermediate position in the model B). This new configuration is stable due to the local minimum of energy (EB = −3,304.13 kkal·mol−1). Later Li+ is positioned close to the second oxygen atom (model C) with acorresponding minimum of energy EC= −3,286.61 kkal·mol−1. Later Li+ passes a number of stable configurations with the local minimum of energies (ED= −3,304.63 kkal mol−1, EE= −3,286.82 kkal mol−1, EF= −3,304.61 kkal·mol−1, Eg= −3,286.60 kkal·mol−1, EH= −3,319.30 kkal·mol−1, EJ= −3,318.75 kkal·mol−1 and EK= −3,330.75 kkal·mol−1) when lithium ion moves along the polymeric chain. The models which are described above are shown in Figure 7.
In addition, there are non-operating transitions (L and M) which exist between the intermediate states (B, D, F, H and K) (Figure 8). Li+ ions move by changing the states with the local minimum of energy due to the states with the local maximum of energy (model L and M) with the close values (EL= −3,283.80 kkal·mol−1 and EM= −3,287.19 kkal·mol−1). Li+ ions move actively along the polymeric chain due to the rotations of polymer (i.e., carbon permanently rotates around hydrogen, hydrogen rotates around carbon, both carbon and hydrogen rotate around oxygen, etc.). Therefore Li+ ion transports along the polymeric chain by passing through the non-operating positions (L and M) due to intrapolymeric rotations. Li+ ion acquires energies of EL and EM when carbon atoms get a perpendicular position relatively to each other at the position of a Li+ ion. One requires to transform an additional energy of E1= −3.31 kkal·mol−1 in order to move Li+ from the position with EA to EB through EL and similarly one donates the Li+ by E2= −19.28 kkal·mol−1 for transportation from EB to EC through EM. The calculations of the minimum energy corresponding to the most probable positions of a Li+ ion nearby the atoms (C, H and O) of polymeric chain allow increasing the conductivity of polyethylene oxide with impurities.
2.5. The Conductivity Temperature Dependence of Ionic Conductors
The conductivity of Li2SO4 versus temperature is measured by a technique reported elsewhere [36]. Conductivity increases with the temperature rise because the Li+ ion becomes more mobile due to weaker bonding with other atoms (Table 5). The high mobility of Li+ ion can be explained by the mechanism of a ‘paddle-wheel’, where Li+ diffuses into the crystal lattice via an adhesion of sulfate ions in the rotation [37]. This phenomenon results in band shifts to the low frequency region.
3. Experimental Section
3.1. Materials
Lithium trifluoromethanesulfonate (LiCF3SO3, 99.995%), dimethyl ethylene glycol ([EG]nDME, n = 2, 3 and 11), lithium sulfate dihydrate (Li2SO4·2H2O, ≥99.99%), sodium sulfate dihydrate (Na2SO4·2H2O, ≥99.99%) were purchased from Sigma-Aldrich (Munich, Germany).
3.2. Preparation of Li2SO4 and Na2SO4 Crystals and Polymeric Electrolytes
Li2SO4 and Na2SO4·crystals were grown by slow evaporation at different temperatures. The aqueous solutions were heated until 80 °C, filtered, slowly cooled with a step 5–10 °C until 30 °C and dried; but not completely in order to avoid possible contamination by the rest of the impurities contained in the bulk of the material. These formed crystals are colorless with a morphology at the mm scale.
Polymeric electrolytes, which are produced on the basis of dimethyl ethylene glycol ((EG)nDME) were dried in vacuum in order to remove water traces. LiCF3SO3 was dried at 120 °C under vacuum (10−3 bar) during 24 hours. The mixture of LiCF3SO3 in ethylene glycol was prepared at 50 C in a micro chamber under argon atmosphere. LiCF3SO3 was dissolved in oligomers (EG)nDME with n = 2 and 3. The molar ratio of Li/EO (LiCF3SO3 to ethylene oxide) was varied from 0 to 0.4.
3.3. FTIR Measurements
- a)
At Room Temperature
Li2SO4 crystals (4 × 10⁻³ g) and KBr (846 × 10−3 g) were ground into a powder and pressed to form a pellet (0.47% of Li2SO4 crystals) by putting the mixture into a press-shape (150 kg·cm−2) with a diameter of 12 mm under high pressure (150 atm). The pellets and Li2SO4 crystals were kept in a waterproof reservoir in order to avoid contact with air. The Fourier transformed infrared spectra (FTIR) of prepared Li/KBr pellets were measured employing the Bruker IFS66 Fourier spectrometer with Raman module FRA106 in the middle infra-red region (2.5–25 μm) with a spectral resolution 2 cm−1 at a laser (1,064 nm) power of 3 × 10⁻⁵ V. 400 scans. A 10 min scan was added for each spectrum, in order to get a good signal/noise ratio. Raman intensities were determined as integral intensities. The ν(CO) and ν(CC) bands of pure polymer at 1,032 cm−1 were subtracted from the reaction spectra. Raman bands were factorized into Gaussian-Lorentz function and a linear baseline in the spectral range 740 cm−1.
- b)
In the Temperature Range from 22 °C to 250 °C
The temperature dependence of Raman spectra was measured employing a temperature add-on device R495 from Bruker (Figure SI.2, supporting information) and a special home made thermostat set-up for this purpose (thermo-isolator box with a metallic net inside, Figure SI.3, supporting information). The voltage power supply in the in-built electro-heater (85 W) was completely on or off in a range of 0 to 12 V, while the temperature was increased from 22 °C to 250 °C with a stability ±3 °C. The calibration curves of the thermocouple (thermo electromobile force, EMF, versus temperature) in the temperature add-on device and special home made thermostat are shown in Figure SI.4 (supporting information).
3.4. Theoretical Calculations (Method MNDO)
The MNDO method is based on stationary Schrödinger equations. MNDO (Modified Neglect of Differential Overlap) is a modified method of NDDO (Neglect of Diatomic Differential Overlap) and semi-empirical method, which is oriented to the correct reproduction of electron characteristics such as dipole moments, non-transformation heat and geometry of molecules. The atomic orbital is of spherical symmetry in the calculations of electron-electron repulsion integrals. The orientation of p-orbitals is considered in the calculation of n-centered (n = 1–4) integrals of atomic orbital repulsion of the same atom. The self-descriptiveness of MNDO is due to information not only from the geometry of the molecule, but also dipole moments, the heat of the formation, the order of bonds, and spinning and density ratios among other factors.
MNDO is employed for a more accurate description of the repulsion between unshared electronic couples [38]. One of the main advantages of MNDO is the calculation of unsaturated compounds and molecules, which contain unshared electronic couples within neighboring atoms (for polar molecules). In addition, valent angles and the consistency of molecular orbital levels are accurately calculated through this method. MNDO correctly reproduces a relative stability of isomers, which contain double and triple bonds, and is widely used for a calculation of the oscillation frequency and structure of linear polymers. Moreover, MNDO is applied to polyyne and paracyclophan molecules, yielding high results for fluorine compounds (e.g., F-O, F-N, etc.) as well as a good reproduction of oscillation frequency. The disadvantages of MNDO are as follows: i) an incorrect description of hydrogen bonds; ii) an inaccurate calculation of internal rotation barriers in the conjugate molecules (e.g., benzylideneaniline, stilbene and azobenzene); iii) a disability to calculate four-termed cycles (they are too planar and stable); and, iv) a systematic overstating of ionization potentials in compounds, which contain Cl− and Br− anions Despite these disadvantages, MNDO/d (modified version of MNDO) is applied to model the interactions between Li+ and polyethylene oxide.
An Algorithm of Calculations by MNDO
Normally nuclei are considered to be static, while electrons are mobile. Given these considerations, it is possible to solve the Schrödinger equation for the one-electron system only. For this reason the most applied method is the method of self-consistent fields (SCF) or Hartree-Fock in quantum-chemical theory. In this method any electron moves in the field of atomic nuclei and in the effective averaged field of other electrons. Multielectron wave function is considered as an asymmetric product of spin-orbitals (i.e., one-electron molecular orbitals (MO), φi(m), which are multiplied by spin wave functions α and β of the corresponding electron [38]:
Restricted, the Hartree-Fock method (RHF) is used for systems with closed shells (without unpaired electrons), where each electron MO φi(m) is occupied by two electrons with opposite spins. The Schrödinger equation is transformed into a system of integral-differential equations to describe the movement of each separate electron:
Molecular orbitals φi(m) for linear combinations of atomic orbitals xj(m) (LCAO approximation) is as follows
The group of atomic orbitals (AO), xj, is the basis for a molecular construction wave function φi. This basis is incomplete due to the relatively small number of basic AO. The distribution of electron density in the molecule can be transmitted by the AO basis with the challenge in its choice [38].
This system of linear equations below is used to find the minimum of full molecule electron energy E as well as Cmj.
This system of Equation 14 is solved by a self-agreement method with Cmj as the random group and the matrix Fij, which is derived from the group of coefficients. The solution (11) gives new Cmj and Fij until Cmj is the same. This calculation is carried out for the valence electrons with the minimal basis and a considerable part of Coulomb integrals is neglected (13). In this work, the method MNDO/d is used to calculate local minimal energies during the interaction of Li atoms with the polymeric chain of polyethylene oxide.
4. Conclusions
Polyethylene oxide acquires the properties of a conductor and becomes a polymeric electrolyte when it is doped by LiCF3SO3. This conductivity can be controlled by monitoring the vibrations of SO3 groups at EO/Li molar ratio from 10 to 30 in LiCF3SO3 + (EG)nDME (n= 2,3, 11). At the high EO/Li ratio the intensity of bands increases and a triplet appears at 1,045 cm−1, indicating the presence of free anions, ionic pairs and aggregates. The existence of free ions in the polymeric electrolyte is also proven by red shift of bands in Raman spectra within a temperature range of 16 to 90 °C. In addition, a shift of bands in the monocrystal Li2SO4·2H2O to the low frequency region is observed in the Infra-red at 65 < T < 355 °C, as measured by the home made temperature device located inside the spectrometer. In the Raman spectra of Na2SO4 the symmetry of SO42− vibrations is changed due to an interaction with neighboring cations resulting in the disposal of a degeneration of vibrations, leading to a band split.
From the quantum mechanical modelling (method MNDO/d), the energies (minimum and maximum) corresponding to the most probable and stable positions of Li+ are calculated in order to gain deeper insight into the conductivity of polymeric electrolytes. While being transported along the polymeric chain, Li+ ion overcomes intermediate states (minimum energy) through non-operating transitions (maximum energy) due to permanent intrapolymeric rotations (rotation of C, H and O atoms around each other). The conductivity of the monocrystal Li2SO4·2H2O increases with a temperature rise of 20 to 227 °C. Li+ ions become more free and mobile resulting in an increase of the conductivity of a pellet-sample Li2SO4·2H2O.
The results of this present work can be of practical interest for the direct production of small and effective devices in science and industry that use polymeric electrolytes, which are formed by combining polyethylene oxide and LiCF3SO3 as well as solid electrolytes (e.g., Li2SO4).
Supplementary Materials
polymers-03-00674-s001.pdf


| Wavenumber (Cm−1) | Labeling of frequencies |
|---|---|
| 314s | A1(vC-S) |
| 349s | E (vSO3) |
| 524w | E (δCF3) |
| 575m | A1(δSO3) |
| 758s | A1(δCF3) |
| 1034vs | A1(vSO3) |
| 1230sh | A1(vCF3) |
| XX | YY | ZZ | XY | YZ | ZX | Vibrations |
|---|---|---|---|---|---|---|
| — | 87w | 87w | 87w | 87w | — | TAS |
| 140w | 140w | 140w | 140w | 140w | 140w | — |
| 166vw | 166vw | 161w | 166w | — | 166w | LA |
| — | 450s | 456vs | — | 456w | 456w | ν2SO4 |
| 472m | 472w | — | 469w | 469w | 469w | ν2SO4 |
| — | 622w | — | 625w | 625w | — | ν4SO4 |
| 639w | — | 639m | — | — | 633vs | ν4SO4 |
| — | 650w | 650w | 651w | 651s | — | ν4SO4 |
| 994vs | 994vs | 994vs | 994s | 994vs | 994vs | ν1SO4 |
| — | 1106w | — | 1103vs | 1103w | 1103vw | ν3SO4 |
| — | 1136w | 1136w | 1133w | 1133s | 1133vw | ν3SO4 |
| 1156w | — | 1156m | 1156w | 1156w | 1156vs | ν3SO4 |
| Polarization tensor | Type of polarization tensor | Type of symmetry |
|---|---|---|
| α456 | B3g, ν2SO4 | |
| α639 | B2g, ν4SO4 | |
| α650 | B3g, ν4SO4 | |
| α994 | Ag, ν1SO4 | |
| α1106 | B1g, ν3SO4 | |
| α1133 | B3g, ν3SO4 | |
| α1156 | B2g, ν3SO4 |
| T[°C] | 103T−1 [κ−1] | Ln(σ) [S·cm−1] |
|---|---|---|
| 20 | 3.4 | −4.1 |
| 50 | 3.1 | −3.3 |
| 78 | 2.9 | −2.8 |
| 227 | 2.0 | −1.6 |
Acknowledgments
This work is supported by the FP6EU Project. The author thanks S. N. Shashkov from Department of Physics in Belarusian State University (BSU, Minsk, Belarus) for useful discussions and supporting materials. A. Kulak (BSU, Department of Physics, Minsk, Belarus) is acknowledged for careful reading the manuscript.
References
- Manea, C.; Mulder, M. New polymeric electrolyte membranes based on proton donor-proton acceptor properties for direct methanol fuel cells. Desalination 2002, 147, 179–182. [Google Scholar]
- Corbo, P.; Migliardini, F.; Veneri, O. Dynamic behaviour of hydrogen fuel cells for automotive application. Renewable Energy 2009, 34, 1955–1961. [Google Scholar]
- Morita, M.; Qiao, J.L.; Yoshimoto, N.; Ishikawa, M. Application of proton conducting polymeric electrolytes to electrochemical capacitors. Electrochim. Acta 2004, 50, 837–841. [Google Scholar]
- Bukun, N.G.; Moskvina, E.I.; Ukshe, E.A. Impedance of a Silver electrode and the conductivity of a solid electrolyte of the nasicon type. Sov. Electrochem. 1986, 22, 1240–1244. [Google Scholar]
- Delhommelle, J.; Cummings, P.T.; Petravic, J. Conductivity of molten sodium chloride in an arbitrarily weak dc electric field. J. Chem. Phys. 2005, 123, 114501–114505. [Google Scholar]
- Zimmerman, G.H.; Scott, P.W.; Greynolds, W. A new flow instrument for conductance measurements at elevated temperatures and pressures: Measurements on NaCl(aq) to 458 K and 1.4 MPa. J. Solut. Chem. 2007, 36, 767–786. [Google Scholar]
- Butman, M.F.; Smirnov, A.A.; Kudin, L.S.; Munir, Z.A. Mass-spectrometric study of the kinetics of ionic and molecular sublimation of sodium chloride single crystals. J. Mater. Synth. Process. 1999, 7, 379–385. [Google Scholar]
- Ramires, M.L.V.; Decastro, C.A.N.; Fareleira, J.; Wakeham, W.A. Thermal-Conductivity of Aqueous Sodium-Chloride Solutions. J. Chem. Eng. Data 1994, 39, 186–190. [Google Scholar]
- Corish, J.; Jacobs, P.W.M. Ionic Conductivity of Silver-Chloride Single-Crystals. J. Phys. Chem. Solid. 1972, 33, 1799–1818. [Google Scholar]
- Tiwari, J.P.; Rao, C.R.K. Template synthesized high conducting silver chloride nanoplates. Solid State Ionics 2008, 179, 299–304. [Google Scholar]
- Panero, S.; Scrosati, B.; Sumathipala, H.H.; Wieczorek, W. Dual-composite polymer electrolytes with enhanced transport properties. J. Power Sour. 2007, 167, 510–514. [Google Scholar]
- Ciosek, M.; Sannier, L.; Siekierski, M.; Golodnitsky, D.; Peled, E.; Scrosati, B.; Glowinkowski, S.; Wieczorek, W. Ion transport phenomena in polymeric electrolytes. Electrochim. Acta 2007, 53, 1409–1416. [Google Scholar]
- Morita, M.; Shirai, T.; Egashira, M.; Yoshimoto, N. Conductance behavior of polymeric ion-gel containing magnesium salt. Electrochemistry 2005, 73, 579–581. [Google Scholar]
- Florjanczyk, Z.; Zygadlo-Monikowska, E.; Rogalska-Jonska, E.; Krok, F.; Dygas, J.R.; Misztal-Faraj, B. Polymer electrolytes based on PEO and aluminum carboxylates. Solid State Ionics 2002, 152, 227–234. [Google Scholar]
- Rahman, M.Y.A.; Ahmad, A.; Mangsor, M.R.; Wahab, S.A. Temperature dependence on conductivity and thermal properties of a solid polymeric electrolyte of PVC-ZnO-LiClO4. Phys. B-Condens. Matter 2008, 403, 3414–3416. [Google Scholar]
- Licoccia, S.; Traversa, E. Increasing the operation temperature of polymer electrolyte membranes for fuel cells: From nanocomposites to hybrids. J. Power Sour. 2006, 159, 12–20. [Google Scholar]
- Armand, M.B.; Chabagno, J.M.; Duclot, M. Fast Ion Transport in Solids; North-Holland: New York, NY, USA, 1979; pp. 131–136. [Google Scholar]
- Ziegler, G.E. The crystal structure of lithium sulphate mono-hydrate, Li2SO4 H2O. Z. Krist. 1934, 89, 456–461. [Google Scholar]
- Larson, A.C.; Helmholz, L. Redetermination of the Crystal structure of lithium sulfate monohydrate Li2SO4 H2o. J. Chem. Phys. 1954, 22, 2049–2050. [Google Scholar]
- McGrath, J.W.; Silvidi, A.A.; Carroll, J.C. Proton magnetic resonance study of lithium sulfate monohydrate. J. Chem. Phys. 1959, 31, 1444–1449. [Google Scholar]
- Bansal, M.L.; Roy, A.P. Orientational phase-transition in LiKSO4. Phys. Rev. B 1984, 30, 7307–7309. [Google Scholar]
- Moreira, R.L.; Bourson, P.; Leitao, U.A.; Righi, A.; Belo, L.C.M.; Pimenta, M.A. Raman and birefringence studies of the low-temperature phase-transitions in LiK1-xRbxSO4 crystals. Phys. Rev. B 1995, 52, 12591–12600. [Google Scholar]
- Cazzanelli, E.; Frech, R. Raman-spectra of 7Li2SO4 and 6Li2SO4. J. Chem. Phys. 1983, 79, 2615–2620. [Google Scholar]
- Petersen, G.; Torell, L.M.; Panero, S.; Scrosati, B.; Dasilva, C.J.; Smith, M. Ionic interactions in MCF3SO3-polyether complexes containing monovalent, divalent and trivalent cations. Solid State Ionics 1993, 60, 55–60. [Google Scholar]
- Xu, W.Y.; Smid, J.; Vanbeylen, M. Structure of ion-pairs in solid polymer electrolytes. Solid State Ionics 1992, 57, 133–139. [Google Scholar]
- Schantz, S.; Torell, L.M.; Stevens, J.R. Raman and brillouin-scattering of LiClO4 complexed in poly(propylene-glycol). J. Appl. Phys. 1988, 64, 2038–2043. [Google Scholar]
- Papke, B.L.; Ratner, M.A.; Shriver, D.F. Vibrational spectroscopic determination of structure and ion-pairing in complexes of poly(ethylene oxide) with lithium-salts. J. Electrochem. Soc. 1982, 129, 1434–1438. [Google Scholar]
- Huang, W.W.; Frech, R. Dependence of ionic association on polymer-chain length in poly(ethylene oxide)-lithium triflate complexes. Polymer 1994, 35, 235–242. [Google Scholar]
- Watanabe, M.; Endo, T.; Nishimoto, A.; Miura, K.; Yanagida, M. High ionic conductivity and electrode interface properties of polymer electrolytes based on high molecular weight branched polyether. J. Power Sour. 1999, 81, 786–789. [Google Scholar]
- Allcock, H.R.; Napierala, M.E.; Olmeijer, D.L.; Cameron, C.G.; Kuharcik, S.E.; Reed, C.S.; O'Connor, S.J.M. New macromolecules for solid polymeric electrolytes. Electrochim. Acta 1998, 43, 1145–1150. [Google Scholar]
- Papke, B.L.; Ratner, M.A.; Shriver, D.F. Conformation and ion-transport models for the structure and ionic-conductivity in complexes of polyethers with alkali-metal salts. J. Electrochem. Soc. 1982, 129, 1694–1701. [Google Scholar]
- Smith, H.G.; Peterson, S.W.; Levy, H.A. Neutron-diffraction study of lithium sulfate monohydrate. J. Chem. Phys. 1968, 48, 5561–5565. [Google Scholar]
- Larson, A.C. Crystal structure of Li2SO4 2H2O a 3-dimensional refinement. Acta Crystallogr. 1965, 18, 717–724. [Google Scholar]
- Neises, B.; Steglich, W. 4-Dialkylaminopyridines as Acylation Catalysts. 5. Simple Method for Esterification of Carboxylic-Acids. Angew. Chem.-Int. Ed. Engl. 1978, 17, 522–524. [Google Scholar]
- Poulet, H.; Mathieu, J.P. Vibration Spectra and Symmetry of Crystals; Gordon and Breach: New York, NY, USA, 1976; p. 571. [Google Scholar]
- Singh, K.; Bhoga, S.S. The ion conduction mechanism of isovalent cation-doped Li2SO4. Appl. Phys. A 1998, 67, 475–481. [Google Scholar]
- Suleimany, B.M.; Gustavssonz, M.; Karawacki, E.; Lunden, A. Thermal properties of lithium sulphate. J. Phys. D Appl. Phys. 1997, 30, 2553–2560. [Google Scholar]
- Clark, T. A Handbook of Computational Chemistry; John Wiley and Sons: Hoboken, NJ, USA, 1985; pp. 12–95. [Google Scholar]
© 2011 by the authors; licensee MDPI, Basel, Switzerland. This article is an open access article distributed under the terms and conditions of the Creative Commons Attribution license (http://creativecommons.org/licenses/by/3.0/).
Share and Cite
Radziuk, D.V.; Möhwald, H. Spectroscopic Investigation of Composite Polymeric and Monocrystalline Systems with Ionic Conductivity. Polymers 2011, 3, 674-692. https://doi.org/10.3390/polym3020674
Radziuk DV, Möhwald H. Spectroscopic Investigation of Composite Polymeric and Monocrystalline Systems with Ionic Conductivity. Polymers. 2011; 3(2):674-692. https://doi.org/10.3390/polym3020674
Chicago/Turabian StyleRadziuk, Darya V., and Helmuth Möhwald. 2011. "Spectroscopic Investigation of Composite Polymeric and Monocrystalline Systems with Ionic Conductivity" Polymers 3, no. 2: 674-692. https://doi.org/10.3390/polym3020674