Electrically Conductive Epoxy Adhesives

Abstract
: Conductive adhesives are widely used in electronic packaging applications such as die attachment and solderless interconnections, component repair, display interconnections, and heat dissipation. The effects of film thickness as functions of filler volume fraction, conductive filler size, shape, as well as uncured adhesive matrix viscosity on the electrical conduction behavior of epoxy-based adhesives are presented in this work. For this purpose, epoxy-based adhesives were prepared using conductive fillers of different size, shape, and types, including Ni powder, flakes, and filaments, Ag powder, and Cu powder. The filaments were 20 μm in diameter, and 160 or 260 μm in length. HCl and H3PO4 acid solutions were used to etch and remove the surface oxide layers from the fillers. The plane resistance of filled adhesive films was measured using the four-point method. In all cases of conductive filler addition, the planar resistivity levels for the composite adhesive films increased when the film thickness was reduced. The shape of resistivity-thickness curves was negative exponential decaying type and was modeled using a mathematical relation. The relationships between the conductive film resistivities and the filler volume fractions were also derived mathematically based on the experimental data. Thus, the effects of surface treatment of filler particles, the type, size, shape of fillers, and the uncured epoxy viscosity could be included empirically by using these mathematical relations based on the experimental data. By utilizing the relations we proposed to model thickness-dependent and volume fraction-dependent conduction behaviors separately, we were able to describe the combined and coupled volume fraction-film thickness relationship mathematically based on our experimental data.
1. Introduction
Over the past decades, the use of electrically conductive adhesive (ECA's) has expanded rapidly in the microelectronics industry. The major applications for ECA's are die attachment, liquid crystal display (LCD), and surface-mounted assembly of packaged components on printed wiring board (PWB's). ECA's can be used as solder replacement, interconnection, sealing, electrical shielding, various electronic components bonding, fastening and brazing [1,2].
Unlike other types of adhesives, electrically conductive adhesives perform two primary functions. First, conductive adhesives form joints with sufficient strength so that they can bond two surfaces, and second, an electrical interconnection is formed between the two bonded surfaces. This dual functionality is usually achieved in composite form by dispersion of particles in an insulating adhesive matrix [3,4]. The commonly used conductive fillers include carbon black, graphite flakes, and micron or nano-sized metal particles such as silver, nickel, copper or aluminum. Typical polymer matrices are epoxy, silicone, polyamide or polyurethane. The primary properties of these adhesives are high and stable electrical conductivity. Typically, these adhesives have an electrical resistivity of 104 Ω-cm (Ohm-cm), which is about two orders of magnitude higher than the best metallic conductors. The metal fillers, which are added to the epoxy resin usually improve its other properties such as strength, thermal conductivity etc., and therefore, can also be used to impart specific composite properties such as thermal expansion, thermal conductivity, shrinkage and heat resistance [5,6].
Compared to traditional tin/lead (Sn/Pb) soldering technology, conductive adhesive joining technology offers many advantages, such as: (i) lower sensitivity to thermo-mechanical stresses, due to higher flexibility than solder; (ii) lower cure temperature enabling the use of heat sensitive or non-solderable materials; (iii) high resolution capability for fine-pitch interconnections due to smaller particle size than solder pastes; (iv) simple processing, and thereby lower cost; and (v) environmental compatibility [7-9].
Despite the achievements so far, the conductive adhesive joining technology still has some problems. The major ones being conductivity lower than solder, sensitivity to type and quality of component and board metallization, longer curing times, and the question of durability in various climatic environments. The processing parameters, such as temperature, pressure, cure time, pot and shelf life are critical to the success of making reliable electrical and mechanical interconnections. A conductive adhesive joint may fail in many different ways [10-23]. These include thermal stresses caused by the coefficient of thermal expansion mismatch between the substrate and component, and by mismatch between the adhesive and adherend during temperature cycling, oxidation of the bonding surfaces and of the filler, and degradation by UV-light or corrosive gases. A better understanding of the design, reliability, material, and manufacturing characteristics of various conductive adhesive technologies must be achieved before an assessment of their application as component attachment replacement can be made [24-32]. In order to understand and analyze these issues, the mechanism of electrical conduction needs to be studied first.
1.1. Conduction Mechanisms in Metal-Polymer Composite
Composite material properties, which result when conductive particles are dispersed into a polymer matrix, are influenced by the particle volume fraction. The main interest has been focused on the critical volumetric concentration of filler at which the composite resistivity drops suddenly from the high value of matrix to a value orders of magnitude lower [33].
In ECA's, the conductive paths are formed by metal particles. These particles must initially make intimate contact (physical and tunneling) and form a conductive chain, which transports electrons [34,35]. At critical concentration, a connected chain network of particles first appear in the system. As the particle concentration is increased, the fraction of particles in this network increases. It is this network, which contributes to the major conduction process.
Several factors are known to affect the magnitude of the threshold volume fraction, such as particle size distribution, particle shape, and pre-treatment of particle. For different conductive adhesive systems, different fillers result in different adhesive resistivity behavior, along with the limitation imposed by the adhesive film thickness.
This work is concerned with the modeling of thickness-dependent conduction behavior of epoxy adhesives with different volume fractions of particle fillers, which have different size, shape, and type.
In metal-polymer composite systems, three situations are possible: no contact, close proximity and physical contact between the conductive particles [36]. When the conductive particles are isolated in the insulating polymer, the conductivity of the composite is changed only slightly. The composite remains an insulator, although its dielectric properties may change significantly [37]. When the conductive particles are in close proximity, electrons can penetrate the thin gap (<10 nm) between the particles. The process of electron transport across an insulator gap is referred to as tunneling. The tunneling effect is extremely sensitive to the gap width (thickness of the insulating film) and height of the potential barrier to be penetrated. When the metal fillers physically contact each other to form a continuous network, the composite conducts through the particle network by the conduction mechanism of the metal particles (band-type conduction). Actual physical metallic contacts or tunneling conductions possibly co-exist between the metal particles in the metal-filled polymer system, depending on the filler loading, processing conditions, polymer-metal wettability, and the temperature.
1.2. Percolation Theory
When a sufficient amount of conductive filler is loaded into an insulating polymer matrix, the composite transforms from an insulator to a conductor, the result of continuous linkages of filler particles. Assuming a random dispersion of the conductive filler, as its concentration increases, no significant change occurs until a critical concentration (volume fraction) Vc is reached. This point where the electrical resistivity decreases dramatically, called the percolation threshold, has been attributed to the formation of a network of chains of conductive particles that span the composite [33].
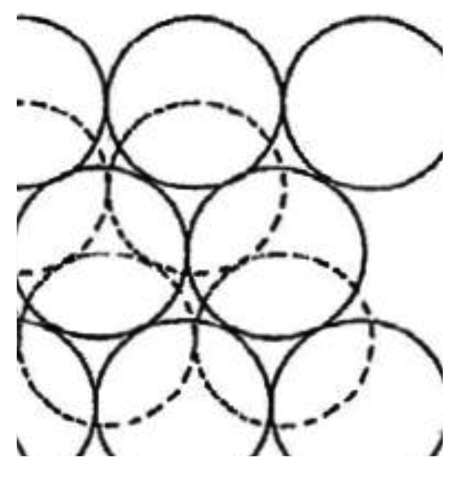
The probability of a continuous network being formed by filler particles in a matrix is related to the statistical average number of contacts each particle makes with neighboring particles and the maximum number of contacts per particle that are possible [33,38]. At the critical point of network formation, the critical number of contacts per particle is given by
The volume percentage of metal filler, P, in a matrix can be related to the average number of contacts per filler particle i.e., Cp = f (Pc). We assume a linear relationship [40]:
For a random mixture of spheres, we have: Cp = 1.5, Z = 6, and Pm = 0.637. Therefore, Pc is 0.159. This value is much lower than the experimental values. Based on this observation, Jantzen proposed [41]:
At the critical loading for network formation, we have:
For the random sphere case as above, Pc is 0.305, which also represents the critical concentration (volume fraction), Vc, for the filler particles. This represents the point at which network formation begins and the sharp drop in resistivity starts. These equations do not adequately account for preparation technique, particle size distribution, or particle-particle interaction effects.
Network formation theories for flakes, fibers, and other irregular shapes are even less well developed. For irregular fillers with a completely random distribution, the critical value of Pc is assumed to be the same as that for spherical fillers [42].
Wei and Sancaktar [43] showed that in particle filled electrically conductive adhesives systems, the resistivity depends on the average length (Si) of conductive adhesive paths between the conductive particles incorporated in the adhesive matrix. The average length of conductive paths can be defined as:
1.3. Contact Resistance
The resistivity of the filled adhesives containing spherical particles can be expressed by:
The contact resistance Rs can be determined [44,45] by using the relation,
The constriction resistance is given by
2. Experimental Methods and Materials
2.1. Materials
In our research, epoxy resins (Epon 815C and Epon 830), and the curing agent (Diethylenetriamine DETA), obtained from Shell Chemical Company (Houston, Texas) were used. Epon 830, which is a DGEBA type epoxy, had an epoxide equivalent weight of 190–198, and viscosity of 170–225 poise. Epon Resin 815C is liquid bisphenol A based epoxy resin containing n-butyl glycidyl ether. It had an epoxide equivalent weight of 180–195, and viscosity of 5–7 poise.
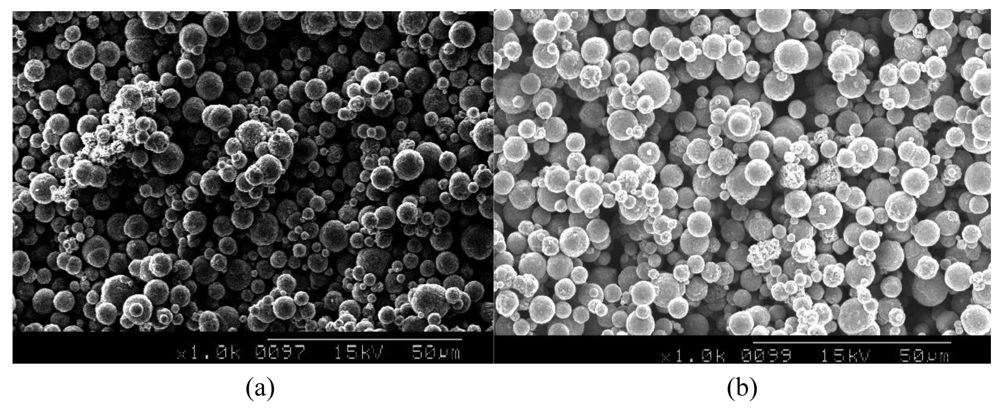
The following conductive particles were used in experiments: Ag powder (4–7 μm), Ni powder (3–7 μm, see Figure 2), Ni flakes (1–5 μm), Cu powder (6–7 μm), Ni filaments (20 μm diameter with 160 μm or 260 μm length respectively). Silver powders were purchased from Johnson Matthey Company (Ward Hill, MA); nickel particles were provided by Atlantic Equipment Engineering (Bergenfield, NJ); copper powder was purchased from Degussa (Cleveland, OH).
HCl and H3PO4, provided by EM Science (Gibbstown, NJ) were used for etching purposes.
2.2. Experimental Procedures
2.2.1. Adhesive Preparation
The preparation of the conductive adhesive was done as follows: First, the required amount of conductive particles was thoroughly mixed manually with epoxy resin. Then, as recommended by Turgut and Sancaktar [46], 11% DETA was added to the above mixture and again mixed thoroughly. Two kinds of epoxy resins (Epon 815C, Epon 830), and three different kinds of particles (Ni, Ag, Cu) were used in the experiments. Also, different volume fractions of particles were incorporated, ranging from 25% to 60% by volume. Adhesive films were cast manually with the thickness of the film as an experimental variable. The uncured mixture was dispersed on a glass slide as a film, and the thickness was controlled by the thickness of the molds, which were made by multilayer adhesive tape. As recommended by Shell, the films were cured in an oven at 60 °C for 3 hours.
2.2.2. Particle Etch Procedure
In order to remove the surface oxide layer, the nickel and copper particles were etched with 10% Hydrochloric acid (HCl) and 20% Phosphoric acid (H3PO4) respectively [47]. The particles were covered with the etching solution for 5 minutes with occasional mixing. The particles were then rinsed with distilled water and allowed to dry in an oven at 120 °C (see Figure 2(b)). As seen in Figure 2 with Ni powder, the etching procedure resulted in smoother particle surfaces, and thus, larger contact area between them to provide lower constriction resistance (see Equation 11).
2.3. Characterization
2.3.1. Measurement of Resistivity
Electrical resistances of conductive adhesive were measured by employing the standard four-point probe method under laboratory conditions. The apparatus used was Micro-ohmmeter (Model 580, Keithley Instruments, Inc., Cleveland, Ohio). Resistivity was calculated from the bulk resistance of the ECA specimen. Two strips of an adhesive tape were applied (as a mold) onto a precleaned glass slide with a gap between these two strips. A conductive paste was then spread within the space by means of a doctor blade. The narrow sides of the film were covered with aluminum foils to facilitate measurement with the four-point probe. After cure, the bulk resistance of this ECA strip was measured by using a Keithley Micro-ohmmeter with a four-point probe. The effect of the mixture of different metal fillers, volume fraction, and thickness on the resistivity of the ECA was observed.
The film resistivity (ρ) was calculated by using the relation,
3. Results and Discussion
3.1. Thickness-Dependent Conduction Behavior
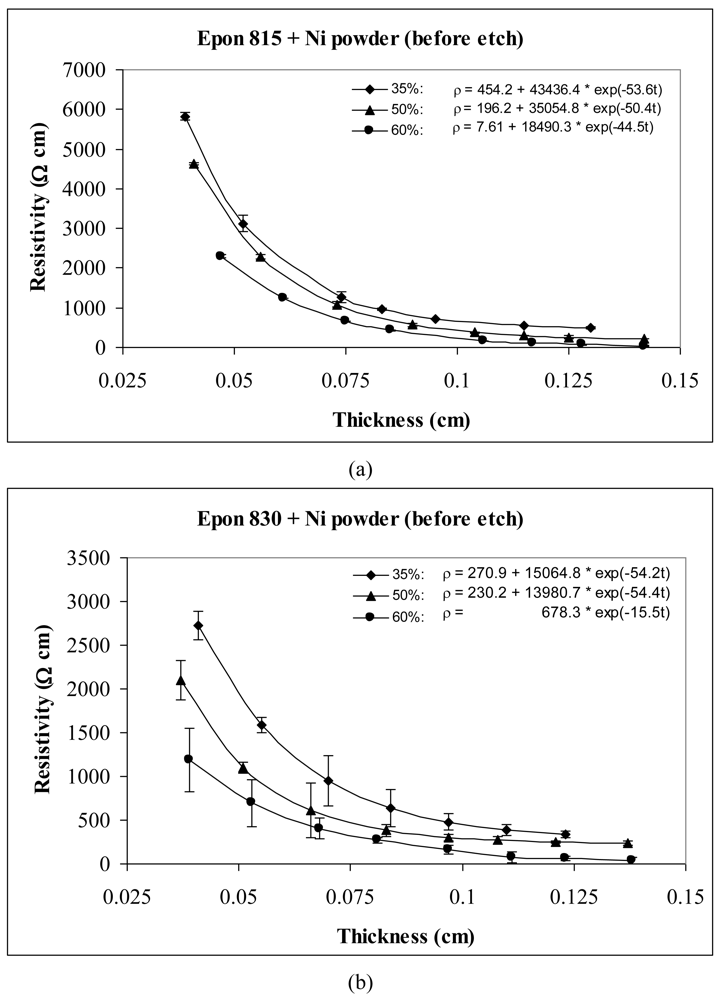
Experimental results for the thickness dependent conduction behavior are shown in Figures 3–12. In all cases, the resistivity levels are reduced as the thickness is increased similar to our previous published findings [48-50]. Conversely, when the thickness is reduced significantly, the effective coordination number, Z is reduced, and therefore, the critical volume fraction requirement for network formation, Pc, increases (see Equation 3). Therefore, a significant increase in resistivity is observed coupled with a significant increase in the slope of the resistivity-thickness curve.
The shape of resistivity-thickness curves is negative exponential decaying type. To describe this behavior, the function,
Based on the adhesive thickness-resistivity data, and Equation 14, we used Sigma Plot function fitting program to fit all the points, and obtained all the parameters and fitting errors for each specific adhesive system. The parameters of all the curves are listed in Tables 1 and 2.
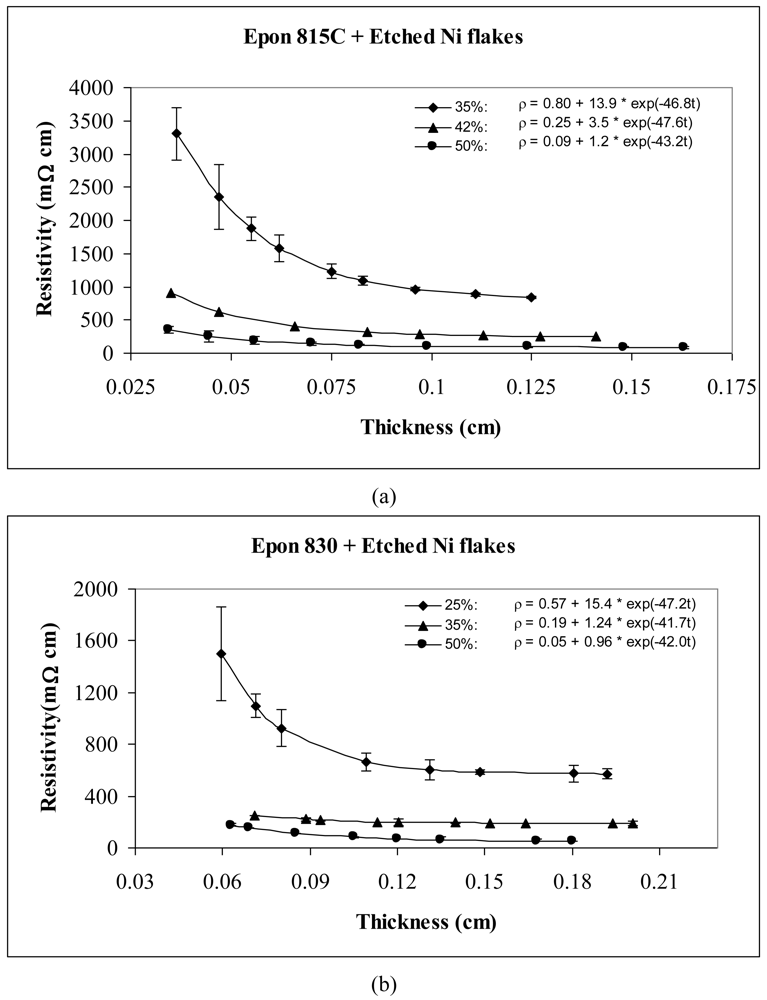
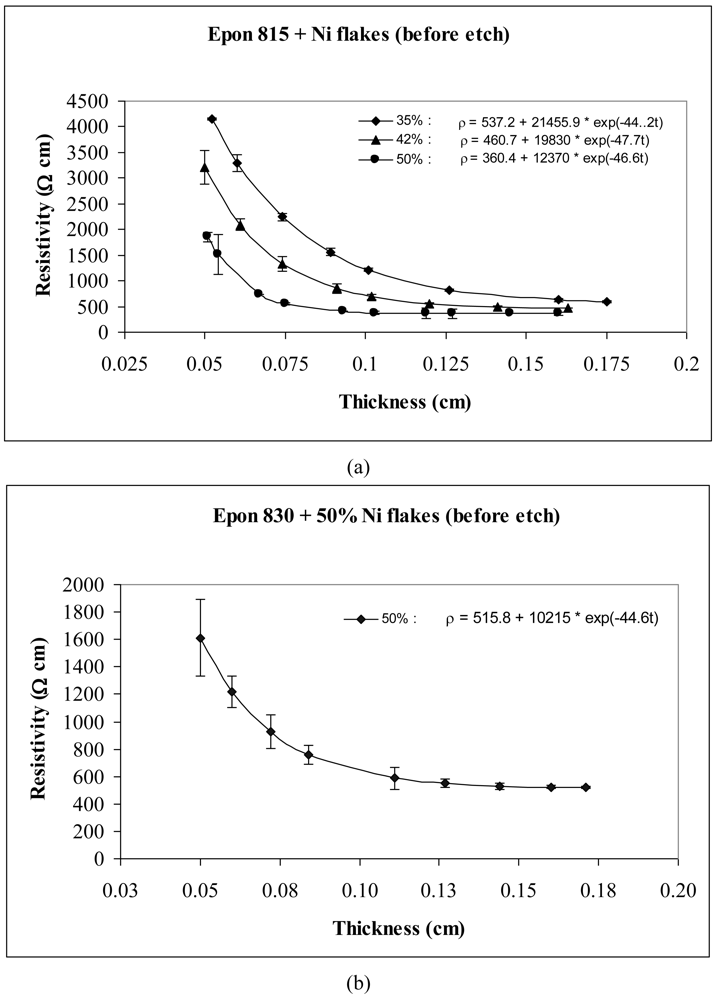
The thickness dependent resistivity behavior of conductive adhesive films containing three different volume fractions of nickel flakes are shown in Figures 3 and 4. These figures reveal that the values of parameters a and b both decrease with the increasing volume fraction of nickel particles. The values of parameter c, however, remained at the same level. These figures also reveal that the resistivity level of the conductive adhesive film decreases with increasing volume fraction of metal filler due to larger number of particle network interconnections formed.
Comparison of Figures 3 and 4 reveals the effect of particle etching when nickel flakes are used. We can observe that the unetched nickel flakes induce higher resistivity in comparison to the etched flakes. The parameter a values of Equation 14 range between 360 to 537 Ω-cm with the unetched particles, and 0.05 to 0.8 Ω-cm with the etched particles. These findings indicate that removal of nickel oxide from the particle surfaces result in much diminished resistance. For the etched samples, the values of parameter b dropped dramatically by as much as 99.9%, while the values of parameter c did not change much.
As mentioned before, two kinds of Epoxy resin were used in the experiments. Figures 3 and 4 show that for the same volume fraction of particles, higher resistivity levels are obtained with Epon 815C resin which has 5–7 Poise viscosity in comparison to Epon 830 resin which has 170–225 Poise viscosity. When epoxide polymers are mixed with metals to form a conductive polymer/metal composite, the early set viscosity is critical. In our case, the viscosity of Epon 815C is about 30-fold lower than Epon 830. According to Stokes's law, faster sedimentation of the metal particles is expected with lower polymer viscosities until the polymerization reaction can sufficiently increase the polymer viscosity. Comparison of Figure 4(a) and 4(b) reveals 44% reduction in parameter a, and 20% reduction in parameter b when the higher viscosity resin is used with etched particles. With the unetched particles, however, the parameter a increases 43%, while b decreases 17% when the resin viscosity is increased (Figure 3(a,b)). Changes in parameter c are not significant in either of these cases.
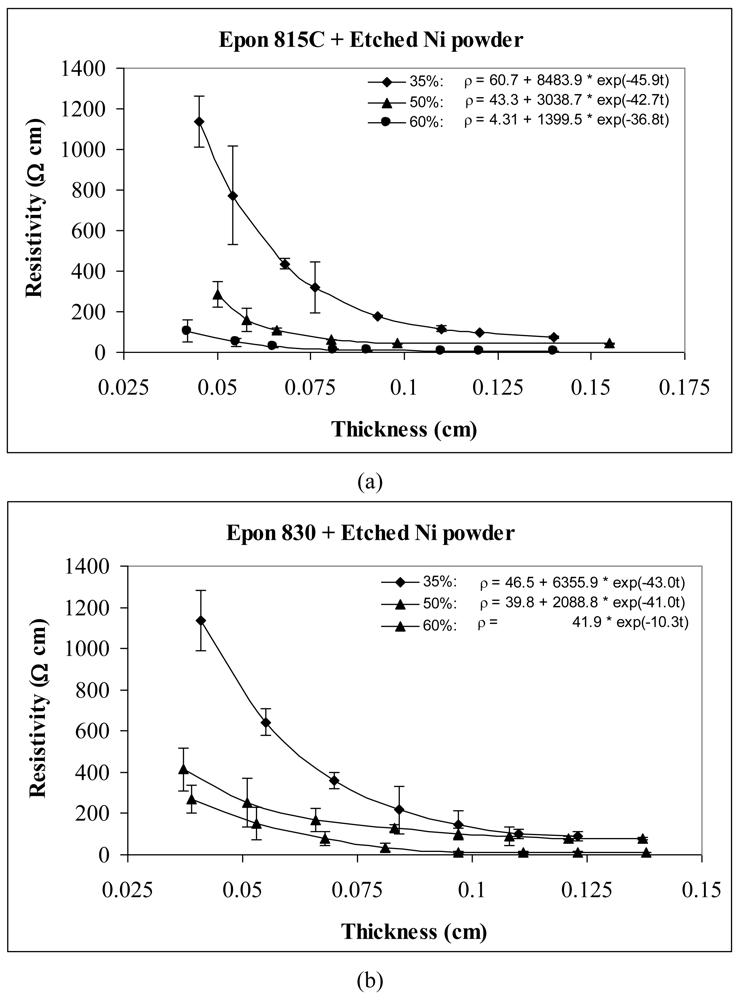
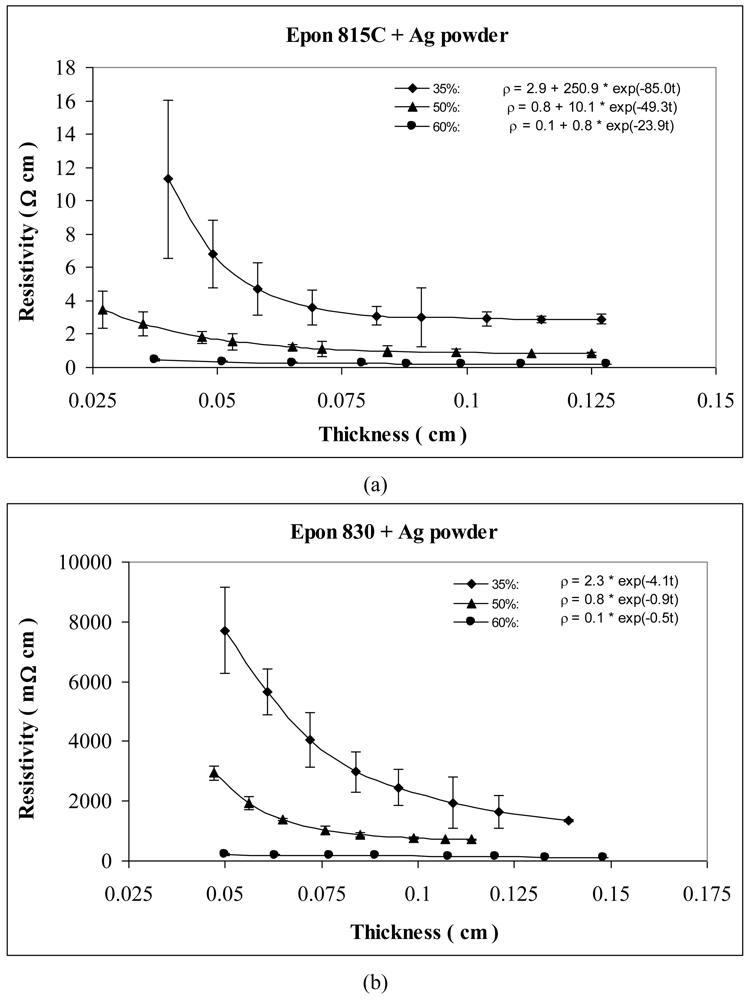
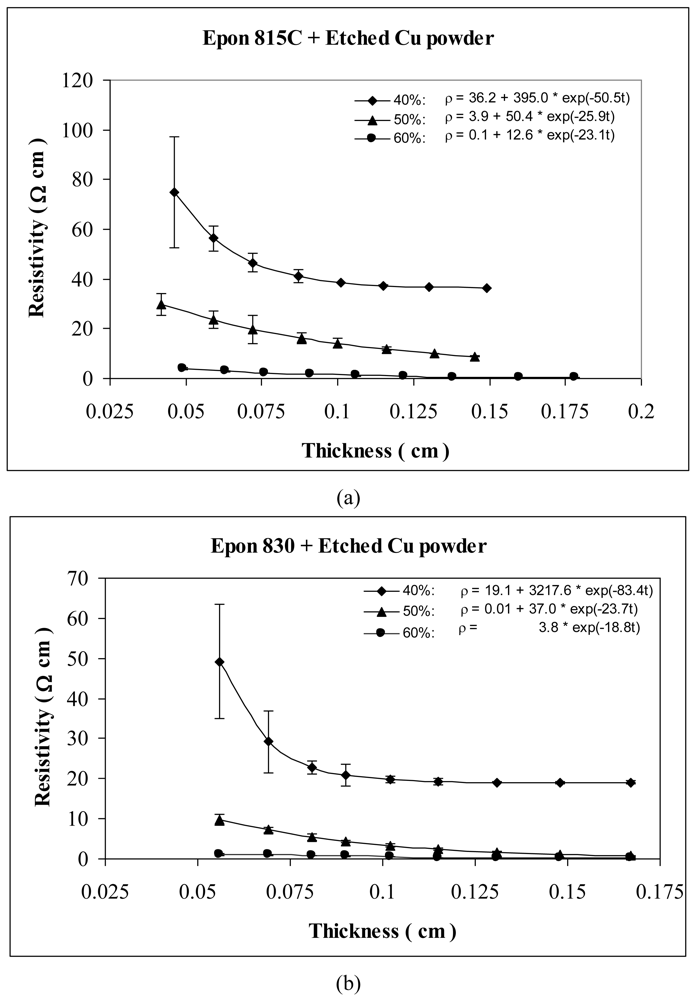
For the behavior of approximately spherical shaped powder particles, the results are shown in Figures 5 and 6 for nickel powder, Figure 7 for silver powder, and Figure 8 for copper powder. We can observe that the resistivity levels are reduced as the film thickness and the volume fraction of metal filler are increased. The values of parameters a, b and c all decrease with increasing volume fraction of particles.
For the nickel and copper powders, oxide removal treatment also has a significant effect in reducing adhesive resistivity. Especially for untreated copper particles, no conduction can be obtained in the adhesive films without etching the particles. Comparison of Figures 5 and 6, reveals the effect of nickel powder particle etching. We can observe that the unetched nickel powder induces higher resistivity in comparison to the etched powder. When the lower viscosity resin (Epon 815C) was used with etched particles, the values of parameters a, b and c dropped by as much as 69%, 88% and 15% respectively. The values of parameters a, b and c dropped by as much as 82%, 79% and 22% respectively, when the higher viscosity resin (Epon 830) was used with the etched nickel powder.
For the same volume fraction of nickel powder loading, the Epon 815C resin has a higher resistivity level than Epon 830 resin. Comparison of Figure 6(a) and 6(b) reveals 15% reduction in parameter a, 27% reduction in parameter b, and 6% reduction in parameter c, when the higher viscosity resin is used with etched particles. With the unetched nickel powder (Figure 5(a,b)), the parameter a decreases 40%, and parameter b decreases 62% when the viscosity of the resin is increased. Changes in parameter c are not consistent, but the results still display a decreasing trend.
Figures 7 and 8 show the thickness-dependent resistivity results for the silver and copper particles respectively. For silver powder, the parameter a values range between 2.9 to 0.1 Ω-cm with the lower viscosity resin, but it is zero for the higher viscosity resin. Parameters b and c decrease by as much as 98% when the resin viscosity is increased. Figure 8(a,b) reveals 55% reduction in parameter a, 48% reduction in parameter b, and 13% reduction in parameter c, when the resin viscosity is increased in the presence of etched copper particles.
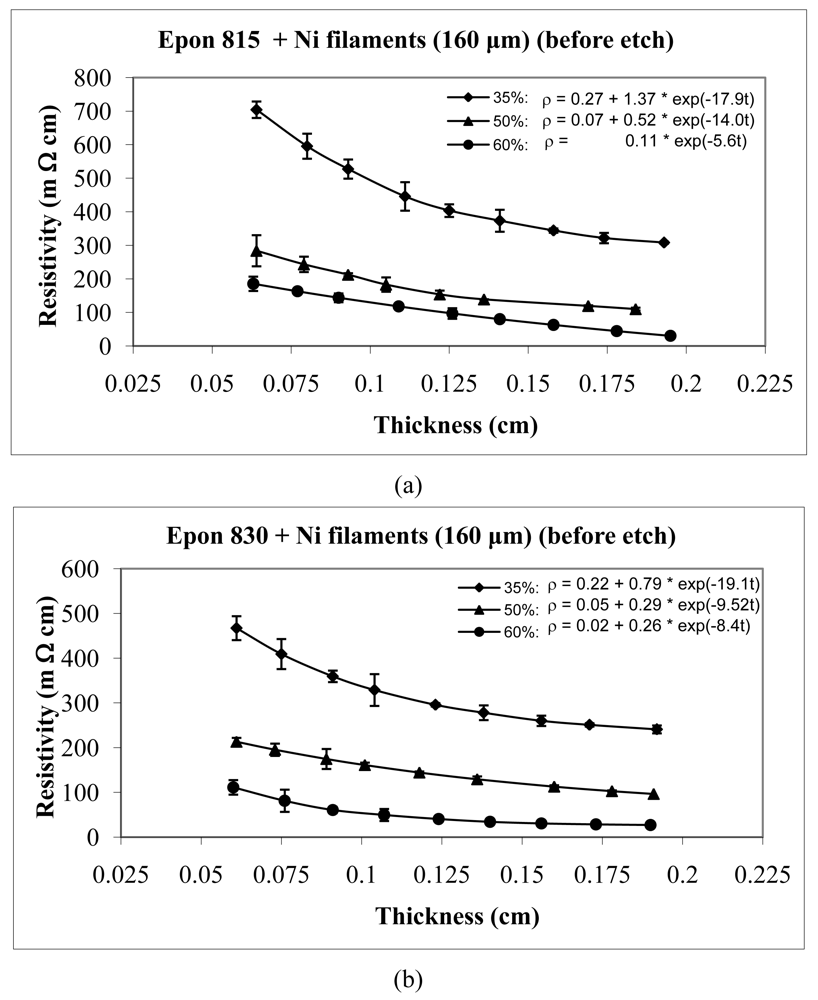
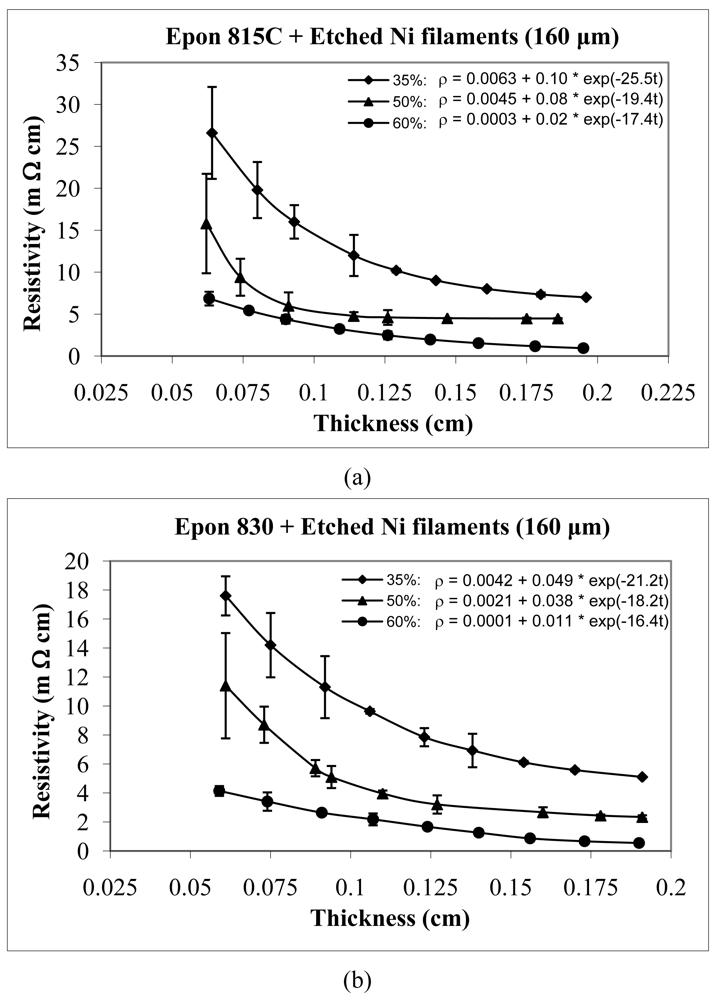
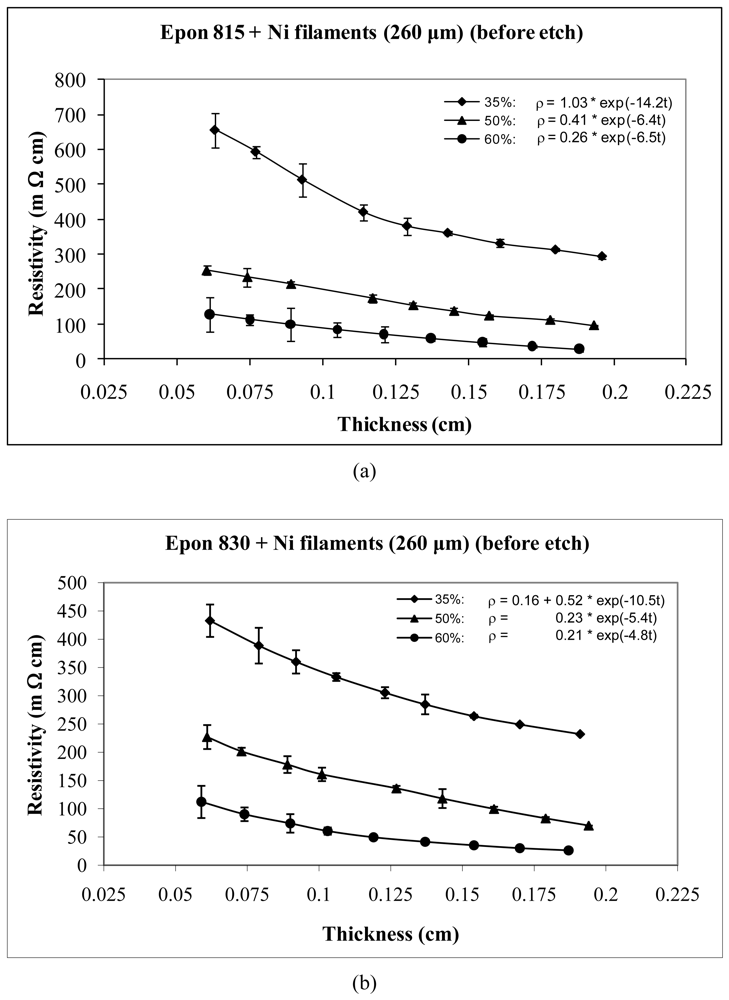
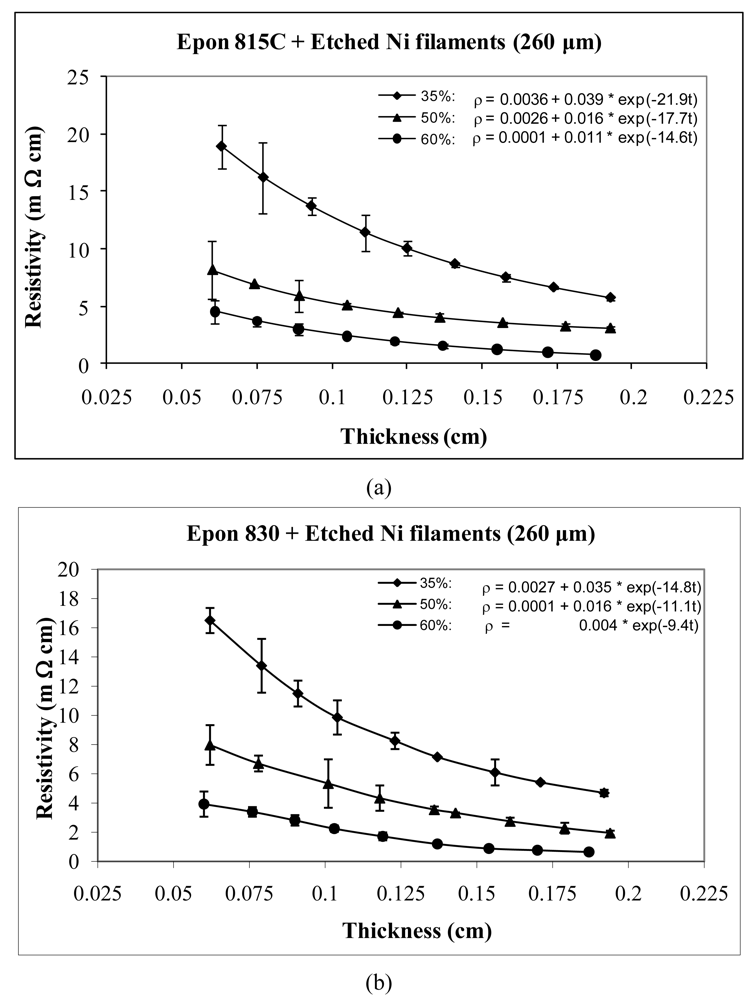
For the case of nickel filament addition, Figures 9 and 10 show the thickness dependent resistivity behavior for 160 μm long nickel filaments, and Figures 11 and 12 show the same for the 260 μm filament length. From these figures, we can observe that the resistivity levels display a decreasing trend as the film thickness and the volume fraction of nickel filaments are increased. The values of parameters a, b and c all decrease with increasing volume fraction of nickel filament particles. Comparison Figures 9 and 10 reveals that the unetched nickel filaments provide higher resistivity than the etched filaments; For the 160 μm nickel filaments, the parameter a values are 0.27 Ω-cm or lower with the unetched particles, and range from 0.0063 to 0.0001 Ω-cm with the etched particles. The parameter b values range between 1.37 and 0.11 Ω-cm with the unetched filaments, and 0.10 to 0.01 Ω-cm with the etched filaments. These findings indicate that removal of nickel oxide from the particle surfaces result in much diminished resistance. As for the parameter c values, etching results in about 46% increase in comparison to the unetched filaments.
For the same amount of 160 μm filaments loading, the resistivity level is less with the Epon 830 resin than the Epon 815C resin. Comparison of Figure 10(a) and 10(b) reveals 43% reduction in parameter a, 50% reduction in parameter b, and 9% reduction in parameter c, when the higher viscosity resin is used with etched 160 μm nickel filaments. With the unetched nickel filaments, (Figure 9(a,b)), the parameters a and b decrease 24% and 43%, respectively, when the viscosity of the resin is increased.
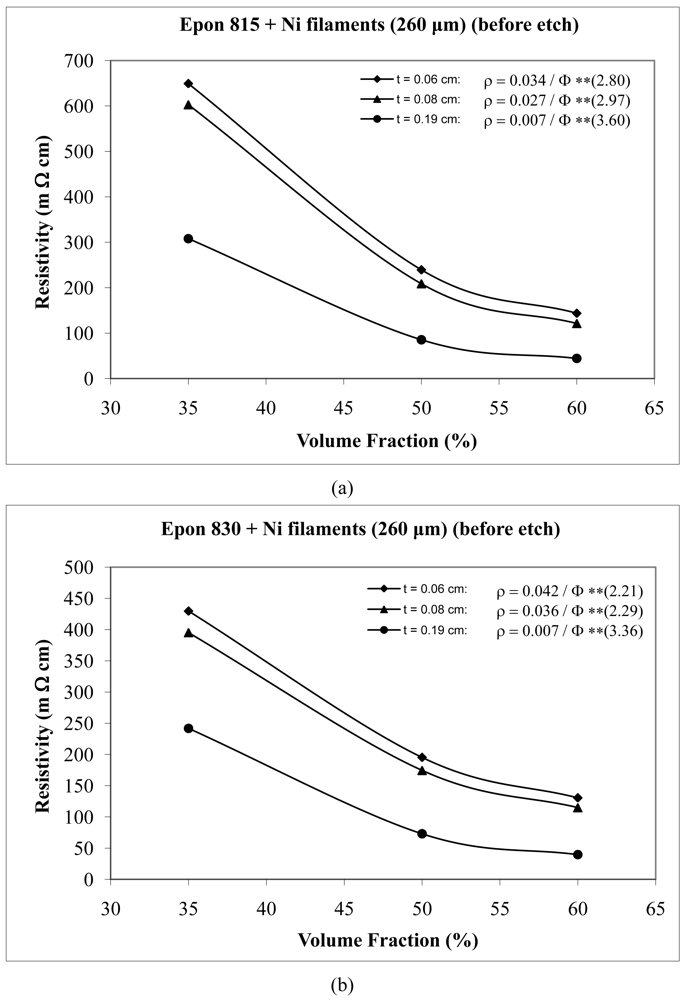
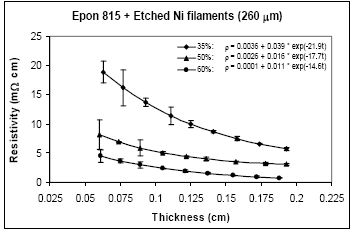
For nickel filaments with 260 μm length, comparison of Figures 11 and 12, reveals that the parameter a values are 0.16 Ω-cm or lower with the unetched particles, and 0.0036 Ω-cm or lower with the etched particles. The parameter b values range between 1.03 to 0.21Ω-cm with the unetched filaments, and 0.039 to 0.004 Ω-cm with the etched filaments. These findings indicate that removal of nickel oxide from the particle surfaces results in much diminished resistance. With the etched filaments, the parameter c increased about 53% in comparison to the unetched filaments.
For the same amount of 260 μm filaments loading, the resistivity level is less with the Epon 830 resin in comparison to the Epon 815C resin. Comparison of Figure 12(a) and 12(b) reveals 61% reduction in parameter a, 25% reduction in parameter b, and 35% reduction in parameter c, when the higher viscosity resin (Epon 830) is used with etched nickel filaments. With the unetched nickel filaments, (Figure 11(a,b)), the parameter a remains zero, parameter b decreases 52% and parameter c decreases 27%, when the viscosity of the resin is increased.
Our results on the thickness-dependent resistivity behavior of conductive particle filled epoxy resins reveal that the values of the governing Equation 14 parameters a, b and c depend on the particle filler volume fraction, etch treatment, prepolymer viscosity, particle type and particle shape. In unique case of the nickel flakes, the parameter c remains almost constant.
Tables 1 and 2 list the parameters for all the curves shown in Figures 3–12 for comparison purposes.
3.2. Volume-Fraction Dependent Conduction Behavior
Examination of Equations 8 and 9 reveals the filled adhesive resistivity to be inversely proportionally to a power (n) of volume fraction Φ. Thus, a 2-parameter power function of the type,
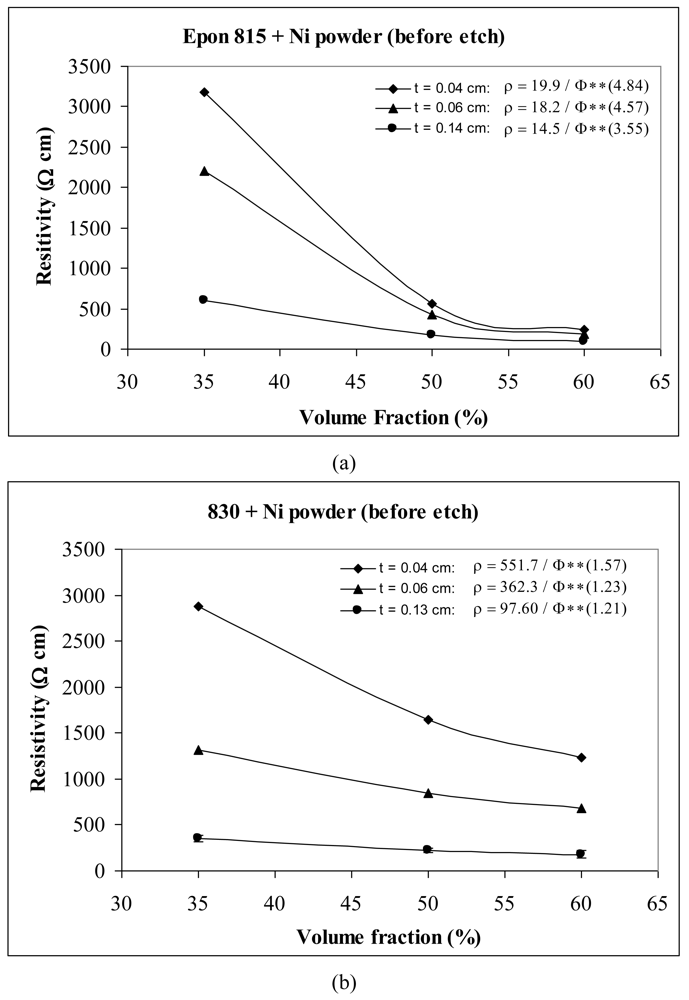
Figures 13–21 and Tables 3 and 4 show the experimental results for particle volume fraction dependent conduction behavior. In all cases, the resistivity levels are reduced as the volume fraction is increased. In Figures 13–21, the shapes of the resistivity-volume fraction curves are similar and they can be efficiently described by using the 2-parameter power function of Equation 15.
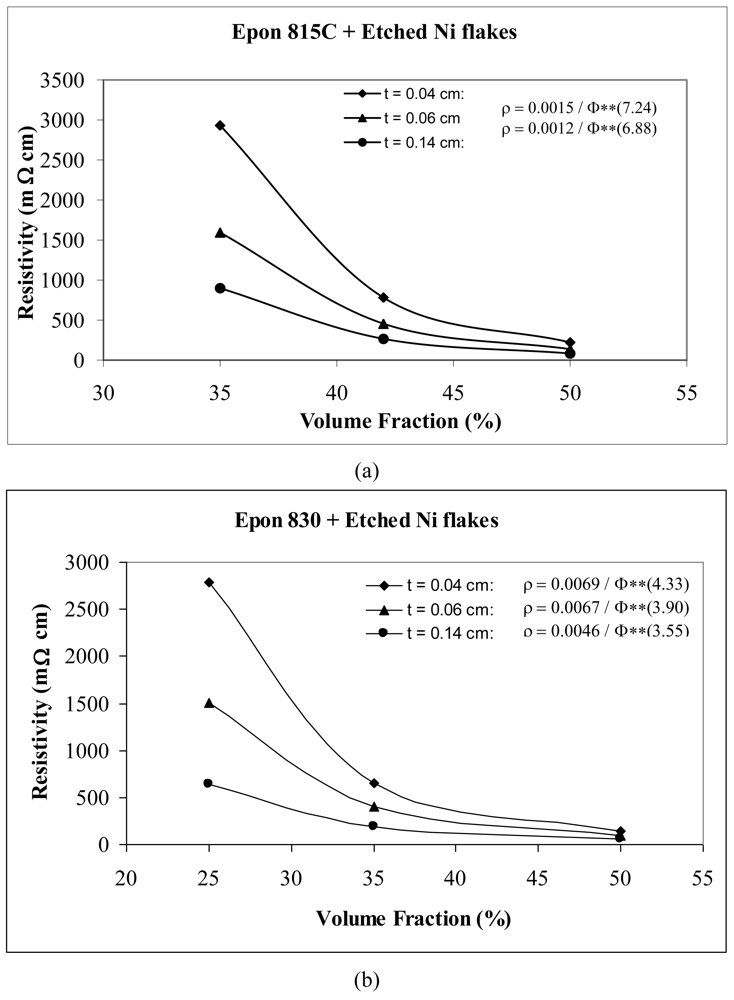
Volume fraction-thickness dependent resistivity behaviors of etched nickel flake filled conductive adhesive films of three different thicknesses are shown in Figure 13. We note that the values of parameters A and n both decrease with increasing thickness of adhesive film, indicating reductions in film resistivity. This is because thicker conductive adhesive films have more possibility of particle network interconnection formation, resulting in easier electrical conduction through the composite film. For example, with Epon 815C resin, increasing the film thickness from 0.04 cm to 0.06 cm, results in 20% and 5% decreases in A and n values, respectively, and a further increase to 0.14 cm, results in 47% and 8% reductions, respectively (Figure 13(a)). The corresponding reductions are 3%, 10%, and 33%, 18% when Epon 830 resin is used (Figure 13(b)).
By comparing Figure 13(a) with Figure 13(b) for the same thickness of adhesive film, we note that the parameter A has a lower value for Epon 815C resin in comparison to Epon 830 resin. This difference is as high as 82% with t = 0.14 cm. On the other hand, Epon 815C has higher values of exponent n than Epon 830. This difference is as high as 47% with t = 0.14 cm. Obviously, with the lower viscosity of resin 815C, the film resistivity is more sensitive to changes in the filler volume fraction as its exponent, n, is higher at all film thicknesses when nickel flakes are used. We also note that since fractions are used for Φ values in the Equation 15, the lower values of the exponent n with the higher viscosity resin Epon 830 result in lower film resistivity values, with the effect of the parameter A being much less.
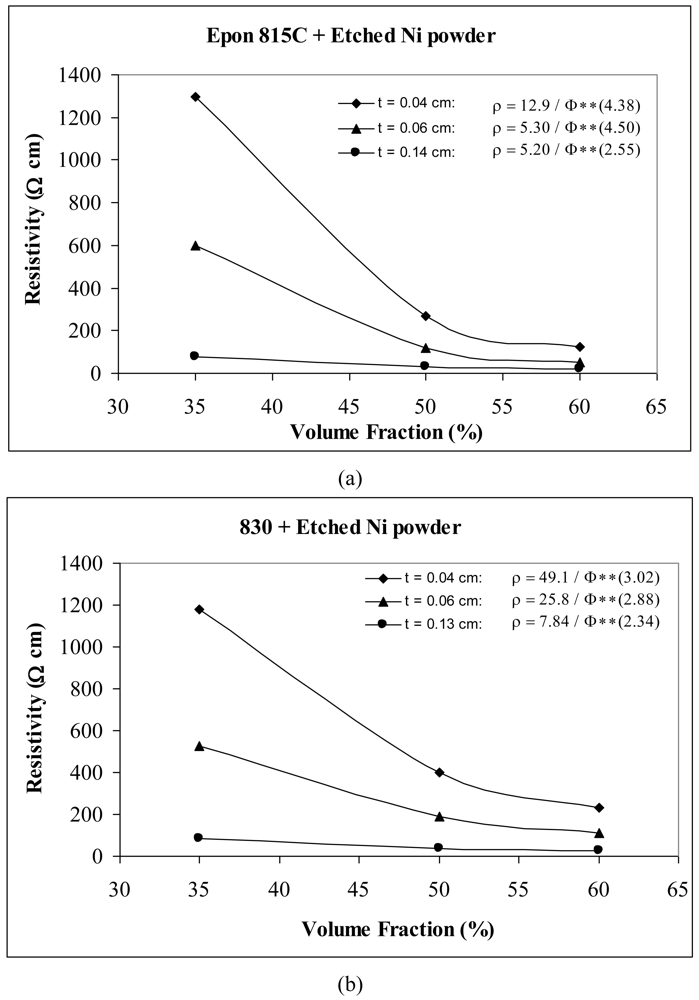
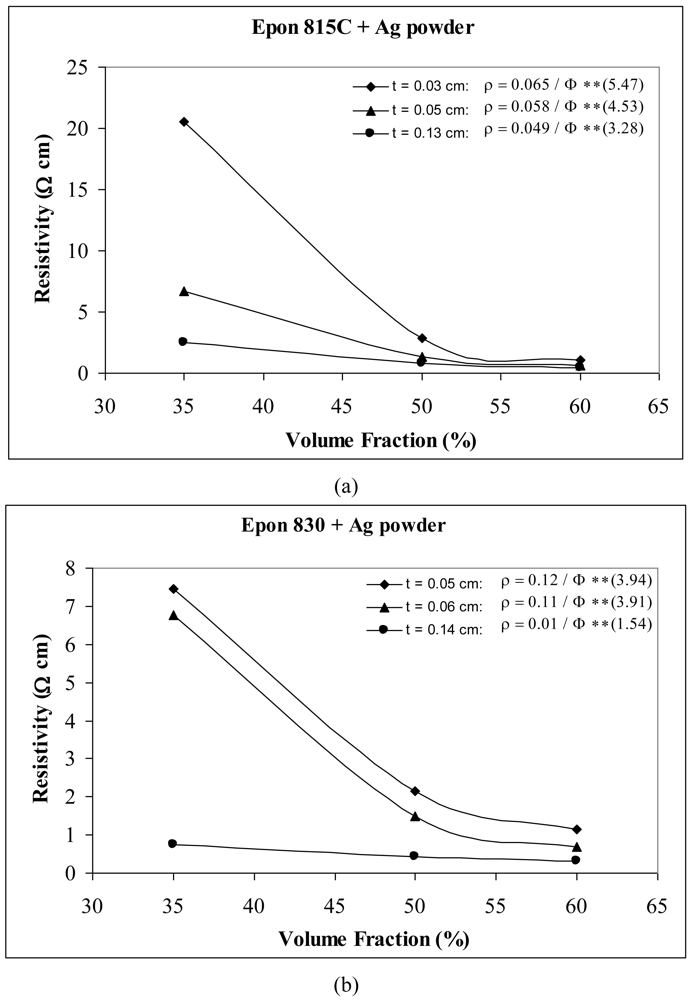
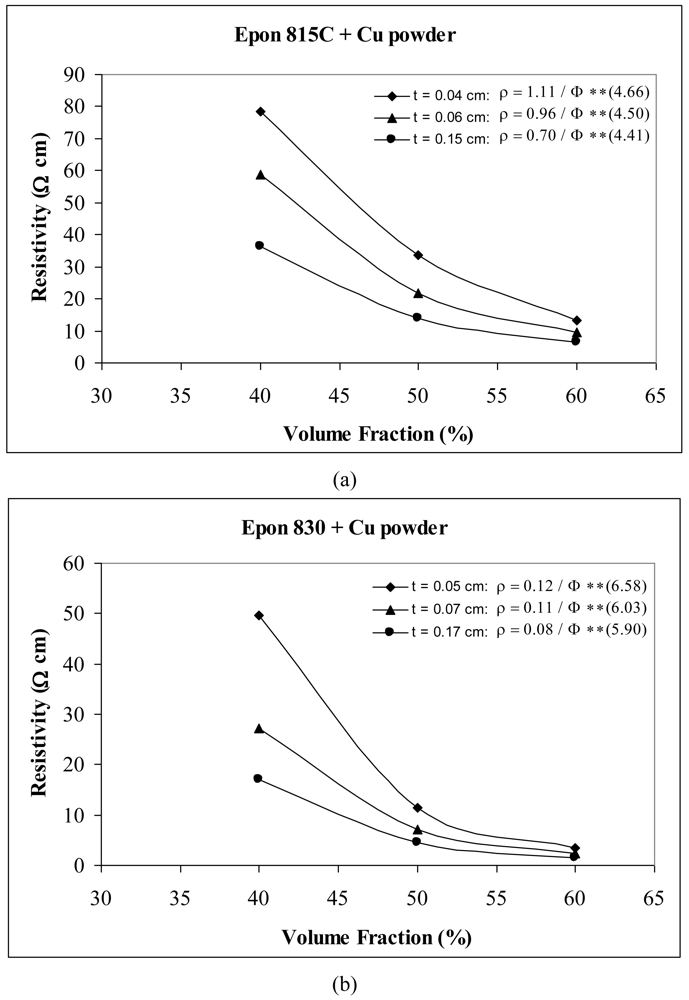
The results for film resistivity behavior with powder particles are shown in Figures 14 and 15 for unetched and etched nickel powders, respectively, in Figure 16 for silver powder, and Figure 17 for etched copper powder. We can observe that the resistivity levels are reduced as the thickness and the volume fraction of the metal filler are increased. The values of parameter A and n all decrease with increasing thickness of the conductive adhesive film.
For unetched Ni powder with Epon 815C resin, increasing the film thickness from 0.04 cm to 0.06 cm, results in 9% and 6% decreases in A and n values, respectively, and a further increase to 0.14 cm, results in 27% and 26% reductions, respectively (Figure 14(a)). The corresponding reductions are 34%, 22%, and 82%, 23% when Epon 830 resin is used (Figure 14(b)). For etched Ni powder, with Epon 815C resin, increasing the film thickness from 0.04 cm to 0.06 cm, results in 59% decrease in A values, and 3% increase in n values. A further increase to 0.14 cm, results in 60% and 42% reductions in parameters A and n (Figure 15(a)). The corresponding reductions are 47%, 5%, and 84%, 23% when Epon 830 resin is used (Figure 15(b)).
When we use Ag powder with Epon 815C resin, increasing the film thickness from 0.04 cm to 0.06 cm, results in 11% and 17% decreases in A and n values, respectively, and a further increase to 0.14 cm, results in 25% and 40% reductions in parameters A and n (Figure 16(a)). The corresponding reductions are 8%, 1%, and 92%, 61% when Epon 830 resin is used (Figure 16(b)). For etched Cu powder with Epon 815C resin, increasing the film thickness from 0.04 cm to 0.06 cm, results in 14% and 3% decreases in A and n values, respectively, and a further increase to 0.14 cm, results in 37% and 5% reductions in parameters A and n (Figure 17(a)). The corresponding reductions are 8%, 8%, and 33%, 10% when Epon 830 resin is used (Figure 17(b)).
The effects of powder particle etching can be further illustrated by comparison of Figures 14 and 15. We can observe that the unetched nickel powder provides higher resistivity in comparison to the etched powder. These findings indicate removal of nickel oxide from the particle surfaces result in much diminished resistance. We also note that the values of parameter A decrease by as much as 71% with t = 0.06 cm for etched nickel powder. The values of the exponent n reduced as much as 28% with t = 0.14 cm for Epon 815C system, and increased by as much as 92% with t = 0.14 cm for the Epon 830 system.
For the nickel powder (Figures 14 and 15), with the same thickness of adhesive film, we note that the Epon 815C resin has a lower value of the parameter A than Epon 830 resin. This difference is as much as 85% (t = 0.14 cm) with unetched particles, and 33% (t = 0.14 cm) with the etched powder. On the other hand, Epon 815C has higher values of exponent n than Epon 830. This difference is as much as 66% (t = 0.14 cm) with unetched particles, and 33% (t = 0.14 cm) with the etched powder. Figure 16 reveals similar effects with the Ag powder. Going from resin Epon 815C to 830, the value of the parameter A increases by as much as 80% (t = 0.13 cm), and the value of n decreases by as much as 53% (t = 0.13 cm). With the Cu powder, however, the opposite trend is obtained (Figure 17). Going from resin 815C to 830, the value of the parameter A decreases by as much as 80% (t = 0.15 cm), and the value of n increases by as much as 34% (t = 0.15 cm).
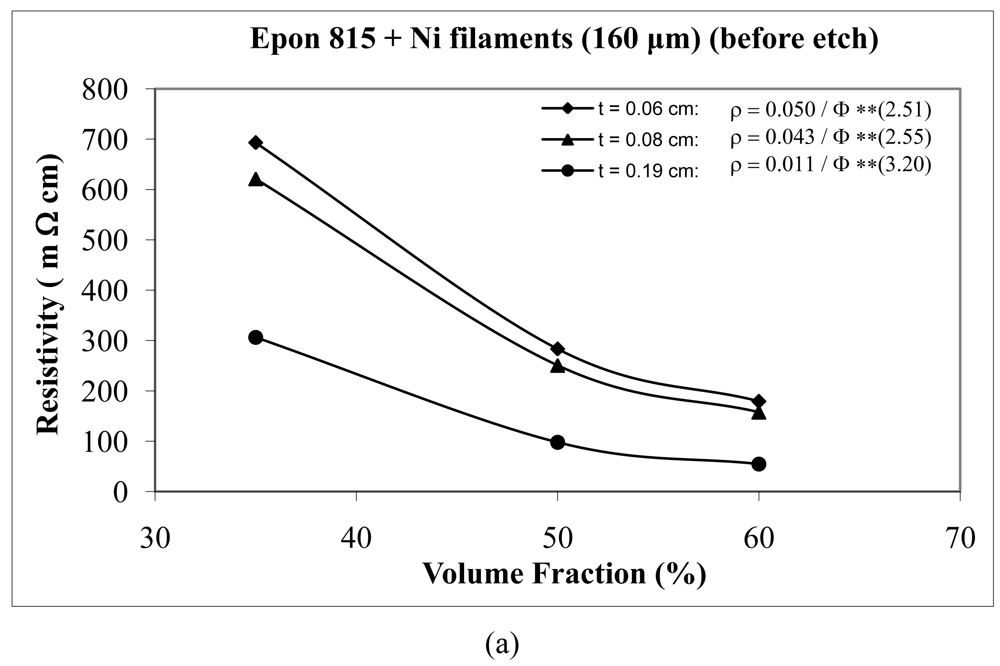
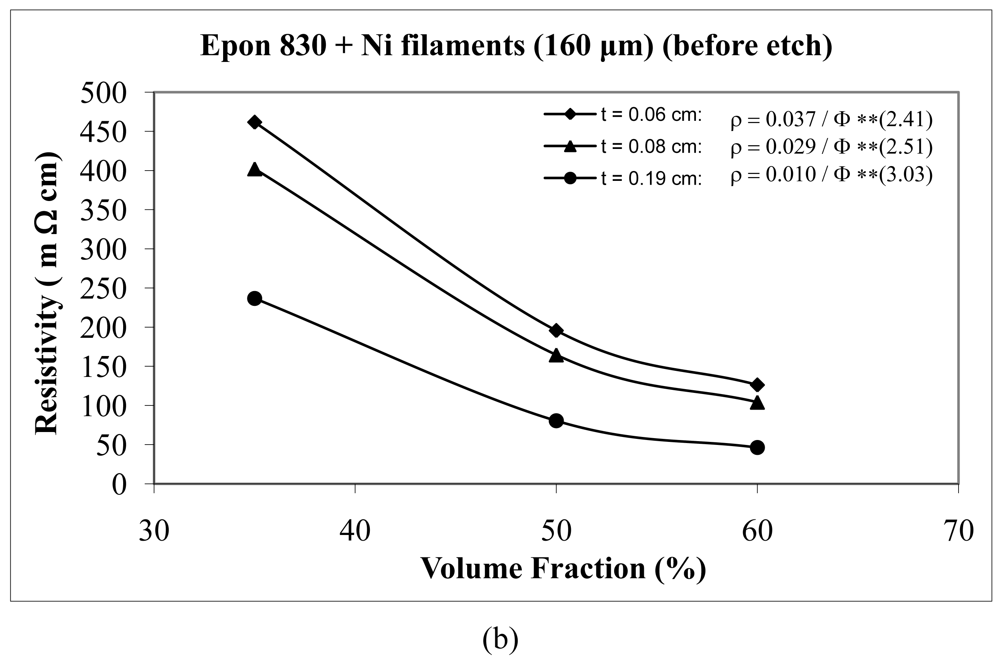
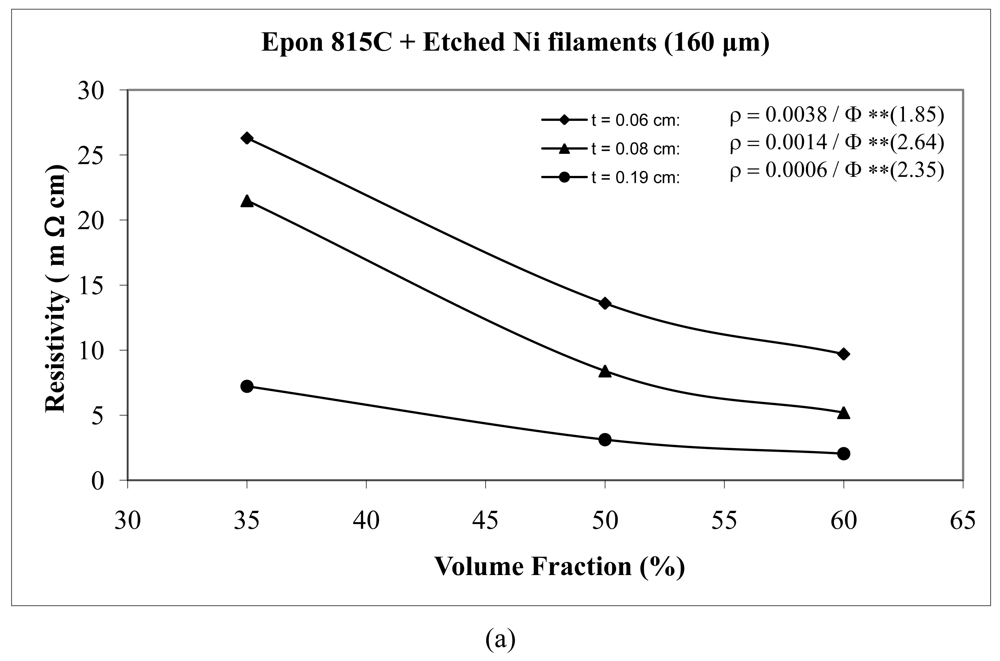
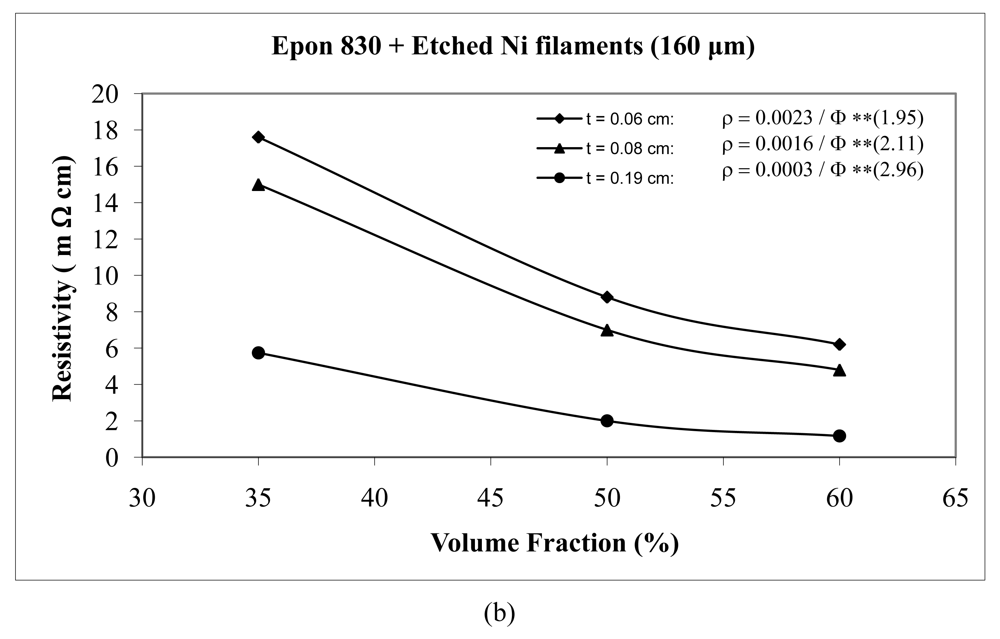
For the case of nickel filament addition, Figures 18 and 19 show us the behavior with nickel filaments of 160 μm length, and Figures 20 and 21 give us the results with nickel filaments of 260 μm length. From these figures, we can observe that the resistivity levels display a decreasing trend as the film thickness and the volume fraction of nickel filaments are increased. When increasing the thickness of adhesive film, the value of Equation 15 parameter A decreases and the value of parameter n increases.
When we use unetched nickel filaments of 160 μm length in Epon 815C resin, increasing the film thickness from 0.06 cm to 0.19 cm, results in 78% decrease in the A value, and 27% increase in the n value (Figure 18(a)). The corresponding changes are 73% decrease, and 20% increase, respectively, when Epon 830 resin is used (Figure 18(b)). For the etched nickel filaments with Epon 815C resin, increasing the film thickness from 0.06 cm to 0.19 cm, results in 84% decrease in the A value, and 27% increase in the n value (Figure 19(a)). The corresponding changes are 87% decrease, and 51% increase, respectively, when Epon 830 resin is used (Figure 19(b)).
For the nickel filaments of 260 μm length, when we use unetched particles with Epon 815C resin, increasing the film thickness from 0.06 cm to 0.19 cm, results in 79% decrease in the A value, and 22% increase in the n value (Figure 20(a)). The corresponding changes are 73% decrease, and 52% increase, respectively, when Epon 830 resin is used (Figure 20(b)). For etched nickel filaments with Epon 815C resin, increasing the film thickness from 0.06 cm to 0.19 cm, results in 62% decrease in the A value, and 2% increase in the n value when the film thickness is increased from 0.04 cm to 0.06 cm (Figure 21(a)). The corresponding changes are 86% decrease, and 9% increase, respectively, when Epon 830 resin is used (Figure 21(b)).
At equal concentration, the unetched nickel filaments produce higher resistivity compare to the etched filaments. For the nickel filaments of 160 μm length, the values of the parameter A with the etched particles dropped dramatically by as much as 94% (t = 0.19 cm) for the Epon 815C system (Figures 18(a) and 19(a), and Table 3), and 97% (t = 0.19 cm) for the Epon 830 system (Figures 18(b) and 19(b), and Table 4). The values of the exponent n decreased by as much as 30% (t = 0.19 cm) with the Epon 815C system (Figures 18(a) and 19(a), and Table 3), and 7% (t = 0.14 cm) with the Epon 830 system (Figures 18(b) and 19(b), and Table 4), when etched particles were used. For the nickel filaments of 260 μm length, the values of the parameter A with the etched particles dropped dramatically by as much as 93% (t = 0.19 cm) for the Epon 815C system (Figures 20(a) and 21(a), and Table 3), and 97% (t = 0.19 cm) for the Epon 830 system (Figures 20(b) and 21(b), and Table 4). The values of the exponent n decreased by as much as 32% (t = 0.19 cm) with the Epon 815C system (Figures 20(a) and 21(a), and Table 3), and 13% (t = 0.14 cm) with the Epon 830 system (Figures 20(b) and 21(b), and Table 4), when etched particles were used.
Comparing Epon 830 resin with 815C, for the same thickness of adhesive film, the 260 μm nickel filaments approximately follow the same trend as nickel flakes, nickel powder, and silver powder. The parameter A has lower values with Epon 815C resin than Epon 830 resin. The average difference is as much as 17% with unetched filaments, and 4% with etched filaments. On the other hand, Epon 815C has higher values for exponent n in comparison to Epon 830. The average difference is as much as 16% with unetched filaments, and 6% with etched filaments. As for 160 μm nickel filaments, the results display a mixed trend. Going from Epon resin 815C to 830, the values of parameter A increase by as much as 22% (average), and exponent n increase by as much as 4% (average) with the unetched filaments. For the etched 160 μm Ni filaments, again going from Epon 815C to 830, the values of parameter A increase by as much as 45% (t = 0.08 cm), and the values of exponent n decrease by 13% (t = 0.19 cm).
Tables 3 and 4 list the parameters for all the curves shown in Figures 13–21 for comparison purposes.
In all, we can conclude that the values of the parameters A and n are affected by the thickness of adhesive film, etch treatment, pre-polymer viscosity, particle type and particle shape.
3.3. Establishing the Volume Fraction-Film Thickness Relationship
Earlier, we discussed the thickness dependent conduction behavior (Section 3.1). To describe that behavior, Equation 14 was utilized to fit all the curves. In Section 3.2, the volume-fraction dependent conduction behavior was investigated, and a 2- parameter power Equation 15 was used to fit all resistivity versus volume fraction data. From Equations 14 and 15, we can get:
Since a, b, and c are functions of the volume fraction Φ, and A and n are functions of thickness t, Equation 16 can be changed to:
In order to model the volume fraction-film thickness behavior mathematically based on our experimental data, we assumed that each parameter can be represented by an equation of the type:
This particular mathematical form was chosen, because it is the simplest function which efficiently represents the data available. For example, with etched nickel flakes in Epon 815C system, we get 3 data points from Table 1 for each data pair (Φ-a, Φ-b, and Φ-c). We can then get the parameters e, f and g of Equation 18 for a(Φ), b(Φ), and c(Φ). Similarly, from Table 3, we get 3 data points for each of data pairs (t-A, and t-n), and thus, we can obtain the parameters e, f and g of Equation 18 for A(t) and n(t).
The calculation procedure can be illustrated by the following set of quadratic equations representing the volume fraction (Φ) dependent behavior of parameter a (Equation 16) for etched nickel flakes (Table 1)
Simultaneous solution of equation set (19) results in: e = 39, f = −38, g = 9.3. Therefore, we have, a(Φ) = 39*Φ2 − 38*Φ + 9.3. The functions, b(Φ), c(Φ), A(t) and n(t) can be obtained similarly.
Subsequent to these calculations, Equation 17 can be rewritten as follows for etched nickel flakes in Epon 815C system:
The parameters e, f and g of Equation 18 for a(Φ), b(Φ) and c(Φ) with various filled adhesive systems are listed in Tables 5 and 6. The parameters e, f and g of Equation 18 for A(t) and n(t) with various systems are listed in Tables 7 and 8.
4. Conclusions
The major objective of this work was to study the conduction behavior of epoxy conductive adhesives with different volume fraction of particle fillers of different size, shape, and type. Two different epoxy adhesives (Epon 815C and Epon 830) of viscosities with 30-fold difference were used as the matrix material. As for conductive fillers, the following conductive particles of various shapes were used: Ag powder (4–7 μm), Ni powder (3–7 μm), Ni flakes (1–5 μm), Cu powder (6–7 μm), Ni filaments (20 μm diameter with 160 μm or 260 μm length). The effects of etching the filler particles were also considered. The results of this work lead to the following conclusions:
For the film thickness dependent conduction behavior, the resistivity levels are reduced as the adhesive film thickness increases. Conversely, when the thickness is reduced significantly, the effective coordination number, Z is reduced, and therefore, the critical volume fraction requirement for network formation, Pc, increases. Therefore, a significant increase in resistivity is observed coupled with a significant increase in the slope of the resistivity-thickness curve. The shapes of the resistivity-thickness curves are similar and typical, presenting a negative exponential shape.
For the particle volume-fraction dependent conduction behavior, the resistivity levels were reduced with increasing volume fraction. The shapes of resistivity-volume fraction curves are typical and display a negative power function curve.
Due to the presence of non-conducting nickel oxide, the unetched nickel particles always have higher resistivity than the etched ones. Similarly, the presence of copper oxide results in high resistivity for copper particles.
For the three different types of metal powders investigated, the order of film conductivity, from high to low was: silver, copper and nickel.
As for the effect of particle shape on the adhesive film resistivity, we found that the order from high to low conductivity was: nickel filaments of 260 μm length, nickel filaments of 160 μm length, nickel flakes, and nickel powder. Thus, we can conclude that the particle aspect ratio is an important parameter in affecting the adhesive film resistivity; as the aspect ratio increases, the filled adhesive film resistivity decreases. Obviously, when the particle aspect ratio increases, the effective coordination number, Z also increases, and therefore, the critical volume fraction requirement for network formation, Pc, decreases.
The parameters a, b and c, which are the coefficients of the exponentially decaying fitting function for the thickness-dependent conduction behavior, were found to be dependent on the particle filler volume fraction, etch treatment, prepolymer viscosity, particle type, and particle shape. For the unique case for nickel flakes, the coefficient c remained almost constant.
The values of A and n, which are the parameters of the mathematical relation used for describing the volume fraction-dependent conduction behavior, were found to depend on the thickness of the adhesive film, etch treatment, prepolymer viscosity, particle type, and particle shape. The values of the parameter A were found to be more sensitive to these factors than the exponent n.
By utilizing the mathematical relations we proposed to model thickness-dependent and volume fraction-dependent conduction behaviors separately, we were able to describe the combined and coupled volume fraction-film thickness relationship mathematically based on our experimental data.


| Filler Type | Volume Fraction (%) | a (Ω-cm) | b (Ω-cm) | c (cm−1) | Goodness of Fit (%) |
|---|---|---|---|---|---|
| Unetched Ni flake | 35 | 537.2 | 21,456 | 44.2 | 87.8 |
| 42 | 460.7 | 19,830 | 47.7 | 91.5 | |
| 50 | 360.4 | 12,370 | 46.6 | 92.1 | |
| Etched Ni flake | 35 | 0.80 | 13.9 | 46.8 | 95.1 |
| 42 | 0.25 | 3.5 | 47.6 | 91.3 | |
| 50 | 0.09 | 1.2 | 43.2 | 92.6 | |
| Unetched Ni powder | 35 | 454.2 | 43,436.4 | 53.6 | 90.1 |
| 50 | 196.2 | 35,054.8 | 50.4 | 87.1 | |
| 60 | 7.61 | 18,490.3 | 44.5 | 84.4 | |
| Etched Ni powder | 35 | 60.7 | 8,483.9 | 45.9 | 96.5 |
| 50 | 43.3 | 3,038.9 | 42.7 | 90.4 | |
| 60 | 4.31 | 1,399.5 | 36.8 | 89.1 | |
| Ag powder | 35 | 2.9 | 250.9 | 85 | 94.2 |
| 50 | 0.8 | 10.1 | 49.3 | 84.5 | |
| 60 | 0.1 | 0.8 | 23.9 | 97.7 | |
| Etched Cu powder | 40 | 36.2 | 395 | 50.5 | 98.0 |
| 50 | 3.9 | 50.4 | 25.9 | 92.3 | |
| 60 | 0.1 | 12.6 | 23.1 | 91.8 | |
| Unetched Ni filament (160 μm) | 35 | 0.27 | 1.37 | 17.9 | 98.2 |
| 50 | 0.07 | 0.52 | 14.1 | 97.9 | |
| 60 | 0 | 0.11 | 5.6 | 63.4 | |
| Etched Ni filament (160 μm) | 35 | 0.0063 | 0.1 | 25.5 | 94.5 |
| 50 | 0.0045 | 0.08 | 19.4 | 91.6 | |
| 60 | 0.0003 | 0.02 | 17.4 | 96.1 | |
| Unetched Ni filament (260 μm) | 35 | 0 | 1.03 | 14.2 | 80.6 |
| 50 | 0 | 0.41 | 6.4 | 75.3 | |
| 60 | 0 | 0.26 | 6.5 | 75.3 | |
| Etched Ni filament (260 μm) | 35 | 0.0036 | 0.039 | 21.9 | 95.9 |
| 50 | 0.0026 | 0.016 | 17.7 | 94.7 | |
| 60 | 0.0001 | 0.011 | 14.6 | 94.8 |
| Filler Type | Volume Fraction (%) | a (Ω-cm) | b (Ω-cm) | c (cm−1) | Goodness of Fit (%) |
|---|---|---|---|---|---|
| Unetched Ni flake | 50 | 515.8 | 10,215 | 44.6 | 98.1 |
| Etched Ni flake | 25 | 0.57 | 15.4 | 47.2 | 93.5 |
| 35 | 0.19 | 1.24 | 41.7 | 92.4 | |
| 50 | 0.05 | 0.96 | 42 | 88.0 | |
| Unetched Ni powder | 35 | 270.9 | 15,064.8 | 54.2 | 93.6 |
| 50 | 230.2 | 13,980.7 | 54.4 | 96.6 | |
| 60 | 0 | 678.3 | 15.5 | 59.9 | |
| Etched Ni powder | 35 | 46.5 | 6,355.9 | 43 | 97.6 |
| 50 | 39.8 | 2,088.8 | 41 | 66.1 | |
| 60 | 0 | 41.9 | 10.3 | 59.5 | |
| Ag powder | 35 | 0 | 2.3 | 4.1 | 57.1 |
| 50 | 0 | 0.8 | 0.9 | 96.5 | |
| 60 | 0 | 0.1 | 0.5 | 61.7 | |
| Etched Cu powder | 40 | 19.1 | 3,217.6 | 83.4 | 92.9 |
| 50 | 0.01 | 37 | 23.7 | 88.0 | |
| 60 | 0 | 3.8 | 18.8 | 85.0 | |
| Unetched Ni filament (160 μm) | 35 | 0.22 | 0.79 | 19.1 | 96.0 |
| 50 | 0.05 | 0.29 | 9.52 | 99.1 | |
| 60 | 0.02 | 0.26 | 8.4 | 94.4 | |
| Etched Ni filament (160 μm) | 35 | 0.0042 | 0.049 | 21.2 | 93.8 |
| 50 | 0.0021 | 0.038 | 18.2 | 92.3 | |
| 60 | 0.0001 | 0.011 | 16.4 | 95.1 | |
| Unetched Ni filament (260 μm) | 35 | 0.16 | 0.52 | 10.5 | 97.9 |
| 50 | 0 | 0.23 | 5.4 | 85.2 | |
| 60 | 0 | 0.21 | 4.8 | 94.7 | |
| Etched Ni filament (260 μm) | 35 | 0.0027 | 0.035 | 14.8 | 93.2 |
| 50 | 0.0001 | 0.016 | 11.1 | 93.0 | |
| 60 | 0 | 0.004 | 9.4 | 77.3 |
| Filler Type | Film Thickness (cm) | A (Ω-;cm) | n | Goodness of Fit (%) |
|---|---|---|---|---|
| Etched Ni flake | 0.04 | 0.0015 | 7.24 | 93.4 |
| 0.06 | 0.0012 | 6.88 | 92.8 | |
| 0.14 | 0.0008 | 6.69 | 91.9 | |
| Unetched Ni powder | 0.04 | 19.9000 | 4.84 | 98.4 |
| 0.06 | 18.2000 | 4.57 | 81.8 | |
| 0.14 | 14.5000 | 3.55 | 79.6 | |
| Etched Ni powder | 0.04 | 12.9000 | 4.38 | 93.4 |
| 0.06 | 5.3000 | 4.50 | 88.5 | |
| 0.14 | 5.2000 | 2.55 | 64.2 | |
| Ag powder | 0.03 | 0.0650 | 5.47 | 79.1 |
| 0.05 | 0.0580 | 4.53 | 83.7 | |
| 0.13 | 0.0490 | 3.28 | 77.3 | |
| Cu powder | 0.04 | 1.1100 | 4.66 | 80.5 |
| 0.06 | 0.9600 | 4.50 | 73.5 | |
| 0.15 | 0.7000 | 4.41 | 76.6 | |
| Unetched Ni filament (160 μm) | 0.06 | 0.0500 | 2.51 | 98.6 |
| 0.08 | 0.0430 | 2.55 | 99.6 | |
| 0.19 | 0.0106 | 3.20 | 82.9 | |
| Etched Ni filament (160 μm) | 0.06 | 0.0038 | 1.85 | 83.2 |
| 0.08 | 0.0014 | 2.64 | 98.2 | |
| 0.19 | 0.0006 | 2.35 | 73.9 | |
| Unetched Ni filament (260 μm) | 0.06 | 0.0340 | 2.80 | 94.2 |
| 0.08 | 0.0270 | 2.97 | 93.9 | |
| 0.19 | 0.0071 | 3.60 | 84.9 | |
| Etched Ni filament (260 μm) | 0.06 | 0.0013 | 2.52 | 96.3 |
| 0.08 | 0.0011 | 2.57 | 94.5 | |
| 0.19 | 0.0005 | 2.46 | 76.3 |
| Filler Type | Film Thickness (cm) | A (Ω-cm) | n | Goodness of Fit (%) |
|---|---|---|---|---|
| Etched Ni flake | 0.04 | 0.0069 | 4.33 | 77.2% |
| 0.06 | 0.0067 | 3.90 | 80.5% | |
| 0.14 | 0.0046 | 3.55 | 92.6% | |
| Unetched Ni powder | 0.04 | 551.7000 | 1.57 | 92.4% |
| 0.06 | 362.3000 | 1.23 | 93.1% | |
| 0.14 | 97.6000 | 1.21 | 90.9% | |
| Etched Ni powder | 0.04 | 49.1000 | 3.02 | 92.6% |
| 0.06 | 25.8000 | 2.88 | 97.0% | |
| 0.14 | 7.8400 | 2.34 | 74.0% | |
| Ag powder | 0.03 | 0.1200 | 3.94 | 68.2% |
| 0.05 | 0.1100 | 3.91 | 38.5% | |
| 0.13 | 0.0100 | 1.54 | 62.5% | |
| Cu powder | 0.04 | 0.1200 | 6.58 | 75.0% |
| 0.06 | 0.1100 | 6.03 | 77.4% | |
| 0.15 | 0.0800 | 5.90 | 64.9% | |
| Unetched Ni filament (160 μm) | 0.06 | 0.0370 | 2.41 | 92.7% |
| 0.08 | 0.0290 | 2.51 | 87.0% | |
| 0.19 | 0.0099 | 3.03 | 81.6% | |
| Etched Ni filament (160 μm) | 0.06 | 0.0023 | 1.95 | 80.5% |
| 0.08 | 0.0016 | 2.11 | 81.2% | |
| 0.19 | 0.0003 | 2.96 | 77.7% | |
| Unetched Ni filament (260 μm) | 0.06 | 0.0420 | 2.21 | 90.5% |
| 0.08 | 0.0360 | 2.29 | 89.5% | |
| 0.19 | 0.0071 | 3.36 | 87.5% | |
| Etched Ni filament (260 μm) | 0.06 | 0.0014 | 2.29 | 90.5% |
| 0.08 | 0.0011 | 2.49 | 92.0% | |
| 0.19 | 0.0002 | 2.91 | 80.7% |
| Composition | Parameter | a (Φ)(Ω-cm) | b(Φ)(Ω-cm) | c(Φ)(cm) | |
|---|---|---|---|---|---|
| Material | |||||
| Epon 815C | Etched Ni flake | e | 39.00 | 799.0 | −443.0 |
| f | −38.00 | −764.0 | 352.0 | ||
| g | 9.30 | 183.0 | −22.3 | ||
| Epon 815C | Unetched Ni powder | e | 342.1 | 226,000 | 77.7 |
| f | −2,262.2 | −415,000 | −144.4 | ||
| g | 1,241.8 | 186,000 | 103.2 | ||
| Etched Ni powder | e | 560 | −41,000 | 77.7 | |
| f | −1,010 | 29,000 | −144.4 | ||
| g | 410 | −1,000 | 95.5 | ||
| Epon 815C | Ag powder | e | −14.4 | −3,100 | 33 |
| f | 8.9 | 3,300 | −290.3 | ||
| g | −0.03 | −880 | 186.2 | ||
| Epon 815C | Etched Cu powder | e | 1,430 | 15,300 | 1.09 |
| f | −1,610 | −17,300 | −1.23 | ||
| g | 450 | 4,800 | 0.37 | ||
| Epon 815C | Unetched Ni filament (160 μm) | e | −1.3 | −3.2 | 123 |
| f | 0.7 | −0.55 | −220.3 | ||
| g | 0.03 | 1.6 | 93.5 | ||
| Etched Ni filament (160 μm) | e | 0.06 | 27.1 | 1,680 | |
| f | −0.11 | −38 | −2,360 | ||
| g | 0.04 | 13.1 | 830 | ||
| Epon 815C | Unetched Ni filament (260 μm) | e | 0 | −3 | −77 |
| f | 0 | 2.7 | 124.7 | ||
| g | 0 | −0.4 | −40.6 | ||
| Etched Ni filament (260 μm) | e | 0.05 | −0.17 | −129.9 | |
| f | −0.08 | 0.14 | −173.9 | ||
| g | 0.03 | −0.01 | 72.2 | ||
| Composition | Parameter | a (Φ)(Ω-cm) | b(Φ)(Ω-cm) | c(Φ)(cm) | |
|---|---|---|---|---|---|
| Material | |||||
| Epon 830 | Etched Ni flake | e | 11.50 | 559.0 | 228.0 |
| f | −107.00 | −447.0 | −191.8 | ||
| g | 2.52 | 99.7 | 80.9 | ||
| Epon 830 | Unetched Ni powder | e | 4,190 | 259,000 | 800 |
| f | −6,910 | −418,000 | −1,300 | ||
| g | 2,640 | 158,000 | 490 | ||
| Etched Ni powder | e | 730 | −16,500 | 611.7 | |
| f | −1,200 | −2,400 | −982.9 | ||
| g | 460 | 7,400 | 379.5 | ||
| Epon 830 | Ag powder | e | 0 | −6.2 | −35.7 |
| f | 0 | −0.2 | 35.3 | ||
| g | 0 | 2.4 | −7.82 | ||
| Epon 830 | Etched Cu powder | e | 950 | 1.57 | 2,740 |
| f | −1,050 | −1.73 | −3,060 | ||
| g | 290 | 0.47 | 870 | ||
| Epon 830 | Unetched Ni filament (160 μm) | e | −1.72 | −10.4 | −521 |
| f | 1.59 | 13.1 | 761.9 | ||
| g | −0.32 | −3.67 | −241.2 | ||
| Etched Ni filament (160 μm) | e | 0.012 | 0.89 | 339.5 | |
| f | −0.034 | −1.39 | −491.5 | ||
| g | 0.016 | 0.52 | 189.1 | ||
| Epon 830 | Unetched Ni filament (260 μm) | e | −2.41 | −4.4 | −284.5 |
| f | 2.75 | 5.04 | 417 | ||
| g | 0.77 | −1.19 | −132 | ||
| Etched Ni filament (260 μm) | e | −0.03 | −0.014 | −15.8 | |
| f | 0.04 | −0.105 | 0.39 | ||
| g | −0.01 | 0.72 | 14.9 | ||
| Composition | Parameter | A(t)(Ω-cm) | n(t) | |
|---|---|---|---|---|
| Material | ||||
| Etched Ni flake | Epon 815 | e | 0.1000 | 156.3 |
| f | −0.0250 | −33.6 | ||
| g | 0.0020 | 8.3 | ||
| Unetched Ni powder | Epon 815 | e | 387.5000 | 7.5 |
| f | −123.8000 | −14.3 | ||
| g | 24.2000 | 5.4 | ||
| Etched Ni powder | Epon 815 | e | 3790.0000 | −303.80 |
| f | −760.0000 | 36.40 | ||
| g | 40.0000 | 3.41 | ||
| Ag powder | Epon 815 | e | 2.3800 | 313.80 |
| f | −0.5400 | −72.10 | ||
| g | 0.0800 | 7.40 | ||
| Etched Cu powder | Epon 815 | e | 41.9000 | 63.60 |
| f | −11.7000 | −14.40 | ||
| g | 1.5000 | 5.13 | ||
| Unetched Ni filament (160 μm) | Epon 815 | e | 0.4300 | 30.10 |
| f | −0.4100 | −2.21 | ||
| g | 0.0700 | 2.53 | ||
| Etched Ni filament (160 μm) | Epon 815 | e | 0.8700 | −324.10 |
| f | −0.2400 | 84.90 | ||
| g | 0.0200 | −2.08 | ||
| Unetched Ni filament (260 μm) | Epon 815 | e | 1.3000 | −21.30 |
| f | −0.5300 | 11.50 | ||
| g | 0.0600 | 2.19 | ||
| Etched Ni filament (260 μm) | Epon 815 | e | 0.0350 | −26.90 |
| f | −0.0150 | 6.30 | ||
| g | 0.0020 | 2.24 | ||
| Composition | Parameter | A(t) (Ω-cm) | n(t) | |
|---|---|---|---|---|
| Material | ||||
| Etched Ni flake | Epon 830 | e | −0.0630 | 171.3 |
| f | 0.0060 | −38.6 | ||
| g | 0.0070 | 5.6 | ||
| Unetched Ni powder | Epon 830 | e | 61,600.0000 | 167.5 |
| f | −15,600.0000 | −33.8 | ||
| g | 1,100.0000 | 2.65 | ||
| Etched Ni powder | Epon 830 | e | 9,410.0000 | 2.50 |
| f | −2,110.0000 | −7.30 | ||
| g | 120.0000 | 3.30 | ||
| Ag powder | Epon 830 | e | −7.5000 | −281.30 |
| f | 0.1000 | 21.00 | ||
| g | 0.1200 | 3.56 | ||
| Etched Cu powder | Epon 830 | e | 1.5100 | 236.90 |
| f | −0.6500 | −51.20 | ||
| g | 0.1400 | 8.24 | ||
| Unetched Ni filament (160 μm) | Epon 830 | e | 1.7400 | −2.10 |
| f | −0.6400 | 5.30 | ||
| g | 0.0700 | 2.10 | ||
| Etched Ni filament (160 μm) | Epon 830 | e | 0.1800 | −2.20 |
| f | −0.0600 | 8.30 | ||
| g | 0.0050 | 1.50 | ||
| Unetched Ni filament (260 μm) | Epon 830 | e | 0.2900 | 44.10 |
| f | −0.3400 | −2.20 | ||
| g | 0.0600 | 2.20 | ||
| Etched Ni filament (260 μm) | Epon 830 | e | 0.0520 | −47.60 |
| f | −0.0220 | 16.70 | ||
| g | 0.0030 | 1.46 | ||
References
- Lau, J.H. Flip Chip Technologies; McGraw Hill: New York, NY, USA, 1996; pp. 223–267. [Google Scholar]
- Manzione, L.T. Plastic Packaging of Microelectronic Devices; Van Nostrand Reinhold: New York, NY, USA, 1990; pp. 81–89. [Google Scholar]
- Liu, J. When Can We Use Conductive Adhesives in Volume Production—An Overview of Advances of Conductive Adhesive Joining Technology in Electronics Applications. Proceedings of the International Seminar on Conductive Adhesive in Electronics Packaging, Eindhoven The Netherlands, 5 September 1995; pp. 225–234.
- Ogunjimi, A.O.; Boyle, O.; Whalley, D.C.; Williams, D.J. A Review of the Impact of Conductive Adhesives Technology on Interconnection. J. Electron. Manuf. 1992, 2, 109–118. [Google Scholar]
- Sancaktar, E.; Wei, Y.; Gaynes, M.A. Conduction Efficiency and Strength of Electronically Conductive Adhesive Joints. J. Adhes. 1996, 56, 229–246. [Google Scholar]
- Sancaktar, E.; Wei, Y. Electronically Conductive Adhesives: Conduction Mechanisms, Mechanical Behavior and Durability. In Mittal Festschrift on Adhesion Science and Technology; van Ooij, W.J., Anderson, H., Eds.; VSP: Utrecht, The Netherlands, 1998; pp. 509–529. [Google Scholar]
- Alpert, B.T.; Schoenberg, A.J. Conductive Adhesives as a Soldering Alternative. Electron. Packag. Prod. 1991, 31, 130–132. [Google Scholar]
- Bolger, J.C.; Sylva, J.M.; McGovern, J.F. Conductive Epoxy Adhesives to Replace Solder. Surf. Mount Technol. 1992, 6, 66–70. [Google Scholar]
- Nguyen, G.; Williams, J.; Gibson, F. Conductive Adhesives: Reliable and Economical Alternatives to Solder Paste for Electrical Applications. Proceeding of ISHM, San Francisco, CA, USA, October 1992; pp. 510–517.
- Liu, J. On the Failure Mechanism of Anisotropically Conductive Adhesive Joints on Copper Metallization. Int. J. Adhes. Adhes. 1996, 16, 285–287. [Google Scholar]
- Liu, J. Reliability of Surface-Mounted Anisotropically Conductive Adhesive Joints. Circ. World 1993, 19. [Google Scholar]
- Nguyen, G.P.; Williams, J.R.; Gibson, F.W.; Winster, T. Electrical Reliability of Conductive Adhesives for Surface-Mount Applications. Proceedings of ISHM, Dallas, TX, USA, 9–11 November 1993; pp. 50–55.
- Gomatam, R.; Sancaktar, E. A Comprehensive Fatigue Life Predictive Model for Electronically Conductive Adhesive Joints under Constant-Cycle Loading. J. Adhes. Sci. Technol. 2006, 20, 87–104. [Google Scholar]
- Gomatam, R. Sancaktar, E. A Novel Cumulative Fatigue Damage Model for Electronically Conductive Adhesive Joints under Variable Loading. J. Adhes. Sci. Technol. 2006, 20, 69–86. [Google Scholar]
- Gomatam, R.; Sancaktar, E. The Effects of Stress State, Loading Frequency, and Cyclic Waveforms on the Fatigue Behavior of Silver-Filled Electronically Conductive Adhesive Joints. J. Adhes. Sci. Technol. 2006, 20, 53–68. [Google Scholar]
- Sancaktar, E.; Rajput, P.; Khanolkar, A. Correlation of Silver Migration to the Pull out Strength of Silver Wire Embedded in an Adhesive Matrix. IEEE Trans. Compon. Packag. Technol. 2005, 28, 771–780. [Google Scholar]
- Gomatam, R.; Sancaktar, E. Effects of Various Adherend Surface Treatments on Fatigue Behavior of Joints Bonded with a Silver-Filled Electronically Conductive Adhesive. J. Adhes. Sci. Technol. 2005, 19, 659–678. [Google Scholar]
- Gomatam, R.; Sancaktar, E. Fatigue and Failure Behaviors of Silver-Filled Electronically Conductive Adhesive Joints Subjected to Elevated Humidity. J. Adhes. Sci. Technol. 2004, 18, 1833–1848. [Google Scholar]
- Gomatam, R.; Sancaktar, E. The Interrelationships Between Electronically Conductive Adhesive Formulations, Substrate and Filler Surface Properties, Bonding, and Joint Performance. Part II: The Effects of Bonding Pressure. J. Adhes. Sci. Technol. 2004, 18, 1245–1262. [Google Scholar]
- Gomatam, R.; Sancaktar, E. The Interrelationships Between Electronically Conductive Adhesive Formulations, Substrate and Filler Surface Properties, and Joint Performance. Part I: The Effects of Adhesive Thickness. J. Adhes. Sci. Technol. 2004, 18, 1225–1244. [Google Scholar]
- Gomatam, R.; Sancaktar, E. Fatigue and Failure Behavior of Silver-Filled Electronically Conductive Adhesive Joints Subjected to Elevated Temperatures. J. Adhes. Sci. Technol. 2004, 18, 849–881. [Google Scholar]
- Gomatam, R.; Sancaktar, E. Dynamic Fatigue and Failure Behavior of Silver-Filled Electronically Conductive Adhesive Joints at Ambient Environmental Conditions. J. Adhes. Sci. Technol. 2004, 18, 731–750. [Google Scholar]
- Sancaktar, E.; Khanolkar, A. Effect of Interfacial Weight Loss by Silver Migration on the Pullout Strength of Silver Wire Embedded in an Adhesive Matrix. J. Adhes. Sci. Technol. 2001, 15, 1221–1245. [Google Scholar]
- Landrock, A.H. Adhesives Technology Handbook; NOYES Publication: New Jersey, NJ, USA, 1985; pp. 396–399. [Google Scholar]
- Liu, J.; Rorgren, R.; Tjungkrona, L. High Volume Electronics Manufacturing Using Conductive Adhesives for Surface Mounting. J. Surf. Mount Technol. 1995, 18, 30–40. [Google Scholar]
- Boyle, O.; Whalley, D.; Williams, P.S. A Study of The Process Parameters Involved in the Manufacturing of Conductive Adhesive Joints. Proceedings of 30th ISHM-Nordic, Oslo, Norway, September 1992; pp. 138–149.
- Rosner, B.; Liu, J.; Lai, Z. Flip Chip Bonding Using Isotropically Conductive Adhesives. Proceedings of 1996 Electronic Components and Technology Conference, Orlando, FL, USA, 28–31 May 1996; pp. 578–585.
- Zhou, J.G.; Sancaktar, E. Geometric Effects on Multilayer Generic Circuits Fabricated Using Conductive Epoxy/Nickel Adhesives. J. Adhes. Sci. Technol. 2008, 22, 947–956. [Google Scholar]
- Zhou, J.G.; Sancaktar, E. Stable and Unstable Capillary Flows of Highly-Filled Epoxy/Nickel Suspensions. J. Adhes. Sci. Technol. 2008, 22, 983–1002. [Google Scholar]
- Zhou, J.G.; Sancaktar, E. Chemorheology of Epoxy/Nickel Conductive Adhesives during Processing and Cure. J. Adhes. Sci. Technol. 2008, 22, 957–981. [Google Scholar]
- Dilsiz, N.; Partch, R.; Matijevic, E.; Sancaktar, E. Silver Coating of Spindle- and Filament- Type Magnetic Particles for Conductive Adhesive Applications. J. Adhes. Sci. Technol. 1997, 11, 1105–1118. [Google Scholar]
- Sancaktar, E.; Dilsiz, N. Anisotropic Alignment of Nickel Particles in Magnetic Field for Electronically Conductive adhesives. J. Adhes. Sci. Technol. 1997, 11, 155–166. [Google Scholar]
- Kirkpatrick, S. Percolation and Conduction. Rev. Mod. Phys. 1973, 45, 574–578. [Google Scholar]
- Aharoni, S.M. Electrical Resistivity of a Composite of Conducting Particles in an Insulating Matrix. J. App. Phys. 1972, 43, 2463–2465. [Google Scholar]
- McLachlan, D.S.; Blaszkiewics, M.; Newnham, R.E. Electrical-Resistivity of Composites. J. Am. Ceram. Soc. 1990, 73, 2187–2203. [Google Scholar]
- Searisbrick, R.M. Electrically Conducting Mixtures. J. Physics D Appl. Phys. 1973, 6, 2098–2110. [Google Scholar]
- Narkis, M.; Ram, A.; Flashner, F. Electrical Properties of Carbon Black Filled Polyethylene. Polym. Eng. Sci. 1978, 18, 649–653. [Google Scholar]
- Scher, H.; Zallen, R. Critical Density in Percolation Processes. J. Chem. Phys. 1970, 53, 3759–3762. [Google Scholar]
- Gurland, J. An Estimate of Contact and Continuity of Dispersions in Opaque Samples. Trans. Metall. Soc. AIME 1966, 236, 642–646. [Google Scholar]
- Bueche, F. Electrical Resistivity of Conducting Particles in an Insulating Matrix. J. Appl. Phys. 1972, 43, 4837. [Google Scholar]
- Janzen, J. On the Critical Conductive Filler Loading in Antistatic Composites. J. Appl. Phys. 1975, 46, 966–969. [Google Scholar]
- Bigg, D.M. Properties and Processing Characteristics of Open-Celled Foams Produced by Loading NaCl from High Density Polyethylene. Polym. Eng. Sci. 1981, 21, 76–79. [Google Scholar]
- Wei, Y.; Sancaktar, E. Dependence of Electric Conduction on Film Thickness of Conductive Adhesives: Modeling, Computer Simulation, and Experiment. J. Adhes. Sci. Technol. 1996, 10, 1199–1219. [Google Scholar]
- Holm, R. Electric Contact; Springer Verlag: New York, NY, USA, 1967; pp. 232–265. [Google Scholar]
- Sancaktar, E.; Wei, Y. The Effect of Pressure on the Initial Establishment of Conductive Paths in Electronically Conductive Adhesives. J. Adhes. Sci. Technol. 1996, 10, 1121–1235. [Google Scholar]
- Turgut, A.; Sancaktar, E. Viscoelastic and Processing Effects on the Fiber-Matrix Interphase Strength Part II: The Effects of Cure Temperature-Time and Curing Agent Content. J. Adhes. 1992, 38, 111–129. [Google Scholar]
- Sancaktar, E.; Dilsiz, N. Pressure Dependent Conduction Behavior of Various Particles for Conductive Adhesive Applications. J. Adhes. Sci. Technol. 1999, 13, 679–693. [Google Scholar]
- Sancaktar, E.; Dilsiz, N. Thickness Dependent Conduction Behavior of Various Particles for Conductive Adhesive Applications. J. Adhes. Sci. Technol. 1999, 13, 763–771. [Google Scholar]
- Sancaktar, E.; Bai, L. Modeling Filler Volume Fraction and Film Thickness Effects on Conductive Adhesive Resistivity. Proceedings of Polytronic 2004: 4th International IEEE Conference on Polymers and Adhesives in Microelectronics and Photonics on CD-ROM, Binghamton, NY, USA, 12–15 September 2004; McCal, D., Ed.;
- Sancaktar, E.; Bai, L. The Effects of Filler Volume Fraction and Film Thickness on Resistivity of Conductive Adhesives. Proceedings of the 2003 ASME International Design Engineering Technical Conferences & Computers and Information in Engineering Conference on CD-ROM, Reliability, Stress Analysis and Failure Prevention, Chicago, IL, USA, 2–6 September 2003; Sancaktar, E., Ed.; paper DETC2003/RSAFP-48694.
© 2011 by the authors; licensee MDPI, Basel, Switzerland. This article is an open access article distributed under the terms and conditions of the Creative Commons Attribution license (http://creativecommons.org/licenses/by/3.0/).
Share and Cite
Sancaktar, E.; Bai, L. Electrically Conductive Epoxy Adhesives. Polymers 2011, 3, 427-466. https://doi.org/10.3390/polym3010427
Sancaktar E, Bai L. Electrically Conductive Epoxy Adhesives. Polymers. 2011; 3(1):427-466. https://doi.org/10.3390/polym3010427
Chicago/Turabian StyleSancaktar, Erol, and Lan Bai. 2011. "Electrically Conductive Epoxy Adhesives" Polymers 3, no. 1: 427-466. https://doi.org/10.3390/polym3010427