
Design and Analysis of Porous Elastomeric Polymer Based on Electro-Mechanical Coupling Characteristics for Flexible Pressure Sensor
 , and
, and
Abstract
:1. Introduction
2. Materials and Methods
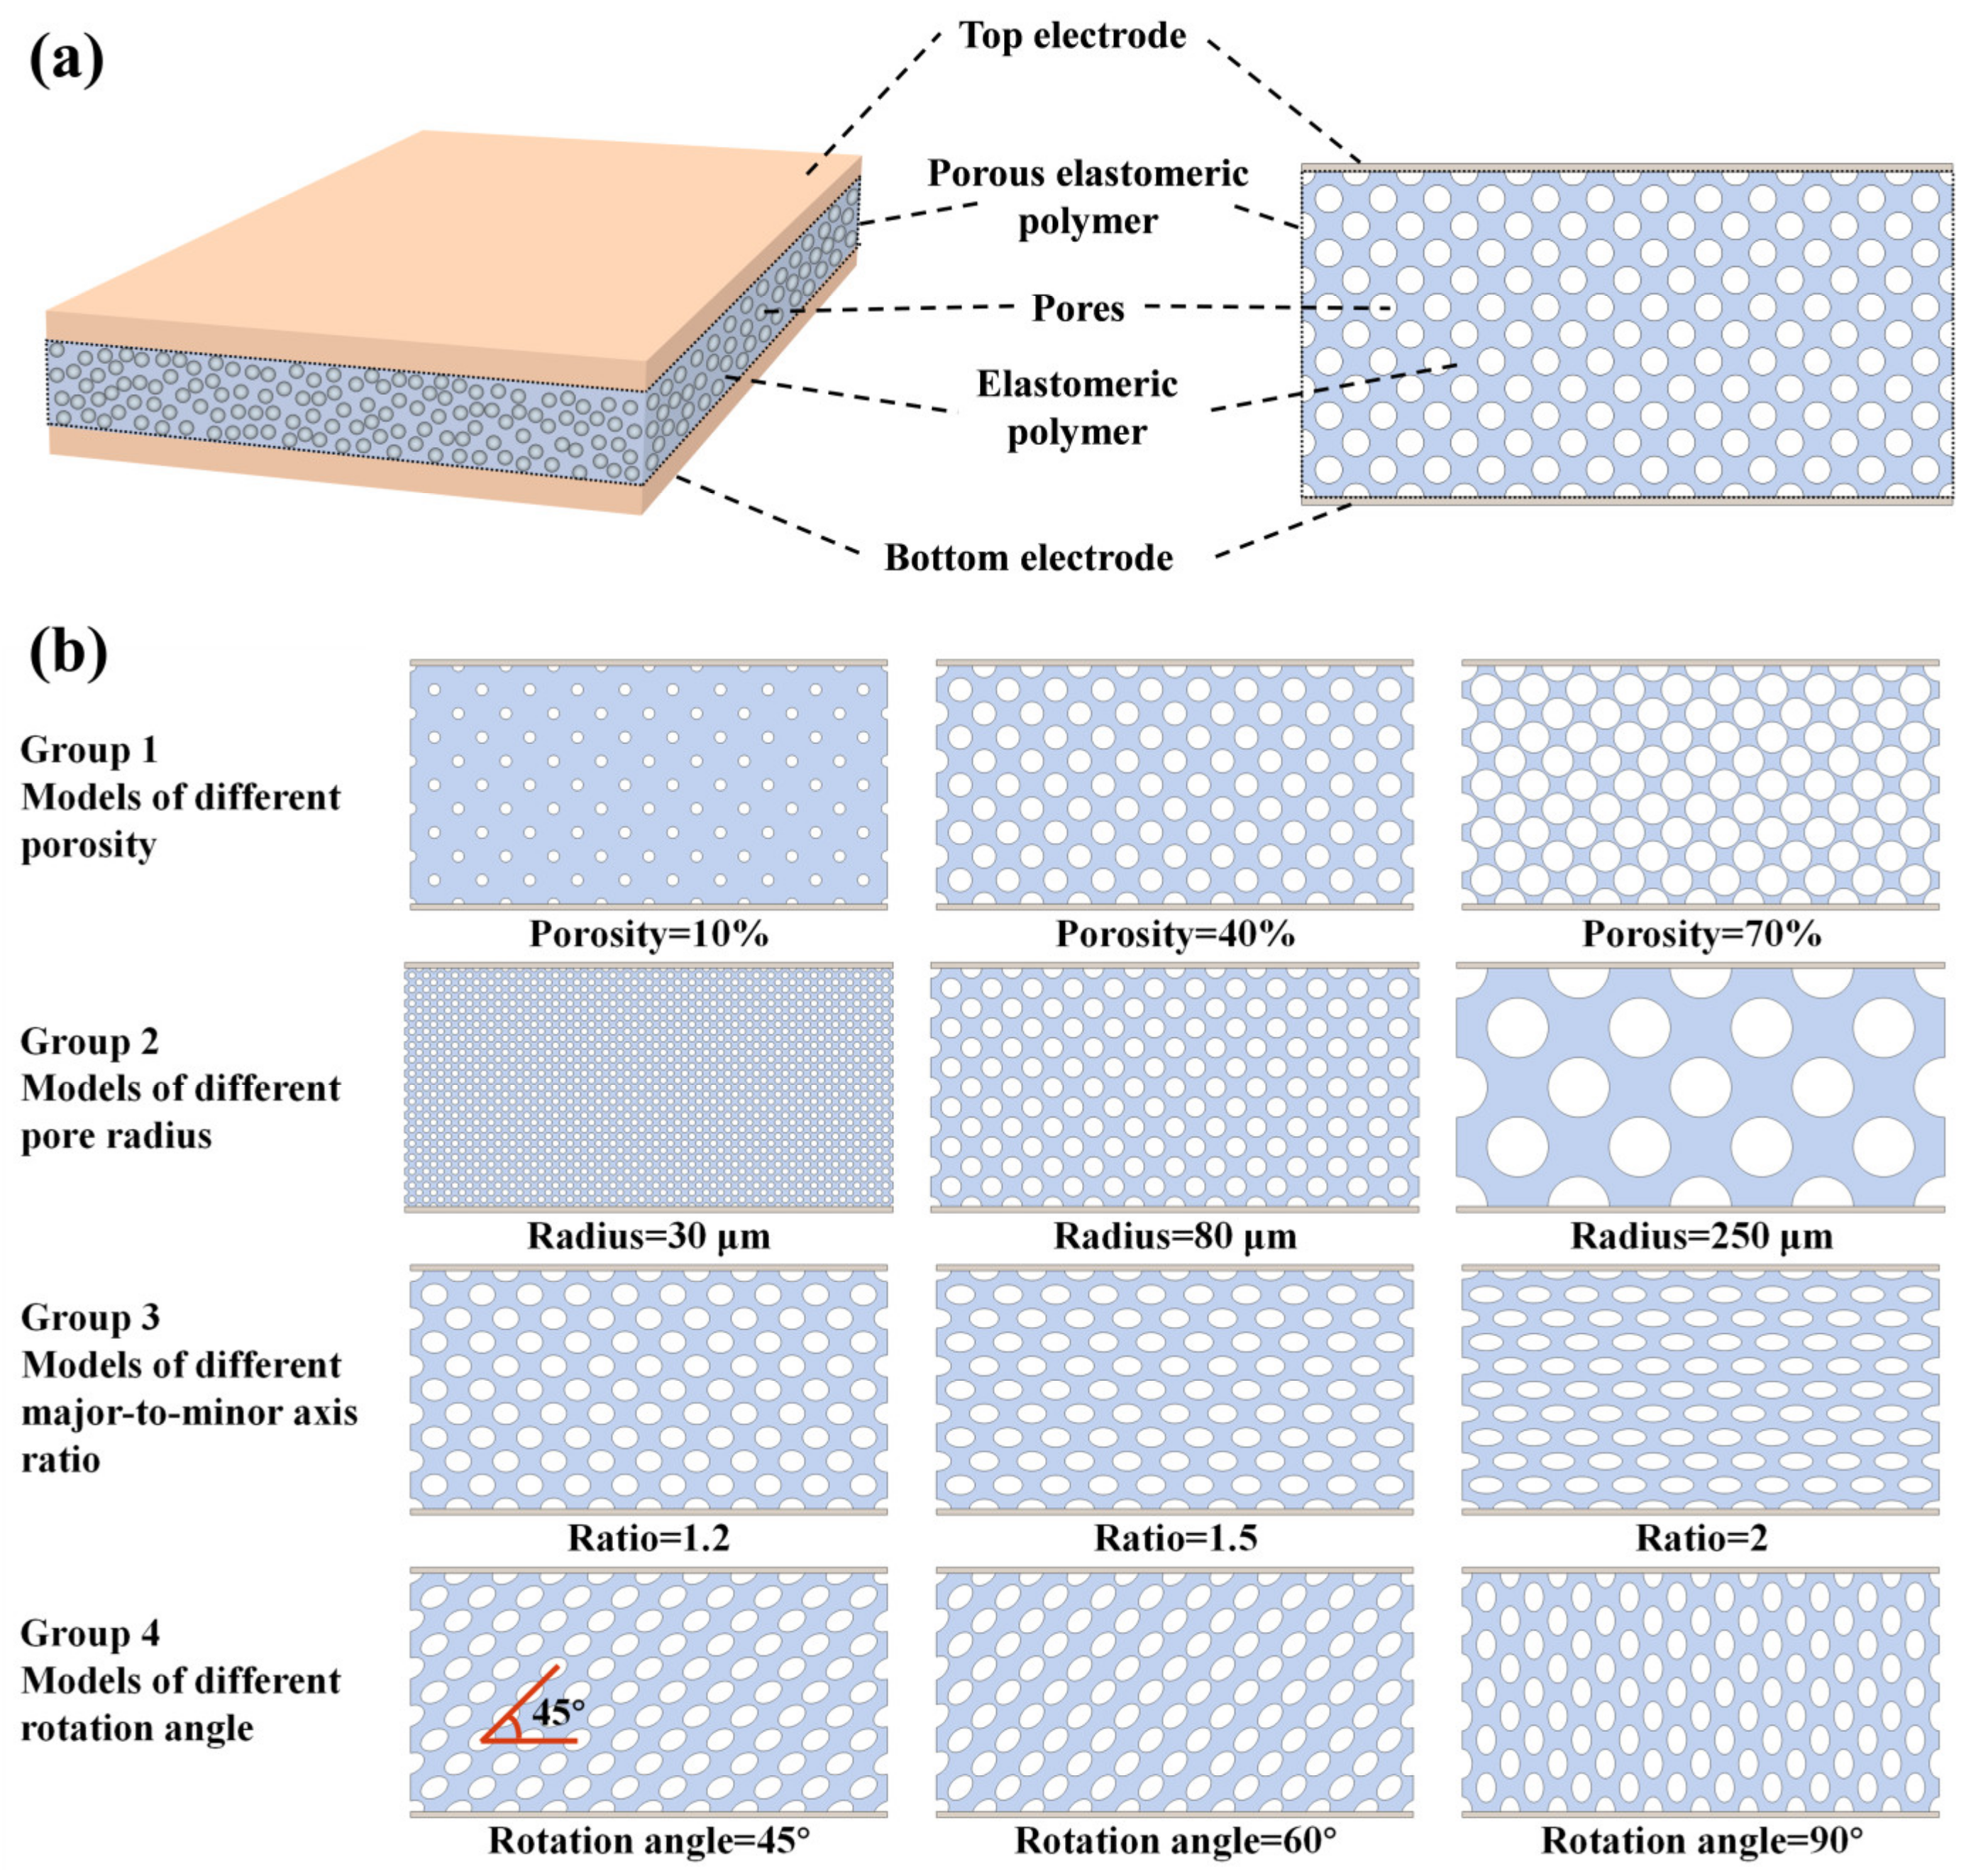
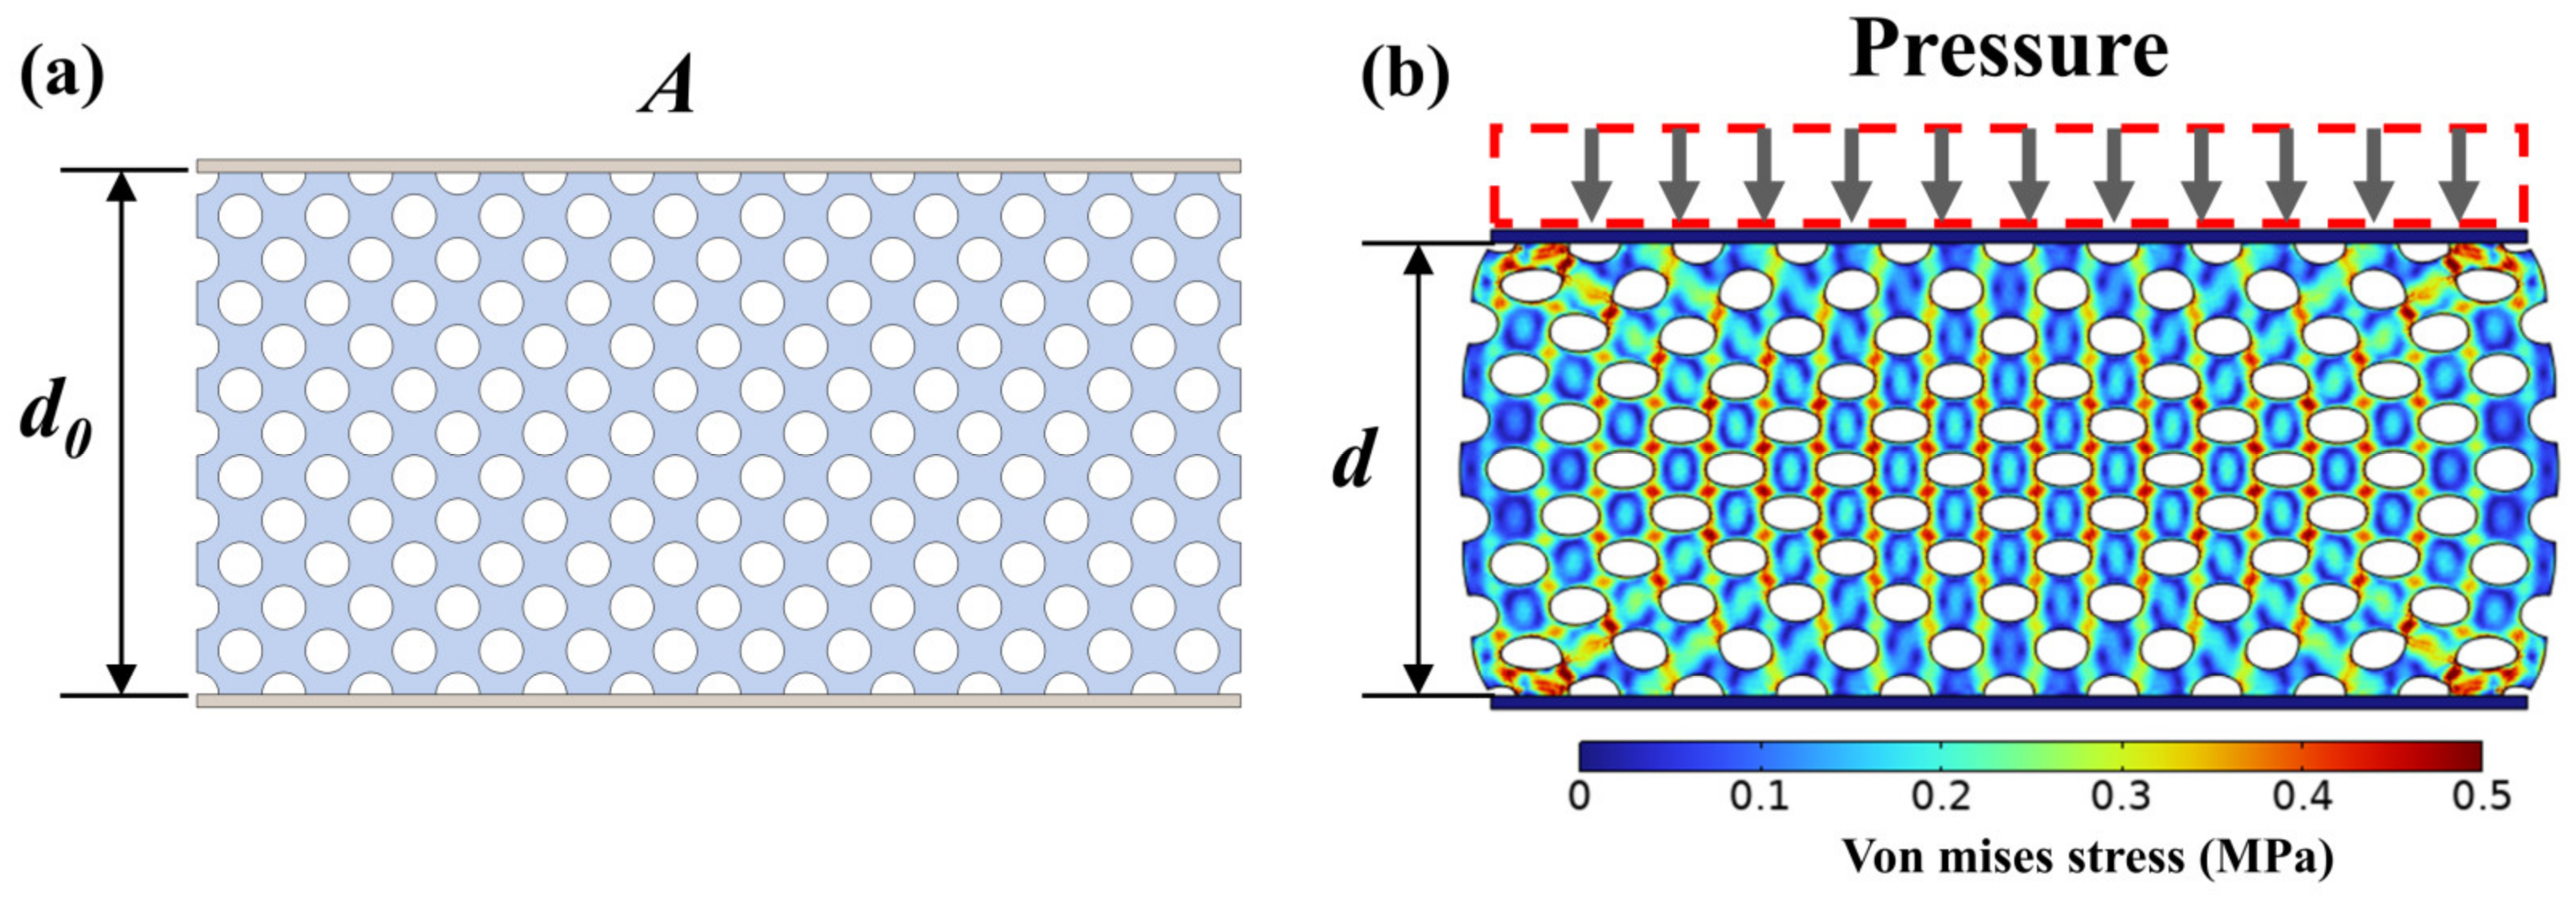
2.1. Finite Element Model
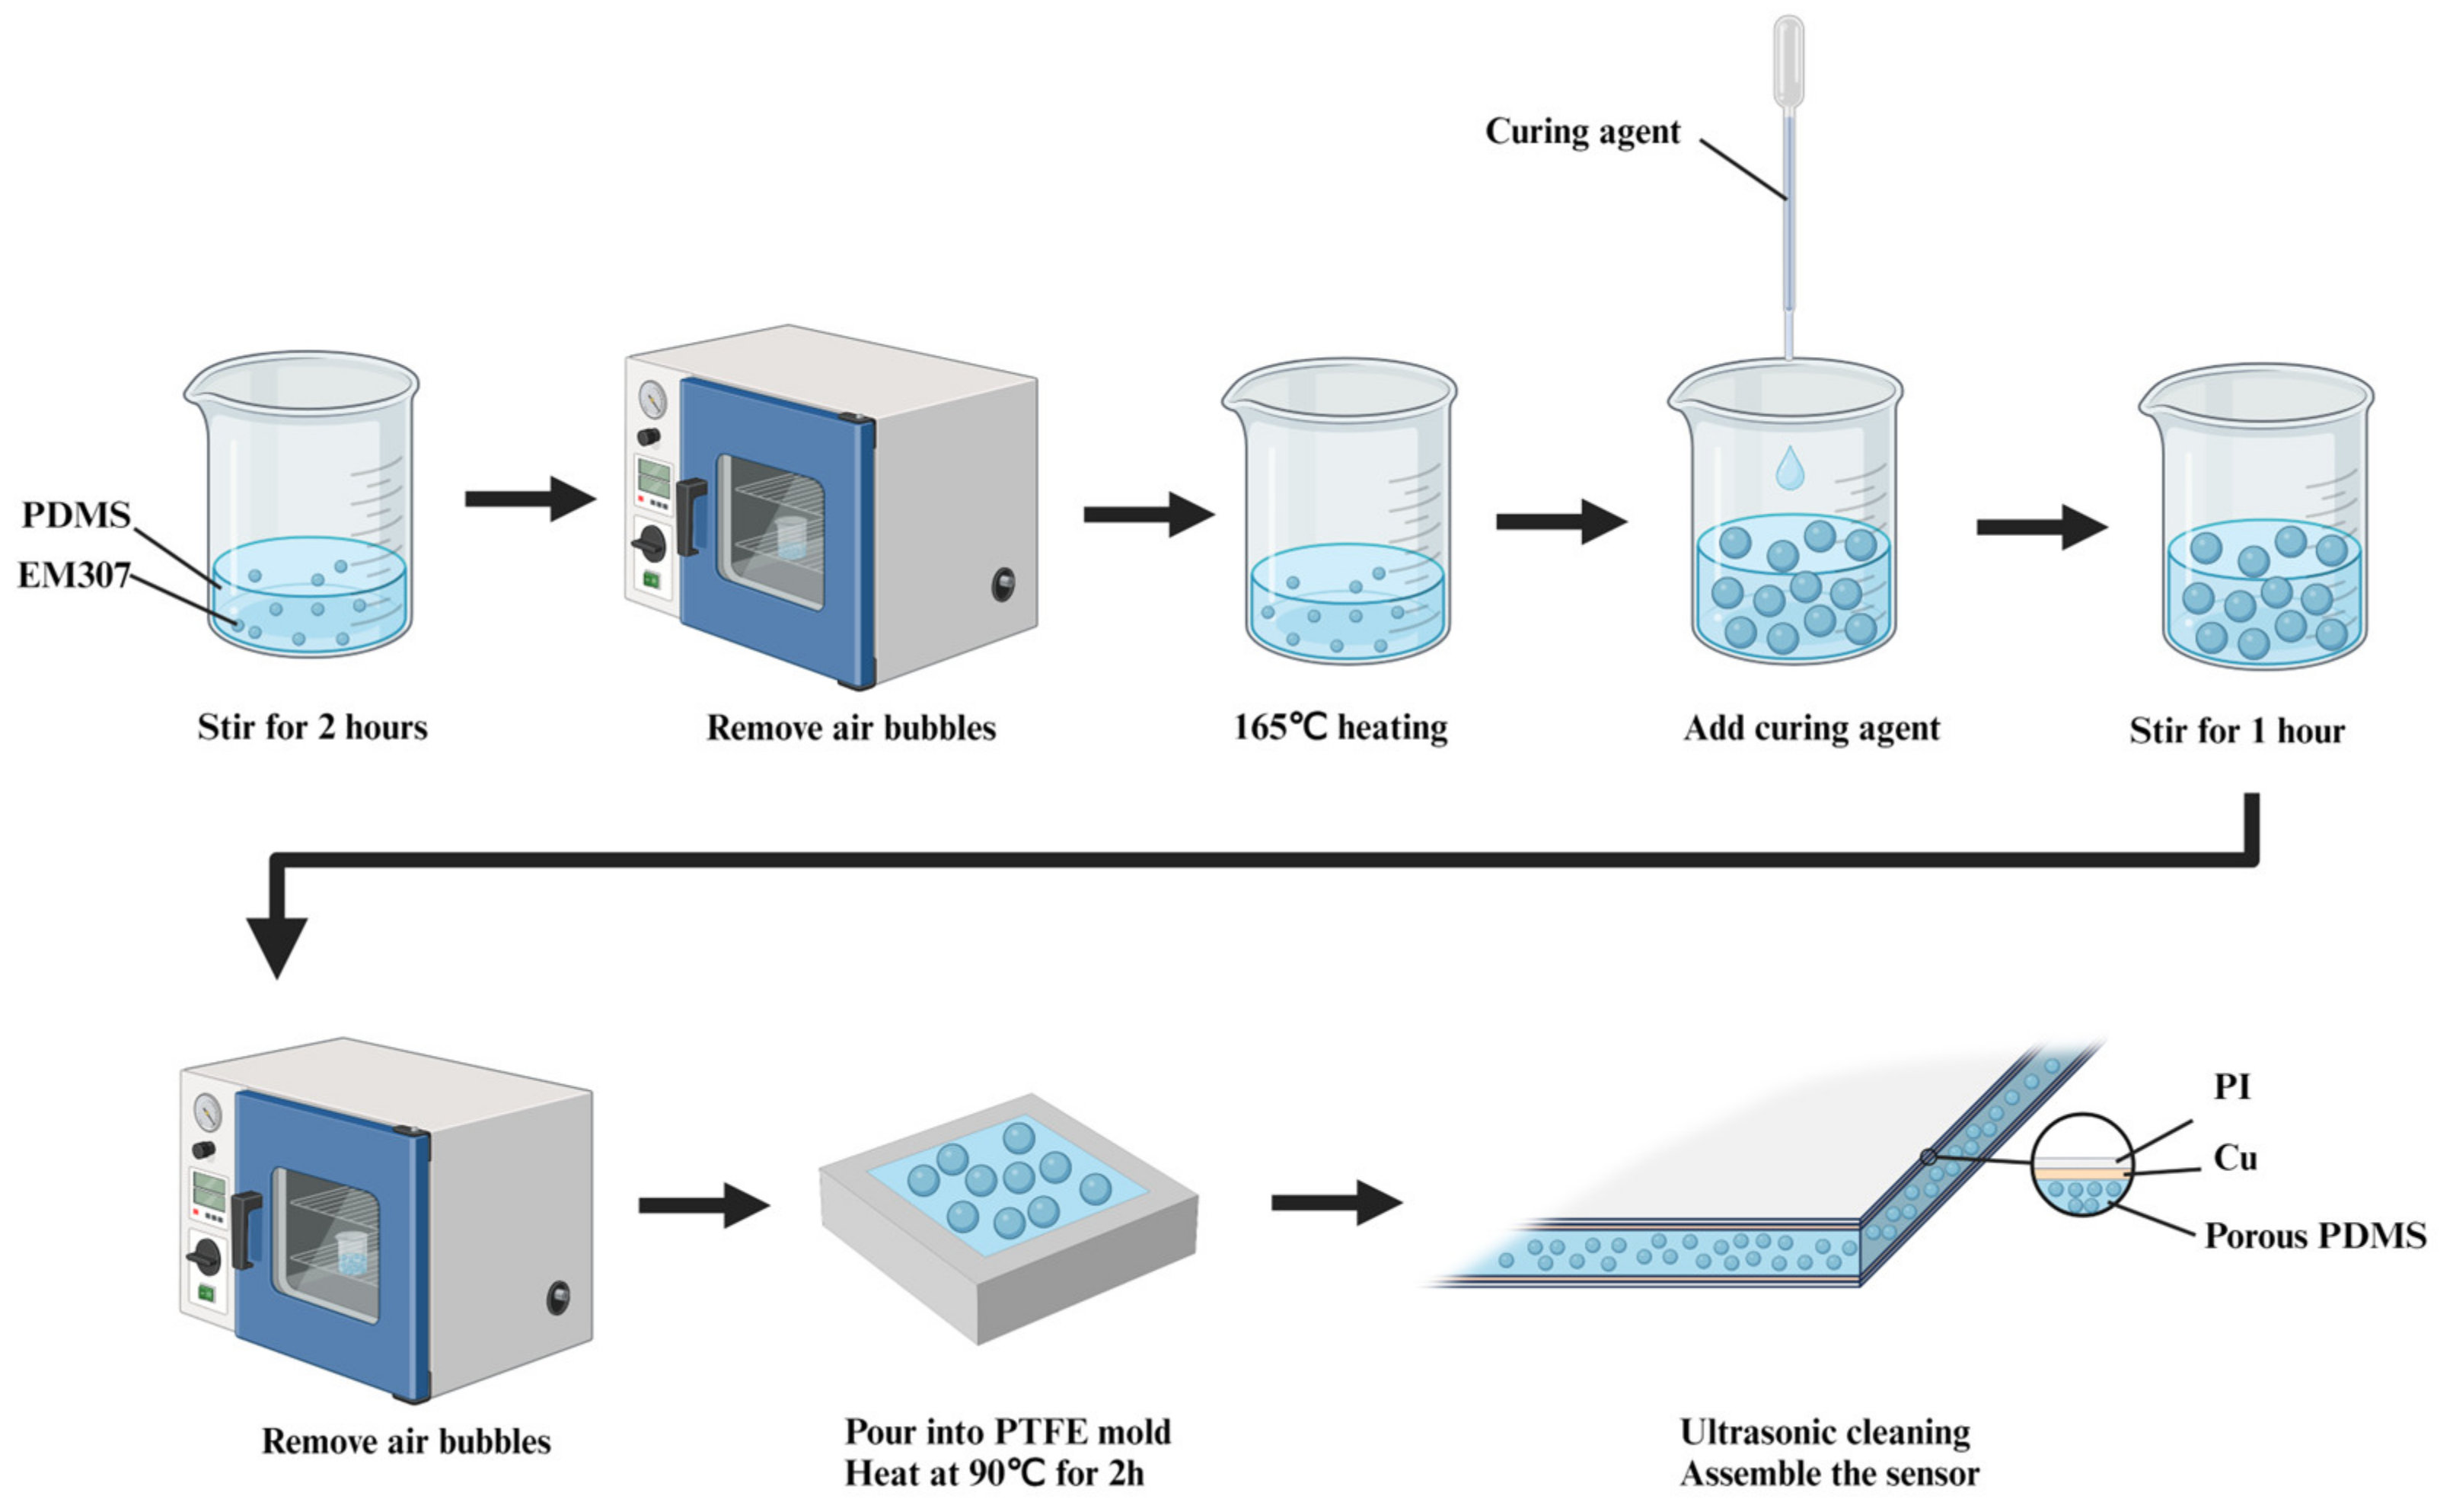
2.2. Preparation of Porous PDMS Dielectric Layer
3. Results and Discussion
3.1. The Impact of Porous Elastomeric Polymer Structure on Sensor’s Sensitivity
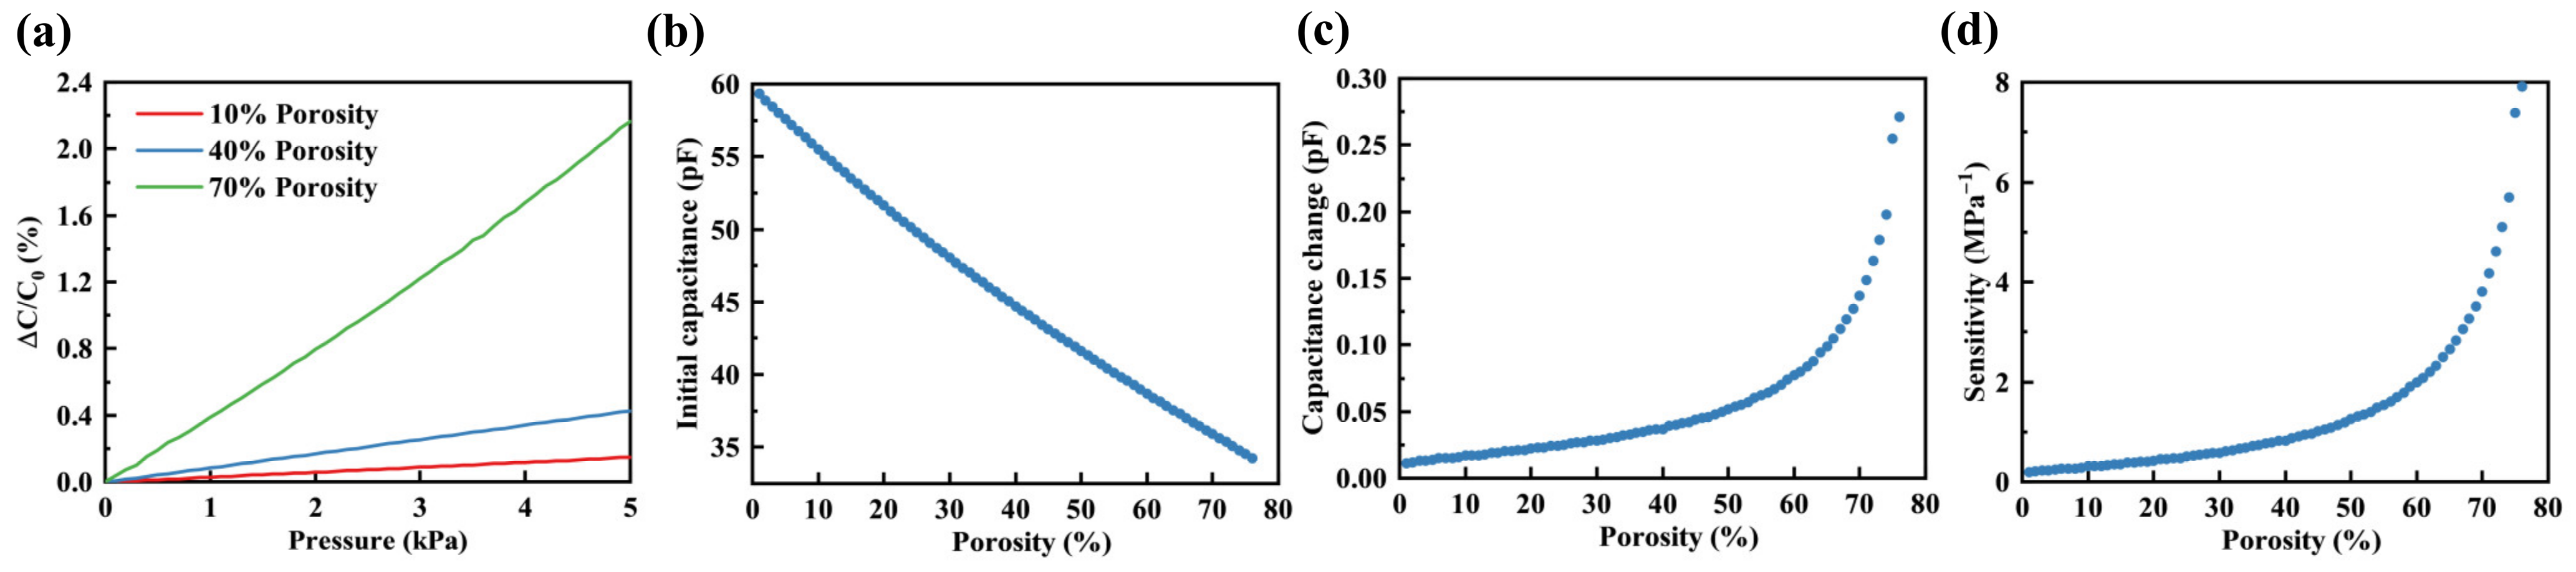
3.1.1. Porosity
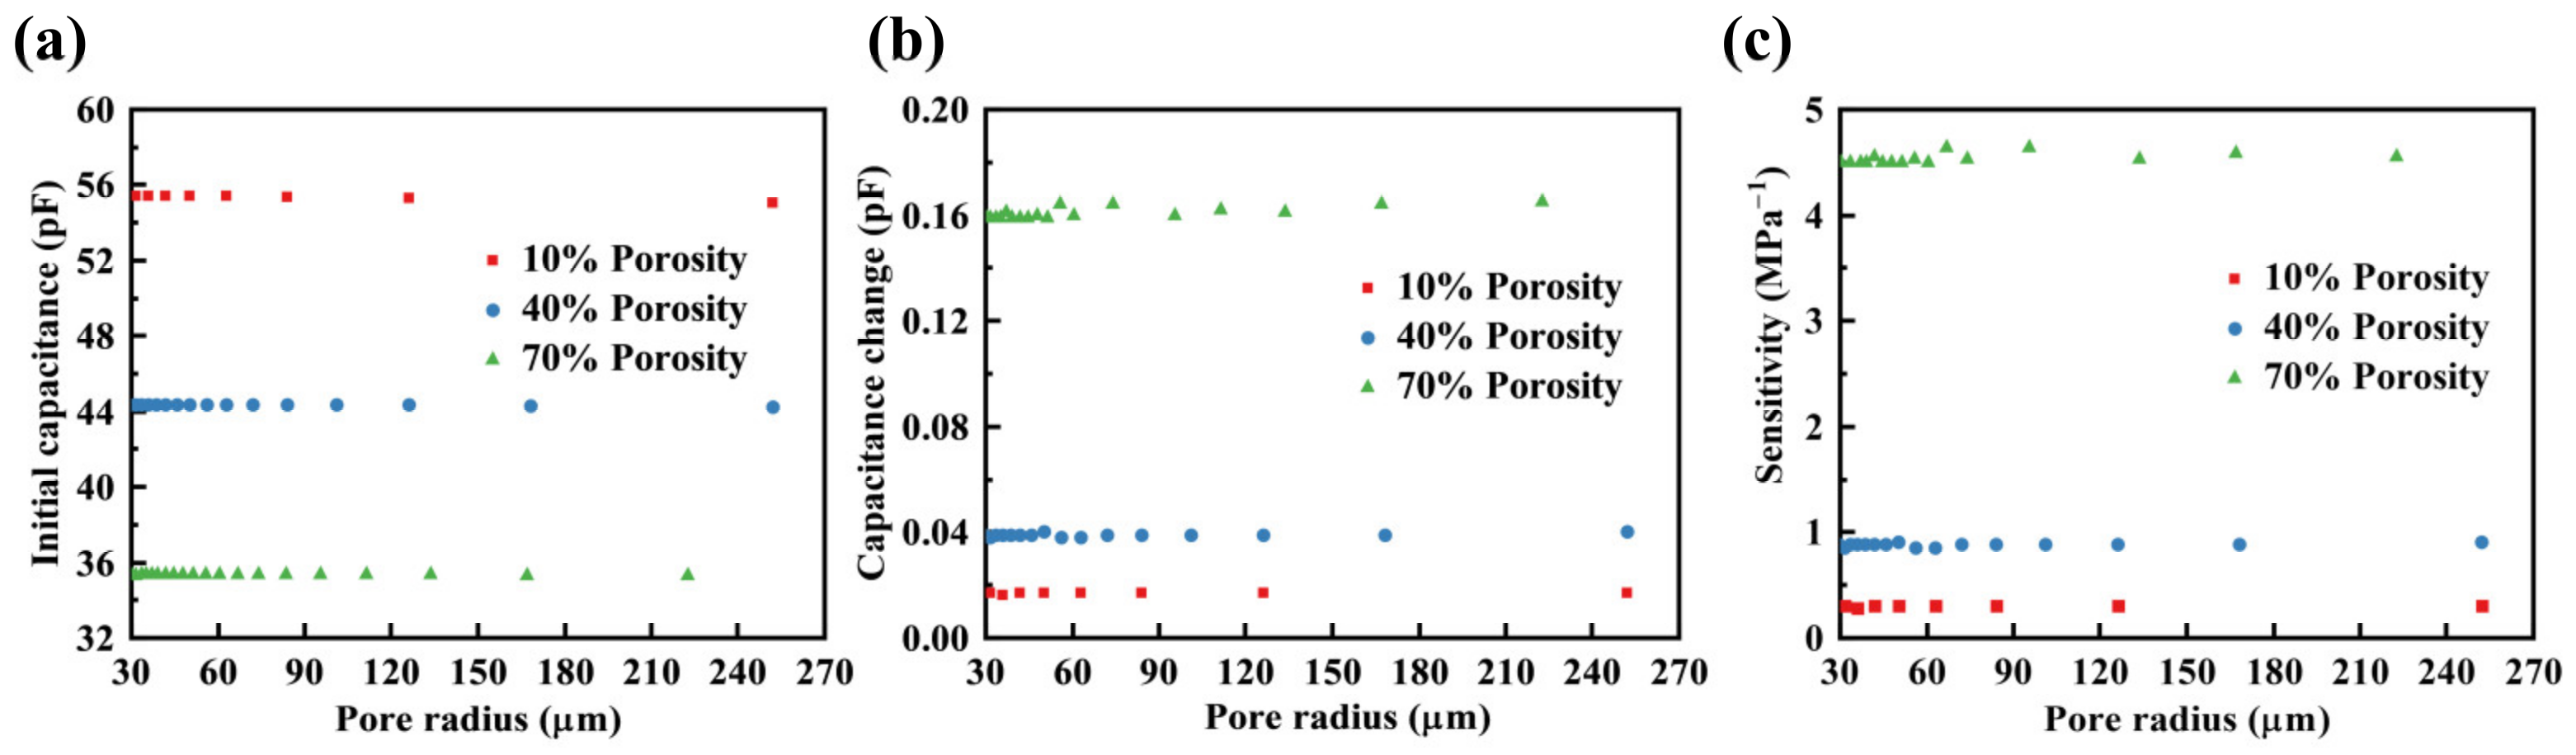
3.1.2. Pore Radius
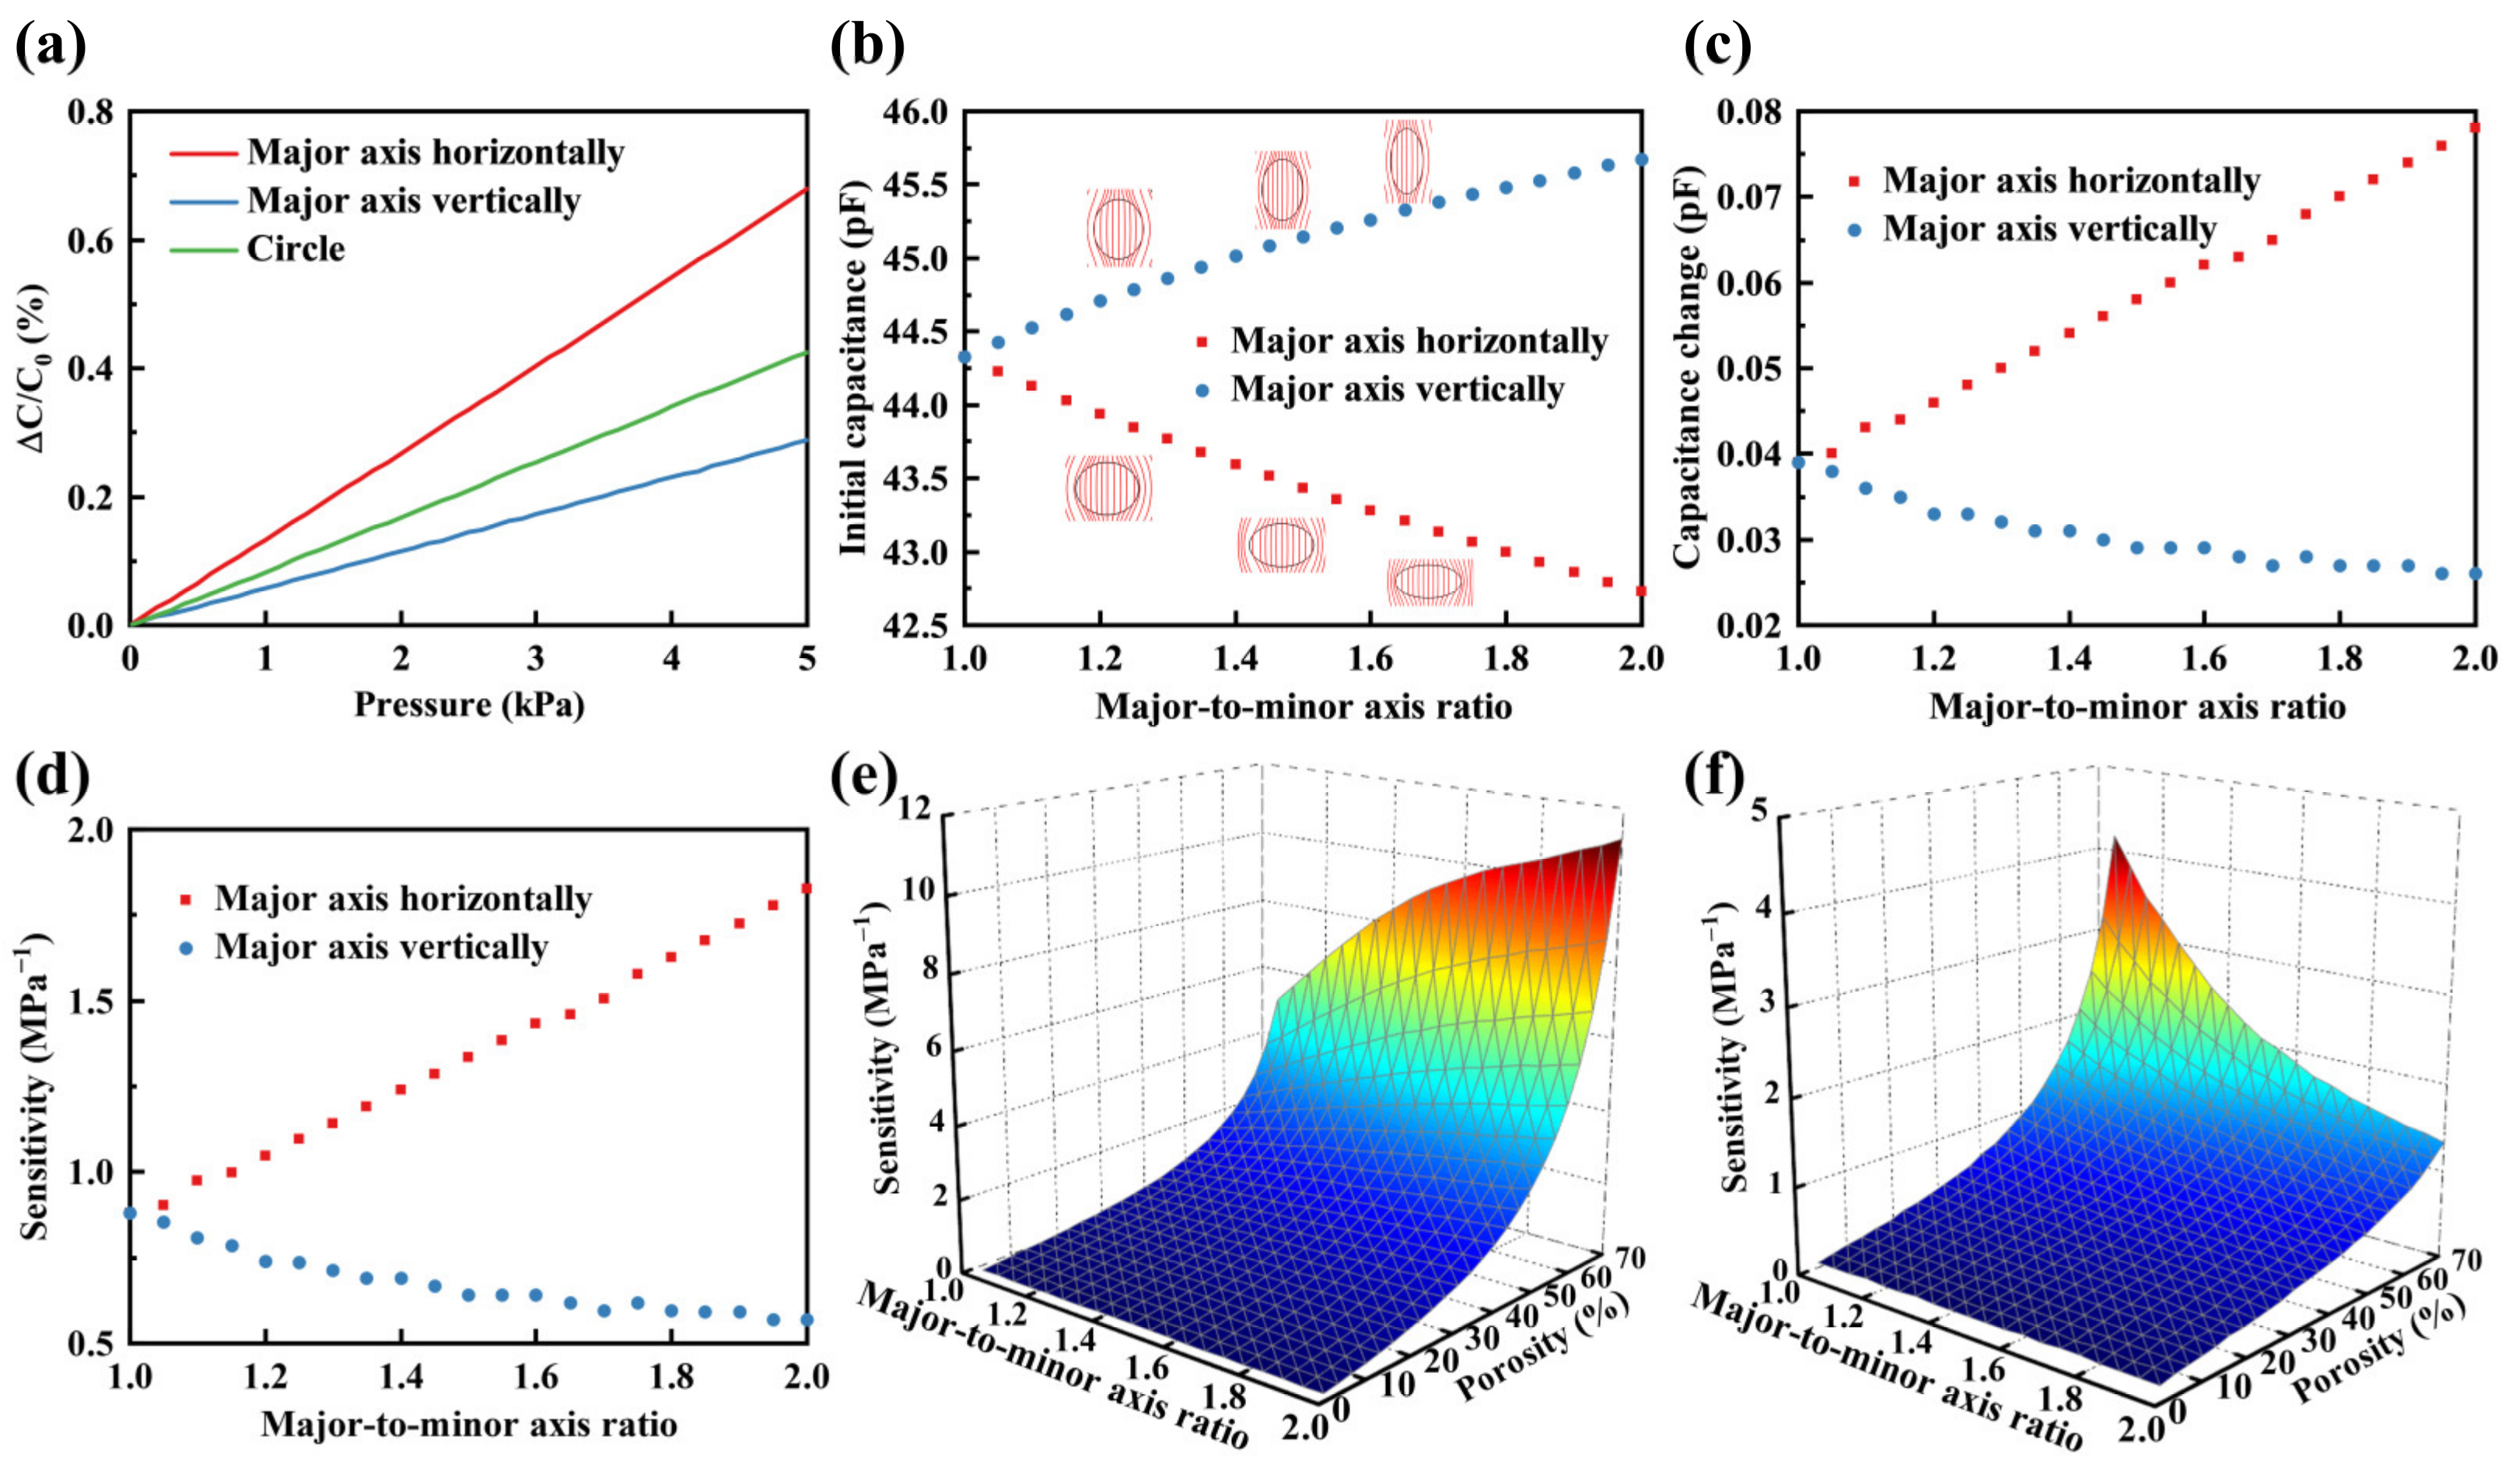
3.1.3. Major-to-Minor Axis Ratio
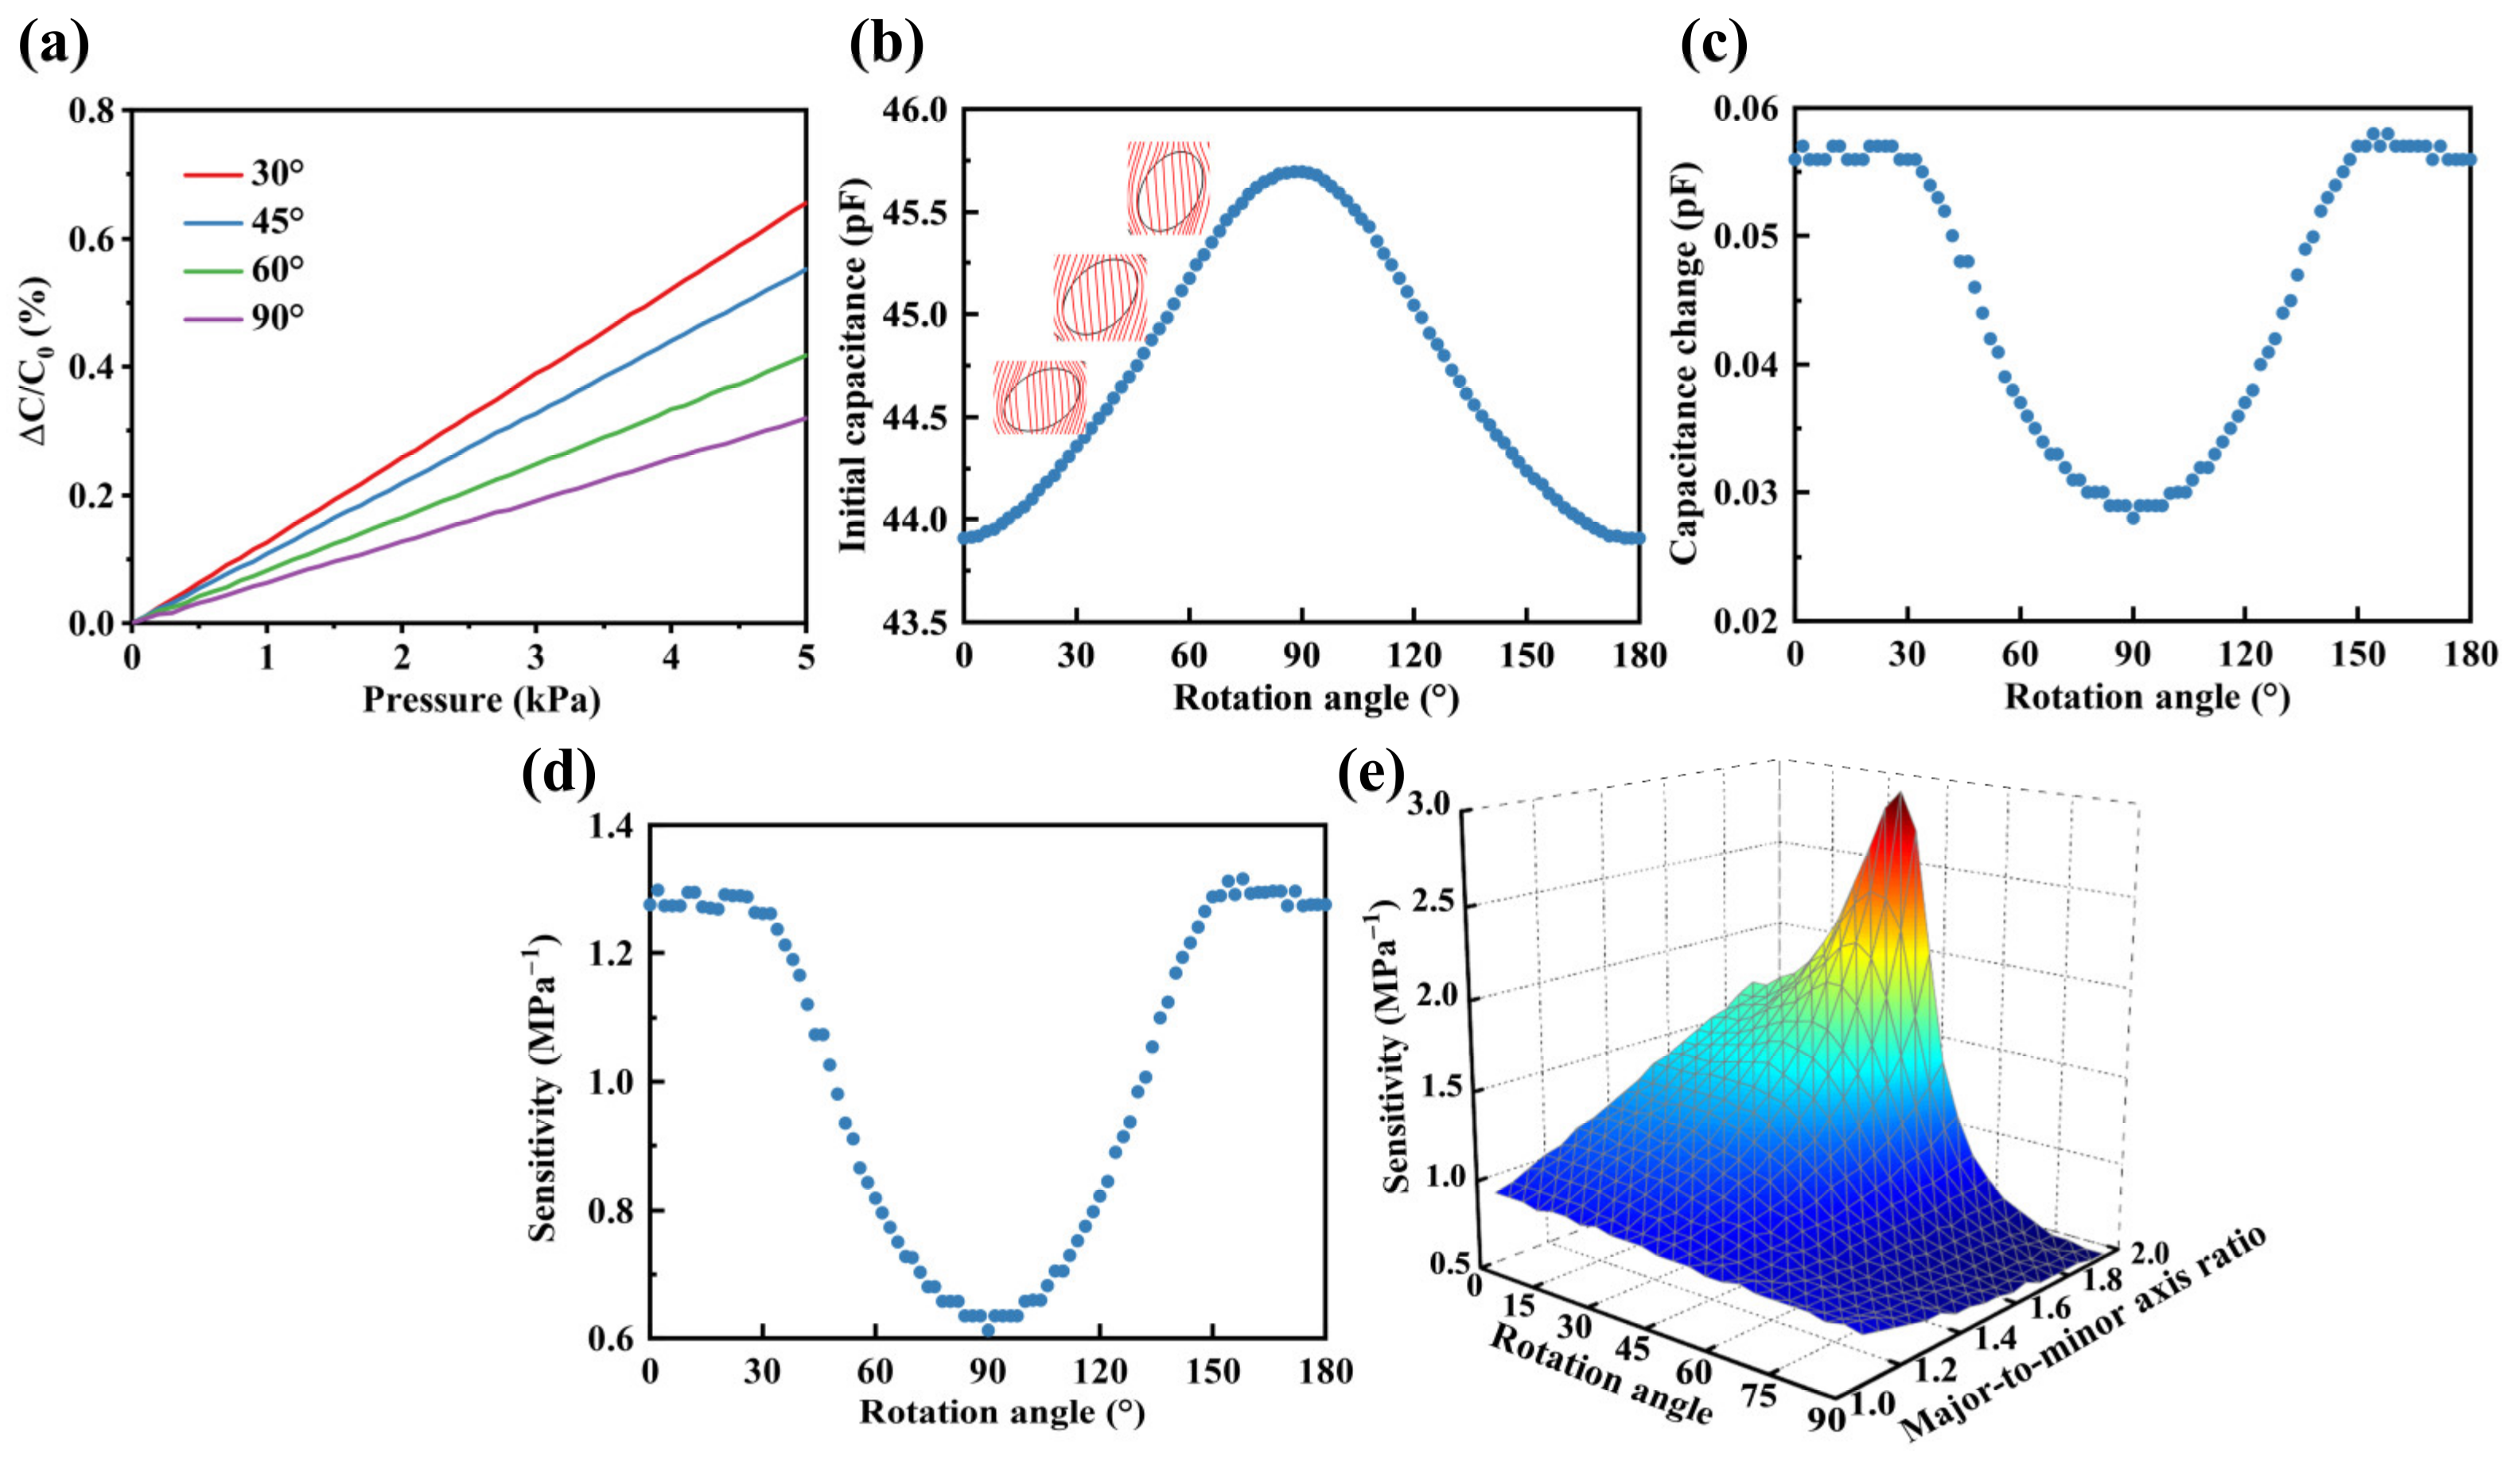
3.1.4. Rotation Angle of the Major Axis
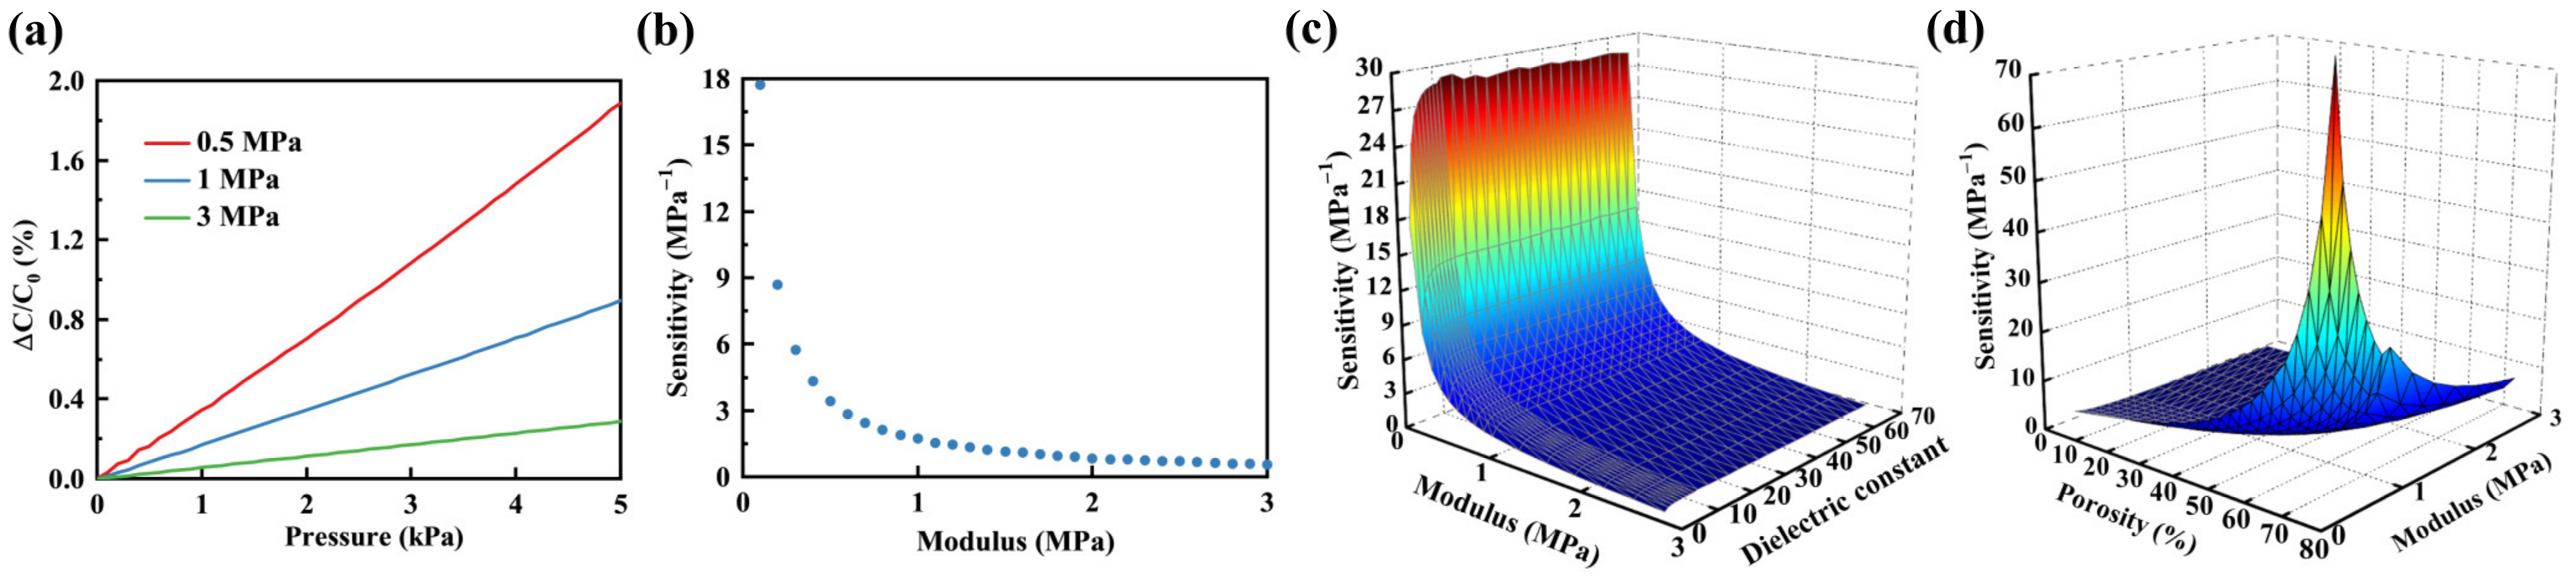
3.2. The Influence of Material Property of Elastomeric Polymer on the Sensor’s Sensitivity
3.2.1. Relative Dielectric Constant of Elastomeric Polymer
3.2.2. Modulus of Elastomeric Polymer
3.3. Experimental Results Analysis of Sensors with PDMS as the Dielectric Layer
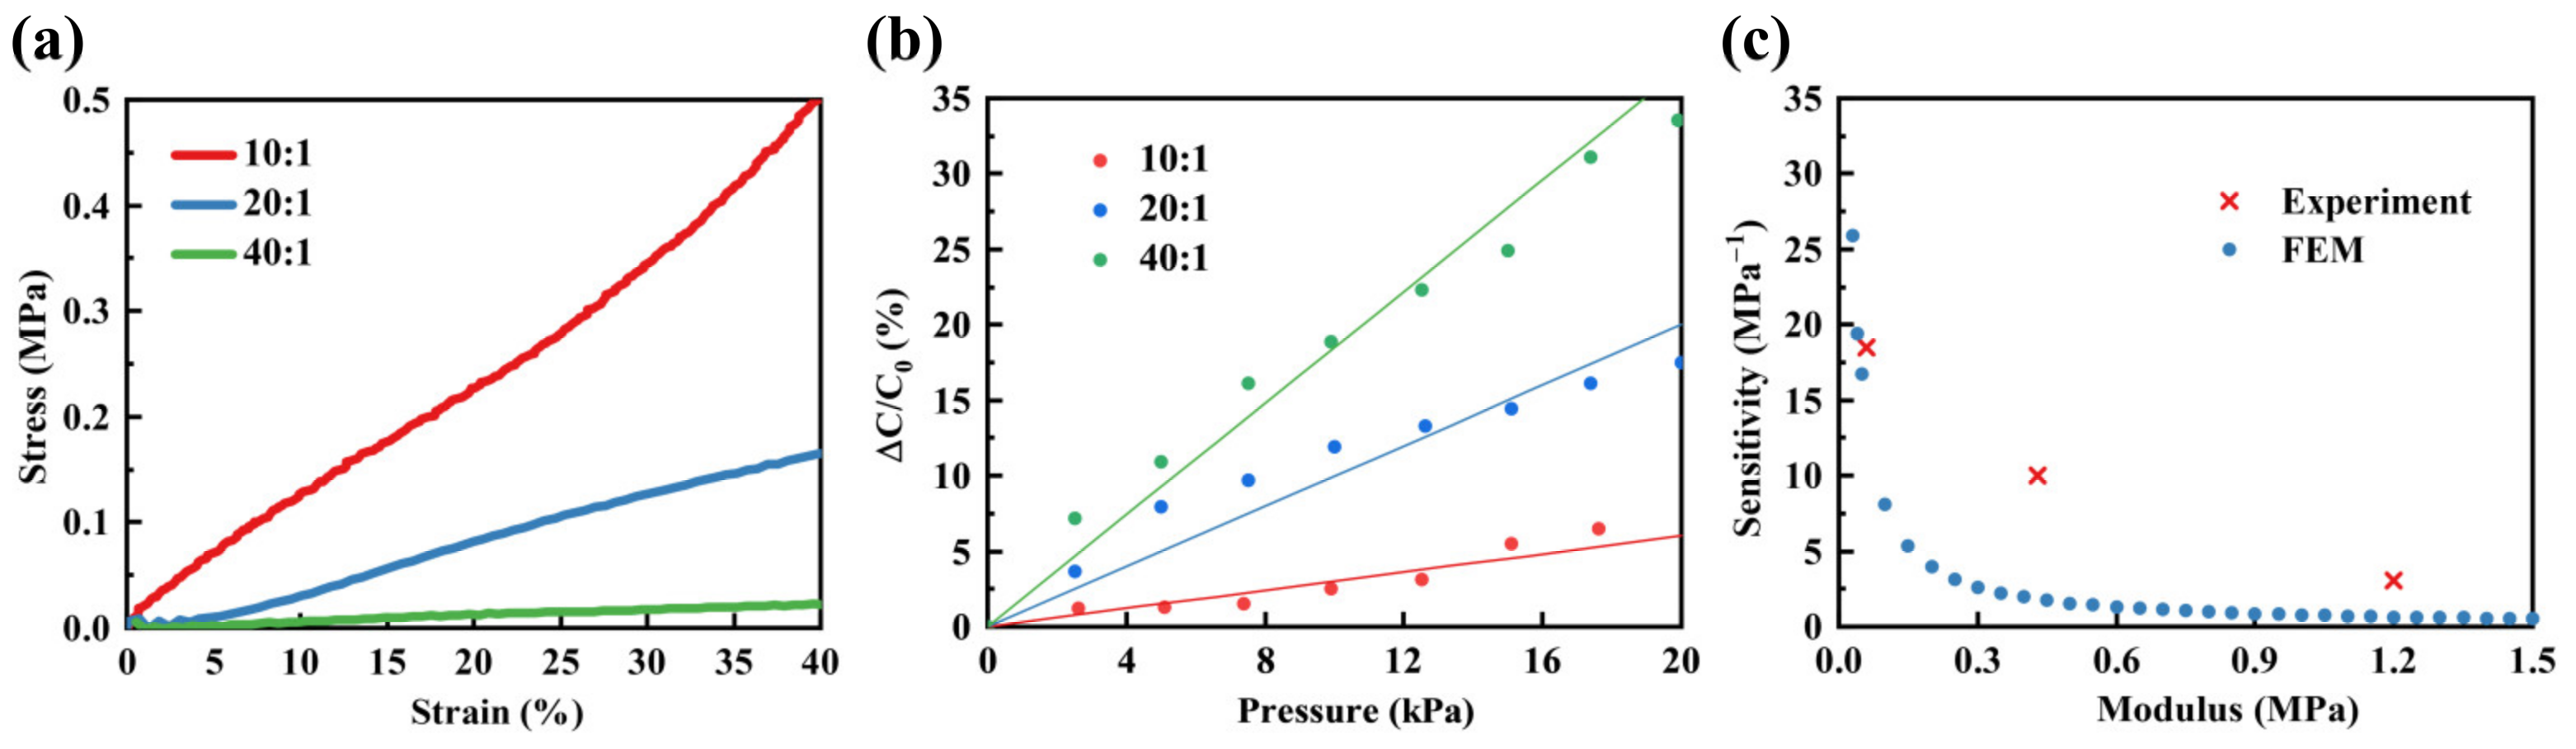
3.3.1. Impact of Different Modulus of PDMS on Sensor’s Sensitivity
3.3.2. The Impact of the Porosity of Porous PDMS on the Sensitivity of Sensors
4. Conclusions
Author Contributions
Funding
Institutional Review Board Statement
Data Availability Statement
Conflicts of Interest
References
- Zhang, J.; Sun, D.; Zhang, B.; Sun, Q.; Zhang, Y.; Liu, S.; Wang, Y.; Liu, C.; Chen, J.; Chen, J.; et al. Intrinsic carbon nanotube liquid crystalline elastomer photoactuators for high-definition biomechanics. Mater. Horiz. 2022, 9, 1045–1056. [Google Scholar] [CrossRef]
- Gao, W.; Yao, J.; Yue, X.; Zhu, K.; Cheng, Z.; Li, K. A flexible sensor with circumferential negative poisson’s ratio characteristics for human interaction. IEEE Sens. J. 2023, 23, 22313–22322. [Google Scholar] [CrossRef]
- Zhong, Y.; Wu, L.; Gu, F.; Wang, J.; Dai, S.; Zhu, H.; Cheng, G.; Ding, J. Negative pressure-assisted porous structure with gradient dielectrics design for linearity enhancement of flexible capacitance pressure sensor. Colloids Surf. A Physicochem. Eng. Asp. 2023, 676, 132306. [Google Scholar] [CrossRef]
- Huang, W.; Ding, Q.; Wang, H.; Wu, Z.; Luo, Y.; Shi, W.; Yang, L.; Liang, Y.; Liu, C.; Wu, J. Design of stretchable and self-powered sensing device for portable and remote trace biomarkers detection. Nat. Commun. 2023, 14, 5221. [Google Scholar] [CrossRef] [PubMed]
- Su, L.; Liang, M.; Wang, J.; Xin, X.; Jiao, Y.; Wang, C.; Zhang, Y.; Yao, Z. Robust orientation-3D conductive network enabled high-performance flexible sensor for traffic monitoring: Role of surface functionalization on self-assembled microspheres arrays. Chem. Eng. J. 2023, 468, 143564. [Google Scholar] [CrossRef]
- Qin, Y.; Gao, B.; Chen, Y.; Xia, Q. Flexible multimodal sensors based on fibrous porous networks of multiwalled carbon nanotubes and polydimethylsiloxane for sensing and distinguishing vertical and shear Force. ACS Appl. Nano Mater. 2023, 6, 9569–9578. [Google Scholar] [CrossRef]
- Gao, W.; Yao, J.; Zhu, K.; Zhao, P.; Chen, X. Highly sensitive, wide-range pressure sensor based on negative poisson’s ratio for human motion detection. IEEE Sens. J. 2023, 23, 12618–12625. [Google Scholar] [CrossRef]
- He, S.; Wu, J.; Su, B.; Liu, S.; Wang, Y. Design of PDMS/CNT flexible pressure sensor based on double structure with the regulation of electrical properties. Compos. Sci. Technol. 2023, 242, 110166. [Google Scholar] [CrossRef]
- He, S.; Wu, J.; Duan, Y.; Su, B.; Liu, S.; Teng, F.; Wang, Y. Soft-template synthesis of hierarchically porous structured polydimethylsiloxane toward flexible capacitive pressure sensor. Sci. China Technol. Sci. 2023, 66, 2696–2706. [Google Scholar] [CrossRef]
- Duan, Y.; Wu, J.; He, S.; Su, B.; Li, Z.; Wang, Y. Bioinspired spinosum capacitive pressure sensor based on CNT/PDMS nanocomposites for broad range and high sensitivity. Nanomaterials 2022, 12, 3265. [Google Scholar] [CrossRef]
- Lee, J.; Kwon, H.; Seo, J.; Shin, S.; Koo, J.H.; Pang, C.; Son, S.; Kim, J.H.; Jang, Y.H.; Kim, D.E.; et al. Conductive fiber-based ultrasensitive textile pressure sensor for wearable electronics. Adv. Mater. 2015, 27, 2433–2439. [Google Scholar] [CrossRef] [PubMed]
- Zheng, S.; Jiang, Y.; Wu, X.; Xu, Z.; Liu, Z.; Yang, W.; Yang, M. Highly sensitive pressure sensor with broad linearity via constructing a hollow structure in polyaniline/polydimethylsiloxane composite. Compos. Sci. Technol. 2021, 201, 108546. [Google Scholar] [CrossRef]
- Yuan, T.; Yin, R.; Li, C.; Wang, C.; Fan, Z.; Pan, L. Fully inkjet-printed dual-mode sensor for simultaneous pressure and temperature sensing with high decoupling. Chem. Eng. J. 2023, 473, 145475. [Google Scholar] [CrossRef]
- Ren, M.; Sun, Z.; Zhang, M.; Yang, X.; Guo, D.; Dong, S.; Dhakal, R.; Yao, Z.; Li, Y.; Kim, N.Y. A high-performance wearable pressure sensor based on an MXene/PVP composite nanofiber membrane for health monitoring. Nanoscale. Adv. 2022, 4, 3987–3995. [Google Scholar] [CrossRef] [PubMed]
- Zhu, H.; Yang, H.; Zhan, L.; Chen, Y.; Wang, J.; Xu, F. Hydrogel-based smart contact lens for highly sensitive wireless intraocular pressure monitoring. ACS. Sens. 2022, 7, 3014–3022. [Google Scholar] [CrossRef] [PubMed]
- Chen, Y.-S.; Hsieh, G.-W.; Chen, S.-P.; Tseng, P.-Y.; Wang, C.-W. Zinc oxide nanowire-poly(methyl methacrylate) dielectric layers for polymer capacitive pressure sensors. ACS Appl. Mater. Interfaces. 2015, 7, 45–50. [Google Scholar] [CrossRef]
- Qu, C.; Lu, M.; Zhang, Z.; Chen, S.; Liu, D.; Zhang, D.; Wang, J.; Sheng, B. Flexible microstructured capacitive pressure sensors using laser engraving and graphitization from natural wood. Molecules 2023, 28, 5339. [Google Scholar] [CrossRef]
- Choi, J.; Kwon, D.; Kim, K.; Park, J.; Orbe, D.D.; Gu, J.; Ahn, J.; Cho, I.; Jeong, Y.; Oh, Y.; et al. Synergetic effect of porous elastomer and percolation of carbon nanotube filler toward high performance capacitive pressure sensors. ACS Appl. Mater. Interfaces 2020, 12, 1698–1706. [Google Scholar] [CrossRef]
- Li, T.; Luo, H.; Qin, L.; Wang, X.; Xiong, Z.; Ding, H.; Gu, Y.; Liu, Z.; Zhang, T. Flexible capacitive tactile sensor based on micropatterned dielectric layer. Small 2016, 12, 5042–5048. [Google Scholar] [CrossRef]
- Joo, Y.; Yoon, J.; Ha, J.; Kim, T.; Lee, S.; Lee, B.; Pang, C.; Hong, Y. Highly sensitive and bendable capacitive pressure sensor and its application to 1 V operation pressure-sensitive transistor. Adv. Electron. Mater. 2017, 3, 1600455. [Google Scholar] [CrossRef]
- Wang, J.; Jiu, J.; Nogi, M.; Sugahara, T.; Nagao, S.; Koga, H.; He, P.; Suganuma, K. A highly sensitive and flexible pressure sensor with electrodes and elastomeric interlayer containing silver nanowires. Nanoscale 2015, 7, 2926–2932. [Google Scholar] [CrossRef] [PubMed]
- Bilent, S.; Dinh, T.H.N.; Martincic, E.; Joubert, P.-Y. Influence of the porosity of polymer foams on the performances of capacitive flexible pressure sensors. Sensors 2019, 19, 1968. [Google Scholar] [CrossRef] [PubMed]
- Zhang, J.W.; Zhang, Y.; Li, Y.Y.; Wang, P. Textile-based flexible pressure sensors: A review. Polym. Rev. 2022, 62, 65–94. [Google Scholar] [CrossRef]
- Mannsfeld, S.C.B.; Tee, B.C.K.; Stoltenberg, R.M.; Chen, C.V.H.H.; Barman, S.; Muir, B.V.O.; Sokolov, A.N.; Reese, C.; Bao, Z. Highly sensitive flexible pressure sensors with microstructured rubber dielectric layers. Nat. Mater. 2010, 9, 859–864. [Google Scholar] [CrossRef]
- Li, Q.; Duan, T.; Shao, J.; Yu, H. Fabrication method for structured porous polydimethylsiloxane (PDMS). J. Mater. Sci. 2018, 53, 11873–11882. [Google Scholar] [CrossRef]
- Masihi, S.; Panahi, M.; Maddipatla, D.; Hanson, A.J.; Bose, A.K.; Hajian, S.; Palaniappan, V.; Narakathu, B.B.; Bazuin, B.J.; Atashbar, M.Z. Highly sensitive porous PDMS-based capacitive pressure sensors fabricated on fabric platform for wearable applications. ACS Sens. 2021, 6, 938–949. [Google Scholar] [CrossRef]
- Pruvost, M.; Smit, W.J.; Monteux, C.; Poulin, P.; Colin, A. Polymeric foams for flexible and highly sensitive low-pressure capacitive sensors. NPJ Flex. Electron. 2019, 3, 7. [Google Scholar] [CrossRef]
- Han, M.; Lee, J.; Kim, J.K.; An, H.K.; Kang, S.-W.; Jung, D. Highly sensitive and flexible wearable pressure sensor with dielectric elastomer and carbon nanotube electrodes. Sens. Actuator A Phys. 2020, 305, 111941. [Google Scholar] [CrossRef]
- Kurup, L.A.; Cole, C.M.; Arthur, J.N.; Yambem, S.D. Graphene porous foams for capacitive pressure sensing. ACS Appl. Nano Mater. 2022, 5, 2973–2983. [Google Scholar] [CrossRef]
- Yang, C.R.; Wang, L.J.; Tseng, S.F. Arrayed porous polydimethylsiloxane/barium titanate microstructures for high-sensitivity flexible capacitive pressure sensors. Ceram. Int. 2022, 48, 13144–13153. [Google Scholar] [CrossRef]
- Fortunato, M.; Bellagamba, I.; Tamburrano, A.; Sarto, M.S. Flexible ecoflex/graphene nanoplatelet foams for highly sensitive low-pressure sensors. Sensors 2020, 20, 4406. [Google Scholar] [CrossRef]
- Dinh, T.H.N.; Martincic, E.; Dufour-Gergam, E.; Joubert, P.Y. Mechanical Characterization of PDMS Films for the Optimization of Polymer Based Flexible Capacitive Pressure Microsensors. J. Sens. 2017, 2017, 8235729. [Google Scholar] [CrossRef]
- Gibson, L.J.; Ashby, M.F. Cellular Solids: Structure and Properties; Cambridge University Press: Cambridge, UK, 1997. [Google Scholar]
- Li, S.; Dong, K.; Li, R.; Huang, X.; Chen, T.; Xiao, X. Capacitive pressure sensor inlaid a porous dielectric layer of superelastic polydimethylsiloxane in conductive fabrics for detection of human motions. Sens. Actuator A Phys. 2020, 312, 112106. [Google Scholar] [CrossRef]
- Lei, K.F.; Lee, K.-F.; Lee, M.-Y. Development of a flexible PDMS capacitive pressure sensor for plantar pressure measurement. Microelectron Eng. 2012, 99, 1–5. [Google Scholar] [CrossRef]
- Ma, L.; Yu, X.; Yang, Y.; Hu, Y.; Zhang, X.; Li, H.; Ouyang, X.; Zhu, P.; Sun, R.; Wong, C.-P. Highly sensitive flexible capacitive pressure sensor with a broad linear response range and finite element analysis of micro-array electrode. J. Mater. 2020, 6, 321–329. [Google Scholar] [CrossRef]
- Ho, D.H.; Sun, Q.; Kim, S.Y.; Han, J.T.; Kim, D.H.; Cho, J.H. Stretchable and multimodal all graphene electronic skin. Adv. Mater. 2016, 28, 2601–2608. [Google Scholar] [CrossRef] [PubMed]
- Sun, Y.; Tai, H.; Yuan, Z.; Duan, Z.; Huang, Q.; Jiang, Y.J.P.; Characterization, P.S. A facile strategy for low Young’s modulus PDMS microbeads enhanced flexible capacitive pressure sensors. Part. Part. Syst. Charact. 2021, 38, 2100019. [Google Scholar] [CrossRef]
- Zhang, Q.; Jia, W.; Ji, C.; Pei, Z.; Jing, Z.; Cheng, Y.; Zhang, W.; Zhuo, K.; Ji, J.; Yuan, Z.; et al. Flexible wide-range capacitive pressure sensor using micropore PE tape as template. Smart Mater Struct. 2019, 28, 115040. [Google Scholar] [CrossRef]
- Choi, H.B.; Oh, J.; Kim, Y.; Pyatykh, M.; Chang Yang, J.; Ryu, S.; Park, S. Transparent pressure sensor with high linearity over a wide pressure range for 3D touch screen applications. ACS Appl. Mater. Interfaces 2020, 12, 16691–16699. [Google Scholar] [CrossRef] [PubMed]


| 10:1 | 20:1 | 40:1 |
|---|---|---|
| 1.2 MPa | 0.43 MPa | 0.06 MPa |
| Reference | Dielectric Material | Dielectric Structure | Maximum Sensitivity (MPa−1) | Working Pressure (kPa) |
|---|---|---|---|---|
| [34] | PDMS | Porous | 23 | 0–200 |
| [25] | PDMS | Porous | 10.7 | 0–12 |
| [35] | PDMS | Solid | 1.6 | 0–945 |
| [36] | PDMS | Micro-array | 32 | 0–50 |
| [37] | PDMS/GO | Solid | 2 | 0–400 |
| [38] | Ecoflex/PDMS | Microbeads | 48 | 0–10 |
| [39] | PDMS/Ag@CNTs/AgNWs | Solid | 49 | 0–45 |
| [40] | PDMS | Pyramid | 34 | 0–100 |
| This work | PDMS | Porous | 80 | 0–10 |
Disclaimer/Publisher’s Note: The statements, opinions and data contained in all publications are solely those of the individual author(s) and contributor(s) and not of MDPI and/or the editor(s). MDPI and/or the editor(s) disclaim responsibility for any injury to people or property resulting from any ideas, methods, instructions or products referred to in the content. |
© 2024 by the authors. Licensee MDPI, Basel, Switzerland. This article is an open access article distributed under the terms and conditions of the Creative Commons Attribution (CC BY) license (https://creativecommons.org/licenses/by/4.0/).
Share and Cite
Bu, Y.; Wu, J.; Zhang, Z.; Wei, Q.; Su, B.; Wang, Y. Design and Analysis of Porous Elastomeric Polymer Based on Electro-Mechanical Coupling Characteristics for Flexible Pressure Sensor. Polymers 2024, 16, 701. https://doi.org/10.3390/polym16050701
Bu Y, Wu J, Zhang Z, Wei Q, Su B, Wang Y. Design and Analysis of Porous Elastomeric Polymer Based on Electro-Mechanical Coupling Characteristics for Flexible Pressure Sensor. Polymers. 2024; 16(5):701. https://doi.org/10.3390/polym16050701
Chicago/Turabian StyleBu, Yingxuan, Jian Wu, Zheming Zhang, Qiandiao Wei, Benlong Su, and Youshan Wang. 2024. "Design and Analysis of Porous Elastomeric Polymer Based on Electro-Mechanical Coupling Characteristics for Flexible Pressure Sensor" Polymers 16, no. 5: 701. https://doi.org/10.3390/polym16050701