
Preparation and Thermo-Mechanical Characteristics of Composites Based on Epoxy Resin with Kaolinite and Clinoptilolite


Abstract
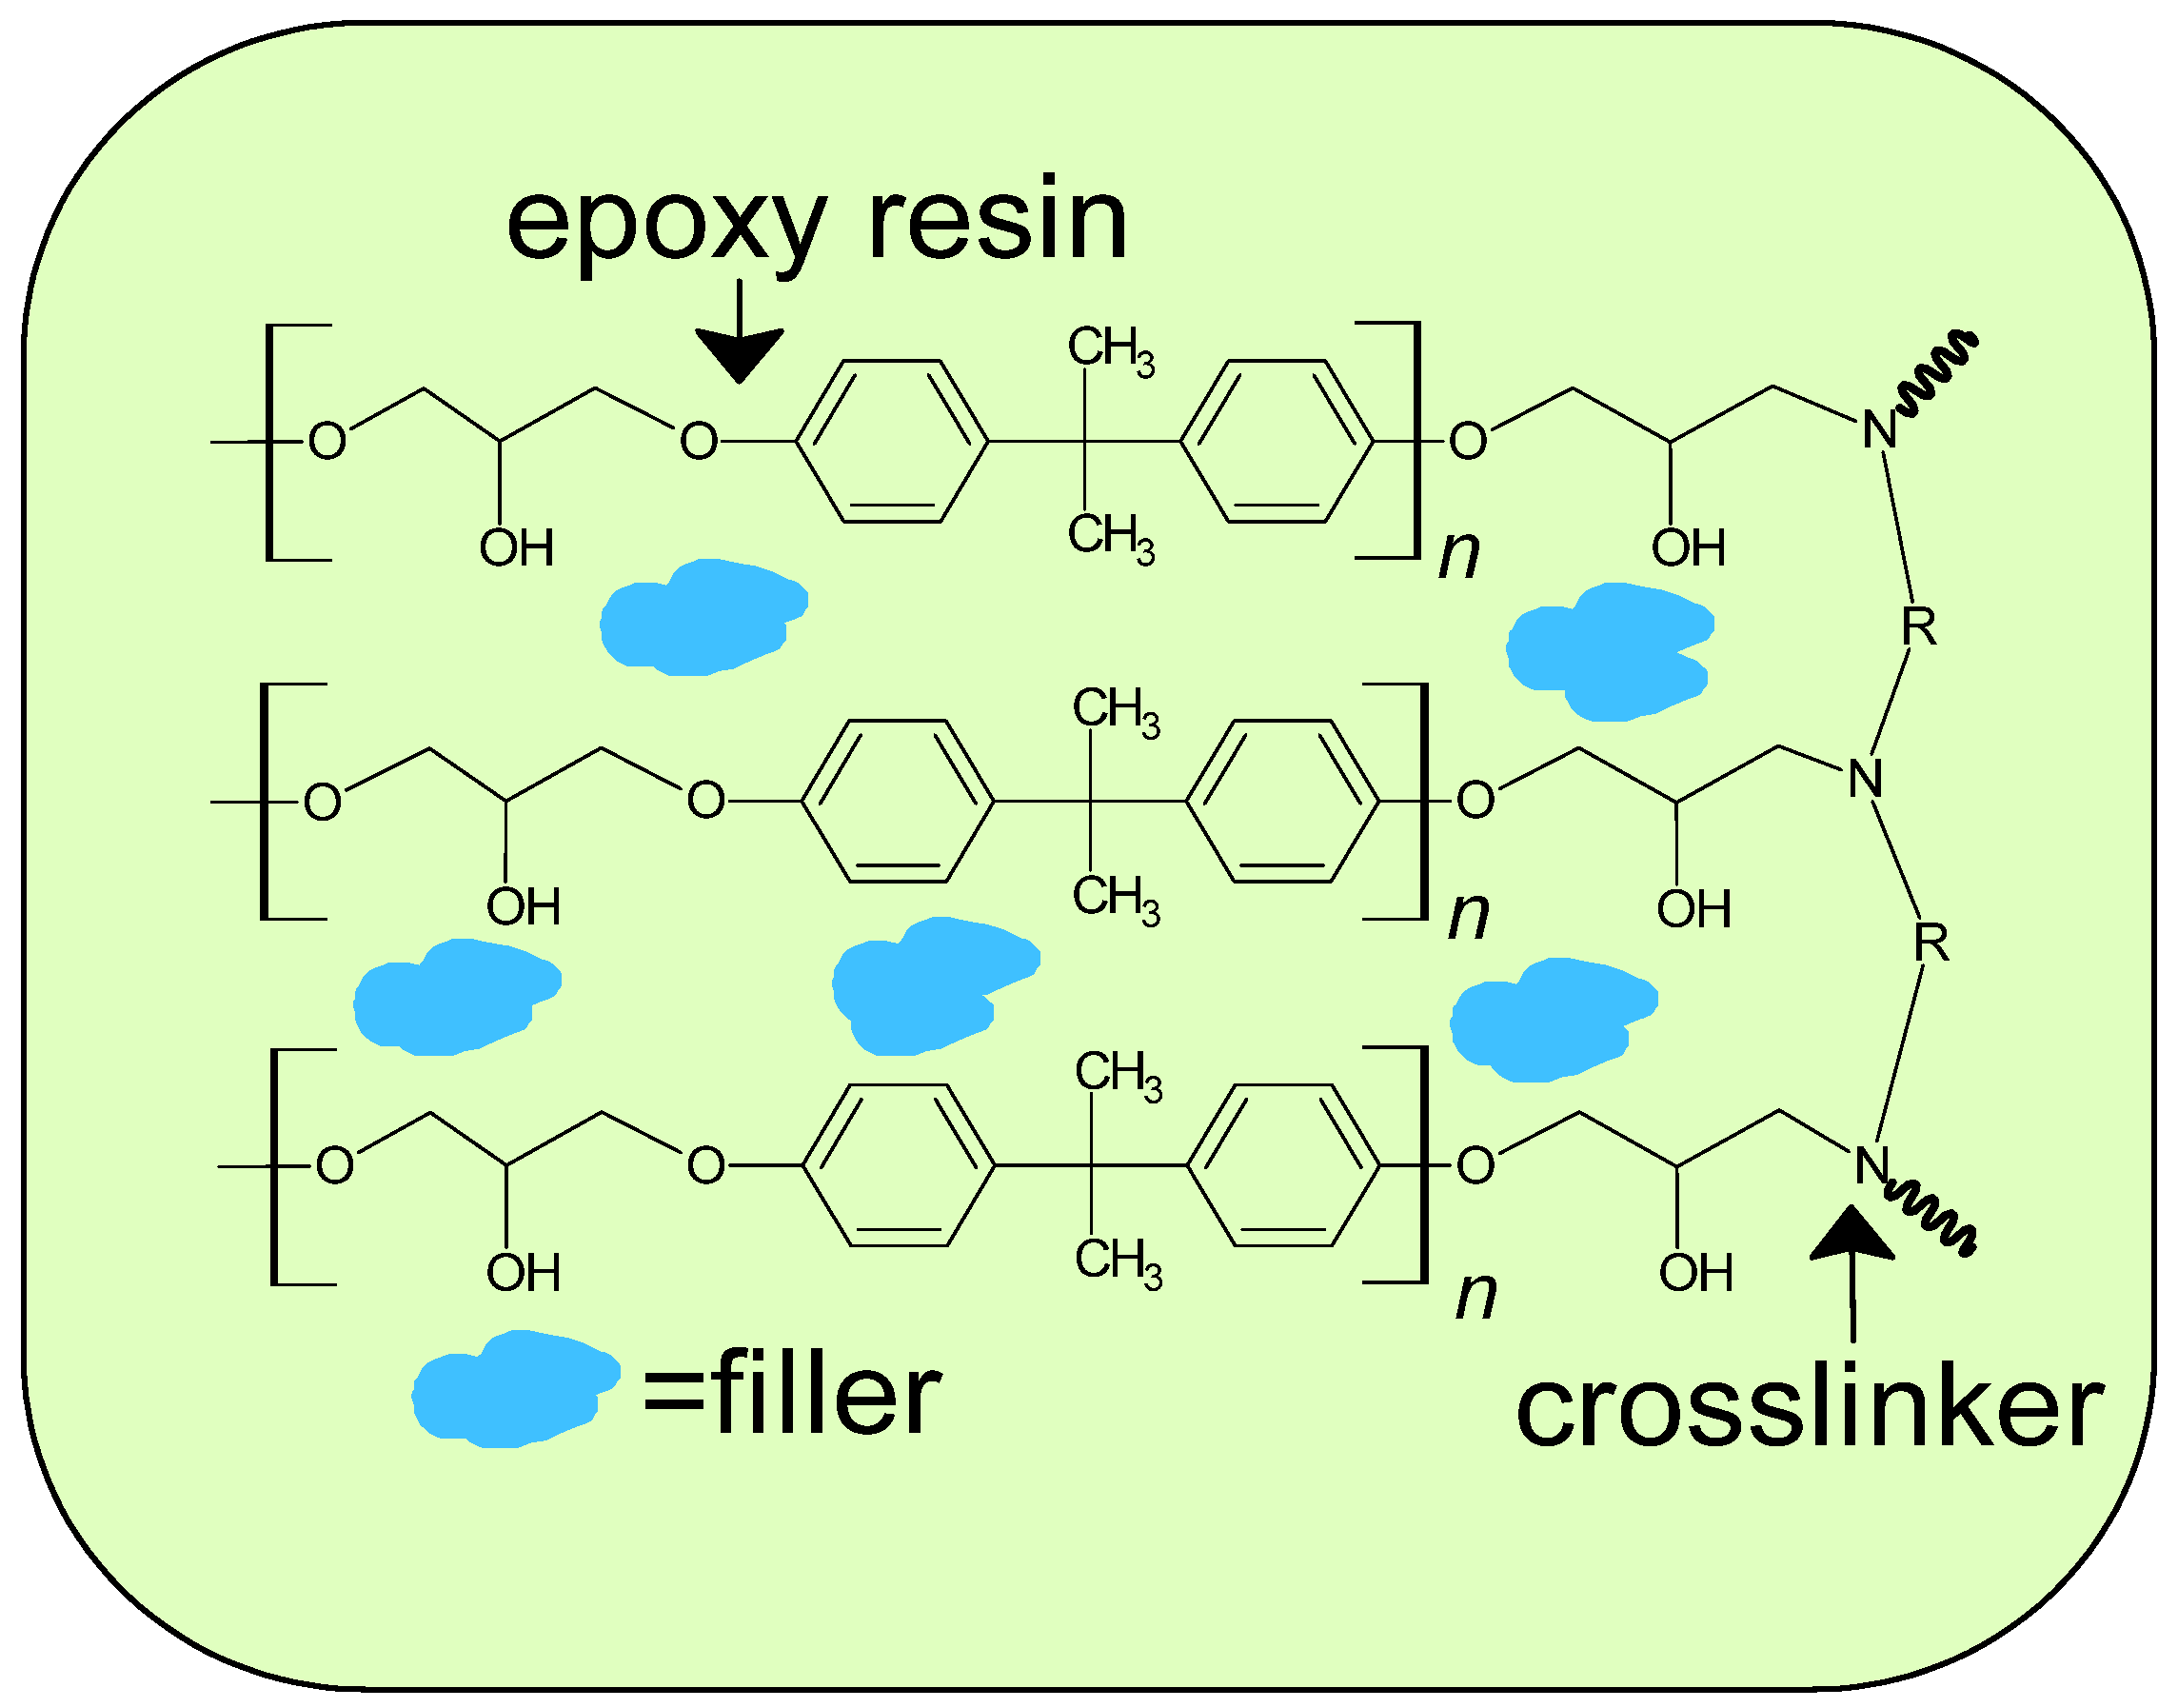
:1. Introduction
2. Materials and Methods
2.1. Chemicals
2.2. Composite Preparation
2.3. Measurements Methods
2.3.1. Fourier Transform Infrared Spectroscopy (FTIR)
2.3.2. Thermal and Thermomechanical Properties
Differential Scanning Calorimetry (DSC)
Dynamic Mechanical Analysis (DMA)
2.3.3. Mechanical Properties
2.3.4. Scanning Electron Microscope (SEM)
3. Results and Discussion
3.1. Spectroscopic Characteristics
3.2. DSC Analysis
3.3. DMA Analysis
3.4. Mechanical Properties
3.5. SEM Analysis
4. Conclusions
Author Contributions
Funding
Institutional Review Board Statement
Informed Consent Statement
Data Availability Statement
Acknowledgments
Conflicts of Interest
References
- Pascault, J.-P.; Williams, R.J.J. Epoxy Polymers: New Materials and Innovations; Wiley-VCH Verlag GmbH & Co. KGaA: Weinheim, Germany, 2010. [Google Scholar]
- Koronis, G.; Silva, A.; Fontul, M. Green Composites: A Review of Adequate Materials for Automotive Applications. Compos. B Eng. 2013, 44, 120–127. [Google Scholar] [CrossRef]
- Chrusciel, J.J.; Lesniak, E. Modification of Epoxy Resins with Functional Silanes, Polysiloxanes, Silsesquioxanes, Silica and Silicates. Prog. Polym. Sci. 2015, 41, 67–121. [Google Scholar] [CrossRef]
- Gargol, M.; Klepka, T.; Klapiszewski, Ł.; Podkościelna, B. Synthesis and Thermo-Mechanical Study of Epoxy Resin-Based Composites with Waste Fibers of Hemp as an Eco-Friendly Filler. Polymers 2021, 13, 503. [Google Scholar] [CrossRef] [PubMed]
- Jin, H.; Miller, G.M.; Pety, S.J.; Griffin, A.S.; Stradley, D.S.; Roach, D.; Sottos, N.R.; White, S.R. Fracture Behavior of a Self-Healing. Toughened Epoxy Adhesive. Int. J. Adhes. Adhes. 2013, 44, 157–165. [Google Scholar] [CrossRef]
- Conradi, M.; Kocijan, A.; Kek-Merl, D.; Zorko, M.; Verpoest, I. Mechanical and Anticorrosion Properties of Nanosilica-Filled Epoxy-Resin Composite Coatings. Appl. Surf. Sci. 2014, 292, 432–437. [Google Scholar] [CrossRef]
- Guo, Q.; Huang, Y.; Zhang, Y.Y.; Zhu, L.R.; Zhang, B.L. Curing Behavior of Epoxy Resins with a Series of Novel Curing Agents Containing 4.40-Biphenyl and Varying Methylene Units. J. Therm. Anal. Calorim. 2010, 102, 915–922. [Google Scholar] [CrossRef]
- Fraga, F.; Soto, V.; Rodríguez-Núñez, E.; Martínez-Ageitos, J.; Rodríguez, V. Cure Kinetic of the Epoxy Network Diglycidyl ether of Bisphenol A (BADGE n = 10)/Amantidine. J. Therm. Anal. Calorim. 2007, 87, 97–100. [Google Scholar] [CrossRef]
- Mustata, F.; Tudorachi, N. Curing kinetics and Thermal Characterization of Epoxy Resin Cured with Amidodicarboxylic Acids. Appl. Therm. Eng. 2017, 125, 285–296. [Google Scholar] [CrossRef]
- Ghaemy, M.; Behmadi, H. Study of Cure Kinetics of DGEBA with Optically Active Curing Agents. J. Therm. Anal. Calorim. 2010, 101, 1011–1017. [Google Scholar] [CrossRef]
- Zhang, D.; Jia, D.; Chen, S. Kinetics of Curing and Thermal Degradation of Hyperbranched Epoxy (HTDE)/Diglycidyl ether of Bisphenol-A Epoxy Hybrid Resin. J. Therm. Anal. Calorim. 2009, 98, 819–824. [Google Scholar] [CrossRef]
- Gonçalves, F.A.M.M.; Santos, M.; Cernadas, T.; Alves, P.; Ferreira, P. Influence of Fillers on Epoxy Resins Properties: A Review. J. Mater Sci. 2022, 57, 15183–15212. [Google Scholar] [CrossRef]
- Oleksy, M.; Szwarc-Rzepka, K.; Heneczkowski, M.; Oliwa, R.; Jesionowski, T. Epoxy Resin Composite Based on Functional Hybrid Fillers. Materials 2014, 7, 6064–6091. [Google Scholar] [CrossRef] [PubMed] [Green Version]
- Azeez, A.A.; Rhee, K.Y.; Park, S.J.; Hui, D. Epoxy Clay Nanocomposites—Processing, Properties and Applications: A Review. Compos. Part B Eng. 2013, 45, 308–320. [Google Scholar] [CrossRef]
- Katariya, M.N.; Jana, A.K.; Parikh, P.A. Corrosion Inhibition Effectiveness of Zeolite ZSM-5 Coating on Mild Steel against Various Organic Acids and its Antimicrobial Activity. J. Ind. Eng. Chem. 2013, 19, 286–291. [Google Scholar] [CrossRef]
- Yang, G.; Fu, S.-Y.; Yang, J.-P. Preparation and Mechanical Properties of Modified Epoxy Resins with Flexible Diamines. Polymer 2007, 48, 302–310. [Google Scholar] [CrossRef]
- Cai, H.; Li, P.; Sui, G.; Yu, Y.; Li, G.; Yang, X.; Ryu, S. Curing Kinetics Study of Epoxy Resin/Flexible Amine Toughness Systems by Dynamic and Isothermal DSC. Thermochim. Acta 2008, 473, 101–105. [Google Scholar] [CrossRef]
- Gargol, M.; Podkościelna, B. The Use of Waste Materials as Fillers in Polymer Composites—Synthesis and Thermal Properties. Physicochem. Probl. Miner. Process. 2019, 55, 1550–1557. [Google Scholar]
- Dziuba, K.; Wnuczek, K.; Wojtachnio, P.; Sonnier, R.; Podkościelna, B. New Polymer Composites with Aluminum Phosphates as Hybrid Flame Retardants. Materials 2023, 16, 426. [Google Scholar] [CrossRef]
- Bekeshev, A.; Mostovoy, A.; Kadykova, Y.; Akhmetova, M.; Tastanova, L.; Lopukhova, M. Development and Analysis of the Physic Chemical and Mechanical Properties of Diorite-Reinforced Epoxy Composites. Polymers 2021, 13, 2421. [Google Scholar] [CrossRef]
- Bafakeeh, O.T.; Shewakh, W.M.; Abu-Oqail, A.; Abd-Elaziem, W.; Abdel Ghafaar, M.; Abu-Okail, M. Synthesis and Characterization of Hybrid Fiber-Reinforced Polymer by Adding Ceramic Nanoparticles for Aeronautical Structural Applications. Polymers 2021, 13, 4116. [Google Scholar] [CrossRef]
- Sim, J.; Kang, Y.; Kim, B.J.; Park, Y.H.; Lee, Y.C. Preparation of Fly Ash/Epoxy Composites and its Effects on Mechanical Properties. Polymers 2020, 12, 79. [Google Scholar] [CrossRef] [PubMed] [Green Version]
- Burmistrov, I.N.; Mostovoi, A.S.; Shatrova, N.V.; Panova, L.G.; Kuznetsov, D.V.; Gorokhovskii, A.V.; Il’inykh, I.A. Influence of Surface Modification of Potassium Polytitanates on the Mechanical Properties of Polymer Composites Thereof. Russ. J. Appl. Chem. 2013, 86, 765–771. [Google Scholar] [CrossRef]
- Su, L.; Zeng, X.; He, H.; Tao, Q.; Komarneni, S. Preparation of Functionalized Kaolinite/Epoxy Resin Nanocomposites with Enhanced Thermal Properties. Appl. Clay Sci. 2017, 148, 103–108. [Google Scholar] [CrossRef]
- Fan, H.; Zhao, J.; Zhang, J.; Li, H.; Zhang, S.; Sun, J.; Xin, F.; Liu, F.; Qin, Z.; Tang, W. TiO2/SiO2/Kaolinite Hybrid Filler to Improve the Flame Retardancy, Smoke Suppression and Anti-Aging Characteristics of Epoxy Resin. Mater. Chem. Phys. 2022, 277, 125576. [Google Scholar] [CrossRef]
- Hamidi, S.; Marandi, S.M. Clay Concrete and Effect of Clay Minerals Types on Stabilized Soft Clay Soils by Epoxy Resin. Appl. Clay Sci. 2018, 151, 92–101. [Google Scholar] [CrossRef]
- ISO 11357: 2016; Plastics—Differential scanning calorimetry (DSC). International Organization of Standardization: Geneva, Switzerland, 2016.
- ISO 868:2003; Plastics and Ebonite—Determination of Indentation Hardness by Means of a Durometer (Shore Hardness). International Organization of Standardization: Geneva, Switzerland, 2003.
- Jozanikohan, G.; Abarghooei, M.N. The Fourier Transform Infrared Spectroscopy (FTIR) Analysis for the Clay Mineralogy Studies in a Clastic Reservoir. J. Pet. Explor. Prod. Technol. 2022, 12, 2093–2106. [Google Scholar] [CrossRef]
- Mansouri, N.; Rikhtegar, N.; Panahi, H.A.; Atabi, F.; Shahraki, B.K. Porosity, Characterization and Structural Properties of Natural Zeolite–Clinoptilolite–As a Sorbent. Environ. Prot. Eng. 2013, 39, 139–152. [Google Scholar] [CrossRef]
- Maity, P.; Kasisomayajula, S.V.; Parameswaran, V.; Basu, S.; Gupta, N. Improvement in Surface Degradation Properties of Polymer Composites due to Pre-Processed Nanometric Alumina Fillers. IEEE Trans. Dielectr. Electr. Insul. 2008, 15, 63–72. [Google Scholar] [CrossRef]


| Composite | EP601 | TETA [g] | KA | CL |
|---|---|---|---|---|
| 0 | 15 | 1.5 | 0 | 0 |
| KA1 | 15 | 1.5 | 0.165 | 0 |
| KA5 | 15 | 1.5 | 0.825 | 0 |
| KA10 | 15 | 1.5 | 1.650 | 0 |
| CL1 | 15 | 1.5 | 0 | 0.165 |
| CL5 | 15 | 1.5 | 0 | 0.825 |
| CL10 | 15 | 1.5 | 0 | 1.650 |
| Sample | Tg [°C] | Tcur [°C] | ΔH [J/g] | |||
|---|---|---|---|---|---|---|
| I a | II b | I a | II b | I a | II b | |
| 0 | 50 | 59 | 107 | - | 3.65 | - |
| KA1 | 32 | 47 | 110 | - | 4.78 | - |
| KA5 | 43 | 50 | 112 | - | 3.37 | - |
| KA10 | 54 | 65 | 117 | - | 18.33 | - |
| CL1 | 53 | 58 | 109 | - | 3.16 | - |
| CL5 | 31 | 40 | 107 | - | 7.10 | - |
| CL10 | 45 | 53 | 111 | - | 3.39 | - |
| Sample | E′20 (GPa) | E″max (°C) | E″max (MPa) | tan δmax (°C) | tan δmax | FWHM (°C) |
|---|---|---|---|---|---|---|
| 0 | 3.01 | 50.9 | 443.1 | 63.3 | 1.10 | 26.73 |
| KA1 | 3.11 | 52.3 | 384.6 | 64.1 | 1.47 | 21.44 |
| KA5 | 3.43 | 54.3 | 420.7 | 65.0 | 1.44 | 20.20 |
| KA10 | 3.48 | 59.4 | 505.7 | 69.7 | 1.40 | 17.91 |
| CL1 | 3.14 | 51.7 | 391.9 | 63.8 | 1.27 | 21.89 |
| CL5 | 3.43 | 49.8 | 402.5 | 64.5 | 1.34 | 21.65 |
| CL10 | 3.50 | 50.9 | 464.1 | 63.2 | 1.52 | 19.60 |
| Spec. Name | Material Name | Strength for Bending (Zwick) [MPa] | Average Strength for Material [MPa] | Maximum Deflection (ARAMIS) [mm] | Average Deflection per Material [mm] | Maximum Tensile Strain EpsX (ARAMIS) [%] | Average from Maximum Strain per Material [%] |
|---|---|---|---|---|---|---|---|
| 1.3 | CL5 | 73.6 | 81.0 | 3.62 | 3.62 | 1.83 | 1.83 |
| 1.2 | 87.4 | 4.12 | 2.05 | ||||
| 1.4 | 81.9 | 4.16 | 2.25 | ||||
| 2.2 | KA1 | 70.0 | 73.2 | 15.98 | 17.74 | 24.28 | 25.26 |
| 2.3 | 74.7 | 18.01 | 25.45 | ||||
| 2.4 | 74.9 | 19.22 | 26.06 | ||||
| 3.1 | CL10 | 51.0 | 58.3 | 2.39 | 3.00 | 1.18 | 1.49 |
| 3.2 | 68.6 | 3.73 | 1.90 | ||||
| 3.3 | 55.3 | 2.88 | 1.38 | ||||
| 4.2 | 0 | 19.4 | 48.8 | 8.92 | 8.51 | 1.08 | 6.61 |
| 4.3 | 77.5 | 3.97 | 2.10 | ||||
| 4.4 | 49.5 | 12.65 | 16.64 | ||||
| 5.1 | KA5 | 62.3 | 69.9 | 3.01 | 3.41 | 1.44 | 1.73 |
| 5.2 | 72.7 | 3.56 | 1.77 | ||||
| 5.3 | 74.8 | 3.67 | 1.99 | ||||
| 6.1 | CL1 | 83.2 | 88.3 | 3.53 | 3.74 | 1.74 | 1.82 |
| 6.2 | 92.3 | 3.85 | 1.72 | ||||
| 6.3 | 89.4 | 3.84 | 1.99 | ||||
| 7.1 | KA10 | 62.8 | 69.7 | 2.63 | 2.90 | 1.36 | 1.54 |
| 7.2 | 79.9 | 3.17 | 1.60 | ||||
| 7.3 | 66.3 | 2.90 | 1.65 |
| Material Name | Spec. Name | EpsX Strain Maps View and the Scale. |
|---|---|---|
| 0 | 4.3 |  |
| CL1 | 6.3 |  |
| KA5 | 1.4 |  |
| CL10 | 3.3 |  |
| KA1 | 2.3 |  |
| KA5 | 5.1 |  |
| KA10 | 7.3 |  |
Disclaimer/Publisher’s Note: The statements, opinions and data contained in all publications are solely those of the individual author(s) and contributor(s) and not of MDPI and/or the editor(s). MDPI and/or the editor(s) disclaim responsibility for any injury to people or property resulting from any ideas, methods, instructions or products referred to in the content. |
© 2023 by the authors. Licensee MDPI, Basel, Switzerland. This article is an open access article distributed under the terms and conditions of the Creative Commons Attribution (CC BY) license (https://creativecommons.org/licenses/by/4.0/).
Share and Cite
Puszka, A.; Kneć, M.; Franus, W.; Podkościelna, B. Preparation and Thermo-Mechanical Characteristics of Composites Based on Epoxy Resin with Kaolinite and Clinoptilolite. Polymers 2023, 15, 1898. https://doi.org/10.3390/polym15081898
Puszka A, Kneć M, Franus W, Podkościelna B. Preparation and Thermo-Mechanical Characteristics of Composites Based on Epoxy Resin with Kaolinite and Clinoptilolite. Polymers. 2023; 15(8):1898. https://doi.org/10.3390/polym15081898
Chicago/Turabian StylePuszka, Andrzej, Marcin Kneć, Wojciech Franus, and Beata Podkościelna. 2023. "Preparation and Thermo-Mechanical Characteristics of Composites Based on Epoxy Resin with Kaolinite and Clinoptilolite" Polymers 15, no. 8: 1898. https://doi.org/10.3390/polym15081898