
Using Thermomechanical Properties to Reassess Particles’ Dispersion in Nanostructured Polymers: Size vs. Content
 , , ,
, , ,  and
and
Abstract
:1. Introduction
2. Major Particle Fillers
2.1. Inorganic Nanofillers
2.1.1. Titanium Dioxide
2.1.2. Silicon Dioxide
2.1.3. Zinc Oxide
2.1.4. Clays
2.2. Organic Nanofillers
2.2.1. Graphene, Graphene Oxide and Graphene Nanoplatelets
2.2.2. Carbon Nanotubes
2.2.3. Nanocellulose
3. Dispersion Methods of Nanoparticles in Polymeric Matrices
4. Particle Effects on Composite Thermomechanical Properties
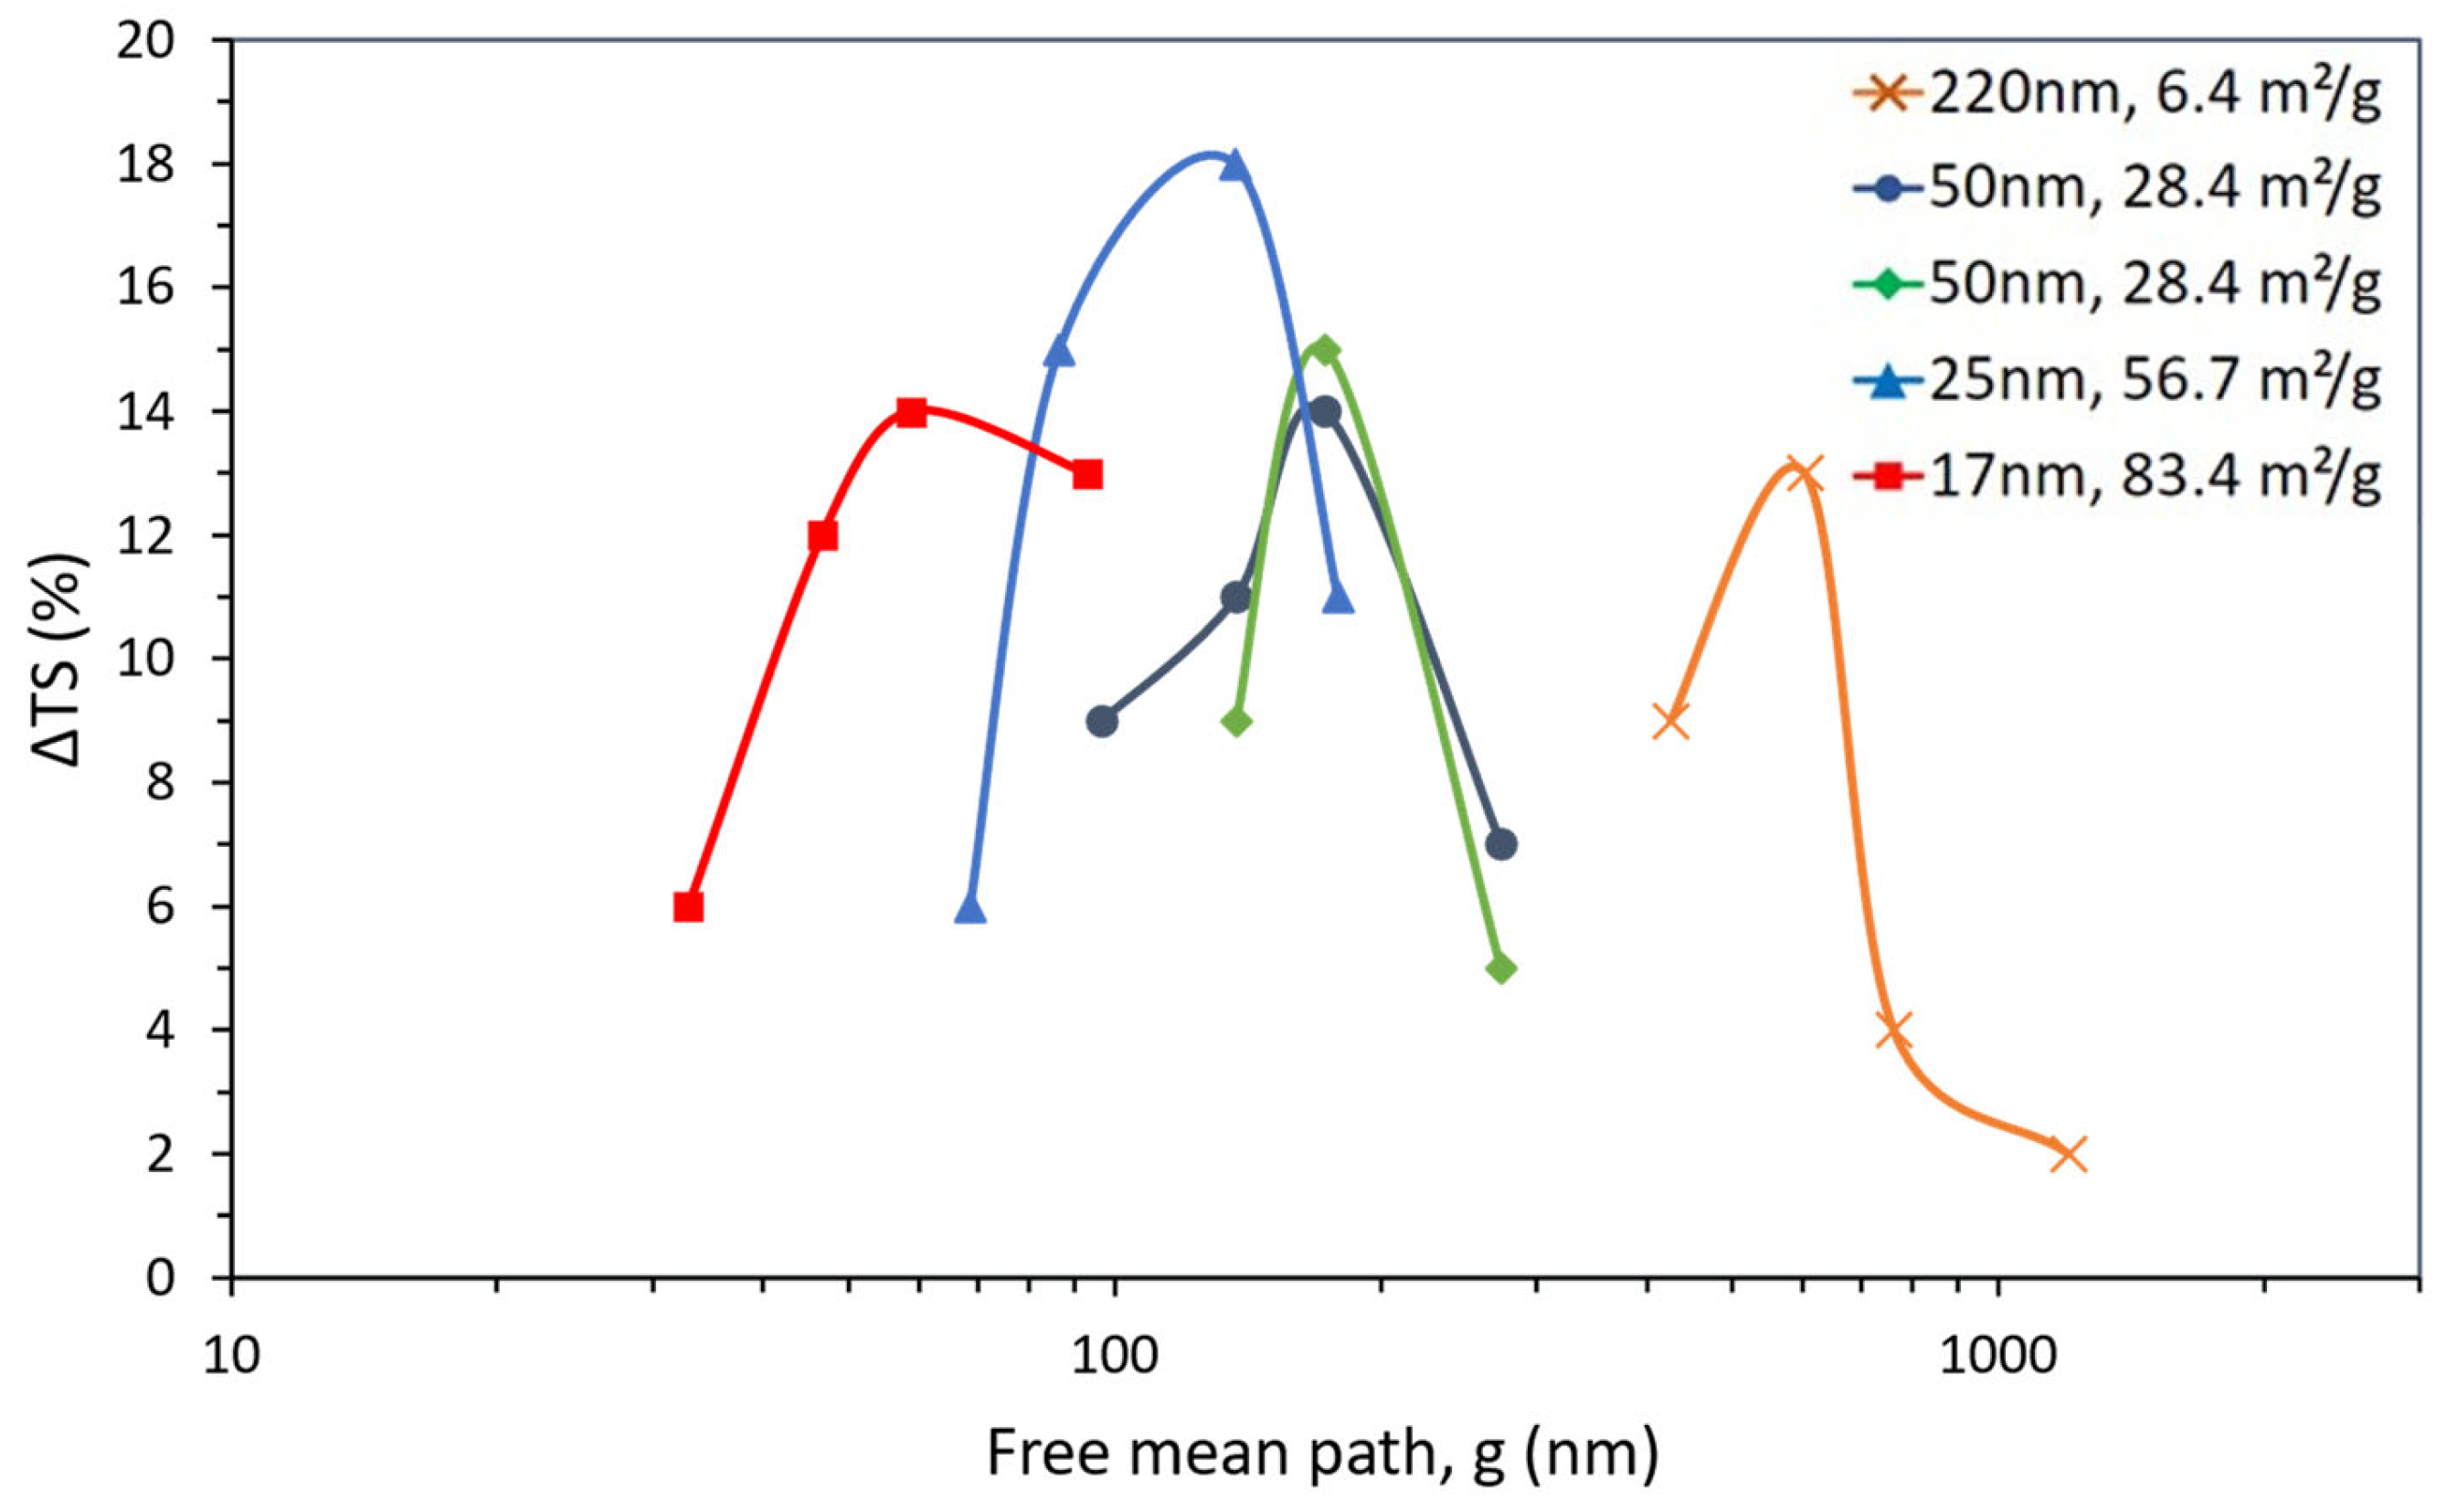
4.1. Effect on Tensile Strength
4.2. Effect on Dynamic Mechanical Properties
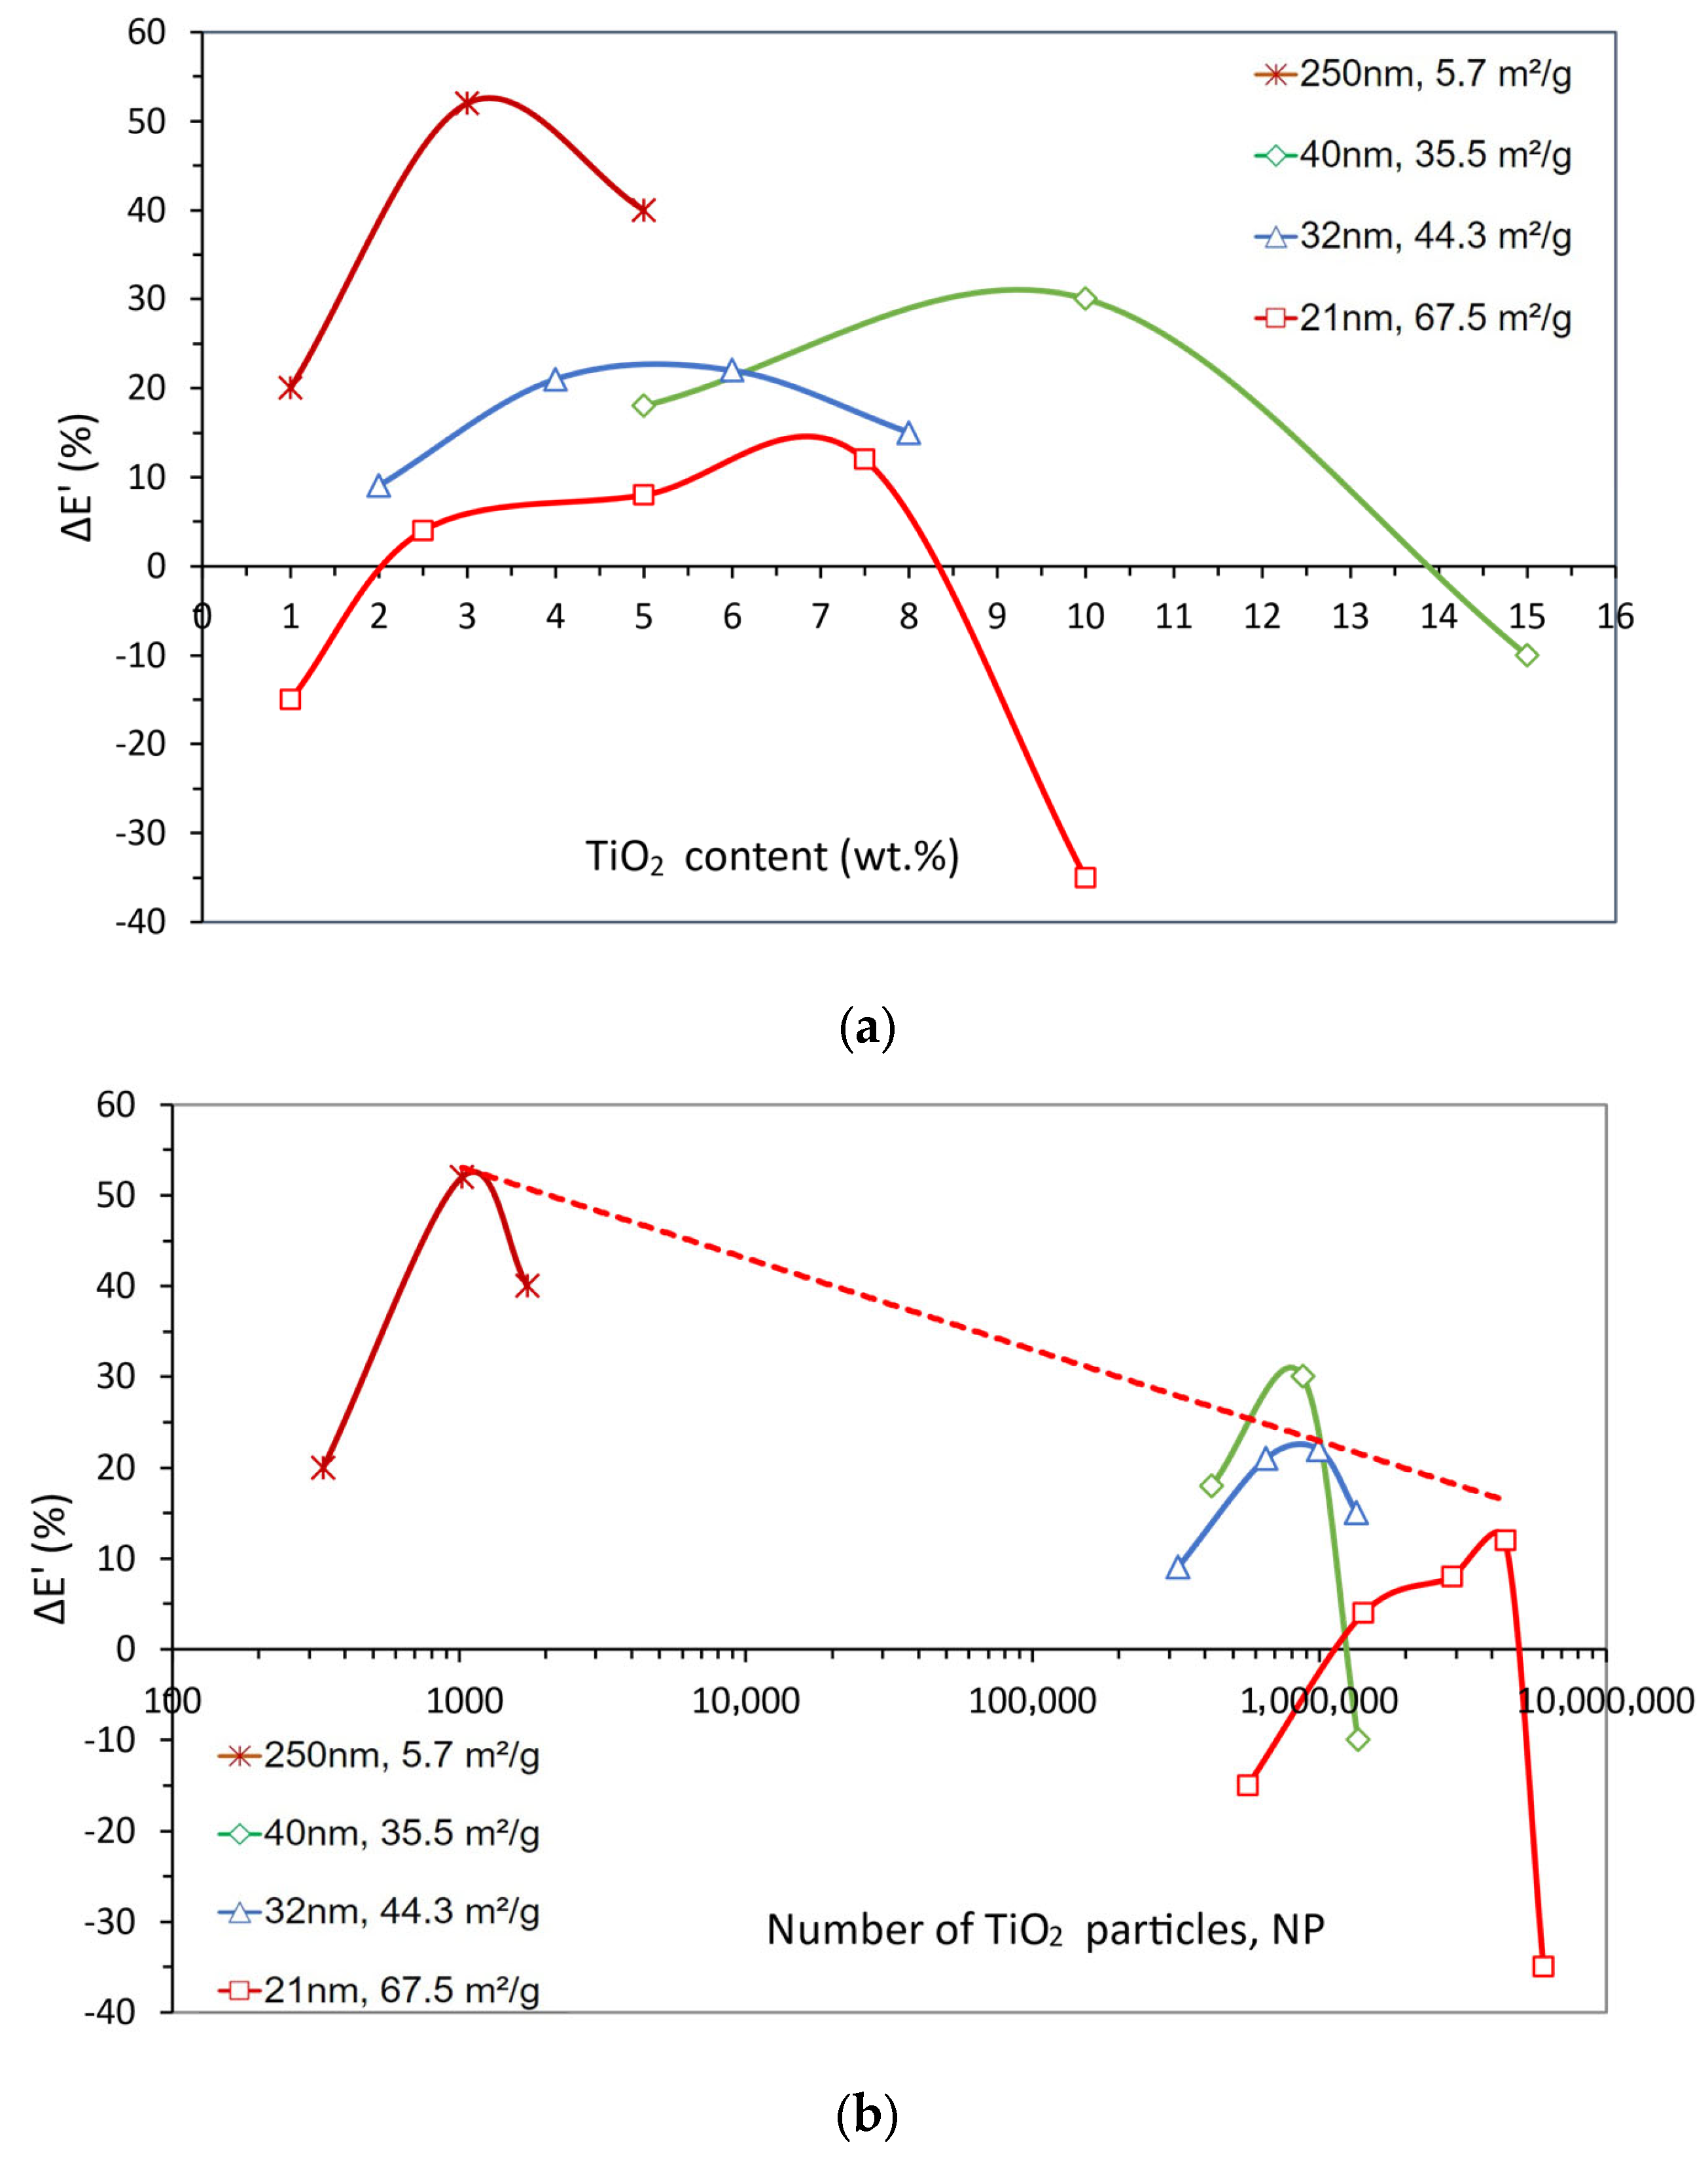
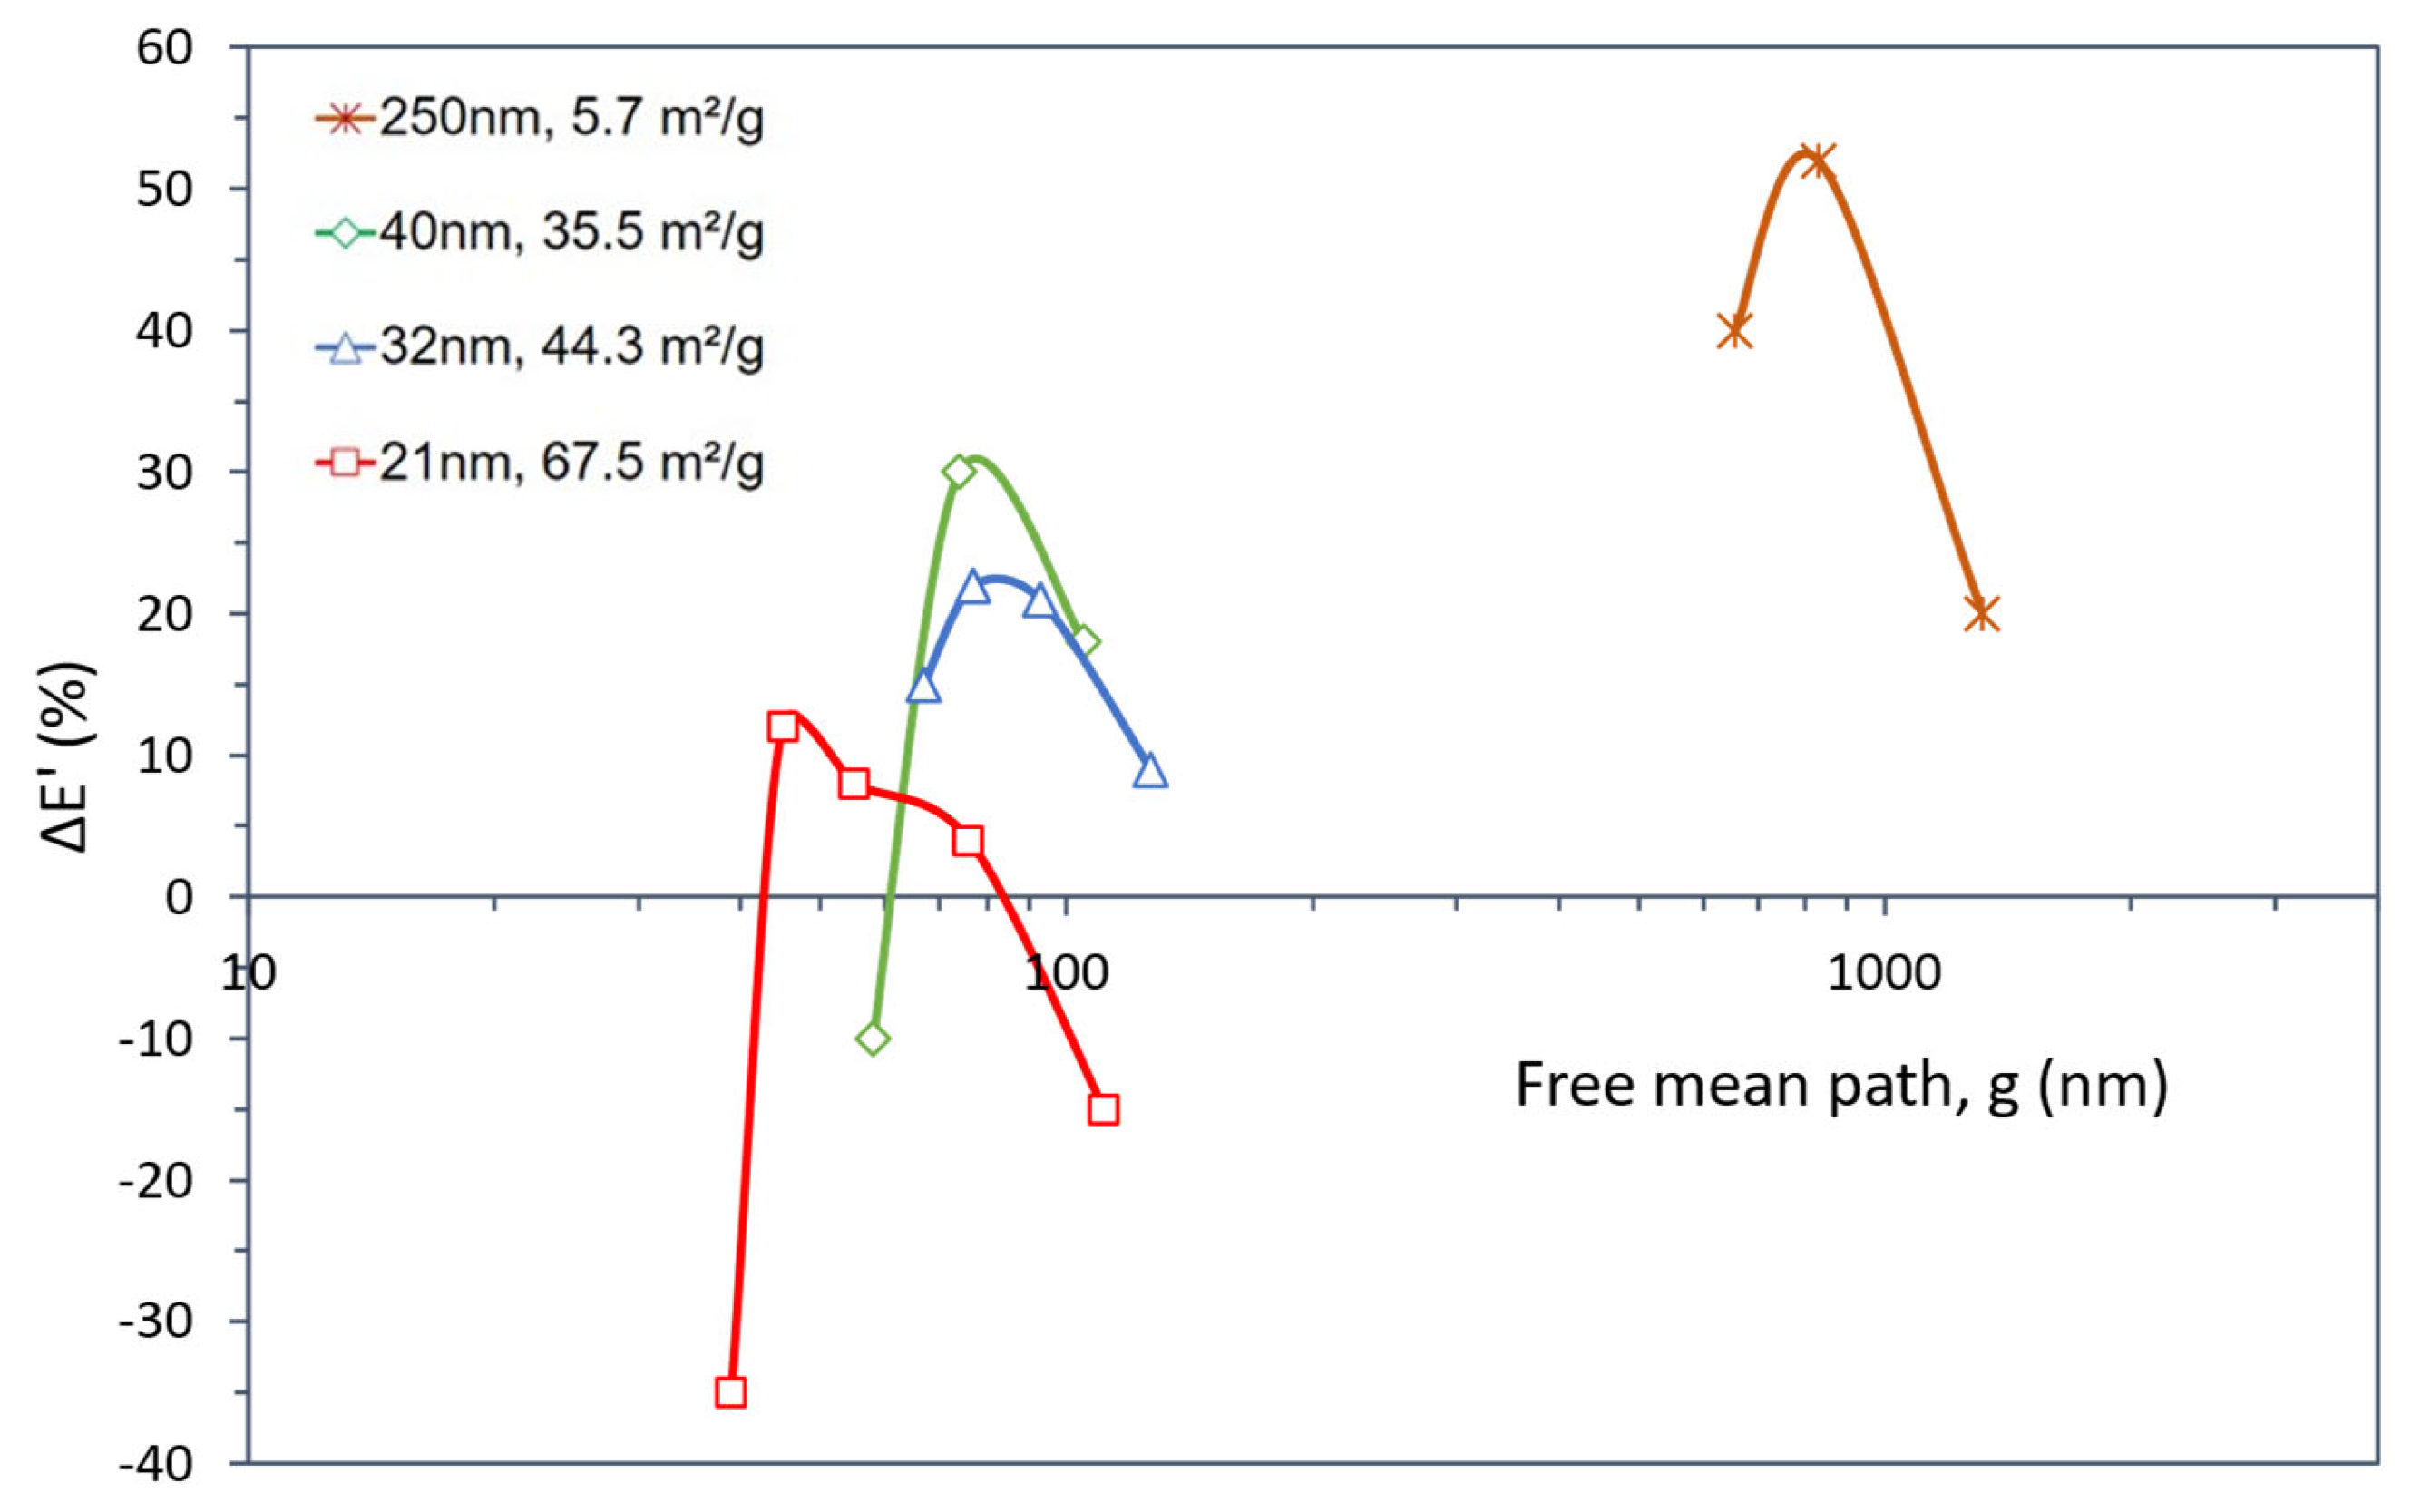
4.2.1. Storage Modulus
4.2.2. Glass Transition Temperature
5. Conclusions and Outlook
Author Contributions
Funding
Institutional Review Board Statement
Data Availability Statement
Acknowledgments
Conflicts of Interest
References
- Lobo, R.F.M. Nanotechnology and Nanophysics. Concepts of Modern Nanoscience; Escolar: Lisboa, Portugal, 2009; ISBN 9789725922675. [Google Scholar]
- Al-Rodhan, N.R.F. Materials Science. In The Politics of Emerging Strategic Technologies; St Antony’s Series; Palgrave Macmillan: London, UK, 2011; Volume 11, pp. 139–151. [Google Scholar]
- Lau, K.; Hung, P.; Zhu, M.-H.; Hui, D. Properties of Natural Fibre Composites for Structural Engineering Applications. Compos. Part B Eng. 2018, 136, 222–233. [Google Scholar] [CrossRef]
- Yun, M.; Sas, H.; Simacek, P.; Advani, S.G. Characterization of 3D Fabric Permeability with Skew Terms. Compos. Part A Appl. Sci. Manuf. 2017, 97, 51–59. [Google Scholar] [CrossRef]
- Kuilla, T.; Bhadra, S.; Yao, D.; Kim, N.H.; Bose, S.; Lee, J.H. Recent Advances in Graphene Based Polymer Composites. Prog. Polym. Sci. 2010, 35, 1350–1375. [Google Scholar] [CrossRef]
- Saba, N.; Jawaid, M.; Alothman, O.Y.; Paridah, M.T. A Review on Dynamic Mechanical Properties of Natural Fibre Reinforced Polymer Composites. Constr. Build. Mater. 2016, 106, 149–159. [Google Scholar] [CrossRef]
- Ibeh, C.C.; Bubacz, M. Current Trends in Nanocomposite Foams. J. Cell. Plast. 2008, 44, 493–515. [Google Scholar] [CrossRef]
- Abdelkarim, M.F.; Nasrat, L.S.; Elkhodary, S.M.; Soliman, A.M.; Hassan, A.M.; Mansour, S.H. Volume Resistivity and Mechanical Behavior of Epoxy Nanocomposite Materials. Eng. Technol. Appl. Sci. Res. 2015, 5, 775–780. [Google Scholar] [CrossRef]
- Rafique, I.; Kausar, A.; Muhammad, B. Epoxy Resin Composite Reinforced with Carbon Fiber and Inorganic Filler: Overview on Preparation and Properties. Polym.-Plast. Technol. Eng. 2016, 55, 1653–1672. [Google Scholar] [CrossRef]
- Masala, O.; Seshadri, R. Synthesis Routes for Large Volumes of Nanoparticles. Annu. Rev. Mater. Res. 2004, 34, 41–81. [Google Scholar] [CrossRef]
- Pinto, D.; Bernardo, L.; Amaro, A.; Lopes, S. Mechanical Properties of Epoxy Nanocomposites Using Titanium Dioxide as Reinforcement—A Review. Constr. Build. Mater. 2015, 95, 506–524. [Google Scholar] [CrossRef]
- Goud, K.Y.; Reddy, K.K.; Satyanarayana, M.; Kummari, S.; Gobi, K.V. A Review on Recent Developments in Optical and Electrochemical Aptamer-Based Assays for Mycotoxins Using Advanced Nanomaterials. Microchim. Acta 2020, 187, 29. [Google Scholar] [CrossRef]
- Prasad, V.; Sekar, K.; Varghese, S.; Joseph, M.A. Evaluation of Interlaminar Fracture Toughness and Dynamic Mechanical Properties of Nano TiO2 Coated Flax Fibre Epoxy Composites. Polym. Test. 2020, 91, 106784. [Google Scholar] [CrossRef]
- Hunain, M.B.; Abass, B.A.; Akhudair, J.M. Experimental and Numerical Studies of Fatigue Properties of Carbon/Glass Fiber/Epoxy Hybrid Composites Enhanced with Nano TiO2 powder. Diagnostyka 2021, 22, 75–84. [Google Scholar] [CrossRef]
- Al-Zubaydi, A.S.J.; Salih, R.M.; Al-Dabbagh, B.M. Effect of Nano TiO2 Particles on the Properties of Carbon Fiber-Epoxy Composites. Prog. Rubber Plast. Recycl. Technol. 2021, 37, 216–232. [Google Scholar] [CrossRef]
- Akhter, F.; Rao, A.A.; Abbasi, M.N.; Wahocho, S.A.; Mallah, M.A.; Anees-ur-Rehman, H.; Chandio, Z.A. A Comprehensive Review of Synthesis, Applications and Future Prospects for Silica Nanoparticles (SNPs). Silicon 2022, 14, 8295–8310. [Google Scholar] [CrossRef]
- Aziz, I.; Duran, H.; Saleem, M.; Yameen, B.; Arshad, S.N. The Role of Interface on Dynamic Mechanical Properties, Dielectric Performance, Conductivity, and Thermal Stability of Electrospun Carbon Nanofibers Reinforced Epoxy. Polym. Compos. 2021, 42, 4366–4379. [Google Scholar] [CrossRef]
- Zhang, X.R.; Pei, X.Q.; Wang, Q.H. Friction and Wear Studies of Polyimide Composites Filled with Short Carbon Fibers and Graphite and Micro SiO2. Mater. Des. 2009, 30, 4414–4420. [Google Scholar] [CrossRef]
- Fernández-Álvarez, M.; Velasco, F.; Bautista, A. Performance of Ultraviolet Exposed Epoxy Powder Coatings Functionalized with Silica by Hot Mixing. J. Mater. Res. Technol. 2021, 10, 1042–1057. [Google Scholar] [CrossRef]
- Xie, Z.; Li, H.; Zhang, S.; Gong, A.; Liu, P.; Peng, Z.; Wang, Q. Research on Electrical Properties of Surface-Modified Nano-SiO2/Epoxy Composites. In Proceedings of the 7th IEEE International Conference on High Voltage Engineering and Application, ICHVE 2020, Beijing, China, 6–10 September 2020. [Google Scholar]
- Zhou, S.; Wu, L.; Xiong, M.; He, Q.; Chen, G. Dispersion and UV-VIS Properties of Nanoparticles in Coatings. J. Dispers. Sci. Technol. 2005, 25, 417–433. [Google Scholar] [CrossRef]
- Wang, T.; Liu, C.; Li, D.; Hou, Y.; Zhang, G.; Zhang, B. Nano ZnO/Epoxy Coating to Promote Surface Charge Dissipation on Insulators in DC Gas-Insulated Systems. IEEE Trans. Dielectr. Electr. Insul. 2020, 27, 1322–1329. [Google Scholar] [CrossRef]
- Ammar, S.; Ramesh, K.; Vengadaesvaran, B.; Ramesh, S.; Arof, A.K. Amelioration of Anticorrosion and Hydrophobic Properties of Epoxy/PDMS Composite Coatings Containing Nano ZnO Particles. Prog. Org. Coat. 2016, 92, 54–65. [Google Scholar] [CrossRef]
- Theerthagiri, J.; Salla, S.; Senthil, R.A.; Nithyadharseni, P.; Madankumar, A.; Arunachalam, P.; Maiyalagan, T.; Kim, H.-S. A Review on ZnO Nanostructured Materials: Energy, Environmental and Biological Applications. Nanotechnology 2019, 30, 392001. [Google Scholar] [CrossRef]
- Babaei, I.; Madanipour, M.; Farsi, M.; Farajpoor, A. Physical and Mechanical Properties of Foamed HDPE/Wheat Straw Flour/Nanoclay Hybrid Composite. Compos. Part B Eng. 2014, 56, 163–170. [Google Scholar] [CrossRef]
- Klingshirn, C.F. ZnO: Material, Physics and Applications. ChemPhysChem 2007, 8, 782–803. [Google Scholar] [CrossRef] [PubMed]
- Battez, A.H.; González, R.; Viesca, J.L.; Fernández, J.E.; Fernández, J.M.D.; Machado, A.; Chou, R.; Riba, J. CuO, ZrO2 and ZnO Nanoparticles as Antiwear Additive in Oil Lubricants. Wear 2008, 265, 422–428. [Google Scholar] [CrossRef]
- Cangul, I.T.; Gul, N.Y.; Topal, A.; Yilmaz, R. Evaluation of the Effects of Topical Tripeptide-Copper Complex and Zinc Oxide on Open-Wound Healing in Rabbits. Vet. Dermatol. 2006, 17, 417–423. [Google Scholar] [CrossRef] [PubMed]
- De Liedekerke, M.; Auer, G.; Woditsch, P.; Westerhaus, A.; Kischkewitz, J.; Griebler, W.-D. Pigments, Inorganic, 2. White Pigments. Ullmann’s Encycl. Ind. Chem. 2006, 2, 257–291. [Google Scholar]
- Zhang, Z.; Yang, X.; Fu, Y.; Du, K. Ultrathin Molybdenum Diselenide Nanosheets Anchored on Multi-Walled Carbon Nanotubes as Anode Composites for High Performance Sodium-Ion Batteries. J. Power Sources 2015, 296, 2–9. [Google Scholar] [CrossRef]
- Jahanmardi, R.; Kangarlou, B.; Dibazar, A.R. Effects of Organically Modified Nanoclay on Cellular Morphology, Tensile Properties, and Dimensional Stability of Flexible Polyurethane Foams. J. Nanostruct. Chem. 2013, 3, 82. [Google Scholar] [CrossRef]
- Hossain, Z.; Zaman, M.; Hawa, T.; Saha, M.C. Evaluation of Moisture Susceptibility of Nanoclay-Modified Asphalt Binders through the Surface Science Approach. J. Mater. Civ. Eng. 2014, 27, 04014261. [Google Scholar] [CrossRef]
- LibreTextsTM. Available online: https://chem.libretexts.org/Bookshelves/General_Chemistry/Chemistry_1e_%28OpenSTAX%29/10%3A_Liquids_and_Solids/10.6%3A_Lattice_Structures_in_Crystalline_Solids (accessed on 23 July 2023).
- Najafi, N.; Heuzey, M.C.; Carreau, P.J. Polylactide (PLA)-Clay Nanocomposites Prepared by Melt Compounding in the Presence of a Chain Extender. Compos. Sci. Technol. 2012, 72, 608–615. [Google Scholar] [CrossRef]
- Vasiliu, S.; Racovita, S.; Gugoasa, I.A.; Lungan, M.A.; Popa, M.; Desbrieres, J. The Benefits of Smart Nanoparticles in Dental Applications. Int. J. Mol. Sci. 2021, 22, 2585. [Google Scholar] [CrossRef]
- Tipa, C.; Cidade, M.T.; Vieira, T.; Silva, J.C.; Soares, P.I.P.; Borges, J.P. A New Long-Term Composite Drug Delivery System Based on Thermo-Responsive Hydrogel and Nanoclay. Nanomaterials 2021, 11, 25. [Google Scholar] [CrossRef]
- Allen, M.J.; Tung, V.C.; Kaner, R.B. Honeycomb Carbon: A Review of Graphene. Chem. Rev. 2010, 110, 132–145. [Google Scholar] [CrossRef]
- Kumar, A.; Sharma, K.; Dixit, A.R. A Review of the Mechanical and Thermal Properties of Graphene and Its Hybrid Polymer Nanocomposites for Structural Applications. J. Mater. Sci. 2019, 54, 5992–6026. [Google Scholar] [CrossRef]
- Kim, J.; Kim, J.; Song, S.; Zhang, S.; Cha, J.; Kim, K.; Yoon, H.; Jung, Y.; Paik, K.W.; Jeon, S. Strength Dependence of Epoxy Composites on the Average Filler Size of Non-Oxidized Graphene Flake. Carbon 2017, 113, 379–386. [Google Scholar] [CrossRef]
- Subha, S.; Singh, D.; Venkatanarayanan, P.S. Thermal, Ablation and Mechanical Properties of Carbon-Phenolic Composites Reinforced with Zirconia Coated Graphene Nanoplatelets. Mater. Res. Express 2018, 5, 014008. [Google Scholar] [CrossRef]
- Jang, B.Z.; Zhamu, A. Processing of Nanographene Platelets (NGPs) and NGP Nanocomposites: A Review. J. Mater. Sci. 2008, 43, 5092–5101. [Google Scholar] [CrossRef]
- Goenka, S.; Sant, V.; Sant, S. Graphene-Based Nanomaterials for Drug Delivery and Tissue Engineering. J. Control. Release 2014, 173, 75–88. [Google Scholar] [CrossRef] [PubMed]
- Moradi, S.E. Highly Efficient Removal of Amoxicillin from Water by Magnetic Graphene Oxide Adsorbent. Chem. Bull. ‘Politeh. Timis. ROMANIA Ser. Chem. Environ. Eng. 2015, 60, 41–48. [Google Scholar]
- Akhavan, O.; Ghaderi, E.; Aghayee, S.; Fereydooni, Y.; Talebi, A. The Use of a Glucose-Reduced Graphene Oxide Suspension for Photothermal Cancer Therapy. J. Mater. Chem. 2012, 22, 13773–13781. [Google Scholar] [CrossRef]
- Ha, H.; Ellison, C.J. Polymer/Graphene Oxide (GO) Thermoset Composites with GO as a Crosslinker. Korean J. Chem. Eng. 2018, 35, 303–317. [Google Scholar]
- Papageorgiou, D.G.; Li, Z.; Liu, M.; Kinloch, I.A.; Young, R.J. Mechanisms of Mechanical Reinforcement by Graphene and Carbon Nanotubes in Polymer Nanocomposites. Nanoscale 2020, 12, 2228–2267. [Google Scholar] [CrossRef]
- Bhattacharya, M. Polymer Nanocomposites-A Comparison between Carbon Nanotubes, Graphene, and Clay as Nanofillers. Materials 2016, 9, 262. [Google Scholar] [CrossRef] [PubMed]
- Zurutuza, A.; Marinelli, C. Challenges and Opportunities in Graphene Commercialization. Nat. Nanotechnol. 2014, 9, 730–734. [Google Scholar] [CrossRef]
- Boaretto, J.; Fotouhi, M.; Tende, E.; Aver, G.F.; Marcon, V.R.R.; Cordeiro, G.L.; Bergmann, C.P.; de Camargo, F.V. Biomimetics and Composite Materials toward Efficient Mobility: A Review. J. Compos. Sci. 2021, 5, 22. [Google Scholar] [CrossRef]
- Qiu, P.; Mao, C. Biomimetic Branched Hollow Fibers Templated by Self-Assembled Fibrous Polyvinylpyrrolidone Structures in Aqueous Solution. ACS Nano 2010, 4, 1573–1579. [Google Scholar] [CrossRef] [PubMed]
- Dikshit, V.; Bhudolia, S.K.; Joshi, S.C. Multiscale Polymer Composites: A Review of the Interlaminar Fracture Toughness Improvement. Fibers 2017, 5, 38. [Google Scholar] [CrossRef]
- Zhu, Y.; Bakis, C.E.; Adair, J.H. Effects of Carbon Nanofiller Functionalization and Distribution on Interlaminar Fracture Toughness of Multi-Scale Reinforced Polymer Composites. Carbon 2012, 50, 1316–1331. [Google Scholar] [CrossRef]
- Ferreira, F.V.; Dufresne, A.; Pinheiro, I.F.; Souza, D.H.S.; Gouveia, R.F.; Mei, L.H.I.; Lona, L.M.F. How Do Cellulose Nanocrystals Affect the Overall Properties of Biodegradable Polymer Nanocomposites: A Comprehensive Review. Eur. Polym. J. 2018, 108, 274–285. [Google Scholar] [CrossRef]
- Azani, N.F.S.M.; Hussin, M.H. Comparison of Cellulose Nanocrystal (CNC) Filler on Chemical, Mechanical, and Corrosion Properties of Epoxy-Zn Protective Coatings for Mild Steel in 3.5% NaCl Solution. Cellulose 2021, 28, 6523–6543. [Google Scholar] [CrossRef]
- Mousavi, S.R.; Nejad, S.F.; Jafari, M.; Paydayesh, A. Polypropylene/Ethylene Propylene Diene Monomer/Cellulose Nanocrystal Ternary Blend Nanocomposites: Effects of Different Parameters on Mechanical, Rheological, and Thermal Properties. Polym. Compos. 2021, 42, 4187–4198. [Google Scholar] [CrossRef]
- Li, Y.; Gong, Q.; Liu, X.; Xia, Z.; Yang, Y.; Chen, C.; Qian, C. Wide Temperature-Tolerant Polyaniline/Cellulose/Polyacrylamide Hydrogels for High-Performance Supercapacitors and Motion Sensors. Carbohydr. Polym. 2021, 267, 118207. [Google Scholar] [CrossRef]
- Cheng, R.; Zeng, J.; Wang, B.; Li, J.; Cheng, Z.; Xu, J.; Gao, W.; Chen, K. Ultralight, Flexible and Conductive Silver Nanowire/Nanofibrillated Cellulose Aerogel for Multifunctional Strain Sensor. Chem. Eng. J. 2021, 424, 130565. [Google Scholar] [CrossRef]
- Ferreira, F.V.; Lona, L.M.F.; Pinheiro, I.F.; de Souza, S.F.; Mei, L.H.I. Polymer Composites Reinforced with Natural Fibers and Nanocellulose in the Automotive Industry: A Short Review. J. Compos. Sci. 2019, 3, 51. [Google Scholar] [CrossRef]
- Sun, Y.; Zhang, Z.; Moon, K.S.; Wong, C.P. Glass Transition and Relaxation Behavior of Epoxy Nanocomposites. J. Polym. Sci. B Polym. Phys. 2004, 42, 3849–3858. [Google Scholar] [CrossRef]
- Jordan, J.; Jacob, K.I.; Tannenbaum, R.; Sharaf, M.A.; Jasiuk, I. Experimental Trends in Polymer Nanocomposites—A Review. Mater. Sci. Eng. A 2005, 393, 1–11. [Google Scholar] [CrossRef]
- Jin, F.-L.; Park, S.-J.; Paik, S.-J. Thermal Stability of Trifunctional Epoxy Resins Modified with Nanosized Calcium Carbonate. Bull. Korean Chem. Soc 2009, 30, 334–338. [Google Scholar]
- Jin, H.; Mangun, C.L.; Stradley, D.S.; Moore, J.S.; Sottos, N.R.; White, S.R. Self-Healing Thermoset Using Encapsulated Epoxy-Amine Healing Chemistry. Polymer 2012, 53, 581–587. [Google Scholar] [CrossRef]
- Jouni, M.; Djurado, D.; Massardier, V.; Boiteux, G. A Representative and Comprehensive Review of the Electrical and Thermal Properties of Polymer Composites with Carbon Nanotube and Other Nanoparticle Fillers. Polym. Int. 2017, 66, 1237–1251. [Google Scholar] [CrossRef]
- Restrepo, I.; Benito, N.; Medinam, C.; Mangalaraja, R.V.; Flores, P.; Rodriguez-Llamazares, S. Development and Characterization of Polyvinyl Alcohol Stabilized Polylactic Acid/ZnO Nanocomposites. Mater. Res. Express 2017, 4, 105019. [Google Scholar] [CrossRef]
- Jiang, S.; Chen, Y.; Duan, G.; Mei, C.; Greiner, A.; Agarwal, S. Electrospun Nanofiber Reinforced Composites: A Review. Polym. Chem. 2018, 9, 2685–2720. [Google Scholar] [CrossRef]
- Zhou, Y.; Lei, L.; Yang, B.; Li, J.; Ren, J. Preparation and Characterization of Polylactic Acid (PLA) Carbon Nanotube Nanocomposites. Polym. Test. 2018, 68, 34–38. [Google Scholar] [CrossRef]
- Blattmann, C.O.; Pratsinis, S.E. Nanoparticle Filler Content and Shape in Polymer Nanocomposites. KONA Powder Part. J. 2019, 36, 3–32. [Google Scholar]
- Fu, S.; Sun, Z.; Huang, P.; Li, Y.; Hu, N. Some Basic Aspects of Polymer Nanocomposites: A Critical Review. Nano Mater. Sci. 2019, 1, 2–30. [Google Scholar] [CrossRef]
- Lepcio, P.; Ondreáš, F.; Zárybnická, K.; Zbončák, M.; Svatík, J.; Jančář, J. Phase Diagram of Bare Particles in Polymer Nanocomposites: Uniting Solution and Melt Blending. Polymer 2021, 230, 124033. [Google Scholar] [CrossRef]
- Sharip, N.S.; Ariffin, H.; Yasim-Anuar, T.A.T.; Andou, Y.; Shirosaki, Y.; Jawaid, M.; Tahir, P.M.; Ibrahim, N.A. Melt-vs. Non-Melt Blending of Complexly Processable Ultra-High Molecular Weight Polyethylene/Cellulose Nanofiber Bionanocomposite. Polymer 2021, 13, 404. [Google Scholar] [CrossRef] [PubMed]
- Wichmann, M.H.G.; Sumfleth, J.; Gojny, F.H.; Quaresimin, M.; Fiedler, B.; Schulte, K. Glass-Fibre-Reinforced Composites with Enhanced Mechanical and Electrical Properties–Benefits and Limitations of a Nanoparticle Modified Matrix. Eng. Fract. Mech. 2006, 73, 2346–2359. [Google Scholar] [CrossRef]
- Bittmann, B.; Haupert, F.; Schlarb, A.K. Ultrasonic Dispersion of Inorganic Nanoparticles in Epoxy Resin. Ultrason Sonochem 2009, 16, 622–628. [Google Scholar] [CrossRef]
- Qian, H.; Greenhalgh, E.S.; Shaffer, M.S.P.; Bismarck, A. Carbon Nanotube-Based Hierarchical Composites: A Review. J. Mater. Chem. 2010, 20, 4751–4762. [Google Scholar] [CrossRef]
- Morselli, D.; Bondioli, F.; Fiorini, M.; Messori, M. Poly(Methyl Methacrylate)-TiO2 Nanocomposites Obtained by Non-Hydrolytic Sol-Gel Synthesis: The Innovative Tert-Butyl Alcohol Route. J. Mater. Sci. 2012, 47, 7003–7012. [Google Scholar] [CrossRef]
- Tang, Y.; Ye, L.; Zhang, Z.; Friedrich, K. Interlaminar Fracture Toughness and CAI Strength of Fibre-Reinforced Composites with Nanoparticles—A Review. Compos. Sci. Technol. 2013, 86, 26–37. [Google Scholar] [CrossRef]
- Zamanian, M.; Mortezaei, M.; Salehnia, B.; Jam, J.E. Fracture Toughness of Epoxy Polymer Modified with Nanosilica Particles: Particle Size Effect. Eng. Fract. Mech. 2013, 97, 193–206. [Google Scholar] [CrossRef]
- Liang, M.; Wong, K.L. Study of Mechanical and Thermal Performances of Epoxy Resin Filled with Micro Particles and Nanoparticles. Energy Procedia 2017, 110, 156–161. [Google Scholar] [CrossRef]
- Mittal, G.; Rhee, K.Y.; Mišković-Stanković, V.; Hui, D. Reinforcements in Multi-Scale Polymer Composites: Processing, Properties, and Applications. Compos. B Eng. 2018, 138, 122–139. [Google Scholar] [CrossRef]
- Harito, C.; Bavykin, D.V.; Yuliarto, B.; Dipojono, H.K.; Walsh, F.C. Polymer Nanocomposites Having a High Filler Content: Synthesis, Structures, Properties, and Applications. Nanoscale 2019, 11, 4653–4682. [Google Scholar] [CrossRef] [PubMed]
- Liu, K.; Macosko, C.W. Can Nanoparticle Toughen Fiber-Reinforced Thermosetting Polymers? J. Mater. Sci. 2019, 54, 4471–4483. [Google Scholar] [CrossRef]
- Di Boon, Y.; Joshi, S.C. A Review of Methods for Improving Interlaminar Interfaces and Fracture Toughness of Laminated Composites. Mater. Today Commun. 2020, 22, 100830. [Google Scholar] [CrossRef]
- Singh, S.K.; Kumar, A.; Jain, A. Mechanical and Viscoelastic Properties of SiO2/Epoxy Nanocomposites Post-Cured at Different Temperatures. Plast. Rubber Compos. 2021, 50, 116–126. [Google Scholar] [CrossRef]
- Lim, J.V.; Bee, S.T.; Sin, L.T.; Ratnam, C.T.; Hamid, Z.A.A. A Review on the Synthesis, Properties, and Utilities of Functionalized Carbon Nanoparticles for Polymer Nanocomposites. Polymers 2021, 13, 3574. [Google Scholar] [CrossRef]
- da Luz, F.S.; da Costa Garcia Filho, F.; del-Río, M.T.G.; Nascimento, L.F.C.; Pinheiro, W.A.; Monteiro, S.N. Graphene-Incorporated Natural Fiber Polymer Composites: A First Overview. Polymers 2020, 12, 1601. [Google Scholar] [CrossRef] [PubMed]
- Rong, M.Z.; Zhang, M.Q.; Ruan, W.H. Surface Modification of Nanoscale Fillers for Improving Properties of Polymer Nanocomposites: A Review. Mater. Sci. Technol. 2006, 22, 787–796. [Google Scholar] [CrossRef]
- Sprenger, S. Epoxy Resin Composites with Surface-Modified Silicon Dioxide Nanoparticles: A Review. J Appl. Polym. Sci. 2013, 130, 1421–1428. [Google Scholar] [CrossRef]
- Kango, S.; Kalia, S.; Celli, A.; Njuguna, J.; Habibi, Y.; Kumar, R. Surface Modification of Inorganic Nanoparticles for Development of Organic-Inorganic Nanocomposites—A Review. Prog. Polym. Sci. 2013, 38, 1232–1261. [Google Scholar] [CrossRef]
- Roy, K.; Jatejarungwong, C.; Potiyaraj, P. Development of Highly Reinforced Maleated Natural Rubber Nanocomposites Based on Sol–Gel-Derived Nano Alumina. J. Appl. Polym. Sci. 2018, 135, 46248. [Google Scholar] [CrossRef]
- Cheon, J.; Kim, M. Impact Resistance and Interlaminar Shear Strength Enhancement of Carbon Fiber Reinforced Thermoplastic Composites by Introducing MWCNT-Anchored Carbon Fiber. Compos. B Eng. 2021, 217, 108872. [Google Scholar] [CrossRef]
- Liang, X.; Li, X.; Tang, Y.; Zhang, X.; Wei, W.; Liu, X. Hyperbranched Epoxy Resin-Grafted Graphene Oxide for Efficient and All-Purpose Epoxy Resin Modification. J. Colloid Interface Sci. 2022, 611, 105–117. [Google Scholar] [CrossRef]
- Meer, S.; Kausar, A.; Iqbal, T. Attributes of Polymer and Silica Nanoparticle Composites: A Review. Polym.-Plast. Technol. Eng. 2016, 55, 826–861. [Google Scholar] [CrossRef]
- Guo, Y.; Bao, C.; Song, L.; Yuan, B.; Hu, Y. In Situ Polymerization of Graphene, Graphite Oxide, and Functionalized Graphite Oxide into Epoxy Resin and Comparison Study of on-the-Flame Behavior. Ind. Eng. Chem. Res. 2011, 50, 7772–7783. [Google Scholar] [CrossRef]
- Roghani-Mamaqani, H.; Haddadi-Asl, V.; Salami-Kalajahi, M. In Situ Controlled Radical Polymerization: A Review on Synthesis of Well-Defined Nanocomposites. Polym. Rev. 2012, 52, 142–188. [Google Scholar] [CrossRef]
- Bhanvase, B.A.; Sonawane, S.H. Ultrasound Assisted in Situ Emulsion Polymerization for Polymer Nanocomposite: A Review. Chem. Eng. Process. Process Intensif. 2014, 85, 86–107. [Google Scholar] [CrossRef]
- Prolongo, S.G.; Díaz-Maroto, C.G.; Jiménez-Suárez, A. Electroactive Shaping and Shape Memory of Sequential Dual-Cured off-Stoichiometric Epoxy/CNT Composites. J. Mater. Res. Technol. 2021, 15, 2970–2981. [Google Scholar] [CrossRef]
- Romero-Zúñiga, G.Y.; Navarro-Rodríguez, D.; Treviño-Martínez, M.E. Enhanced Mechanical Performance of a DGEBA Epoxy Resin-Based Shape Memory Polymer by Introducing Graphene Oxide via Covalent Linking. J. Appl. Polym. Sci. 2022, 139, 51467. [Google Scholar] [CrossRef]
- Morselli, D.; Bondioli, F.; Sangermano, M.; Roppolo, I.; Messori, M. Epoxy Resins Reinforced with TiO2 Generated by Nonhydrolytic Sol-Gel Process. J. Appl. Polym. Sci. 2014, 131, 40470. [Google Scholar] [CrossRef]
- Szeluga, U.; Kumanek, B.; Trzebicka, B. Synergy in Hybrid Polymer/Nanocarbon Composites. A Review. Compos. Part A Appl. Sci. Manuf. 2015, 73, 204–231. [Google Scholar] [CrossRef]
- Kumar, D.; Babu, G.; Krishnan, S. Study on Mechanical & Thermal Properties of PCL Blended Graphene Biocomposites. Polimeros 2019, 29, e2019024. [Google Scholar] [CrossRef]
- Al-Turaif, H.A. Effect of Nano TiO2 Particle Size on Mechanical Properties of Cured Epoxy Resin. Prog. Org. Coat. 2010, 69, 241–246. [Google Scholar] [CrossRef]
- Abass, B.A.; Hunain, M.B.; Khudair, J.M.A. Effects of Titanium Dioxide Nanoparticles on the Mechanical Strength of Epoxy Hybrid Composite Materials Reinforced with Unidirectional Carbon and Glass Fibers. IOP Conf. Ser. Mater. Sci. Eng. 2021, 1094, 012159. [Google Scholar] [CrossRef]
- Choi, Y.M.; Hwangbo, S.A.; Lee, T.G.; Ham, Y.B. Effect of Particle Size on the Mechanical Properties of TiO2–Epoxy Nanocomposites. Materials 2021, 14, 2866. [Google Scholar] [CrossRef]
- Pulikkottil, E.J. The Effect of Nano TiO2 Filler Weight on the Mechanical Properties of Chopped Strand Mat Reinforced Epoxy Composite. Int. J. Res. 2019, VIII, 1115–1124. [Google Scholar]
- Yildirim, F.; Aydin, M.; Avci, A. Mechanical Properties of Nano-SiO2 Reinforced 3D Glass Fiber/Epoxy Composites. Int. J. Mater. Res. 2017, 108, 308–321. [Google Scholar] [CrossRef]
- Lazar, P.J.L.; Sengottuvelu, R.; Natarajan, E. Assessments of Secondary Reinforcement of Epoxy Matrix-Glass Fibre Composite Laminates through Nanosilica (SiO2). Materials 2018, 11, 2186. [Google Scholar] [CrossRef] [PubMed]
- Zheng, J.; Zhang, X.; Cao, J.; Chen, R.; Aziz, T.; Fan, H.; Bittencourt, C. Behavior of Epoxy Resin Filled with Nano-SiO2 Treated with a Eugenol Epoxy Silane. J. Appl. Polym. Sci. 2021, 138, 50138. [Google Scholar] [CrossRef]
- Singh, S.K.; Singh, D.; Kumar, A.; Jain, A. An Analysis of Mechanical and Viscoelastic Behaviour of Nano-SiO2 Dispersed Epoxy Composites. Silicon 2019, 12, 2465–2477. [Google Scholar] [CrossRef]
- Suresha, B.; Divya, G.S.; Hemanth, G.; Somashekar, H.M. Physico-Mechanical Properties of Nano Silica-Filled Epoxy-Based Mono and Hybrid Composites for Structural Applications. Silicon 2021, 13, 2319–2335. [Google Scholar] [CrossRef]
- Li, W.; Dichiara, A.; Bai, J. Carbon Nanotube-Graphene Nanoplatelet Hybrids as High-Performance Multifunctional Reinforcements in Epoxy Composites. Compos. Sci. Technol. 2013, 74, 221–227. [Google Scholar] [CrossRef]
- Yan, L.; Zhou, Y.; Zhang, X.; Zou, H.; Chen, Y.; Liang, M. Effect of Graphene Oxide with Different Exfoliation Levels on the Mechanical Properties of Epoxy Nanocomposites. Polym. Bull. 2019, 76, 6033–6047. [Google Scholar] [CrossRef]
- Eqra, R.; Moghim, M.H.; Eqra, N. A Study on the Mechanical Properties of Graphene Oxide/Epoxy Nanocomposites. Polym. Polym. Compos. 2021, 29, S556–S564. [Google Scholar] [CrossRef]
- Bortz, D.R.; Heras, E.G.; Martin-Gullon, I. Impressive Fatigue Life and Fracture Toughness Improvements in Graphene Oxide/Epoxy Composites. Macromolecules 2012, 45, 238–245. [Google Scholar] [CrossRef]
- Shen, M.Y.; Chang, T.Y.; Hsieh, T.H.; Li, Y.L.; Chiang, C.L.; Yang, H.; Yip, M.C. Mechanical Properties and Tensile Fatigue of Graphene Nanoplatelets Reinforced Polymer Nanocomposites. J. Nanomater. 2013, 2013, 565401. [Google Scholar] [CrossRef]
- Rajabi, L.; Mohammadi, Z.; Derakhshan, A.A. Thermal Stability and Dynamic Mechanical Properties of Nano and Micron-TiO2 Particles Reinforced Epoxy Composites: Effect of Mixing Method. Iran. J. Chem. Eng. 2013, 10, 16–29. [Google Scholar]
- Shen, M.Y.; Liao, W.Y.; Wang, T.Q.; Lai, W.M. Characteristics and Mechanical Properties of Graphene Nanoplatelets-Reinforced Epoxy Nanocomposites: Comparison of Different Dispersal Mechanisms. Sustainability 2021, 13, 1788. [Google Scholar] [CrossRef]
- Ahn, S.-H.; Nam, K.-W.; Moon, C.-K. Mechanical Properties of TiO2/Epoxy Resin Nanocomposites. J. Power Syst. Eng. 2013, 17, 69–77. [Google Scholar] [CrossRef]
- Kumar, K.; Ghosh, P.K.; Kumar, A. Improving Mechanical and Thermal Properties of TiO2-Epoxy Nanocomposite. Compos. B Eng. 2016, 97, 353–360. [Google Scholar] [CrossRef]
- Singh, S.K.; Singh, S.; Kumar, A.; Jain, A. Thermo-Mechanical Behavior of TiO2 Dispersed Epoxy Composites. Eng. Fract. Mech. 2017, 184, 241–248. [Google Scholar] [CrossRef]
- Rankin, S.M.; Moody, M.K.; Naskar, A.K.; Bowland, C.C. Enhancing Functionalities in Carbon Fiber Composites by Titanium Dioxide Nanoparticles. Compos. Sci. Technol. 2021, 201, 108491. [Google Scholar] [CrossRef]
- Yao, X.F.; Yeh, H.Y.; Zhou, D.; Zhang, Y.H. The Structural Characterization and Properties of SiO2-Epoxy Nanocomposites. J. Compos. Mater. 2006, 40, 371–381. [Google Scholar] [CrossRef]
- Bi, Y.T.; Li, Z.J.; Liang, W. Preparation and Characterization of Epoxy/SiO2 Nanocomposites by Cationic Photopolymerization and Sol-Gel Process. Polym. Adv. Technol. 2014, 25, 173–178. [Google Scholar] [CrossRef]
- Liang, H.; Yao, X.; Liu, X.; Huang, Z. The Effect of Powder Bed on the Liquid Phase Sintering of α-SiC. Mater. Des. (1980–2015) 2014, 56, 1009–1013. [Google Scholar] [CrossRef]
- Zheng, W.; Chen, W.G.; Zhao, Q.; Ren, S.X.; Fu, Y.Q. Interfacial Structures and Mechanisms for Strengthening and Enhanced Conductivity of Graphene/Epoxy Nanocomposites. Polymer 2019, 163, 171–177. [Google Scholar] [CrossRef]
- Liu, Q.; Zhou, X.; Fan, X.; Zhu, C.; Yao, X.; Liu, Z. Mechanical and Thermal Properties of Epoxy Resin Nanocomposites Reinforced with Graphene Oxide. Polym.-Plast. Technol. Eng. 2012, 51, 251–256. [Google Scholar] [CrossRef]
- Adak, N.C.; Chhetri, S.; Kim, N.H.; Murmu, N.C.; Samanta, P.; Kuila, T. Static and Dynamic Mechanical Properties of Graphene Oxide-Incorporated Woven Carbon Fiber/Epoxy Composite. J. Mater. Eng. Perform. 2018, 27, 1138–1147. [Google Scholar] [CrossRef]
- Ashori, A.; Ghiyasi, M.; Fallah, A. Glass Fiber-Reinforced Epoxy Composite with Surface-Modified Graphene Oxide: Enhancement of Interlaminar Fracture Toughness and Thermo-Mechanical Performance. Polym. Bull. 2019, 76, 259–270. [Google Scholar] [CrossRef]
- Yu, S.; Wei, D.; Shi, L.; Ai, Y.; Zhang, P.; Wang, X. Three-Dimensional Graphene/Titanium Dioxide Composite for Enhanced U(VI) Capture: Insights from Batch Experiments, XPS Spectroscopy and DFT Calculation. Environ. Pollut. 2019, 251, 975–983. [Google Scholar] [CrossRef] [PubMed]
- Jayan, J.S.; Saritha, A.; Deeraj, B.D.S.; Joseph, K. Graphene Oxide as a Prospective Graft in Polyethylene Glycol for Enhancing the Toughness of Epoxy Nanocomposites. Polym. Eng. Sci. 2020, 60, 773–781. [Google Scholar] [CrossRef]
- Wang, Q.; Wang, J.; Lu, C.; Liu, B.; Zhang, K.; Li, C. Influence of Graphene Oxide Additions on the Microstructure and Mechanical Strength of Cement. New Carbon Mater. 2015, 30, 349–356. [Google Scholar] [CrossRef]
- Wei, J.; Atif, R.; Vo, T.; Inam, F. Graphene Nanoplatelets in Epoxy System: Dispersion, Reaggregation, and Mechanical Properties of Nanocomposites. J. Nanomater. 2015, 2015, 374. [Google Scholar] [CrossRef]
- Lavoratti, A.; Zattera, A.J.; Amico, S.C. Mechanical and Dynamic-Mechanical Properties of Silane-Treated Graphite Nanoplatelet/Epoxy Composites. J. Appl. Polym. Sci. 2018, 135, 46724. [Google Scholar] [CrossRef]
- Kamaraj, M.; Dodson, E.A.; Datta, S. Thermal and Viscoelastic Behaviour of Graphene Nanoplatelets/Flax Fibre/Epoxy Composites. Plast. Rubber Compos. 2021, 50, 219–227. [Google Scholar] [CrossRef]
- Ulus, H. The impact of seawater aging on basalt/graphene nanoplatelet-epoxy composites: Performance evaluating by Dynamic Mechanical Analysis (DMA) and short beam shear (sbs) tests. NOHU J. Eng. Sci. 2021, 10, 412–419. [Google Scholar] [CrossRef]
- German, R.M.; Park, S.J. Handbook of Mathematical Relations in Particulate Materials Processing: Ceramics, Powder Metals, Cermets, Carbides, Hard Materials, and Minerals; John Wiley & Sons, Inc.: Hoboken, NJ, USA, 2009. [Google Scholar]
- MacÉ, T.; Vaslin-Reimann, S.; Ausset, P.; Maillé, M. Characterization of Manufactured TiO2 Nanoparticles. J. Phys. Conf. Ser. 2013, 429, 012012. [Google Scholar]
- Safdari, M.; Al-Haik, M.S. A Review on Polymeric Nanocomposites: Effect of Hybridization and Synergy on Electrical Properties. In Carbon-Based Polymer Nanocomposites for Environmental and Energy Applications; Elsevier Inc.: Amsterdam, The Netherlands, 2018; pp. 113–146. ISBN 9780128135754. [Google Scholar]
- Gimenes Benega, M.A.; Silva, W.M.; Schnitzler, M.C.; Espanhol Andrade, R.J.; Ribeiro, H. Improvements in Thermal and Mechanical Properties of Composites Based on Epoxy-Carbon Nanomaterials—A Brief Landscape. Polym. Test. 2021, 98, 107180. [Google Scholar] [CrossRef]
- Krishnan, M.R.; Alsharaeh, E. A Review on Polymer Nanocomposites Based High-Performance Functional Materials. 2022. Available online: https://ssrn.com/abstract=4222854 (accessed on 4 November 2022).
- Białkowska, A.; Bakar, M.; Kucharczyk, W.; Zarzyka, I. Hybrid Epoxy Nanocomposites: Improvement in Mechanical Properties and Toughening Mechanisms—A Review. Polymers 2023, 15, 1398. [Google Scholar] [CrossRef]
- Zaman, I.; Nor, F.M.; Manshoor, B.; Khalid, A.; Araby, S. Influence of Interface on Epoxy/Clay Nanocomposites: 2. Mechanical and Thermal Dynamic Properties. Procedia Manuf. 2015, 2, 23–27. [Google Scholar] [CrossRef]
- Das, S.; Halder, S.; Paul, B.; Khan, N.I.; Goyat, M.S. Impact of Silanized Milled Graphite Nanoparticles on Thermo-Mechanical Properties of Epoxy Nanocomposite. Mater. Chem. Phys. 2022, 278, 125601. [Google Scholar] [CrossRef]
- Ahmad, M.A.A.; Ridzuan, M.J.M.; Majid, M.S.A.; Cheng, E.M.; Sulaiman, M.H. Dynamic Mechanical Analysis of Graphene Nanoplatelets/Glass Reinforced Epoxy Composite. J. Phys. Conf. Ser. 2021, 2051, 012046. [Google Scholar] [CrossRef]
- Baghdadi, Y.N.; Youssef, L.; Bouhadir, K.; Harb, M.; Mustapha, S.; Patra, D.; Tehrani-Bagha, A.R. Thermal and Mechanical Properties of Epoxy Resin Reinforced with Modified Iron Oxide Nanoparticles. J. Appl. Polym. Sci. 2021, 138, 50533. [Google Scholar] [CrossRef]
- Karthik, K.; Rajamani, D.; Venkatesan, E.P.; Shajahan, M.I.; Rajhi, A.A.; Aabid, A.; Baig, M.; Saleh, B. Experimental Investigation of the Mechanical Properties of Carbon/Basalt/SiC Nanoparticle/Polyester Hybrid Composite Materials. Crystals 2023, 13, 415. [Google Scholar] [CrossRef]
- Pan, S.; Feng, J.; Safaei, B.; Qin, Z.; Chu, F.; Hui, D. A Comparative Experimental Study on Damping Properties of Epoxy Nanocomposite Beams Reinforced with Carbon Nanotubes and Graphene Nanoplatelets. Nanotechnol. Rev. 2022, 11, 1658–1669. [Google Scholar] [CrossRef]
- Wu, S.; Sikdar, P.; Bhat, G.S. Recent Progress in Developing Ballistic and Anti-Impact Materials: Nanotechnology and Main Approaches. Def. Technol. 2023, 21, 33–61. [Google Scholar] [CrossRef]
- Shukla, P.; Saxena, P. Polymer Nanocomposites in Sensor Applications: A Review on Present Trends and Future Scope. Chinese J. Polym. Sci. Engl. Ed. 2021, 39, 665–691. [Google Scholar] [CrossRef]
- Agboola, O.; Fayomi, O.S.I.; Ayodeji, A.; Ayeni, A.O.; Alagbe, E.E.; Sanni, S.E.; Okoro, E.E.; Moropeng, L.; Sadiku, R.; Kupolati, K.W.; et al. A Review on Polymer Nanocomposites and Their Effective Applications in Membranes and Adsorbents for Water Treatment and Gas Separation. Membranes 2021, 11, 139. [Google Scholar] [CrossRef] [PubMed]
- Jadoun, S.; Chauhan, N.P.S.; Chinnam, S.; Aepuru, R.; Sathish, M.; Chundawat, N.S.; Rahdar, A. A Short Review on Conducting Polymer Nanocomposites. Biomed. Mater. Devices 2022. [Google Scholar] [CrossRef]
- Hojatzadeh, S.; Rahimpour, F.; Sharifzadeh, E. A Study on the Synergetic Effects of Self/Induced Crystallization and Nanoparticles on the Mechanical Properties of Semi-Crystalline Polymer Nanocomposites: Experimental and Analytical Approaches. Iran. Polym. J. Engl. Ed. 2023, 32, 543–555. [Google Scholar] [CrossRef]
- Parente, J.M.; Simões, R.; Reis, P.N.B. Effect of Graphene Nanoparticles on Suspension Viscosity and Mechanical Properties of Epoxy-Based Nanocomposites. Procedia Struct. Integr. 2022, 37, 820–825. [Google Scholar] [CrossRef]
- Lapčík, L.; Sepetcioǧlu, H.; Murtaja, Y.; Lapčíková, B.; Vašina, M.; Ovsík, M.; Staněk, M.; Gautam, S. Study of Mechanical Properties of Epoxy/Graphene and Epoxy/Halloysite Nanocomposites. Nanotechnol. Rev. 2023, 12, 20220520. [Google Scholar] [CrossRef]
- Di, C.; Yu, J.; Wang, B.; Lau, A.K.T.; Zhu, B.; Qiao, K. Study of Hybrid Nanoparticles Modified Epoxy Resin Used in Filament Winding Composite. Materials 2019, 12, 3853. [Google Scholar] [CrossRef]
- El-Masry, M.M.; Ramadan, R.; Ahmed, M.K. The Effect of Adding Cobalt Ferrite Nanoparticles on the Mechanical Properties of Epoxy Resin. Results Mater. 2020, 8, 100160. [Google Scholar] [CrossRef]
- Govindaraj, P.; Fox, B.; Aitchison, P.; Hameed, N. A Review on Graphene Polymer Nanocomposites in Harsh Operating Conditions. Ind. Eng. Chem. Res. 2019, 58, 17106–17129. [Google Scholar] [CrossRef]
- Shameem, M.M.; Sasikanth, S.M.; Annamalai, R.; Raman, R.G. A Brief Review on Polymer Nanocomposites and Its Applications. Mater. Today Proc. 2021, 45, 2536–2539. [Google Scholar] [CrossRef]


| Dispersion Method | Nanoparticles | ΔTg (%) | Composites Preparation Remarks | Reference | ||
|---|---|---|---|---|---|---|
| Type | Size (nm) | Content (wt.%) | ||||
| Physical: Melt-blending processing | SiC | <100 | 10 | 6 | Prepared at 80 °C by 60 min stirring and 30 min sonication. Tg: DMA (1 Hz, 35–250 °C, 5 °C/min). | [62] |
| CaCO3 | 40–70 | 6 | 0 | Prepared at 80 °C by 60 min stirring and sonication. Tg: DMA (1 Hz, 30–300 °C, 5 °C/min). | [61] | |
| SiO2 | 100 | 5 | 5 | Prepared at an elevated temperature by 30 min sonication. Tg: DSC (25–200 °C, 5 °C/min). | [59] | |
| CB a | 30 | 2 | 2 | Prepared at an elevated temperature by 5 min sonication. Tg: DSC (25–200 °C, 5 °C/min). | [59] | |
| Physical: Mechanical-aided solvent processing | ZrO2 | 45 | 6 | 11 | Prepared in butanone with 10 min of stirring and 60 min sonication. Tg: DMA (1 Hz, 28–100 °C, 2 °C/min). | [82] |
| Al2O3 | 80 | 1 | 21 | Prepared in liquid resin by high-speed mixing. Tg: DMA (1 Hz, 40–130 °C, 2 °C/min). | [77] | |
| SiO2 | 12 | 6 | 0 | Prepared in acetone by mechanical mixing and sonication. Tg: DMA (1 Hz, 20–175 °C). | [76] | |
| TiO2 | <10 | 3 | 21 | Prepared in benzyl alcohol by 5 min high-speed mixing and 5 min sonication. Tg: DMTA. | [74] | |
| Chemical: Covalent bonding through particle functionalization | SiO2 | 7 | 7 | 15 | Prepared by covalent bonding between functionalized SiO2 and resin by 10 min mixing and 30 min sonication. Tg: DMA (1 Hz, 25–200 °C, 5 °C/min). | [89] |
| GO | n/a | 0.5 | 5 | Prepared by covalent bonding between functionalized GO and resin by 30 min mixing. Tg: DMA. | [90] | |
| TiO2 | 25 | 5 | 43 | Prepared by covalent bonding between functionalized TiO2 and resin by 15 min stirring. Tg: DSC (N2 atmosphere, 20–200 °C, 10 °C/min). | [22] | |
| CNT b | d: 30 nm L: 15 µm | 0.5 | 34 | Prepared by covalent bonding between functionalized CNT and resin by 60 min stirring. Tg: DSC. | [88] | |
| Chemical: In situ matrix formation in a particle suspension | CNT | d: 9.5 nm L: 1.5 µm | 0.2 | 27 | Prepared by in situ polymer formation in a CNT suspension. Tg: DMTA (1 Hz, 25–200 °C, 2 °C/min). | [95] |
| GO | n/a | 0.5 | 40 | Prepared by in situ polymer formation in a GO suspension. Tg: DMA (1 Hz, 5 °C/min). | [96] | |
| TiO2 | <25 | 7.6 | 25 | Prepared by in situ polymer formation in a TiO2 suspension. Tg: DMTA (1 Hz, 5 °C/min). | [97] | |
| rGO c | n/a | 1 | 0 | Prepared by in situ polymer formation in a rGO suspension. Tg: DSC. | [92] | |
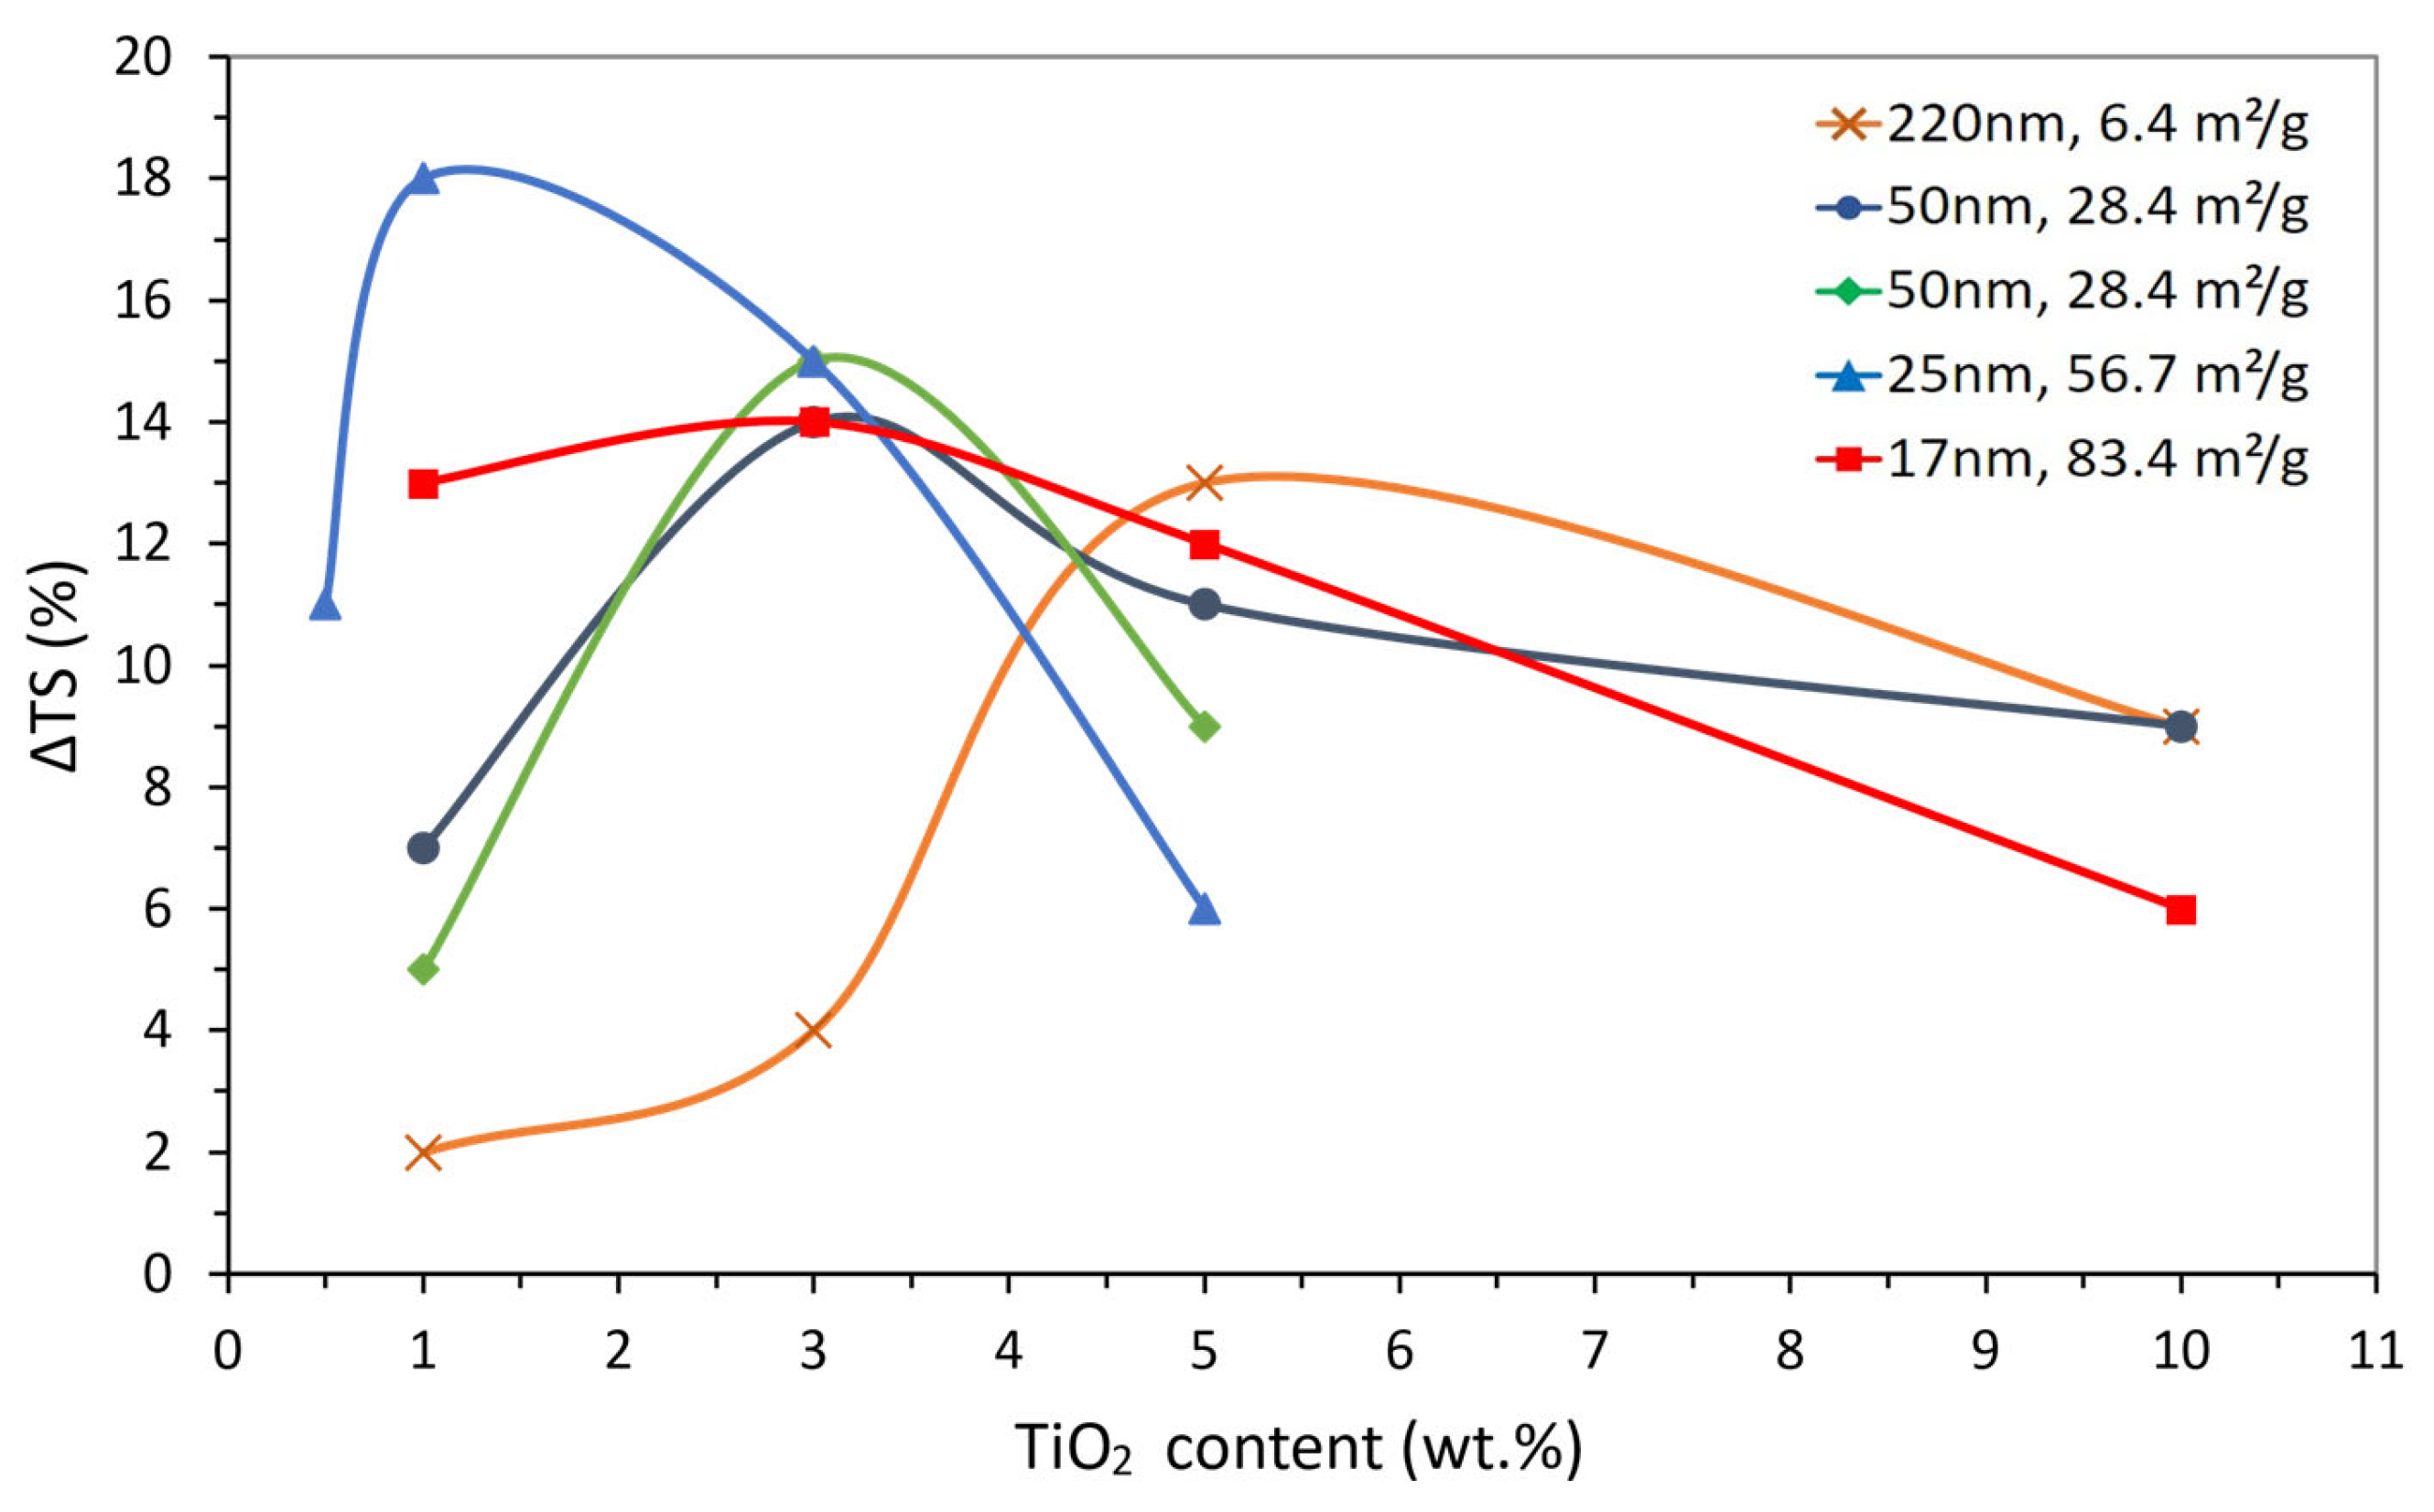
| Type | Size (nm) | Content (wt.%) | ΔTS (%) | Reference |
|---|---|---|---|---|
| TiO2 | 220 | 1; 3; 5; 10 | 2; 4; 13; 9 | [100] |
| 190 | 2; 4; 6; 8; 10 | 45; 62; 31; 14; 7 | [100] | |
| 50 | 1; 3; 5; 10 | 7; 14; 11; 9 | [100] | |
| 50 | 1; 3; 5 | 5; 15; 9 | [101] | |
| 25 | 0.5; 1; 3; 5 | 11; 18; 15; 6 | [102] | |
| 17 | 1; 3; 5; 10 | 13; 14; 12; 6 | [100] | |
| 15 | 1; 2; 3; 4; 5; 6 | 51; 71; 19; 11; 7; 21 | [103] | |
| SiO2 | 30 | 0.5; 1; 2; 3 | 4; 9; 11; 0 | [104] |
| 17 | 0.5; 0.75; 1; 3 | 12; 42; −6; −14 | [105] | |
| 15 | 2; 4; 6; 8 | 14; 27; 10; 6 | [82] | |
| 15 | 1; 2; 3; 4; 5 | 9; 13; 117; −14; 14 | [106] | |
| 15 | 2; 4; 6; 8 | 15; 29; 3; −12 | [107] | |
| 15 | 0.5; 1; 1.5; 3; 5 | 1; 24; 26; 31; 27 | [108] | |
| GO * | 500 T: 1.2 nm | 0.1; 0.2; 0.5; 1 | 7; 9; 11; 15 | [109] |
| 500 T: 1.2 nm | 0.1; 0.2; 0.5; 1 | 3; 4; 7; −6 | [109] | |
| 1.5 × 10³ T: 2.8 nm | 0.025; 0.05; 0.1; 0.2 | 2; 10; 19; 14 | [110] | |
| 1.5 × 10³ T: 3.5 nm | 0.025; 0.05; 0.1; 0.2 | 20; 29; 17; 5 | [110] | |
| 3.0 × 10³ T: 1.2 nm | 0.1; 0.3; 0.5; 0.7; 1 | 3; 2; 12; 6; 4; 2 | [111] | |
| 5.0 × 10³ T: 4.0 nm | 0.1; 0.25; 0.5; 1 | 11; 11; 13; −1;5 | [112] | |
| GNP * | 5.0 × 10³ T: 25 nm | 0.25; 0.5; 1; 1.5 | 20; 11; 1; −6 | [113] |
| 5.0 × 10³ T: 25 nm | 0.1; 0.25; 0.5; 1 | 5; 13; 10; 2; 7 | [114] | |
| 5.0 × 10³ T: 25 nm | 0.1; 0.25; 0.5; 1 | −1; −13; −8; 0 | [115] | |
| 5.0 × 10³ T: 25 nm | 0.1; 0.25; 0.5; 1 | 0; 20; 11; 1 | [115] |
| Type | Properties (%) | Reference | ||||
|---|---|---|---|---|---|---|
| Size (nm) | Content (wt.%) | ΔE’ | Δtan δ | ΔTg | ||
| TiO2 | 250 | 1; 3; 5 | 20; 52; 40 | Unchanged | −1 | [116] |
| 21 | 1; 2.5; 5; 7.5; 10 | −15; 4; 8; 12; −35 | 110; 80; 60; 70; 30 | 19; 18; 24; 19; 18 | [114] | |
| 30–40 | 5; 10; 15 | 18; 30; −10 | −7; 7; −9 | −3; 11; 3 | [117] | |
| 32 | 2; 4; 6; 8 | 9; 21; 22; 15 | −6; −5; −9; −5 | 9; 14; 19; 16 | [118] | |
| 17 | 0.2; 0.4; 0.6 | 25; 31; 45 | 6; −4; −3 | −3; 2; 3 | [13] | |
| 30 | 0.1; 0.5; 1; 1.5; 2; 2.5; 3; 3.5; 4 | not reported | 215; 115; 138; 246; 123; 246; 85; 77; 119 | −11; −5; −7; −7 | [117,119] | |
| SiO2 | 90 | 1; 3; 5; 7 | 8; 23; 15; 15 | 2; −9; −2; 12 | 1; 2; 0; −8 | [120] |
| 40 | 1; 3; 5 | 8; 14; 44 | 30; 43; 22 | 32; 36; 41 | [121] | |
| 70 | 0.5; 2; 5 | not reported | −14; −27; −28 | 7; 16; 16 | [122] | |
| 40 | 1; 2; 3; 4; 5; 6; 7; 8 | 5; 8; 14; 14; 17; 11; 1; −20 | −10; −9; 0; 3; 0; −9; −17; −19 | 7; 10; 10; 12; 0; 7; 0; 1 | [85] | |
| 15 | 1; 2; 4 | not reported | −15; −16; −21 | 3; 3; 3 | [123] | |
| GO * | 1.3 × 10³ T: 1 nm | 0.1; 0.5; 1; 1.5 | 30; 35; 35; 39 | 10; −7; −11; −21 | −1; −1; −3; −11 | [124] |
| W: 5 µm L: 25 µm T: 1.7 nm | 0.05; 0.1; 0.2; 0.4 | 6; 6; 56; 44 | 13; 20; 22; 9 | 1; 0; 13; 5 | [125] | |
| 20 × 103 T: 9 nm | 0.1; 0.25; 0.5 | not reported | −15; −15; −11 | 5; 6; 5 | [126] | |
| 20 × 103 T: 11 nm | 0.1; 0.25; 0.5 | not reported | −16; −11; −22 | 6; 5; 7 | [126] | |
| 2.5 × 10³ T: 12.3 nm | 0.4; 0.8; 1.2 | 25; 81; 53 | −7; −16; −7 | 5; 9; 6 | [127] | |
| 12 × 103 T: 12 nm | 0.1; 0.3; 0.5 | 54; 48; 46 | 100; 77; 110 | 18; 15; 3 | [128] | |
| GNP * | 5 × 10³ T: 10 nm | 1; 3; 5 | 2; 7; 16 | −2; −7; −10 | 1; 1; 2 | [129] |
| 4.5 × 10³ T: 12 µm | 0.1; 0.3; 0.5; 1 | 24; 30; 18; 12 | −7; −12; −14; −12 | 4; 6; 5; 4 | [130] | |
| 25 × 103 T: 6–8 nm | 0.1; 0.25; 0.5; 1 | not reported | 5; −9; −35; −25 | 1; 4; 7; 1 | [131] | |
| 4.5 × 10³ T: 12 nm | 0.025; 0.1; 0.2 | 6; 18; 13 | −26; −50; −38 | 6; 19; 15 | [132] | |
| 5 × 10³ T: 6 nm | 0.1; 0.3; 0.5; 0.7 | 8; 10; 25; −9 | −5; −9; −18; −15 | 2; 4; 5; 3 | [133] | |
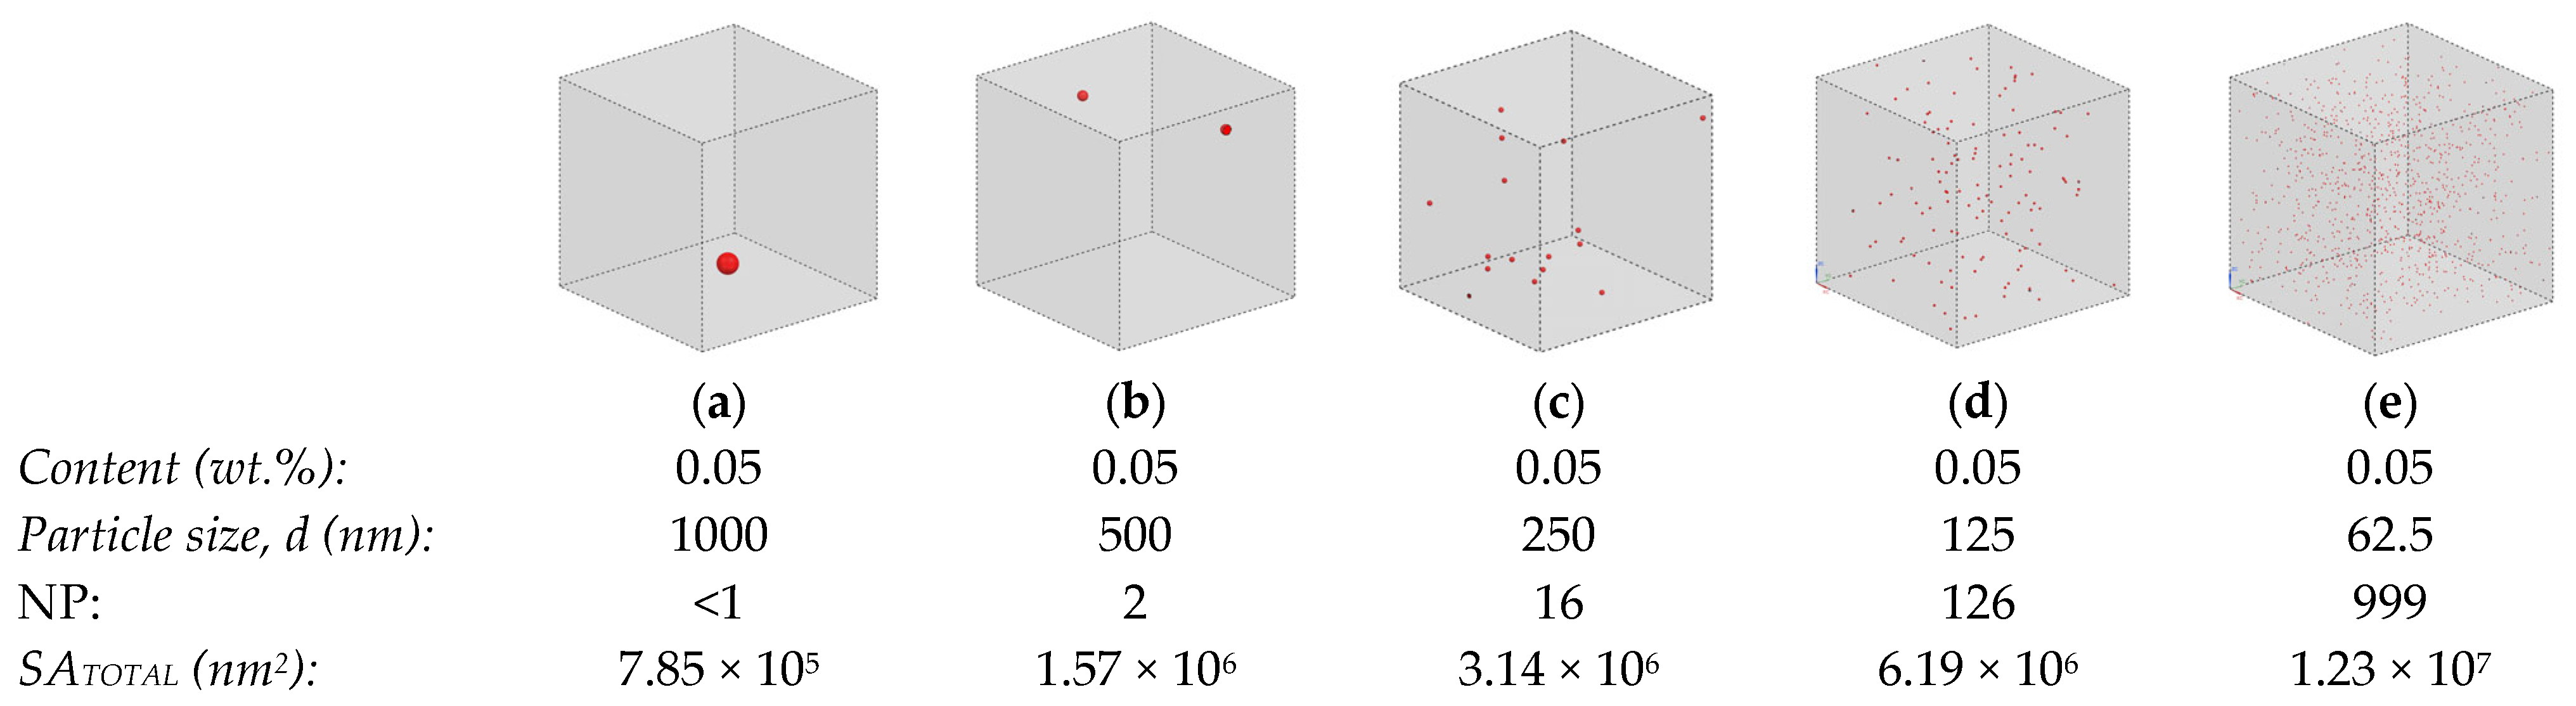
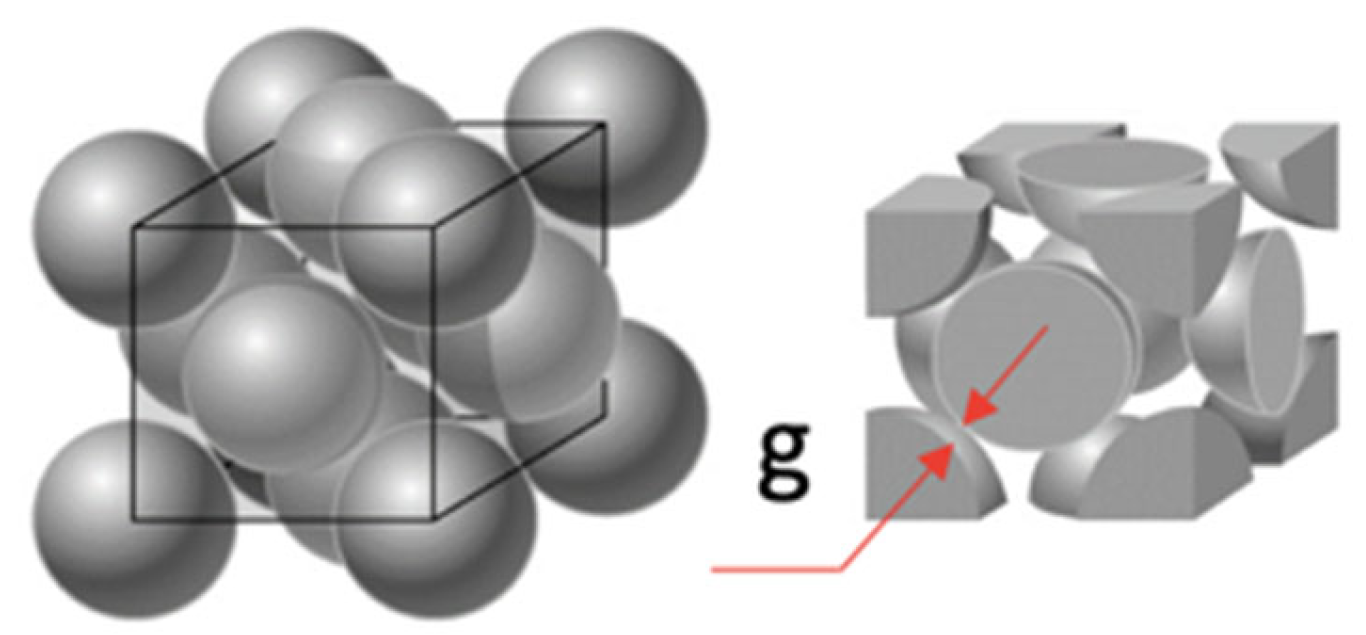
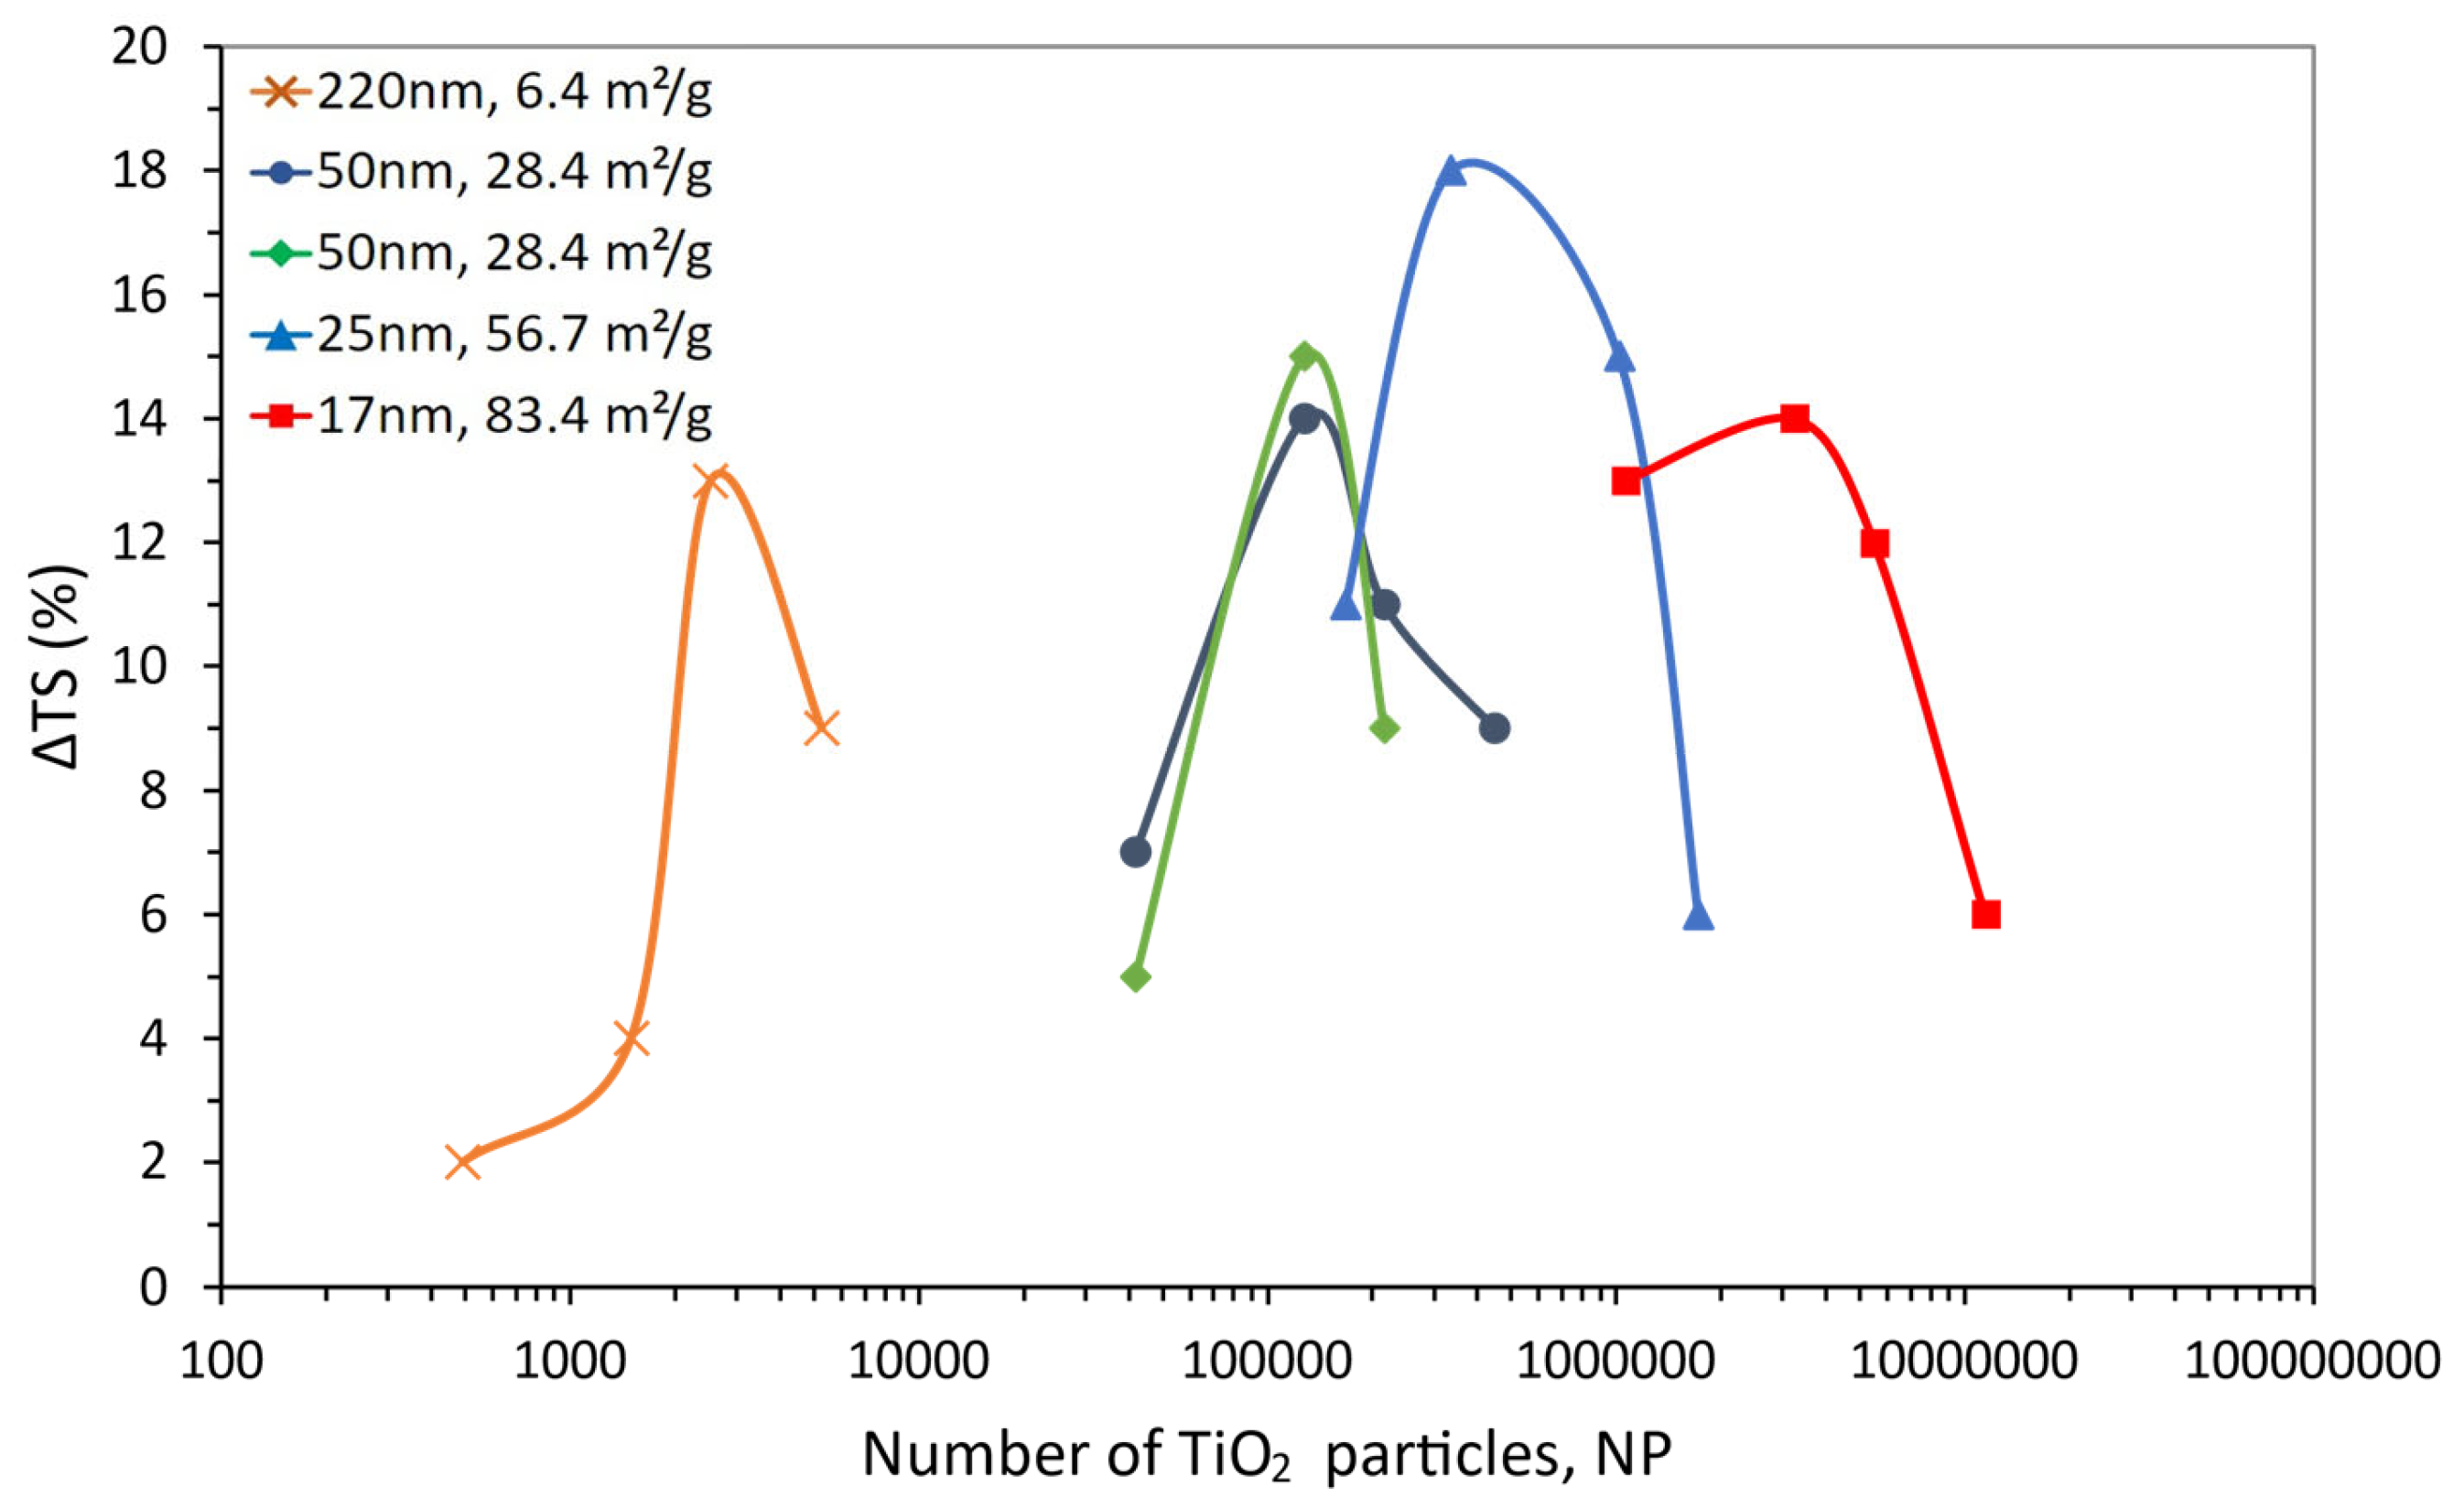
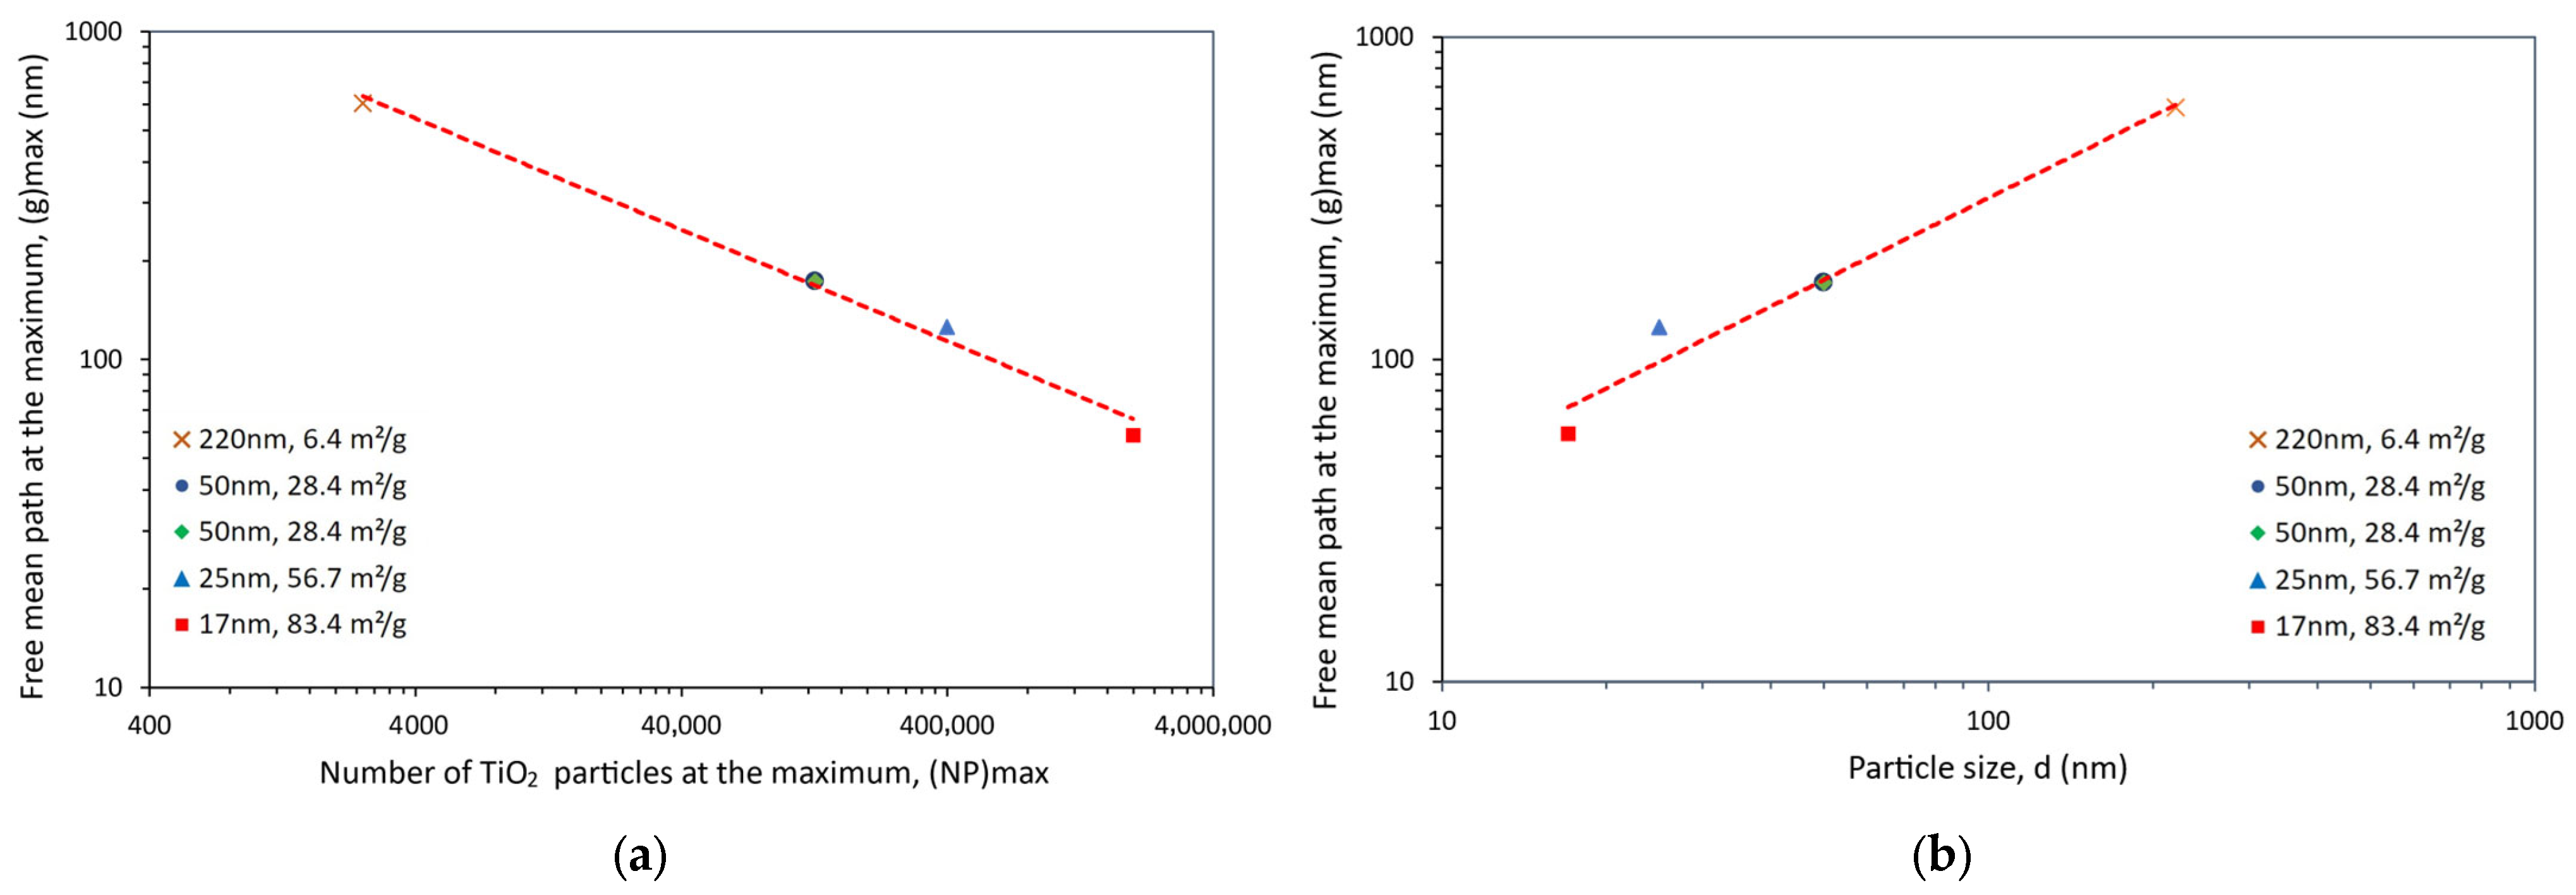
| Size (nm) | Content (wt.%) | ΔTS (%) | NP | g (nm) | SSA (m2/g) | Reference |
|---|---|---|---|---|---|---|
| 220 | 1 | 2 | 4.95 × 10² | 1159 | 6.4 | [100] |
| 3 | 4 | 2.34 × 10³ | 731 | |||
| 5 | 13 | 3.96 × 10³ | 578 | |||
| 10 | 9 | 4.52 × 10⁵ | 406 | |||
| 50 | 1 | 7 | 4.95 × 10² | 263 | 28.4 | [100] |
| 3 | 14 | 2.34 × 10³ | 166 | |||
| 5 | 11 | 3.96 × 10³ | 131 | |||
| 10 | 9 | 4.52 × 10⁵ | 92 | |||
| 50 | 1 | 5 | 1.07 × 10⁶ | 263 | 28.4 | [101] |
| 3 | 15 | 4.76 × 10⁶ | 166 | |||
| 5 | 9 | 8.05 × 10⁶ | 131 | |||
| 25 | 0.5 | 11 | 7.79 × 10⁵ | 173 | 56.7 | [102] |
| 1 | 18 | 1.56 × 10⁶ | 132 | |||
| 3 | 15 | 4.76 × 10⁶ | 83 | |||
| 5 | 6 | 8.05 × 10⁶ | 66 | |||
| 17 | 1 | 13 | 4.95 × 10² | 90 | 83.4 | [100] |
| 3 | 14 | 1.51 × 10³ | 57 | |||
| 5 | 12 | 3.96 × 10³ | 45 | |||
| 10 | 6 | 4.52 × 10⁵ | 31 |
| Size (nm) | ΔE’ (%) | ΔTg (%) | Content (wt.%) | NP | g (nm) | SSA (m2/g) | Reference |
|---|---|---|---|---|---|---|---|
| 250 | 20 | −1 | 1 | 3.38 × 10² | 1317 | [116] | |
| 52 | −1 | 3 | 1.03 × 10³ | 831 | 5.7 | ||
| 40 | −1 | 5 | 1.74 × 10³ | 657 | |||
| 40 | 18 | −3 | 5 | 4.25 × 10⁵ | 105 | [117] | |
| 30 | 11 | 10 | 8.82 × 10⁵ | 74 | 35.5 | ||
| −10 | 3 | 15 | 1.38 × 10⁶ | 58 | |||
| 32 | 9 | 9 | 2 | 3.24 × 10⁵ | 127 | 44.3 | [118] |
| 21 | 14 | 4 | 6.58 × 10⁵ | 93 | |||
| 22 | 19 | 6 | 1.00 × 10⁶ | 77 | |||
| 15 | 16 | 8 | 1.36 × 10⁶ | 67 | |||
| 21 | −15 | 19 | 1 | 5.70 × 10⁵ | 111 | [114] | |
| 4 | 18 | 2.5 | 1.44 × 10⁶ | 76 | |||
| 8 | 24 | 5 | 2.93 × 10⁶ | 55 | 67.5 | ||
| 12 | 19 | 7.5 | 4.49 × 10⁶ | 45 | |||
| −35 | 18 | 10 | 6.10 × 10⁶ | 39 |
Disclaimer/Publisher’s Note: The statements, opinions and data contained in all publications are solely those of the individual author(s) and contributor(s) and not of MDPI and/or the editor(s). MDPI and/or the editor(s) disclaim responsibility for any injury to people or property resulting from any ideas, methods, instructions or products referred to in the content. |
© 2023 by the authors. Licensee MDPI, Basel, Switzerland. This article is an open access article distributed under the terms and conditions of the Creative Commons Attribution (CC BY) license (https://creativecommons.org/licenses/by/4.0/).
Share and Cite
Boaretto, J.; Cruz, R.C.D.; Vannucchi de Camargo, F.; Cordeiro, G.L.; Fragassa, C.; Bergmann, C.P. Using Thermomechanical Properties to Reassess Particles’ Dispersion in Nanostructured Polymers: Size vs. Content. Polymers 2023, 15, 3707. https://doi.org/10.3390/polym15183707
Boaretto J, Cruz RCD, Vannucchi de Camargo F, Cordeiro GL, Fragassa C, Bergmann CP. Using Thermomechanical Properties to Reassess Particles’ Dispersion in Nanostructured Polymers: Size vs. Content. Polymers. 2023; 15(18):3707. https://doi.org/10.3390/polym15183707
Chicago/Turabian StyleBoaretto, Joel, Robinson Carlos Dudley Cruz, Felipe Vannucchi de Camargo, Guilherme Luís Cordeiro, Cristiano Fragassa, and Carlos Pérez Bergmann. 2023. "Using Thermomechanical Properties to Reassess Particles’ Dispersion in Nanostructured Polymers: Size vs. Content" Polymers 15, no. 18: 3707. https://doi.org/10.3390/polym15183707