
Fused Filament Fabrication of Short Glass Fiber-Reinforced Polylactic Acid Composites: Infill Density Influence on Mechanical and Thermal Properties
 , , ,
, , ,
Abstract
:1. Introduction
2. Materials and Methods
2.1. Design of Samples and Fuselage Sections
2.2. FFF of Samples and Fuselage Sections
2.3. Testing of Samples and Fuselage Sections
3. Results and Discussions
3.1. Tensile Properties of 3D FFF Samples
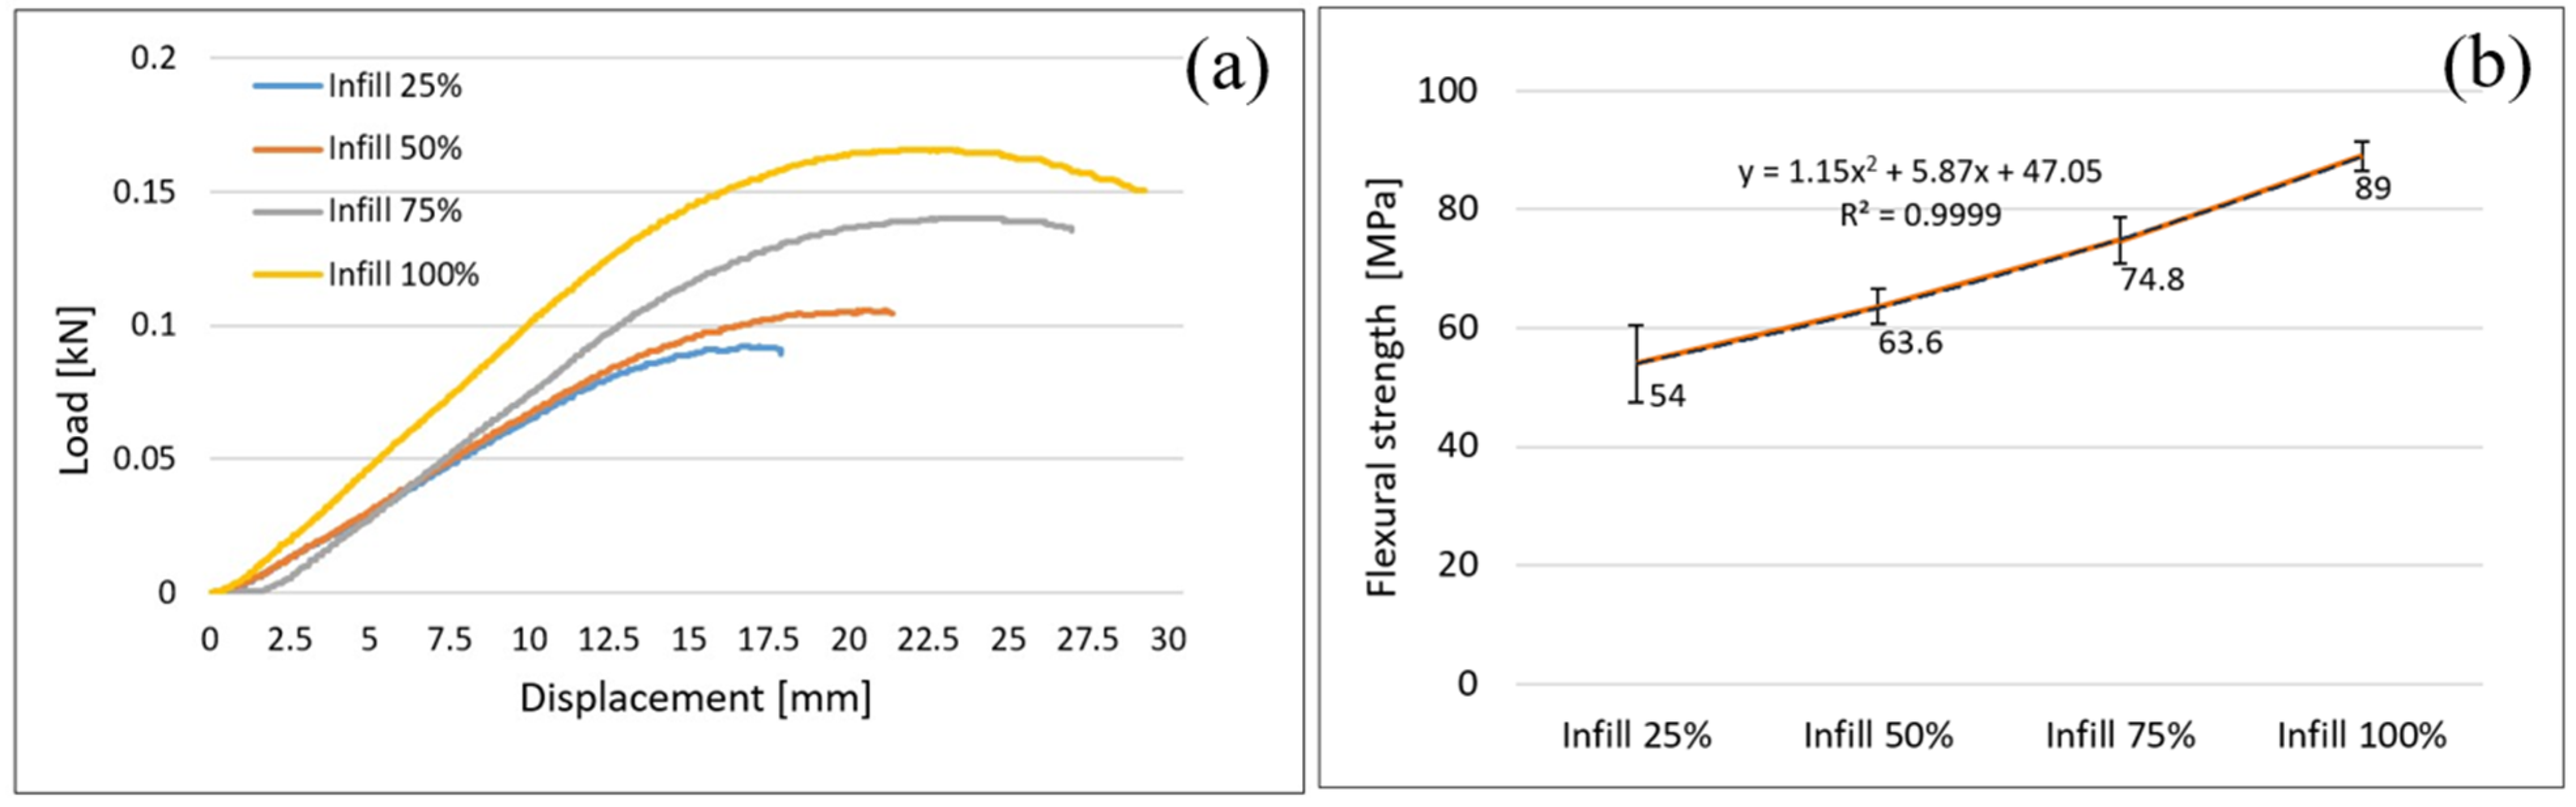
3.2. Flexural Properties of FFF Samples
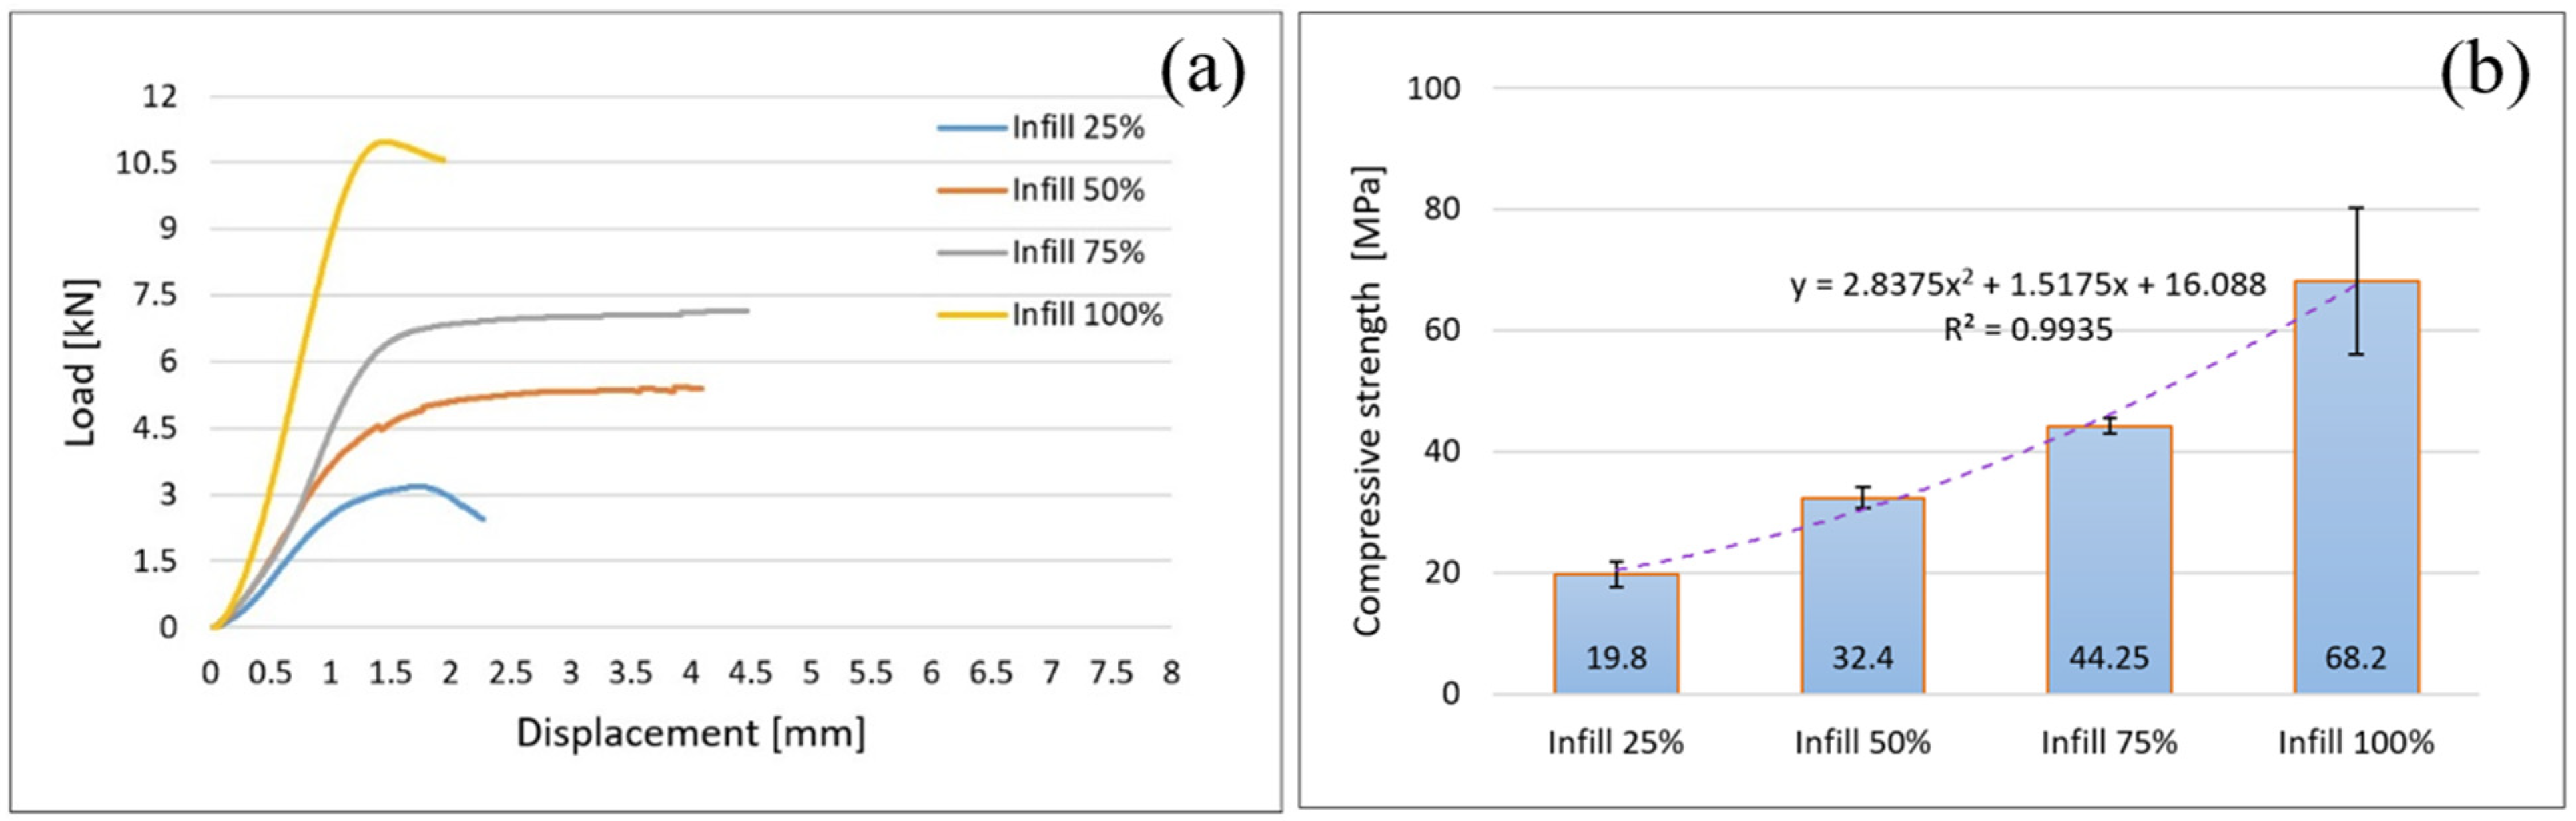
3.3. Compression Properties of FFF Samples and Fuselage Sections
3.4. Thermal Properties of Filament and FFF Samples
4. Conclusions
- -
- It is highlighted that the infill density influences the mechanical properties of the components made of Filaticum PLA-GF composite, manufactured by FFF process, and to some extent also the thermal behavior.
- -
- As the infill density increases, strength to tensile, flexural and compressive loading increases. Therefore, the sample with 100% infill density provides the highest mechanical characteristics even though the AM time and material consumption are higher than in the case of using a lower infill density.
- -
- It is observed that the samples fabricated of Filaticum PLA-GF composite with 50% and 75% infill density present a higher toughness but, in the same time, a lower compressive strength than samples with 100% infill percentage.
- -
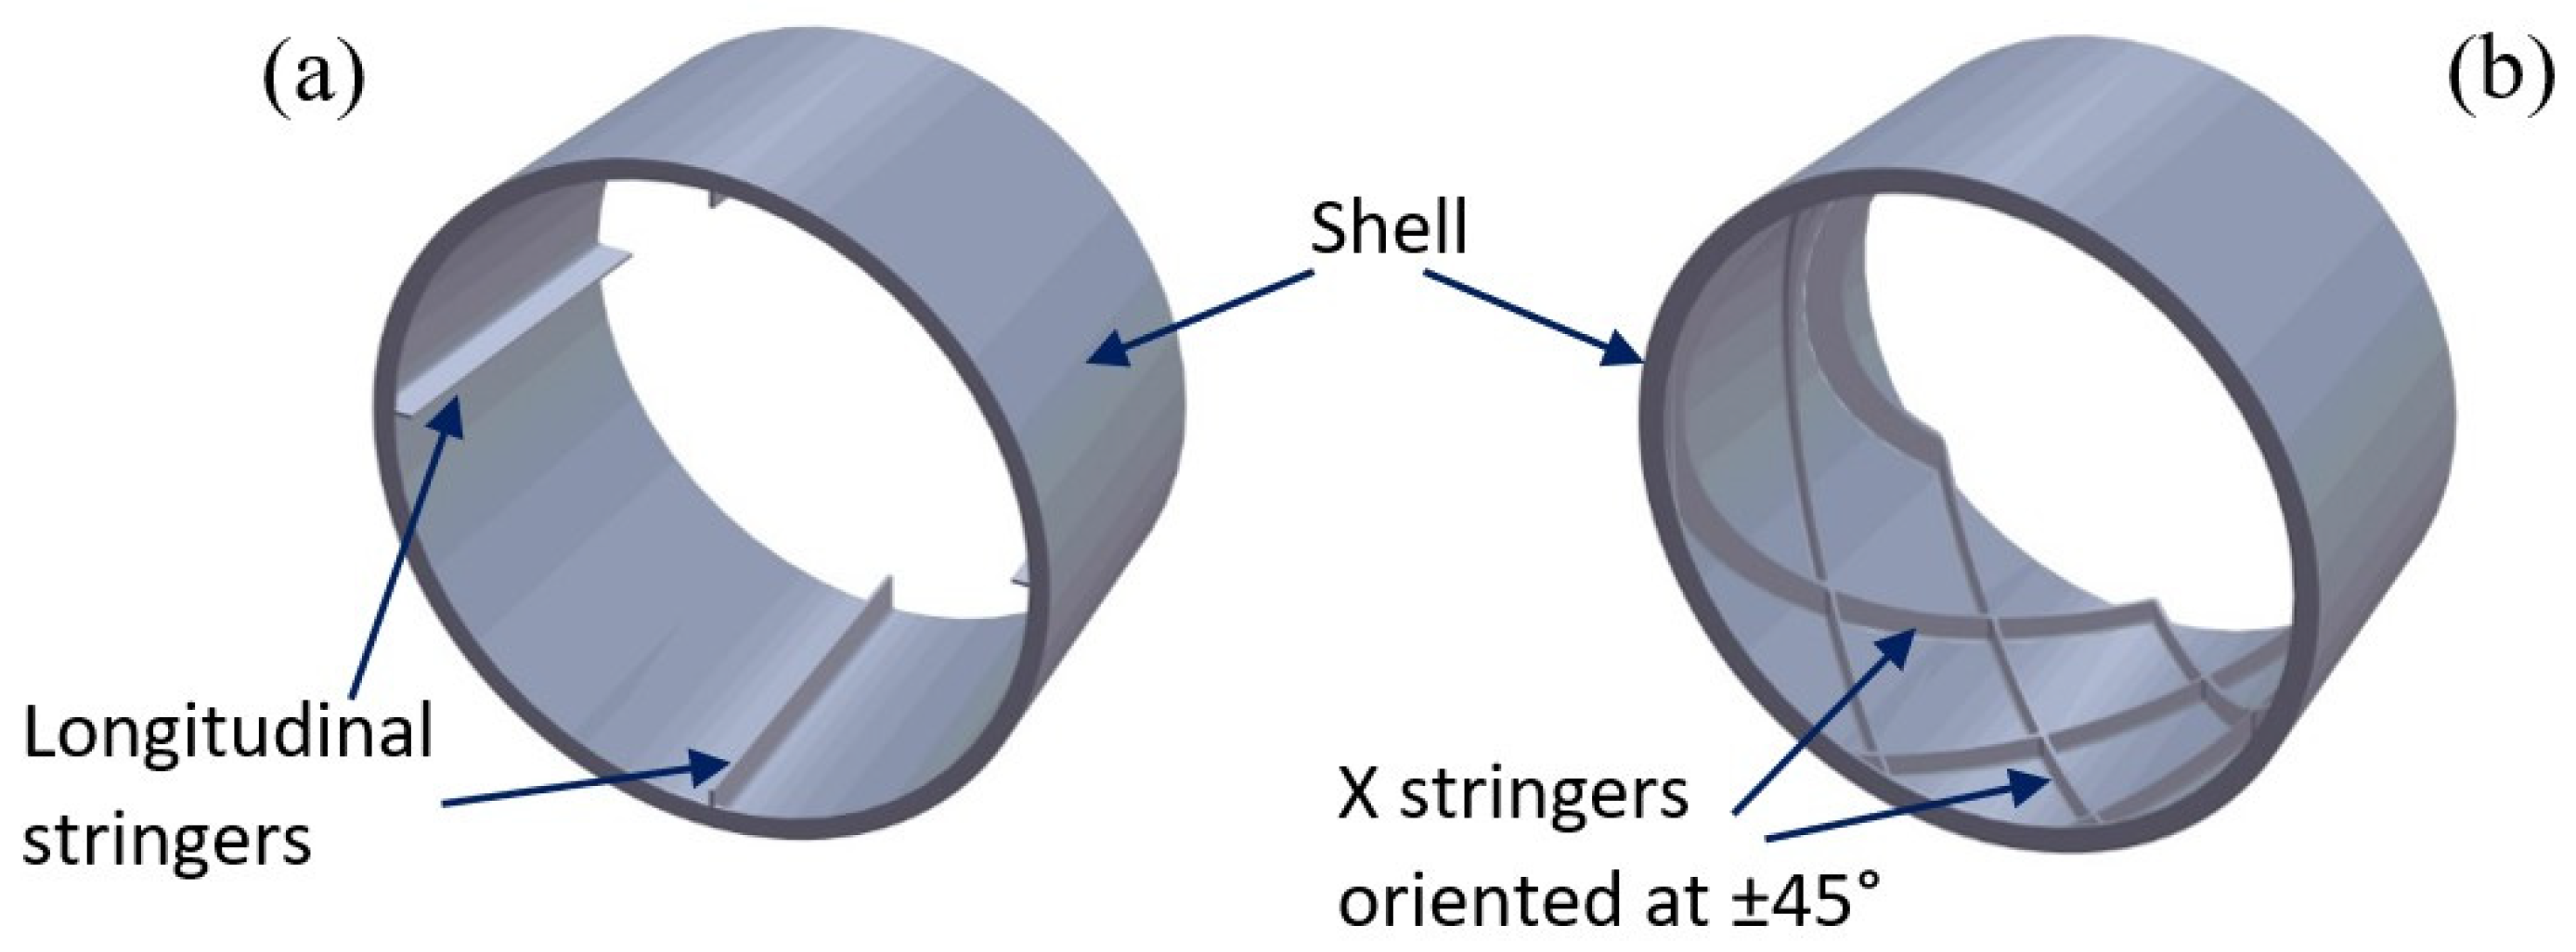
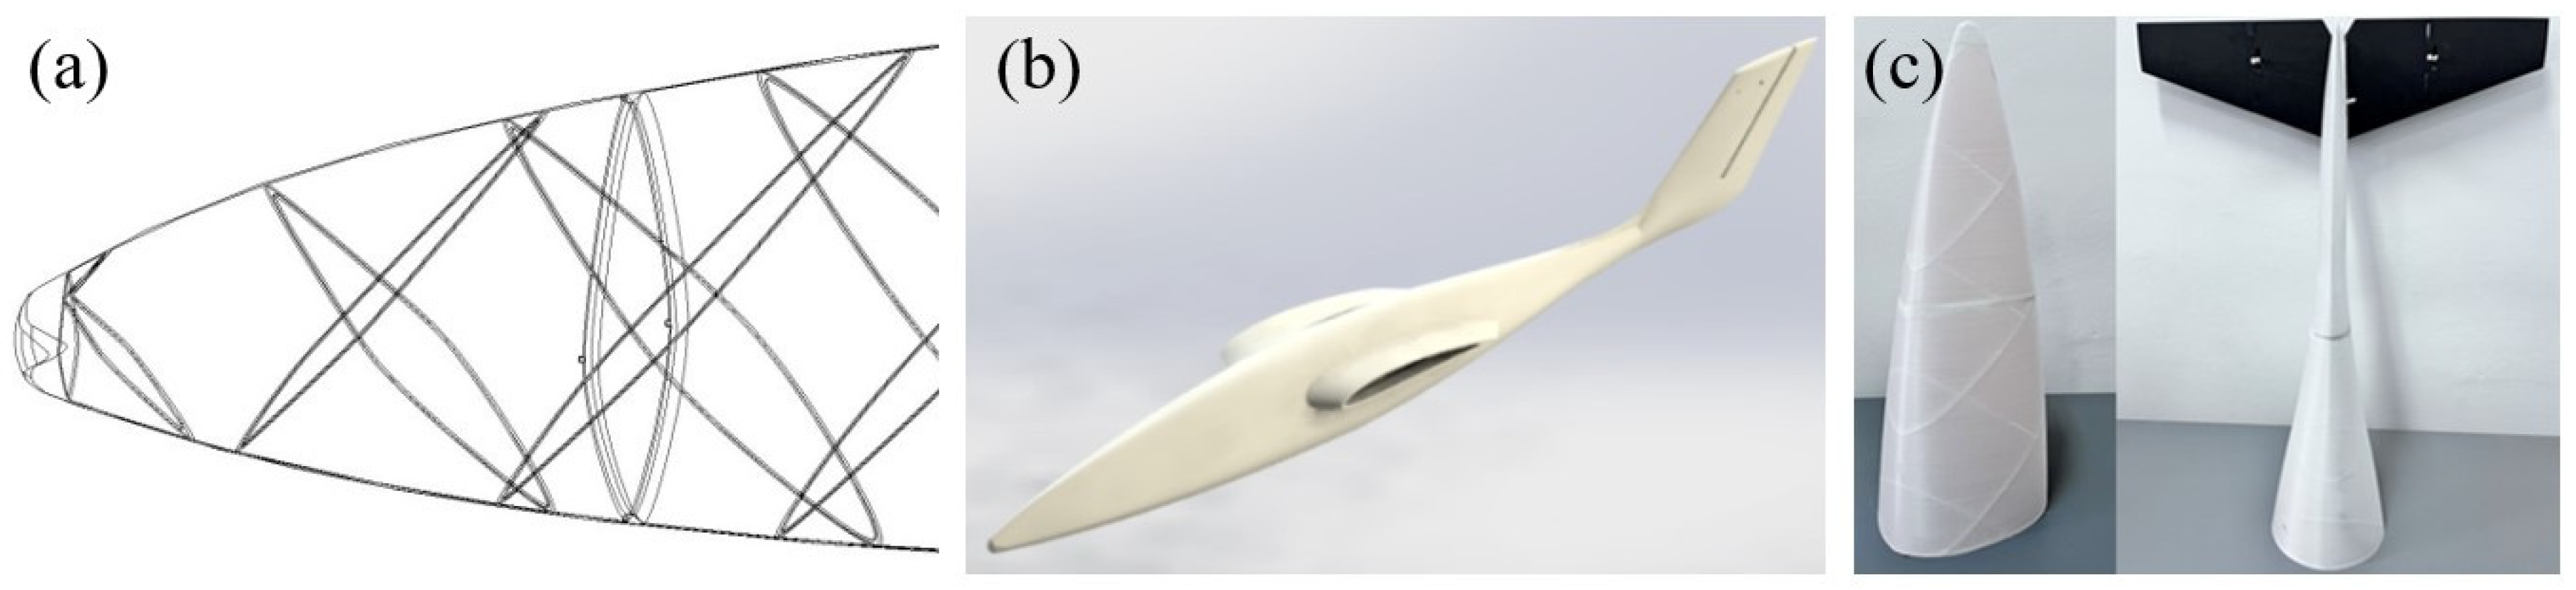
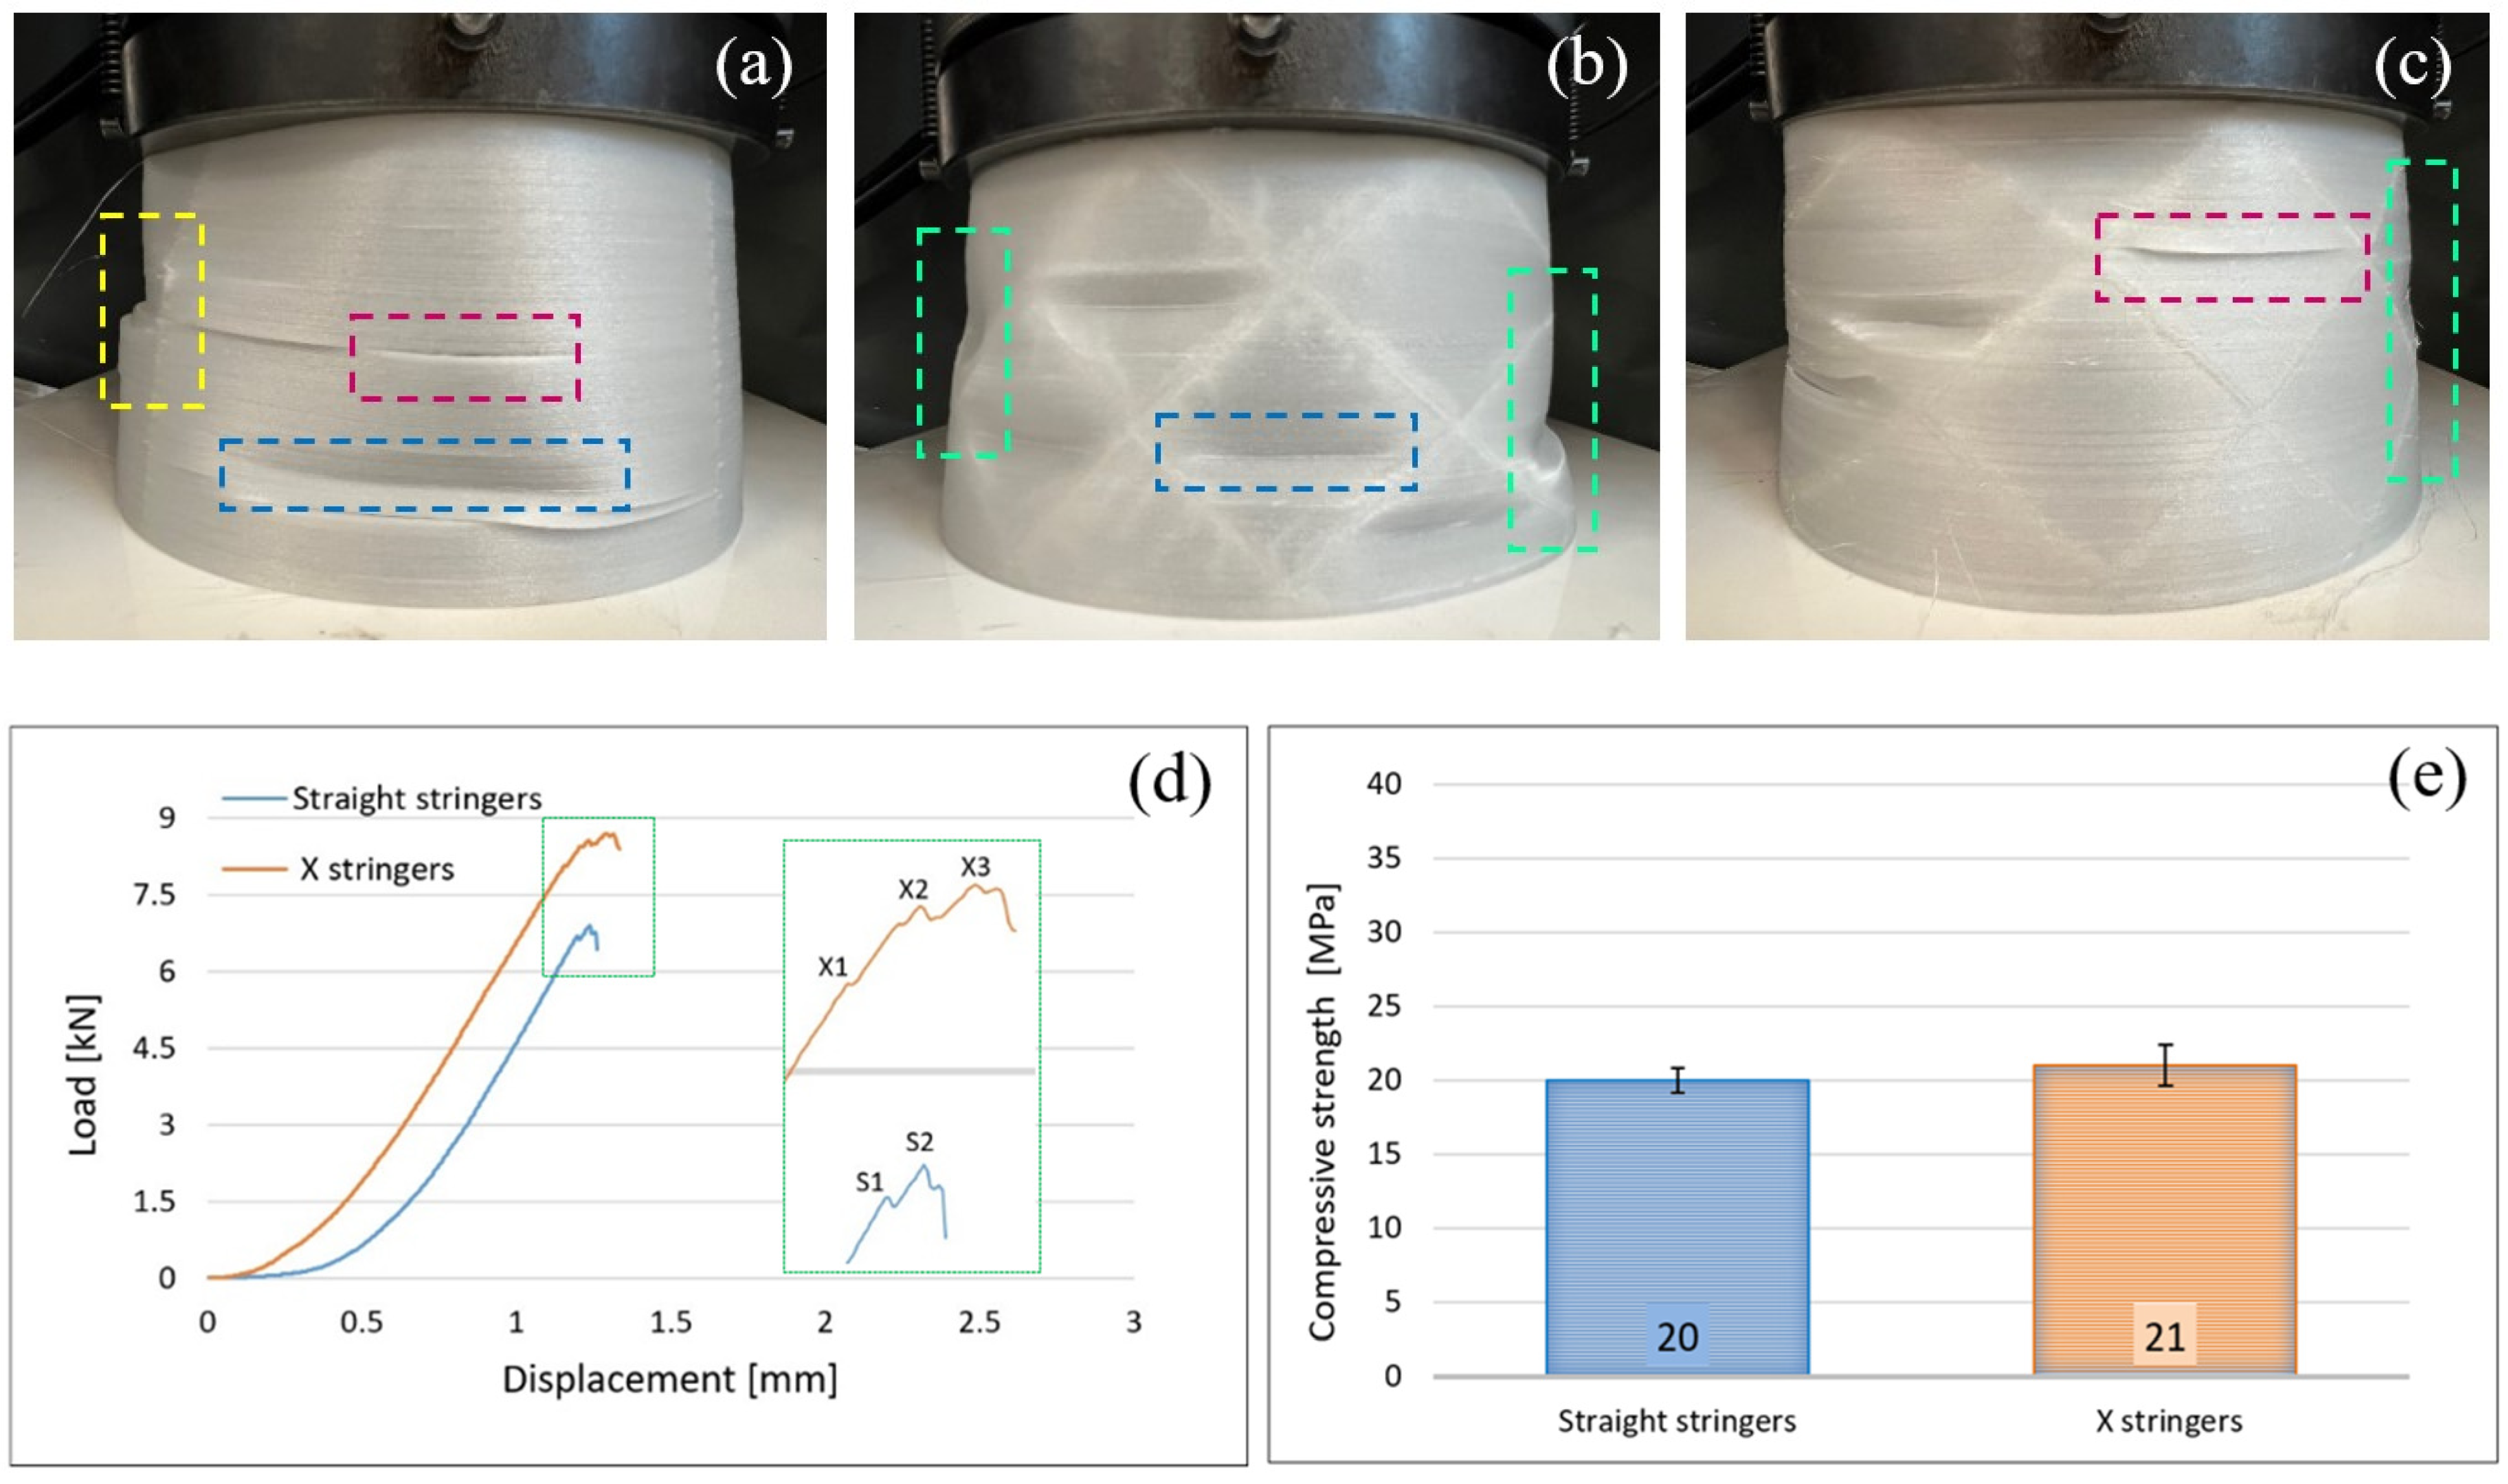
- Since the manufacture of components with infill density of 100%, made of Filaticum PLA-GF composite, ensures high mechanical performance (confirmed by the results obtained after the mechanical tests), it was used in the manufacture of the structural elements that are part of a UAV (Figure 2). Therefore, conical sections from the UAV fuselage were manufactured and subjected to compression tests. The obtained results showed that the fuselage sections made of Filaticum PLA-GF composite and reinforced with stringers oriented at an angle of ±45° present better mechanical performances than those with longitudinal stringers.
- -
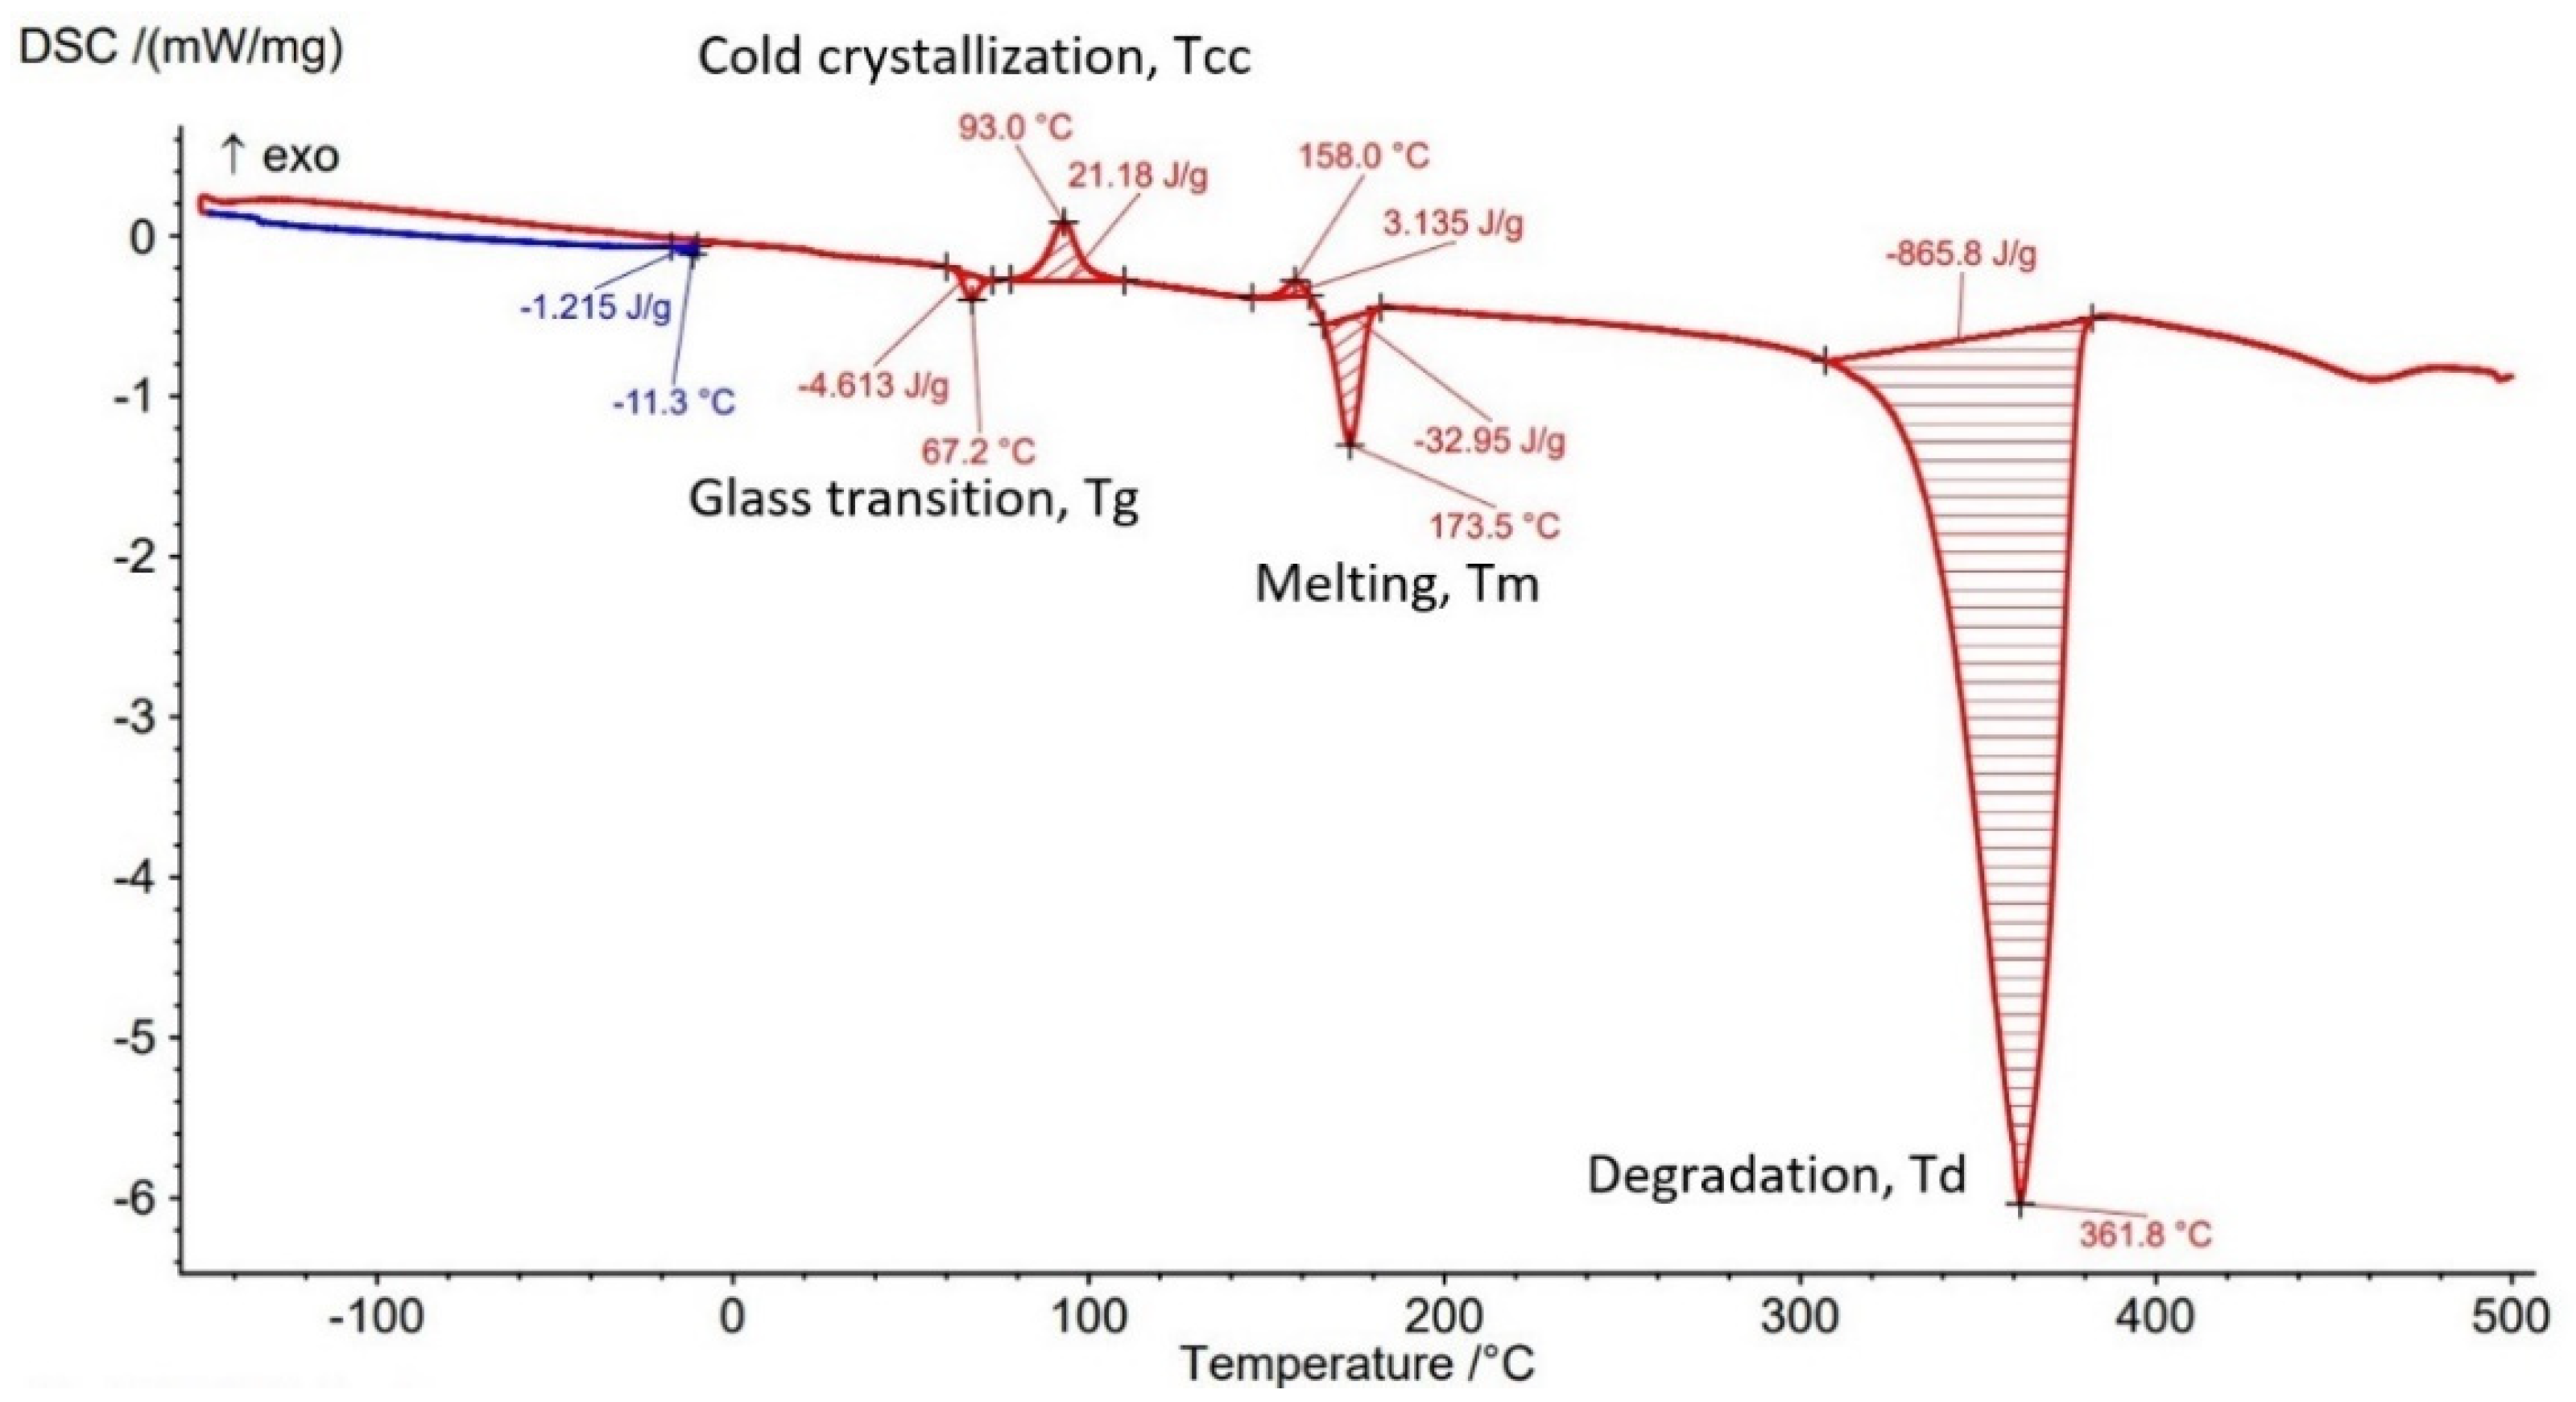
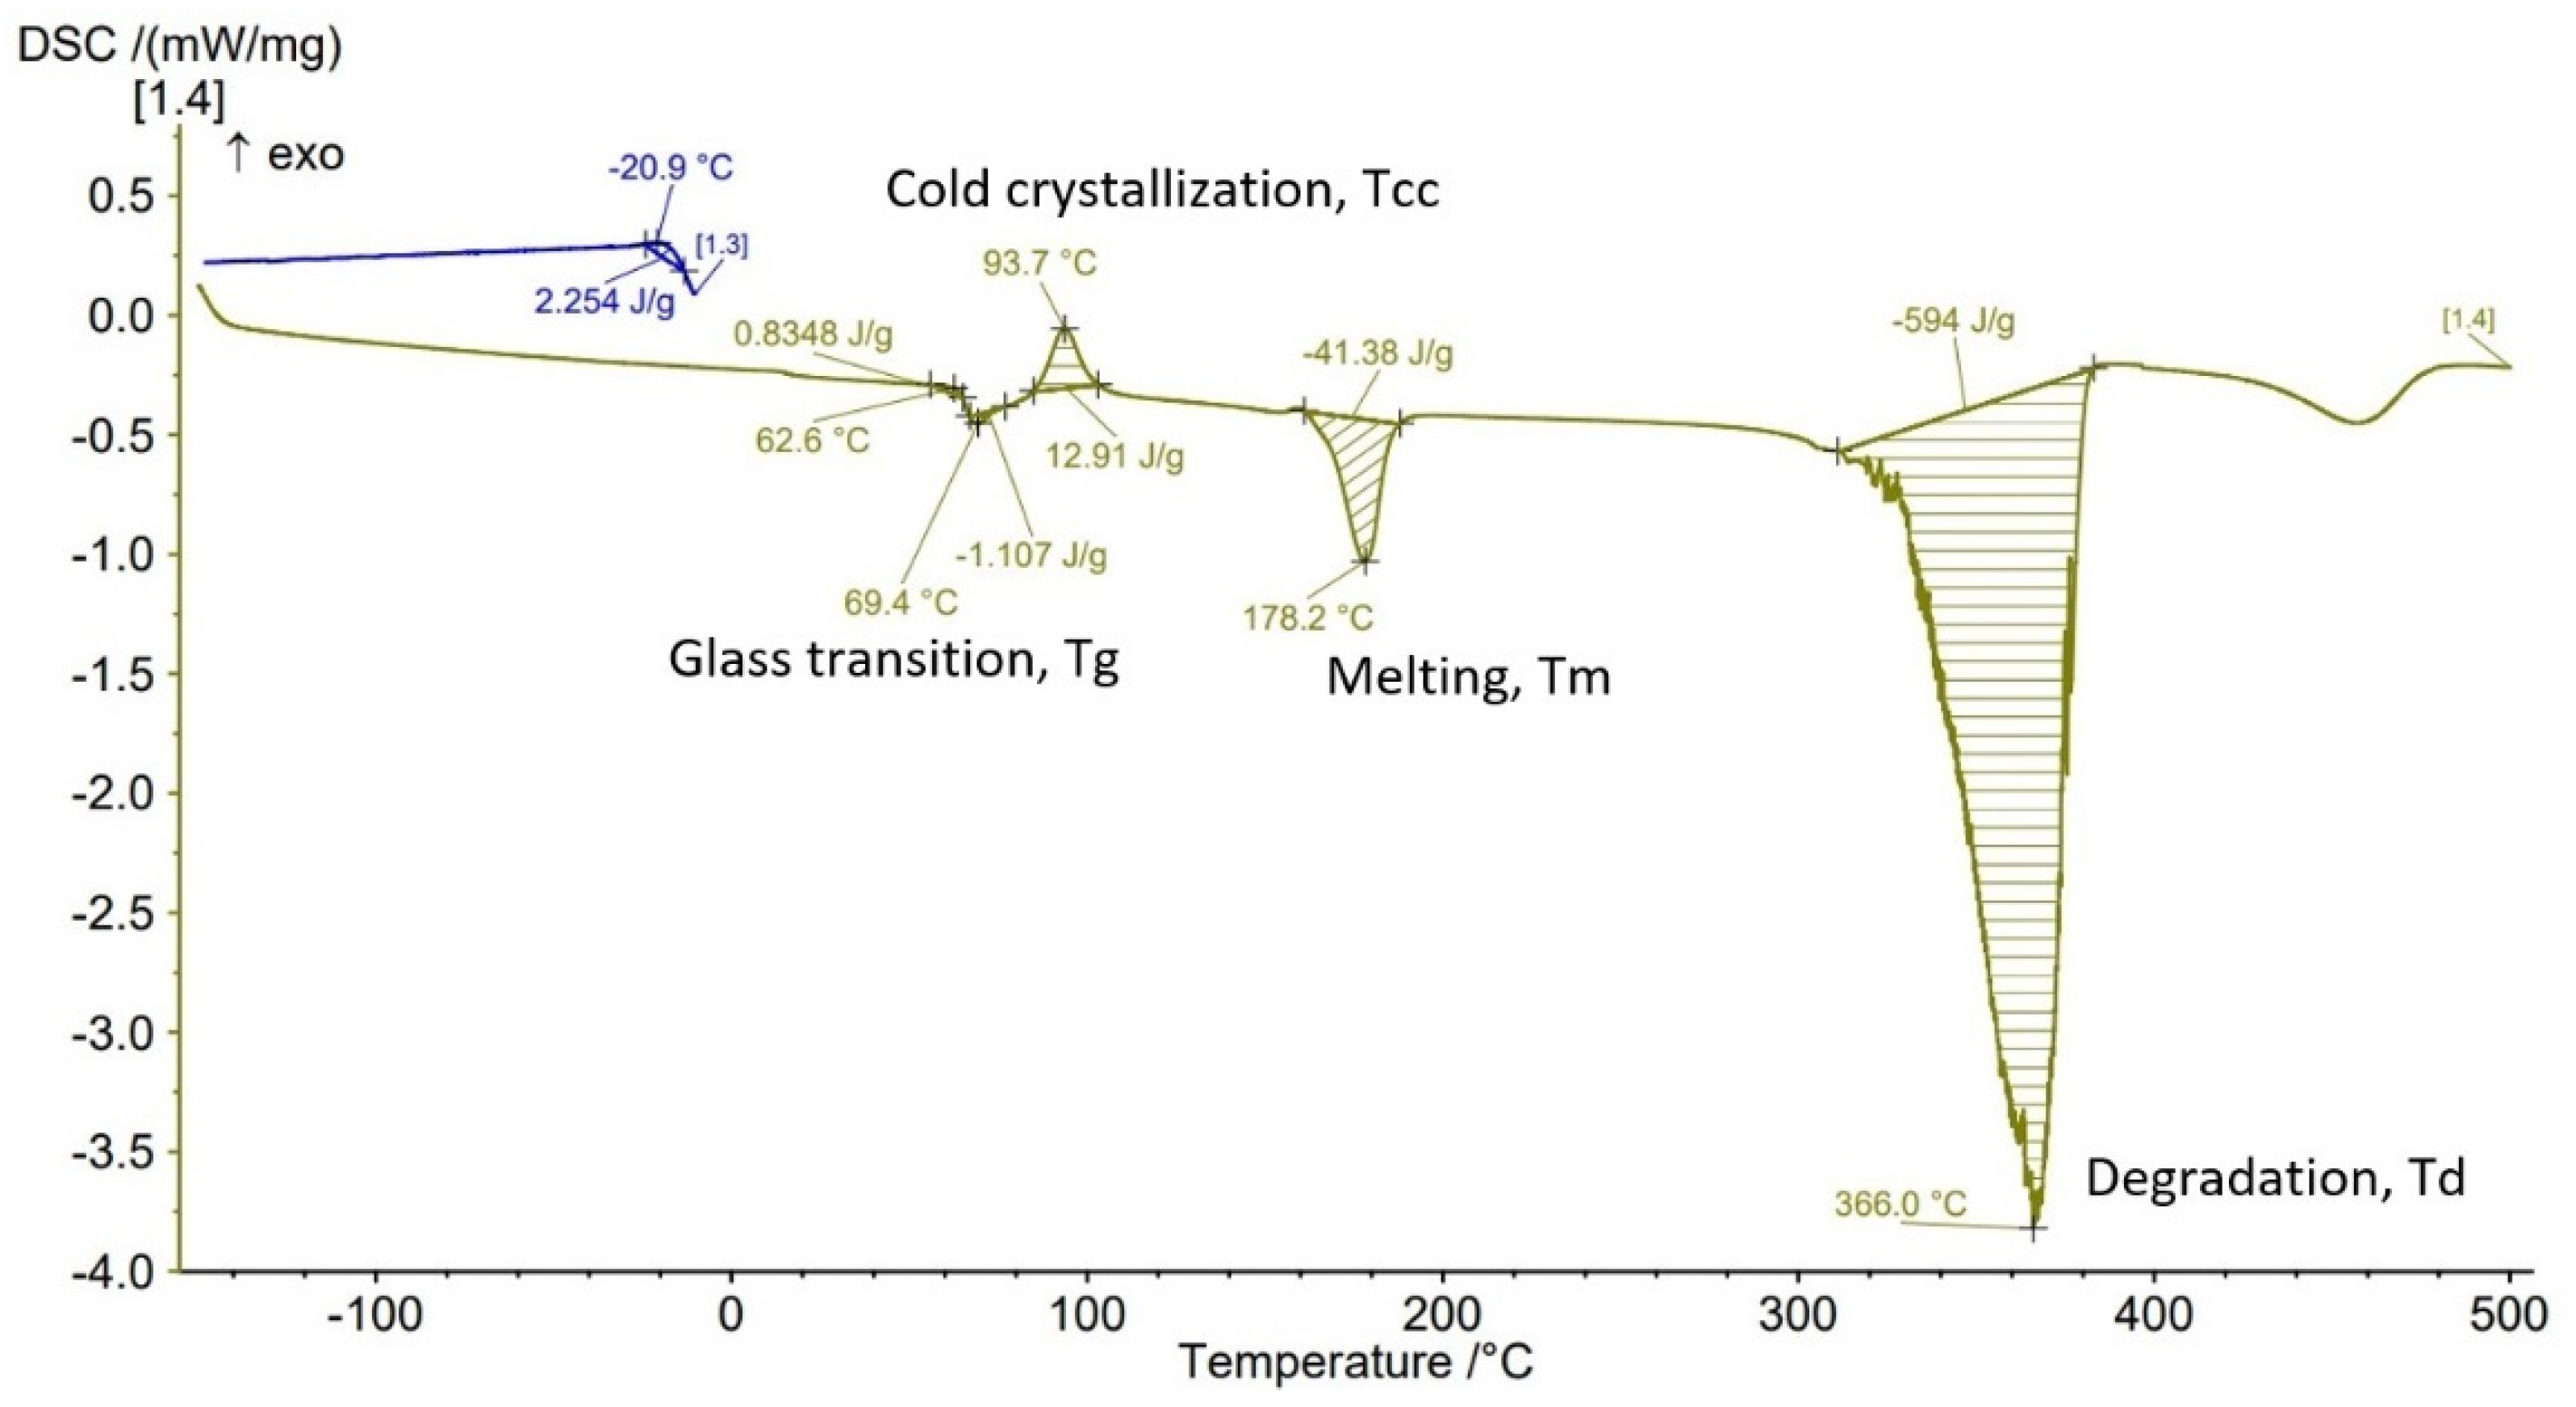
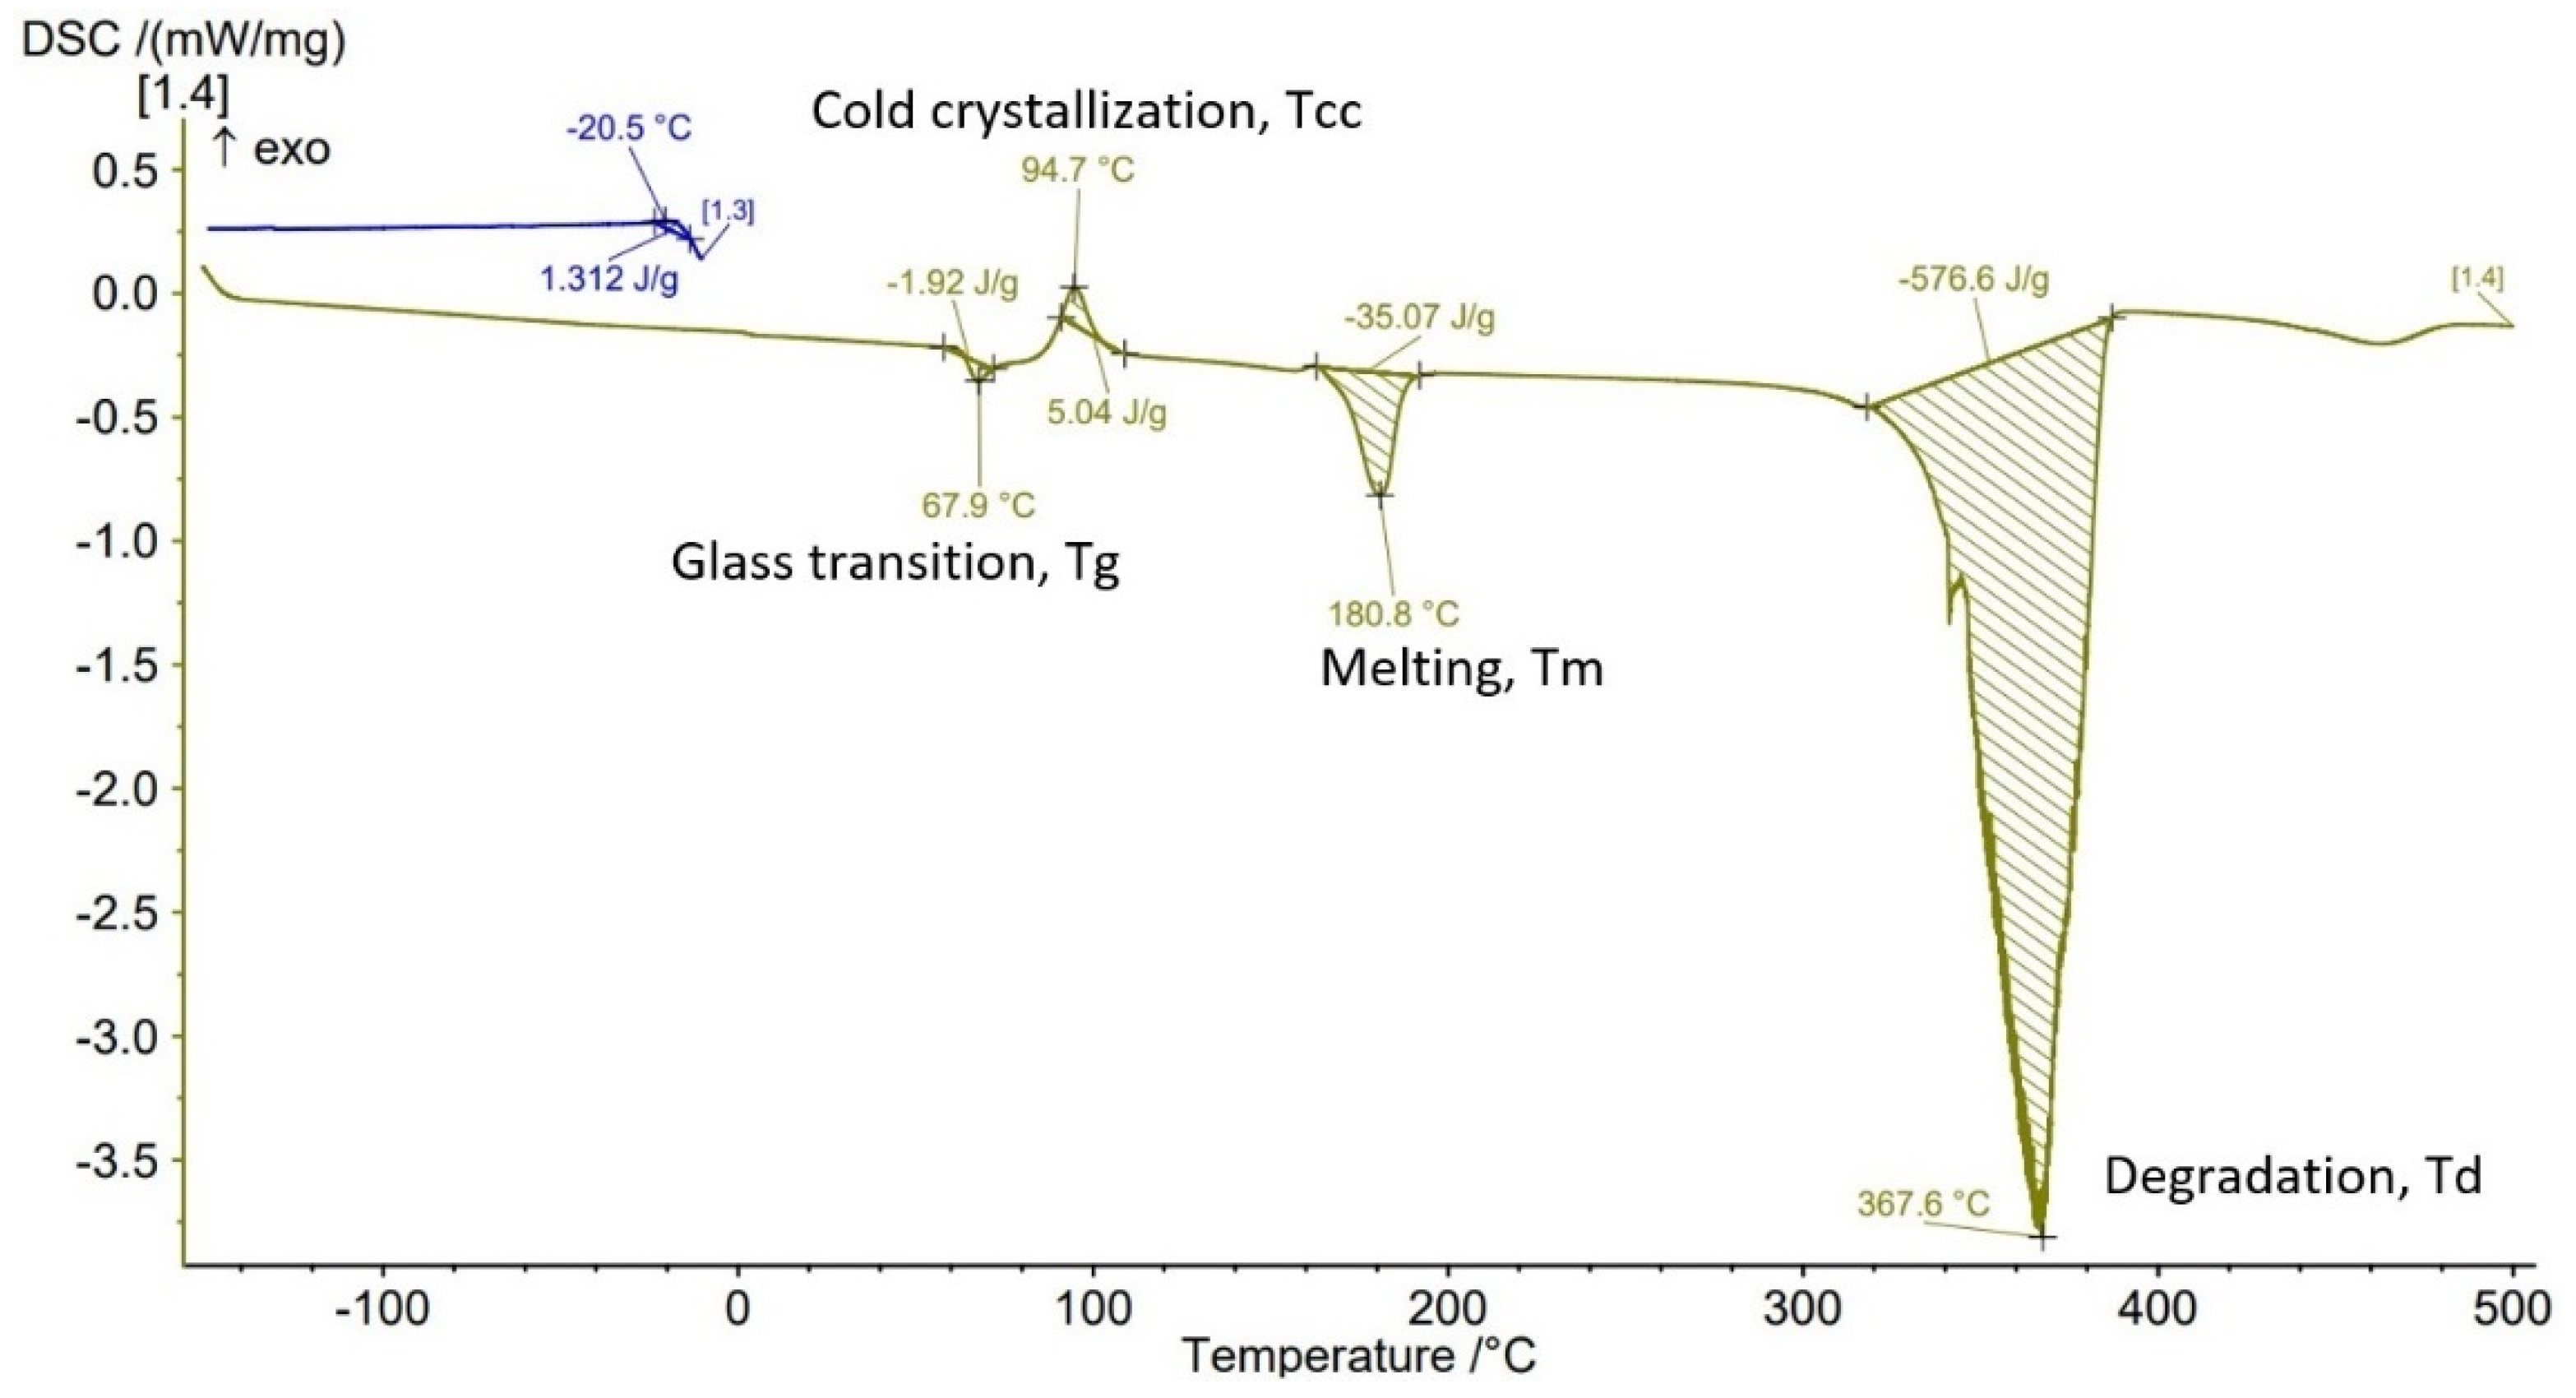
- Because of the manufacturer does not provide data on the thermal behavior of Filaticum PLA-GF filament, glass transition (Tg), crystallization (Tcc), and melting (Tm) temperatures they were determined by DSC analyses (Figure 7, Figure 8, Figure 9, Figure 10 and Figure 11, Table 3). The results highlight that the addition of glass fiber in the PLA matrix causes the glass transition (Tg) to move to a higher temperature, of 69.1 °C, compared to the glass transition of neat PLA, of 50–60 °C.
- -
- It was found that the glass transition (Tg), and melting (Tm) temperature increases slightly as the infill density increases.
- -
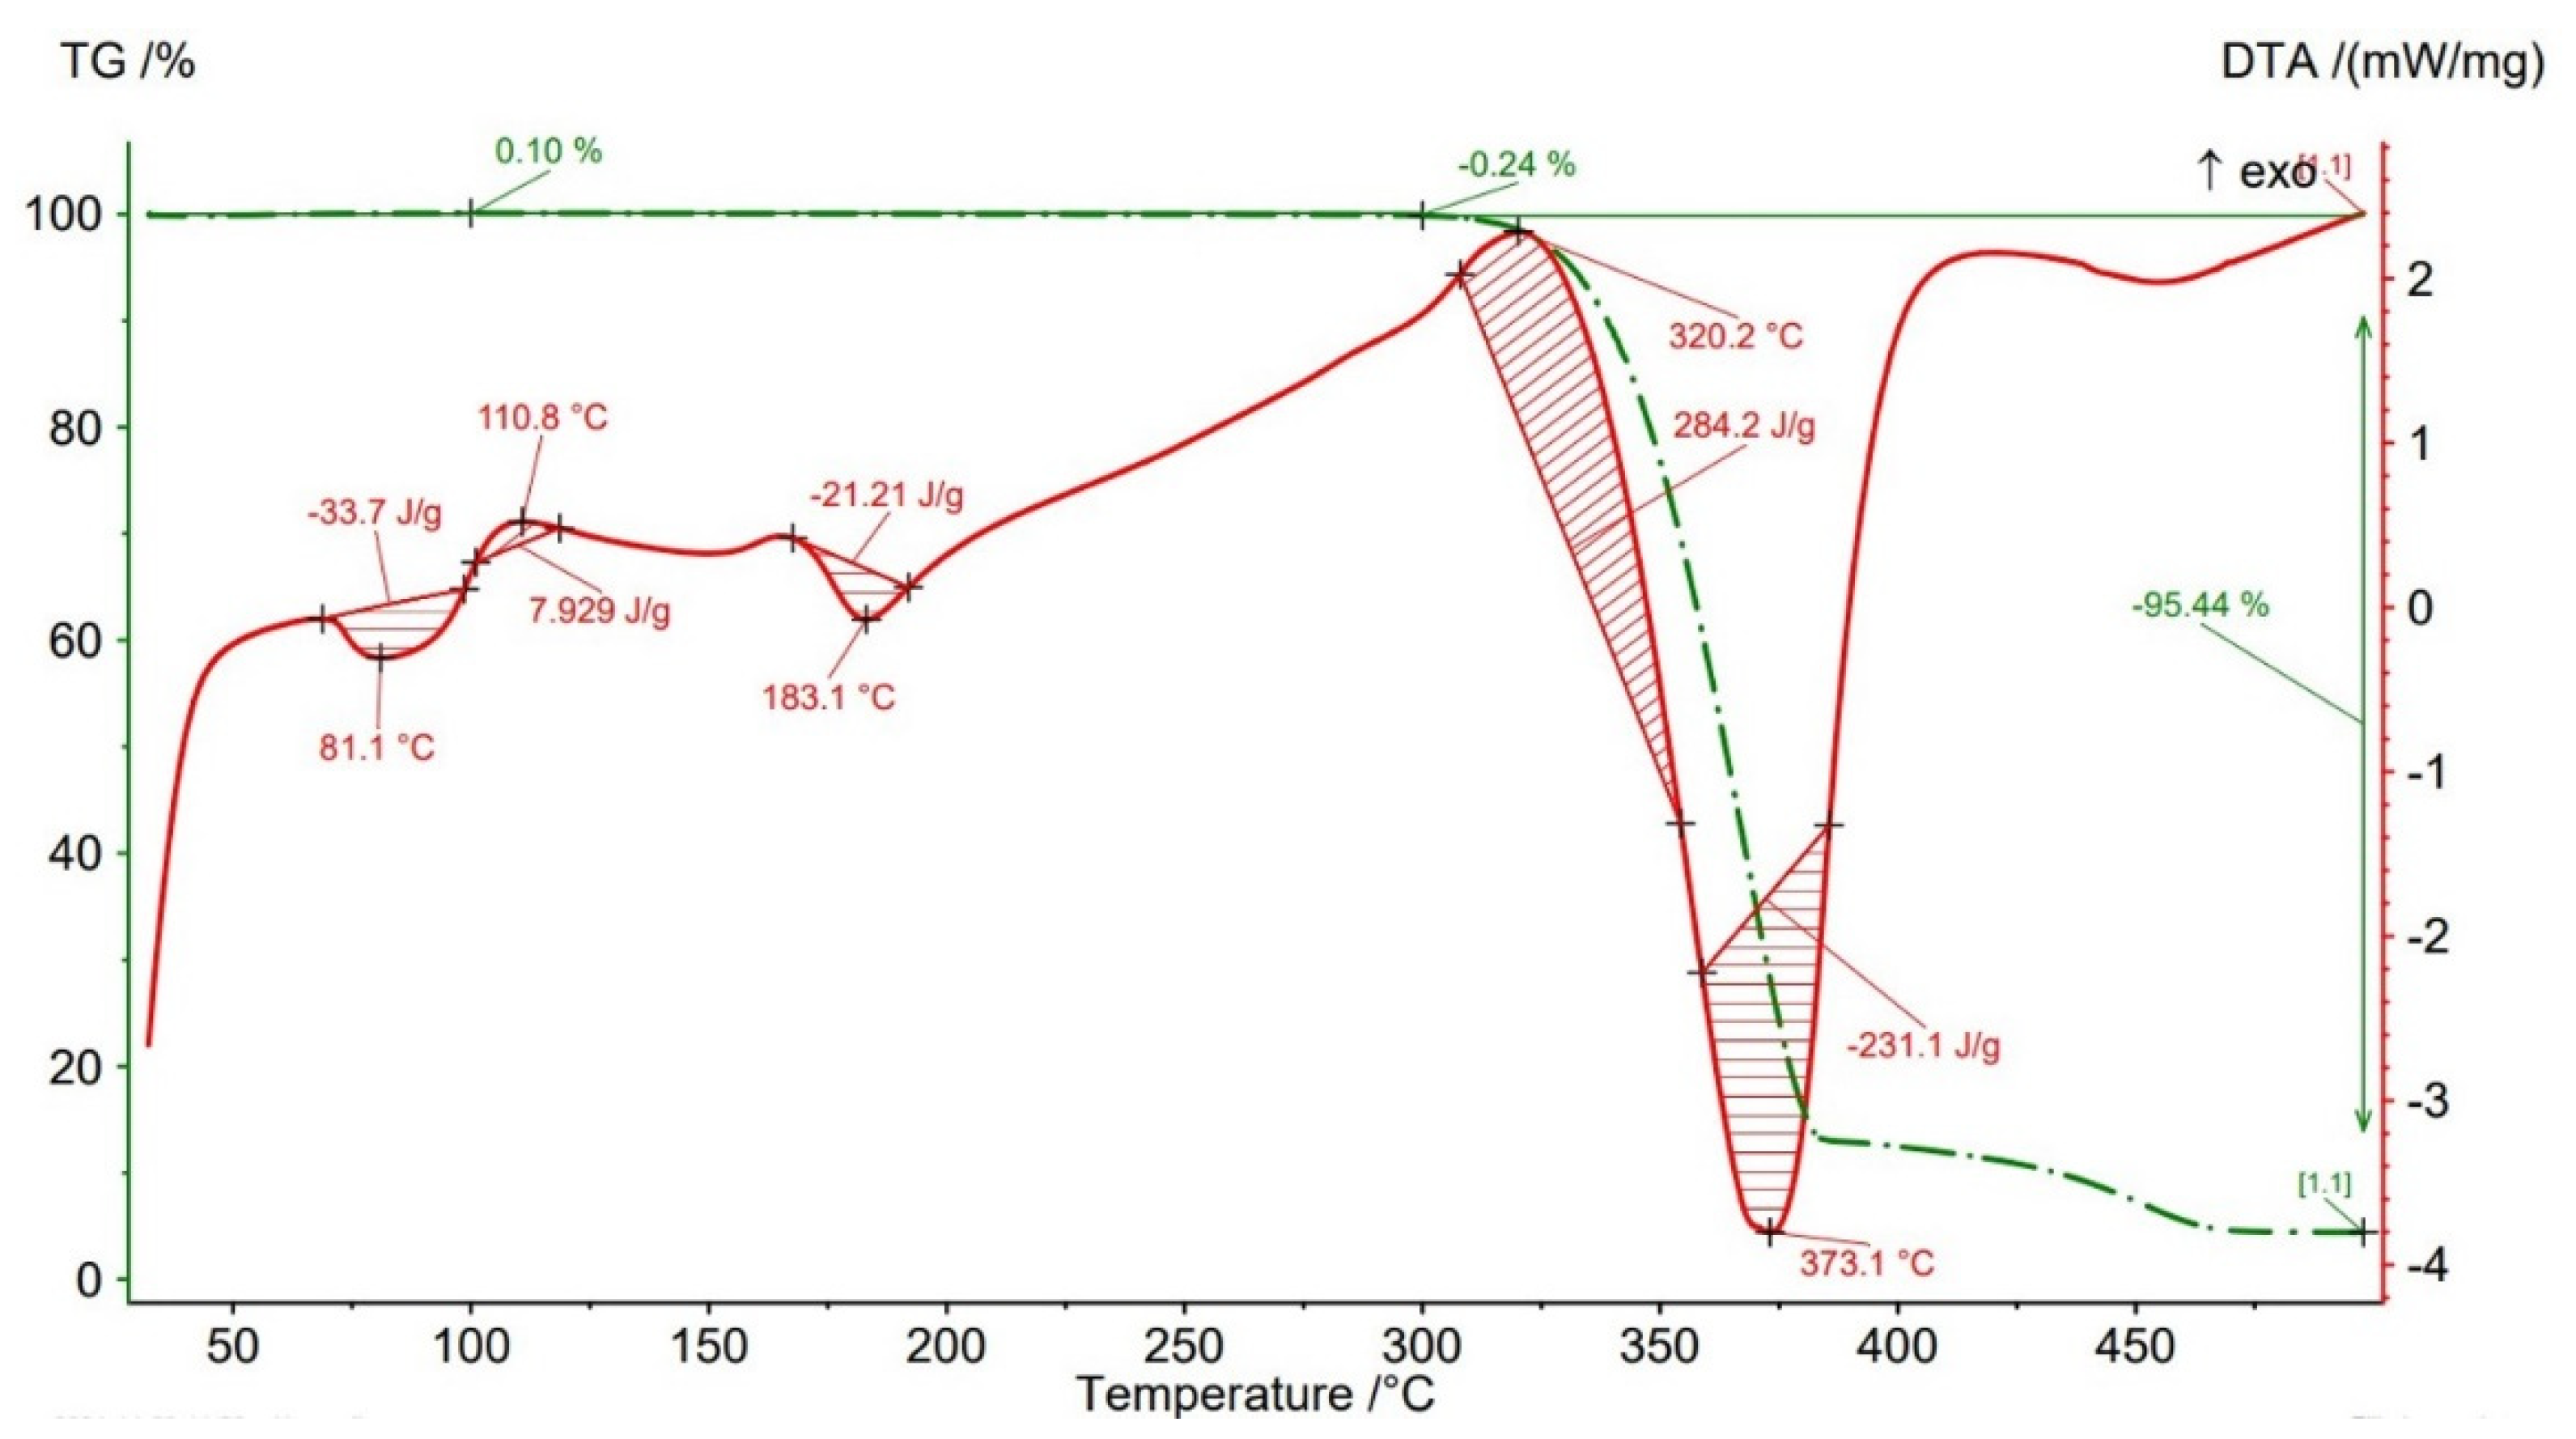
- Thermogravimetric analysis (TGA) reveals the fact that for Filaticum PLA-GF filament the loss of thermal stability begins at a temperature of about 311 °C and its complete destruction occurs at a temperature of 373.1 °C with a mass loss of 95.44%.
- -
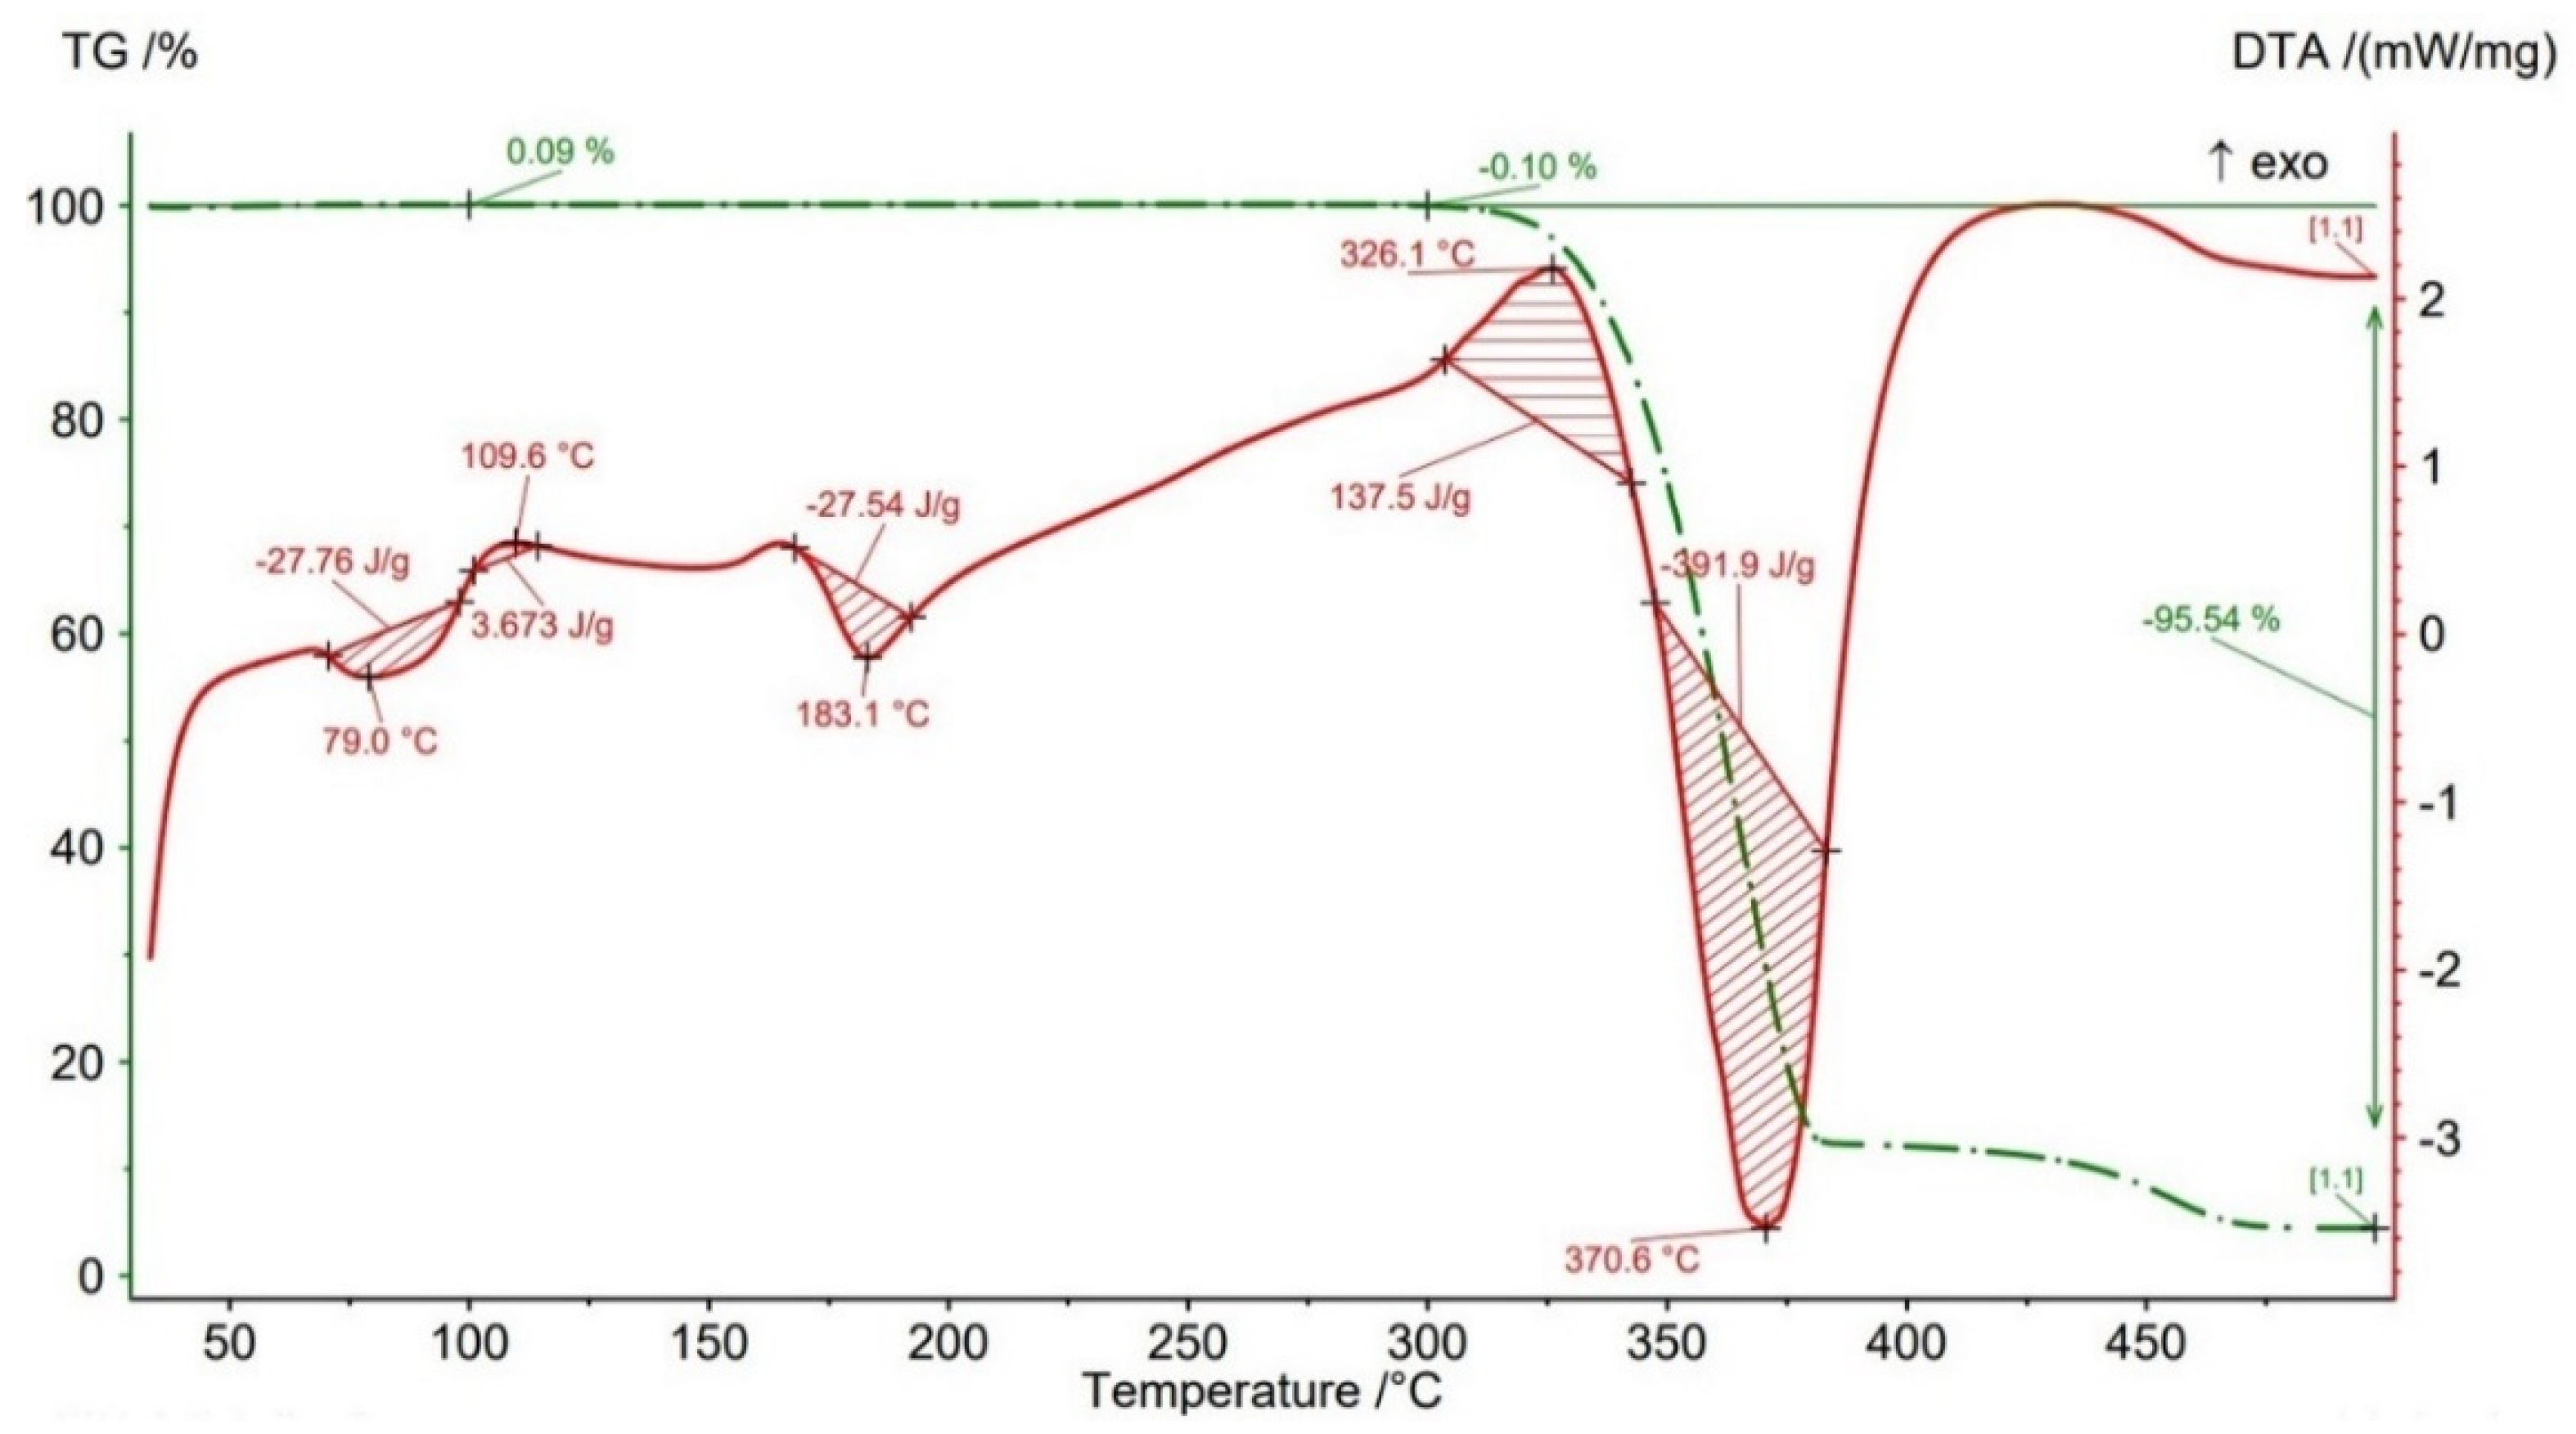
- It was observed that the increase in infill density leads to a slight increase in thermal stability and complete degradation temperature. For samples with 25% infill density, the loss of thermal stability begins at a temperature of about 311.5 °C and for those with 100% infill density at 312.5 °C.
Author Contributions
Funding
Institutional Review Board Statement
Informed Consent Statement
Data Availability Statement
Acknowledgments
Conflicts of Interest
References
- ISO/ASTM 52900:2021(E); Additive Manufacturing—General Principles—Fundamentals and Vocabulary. ASTM International: West Conshohocken, PA, USA, 2021.
- Billah, K.M.; Lorenzana, F.; Martinez, N.L.; Chacon, S.; Wicker, R.B.; Espalin, D. Thermal analysis of thermoplastic materials filled with chopped fiber for large area 3d printing. In Proceedings of the Solid Freeform Fabrication 2019: Proceedings of the 30th Annual International Solid Freeform Fabrication Symposium—An Additive Manufacturing Conference, Austin, TX, USA, 12–14 August 2019. [Google Scholar]
- Forés Garriga, A.; Pérez, M.; Gómez-Gras, G.; Reyes, G. Role of infill parameters on the mechanical performance and weight reduction of PEI Ultem processed by FFF. Mater. Des. 2020, 193, 108810. [Google Scholar] [CrossRef]
- Chao, H.; Qing-Hua, Q. Advances in fused deposition modeling of discontinuous fiber/polymer composites. Curr. Opin. Solid State Mater. Sci. 2020, 24, 100867. [Google Scholar]
- Wang, G.; Zhang, D.; Li, B.; Wan, G.; Zhao, G.; Zhang, A. Strong and thermal-resistance glass fiber-reinforced polylactic acid (PLA) composites enabled by heat treatment. Int. J. Biol. Macromol. 2019, 129, 448–459. [Google Scholar] [CrossRef] [PubMed]
- Wang, G.; Zhang, D.; Wan, G.; Li, B.; Zhao, G. Glass fiber reinforced PLA composite with enhanced mechanical properties, thermal behavior, and foaming ability. Polymer 2019, 181, 121803. [Google Scholar] [CrossRef]
- Ruz-Cruz, M.A.; Herrera-Franco, P.J.; Flores-Johnson, E.A.; Moreno-Chulim, M.V.; Galera-Manzano, L.M.; Valadez-González, A. Thermal and mechanical properties of PLA-based multiscale cellulosic biocomposites. J. Mater. Res. Technol. 2022, 18, 485–495. [Google Scholar] [CrossRef]
- Facca, A.G.; Kortschot, M.T.; Yan, N. Predicting the tensile strength of natural fibre reinforced thermoplastics. Compos. Sci. Technol. 2007, 67, 2454–2466. [Google Scholar] [CrossRef]
- Xiu, H.; Qi, X.; Liu, Z.; Zhou, Y.; Bai, H.; Zhang, Q.; Fu, Q. Simultaneously reinforcing and toughening of polylactide/carbon fiber composites via adding small amount of soft poly(ether)urethane. Compos. Sci. Technol. 2016, 127, 54–61. [Google Scholar] [CrossRef]
- Jing, M.; Che, J.; Xu, S.; Liu, Z.; Fu, Q. The effect of surface modification of glass fiber on the performance of poly(lactic acid) composites: Graphene oxide vs. silane coupling agents. Appl. Surf. Sci. 2018, 435, 1046–1056. [Google Scholar] [CrossRef]
- Yu, B.; Geng, C.; Zhou, M.; Bai, H.; Fu, Q.; He, B. Impact toughness of polypropylene/glass fiber composites: Interplay between intrinsic toughening and extrinsic toughening. Compos. Part B Eng. 2016, 92, 413–419. [Google Scholar] [CrossRef]
- Karger-Kocsis, J.; Mahmood, H.; Pegoretti, A. Recent advances in fiber/matrix interphase engineering for polymer composites. Prog. Polym. Sci. 2015, 73, 1–43. [Google Scholar] [CrossRef]
- Jaszkiewicz, A.; Bledzki, A.K.; Franciszczak, P. Improving the mechanical performance of PLA composites with natural, man-made cellulose and glass fibers—A comparison to PP counterparts. Polimery 2013, 58, 435–442. [Google Scholar] [CrossRef]
- Huda, M.S.; Drzal, L.T.; Mohanty, A.K.; Misra, M. Chopped glass and recycled newspaper as reinforcement fibers in injection molded poly(lactic acid) (PLA) composites: A comparative study. Compos. Sci. Technol. 2006, 66, 1813–1824. [Google Scholar] [CrossRef]
- Deniz Varsavas, S.; Kaynak, C. Effects of glass fiber reinforcement and thermoplastic elastomer blending on the mechanical performance of polylactide. Compos. Commun. 2018, 8, 24–30. [Google Scholar] [CrossRef]
- Chacón, J.M.; Caminero, M.A.; García-Plaza, E.; Núñez, P.J. Additive manufacturing of PLA structures using fused deposition modelling: Effect of process parameters on mechanical properties and their optimal selection. Mater. Des. 2017, 124, 143–157. [Google Scholar] [CrossRef]
- Gómez-Gras, G.; Jerez-Mesa, R.; Travieso-Rodriguez, J.A.; Lluma-Fuentes, J. Fatigue performance of fused filament fabrication PLA specimens. Mater. Des. 2018, 140, 278–285. [Google Scholar] [CrossRef] [Green Version]
- Aloyaydi, B.; Sivasankaran, S.; Hany, A. Influence of infill density on microstructure and flexural behavior of 3D printed PLA thermoplastic parts processed by fusion deposition modeling. AIMS J. 2019, 6, 1033–1048. [Google Scholar]
- Pandžić, A.; Hodzic, D.; Milovanović, A. Effect of infill type and density on tensile properties of PLA material for FDM process. In Proceedings of the 30th DAAAM International Symposium, Zadar, Croatia, 23–26 October 2019; Katalinic, B., Ed.; DAAAM International: Vienna, Austria, 2019. [Google Scholar]
- Ma, Q.; Rejab, M.; Kumar, A.P.; Fu, H.; Kumar, N.M.; Tang, J. Effect of infill pattern, density and material type of 3D printed cubic structure under quasi-static loading. Proc. Inst. Mech. Eng. Part C J. Mech. Eng. Sci. 2021, 235, 4254–4272. [Google Scholar] [CrossRef]
- Hodzic, D.; Pandzic, A. Influence of Infill Design on Compressive and Flexural Mechanical Properties of FDM Printed PLA Material. In Proceedings of the 32nd DAAAM International Symposium, Vienna, Austria, 28–29 October 2021; DAAAM International: Vienna, Austria, 2021. [Google Scholar]
- Gonabadi, H.; Yadav, A.; Bull, S.J. The effect of processing parameters on the mechanical characteristics of PLA produced by a 3D FFF printer. Int. J. Adv. Manuf. Technol. 2020, 111, 695–709. [Google Scholar] [CrossRef]
- Dave, H.K.; Patadiya, N.H.; Prajapati, A.R.; Rajpurohit, S.R. Effect of infill pattern and infill density at varying part orientation on tensile properties of fused deposition modeling-printed poly-lactic acid part. Proc. Inst. Mech. Eng. Part C J. Mech. Eng. Sci. 2019, 235, 1811–1827. [Google Scholar] [CrossRef]
- Akhoundi, B.; Behravesh, A.H. Effect of filling pattern on the tensile and flexural mechanical properties of FDM 3D printed products. Exp. Mech. 2019, 59, 883–897. [Google Scholar] [CrossRef]
- Wang, S.; Ma, Y.; Deng, Z.; Zhang, S.; Cai, J. Effects of fused deposition modeling process parameters on tensile, dynamic mechanical properties of 3D printed polylactic acid materials. Polym. Test 2020, 86, 106483. [Google Scholar] [CrossRef]
- Abeykoon, C.; Sri-Amphorn, P.; Fernando, A. Optimization of fused deposition modeling parameters for improved PLA and ABS 3D printed structures. Int. J. Lightweight Mater. Manuf. 2020, 3, 284–297. [Google Scholar] [CrossRef]
- Cwikła, G.; Grabowik, C.; Kalinowski, K.; Paprocka, I.; Ociepka, P. The influence of printing parameters on selected mechanical properties of FDM/FFF 3D-printed parts. IOP Conference Series: Materials Science and Engineering. In Proceedings of the ModTech International Conference—Modern Technologies in Industrial Engineering, Sibiu, Romania, 14–17 June 2017; IOP Publishing Ltd.: Bristol, UK, 2017. [Google Scholar]
- Singh Mehta, L.; Pillai, P. Compression Testing of PLA in 3D Printing. Int. J. Electron. Electr. Comput. Syst. 2017, 6, 466–470. [Google Scholar]
- Mercado-Colmenero, J.M.; Rubio-Paramio, M.A.; la Rubia-Garcia, M.D.; Lozano-Arjona, D.; Martin-Doñate, C. A numerical and experimental study of the compression uniaxial properties of PLA manufactured with FDM technology based on product specifications. Int. J. Adv. Manuf. Technol. 2019, 103, 1893–1909. [Google Scholar] [CrossRef]
- Abbas, T.; Othman, F.M.; Ali, H.B. Effect of infill Parameter on compression property in FDM Process. Int. J. Eng. Res. Appl. 2017, 7, 16–19. [Google Scholar]
- Pepelnjak, T.; Karimi, A.; Maček, A.; Mole, N. Altering the Elastic Properties of 3D Printed Poly-Lactic Acid (PLA) Parts by Compressive Cyclic Loading. Materials 2020, 13, 4456. [Google Scholar] [CrossRef] [PubMed]
- Lim, L.-T.; Auras, R.; Rubino, M. Processing technologies for poly(lactic acid). Prog. Polym. Sci. 2008, 33, 820–852. [Google Scholar] [CrossRef]
- Carrasco, F.; Pagès, P.; Gámez-Pérez, J.; Santana, O.O.; Maspoch, M.L. Processing of poly(lactic acid): Characterization of chemical structure, thermal stability and mechanical properties. Polym. Degrad. Stab. 2010, 95, 116–125. [Google Scholar] [CrossRef]
- Subramaniyan, M.; Karuppan, S.; Prabanjan, P.; Pugazh, A.; Pynthamizh, A. Survey on compression property of sandwich 3D printed PLA components. Mater. Today Proc. 2022, 66, 955–961. [Google Scholar] [CrossRef]
- Torre, R.; Brischetto, S.; Dipietro, I.R. Buckling developed in 3D printed PLA cuboidal samples under compression: Analytical, numerical and experimental investigations. Addit. Manuf. 2021, 38, 101790. [Google Scholar] [CrossRef]
- Zhu, Y.; Gao, Y.; Jiang, J.; Gu, H.; Lv, S.; Ni, H.; Wang, X.; Jia, C. Study on effects of FFF 3D printing parameters on mechanical properties of polylactic acid. IOP Conf. Ser. Mater. Sci. Eng. 2019, 688, 2019. [Google Scholar]
- Baich, L.; Manogharan, G.; Marie, H. Study of infill print design on production cost-time of 3D printed ABS parts. Int. J. Rapid Manuf. 2015, 5, 308. [Google Scholar] [CrossRef]
- Brischetto, S.; Torre, R. Tensile and Compressive Behavior in the Experimental Tests for PLA Specimens Produced via Fused Deposition Modelling Technique. J. Compos. Sci. 2020, 4, 140. [Google Scholar] [CrossRef]
- ASTM D638; Standard Test Method for Tensile Properties of Plastics. ASTM International: West Conshohocken, PA, USA, 2014.
- Chicos, L.-A.; Pop, M.A.; Zaharia, S.-M.; Lancea, C.; Buican, G.R.; Pascariu, I.S.; Stamate, V.-M. Infill Density Influence on Mechanical and Thermal Properties of Short Carbon Fiber-Reinforced Polyamide Composites Manufactured by FFF Process. Materials 2022, 15, 3706. [Google Scholar] [CrossRef] [PubMed]
- ASTM D790; Standard Test Methods for Flexural Properties of Unreinforced and Reinforced Plastics and Electrical Insulating Materials1. ASTM International: West Conshohocken, PA, USA, 2003.
- ASTM D695-15; Standard Test Method for Compressive Properties of Rigid Plastics. ASTM International: West Conshohocken, PA, USA, 2015.
- Filaticum Glass Reinforced. Available online: https://filaticum.com/en/product/philament-glass-reinforced/ (accessed on 16 August 2022).
- Filaticum Comparision Datasheet. Available online: https://filaticum.com/wp-content/uploads/2021/03/filaticum.com-comparison-datasheet-2021-0308.pdf (accessed on 16 August 2022).
- ASTM D3418-21; Standard Test Method for Transition Temperatures and Enthalpies of Fusion and Crystallization of Polymers by Differential Scanning Calorimetry. ASTM International: West Conshohocken, PA, USA, 2021.
- ASTM E1131-20; Standard Test Method for Compositional Analysis by Thermogravimetry. ASTM International: Conshohocken, PA, USA, 2020.
- Wang, K.; Xie, X.; Wang, J.; Zhao, A.; Peng, Y.; Rao, Y. Effects of infill characteristics and strain rate on the deformation and failure properties of additively manufactured polyamide-based composite structures. Results Phys. 2020, 18, 103346. [Google Scholar] [CrossRef]
- Querin, O.M.; Toporov, V.V.; Liu, D.; Busch, L.H.; Hühne, C.; Niemann, S.; Kolesnikov, B. Topology and Parametric Optimization of a Lattice Composite Fuselage Structure. Altair University: Troy, MI, USA, 2014; Available online: https://altairuniversity.com/wp-content/uploads/2014/04/Topology_and_Parametric_Optimization-of-a-latice_Composite_Fuselage_Structure_as_published.pdf (accessed on 4 September 2022).
- Kanou, H.; Nabavi, S.; Jam, J. Numerical modeling of stresses and buckling loads of isogrid lattice composite structure cylinders. Int. J. Eng. Sci. Technol. 2013, 5, 42–54. [Google Scholar] [CrossRef] [Green Version]
- van Gent, I.; Kassapoglou, C. Cost-weight trades for modular composite structures. Struct. Multidisc. Optim. 2014, 49, 931–952. [Google Scholar] [CrossRef]
- Im, J.-M.; Shin, K.-B. Study on the prediction method of onset and propagation of damage of unit composite lattice structure. J. Mech. Sci. Technol. 2022, 36, 3081–3088. [Google Scholar] [CrossRef]
- Brischetto, S.; Ferro, C.G.; Maggiore, P.; Torre, R. Compression Tests of ABS Specimens for UAV Components Produced via the FDM Technique. Technologies 2017, 5, 20. [Google Scholar] [CrossRef] [Green Version]
- Rafiee, M.; Hejazi, M.; Amoushahi, H. Buckling response of composite cylindrical shells with various stiffener layouts under uniaxial compressive loading. Structures 2021, 33, 4514–4537. [Google Scholar] [CrossRef]
- Zarei, M.; Rahimi, G.H.; Hemmatnezhad, M. On the buckling resistance of grid-stiffened composite conical shells under compression. Eng. Struct. 2021, 237, 112213. [Google Scholar] [CrossRef]
- Akindoyo, J.O.; Beg, M.D.H.; Ghazali, S.; Heim, H.P.; Feldmann, M.; Mariatti, M. Simultaneous impact modified and chain extended glass fiber reinforced poly(lactic acid) composites: Mechanical, thermal, crystallization, and dynamic mechanical performance. J. Appl. Polym. Sci. 2021, 138, e49752. [Google Scholar] [CrossRef]
- Farah, S.; Anderson, D.; Langer, R. Physical and mechanical properties of PLA, and their functions in widespread applications—A comprehensive review. Adv. Drug Deliv. Rev. 2016, 107, 367–392. [Google Scholar] [CrossRef] [Green Version]
- Pillin, I.; Montrelay, N.; Bourmaud, A.; Grohens, Y. Effect of thermo-mechanical cycles on the physico-chemical properties of poly(lactic acid). Polym. Degrad. Stab. 2008, 93, 321e. [Google Scholar] [CrossRef]
- Sun, Y.; Zheng, Z.; Wang, Y.; Yang, B.; Wang, J.; Mu, W. PLA composites reinforced with rice residues or glass fiber—A review of mechanical properties, thermal properties, and biodegradation properties. J. Polym. Res. 2022, 29, 422. [Google Scholar] [CrossRef]


| Dimension | Fuselage Section | Stringers |
|---|---|---|
| Base diameter [mm] | 160 | |
| Top diameter [mm] | 140 | |
| Fuselage section height [mm] | 80 | |
| Shell thickness [mm] | 1 | |
| Stringers thickness [mm] | 1 | |
| Stringers height [mm] | 4 |
| Parameter | Value | Unit | |
|---|---|---|---|
| Samples | Fuselage Sections | ||
| Filament diameter | 2.85 | [mm] | |
| Layer height | 0.2 | 0.2 | [mm] |
| Infill density | 25; 50; 75; 100 | 100 | [%] |
| Print speed | 50 | 50 | [mm/sec] |
| Extrusion temperature | 250 | 250 | [°C] |
| Building plate temperature | 70 | 70 | [°C] |
| Nozzle diameter | 0.6 | 0.6 | [mm] |
| Number of lower and upper layers | 5 | 5 | |
| Number of shell contours | 2 | 2 | |
| Infill pattern | Rectangular (0°/45° with respect to shell contour) | degree | |
| Samples | Glass Transition Temperature Tg [°C] | Cold Crystallization Temperature Tcc [°C] | Melting Temperature Tm [°C] | Full Degradation Temperature Td [°C] |
|---|---|---|---|---|
| Filament Filaticum PLA-GF | 69.1 | 95.2 | 176.8 | 365.8 |
| Sample 25% ID | 63.8 | 93.0 | 173.5 | 361.8 |
| Sample 50% ID | 64 | 95.7 | 175.9 | 363.7 |
| Sample 75% ID | 65.7 | 93.7 | 178.2 | 366.0 |
| Sample 100% ID | 64.2 | 94.7 | 180.8 | 367.6 |
| Samples | Thermal Stability Tonset | Peak of Burning Tb | Peak of Degradation Td | Mass Loss 20–100 °C | Mass Loss 100–300 °C | Mass Loss 300–500 °C |
|---|---|---|---|---|---|---|
| [°C] | [°C] | [°C] | [%] | [%] | [%] | |
| Filament Filaticum PLA-GF | 311 | 320.2 | 373.1 | +0.10 | −0.24 | −95.44 |
| Sample 25% ID | 311.5 | 326.1 | 370.6 | +0.09 | −0.10 | −95.54 |
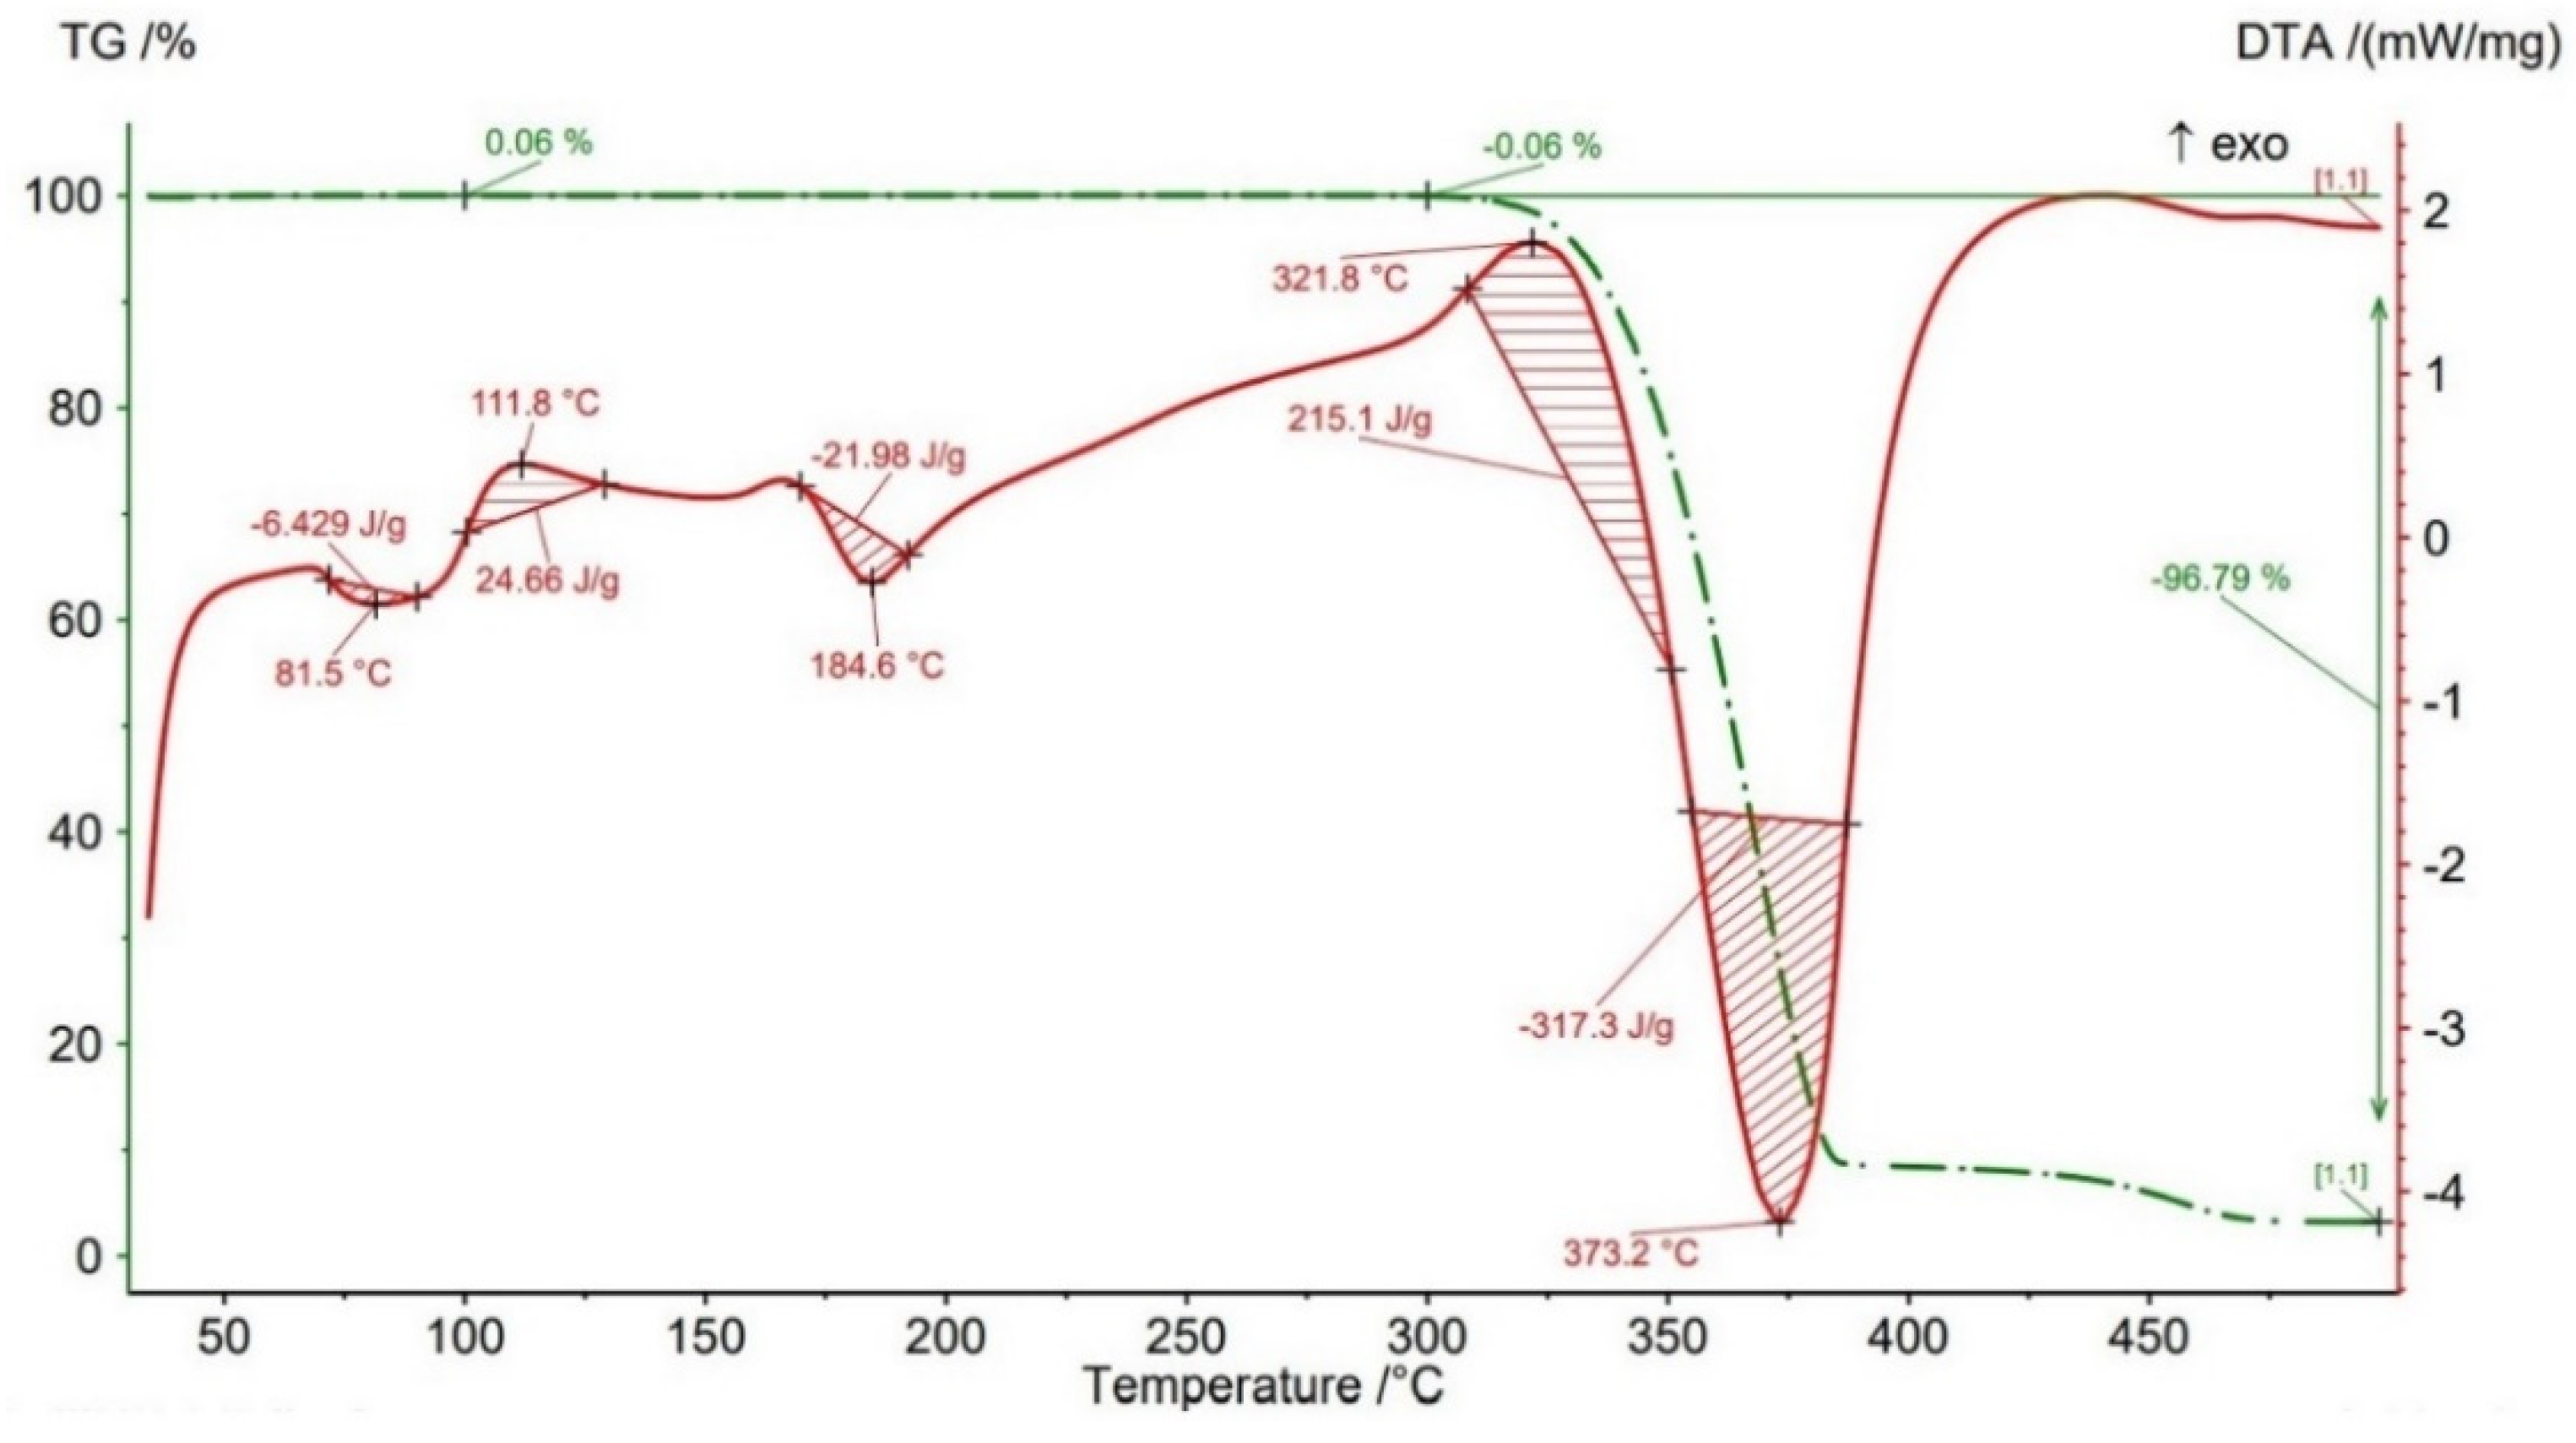
| Sample 50% ID | 312.5 | 321.8 | 373.2 | +0.06 | −0.06 | −96.79 |
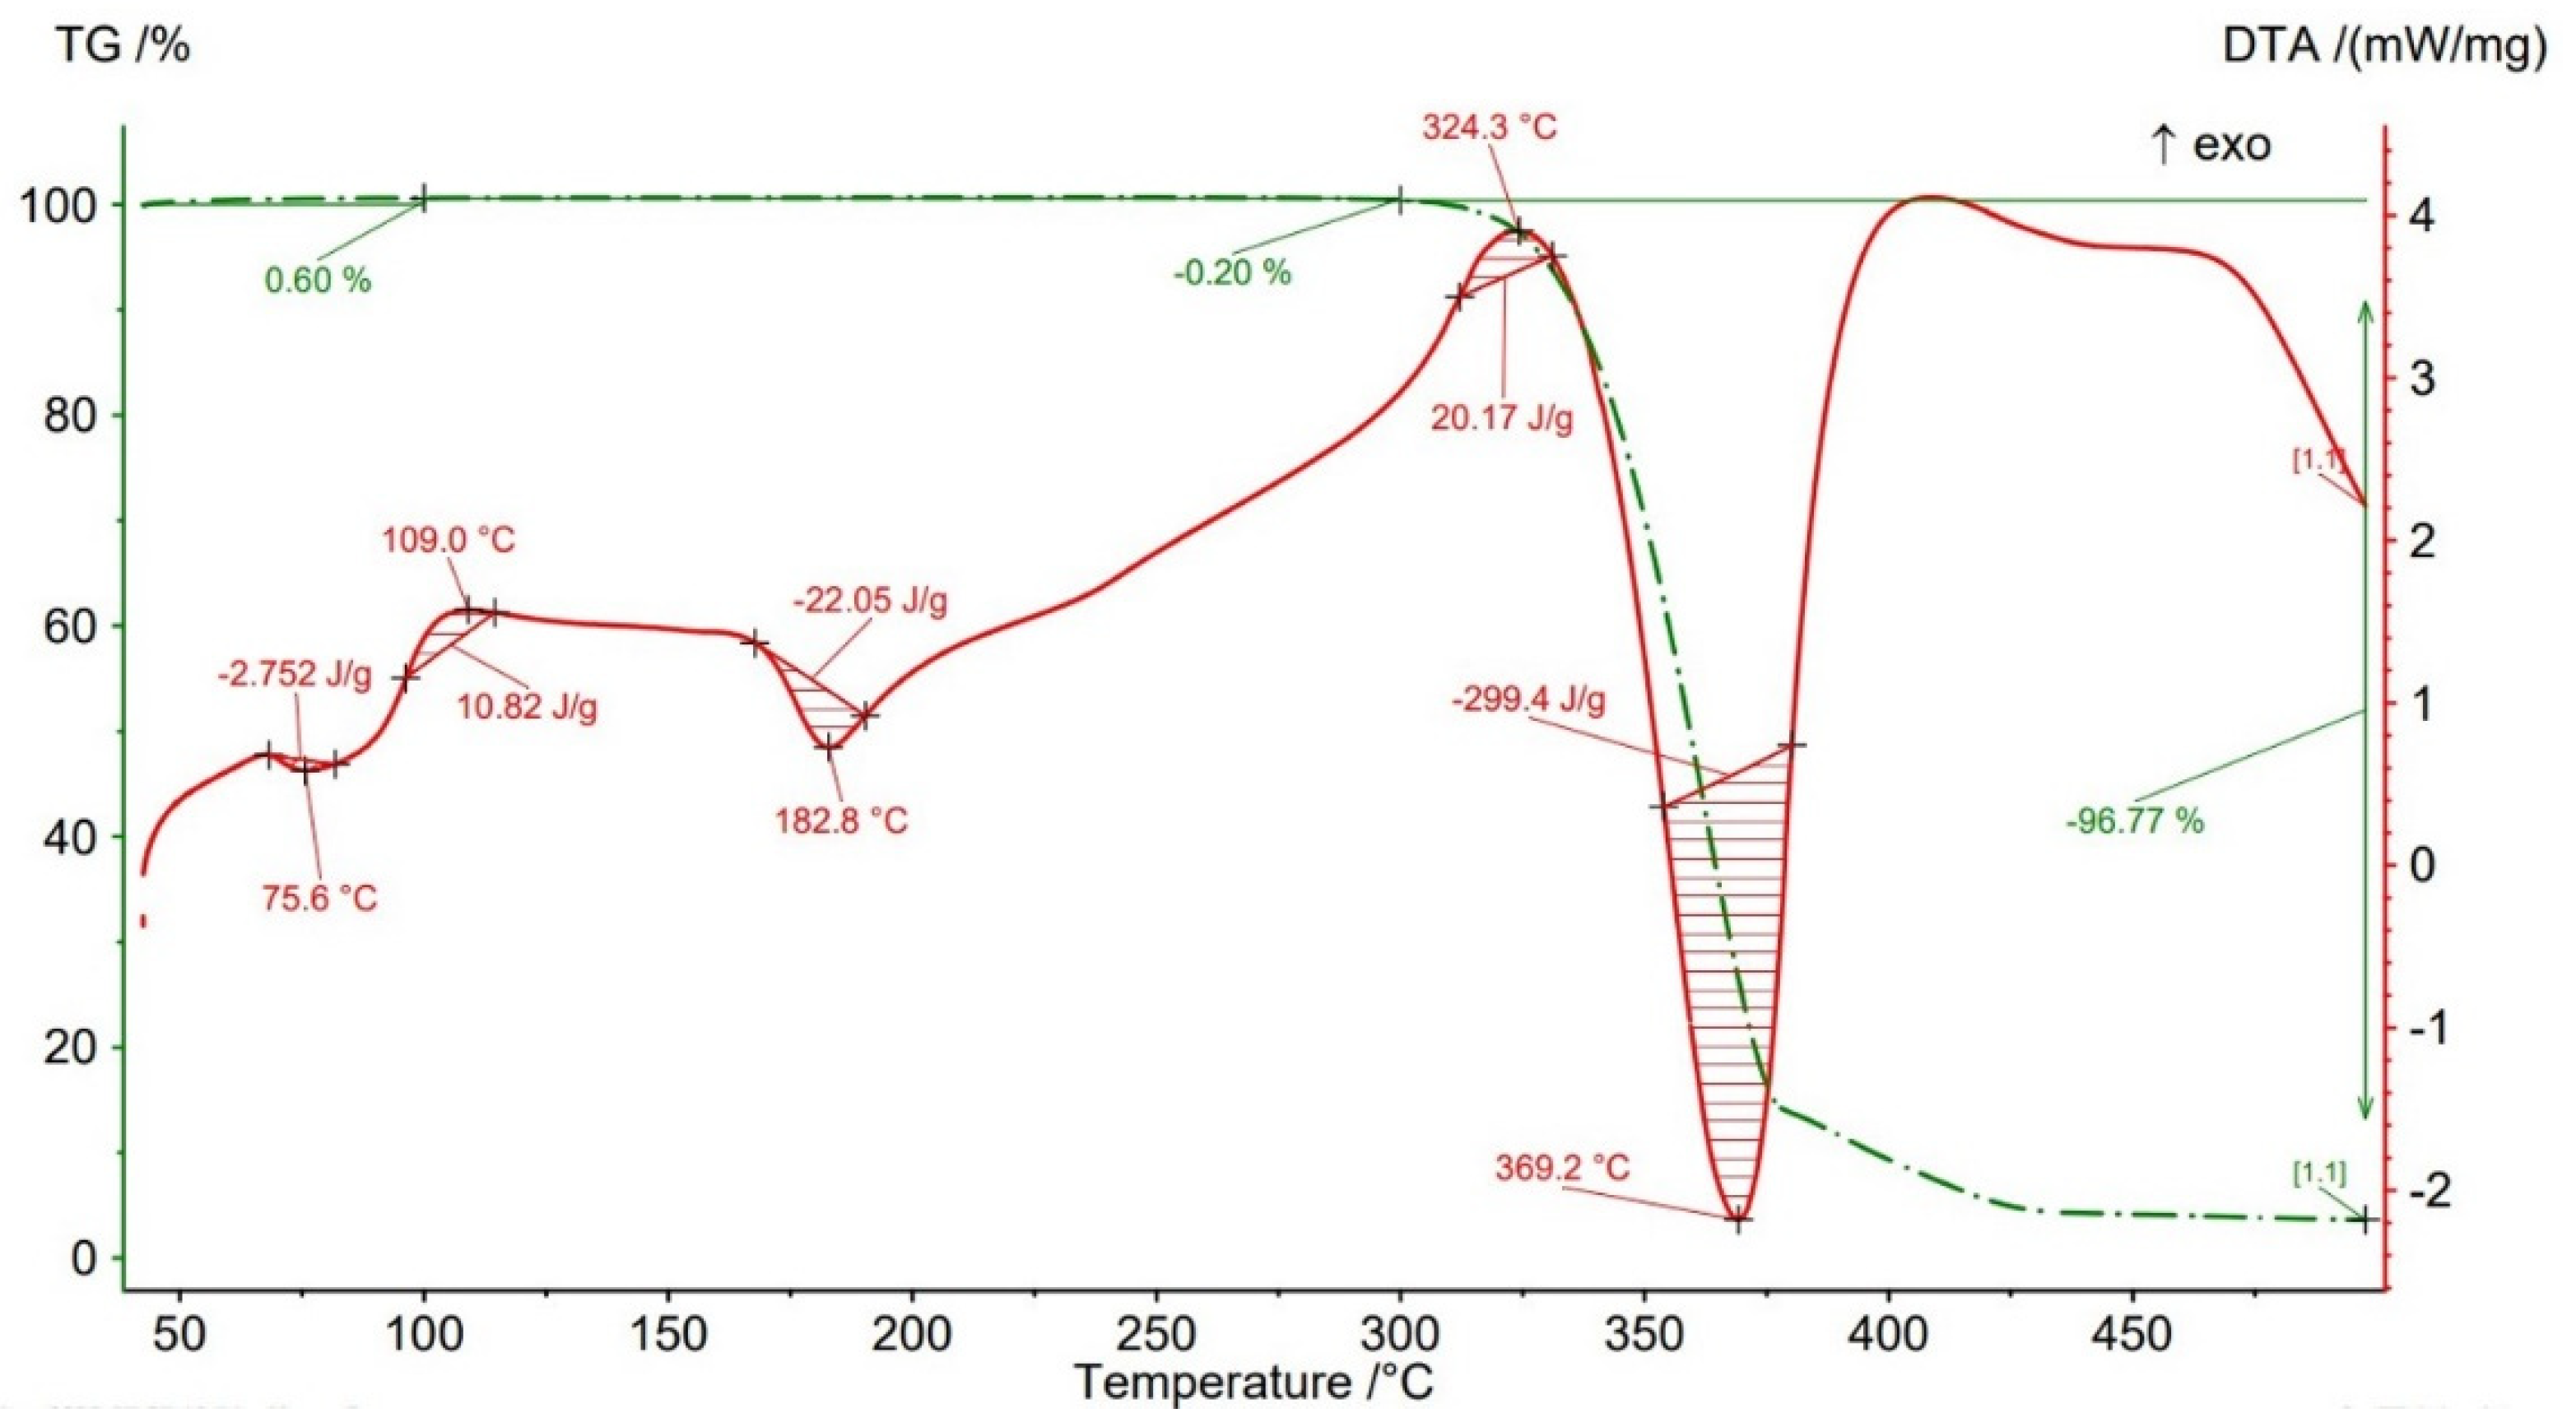
| Sample 75% ID | 309.5 | 324.3 | 369.2 | +0.60 | −0.20 | −96.77 |
| Sample 100% ID | 312.5 | 318.1 | 371.3 | +0.11 | −0.17 | −96.75 |
Publisher’s Note: MDPI stays neutral with regard to jurisdictional claims in published maps and institutional affiliations. |
© 2022 by the authors. Licensee MDPI, Basel, Switzerland. This article is an open access article distributed under the terms and conditions of the Creative Commons Attribution (CC BY) license (https://creativecommons.org/licenses/by/4.0/).
Share and Cite
Chicos, L.-A.; Pop, M.A.; Zaharia, S.-M.; Lancea, C.; Buican, G.R.; Pascariu, I.S.; Stamate, V.-M. Fused Filament Fabrication of Short Glass Fiber-Reinforced Polylactic Acid Composites: Infill Density Influence on Mechanical and Thermal Properties. Polymers 2022, 14, 4988. https://doi.org/10.3390/polym14224988
Chicos L-A, Pop MA, Zaharia S-M, Lancea C, Buican GR, Pascariu IS, Stamate V-M. Fused Filament Fabrication of Short Glass Fiber-Reinforced Polylactic Acid Composites: Infill Density Influence on Mechanical and Thermal Properties. Polymers. 2022; 14(22):4988. https://doi.org/10.3390/polym14224988
Chicago/Turabian StyleChicos, Lucia-Antoneta, Mihai Alin Pop, Sebastian-Marian Zaharia, Camil Lancea, George Razvan Buican, Ionut Stelian Pascariu, and Valentin-Marian Stamate. 2022. "Fused Filament Fabrication of Short Glass Fiber-Reinforced Polylactic Acid Composites: Infill Density Influence on Mechanical and Thermal Properties" Polymers 14, no. 22: 4988. https://doi.org/10.3390/polym14224988