
Thermo-Mechanical Behavior of Novel EPDM Foams Containing a Phase Change Material for Thermal Energy Storage Applications


Abstract
:
1. Introduction
2. Materials and Methods
2.1. Materials
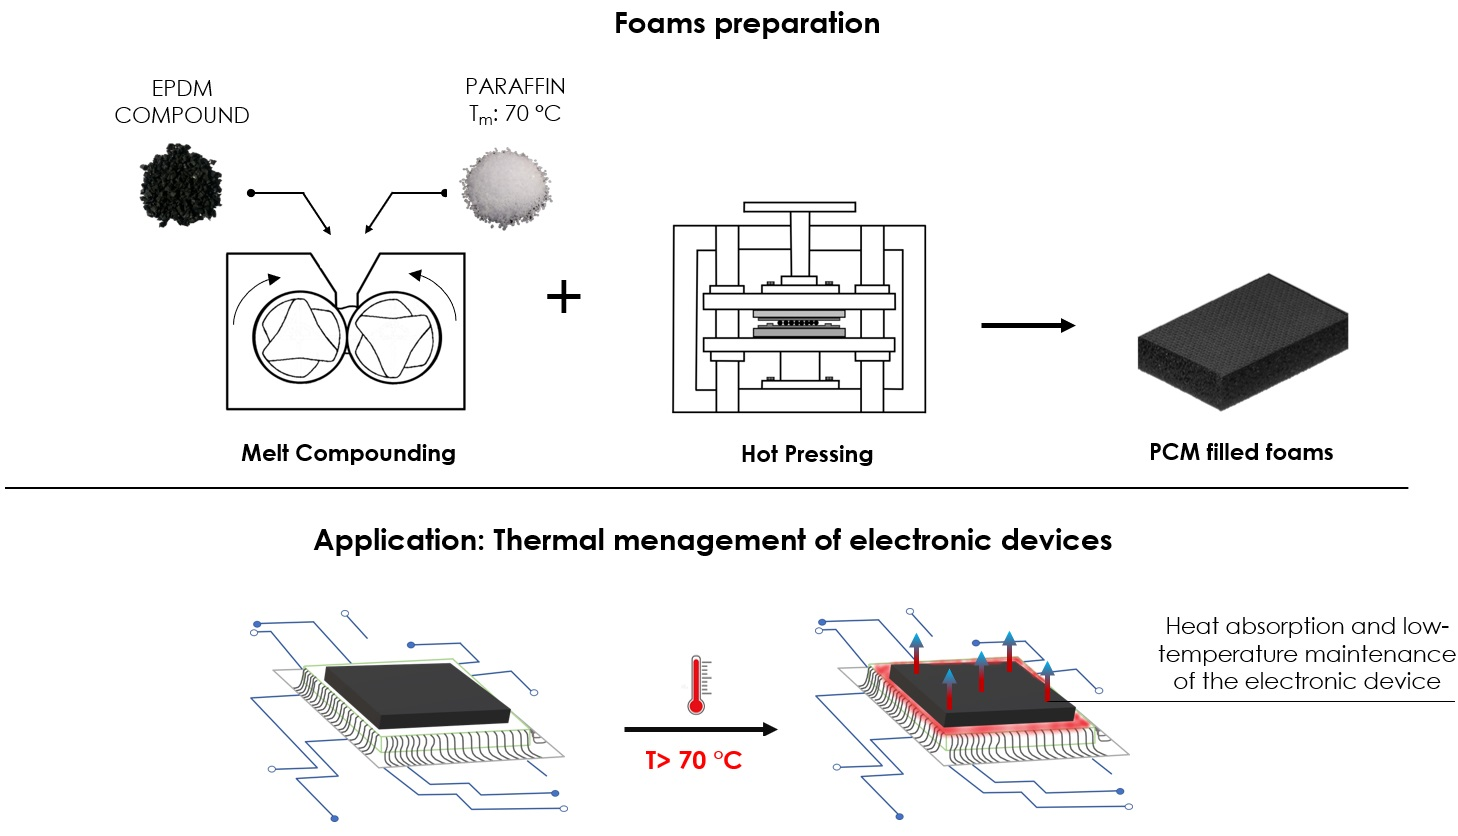
2.2. Sample Preparation
2.2.1. Production of Neat Unfoamed and Foamed Samples
- To produce the non-expanded EPDM sample, after a total compounding time of 10 min, the material was vulcanized under a hydraulic press at a pressure of 8 bar and a temperature of 170 °C in a close mold. The dimensions of the mold were 110 × 110 × 5 mm3.
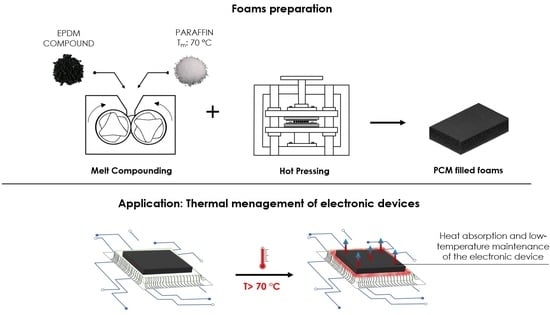
- To produce the neat EPDM foams using H and MP, after 10 min of compounding, the foaming agent was added and mixed for 5 additional minutes. The vulcanization of the material was then carried out in a close mold at a pressure of 1 bar and a temperature of 170 °C. After 10 min, the pressure was released to allow the expansion of the material, and the samples were left for further 10 min to guarantee the completion of the vulcanization process. The dimensions of the mold were 110 × 110 × 5 mm3 and 110 × 110 × 10 mm3 for foams produced with H and MP, respectively. Due to a greater foaming tendency observed in foams produced with MP in preliminary tests, a higher height of the mold was selected for this kind of expanded rubbers.
- To produce neat foams through salt leaching, NaCl and PEG were gradually added to the mixer in order to obtain a homogeneous compound. To assure a uniform distribution of PEG and NaCl, the compound was then milled by means of an IKA M20 Universal mill (IKA, Germany) and fed again in the mixer for a mixing time of 5 min. The vulcanization of the final compound was carried out in a closed mold having dimensions of 110 × 110 × 5 mm3, under a pressure of 1 bar and at a temperature of 170 °C for 20 min. Finally, NaCl and PEG were removed in demineralized water at a temperature of 100 °C for 3 h, leading to the formation of a porous structure in the EPDM matrix. The samples were then dried overnight in an oven at 60 °C.
2.2.2. Production of EPDM/Paraffin Foams
- To produce EPDM/paraffin foams with H and MP, the same procedure of the corresponding neat samples was followed, with the only difference that paraffin was gradually fed in the mixer after the addition of the foaming agent and compounded for 20 min, to obtain a uniform distribution of paraffin in the compound.
- To prepare EPDM/paraffin foams through salt leaching method, once the corresponding neat foam was produced, the addition of paraffin was carried out by pouring the molten PCM at 90 °C on the surface of the sample. With the aid of a spoon, paraffin was distributed on the surface of the foam before its solidification took place. Finally, the sample was maintained for 20 min in an oven at 90 °C, to improve impregnation.
2.3. Characterization
2.3.1. Scanning Electron Microscopy (SEM)
2.3.2. Density Measurements
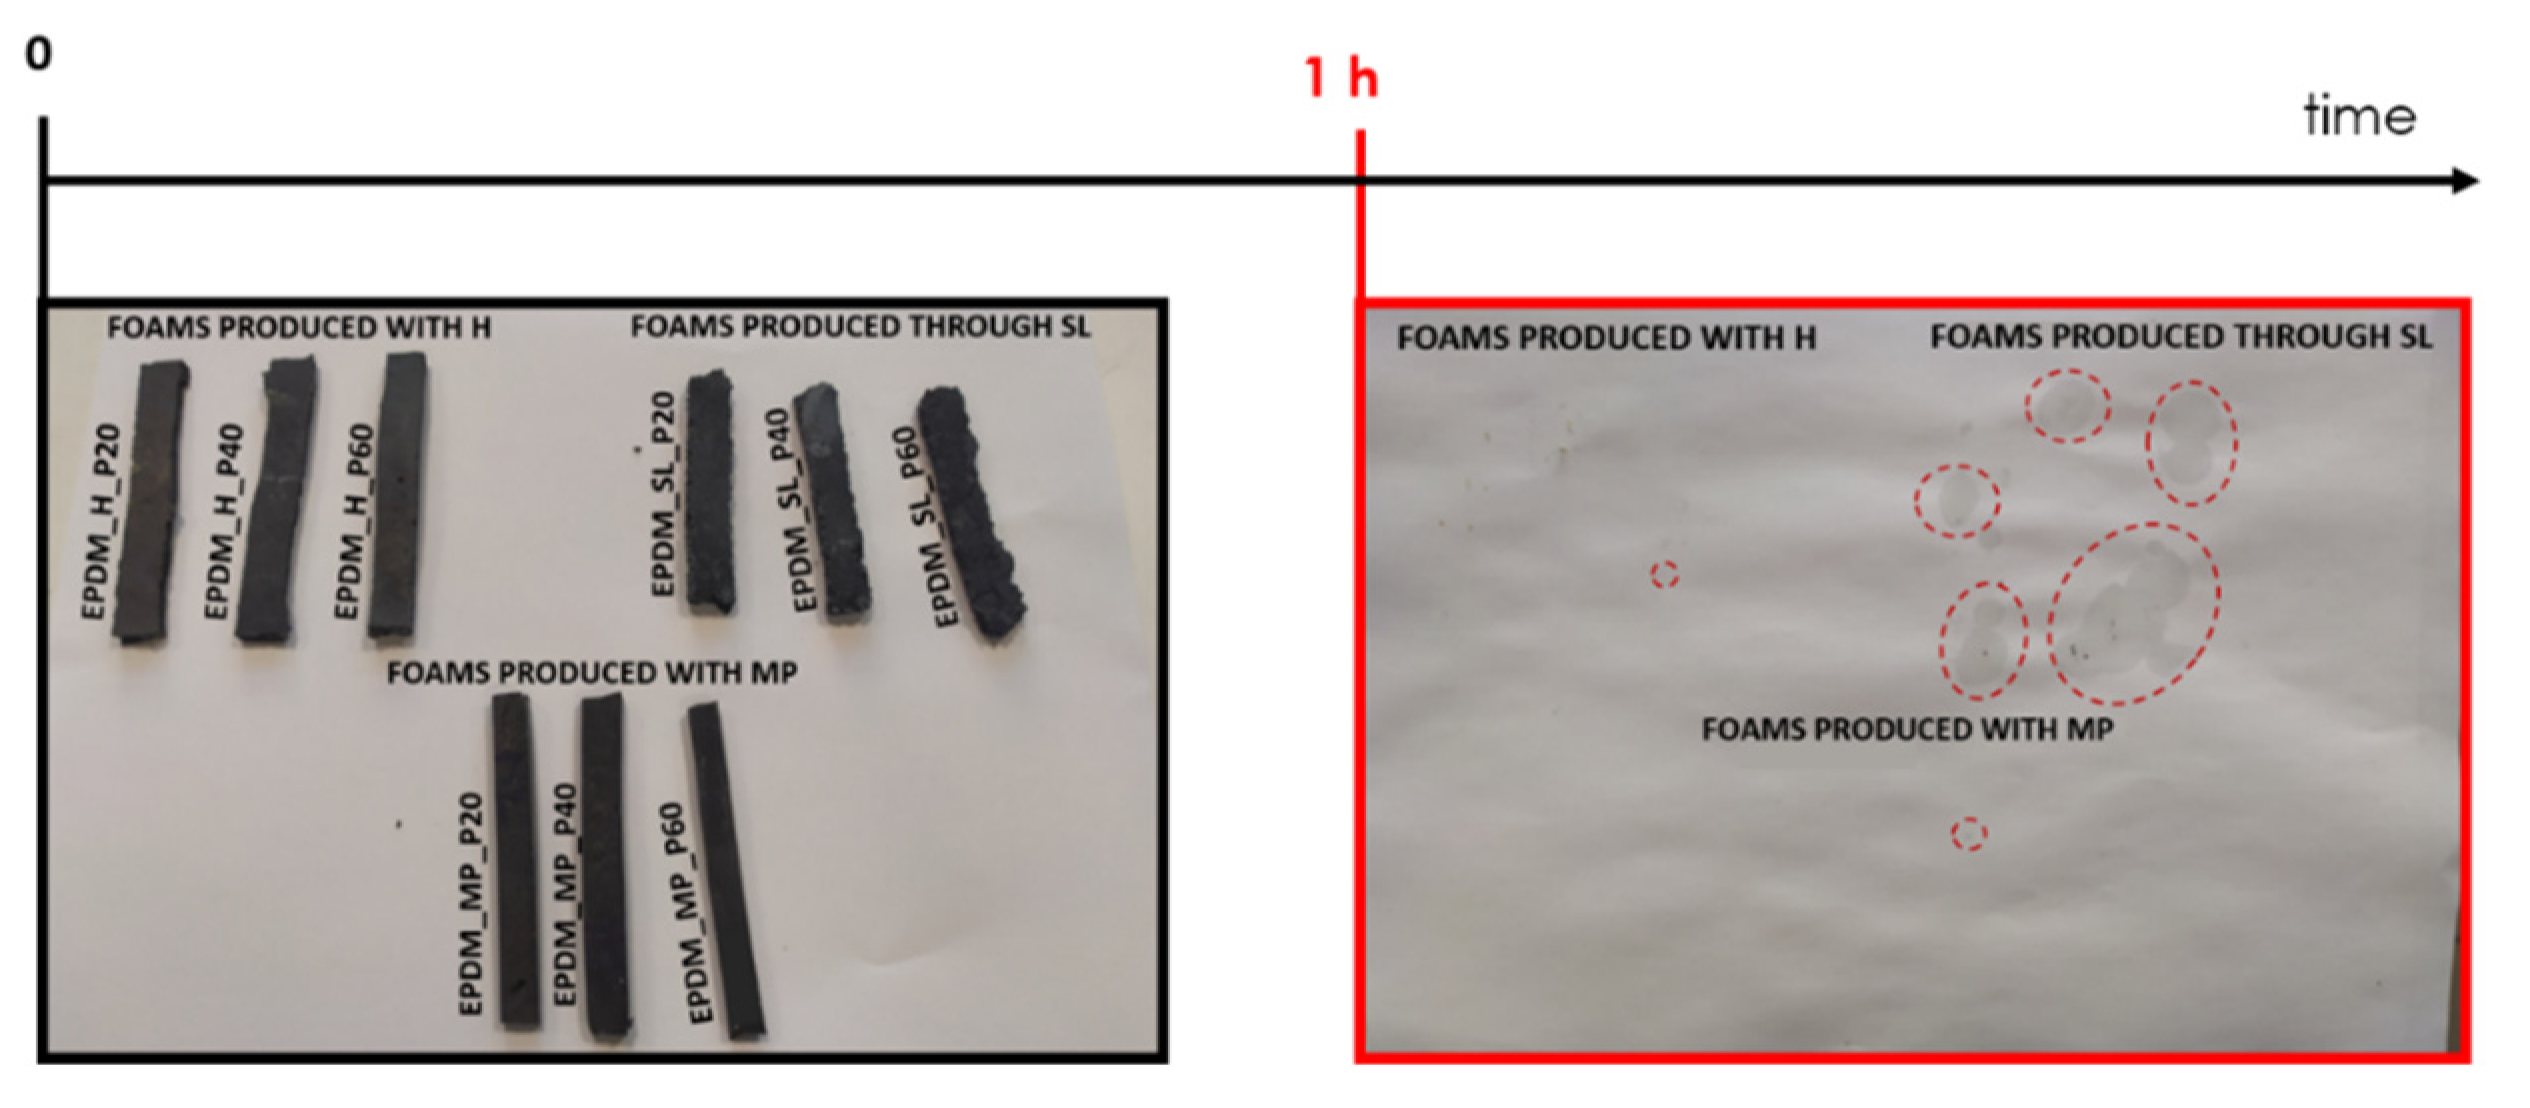
2.3.3. Qualitative Evaluation of Paraffin Leakage
2.3.4. Rheology
2.3.5. Thermogravimetric Analysis (TGA)
2.3.6. Differential Scanning Calorimetry (DSC)
2.3.7. Thermal Conductivity Measurements
2.3.8. Quasi-Static Tensile Tests
2.3.9. Quasi-Static Compression Tests
2.3.10. Shore A
3. Results and Discussion
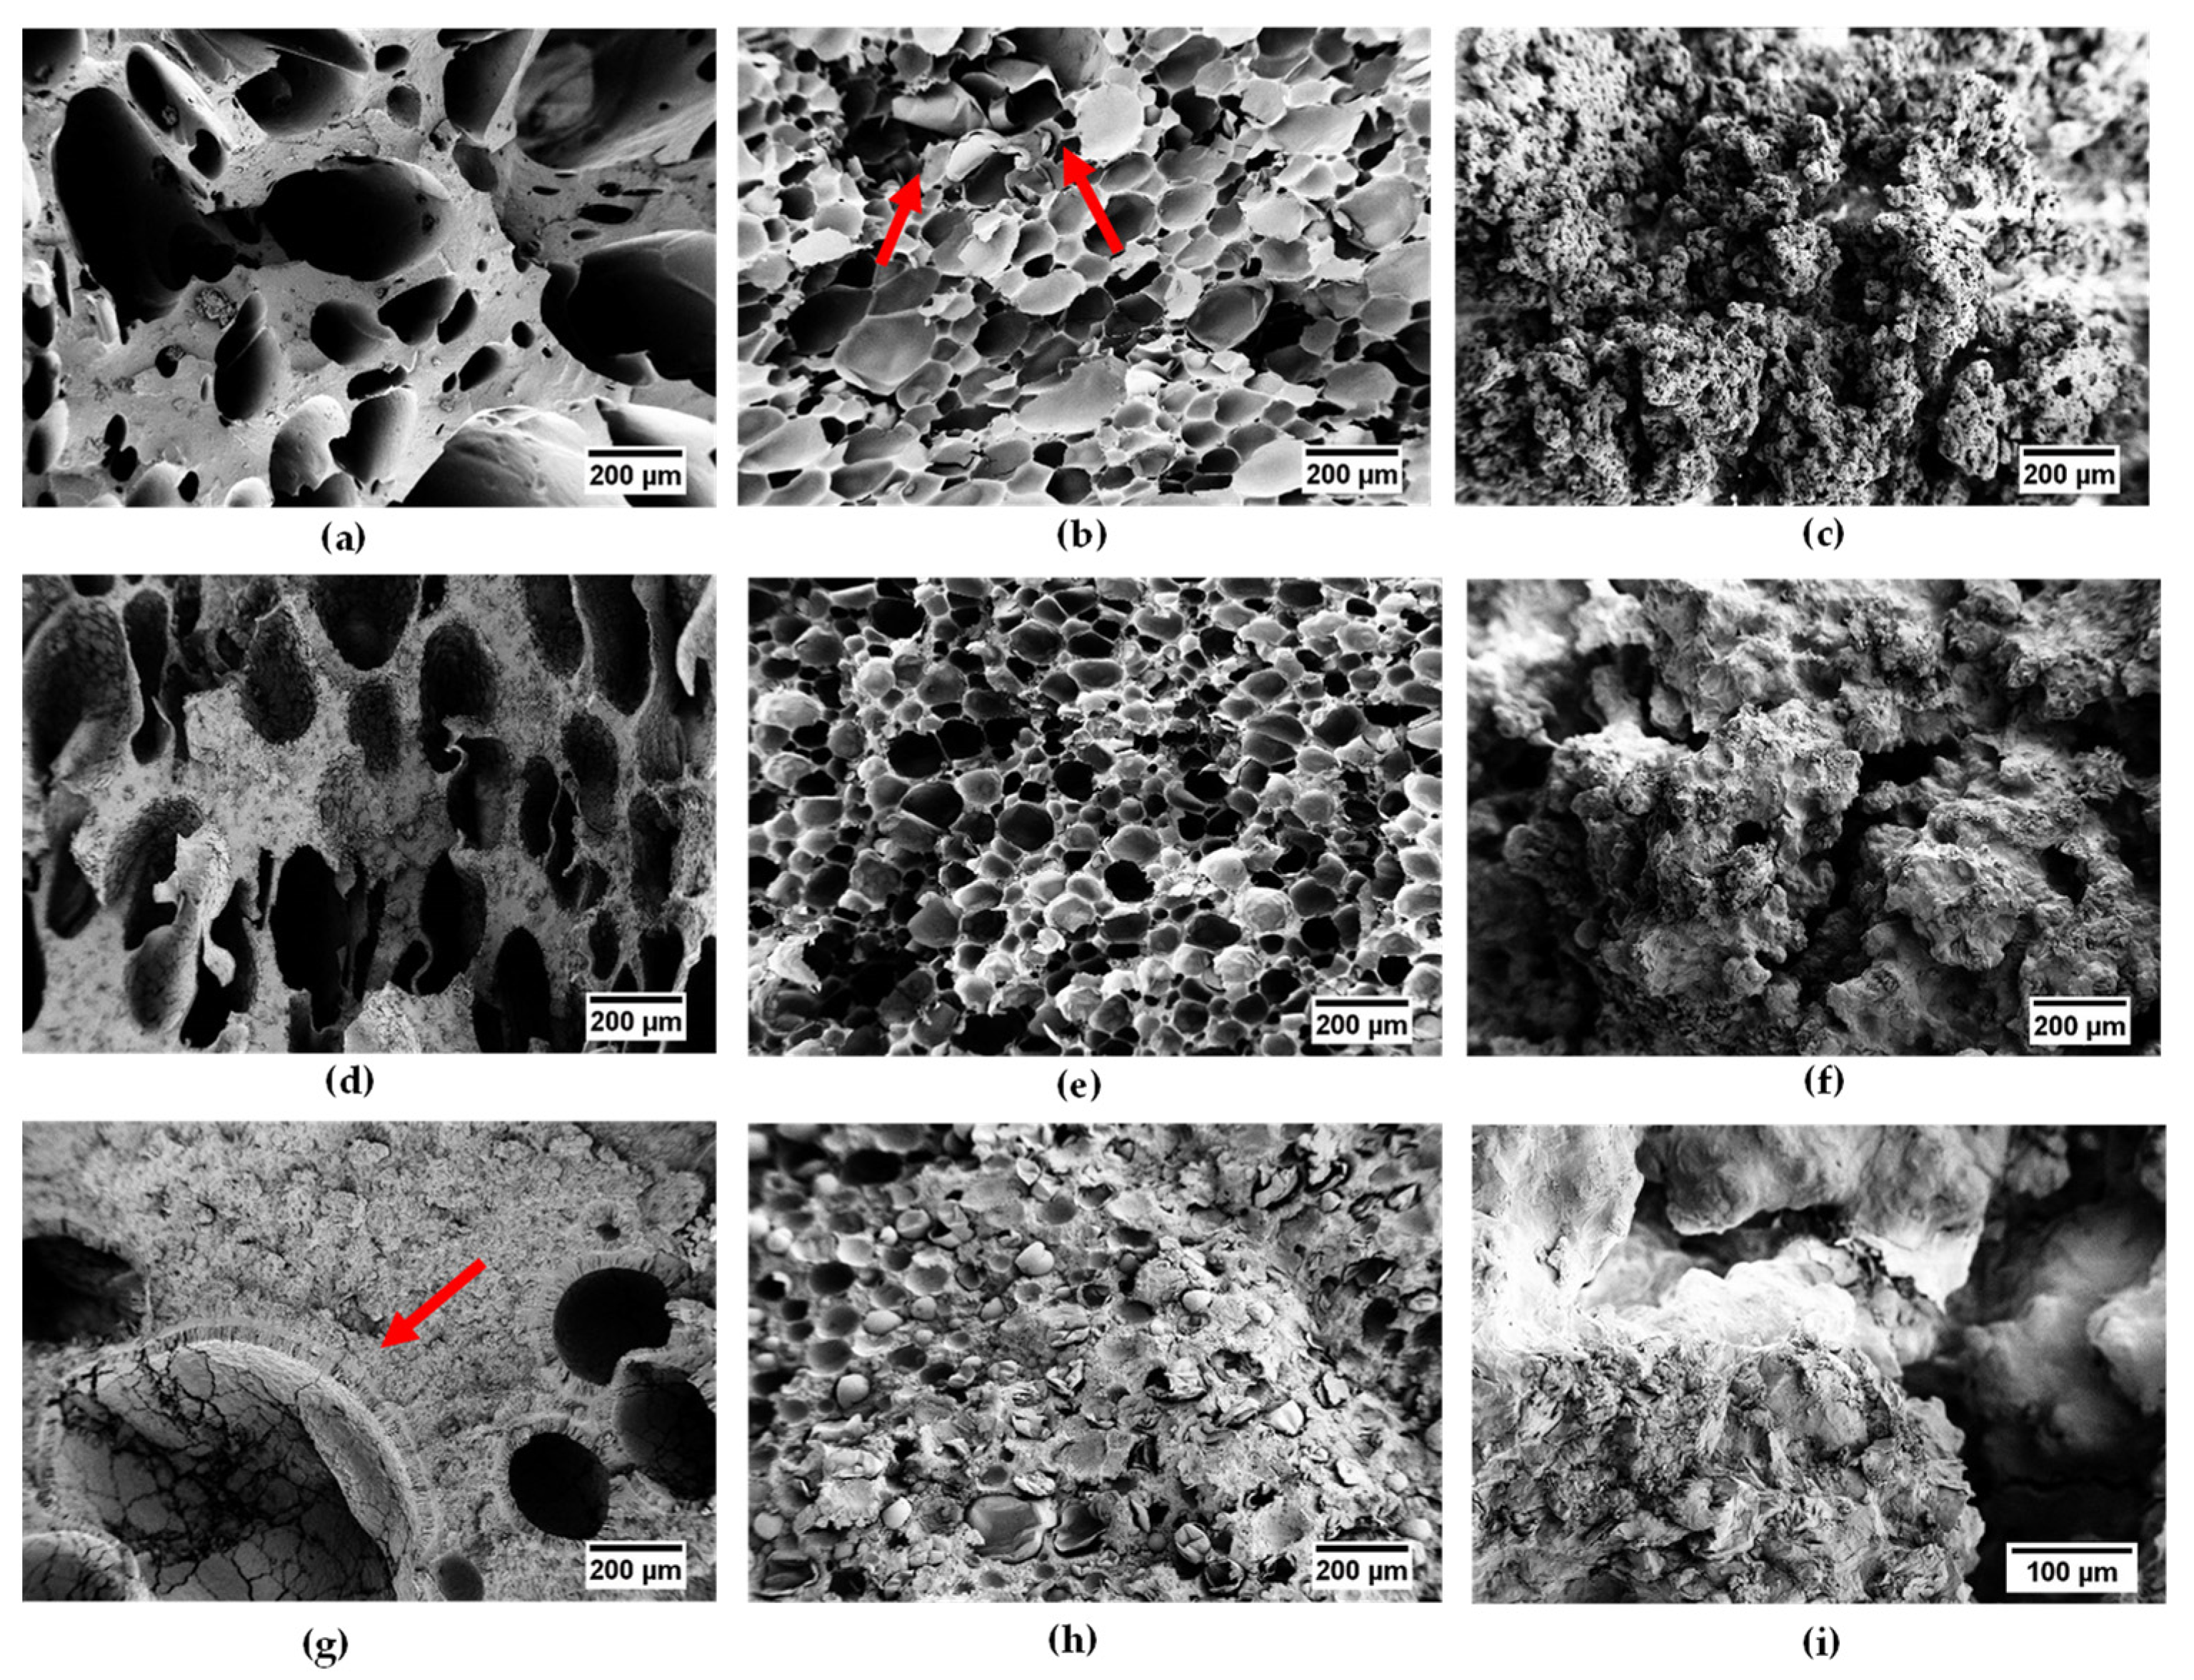
3.1. SEM
3.2. Density Measurements
3.3. Qualitative Analysis of Paraffin Leakage
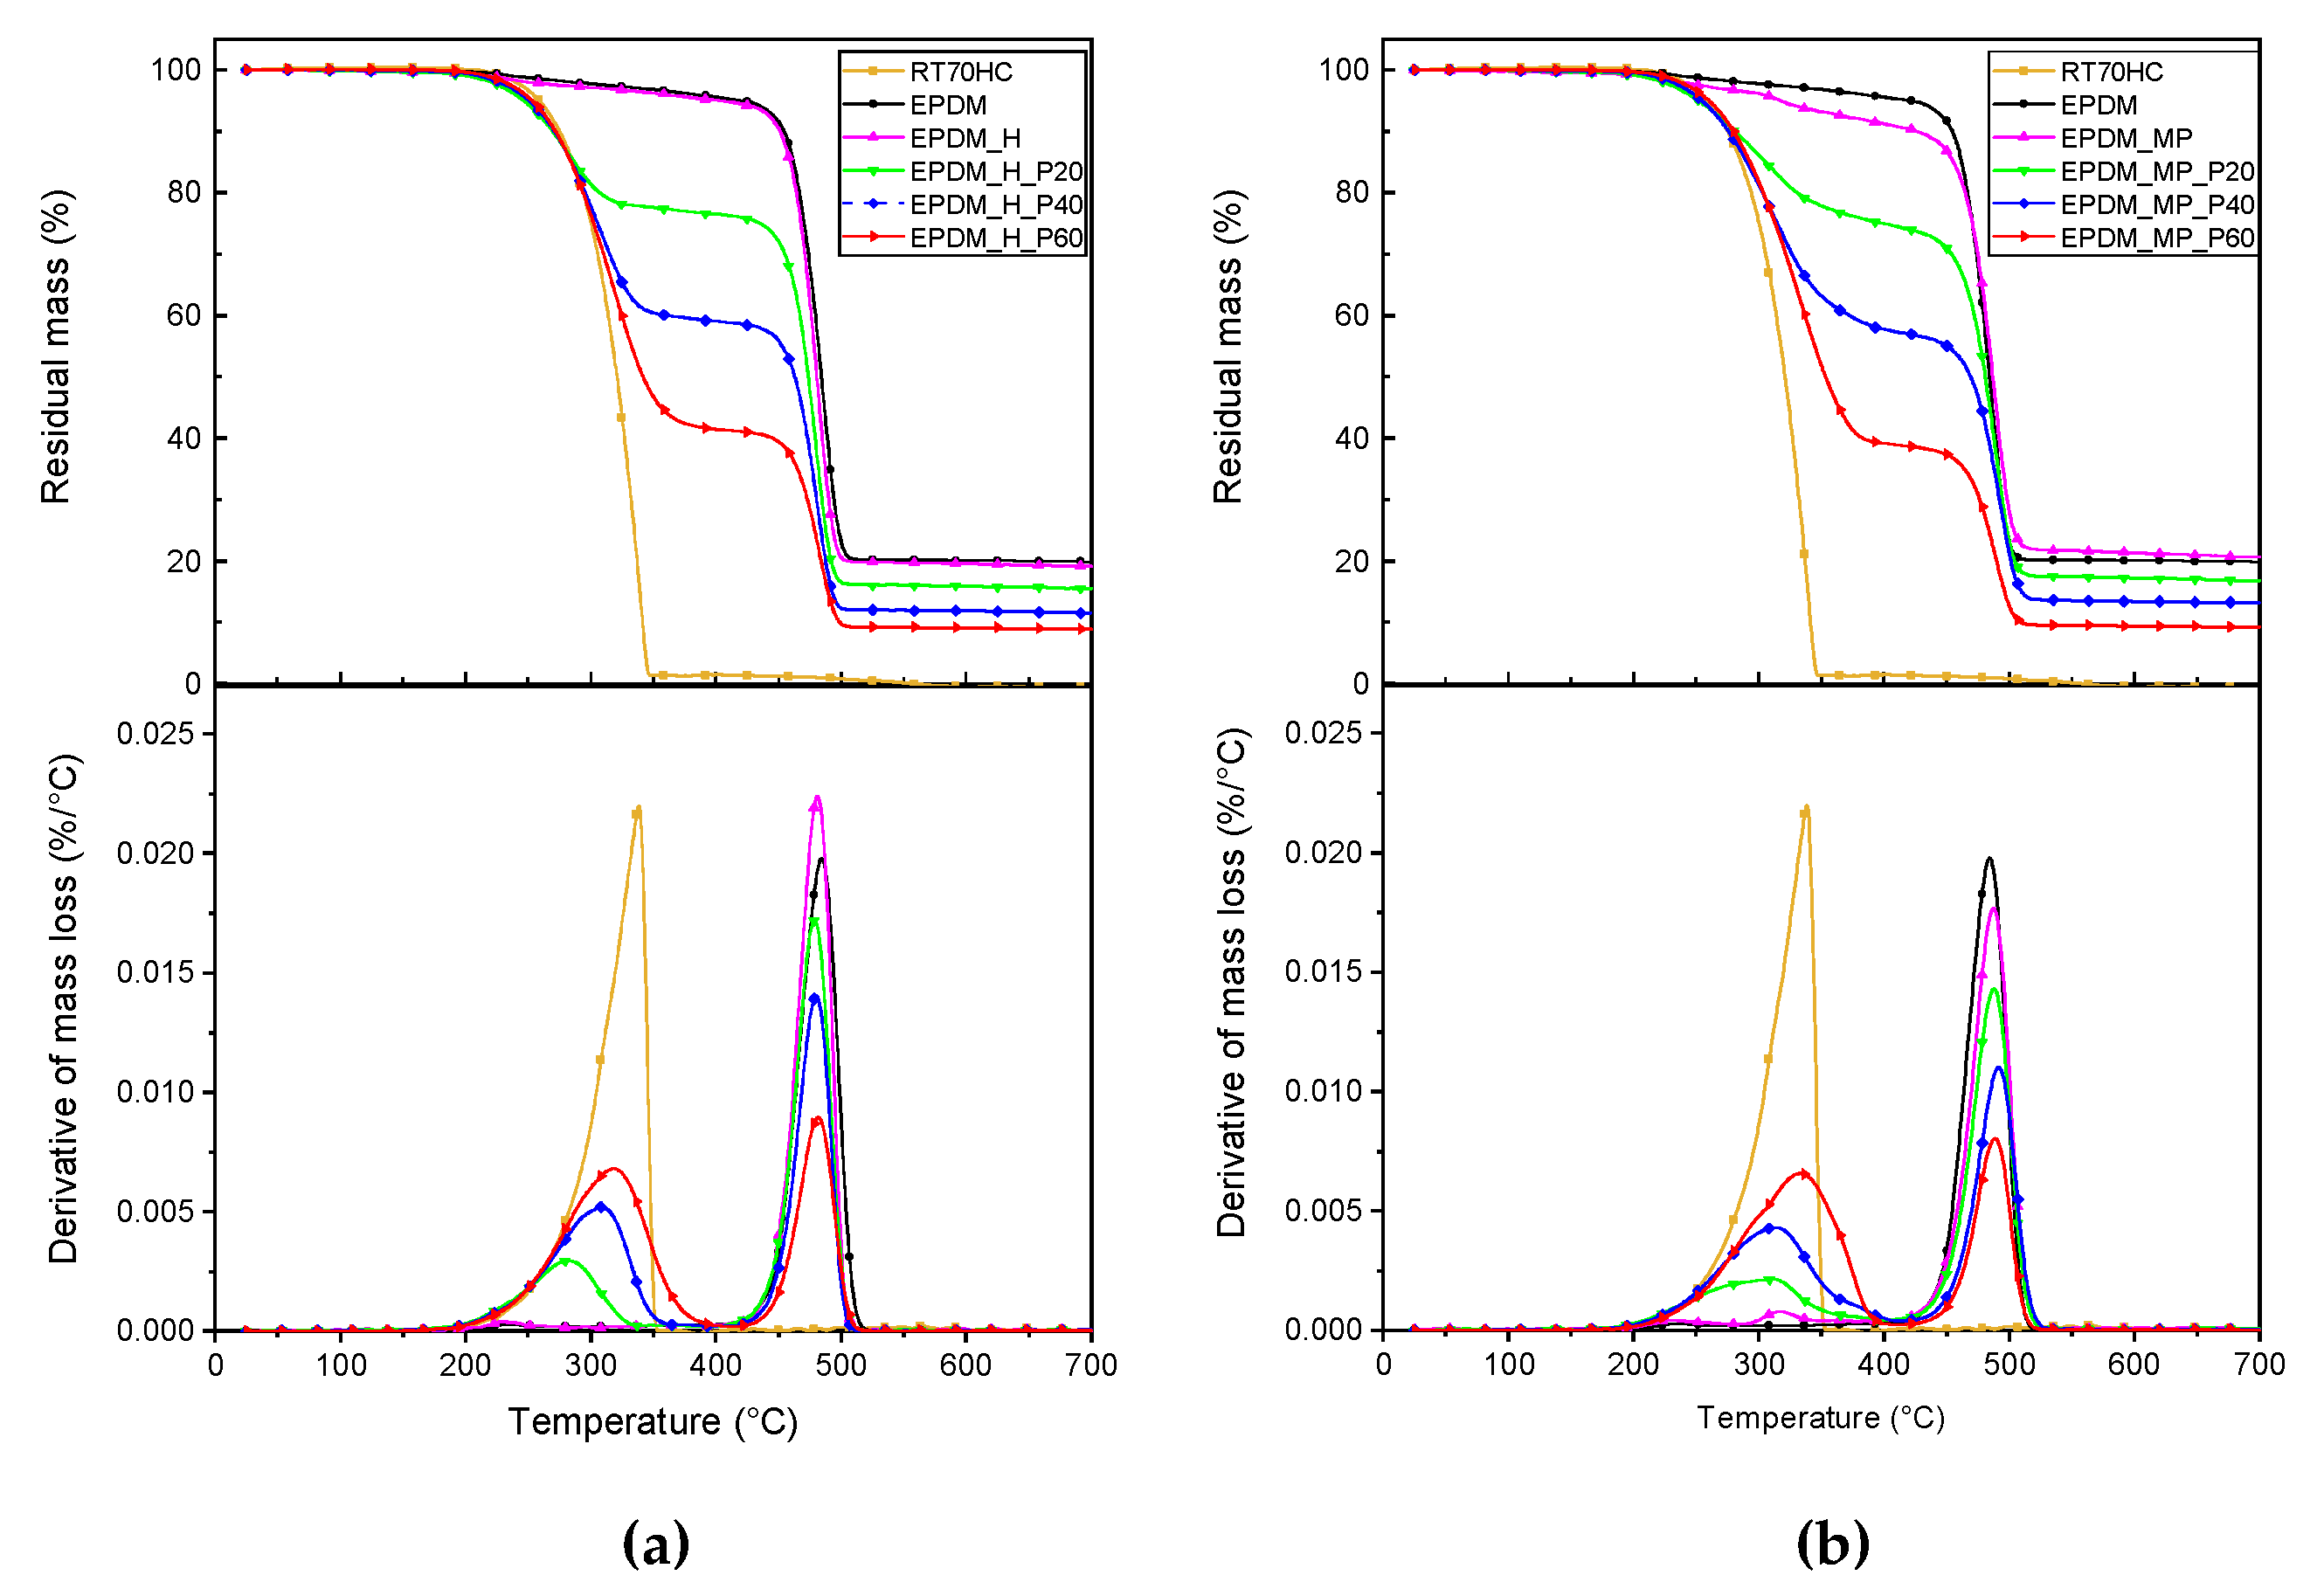
3.4. TGA
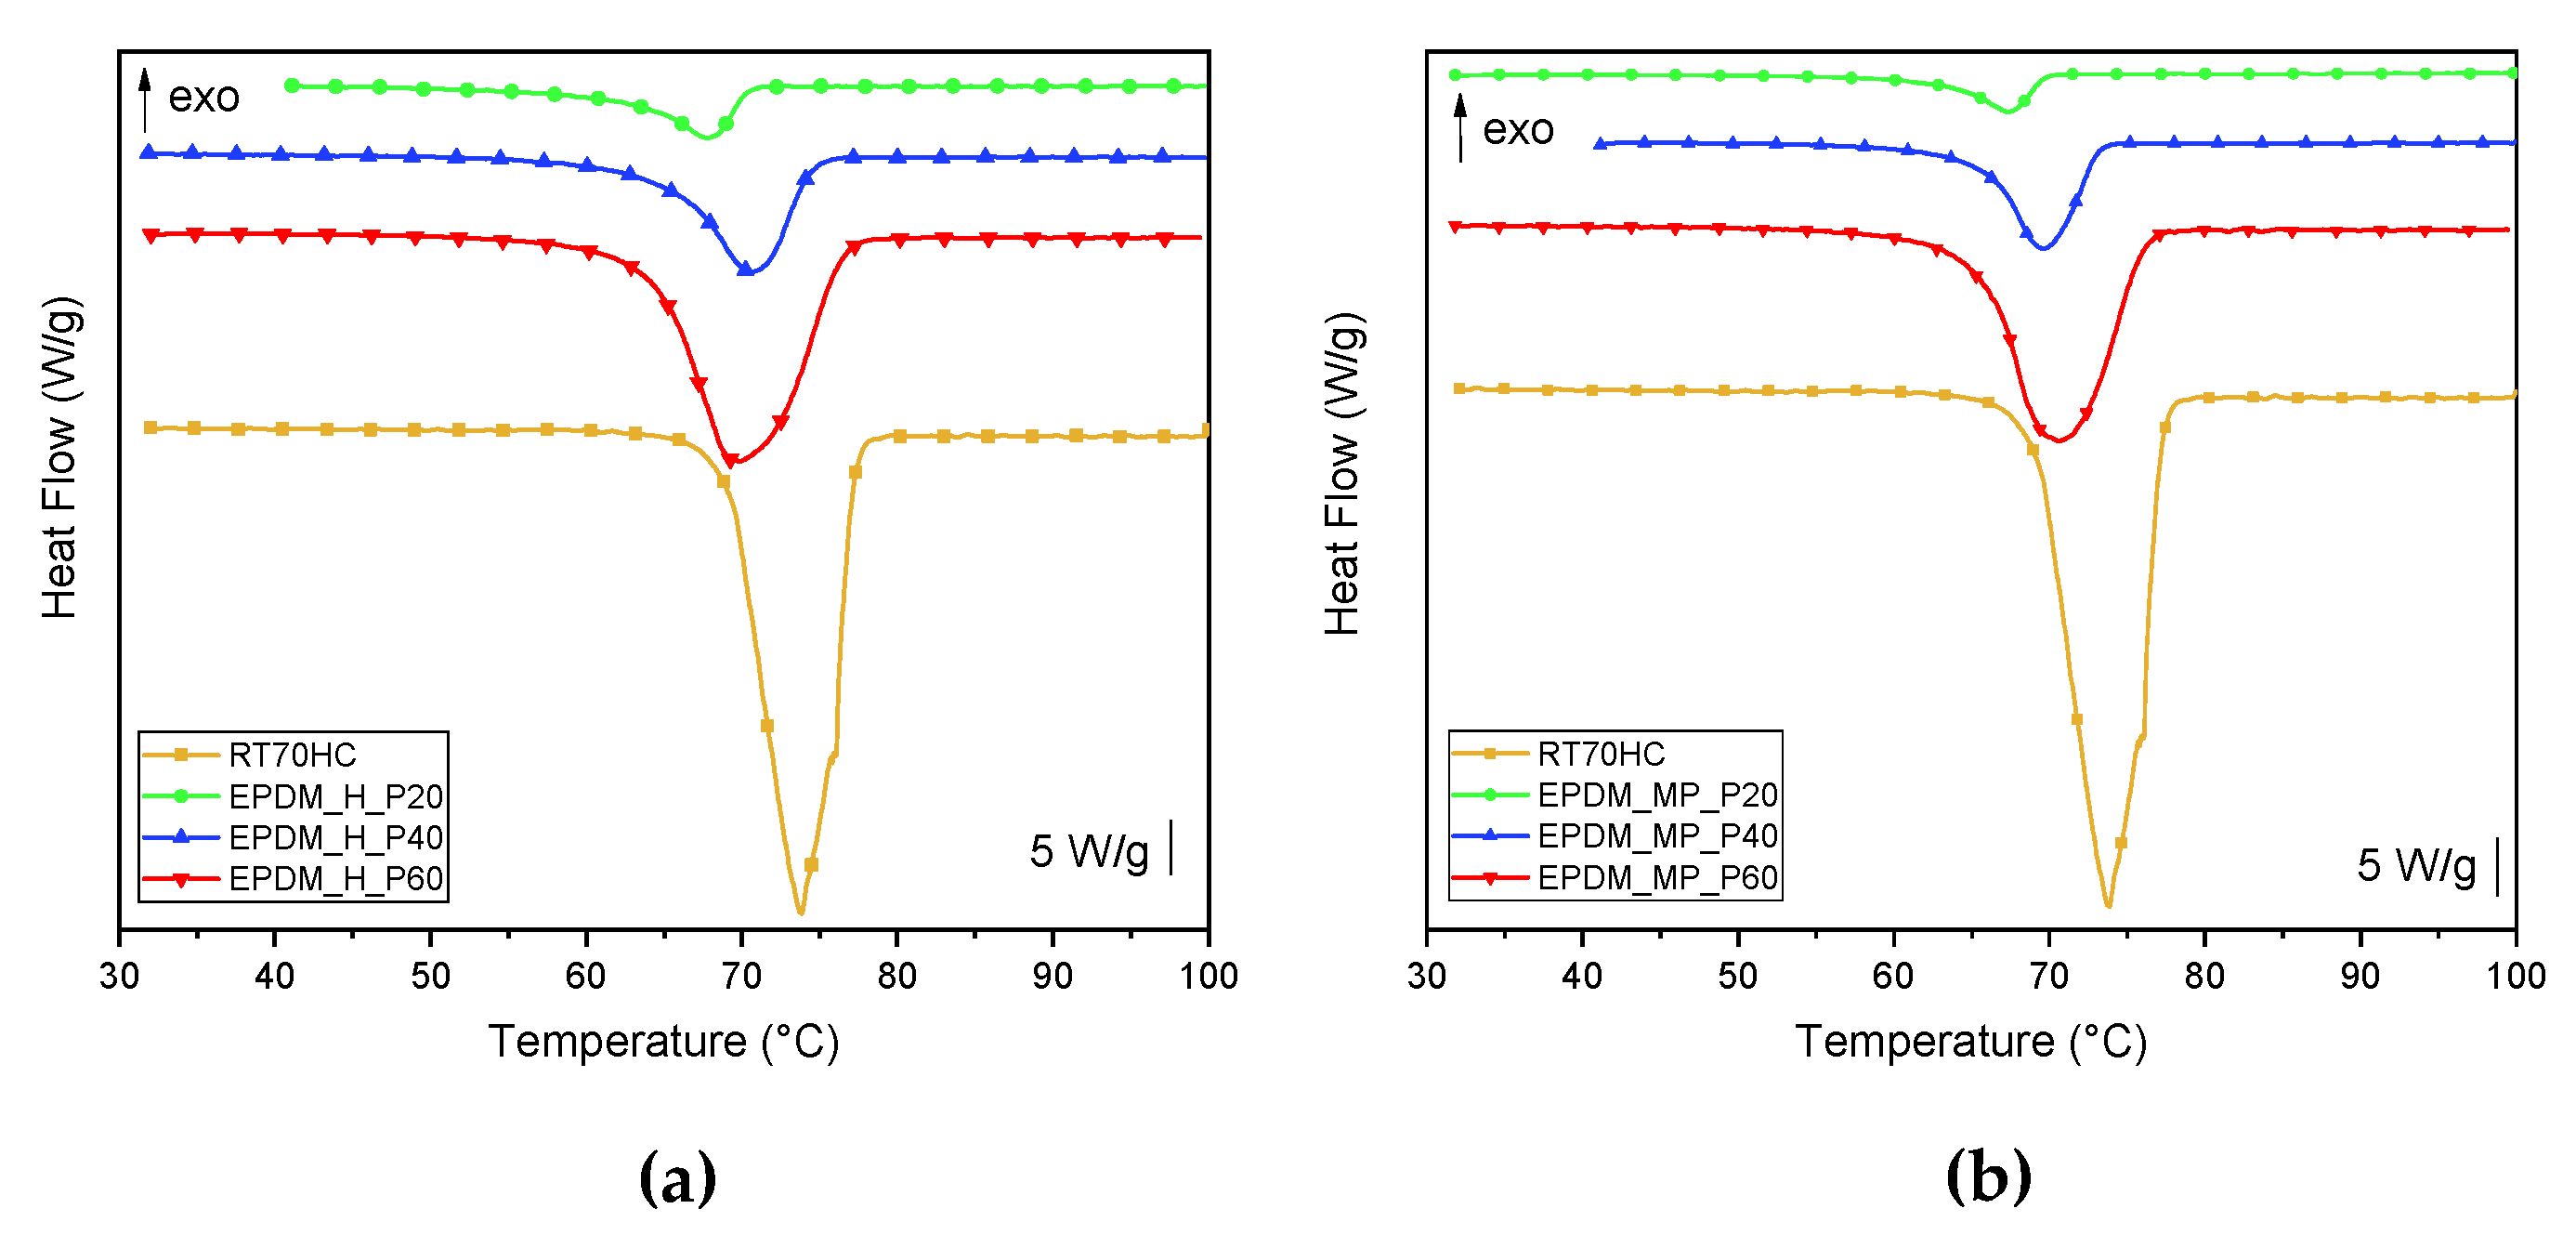
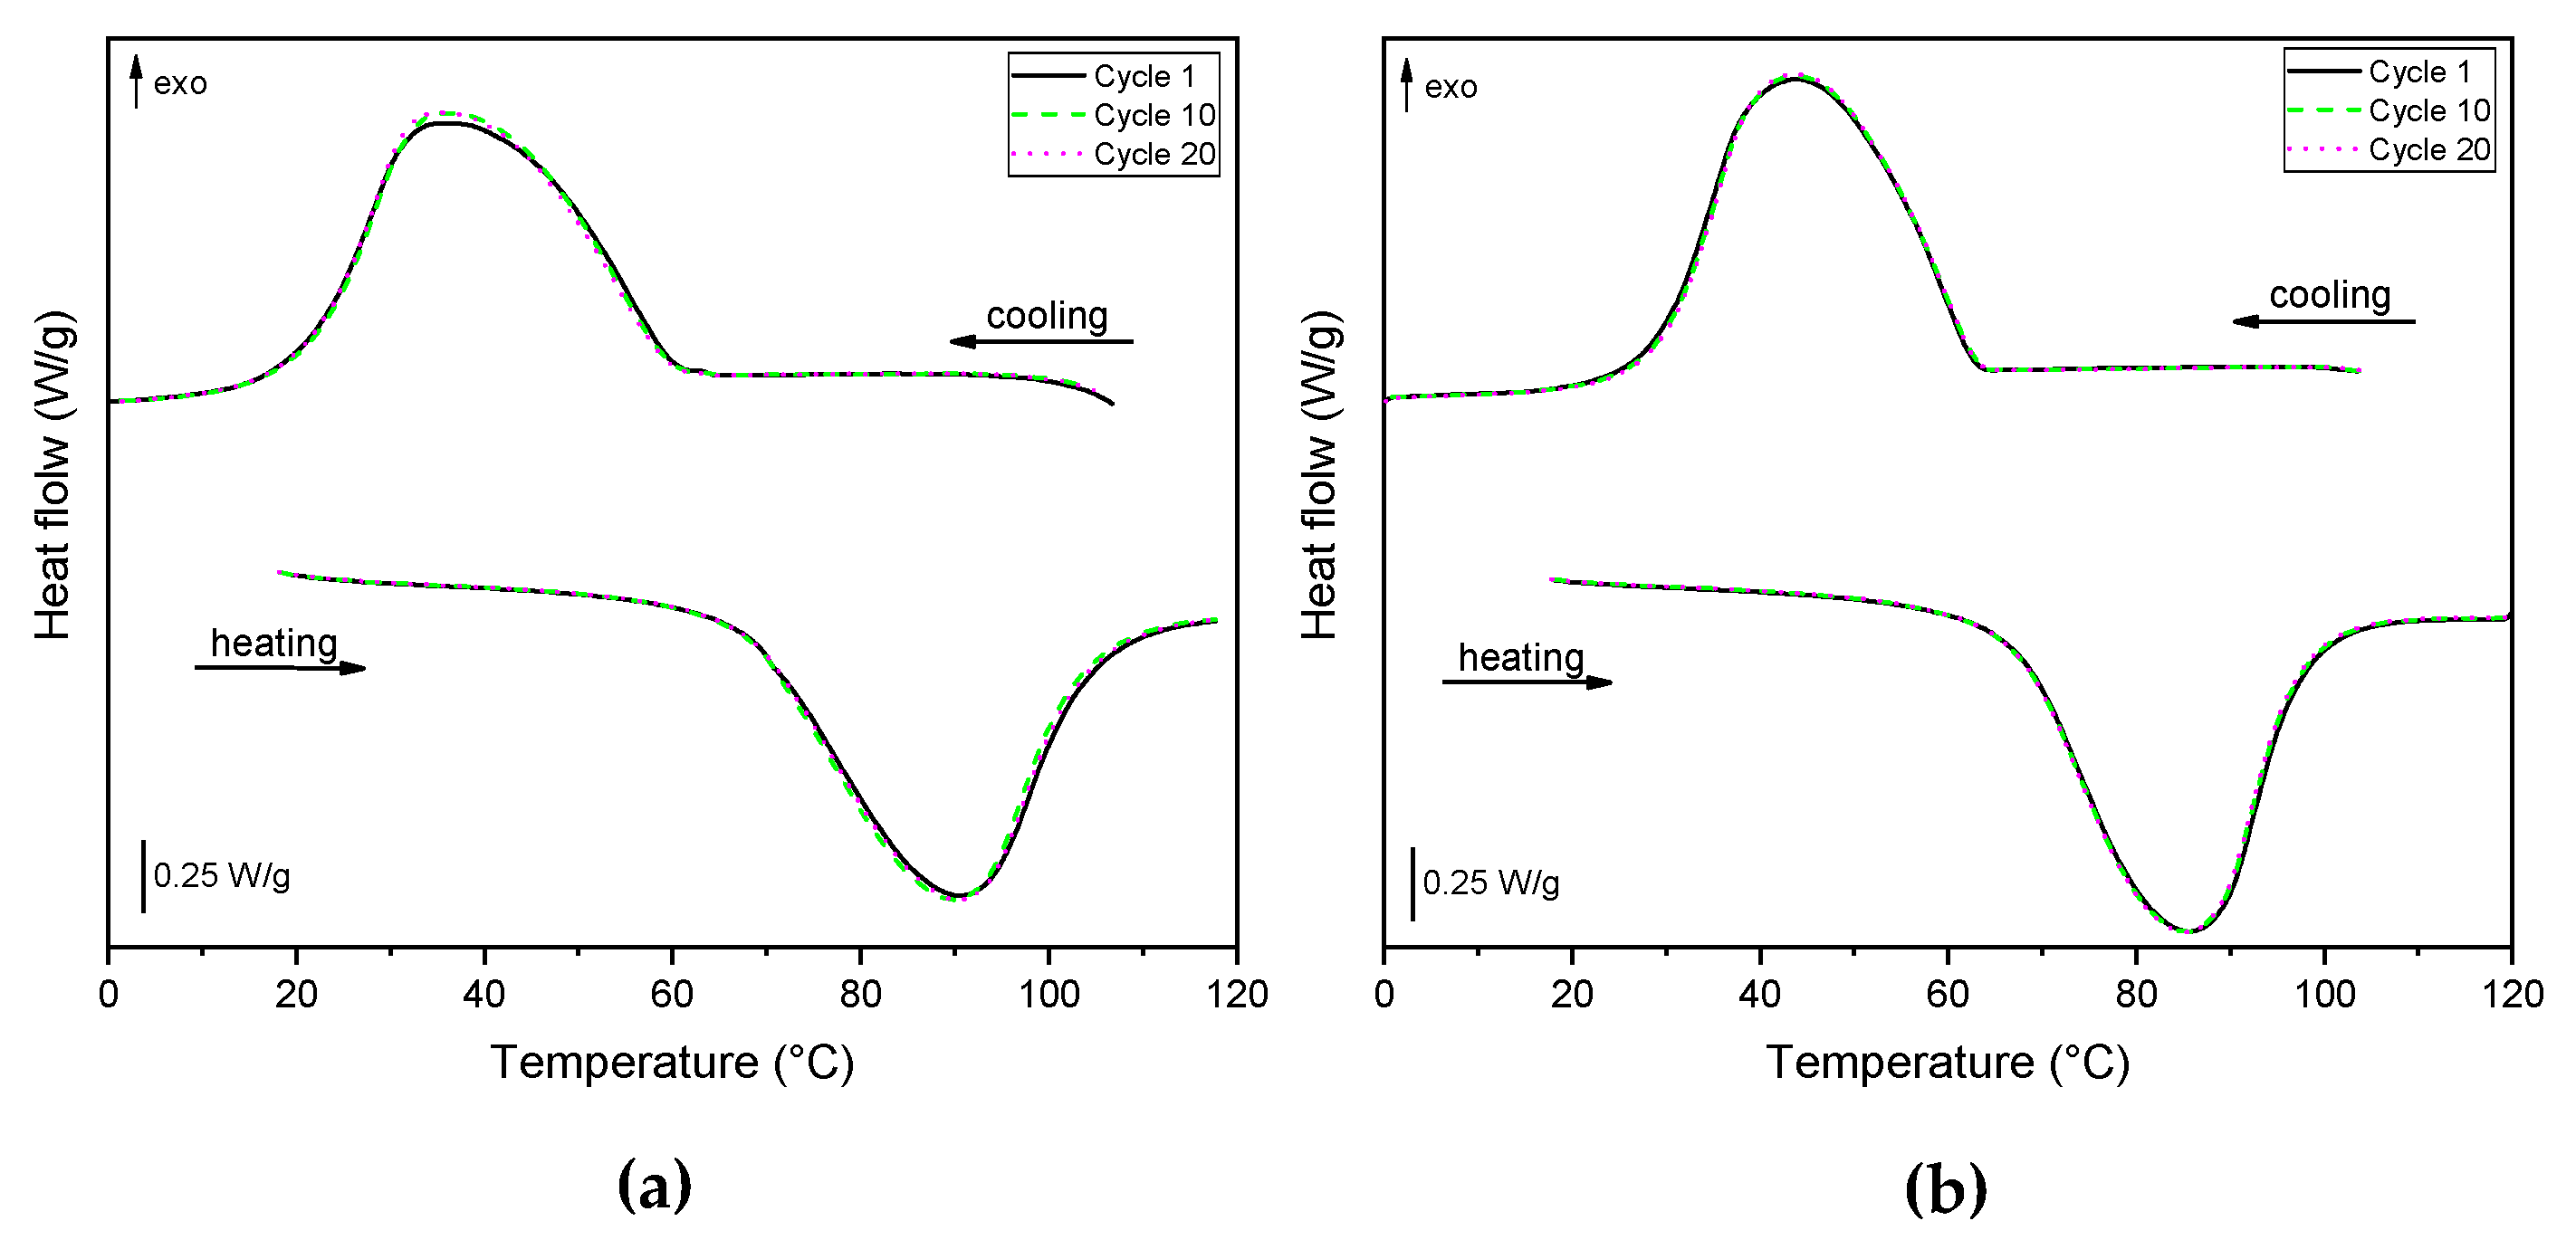
3.5. DSC
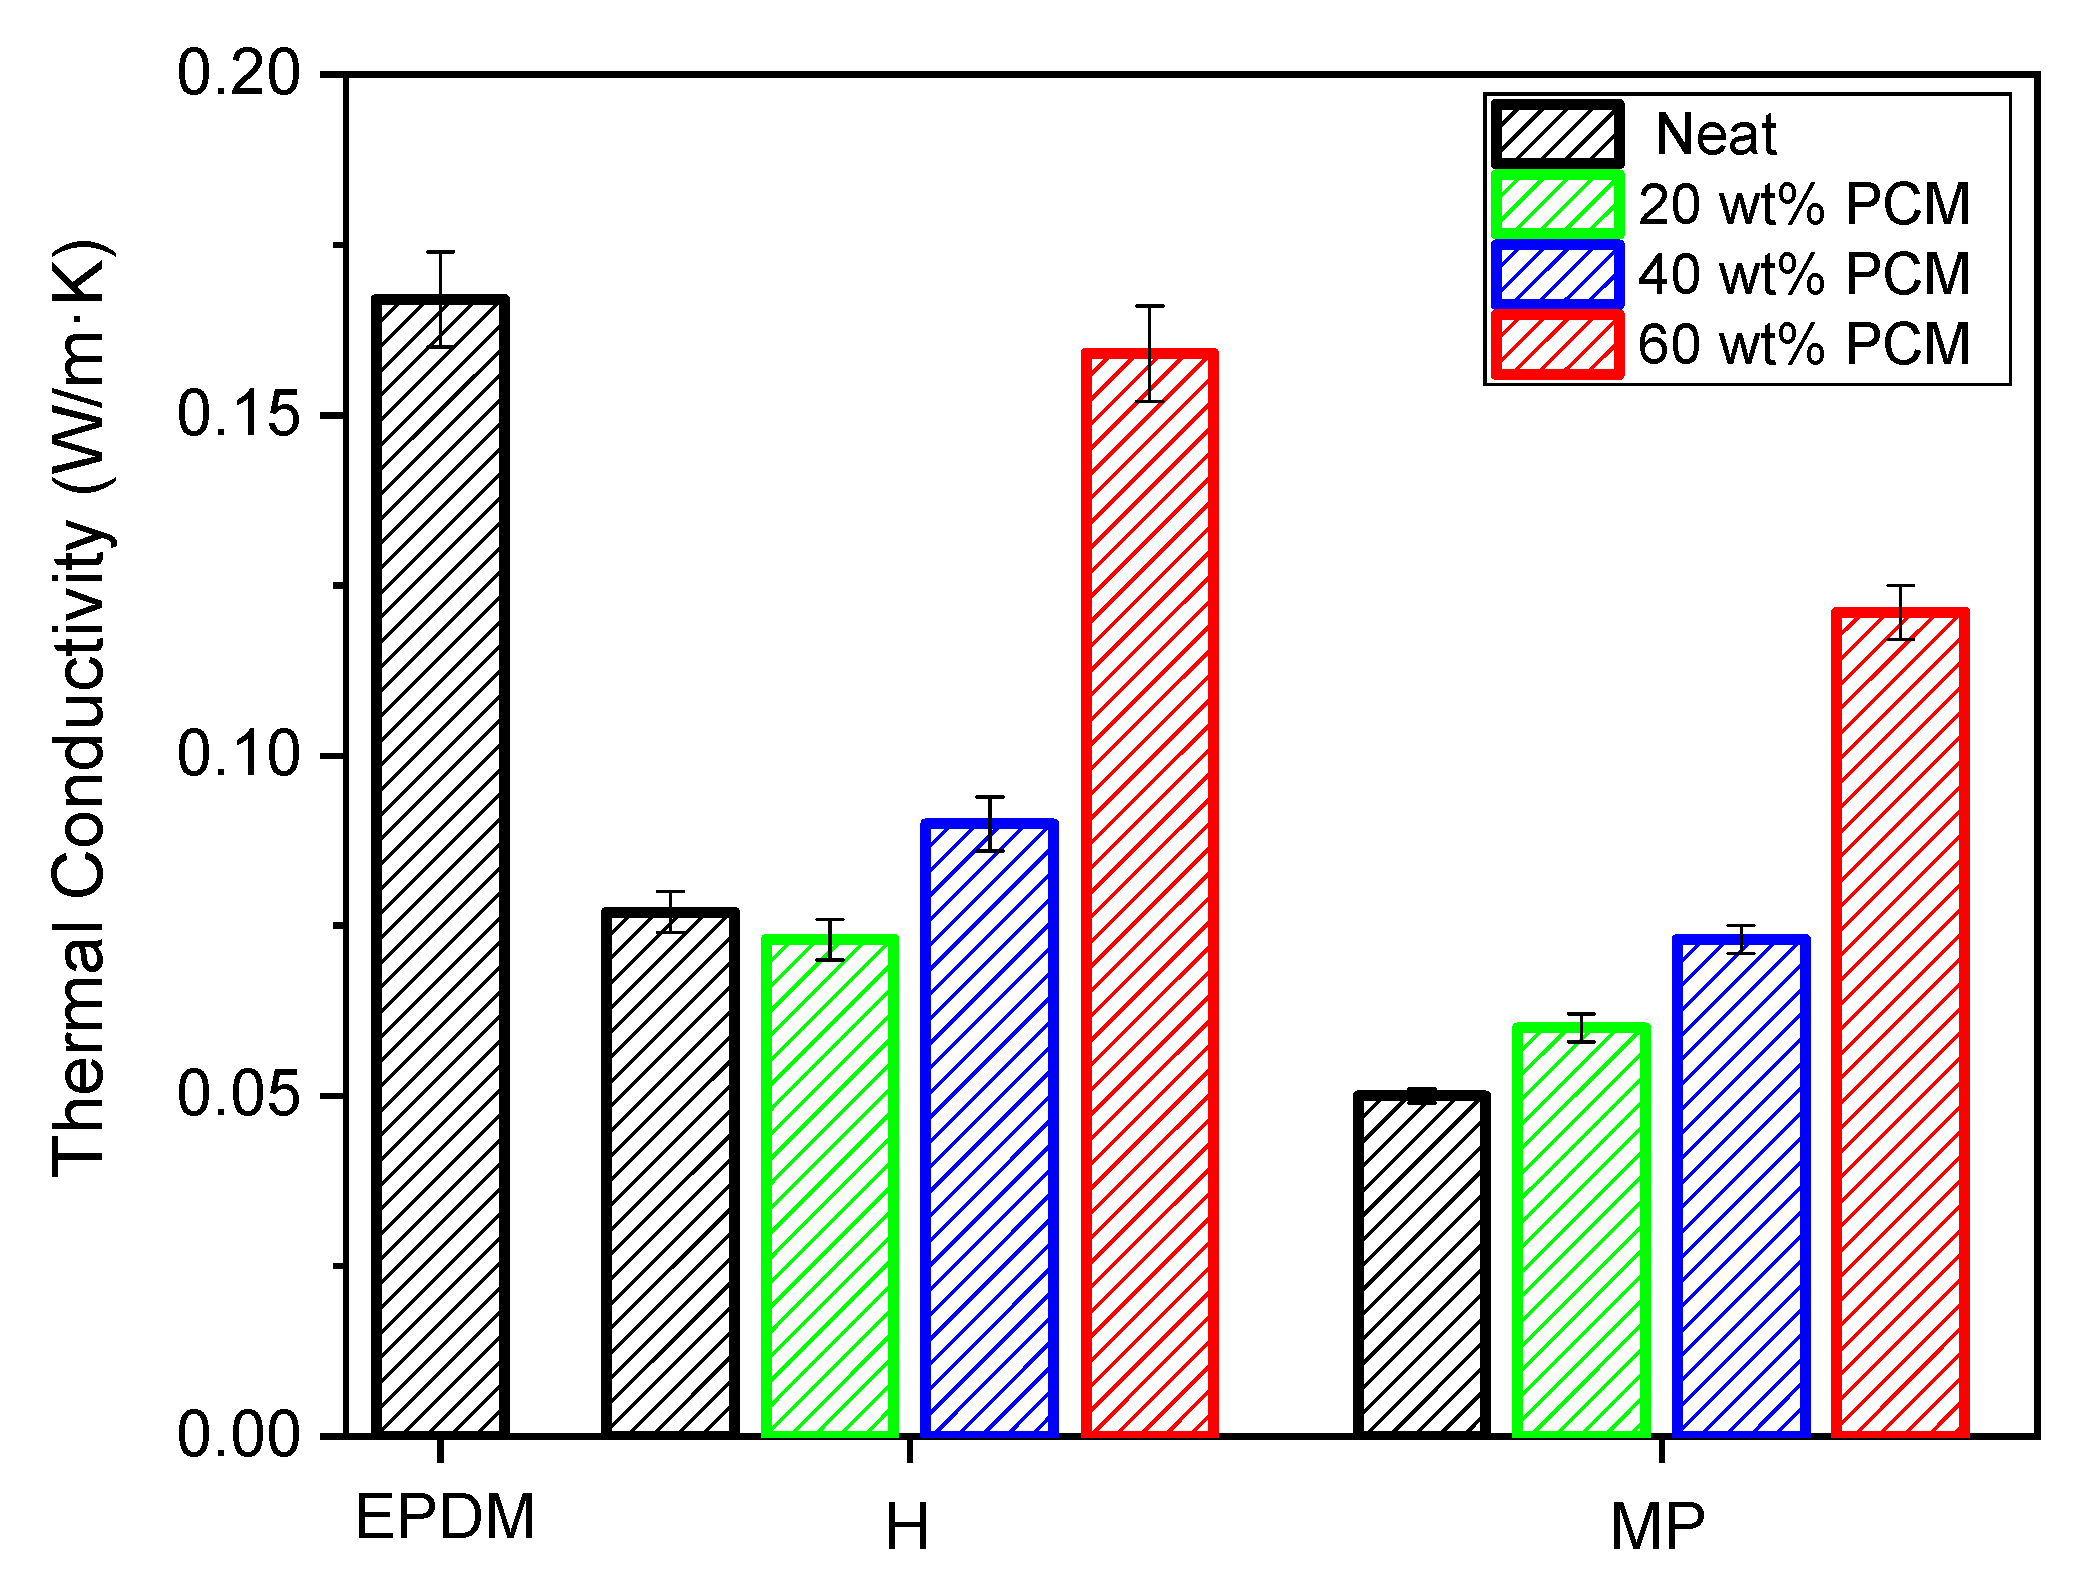
3.6. Thermal Conductivity Measurements
3.7. Rheology
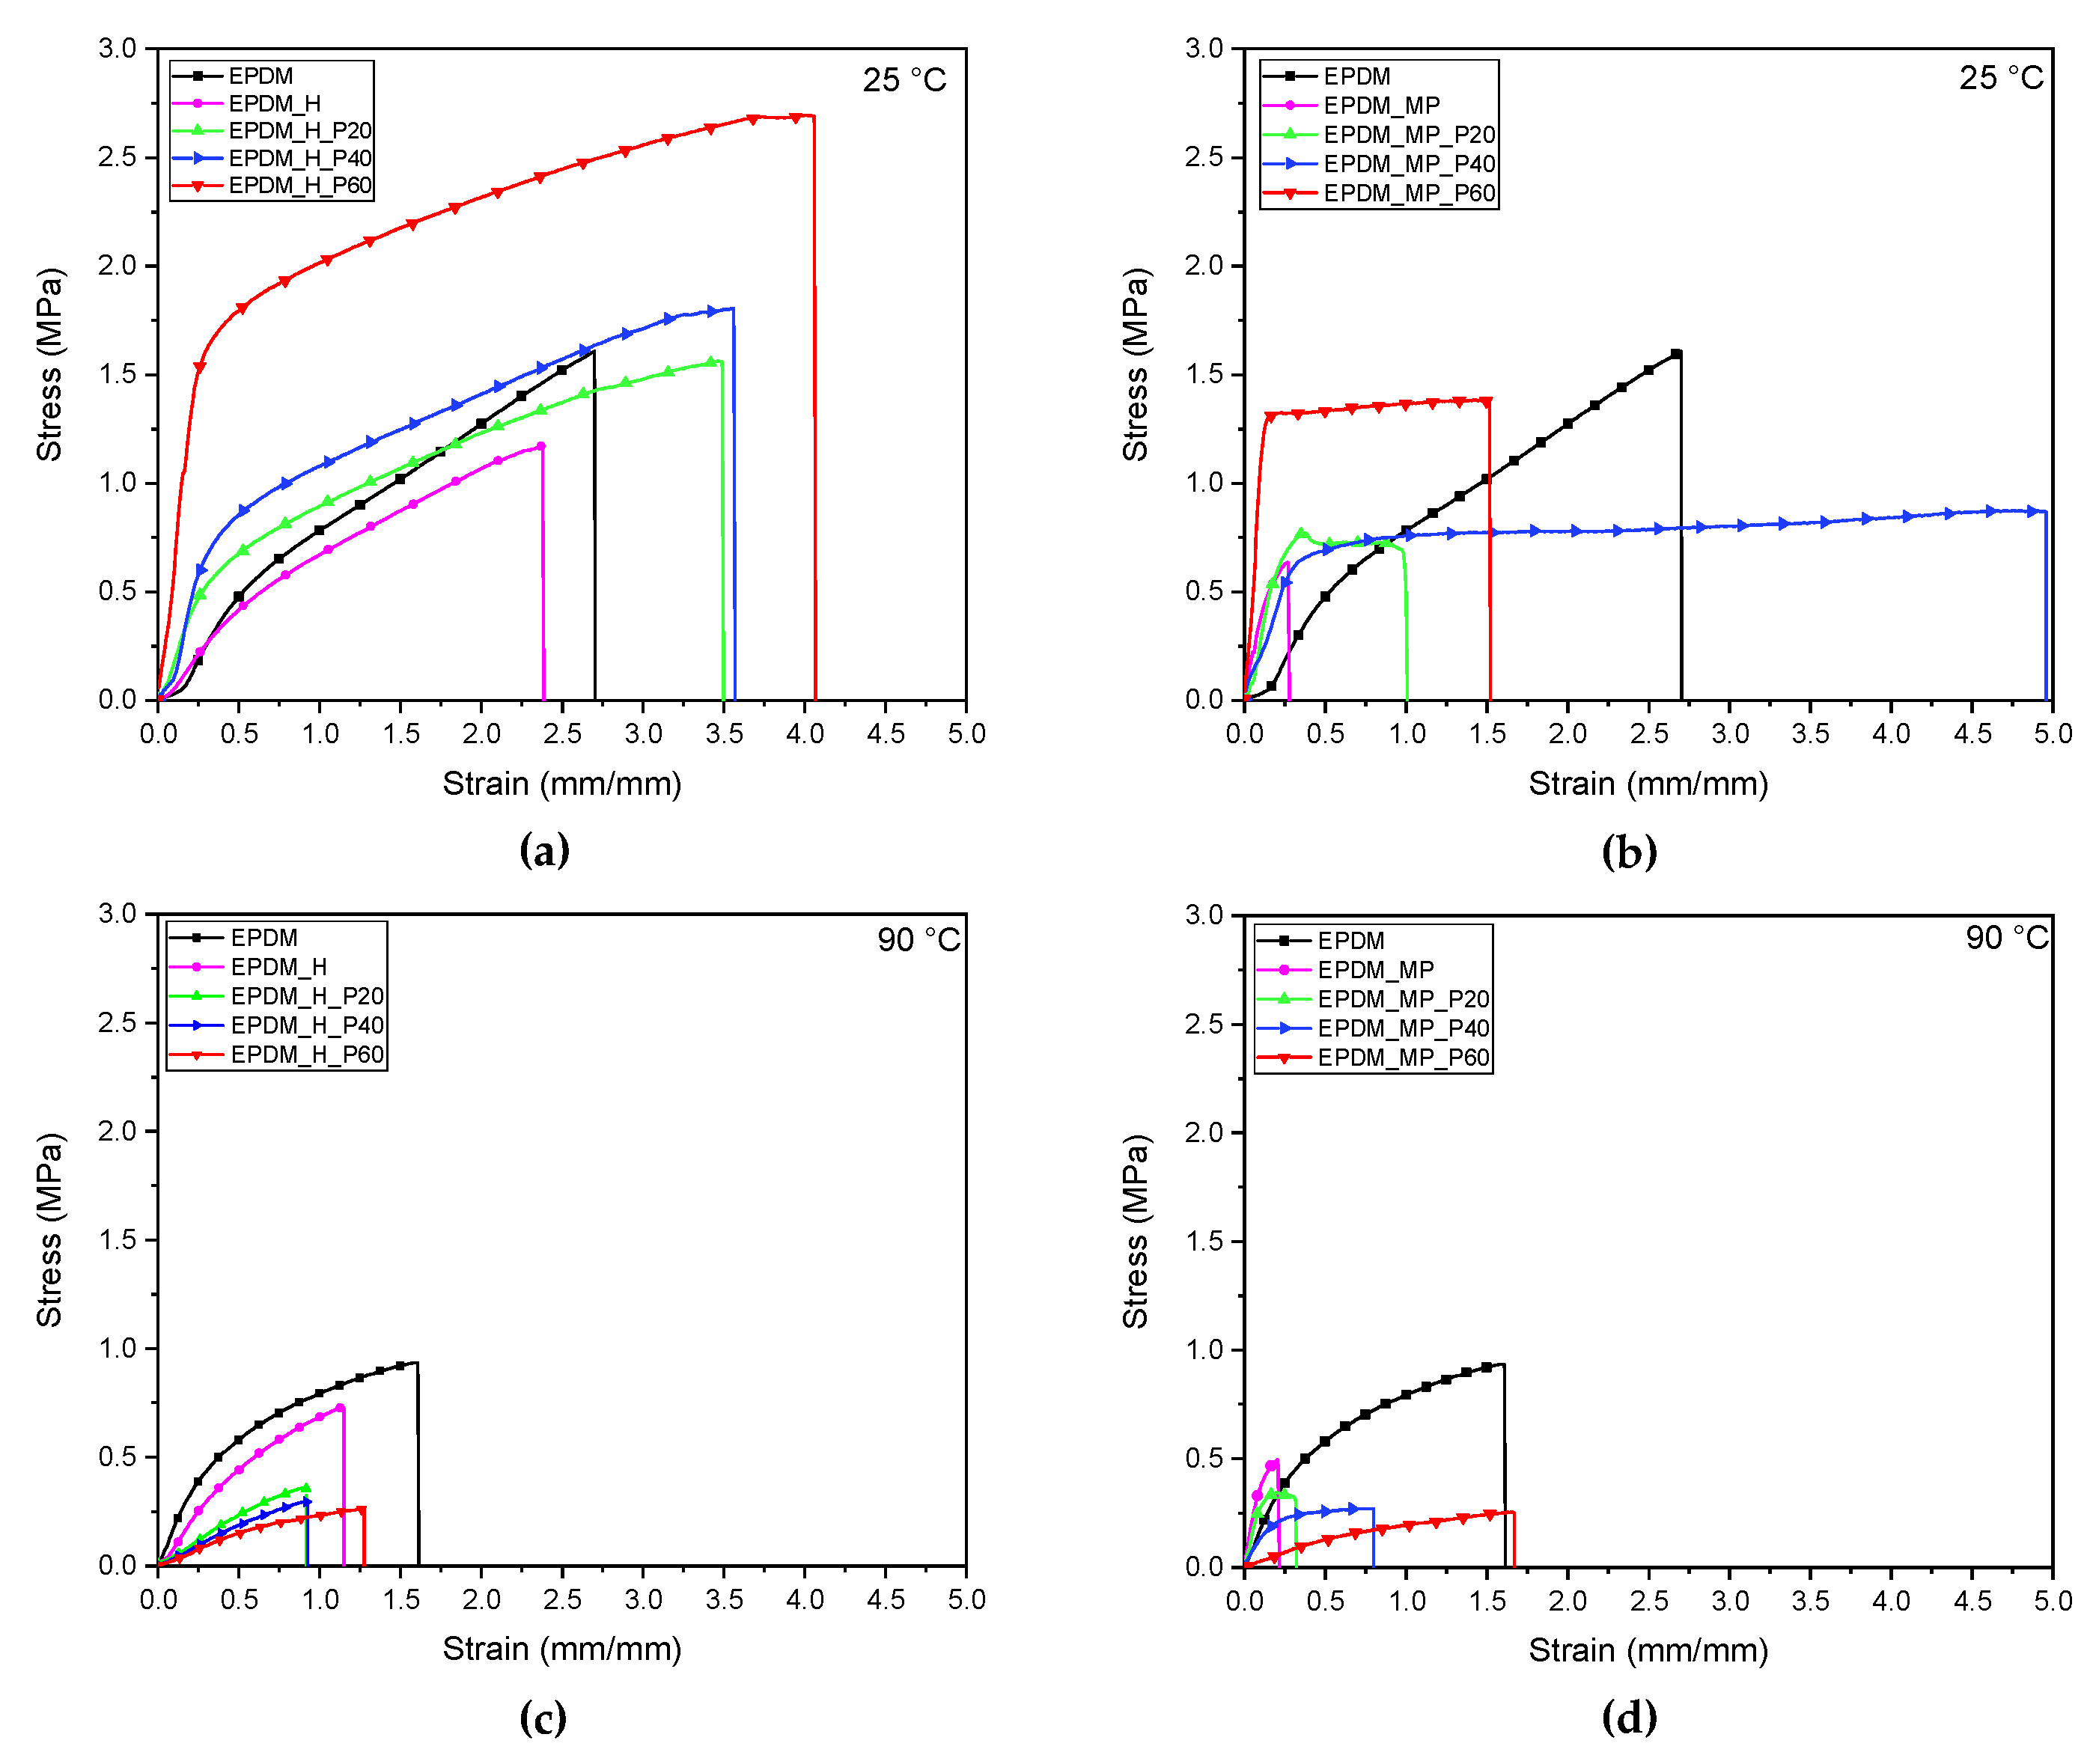
3.8. Quasi-Static Tensile Tests
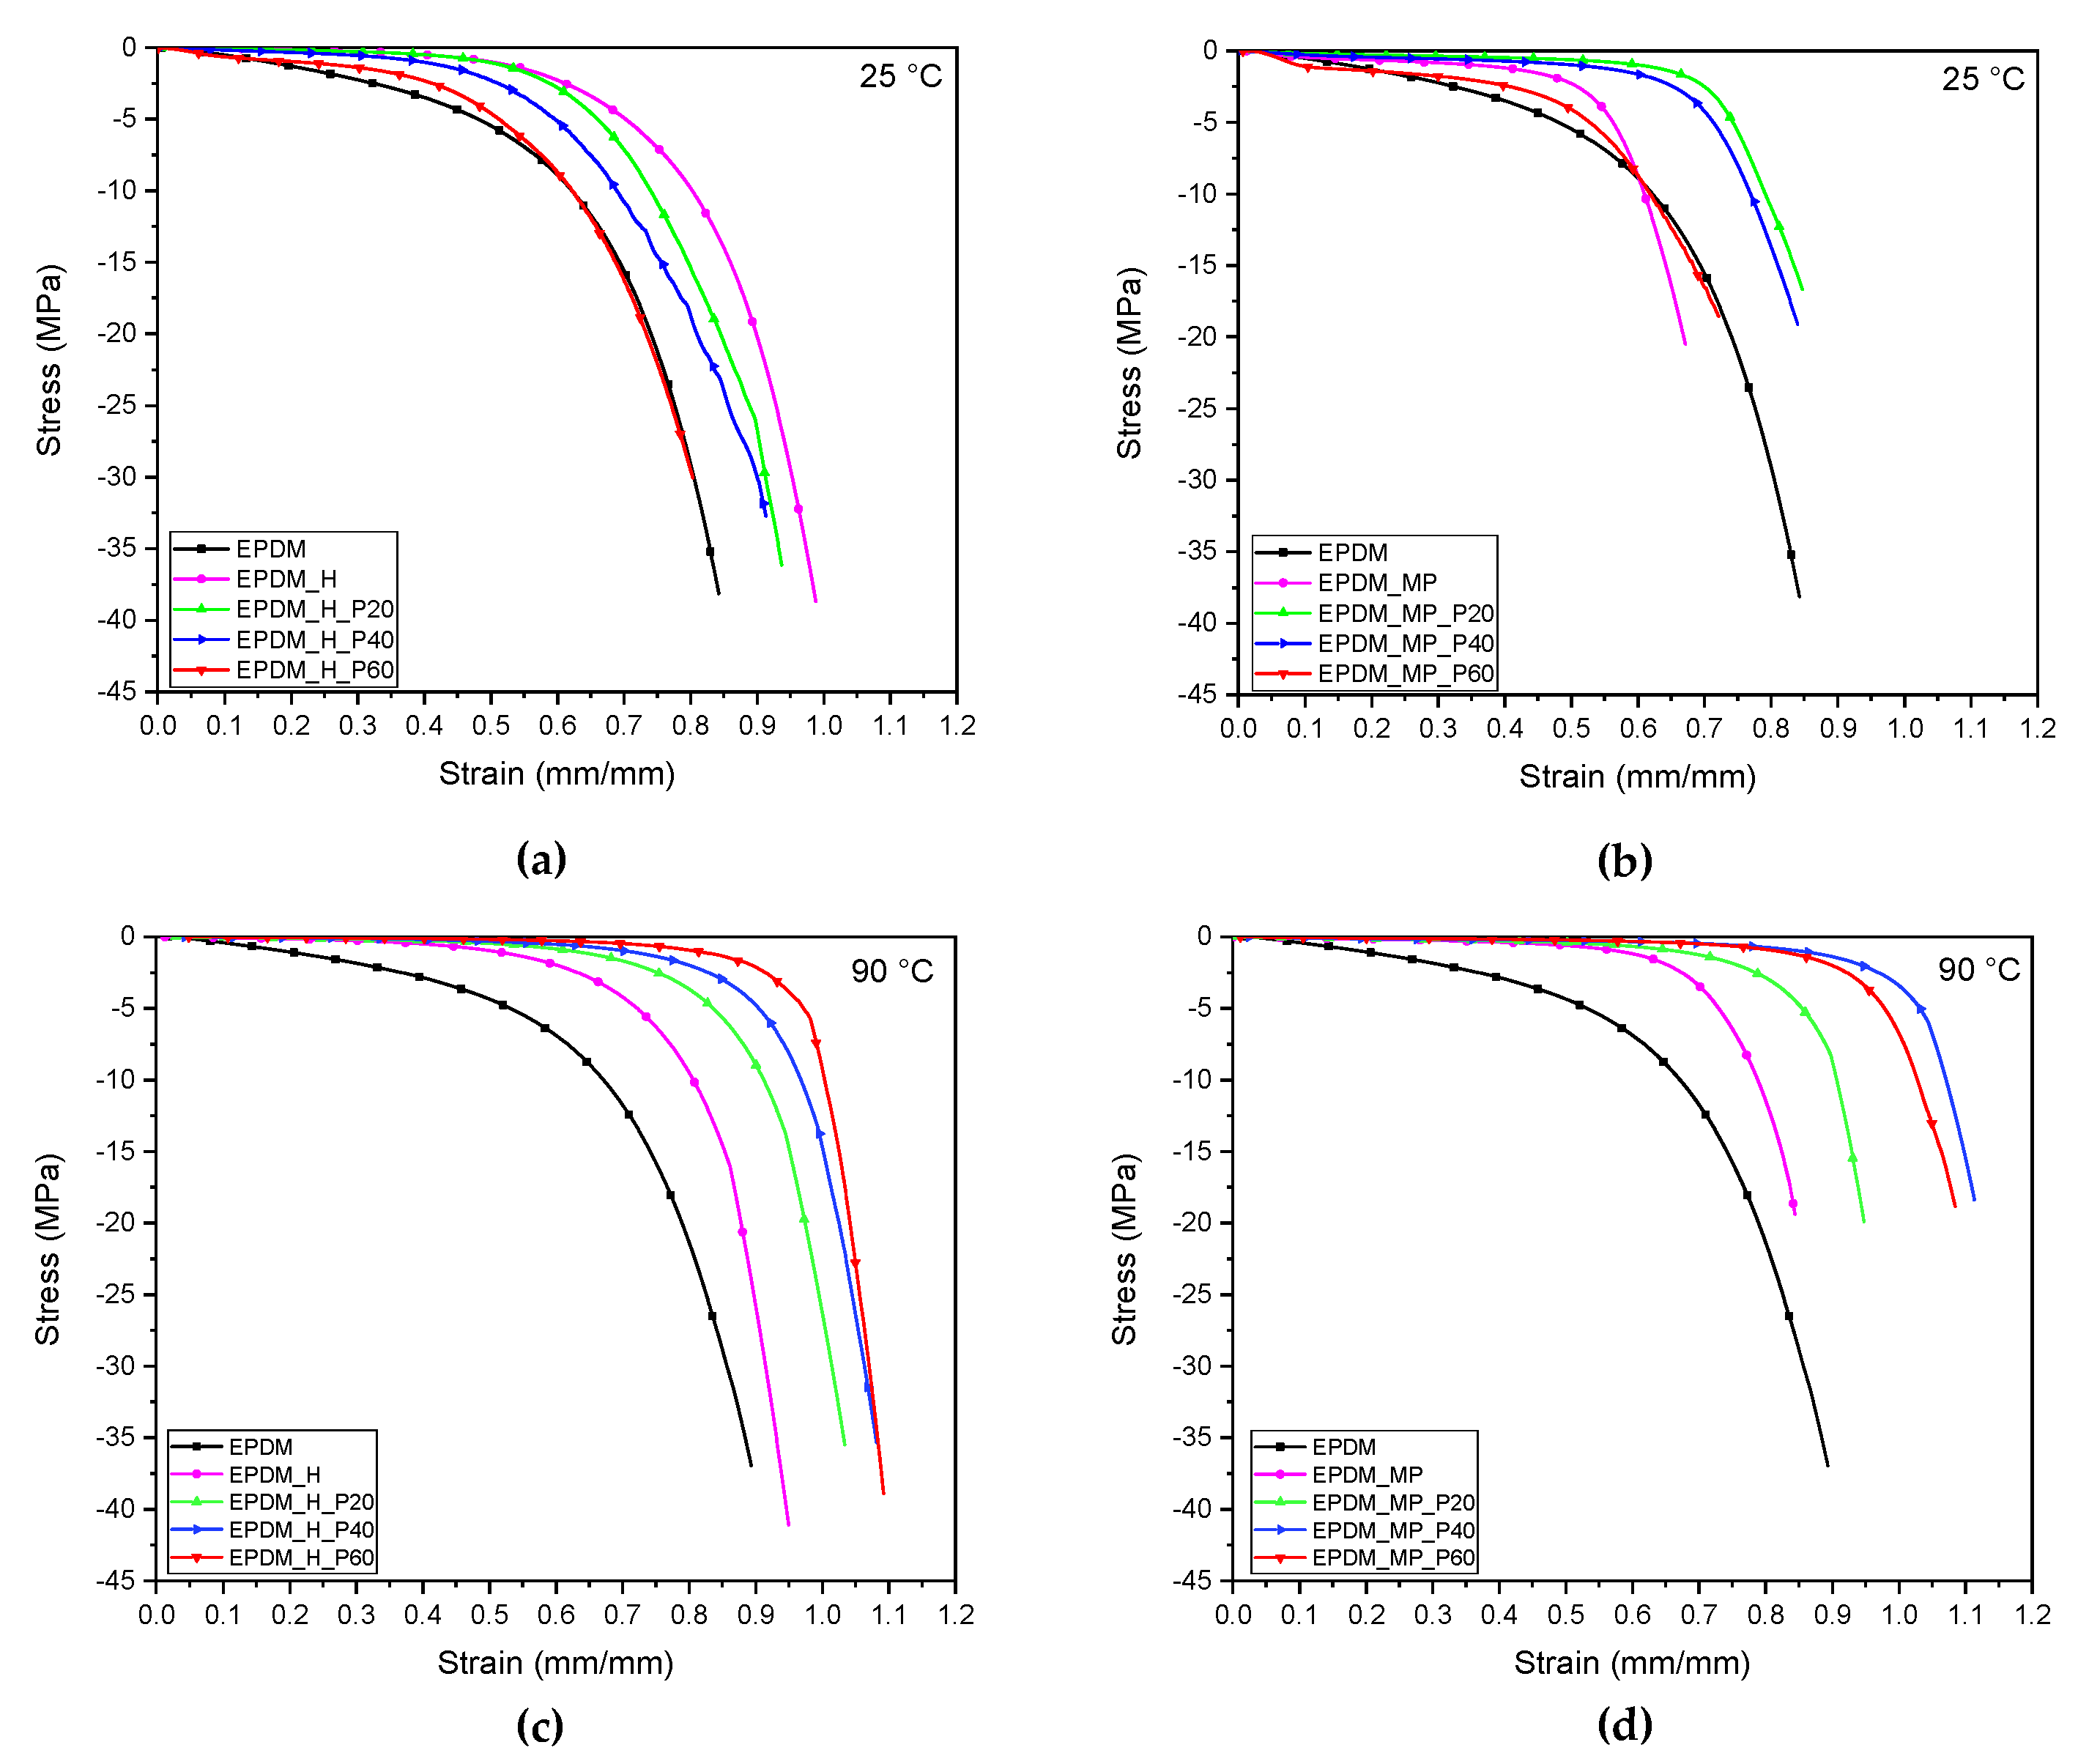
3.9. Quasi-Static Compression Tests
3.10. Shore A
4. Conclusions
Author Contributions
Funding
Institutional Review Board Statement
Informed Consent Statement
Data Availability Statement
Conflicts of Interest
References
- Al-Ghussain, L. Global Warming: Review on Driving Forces and Mitigation. Environ. Prog. Sustain. Energy 2018, 38, 13–21. [Google Scholar] [CrossRef]
- Guilyardi, E.; Lescarmontier, L.; Matthews, R.; Point, S.P.; Rumjaun, A.B.; Schlüpmann, J.; Wilgenbus, D. IPCC Special Report “Global Warming of 1.5 °C”: Summary for Teachers; IPCC: Geneva, Switzerland, 2018. [Google Scholar]
- Yang, J.; Cai, W.; Ma, M.; Li, L.; Liu, C.; Ma, X.; Li, L.; Chen, X. Driving forces of China’s CO2 emissions from energy consumption based on Kaya-LMDI methods. Sci. Total Environ. 2020, 711, 134569. [Google Scholar] [CrossRef]
- Valentini, F.; Fambri, L.; Dorigato, A.; Pegoretti, A. Production and Characterization of TES-EPDM Foams with Paraffin for Thermal Management Applications. Front. Mater. 2021, 8, 101. [Google Scholar] [CrossRef]
- Anisur, M.R.; Mahfuz, M.H.; Kibria, M.A.; Saidur, R.; Metselaar, I.H.S.C.; Mahlia, T.M.I. Curbing global warming with phase change materials for energy storage. Renew. Sustain. Energy Rev. 2013, 18, 23–30. [Google Scholar] [CrossRef]
- Fernandes, D.; Pitié, F.; Cáceres, G.; Baeyens, J. Thermal energy storage: How previous findings determine current research priorities. Energy 2012, 39, 246–257. [Google Scholar] [CrossRef]
- Dincer, I.; Rosen, M.A. Heat Storage Systems. In Energy Analysis of Heating, Refrigerating and Air Conditioning; Elsevier: Amsterdam, The Netherlands, 2015; pp. 221–278. [Google Scholar]
- Luu, M.T.; Milani, D.; Nomvar, M.; Abbas, A. Computer-aided design for high efficiency latent heat storage-a case study of a novel domestic solar hot water process. Comput. Aided Chem. Eng. 2017, 40, 1153–1158. [Google Scholar]
- Fredi, G.; Dorigato, A.; Fambri, L.; Pegoretti, A. Multifunctional structural composites for thermal energy storage. Multifunct. Mater. 2020, 3, 042001. [Google Scholar] [CrossRef]
- Fleisher, A.S. Thermal Energy Storage Using Phase Change Materials Fundamentals and Applications, 1st ed.; Springer: Minneapolis, MN, USA, 2015. [Google Scholar]
- Kuznik, F.; Johannes, K.; Lamrani, B.D. Integrating phase change materials (PCMs) in thermal energy storage systems for buildings. In Advances in Thermal Energy Storage Systems; Woodhead Publishing: Cambridge, UK, 2015; pp. 325–353. [Google Scholar]
- Karkri, M.; Lachheb, M.; Albouchi, F.; Nasrallah, S.B.; Krupa, I. Thermal properties of smart microencapsulated paraffin/plaster composites for the thermal regulation of buildings. Energy Build. 2015, 88, 183–192. [Google Scholar] [CrossRef]
- Liu, X.; Liu, H.; Wang, S.; Zhang, L.; Cheng, H. Preparation and thermal properties of form stable paraffin phase change material encapsulation. Energy Convers. Manag. 2006, 47, 2515–2522. [Google Scholar] [CrossRef]
- Sharma, S.D.; Sagara, K. Latent heat storage materials and systems: A review. J. Green Energy 2005, 2, 1–56. [Google Scholar] [CrossRef]
- Yang, S.; Bo, Z. Melamine foam impregnated with paraffin as thermal regulation materials for obtaining stable indoor temperature. Energy Build. 2019, 183, 650–658. [Google Scholar]
- Sánchez, P.; Sánchez-Fernandez, M.V.; Romero, A.; Rodríguez, J.F.; Sánchez-Silva, L. Development of thermo-regulating textiles using paraffin wax microcapsules. Thermochim. Acta 2010, 498, 16–21. [Google Scholar] [CrossRef]
- Jiang, M.; Song, X.; Ye, G.; Xu, J. Preparation of PVA/paraffin thermal regulating fiber by in situ microencapsulation. Compos. Sci. Technol. 2008, 68, 2231–2237. [Google Scholar] [CrossRef]
- Su, J.F.; Wang, X.Y.; Wang, S.B.; Zhao, Y.H.; Huang, Z. Fabrication and properties of microencapsulated- paraffin/gypsum-matrix building materials for thermal energy storage. Energy Convers. Manag. 2012, 55, 101–107. [Google Scholar] [CrossRef]
- Deng, H.; Yang, W.; Cai, T.; He, F.; Li, Y.; Zhang, K.; He, R. Phase-change composites silicone rubber/paraffin@SiO2 microcapsules with different core/shell ratio for thermal management. Int. J. Energy Res. 2021, 45, 18033–18047. [Google Scholar] [CrossRef]
- Kahwaji, S.; Johnson, M.B.; Kheirabadi, A.C.; Groulx, D.; White, M.A. A comprehensive study of properties of paraffin phase change materials for solar thermal energy storage and thermal management applications. Energy 2018, 162, 1169–1182. [Google Scholar] [CrossRef]
- Rigotti, D.; Dorigato, A.; Pegoretti, A. 3D printable thermoplastic polyurethane blends with thermal energy storage/release capabilities. Mater. Today Commun. 2018, 15, 228–235. [Google Scholar] [CrossRef]
- Zambotti, A.; Caldesi, E.; Pellizzari, M.; Valentini, F.; Pegoretti, A.; Dorigato, A.; Speranza, G.; Chen, K.; Bortolotti, M.; Sorarù, G.D.; et al. Polymer-derived silicon nitride aerogels as shape stabilizers for low and high-temperature thermal energy storage. J. Eur. Ceram. Soc. 2021, 41, 5484–5494. [Google Scholar] [CrossRef]
- Rigotti, D.; Dorigato, A.; Pegoretti, A. Low-cycle fatigue behavior of flexible 3D printed thermoplastic polyurethane blends for thermal energy storage/release applications. J. Appl. Polym. Sci. 2021, 138, 49704. [Google Scholar] [CrossRef]
- Fredi, G.; Dorigato, A.; Unterberger, S.; Artuso, N.; Pegoretti, A. Discontinuous carbon fiber/polyamide composites with microencapsulated paraffin for thermal energy storage. J. Appl. Polym. Sci. 2019, 136, 47408. [Google Scholar] [CrossRef]
- Fredi, G.; Dorigato, A.; Pegoretti, A. Novel reactive thermoplastic resin as a matrix for laminates containing phase change microcapsules. Polym. Compos. 2019, 40, 3711–3724. [Google Scholar] [CrossRef]
- Galvagnini, F.; Dorigato, A.; Fambri, L.; Fredi, G.; Pegoretti, A. Thermophysical Properties of Multifunctional Syntactic Foams Containing Phase Change Microcapsules for Thermal Energy Storage. Polymers 2021, 13, 1790. [Google Scholar] [CrossRef]
- Dashtizadeh, Z.; Abdeali, G.; Bahramian, A.R.; Alvar, M.Z. Enhancement of thermal energy absorption/storage performance of paraffin wax (PW) phase change material by means of chemically synthesized Ethylene Propylene Diene Monomer (EPDM) rubber network. J. Energy Storage 2022, 45, 103646. [Google Scholar] [CrossRef]
- Wei, H.; Lou, L.; Yang, Z.; He, R.; Fan, J.; Zhang, K.; Yang, W. Multifunctional composites silicone rubber/paraffin@lead tungstate with different core/shell ratio for thermal regulation and gamma shielding. J. Energy Storage 2021, 36, 102363. [Google Scholar] [CrossRef]
- Valentini, F.; Dorigato, A.; Fambri, L.; Pegoretti, A. Novel EPDM/paraffin foams for thermal energy storage applications. Rubber Chem. Technol. 2021, 94, 432–448. [Google Scholar] [CrossRef]
- Eleftheriadis, G. Flexible Elastomeric Foams (FEF) and Polyethylene Foams (PEF): Solutions in the Building Industry. CEFEP, Industry Association for FEF and PEF Thermal Insulation. Available online: https://www.cefep.net/index.php/en/ (accessed on 1 May 2022).
- Rostami-Tapeh-Esmaeil, E.; Vahidifar, A.; Esmizadeh, E.; Rodrigue, D. Chemistry, Processing, Properties, and Applications of Rubber Foams. Polymers 2021, 13, 1565. [Google Scholar] [CrossRef] [PubMed]
- Lee, E.; Choi, S. Preparation and characterization of natural rubber foams:Effects of foaming temperature and carbon black content. Korean J. Chem. Eng. 2007, 24, 1070–1075. [Google Scholar]
- Brown, J.A.; Carroll, J.D.; Huddleston, B.; Casias, Z.; Long, K.N. A multiscale study of damage in elastomeric syntactic foams. J. Mater. Sci. 2018, 53, 10479–10498. [Google Scholar]
- Moran, J.L.; Cottrill, A.L.; Benck, J.D.; Liu, P.; Yuan, Z.; Strano, M.S.; Buongiorno, J. Noble-gas-infused neoprene closed-cell foams achieving ultra-low thermal conductivity fabrics. RSC Adv. 2018, 8, 21389–21398. [Google Scholar] [CrossRef] [PubMed]
- Shao, L.; Ji, Z.Y.; Ma, J.Z.; Xue, C.H.; Ma, Z.L.; Zhang, J. The synergy of double cross-linking agents on the properties of styrene butadiene rubber foams. Sci. Rep. 2016, 6, 36931. [Google Scholar] [CrossRef]
- Bardy, E.; Mollendorf, J.; Pendergast, D. Thermal conductivity and compressive strain of foam neoprene insulation under hydrostatic pressure. J. Phys. D Appl. Phys. 2005, 38, 3832. [Google Scholar] [CrossRef]
- Tang, W.; Liao, X.; Zhang, Y.; Li, J.; Wang, G.; Li, G. Mechanical–Microstructure Relationship and Cellular Failure Mechanism of Silicone Rubber Foam by the Cell Microstructure Designed in Supercritical CO2. J. Phys. Chem. C 2019, 123, 26947–26956. [Google Scholar] [CrossRef]
- Valentini, F.; Dorigato, A.; Rigotti, D.; Pegoretti, A. Evaluation of the role of devulcanized rubber on the thermo-mechanical properties of Ethylene-Propylene Diene Monomers (EPDM) foams. Polym. Eng. Sci. 2021, 61, 767–779. [Google Scholar] [CrossRef]
- Valentini, L.; Manchado, M.A.L. High-Performance Elastomeric Materials Reinforced by Nanocarbon; Elsevier: Amsterdam, The Netherlands, 2020. [Google Scholar]
- Callister, W.D. Materials Science and Engineering, 7th ed.; John Wiley & Sons: Hoboken, NJ, USA, 2007. [Google Scholar]
- Eaves, D. Handbook of Polymer Foams; Rapra Technology Ltd.: Shawbury, UK, 2004. [Google Scholar]
- Zonta, E.; Valentini, F.; Dorigato, A.; Fambri, L.; Pegoretti, A. Evaluation of the salt leaching method for the production of ethylene propylene diene monomer rubber foams. Polym. Eng. Sci. 2021, 36, 136–153. [Google Scholar] [CrossRef]
- Scaffaro, R.; Lopresti, F.; Botta, L.; Rigogliuso, S.; Ghersi, G. Preparation of three-layered porous PLA/PEG scaffold: Relationship between morphology, mechanical behavior and cell permeability. J. Mech. Behav. Biomed. Mater. 2016, 54, 8–20. [Google Scholar] [CrossRef] [PubMed]
- Sorze, A.; Valentini, F.; Dorigato, A.; Pegoretti, A. Salt leaching as a green method for the production of polyethylene foams for thermal energy storage applications. Polym. Eng. Sci. 2022, 62, 1650–1663. [Google Scholar] [CrossRef]
- Fredi, G.; Dorigato, A.; Fambri, L.; Pegoretti, A. Multifunctional epoxy/carbon fiber laminates for thermal energy storage and release. Compos. Sci. Technol. 2018, 158, 101–111. [Google Scholar] [CrossRef]
- Banerjee, S.S.; Bhowmick, A.K. An effective strategy to develop nanostructured morphology and enhanced physico-mechanical properties of PP/EPDM thermoplastic elastomers. J. Mater. Sci. 2016, 51, 6722–6734. [Google Scholar] [CrossRef]
- Jolfaei, A.F.; Gavgani, J.N.; Jalali, A.; Goharpey, F. Effect of organoclay and compatibilizers on microstructure, rheological and mechanical properties of dynamically vulcanized EPDM/PP elastomers. Polym. Bull. 2015, 72, 1127–1144. [Google Scholar] [CrossRef]


| Material | Quantity (phr) |
|---|---|
| Vistalon® 2504 | 100 |
| Sulfur (vulcanizing agent) | 3.00 |
| Zinc oxide (activator) | 3.00 |
| Stearic acid (activator) | 1.00 |
| Carbon black (reinforcing filler) | 20.00 |
| TMTD * (accelerator) | 0.87 |
| ZDBC ** (accelerator) | 2.50 |
| Sample | Compounding Temperature (°C) |
|---|---|
| Not expanded EPDM | 40 ± 1 |
| EPDM foams produced using foaming agents | 40 ± 1 |
| EPDM foams produced through salt leaching method | 60 ± 1 |
| EPDM/paraffin foams produced using foaming agents | 70 ± 1 |
| EPDM/paraffin foams produced through salt leaching method | 60 ± 1 |
| Sample | Vistalon 2504 [phr] | Hostatron P0168 [phr] | Micropearl F82 [phr] | NaCl [phr] | PEG [phr] | RT70HC [phr/wt%/vv%] |
|---|---|---|---|---|---|---|
| EPDM | 100 | - | - | - | - | - |
| EPDM_H | 100 | 1.3 | - | - | - | - |
| EPDM_H_P20 | 100 | 1.3 | - | - | - | 33.0/20.0/22.0 |
| EPDM_H_P40 | 100 | 1.3 | - | - | - | 87.0/40.0/43.0 |
| EPDM_H_P60 | 100 | 1.3 | - | - | - | 196.0/60.0/63.0 |
| EPDM_MP | 100 | - | 14 | - | - | - |
| EPDM_MP_P20 | 100 | - | 14 | - | - | 33.0/20.0/22.0 |
| EPDM_MP_P40 | 100 | - | 14 | - | - | 87.0/40.0/43.0 |
| EPDM_MP_P60 | 100 | - | 14 | - | - | 196.0/60.0/63.0 |
| EPDM_SL | 100 | - | - | 305 | 30 | - |
| EPDM_SL_P20 | 100 | - | - | 305 | 30 | 33.0/20.0/22.0 |
| EPDM_SL_P40 | 100 | - | - | 305 | 30 | 87.0/40.0/43.0 |
| EPDM_SL_P60 | 100 | - | - | 305 | 30 | 196.0/60.0/63.0 |
| Sample | Diameter of the Pores (µm) |
|---|---|
| EPDM_H | 271 ± 150 |
| EPDM_H_P20 | 254 ± 95 |
| EPDM_H_P60 | 366 ± 306 |
| EPDM_MP | 110 ± 46 |
| EPDM_MP_P20 | 82 ± 39 |
| EPDM_MP_P60 | 64 ± 22 |
| EPDM_SL | 2 ± 1 |
| EPDM_SL_P20 | 93 ± 63 |
| EPDM_SL_P60 | - |
| Sample | ρapp (g/cm3) | ρgeom (g/cm3) | ρbulk (g/cm3) | OP (vol%) | CP (vol%) | Ptot (vol%) |
|---|---|---|---|---|---|---|
| EPDM | - | 0.996 ± 0.02 | 0.996 | - | - | - |
| EPDM_H | 0.79 ± 0.03 | 0.61 ± 0.05 | 0.996 | 19.6 ± 9.1 | 18.9 ± 13.6 | 38.5 ± 4.6 |
| EPDM_H_P20 | 0.72 ± 0.02 | 0.55 ± 0.02 | 0.97 | 23.5 ± 4.5 | 20.2 ± 6.1 | 43.7 ± 1.6 |
| EPDM_H_P40 | 0.78 ± 0.03 | 0.66 ± 0.01 | 0.946 | 15.6 ± 4.6 | 14.6 ± 5.7 | 30.2 ± 1.1 |
| EPDM_H_P60 | 0.80 ± 0.02 | 0.70 ± 0.01 | 0.923 | 12.6 ± 3.5 | 11.9 ± 4.6 | 24.5 ± 1.1 |
| EPDM_MP | 0.30 ± 0.01 | 0.25 ± 0.01 | 0.996 | 17.0 ± 5.7 | 57.7 ± 6.6 | 74.7 ± 1.0 |
| EPDM_MP_P20 | 0.37 ± 0.01 | 0.30 ± 0.02 | 0.97 | 18.9 ± 6.1 | 50.3 ± 7.8 | 69.3 ± 1.7 |
| EPDM_MP_P40 | 0.44 ± 0.01 | 0.37 ± 0.02 | 0.946 | 16.9 ± 7.3 | 44.1 ± 9.6 | 61.0 ± 2.2 |
| EPDM_MP_P60 | 0.76 ± 0.02 | 0.56 ± 0.02 | 0.923 | 26.2 ± 4.0 | 13.1 ± 5.7 | 39.3 ± 1.8 |
| EPDM_SL | 0.98 ± 0.03 | 0.35 ± 0.02 | 0.996 | 64.3 ± 3.1 | 0.6 ± 5.2 | 64.9 ± 2.1 |
| EPDM_SL_P20 | 0.95 ± 0.01 | 0.67 ± 0.02 | 0.97 | 29.2 ± 2.6 | 1.6 ± 5.0 | 30.8 ± 2.2 |
| Sample | T5% (°C) | Tpeak1 (°C) | Tpeak2 (°C) | m700 (%) | PCMeff (%) |
|---|---|---|---|---|---|
| EPDM | 420.2 | - | 484.4 | 19.9 | - |
| RT70HC | 258.7 | 338.3 | - | 0.0 | 100.0 |
| EPDM_H | 402.8 | - | 481.0 | 19.2 | - |
| EPDM_H_P20 | 246.5 | 281.8 | 478.6 | 15.6 | 23.5 |
| EPDM_H_P40 | 250.8 | 308.6 | 479.9 | 11.6 | 40.9 |
| EPDM_H_P60 | 253.2 | 318.6 | 481.7 | 8.9 | 58.5 |
| EPDM_MP | 317.3 | - | 487.5 | 20.7 | - |
| EPDM_MP_P20 | 252.0 | 311.7 | 487.8 | 16.8 | 25.0 |
| EPDM_MP_P40 | 254.5 | 313.1 | 491.6 | 13.2 | 42.2 |
| EPDM_MP_P60 | 250.2 | 332.8 | 488.6 | 9.3 | 60.8 |
| Sample | Tm1 (°C) | ΔHm1 (J/g) | Tc (°C) | ΔHc (J/g) | Tm2 (°C) | ΔHm2 (J/g) | PCMm1eff (%) | PCMceff (%) | PCMm2eff (%) |
|---|---|---|---|---|---|---|---|---|---|
| RT70HC | 68.4 | 277.4 | 66.9 | 274.2 | 69.4 | 276.1 | - | - | - |
| EPDM_H_P20 | 67.8 | 47.3 | 58.6 | 47.5 | 68.0 | 47.8 | 17.1 | 17.3 | 17.3 |
| EPDM_H_P40 | 70.6 | 94.8 | 57.6 | 94.1 | 70.3 | 94.2 | 34.2 | 34.3 | 34.1 |
| EPDM_H_P60 | 70.0 | 144.6 | 62.8 | 143.6 | 70.5 | 145.4 | 52.1 | 52.4 | 52.7 |
| EPDM_MP_P20 | 67.4 | 44.2 | 58.9 | 40.1 | 67.7 | 44.4 | 15.9 | 14.6 | 16.1 |
| EPDM_MP_P40 | 69.9 | 93.5 | 59.6 | 89.5 | 69.4 | 96.1 | 33.7 | 32.6 | 34.8 |
| EPDM_MP_P60 | 70.6 | 145.8 | 63.7 | 145.2 | 70.3 | 145.7 | 52.6 | 52.9 | 52.8 |
| 25 °C | 90 °C | |||||
|---|---|---|---|---|---|---|
| Sample | E* (MPa·cm3/g) | σb* (MPa·cm3/g) | εb (mm/mm) | E* (MPa·cm3/g) | σb* (MPa·cm3/g) | εb (mm/mm) |
| EPDM | 1.35 ± 0.09 | 1.58 ± 0.15 | 3.00 ± 0.55 | 1.56 ± 0.20 | 0.90 ± 0.09 | 1.42 ± 0.20 |
| EPDM_H | 1.21 ± 0.39 | 1.21 ± 0.13 | 2.53 ± 0.27 | 1.37 ± 0.08 | 1.19 ± 0.08 | 1.03 ± 0.17 |
| EPDM_H_P20 | 3.18 ± 0.98 | 1.63 ± 0.31 | 3.77 ± 0.62 | 0.91 ± 0.06 | 0.68 ± 0.03 | 0.88 ± 0.03 |
| EPDM_H_P40 | 4.42 ± 0.42 | 1.99 ± 0.35 | 4.71 ± 1.73 | 0.58 ± 0.02 | 0.46 ± 0.05 | 0.97 ± 0.17 |
| EPDM_H_P60 | 7.96 ± 2.18 | 2.57 ± 0.60 | 4.15 ± 1.42 | 0.41 ± 0.03 | 0.40 ± 0.04 | 1.28 ± 0.17 |
| EPDM_MP | 11.60 ± 0.86 | 2.61 ± 0.04 | 0.28 ± 0.03 | 15.48 ± 0.45 | 1.90 ± 0.06 | 0.19 ± 0.05 |
| EPDM_MP_P20 | 12.97 ± 0.92 | 2.45 ± 0.09 | 0.47 ± 0.22 | 10.54 ± 0.77 | 1.28 ± 0.08 | 0.30 ± 0.06 |
| EPDM_MP_P40 | 12.08 ± 0.39 | 2.56 ± 0.06 | 4.26 ± 2.30 | 2.82 ± 0.11 | 0.71 ± 0.01 | 0.92 ± 0.25 |
| EPDM_MP_P60 | 17.42 ± 2.18 | 2.60 ± 0.20 | 1.82 ± 0.57 | 0.33 ± 0.01 | 0.39 ± 0.04 | 1.48 ± 0.21 |
| 25 °C | 90 °C | |||||
|---|---|---|---|---|---|---|
| Sample | Ec* (MPa cm3/g) | σ0.6* (MPa cm3/g) | ε5 (mm/mm) | Ec* (MPa cm3/g) | σ0.6* (MPa cm3/g) | ε5 (mm/mm) |
| EPDM | 9.31 ± 0.94 | 8.86 ± 1.99 | 0.49 ± 0.04 | 7.43 ± 0.62 | 6.70 ± 1.27 | 0.13 ± 0.03 |
| EPDM_H | 1.41 ± 0.54 | 3.55 ± 1.18 | 0.71 ± 0.05 | 2.15 ± 0.31 | 3.25 ± 0.93 | 0.38 ± 0.02 |
| EPDM_H_P20 | 2.02 ± 0.46 | 4.90 ± 3.09 | 0.69 ± 0.08 | 0.37 ± 0.14 | 0.79 ± 0.40 | 0.63 ± 0.07 |
| EPDM_H_P40 | 5.71 ± 2.97 | 9.02 ± 3.91 | 0.58 ± 0.06 | 0.67 ± 0.05 | 0.74 ± 0.14 | 0.43 ± 0.37 |
| EPDM_H_P60 | 7.55 ± 1.69 | 12.78 ± 2.23 | 0.52 ± 0.03 | 0.61 ± 0.24 | 0.51 ± 0.16 | 0.70 ± 0.09 |
| EPDM_MP | 7.53 ± 1.03 | 41.98 ± 22.53 | 0.56 ± 0.05 | 3.47 ± 0.90 | 20.9 ± 38.65 | 0.42 ± 0.18 |
| EPDM_MP_P20 | 3.00 ± 0.31 | 3.67 ± 0.44 | 0.75 ± 0.02 | 1.82 ± 0.13 | 2.00 ± 0.25 | 0.56 ± 0.01 |
| EPDM_MP_P40 | 3.98 ± 0.57 | 4.81 ± 0.79 | 0.71 ± 0.03 | 0.89 ± 0.06 | 0.82 ± 0.04 | 0.73 ± 0.02 |
| EPDM_MP_P60 | 5.93 ± 0.76 | 15.12 ± 2.65 | 0.54 ± 0.03 | 0.66 ± 0.04 | 0.73 ± 0.03 | 0.51 ± 0.05 |
| Sample | Shore A at 25 °C | Shore A at 90 °C |
|---|---|---|
| EPDM | 58 ± 2 | 59 ± 1 |
| EPDM_H | 34 ± 3 | 32 ± 1 |
| EPDM_H_P20 | 47 ± 3 | 27 ± 1 |
| EPDM_H_P40 | 56 ± 2 | 23 ± 2 |
| EPDM_H_P60 | 69 ± 9 | 18 ± 5 |
| EPDM_MP | 47 ± 1 | 46 ± 2 |
| EPDM_MP_P20 | 48 ± 3 | 39 ± 3 |
| EPDM_MP_P40 | 56 ± 1 | 20 ± 1 |
| EPDM_MP_P60 | 72 ± 2 | 15 ± 1 |
Publisher’s Note: MDPI stays neutral with regard to jurisdictional claims in published maps and institutional affiliations. |
© 2022 by the authors. Licensee MDPI, Basel, Switzerland. This article is an open access article distributed under the terms and conditions of the Creative Commons Attribution (CC BY) license (https://creativecommons.org/licenses/by/4.0/).
Share and Cite
Bianchi, M.; Valentini, F.; Fredi, G.; Dorigato, A.; Pegoretti, A. Thermo-Mechanical Behavior of Novel EPDM Foams Containing a Phase Change Material for Thermal Energy Storage Applications. Polymers 2022, 14, 4058. https://doi.org/10.3390/polym14194058
Bianchi M, Valentini F, Fredi G, Dorigato A, Pegoretti A. Thermo-Mechanical Behavior of Novel EPDM Foams Containing a Phase Change Material for Thermal Energy Storage Applications. Polymers. 2022; 14(19):4058. https://doi.org/10.3390/polym14194058
Chicago/Turabian StyleBianchi, Marica, Francesco Valentini, Giulia Fredi, Andrea Dorigato, and Alessandro Pegoretti. 2022. "Thermo-Mechanical Behavior of Novel EPDM Foams Containing a Phase Change Material for Thermal Energy Storage Applications" Polymers 14, no. 19: 4058. https://doi.org/10.3390/polym14194058