Development of Multifunctional Nano-Graphene-Grafted Polyester to Enhance Thermal Insulation and Performance of Modified Polyesters
Abstract
:1. Introduction
2. Materials and Methods
2.1. Materials
- (1)
- Spinning grade PET
- (2)
- Polypropylene wax-maleic anhydride (PP wax-MA)
- (3)
- Nanographene powder
2.2. Quality Test Method
- (1)
- Yarn count was used to measure the denier of fibers through ASTM D1577-7.
- (2)
- The tensile strength and elongation at the break of fibers were measured by ASTM D3822.
- (3)
- The far-infrared emissivity and far-infrared temperature rise of fabrics were measured through the FTTS-FA-010 testing standard.
2.3. Material Processing Process
2.3.1. Compounding Process
- (1)
- Feeder: The material is fed into the feed trough.
- (2)
- Heater: The molten material is mixed here, and the equipment used in this study has a total of thirteen sections of heaters.
- (3)
- Die discharge port: The molten material is extruded from this, and the discharge port of the equipment used in this study is set to be a round-shaped section.
- (4)
- Cooling system: After mixing, the material is cooled down by a water-cooling channel for cutting.
- (5)
- Grain end: The material is cut into a granular ester state.
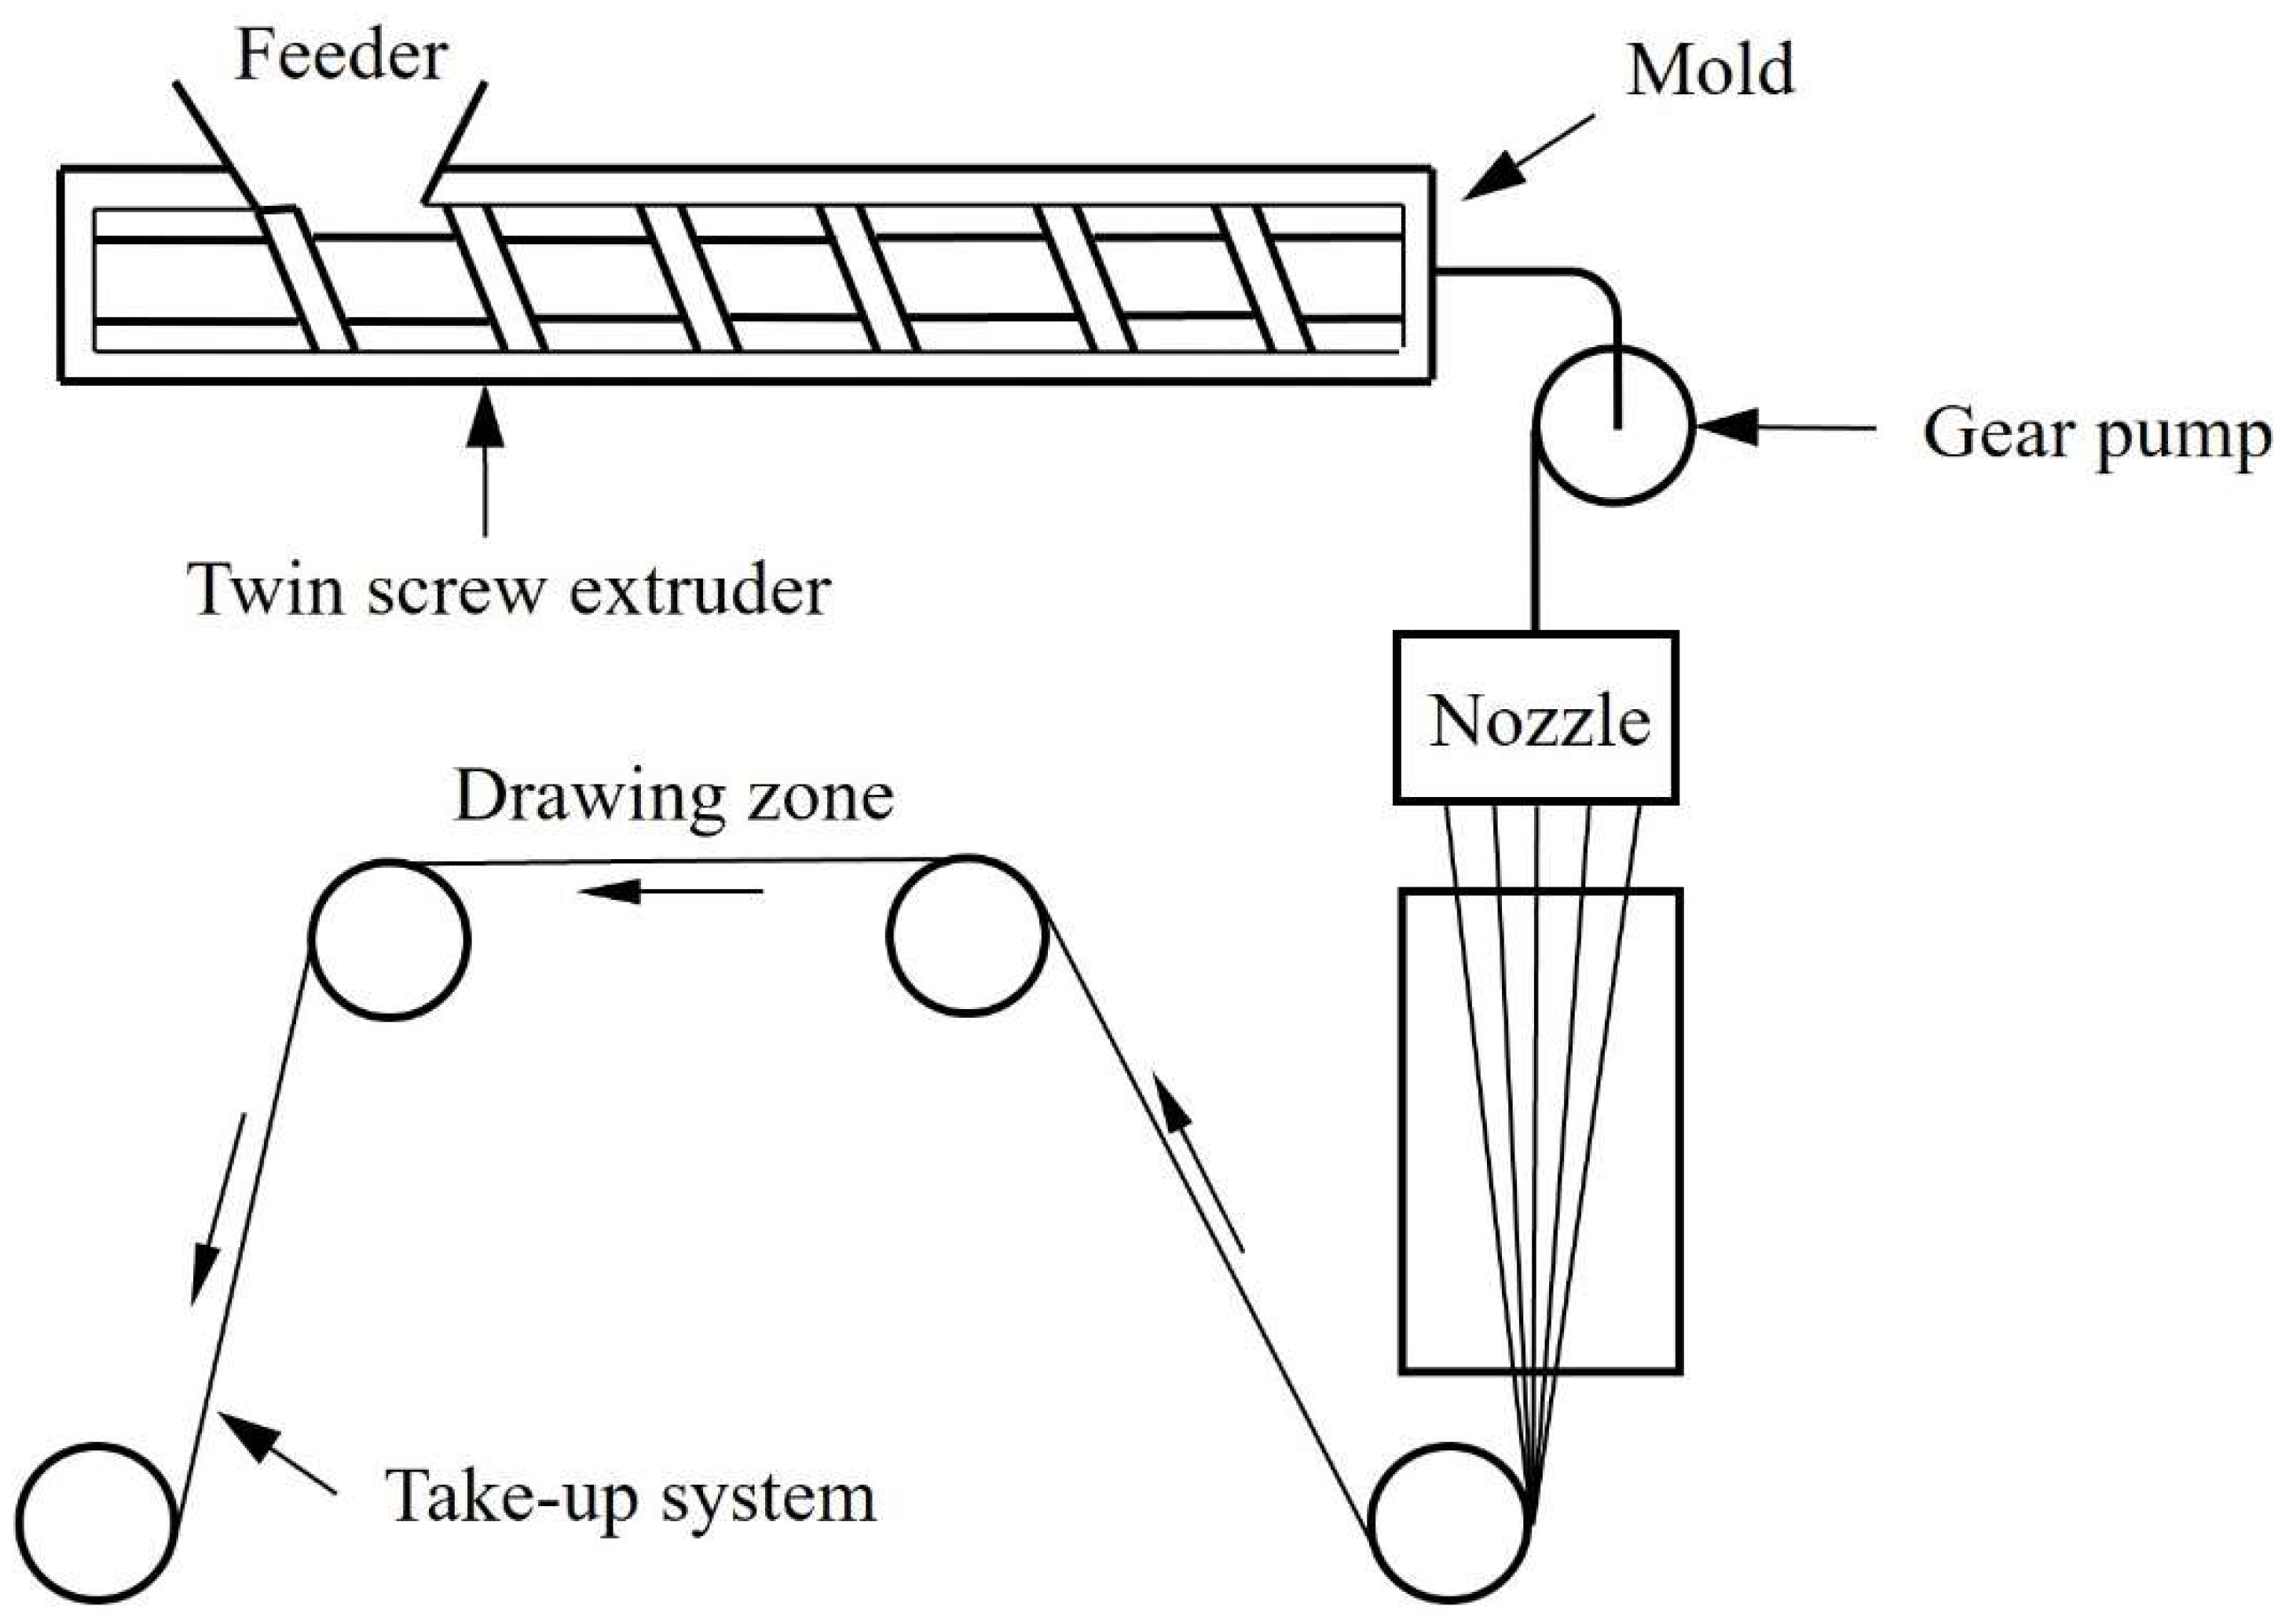
2.3.2. Melt Spinning Process
- (1)
- The material is propelled to the spinning nozzle through the action of a single screw and a gear pump.
- (2)
- After the fiber is extruded from the spinning nozzle, it is still in a molten state, and the molecular chain of the fiber is produced due to the relaxation of the internal stress of the tangled molecule.
- (3)
- Through the cooling system, solidification, and oiling and coiling system, the fibers are cooled and extended to place the fibers in the right direction, thereby increasing the strength of the fiber.
- (4)
- The fibers are solidified and coiled into a long filament cake.
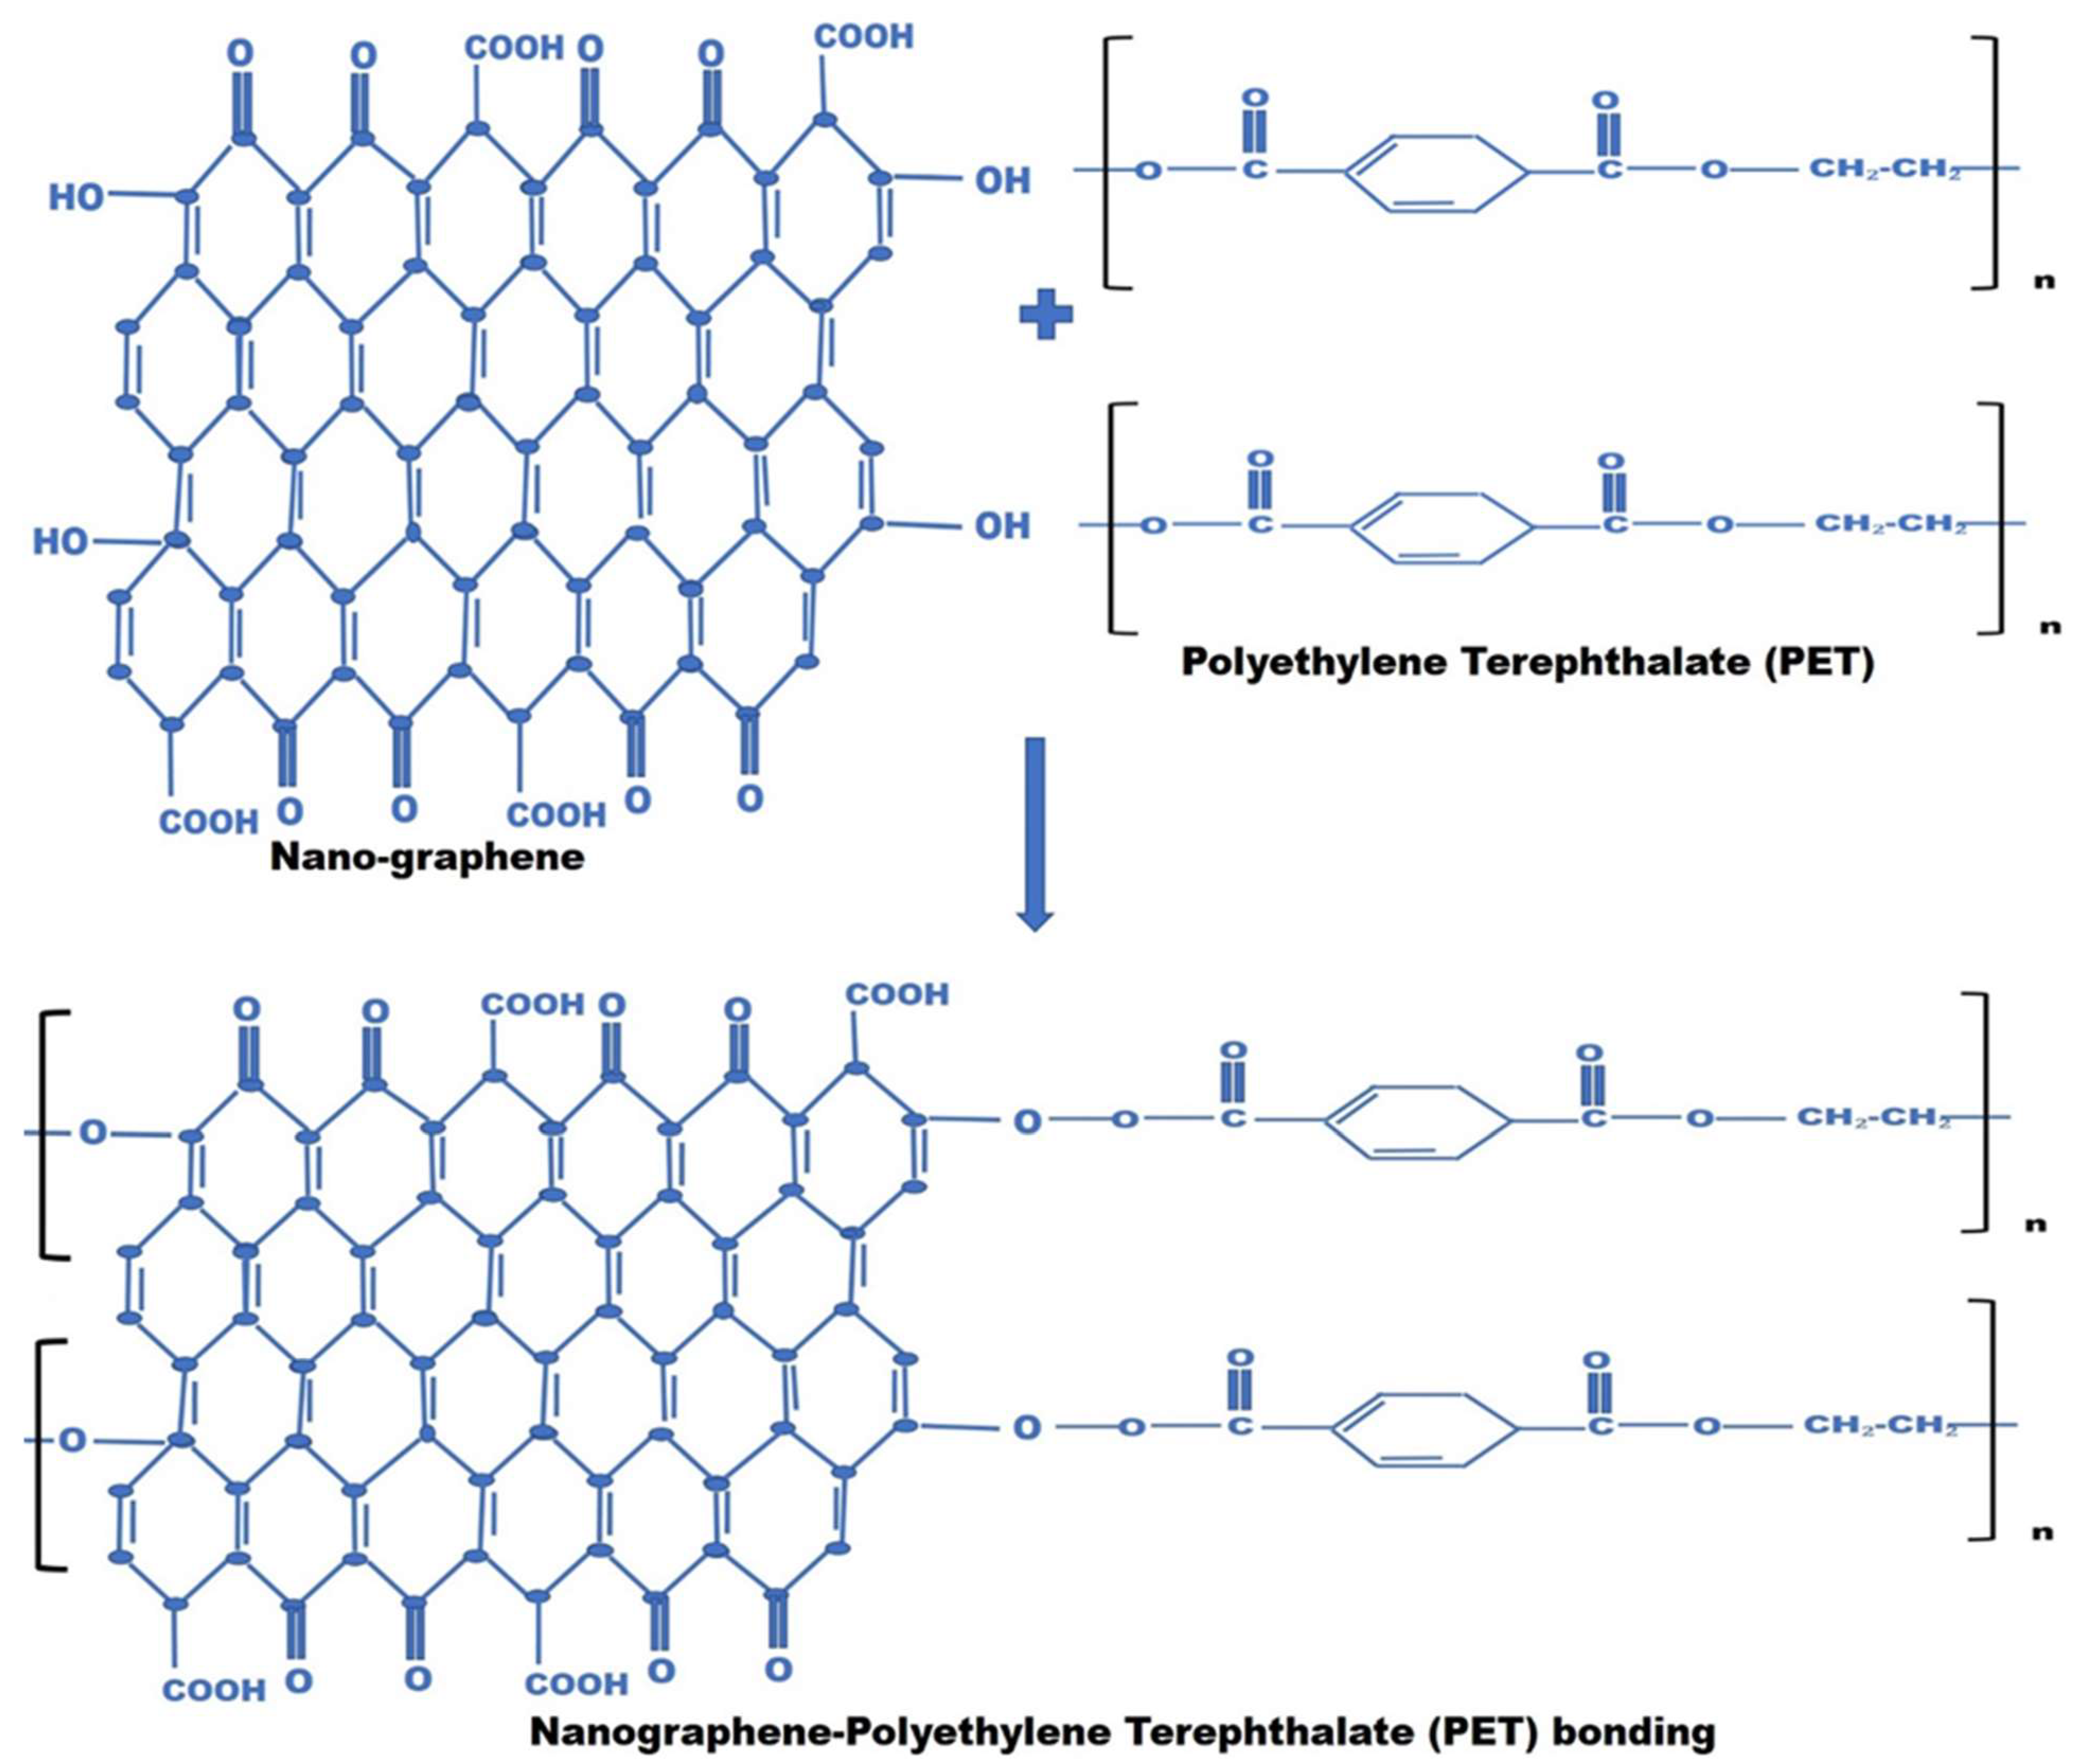
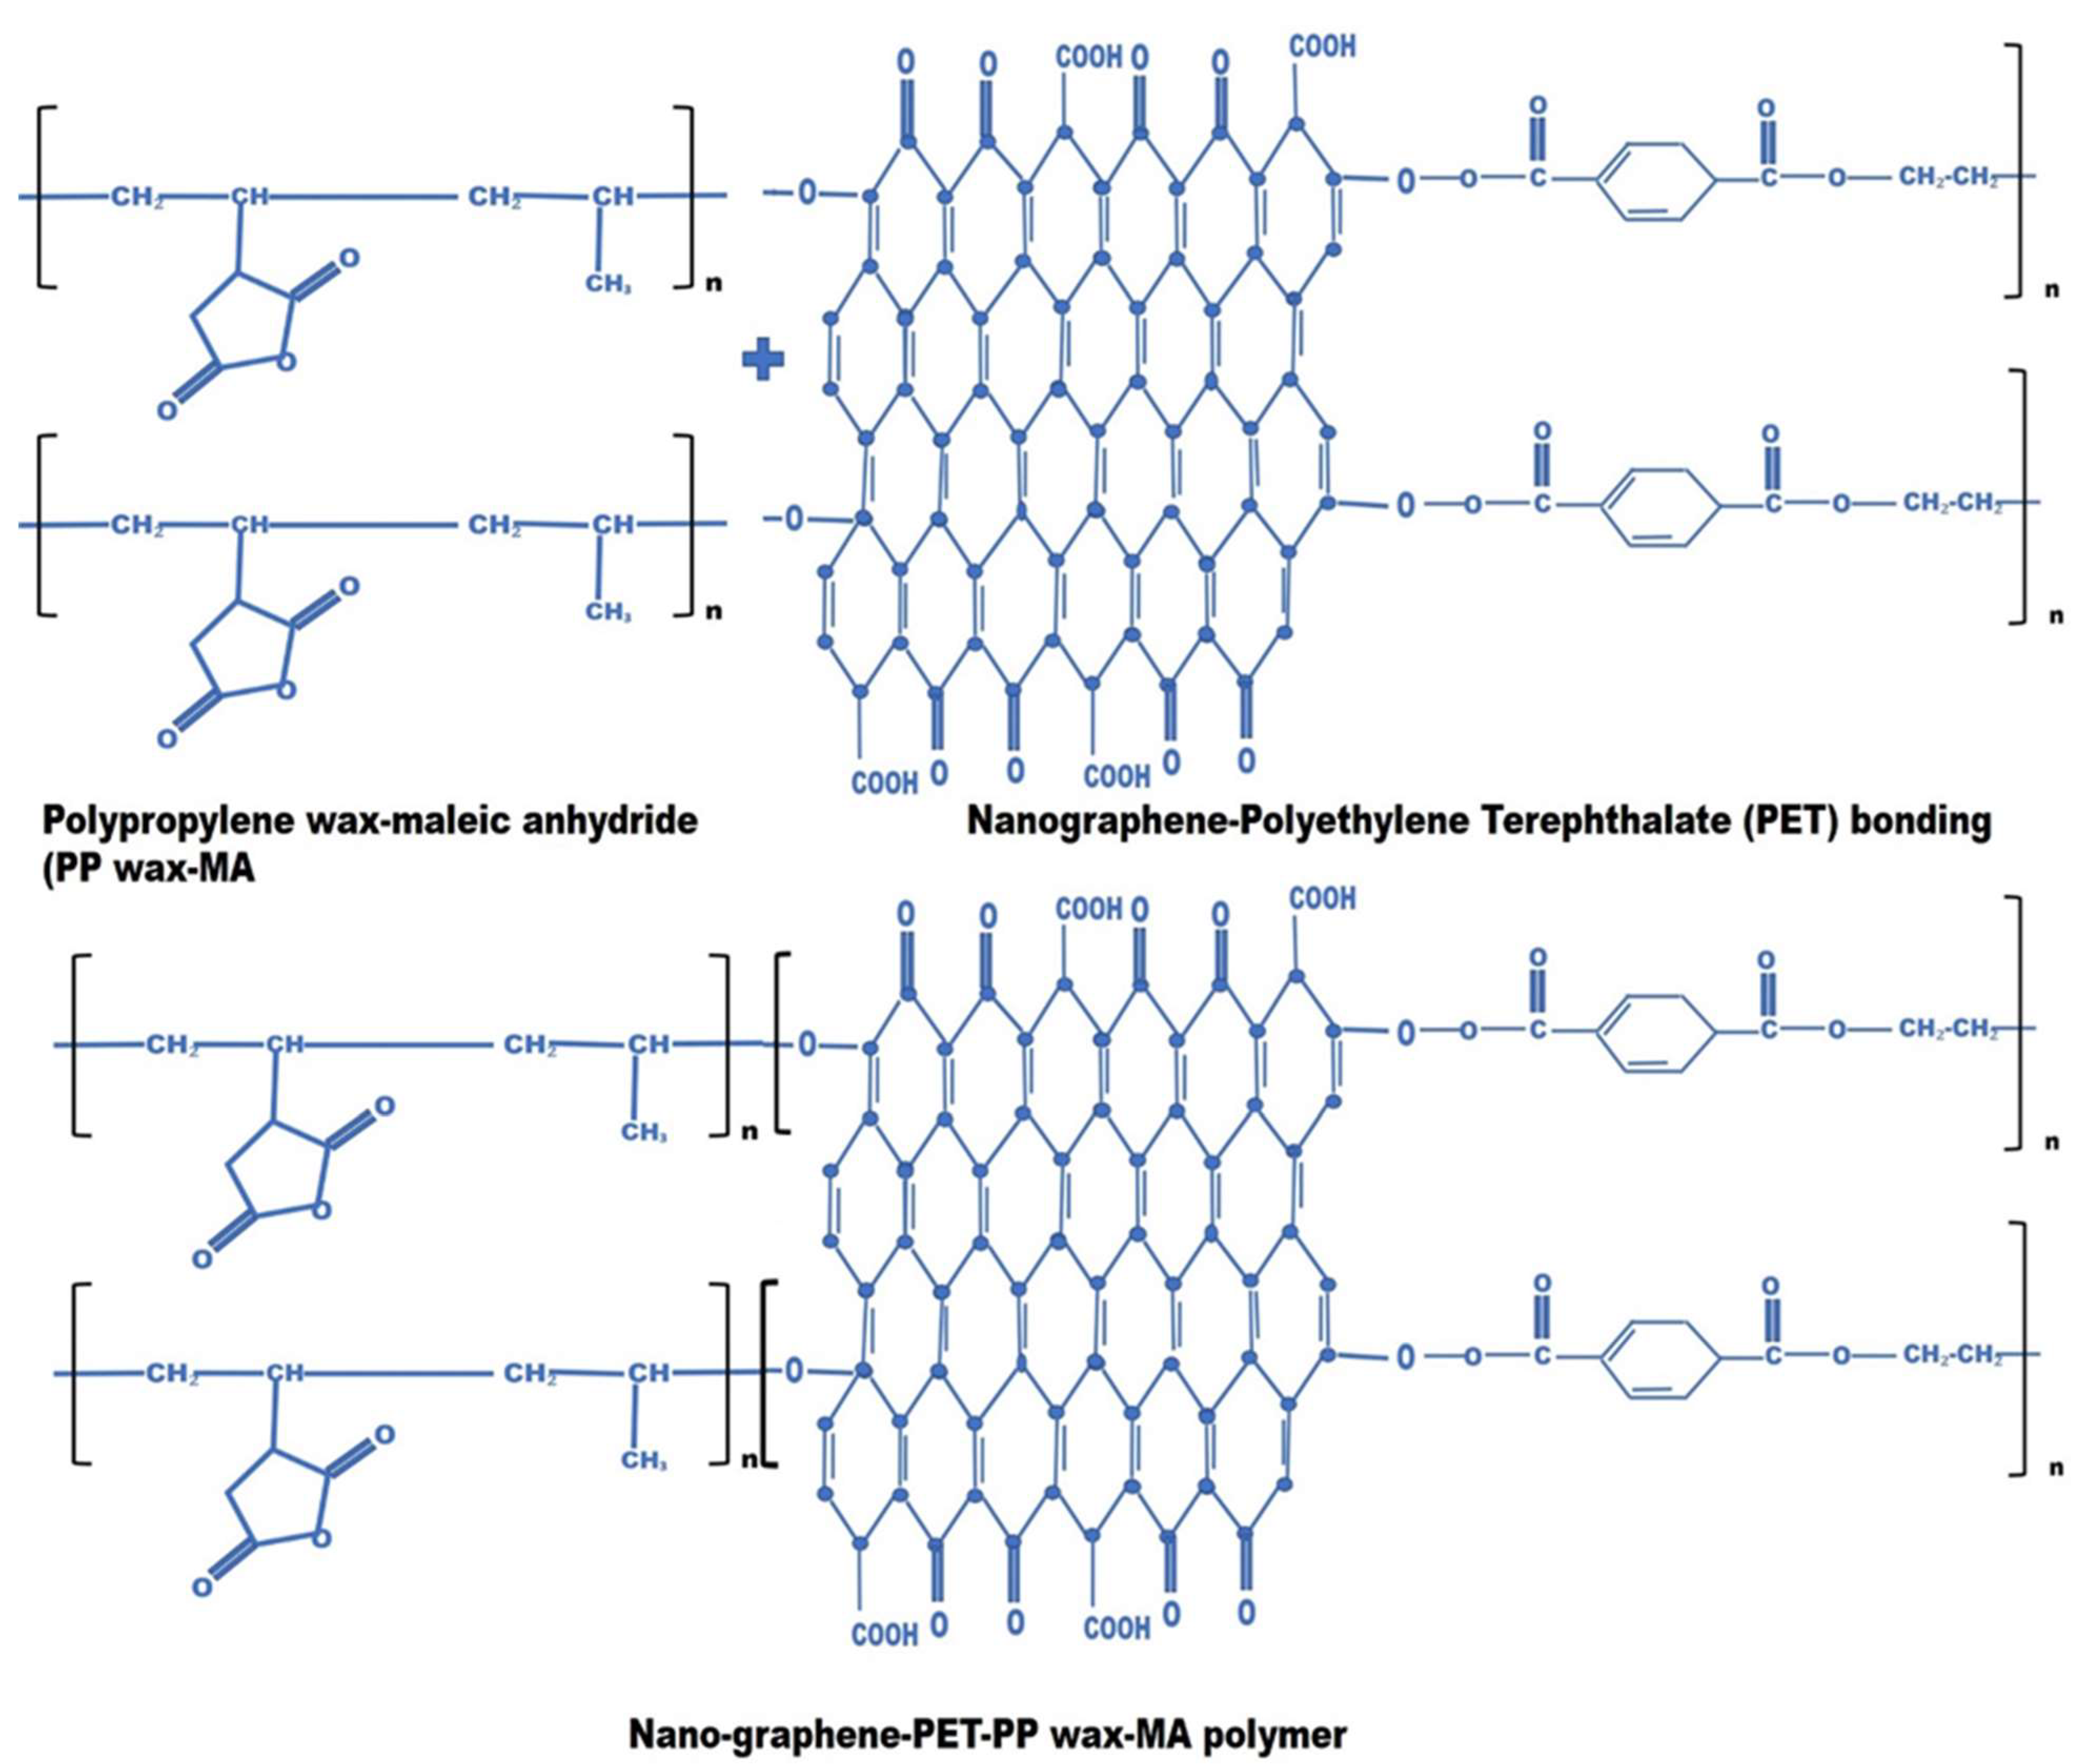
2.3.3. The Chemical Reactions Taking Place during the Synthesis of the Polymer Composite
3. Process Optimization
3.1. Taguchi Quality Method
- (1)
- Orthogonal array
- (2)
- S/N ratio
- (3)
- Main effects analysis (MEA)
3.2. Analysis of Variance (ANOVA)
- (1)
- Degrees of freedom (DOF):
- (2)
- Total sum of squares
- (3)
- Main effect of the sum of squares (SS)
- (4)
- Error sum of squares
- (5)
- Mean square and error mean of square:
- (6)
- F-ratio
- (7)
- Partial sum of square () of factors
- (8)
- Percent of contribution
- (9)
- Error
- (10)
- Combined error
3.3. Confidence Interval (CI)
3.4. Grey Relational Analysis (GRA)
- (1)
- Target values of multiple quality items:
- (2)
- The calculation steps for the gray relational grade:
4. Experimental Process and Planning
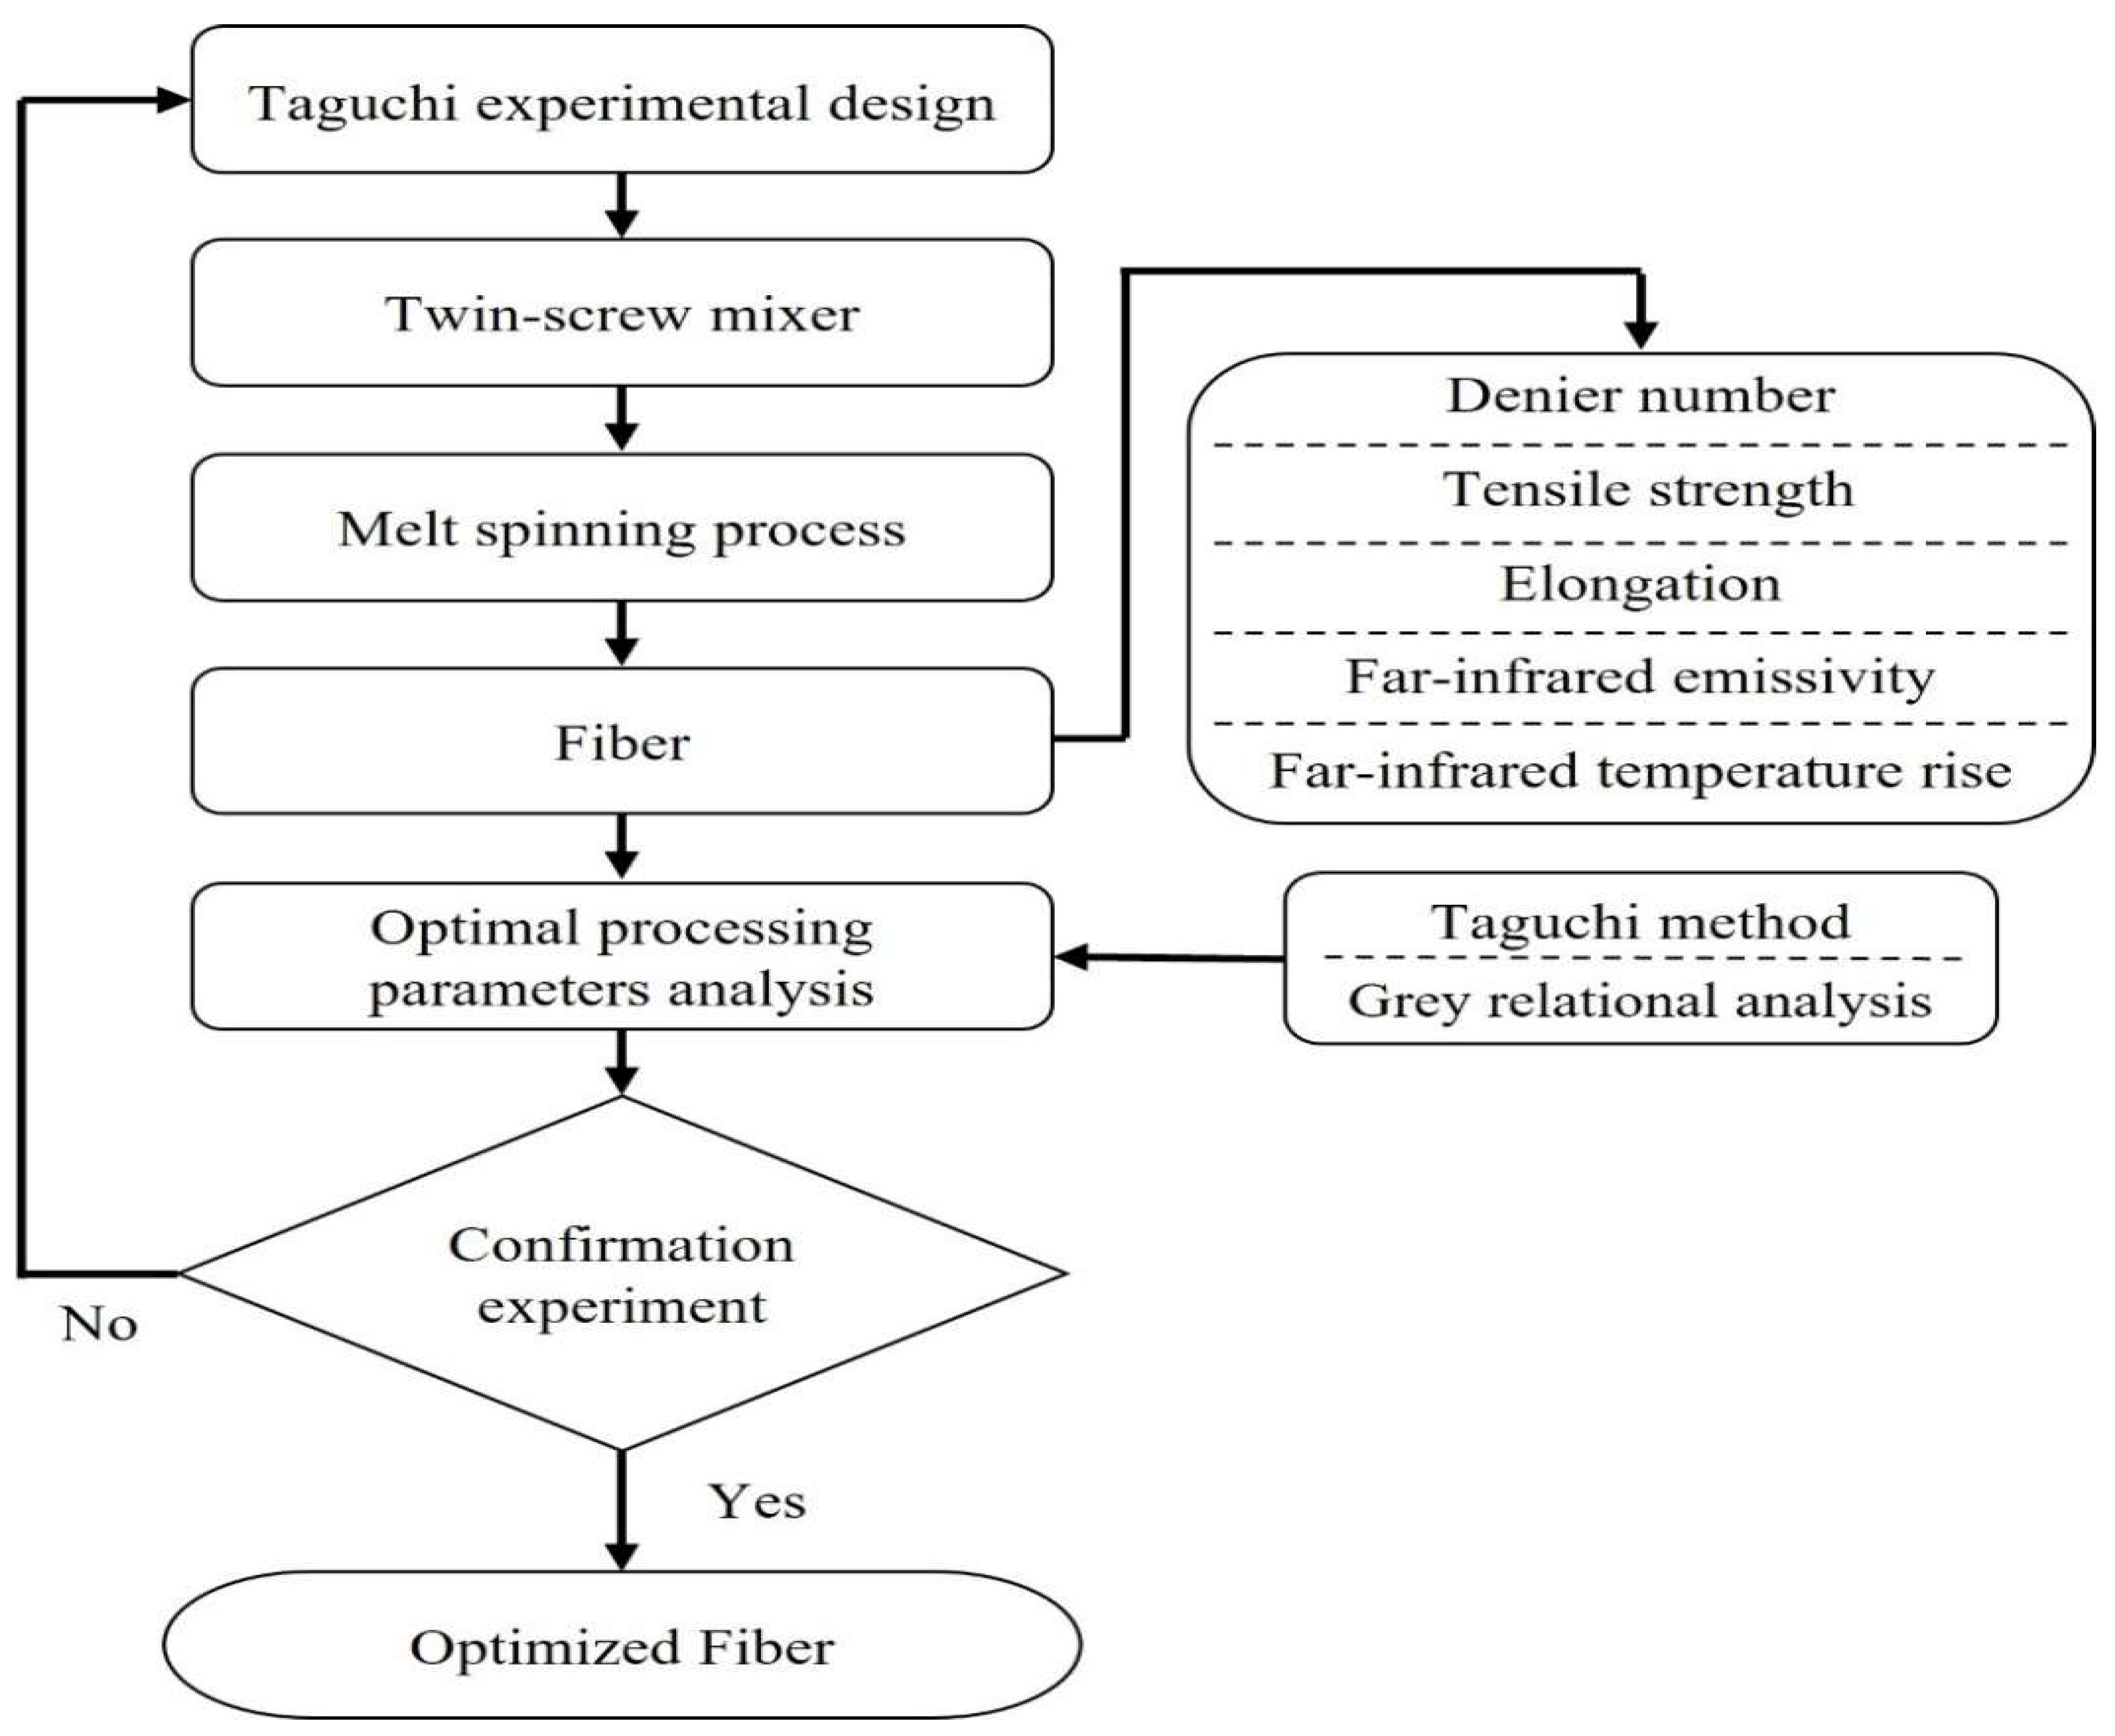
4.1. Experimental Process
4.2. Melt Spinning Process Parameter Selection
- (1)
- The nano-graphene powder addition
- (2)
- Melt Spinning Temperature
- (3)
- Gear pump speed
- (4)
- Roller speed and take-up speed
4.3. Taguchi Experiment Factor and Level Planning
5. Results and Discussion
5.1. Optimal Analysis of Yarn Count Single Quality
- (1)
- Main effects analysis (MEA)
- (2)
- Analysis of variance (ANOVA)
- (3)
- Yarn count confirmation experiment
5.2. Optimal Analysis of Tensile Strength Single Quality
- (1)
- MEA
- (2)
- ANOVA
- (3)
- Tensile strength confirmation experiment
5.3. Optimal Analysis of Single Quality of Elongation at Break
- (1)
- MEA
- (2)
- ANOVA
- (3)
- Elongation at break confirmation test
5.4. Optimal Analysis of Single Quality of Far-Infrared Emissivity
- (1)
- MEA
- (2)
- ANOVA
- (3)
- Far-infrared emissivity confirmation experiment
5.5. Optimal Analysis of Single Quality of Far-Infrared Temperature Rise
- (1)
- MEA
- (2)
- ANOVA
- (3)
- Far-infrared temperature rise confirmation experiment
5.6. Multi-Quality Optimization
5.7. Confirmation Experiment
- (1)
- Measuring instrument: 500-watt halogen lamp and infrared thermal phase detector.
- (2)
- Test sample: sample cloth 5 × 5 cm.
- (3)
- Test conditions and procedures: 500 W halogen lamp irradiated 100 cm away from the sample fabric, using infrared thermal imaging.
5.8. Optimization of Thermal Properties and Surface Resistance of 75 d/72 f Yarns
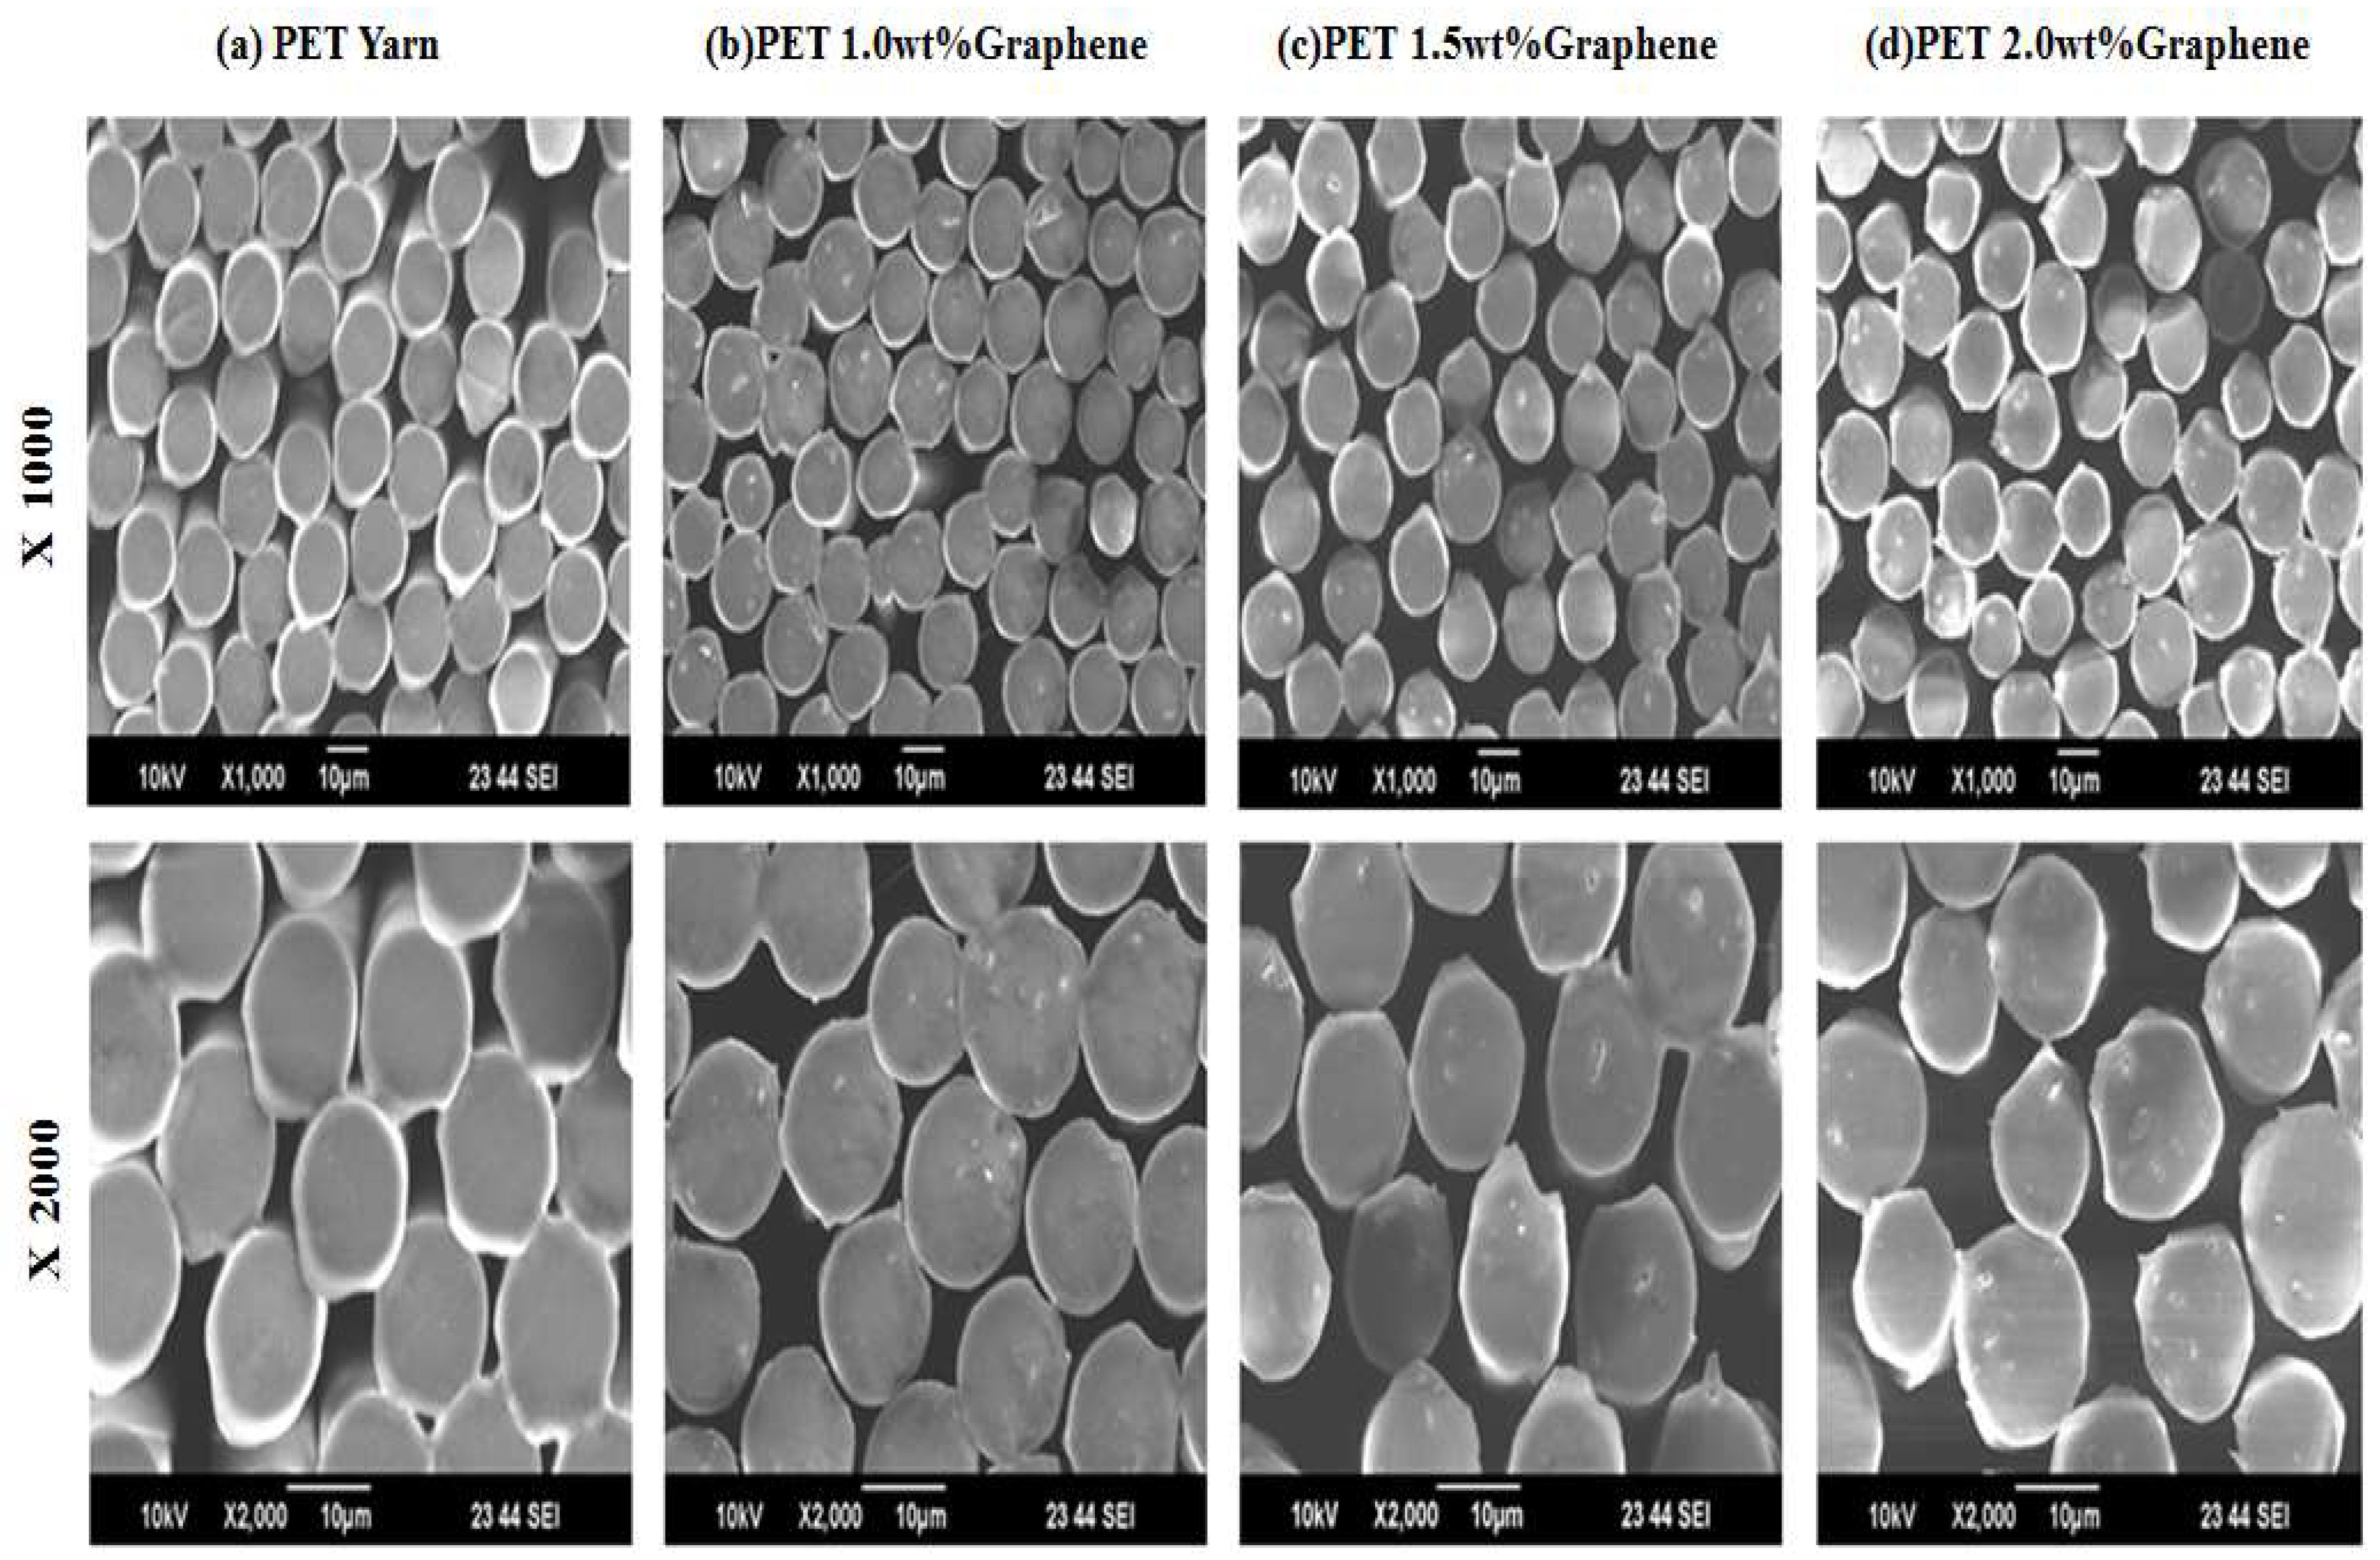
5.9. Fiber Surface Observation
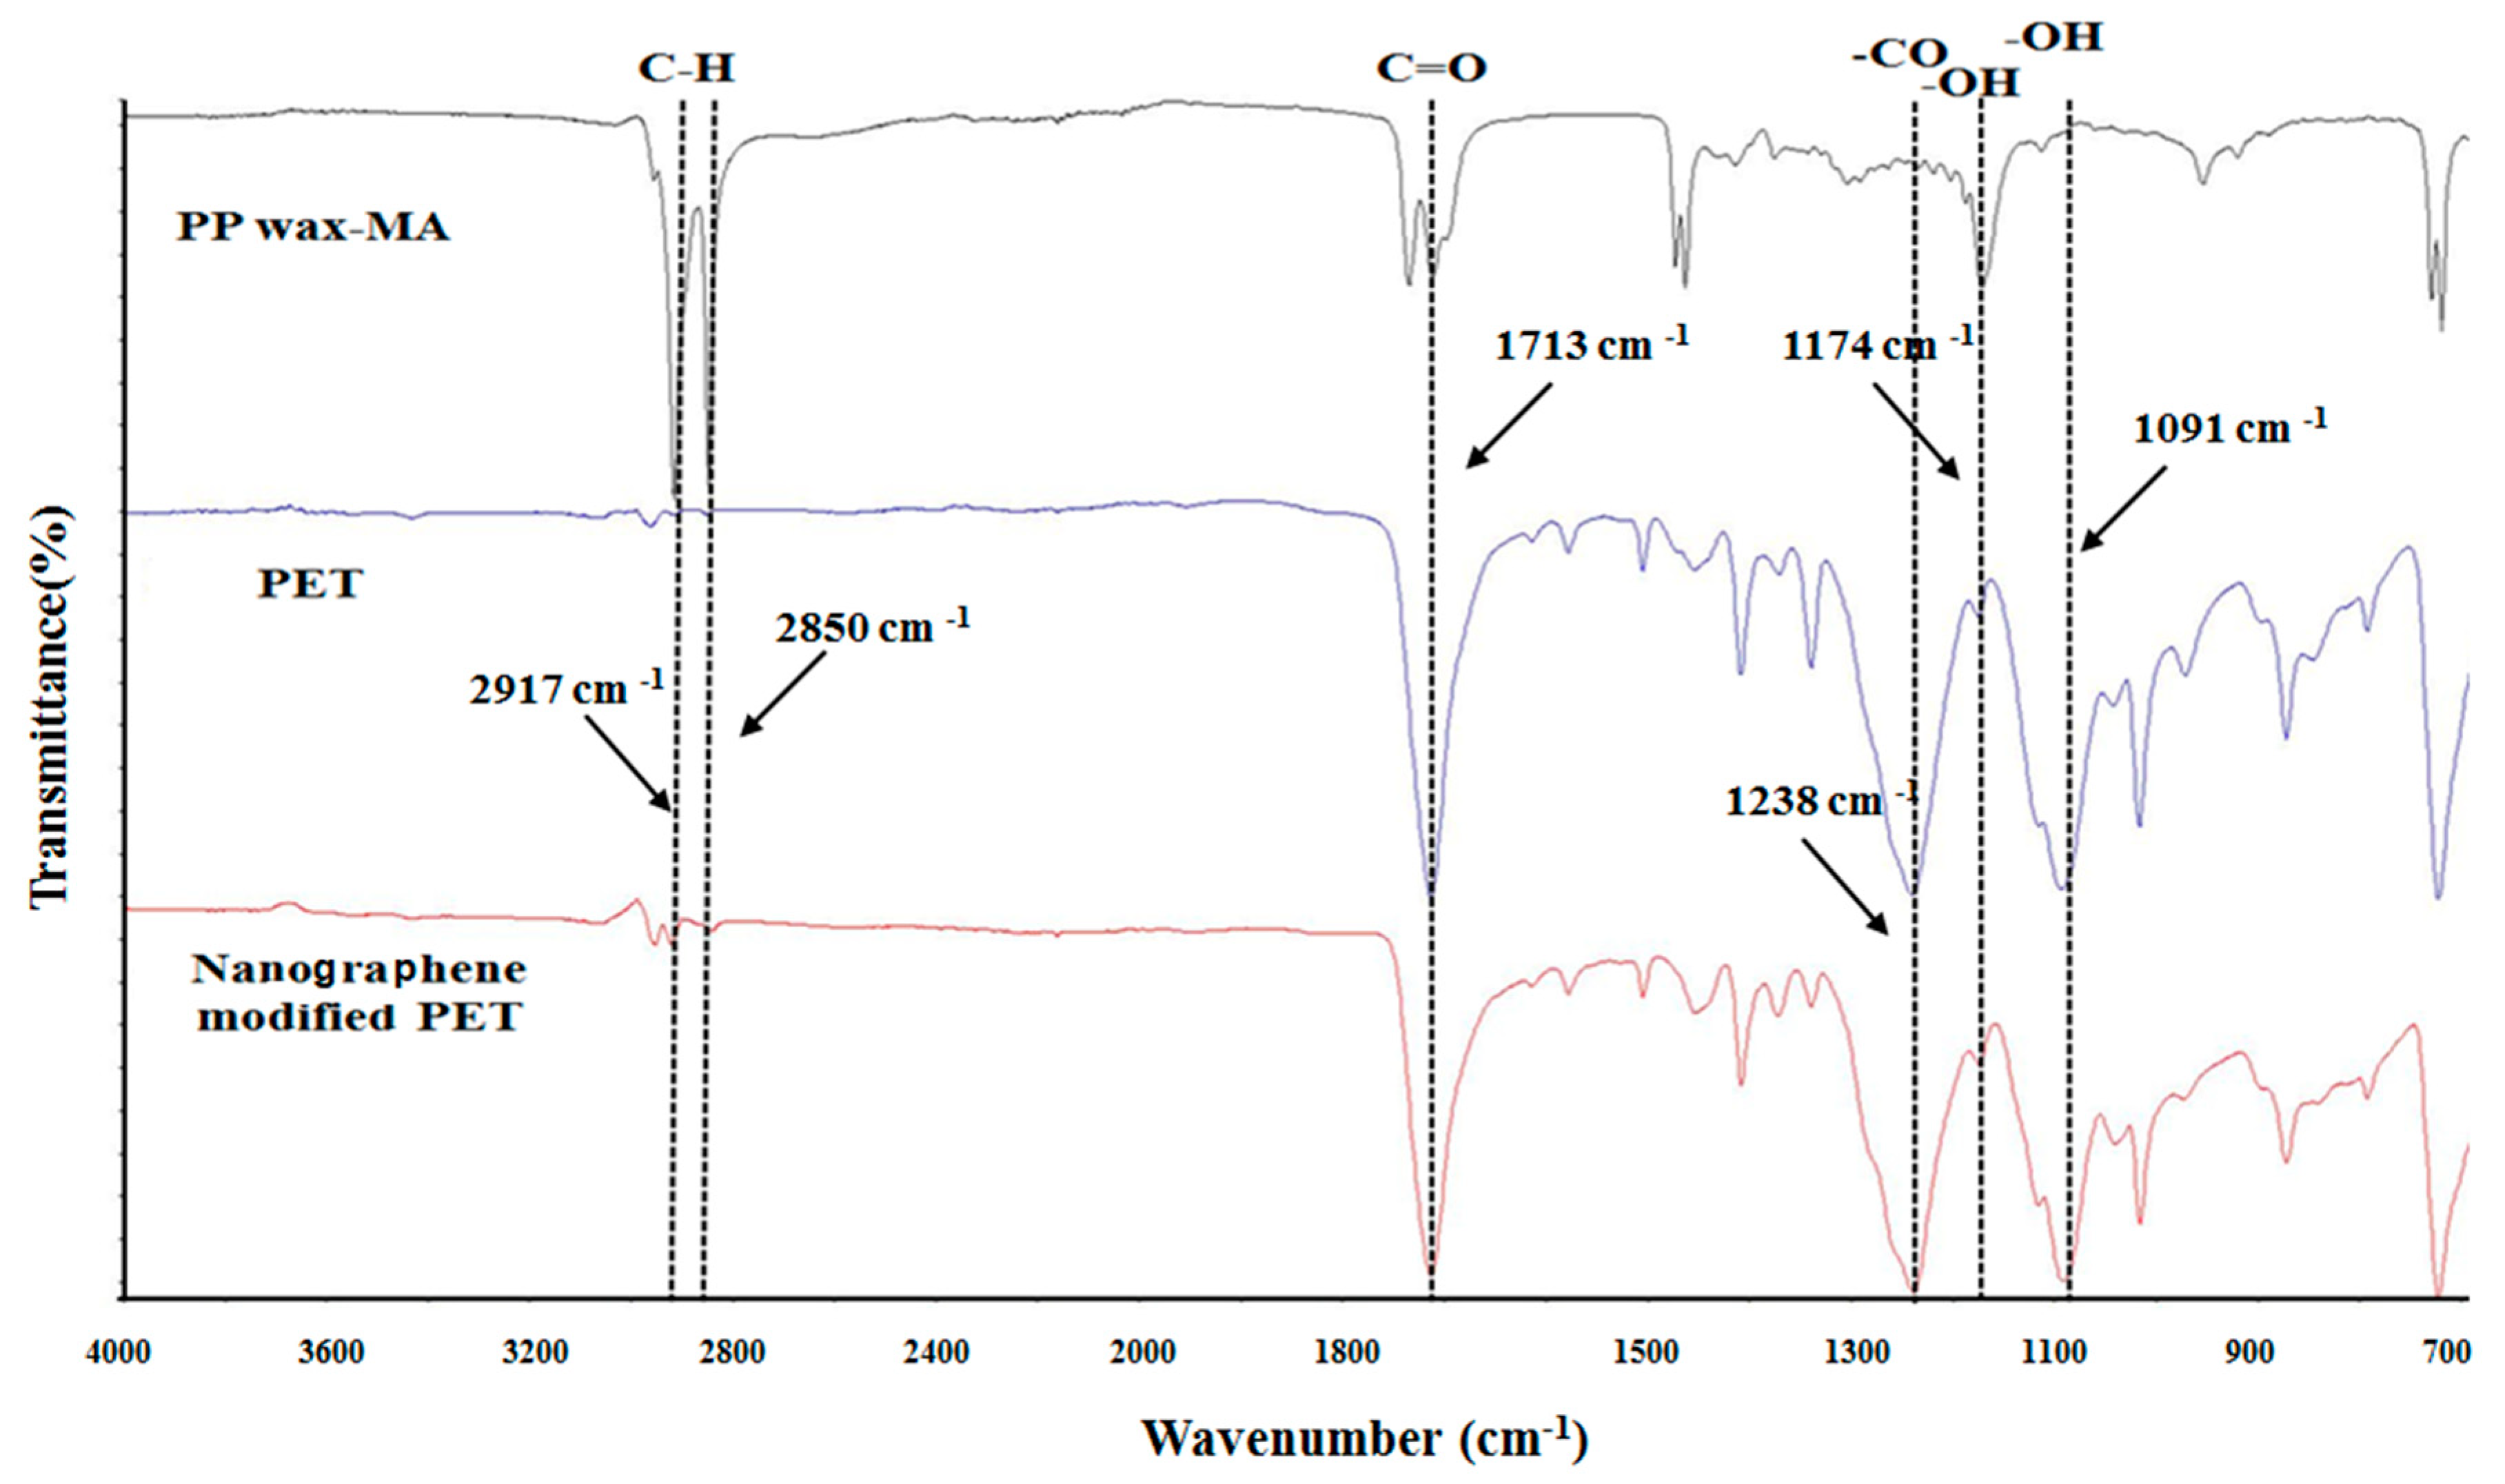
5.10. Fourier-Transform Infrared (FTIR) Spectroscopy Analysis
- (1)
- It is observed that the carboxyl group has a characteristic absorption peak at the wavenumber of 1713 cm−1, indicating that the graphene-modified PET structure has a maleic anhydride structure C=O bond.
- (2)
- The carboxyl group has a characteristic absorption peak at the wavenumber of 1238 cm−1, which represents the ether bond on the PET material.
- (3)
- The characteristic absorption peaks of the hydroxyl group of the graphene structure were found at the wavenumbers of 1091 cm−1 and 1174 cm−1, indicating that the nano-graphene powder interacted with PPwax-MA/PET during the mixing process, increasing their compatibility.
6. Conclusions
Author Contributions
Funding
Institutional Review Board Statement
Informed Consent Statement
Data Availability Statement
Acknowledgments
Conflicts of Interest
References
- Lin, C.M.; Chang, C.W. Production of thermal insulation composites containing bamboo charcoal. Text. Res. J. 2008, 78, 555–560. [Google Scholar] [CrossRef]
- Bahng, G.W.; Lee, J.D. Development of heat-generating polyester fiber harnessing catalytic ceramic powder combined with heat-generating super microorganisms. Text. Res. J. 2014, 84, 1220–1230. [Google Scholar] [CrossRef]
- Frydrych, I.; Dziworska, G.; Bilska, J. Comparative analysis of the thermal insulation properties of fabrics made of natural and man-made cellulose fibres. Fibres Text. East. Eur. 2002, 10, 40–44. [Google Scholar]
- Park, J. Functional fibers, composites and textiles utilizing photothermal and joule heating. Polymer 2020, 12, 189. [Google Scholar] [CrossRef] [PubMed]
- Hong, J.; Park, C.; Kim, Y. Photothermal properties of wool fabrics colored with SiO2@AuNPs. Colloids Surf. A Physicochem. Eng. Asp. 2019, 574, 115–121. [Google Scholar] [CrossRef]
- Zeng, H.; Wang, P.; Liang, L.; Hu, H. Facile preparation of superhydrophobic cotton fabric with a photothermal conversion effect via polypyrrole deposition for oil/water separation. J. Environ. Chem. Eng. 2022, 10, 106915. [Google Scholar] [CrossRef]
- Kim, H.A.; Kim, S.J. Far-Infrared emission characteristics and wear comfort property of ZrC-Imbedded heat storage knitted fabrics for emotional garments. Autex Res. J. 2017, 17, 142–151. [Google Scholar] [CrossRef]
- Furata, T.; Shimizu, Y.; Kondo, Y. Evaluating the temperature and humidity characteristics of solar energy absorbing and retaining fabric. Text. Res. J. 1996, 66, 123–130. [Google Scholar] [CrossRef]
- Kim, H.A.; Kim, S.J. Far-infrared emission characteristics of germanium included fabrics for emotional garment. Korean J. Sci. Emot. Sensib. 2010, 13, 687–692. [Google Scholar]
- Yeo, S.Y.; Lee, D.H.; Kim, E.A. Far IR emission and thermal properties of ceramics coated nylon fabrics. J. Korean Soc. Cloth. Text. 1998, 22, 515–524. [Google Scholar]
- Yoo, H.H.; Kim, Y.H.; Cho, H.T. Improvement of warmth retaining property of water vapor permeable/waterproof coated nylon fabric. J. Korean Fiber Soc. 1993, 30, 250–258. [Google Scholar]
- C A Lin, T.C.A.; Hsu, Y.H. Study on the far infrared ray emission property and adsorption performance of bamboo charcoal/polyvinyl alcohol fiber. Polym.-Plast. Technol. Eng. 2007, 46, 1073–1078. [Google Scholar] [CrossRef]
- Huang, C.L.; Huang, Y.T.; Li, T.T. Composite processing and property evaluation of far-infrared/electromagnetic shielding bamboo charcoal/phase change material/stainless steel elastic composite fabrics. J. Polym. Eng. 2016, 32, 211–220. [Google Scholar] [CrossRef]
- Shim, M.H.; Park, C.H.; Shim, H.S. Effect of ceramics on the physical and thermo-physiological performance of warm-up suit. Text. Res. J. 2009, 79, 1557–1564. [Google Scholar] [CrossRef]
- Mustaqeem, M.; Lin, J.Y.; Kamal, S.; Thakran, A.; Lu, G.Z.; Naikoo, G.; Chen, Y.F. Optically encodable and erasable multi-level nonvolatile flexible memory device based on metal–organic frameworks. ACS Appl. Mater. Interfaces 2022, 14, 26895–26903. [Google Scholar] [CrossRef] [PubMed]
- Aoyama, S.; Ismail, I.; Park, Y.T.; Yoshida, Y.; Macosko, C.W.; Ougizawa, T. Polyethylene terephthalate/trimellitic anhydride modified graphene nanocomposites. ACS Appl. Nano Mater. 2018, 1, 6301–6311. [Google Scholar] [CrossRef]
- Zhang, H.B.; Zheng, W.G.; Yan, Q.; Yang, Y.; Wang, J.W.; Lu, Z.H.; Ji, G.Y.; Yu, Z.Z. Electrically conductive polyethylene terephthalate/Graphene nanocomposites prepared by melt compounding. Polymer 2010, 51, 1191–1196. [Google Scholar] [CrossRef]
- Awad, S.A.; Khalaf, E.M. Improvement of the chemical, thermal, mechanical and morphological properties of polyethylene terephthalate–graphene particle composites. Bull. Mater. Sci. 2018, 41, 67. [Google Scholar] [CrossRef]
- Karaman, O.; Özcan, N.; Karaman, C.; Yola, B.B. Electrochemical cardiac troponin I immunosensor based on nitrogen and boron-doped graphene quantum dots electrode platform and Ce-doped SnO2/SnS2 signal amplification. Mater. Today Chem. 2022, 23, 100666. [Google Scholar] [CrossRef]
- Gunasekera, U.; Perera, N.; Perera, S. Modification of thermal Conductivity of cotton fabric using graphene. In Proceedings of the 2015 Moratuwa Engineering Research Conference IEEE, Moratuwa, Sri Lanka, 7–8 April 2015; pp. 55–59. [Google Scholar]
- Gan, L.; Hang, S.; Yuen, C.W. Graphene nanoribbon coated flexible and conductive cotton fabric. Compos. Sci. Technol. 2015, 17, 208–214. [Google Scholar] [CrossRef]
- Hu, X.; Tian, M.; Qu, L.; Zhu, S.; Han, G. Multifunctional cotton fabrics with graphene/polyurethane coatings with far-infrared emission, electrical conductivity, and ultraviolet-blocking properties. Carbon 2015, 95, 625–633. [Google Scholar] [CrossRef]
- Balandin, A.A.; Ghosh, S.; Bao, W. Superior thermal conductivity of single-layer graphene. Nano Lett. 2008, 3, 902–907. [Google Scholar] [CrossRef] [PubMed]
- Ansari, S.; Giannelis, E.P. Functionalized graphene sheet poly (vinylidene fluoride) conductive nanocomposites. J. Polym. Sci. B 2009, 47, 888–897. [Google Scholar] [CrossRef]
- Available online: http://www.graphene.com.tw/assets/images/DM-C.pdf (accessed on 5 June 2022).
- Mehrabi, M.B.; Shahrokhian, S.; Iraji-Zad, A. Silver fiber fabric as the current collector for preparation of graphene-based supercapacitors. Electrochim. Acta 2017, 227, 246–254. [Google Scholar] [CrossRef]
- Yun, Y.J.; Kim, D.K.; Hong, W.G. Highly stretchable, mechanically stable, and weavable reduced graphene oxide yarn with high NO2 sensitivity for wearable gas sensors. RSC. Adv. 2018, 8, 7615–7621. [Google Scholar] [CrossRef]
- Golparvar, A.J.; Yapici, M.K. Graphene smart textile-based wearable eye movement sensor for electro-ocular control and interaction with objects. J. Electrochem. Soc. 2019, 166, 3184–3193. [Google Scholar] [CrossRef]
- Sombatsompop, N.; Panaploy, M. Die geometry effects on the temperature profile measurements of flowing PP melt in a twin-screw extruder. Polym. Test. 2002, 21, 7–25. [Google Scholar] [CrossRef]
- Baker, W.E.; Scoot, C.E.; Hu, G.H. Reactive Polymer Blending; Hanser Publishers, München: Hanser, Germany, 2001. [Google Scholar]
- The Japan Steel Works Ltd. JSW Twin Screw Extruder. 2002. Available online: https://www.directindustry.com/prod/jsw-japan-steel-works-ltd/product-51394-503382.html (accessed on 30 August 2022).
- TMT Spinning System for FDY TMT Machinery, Inc. Available online: https://www.tmt-mc.jp/ (accessed on 30 August 2022).
- Chu, C.W.; Lin, C.A.; Hong, P.D. Melt-spinning and thermal stability behavior of TiO2 nanoparticle/polypropylene nanocomposite fibers. J. Polym. Res. 2011, 18, 367–372. [Google Scholar] [CrossRef]
- Kuo, C.F.J.; Yang, P.C.; Umar, M.L. A bifacial photovoltaic thermal system design with parameter optimization and performance beneficial validation. Appl. Energy 2019, 247, 335–349. [Google Scholar] [CrossRef]
- Kuo, C.F.J.; Huang, C.C.; Lin, Y.J. A study of optimum processing parameters and abnormal parameter identification of the twin-screw co-rotating extruder mixing process based on the distribution and dispersion properties for SiO2/low-density polyethylene nano-composites. Text. Res. J. 2010, 90, 1102–1117. [Google Scholar] [CrossRef]
- Kuo, C.F.J.; Lin, W.T. Optimum processing parameters of sueding fabric comfort by applying the Taguchi method and fuzzy theory. Text. Res. J. 2019, 89, 5165–5176. [Google Scholar] [CrossRef]
- Kuo, C.F.J.; Liu, J.M.; Umar, M.L. The photovoltaic thermal system parameter optimization design and practical verification. Energy Convers. Manag. 2019, 180, 358–371. [Google Scholar] [CrossRef]
- Canbolat, A.S.; Bademlioglu, A.H.; Arslanoglu, N. Performance optimization of absorption refrigeration systems using Taguchi, ANOVA and Grey Relational Analysis methods. J. Clean. Prod. 2019, 229, 874–885. [Google Scholar] [CrossRef]
- Üstüntağ, S.; Şenyiğit, E.; Mezarcıöz, S. Optimization of coating process conditions for denim fabrics by Taguchi method and grey relational analysis. J. Nat. Fibers 2020, 19, 685–699. [Google Scholar] [CrossRef]
- Kuo, C.F.J.; Dong, M.Y.; Yang, C.P. Optimization of the water-based polyurethane with acrylate terminal process in nylon fabrics application using the Taguchi-based gray relational analysis method. Text. Res. J. 2021, 91, 1197–1210. [Google Scholar] [CrossRef]
- Chen, Z.; Wang, J.; Li, J.; Zhu, Y.; Ge, M. Negative air ion release and far infrared emission properties of polyethylene terephthalate/germanium composite fiber. J. Eng. Fibers Fabr. 2017, 12, 56–65. [Google Scholar] [CrossRef] [Green Version]
- Specified Requirements of Far Infrared Textiles, FTTS-FA-010. Available online: https://www.tnet.org.tw/Article/Detail/18080 (accessed on 3 March 2022).


| Control Factor | Level | |||
|---|---|---|---|---|
| 1 | 2 | 3 | ||
| A | Graphene powder content (wt%) | 1.0 | 1.5 | 2.0 |
| B | Mold temperature (°C) | 275 | 278 | 281 |
| C | Gear pump speed (rpm) | 13 | 15 | 17 |
| D | Melt speed (°C) | 278 | 280 | 282 |
| E | Roller speed (m/min) | 2350 | 2450 | 2550 |
| F | Take up speed (m/min) | 2300 | 2400 | 2500 |
| Exp. No. | Factors | |||||
|---|---|---|---|---|---|---|
| A | B | C | D | E | F | |
| Graphene Powder Content (wt%) | Mold Temperature (°C) | Gear Pump Speed (rpm) | Melt Temperature (°C) | Roller Speed (m/min) | Take Up Speed (m/min) | |
| 1 | 1.0 | 275 | 13 | 278 | 2350 | 2300 |
| 2 | 1.0 | 278 | 15 | 280 | 2450 | 2400 |
| 3 | 1.0 | 281 | 17 | 282 | 2550 | 2500 |
| 4 | 1.5 | 275 | 13 | 280 | 2450 | 2500 |
| 5 | 1.5 | 278 | 15 | 282 | 2550 | 2300 |
| 6 | 1.5 | 281 | 17 | 278 | 2350 | 2400 |
| 7 | 2.0 | 275 | 15 | 278 | 2550 | 2400 |
| 8 | 2.0 | 278 | 17 | 280 | 2350 | 2500 |
| 9 | 2.0 | 281 | 13 | 282 | 2450 | 2300 |
| 10 | 1.0 | 275 | 17 | 282 | 2450 | 2400 |
| 11 | 1.0 | 278 | 13 | 278 | 2550 | 2500 |
| 12 | 1.0 | 281 | 15 | 280 | 2350 | 2300 |
| 13 | 1.5 | 275 | 15 | 282 | 2350 | 2500 |
| 14 | 1.5 | 278 | 17 | 278 | 2450 | 2300 |
| 15 | 1.5 | 281 | 13 | 280 | 2550 | 2400 |
| 16 | 2.0 | 275 | 17 | 280 | 2550 | 2300 |
| 17 | 2.0 | 278 | 13 | 282 | 2350 | 2400 |
| 18 | 2.0 | 281 | 15 | 278 | 2450 | 2500 |
| Exp. No. | Experiment | Yarn Count | ||||
|---|---|---|---|---|---|---|
| Data 1 (d) | Data 2 (d) | Data 3 (d) | Mean (d) | Standard Deviation | S/N Ratio (dB) | |
| 1 | 75.3 | 74.5 | 75.0 | 74.9 | 0.40 | 37.49 |
| 2 | 79.5 | 76.8 | 81.6 | 79.3 | 2.40 | 37.97 |
| 3 | 78.1 | 77.5 | 80.6 | 78.7 | 1.64 | 37.91 |
| 4 | 74.2 | 72.3 | 74.6 | 73.7 | 1.22 | 37.34 |
| 5 | 73.5 | 71.5 | 84.2 | 76.4 | 6.82 | 37.60 |
| 6 | 77.8 | 75.3 | 80.3 | 77.8 | 2.50 | 37.81 |
| 7 | 76.1 | 75.1 | 78.1 | 76.4 | 1.52 | 37.66 |
| 8 | 73.1 | 71.8 | 78.2 | 74.4 | 3.38 | 37.41 |
| 9 | 74.4 | 80.7 | 76.0 | 77.0 | 3.27 | 37.71 |
| 10 | 78.8 | 77.2 | 76.8 | 77.6 | 1.05 | 37.79 |
| 11 | 70.3 | 68.9 | 74.5 | 71.2 | 2.91 | 37.03 |
| 12 | 75.1 | 75.5 | 82.0 | 77.5 | 3.93 | 37.77 |
| 13 | 75.0 | 77.0 | 77.9 | 76.6 | 1.48 | 37.69 |
| 14 | 77.5 | 76.8 | 80.0 | 78.1 | 1.68 | 37.85 |
| 15 | 75.5 | 75.1 | 77.5 | 76.0 | 1.28 | 37.61 |
| 16 | 76.7 | 77.5 | 78.6 | 77.6 | 0.95 | 37.79 |
| 17 | 76.8 | 77.5 | 78.2 | 77.5 | 0.70 | 37.78 |
| 18 | 72.1 | 70.8 | 77.7 | 73.5 | 3.66 | 37.30 |
| A | B | C | D | E | F | |
|---|---|---|---|---|---|---|
| Level 1 | 37.665 | 37.629 | 37.500 | 37.527 | 37.659 | 37.704 |
| Level 2 | 37.651 | 37.609 | 37.666 | 37.653 | 37.666 | 37.774 |
| Level 3 | 37.613 | 37.690 | 37.763 | 37.750 | 37.605 | 37.532 |
| Effect | 0.052 | 0.081 | 0.263 | 0.222 | 0.061 | 0.242 |
| Ranking | 6 | 4 | 1 | 3 | 5 | 2 |
| Factor | DOF | SS | MS | F Ratio | SS’ | Contribution |
|---|---|---|---|---|---|---|
| A | 2 | 0.0088 | 0.0044 | 0.1396 | - | - |
| B | 2 | 0.0216 | 0.0108 | 0.3408 | - | - |
| C | 2 | 0.2129 | 0.1064 | 3.3597 | 0.1495 | 19.5767 |
| D | 2 | 0.1497 | 0.0748 | 2.362 | 0.0864 | 11.3065 |
| E | 2 | 0.0133 | 0.0066 | - | - | - |
| F | 2 | 0.1990 | 0.0995 | 3.1396 | 0.1356 | 17.5148 |
| Error | 5 | 0.16 | 0.0316 | - | - | - |
| Combined error | 11 | 0.50 | 0.0454 | - | 0.39 | 51.602 |
| Total | 17 | 0.76 | - | - | 0.76 | 100 |
| Confirmation Experiment | Unit: Diner | ||||
|---|---|---|---|---|---|
| Control factor | Data 1 | Data 2 | Data 3 | Average | S/N |
| C3, D3, F2 | 77.3 | 75.5 | 76.8 | 76.5 | 37.67 |
| Exp. No. | Experiment | Tensile Strength | ||||
|---|---|---|---|---|---|---|
| Data 1 (g/d) | Data 2 (g/d) | Data 3 (g/d) | Mean (g/d) | Standard Deviation | S/N Ratio (dB) | |
| 1 | 3.16 | 3.12 | 3.13 | 3.14 | 0.021 | 9.92 |
| 2 | 3.22 | 3.28 | 3.26 | 3.25 | 0.030 | 10.24 |
| 3 | 3.42 | 3.35 | 3.39 | 3.39 | 0.035 | 10.59 |
| 4 | 3.28 | 3.30 | 3.26 | 3.28 | 0.02 | 10.31 |
| 5 | 3.19 | 3.15 | 3.22 | 3.19 | 0.035 | 10.06 |
| 6 | 3.29 | 3.17 | 3.31 | 3.26 | 0.075 | 10.25 |
| 7 | 3.17 | 3.25 | 3.19 | 3.20 | 0.041 | 10.11 |
| 8 | 3.28 | 3.31 | 3.34 | 3.31 | 0.030 | 10.39 |
| 9 | 3.36 | 3.28 | 3.37 | 3.34 | 0.049 | 10.46 |
| 10 | 3.32 | 3.17 | 3.33 | 3.27 | 0.089 | 10.29 |
| 11 | 3.35 | 3.39 | 3.34 | 3.36 | 0.026 | 10.52 |
| 12 | 3.12 | 3.18 | 3.08 | 3.13 | 0.050 | 9.90 |
| 13 | 3.32 | 3.27 | 3.35 | 3.31 | 0.040 | 10.40 |
| 14 | 3.33 | 3.34 | 3.41 | 3.36 | 0.043 | 10.52 |
| 15 | 3.35 | 3.27 | 3.36 | 3.33 | 0.049 | 10.44 |
| 16 | 3.29 | 3.26 | 3.29 | 3.28 | 0.017 | 10.32 |
| 17 | 3.25 | 3.36 | 3.27 | 3.29 | 0.058 | 10.35 |
| 18 | 3.35 | 3.41 | 3.36 | 3.37 | 0.032 | 10.56 |
| A | B | C | D | E | F | |
|---|---|---|---|---|---|---|
| Level 1 | 10.248 | 10.228 | 10.337 | 10.317 | 10.204 | 10.200 |
| Level 2 | 10.333 | 10.351 | 10.214 | 10.268 | 10.401 | 10.281 |
| Level 3 | 10.366 | 10.367 | 10.398 | 10.361 | 10.342 | 10.466 |
| Effect | 0.118 | 0.139 | .0.181 | 0.093 | 0.196 | 0.266 |
| Ranking | 5 | 4 | 3 | 6 | 2 | 1 |
| Factor | DOF | SS | MS | F Ratio | SS’ | Contribution |
|---|---|---|---|---|---|---|
| A | 2 | 0.0448 | 0.8840 | - | - | |
| B | 2 | 0.0696 | 0.0224 | 1.3740 | 0.0189 | 2.6499 |
| C | 2 | 0.1033 | 0.0348 | 2.0385 | 0.0526 | 7.3585 |
| D | 2 | 0.0259 | 0.0516 | 0.5120 | - | - |
| E | 2 | 0.1216 | 0.0129 | 2.3993 | 0.0709 | 9.9148 |
| F | 2 | 0.2233 | 0.0608 | 4.4057 | 0.1726 | 24.1307 |
| Error | 5 | 0.1300 | 0.1116 | - | - | - |
| Combined error | 9 | 0.4208 | 0.0253 | - | 0.5729 | 55.9461 |
| Total | 17 | 0.72 | 0.0467 | - | 0.72 | 100 |
| Confirmation Experiment | Unit: g/d | ||||
|---|---|---|---|---|---|
| Control factor | Data 1 | Data 2 | Data 3 | Average | S/N |
| B3, C3, E2, F3 | 3.33 | 3.39 | 3.37 | 3.36 | 10.53 |
| Exp. No. | Experiment | Elongation at Break | ||||
|---|---|---|---|---|---|---|
| Data 1 (%) | Data 2 (%) | Data 3 (%) | Mean (%) | Standard Deviation | S/N Ratio (dB) | |
| 1 | 26.3 | 26.4 | 25.2 | 26.0 | 0.632 | 28.28 |
| 2 | 24.6 | 24.9 | 24.3 | 24.6 | 0.302 | 27.82 |
| 3 | 22.3 | 24.1 | 22.3 | 22.9 | 1.039 | 27.17 |
| 4 | 21.3 | 21.9 | 21.7 | 21.6 | 0.301 | 26.70 |
| 5 | 27.5 | 28.0 | 29.3 | 28.3 | 0.912 | 29.02 |
| 6 | 26.9 | 27.4 | 26.6 | 27.0 | 0.366 | 28.61 |
| 7 | 23.6 | 23.8 | 25.2 | 24.2 | 0.634 | 27.66 |
| 8 | 24.0 | 24.9 | 23.7 | 24.2 | 0.634 | 27.67 |
| 9 | 26.7 | 26.4 | 26.1 | 26.4 | 0.302 | 28.42 |
| 10 | 25.7 | 25.9 | 24.2 | 25.3 | 0.908 | 28.04 |
| 11 | 24.5 | 23.5 | 25.0 | 24.3 | 0.733 | 27.71 |
| 12 | 33.7 | 32.2 | 30.3 | 32.0 | 1.732 | 30.09 |
| 13 | 25.2 | 23.6 | 24.7 | 24.5 | 0.798 | 27.78 |
| 14 | 26.9 | 25.3 | 26.3 | 26.2 | 0.786 | 28.34 |
| 15 | 26.2 | 27.1 | 25.4 | 26.2 | 0.842 | 28.37 |
| 16 | 38.4 | 32.9 | 30.5 | 34.0 | 4.050 | 30.49 |
| 17 | 26.4 | 27.2 | 26.5 | 26.7 | 0.454 | 28.53 |
| 18 | 26.5 | 27.4 | 25.3 | 26.4 | 1.046 | 28.41 |
| A | B | C | D | E | F | |
|---|---|---|---|---|---|---|
| Level 1 | 28.181 | 28.157 | 27.999 | 28.166 | 28.490 | 29.105 |
| Level 2 | 28.138 | 28.183 | 28.464 | 28.525 | 27.957 | 28.174 |
| Level 3 | 28.534 | 28.513 | 28.390 | 28.162 | 28.406 | 28.174 |
| Effect | 0.395 | 0.356 | 0.465 | 0.362 | 0.532 | 1.529 |
| Ranking | 4 | 6 | 3 | 5 | 2 | 1 |
| Factor | DOF | SS | MS | F Ratio | SS’ | Contribution |
|---|---|---|---|---|---|---|
| A | 2 | 0.5671 | 0.2835 | 0.9601 | - | - |
| B | 2 | 0.4739 | 0.2369 | 0.8023 | - | - |
| C | 2 | 0.7507 | 0.3753 | 1.2709 | 0.1600 | 1.3445 |
| D | 2 | 0.5201 | 0.2601 | 0.8806 | - | - |
| E | 2 | 0.9826 | 0.4913 | 1.6635 | 0.3919 | 3.2924 |
| F | 2 | 7.1329 | 3.5664 | 12.0759 | 6.5422 | 54.9578 |
| Error | 5 | 1.45 | 0.2902 | - | - | - |
| Combined error | 11 | 3.73 | 0.3386 | - | 5.0165 | 40.4053 |
| Total | 17 | 11.90 | - | - | 11.90 | 100 |
| Confirmation Experiment | Unit: % | ||||
|---|---|---|---|---|---|
| Control factor | Data 1 | Data 2 | Data 3 | Average | S/N |
| C2, E1, F1 | 26.7 | 27.2 | 26.2 | 26.7 | 28.52 |
| Exp. No. | Experiment | Far-Infrared Emissivity | ||||
|---|---|---|---|---|---|---|
| Data 1 (%) | Data 2 (%) | Data 3 (%) | Mean (%) | Standard Deviation | S/N Ratio (dB) | |
| 1 | 81.7 | 80.3 | 80.2 | 80.7 | 0.840 | 38.14 |
| 2 | 80.3 | 80.3 | 79.9 | 80.1 | 0.229 | 38.07 |
| 3 | 81.3 | 81.4 | 80.4 | 81.0 | 0.548 | 38.17 |
| 4 | 80.2 | 81.6 | 81.7 | 81.2 | 0.814 | 38.18 |
| 5 | 79.6 | 80.8 | 83.2 | 81.2 | 1.789 | 38.19 |
| 6 | 80.5 | 80.3 | 81.2 | 80.7 | 0.439 | 38.13 |
| 7 | 82.3 | 82.3 | 83.2 | 82.6 | 0.502 | 38.34 |
| 8 | 81.9 | 80.6 | 84.4 | 82.3 | 1.904 | 38.30 |
| 9 | 82.6 | 81.4 | 83.5 | 82.5 | 1.017 | 38.32 |
| 10 | 79.9 | 79.4 | 80.2 | 79.9 | 0.436 | 38.04 |
| 11 | 78.0 | 78.9 | 81.4 | 79.4 | 1.779 | 38.00 |
| 12 | 82.0 | 81.7 | 86.0 | 83.2 | 2.391 | 38.39 |
| 13 | 82.8 | 81.9 | 80.8 | 81.8 | 0.990 | 38.25 |
| 14 | 82.6 | 82.3 | 85.7 | 83.5 | 1.898 | 38.43 |
| 15 | 81.7 | 82.9 | 83.5 | 82.7 | 0.880 | 38.34 |
| 16 | 82.8 | 82.7 | 83.1 | 82.9 | 0.219 | 38.36 |
| 17 | 83.7 | 82.6 | 86.0 | 84.1 | 1.735 | 38.49 |
| 18 | 83.1 | 82.1 | 83.5 | 82.9 | 0.703 | 38.37 |
| A | B | C | D | E | F | |
|---|---|---|---|---|---|---|
| Level 1 | 38.138 | 38.223 | 38.248 | 38.235 | 38.286 | 38.308 |
| Level 2 | 38.257 | 38.247 | 38.272 | 38.279 | 38.239 | 38.239 |
| Level 3 | 38.366 | 38.291 | 38.242 | 38.247 | 38.236 | 38.214 |
| Effect | 0.228 | 0.068 | 0.030 | 0.044 | 0.050 | 0.093 |
| Ranking | 1 | 3 | 6 | 5 | 4 | 2 |
| Factor | DOF | SS | MS | F Ratio | SS’ | Contribution |
|---|---|---|---|---|---|---|
| A | 2 | 0.1564 | 0.0782 | 14.9994 | 0.1460 | 59.7779 |
| B | 2 | 0.0145 | 0.0072 | 1.3934 | 0.0041 | 1.6801 |
| C | 2 | 0.0030 | 0.0015 | 0.2924 | - | - |
| D | 2 | 0.0062 | 0.0031 | 0.6005 | - | - |
| E | 2 | 0.0096 | 0.0048 | 0.9292 | - | - |
| F | 2 | 0.0282 | 0.0141 | 2.7039 | 0.0177 | 7.2758 |
| Error | 5 | 0.026 | 0.0052 | - | - | - |
| Combined error | 11 | 0.0451 | 0.0041 | - | 0.0764 | 31.2662 |
| Total | 17 | 0.24 | - | - | 0.24 | 100 |
| Confirmation Experiment | Unit: % | ||||
|---|---|---|---|---|---|
| Control factor | Data 1 | Data 2 | Data 3 | Average | S/N |
| A3, B3, F1 | 82.6 | 83.5 | 85.3 | 83.8 | 38.46 |
| Exp. No. | Experiment Data | Far-Infrared Temperature Rise | ||||
|---|---|---|---|---|---|---|
| F 1 (°C) | F 2 (°C) | F 3 (°C) | Mean (°C) | Standard Deviation | S/N Ratio (dB) | |
| 1 | 20.2 | 20.8 | 20.3 | 20.4 | 0.321 | 26.20 |
| 2 | 20.4 | 20.6 | 20.1 | 20.4 | 0.251 | 26.17 |
| 3 | 21.1 | 20.8 | 20.7 | 20.9 | 0.208 | 26.38 |
| 4 | 20.7 | 20.5 | 20.1 | 20.4 | 0.305 | 26.20 |
| 5 | 20.5 | 21.2 | 20.9 | 20.9 | 0.351 | 26.38 |
| 6 | 20.5 | 20.4 | 20.8 | 20.6 | 0.208 | 26.26 |
| 7 | 22.1 | 22.0 | 22.4 | 22.2 | 0.208 | 26.91 |
| 8 | 21.4 | 21.8 | 22.3 | 21.8 | 0.450 | 26.77 |
| 9 | 22.1 | 21.9 | 22.4 | 22.1 | 0.251 | 26.89 |
| 10 | 21.3 | 21.5 | 21.6 | 21.5 | 0.152 | 26.63 |
| 11 | 21.6 | 21.0 | 20.7 | 21.1 | 0.458 | 26.48 |
| 12 | 20.4 | 20.9 | 20.8 | 20.7 | 0.264 | 26.32 |
| 13 | 21.5 | 22.1 | 21.7 | 21.8 | 0.305 | 26.75 |
| 14 | 22.7 | 21.7 | 22.0 | 22.1 | 0.513 | 26.89 |
| 15 | 21.7 | 21.9 | 21.5 | 21.7 | 0.200 | 26.72 |
| 16 | 22.1 | 21.8 | 21.9 | 21.9 | 0.152 | 26.82 |
| 17 | 22.1 | 21.8 | 22.4 | 22.1 | 0.300 | 26.88 |
| 18 | 21.8 | 22.0 | 22.3 | 22.0 | 0.251 | 26.86 |
| A | B | C | D | E | F | |
|---|---|---|---|---|---|---|
| Level 1 | 26.367 | 26.588 | 26.567 | 26.603 | 26.534 | 26.587 |
| Level 2 | 26.538 | 26.601 | 26.568 | 26.504 | 26.612 | 26.600 |
| Level 3 | 26.860 | 26.576 | 26.630 | 26.658 | 26.619 | 26.578 |
| Effect | 0.492 | 0.024 | 0.062 | 0.153 | 0.085 | 0.022 |
| Ranking | 1 | 5 | 4 | 2 | 3 | 6 |
| Factor | DOF | SS | MS | F Ratio | SS’ | Contribution |
|---|---|---|---|---|---|---|
| A | 2 | 0.7505 | 0.3752 | 4.0268 | 0.5641 | 42.2537 |
| B | 2 | 0.0018 | 0.0099 | 0.0099 | - | - |
| C | 2 | 0.0155 | 0.0078 | 0.0836 | - | - |
| D | 2 | 0.0725 | 0.0362 | 0.3893 | - | - |
| E | 2 | 0.0271 | 0.0135 | 0.1455 | - | - |
| F | 2 | 0.0015 | 0.0007 | 0.0081 | - | - |
| Error | 5 | 0.466 | 0.0931 | - | - | - |
| Combined error | 15 | 0.585 | 0.0389 | - | 0.771 | 57.7463 |
| Total | 17 | 1.34 | - | - | 1.408 | 100 |
| Confirmation Experiment | Experiment | ||||
|---|---|---|---|---|---|
| Control factor | Data 1 | Data 2 | Data 3 | Average | S/N |
| A3 | 21.3 | 22.1 | 21.8 | 21.7 | 26.73 |
| Exp. No. | Exp. No. | Exp. | |||
|---|---|---|---|---|---|
| 1 | 0.4103 | 7 | 0.6079 | 13 | 0.5751 |
| 2 | 0.4902 | 8 | 0.5555 | 14 | 0.8358 |
| 3 | 0.6188 | 9 | 0.6769 | 15 | 0.6000 |
| 4 | 0.4188 | 10 | 0.5227 | 16 | 0.7484 |
| 5 | 0.4836 | 11 | 0.4732 | 17 | 0.7432 |
| 6 | 0.5035 | 12 | 0.5900 | 18 | 0.6724 |
| A | B | C | D | E | F | |
|---|---|---|---|---|---|---|
| Level 1 | 0.5175 | 0.5472 | 0.5537 | 0.5838 | 0.5629 | 0.6242 |
| Level 2 | 0.5695 | 0.5969 | 0.5669 | 0.5671 | 0.6028 | 0.5779 |
| Level 3 | 0.6674 | 0.6103 | 0.6308 | 0.6034 | 0.5886 | 0.5523 |
| Effect | 0.1499 | 0.0631 | 0.0770 | 0.0363 | 0.0399 | 0.0719 |
| Ranking | 1 | 4 | 2 | 6 | 5 | 3 |
| Parameter | Nanographene Powder Content (wt%) | Mold Temperature (°C) | Gear Pump Speed (rpm) | Melt Temperature (°C) | Roller Speed (m/min) | Take Up Speed (m/min) | |
|---|---|---|---|---|---|---|---|
| Quality | |||||||
| Yarn count (d) | 1 | 278 | 17 | 282 | 2450 | 2400 | |
| Tensile strength (g/d) | 2 | 281 | 17 | 282 | 2450 | 2500 | |
| Elongation at break (%) | 2 | 281 | 15 | 280 | 2350 | 2300 | |
| Far-infrared emissivity (%) | 2 | 281 | 15 | 280 | 2350 | 2300 | |
| Far-infrared temperature rise (°C) | 2 | 278 | 17 | 282 | 2550 | 2400 | |
| Item | 75 d/72 f Yarn | 75 d/72 f Fabric | |||
|---|---|---|---|---|---|
| Diner (d) | Tensile Strength (g/d) | Percentage Elongation (%) | Far-Infrared Emissivity (%) | Far-Infrared Temperature Rise (°C) | |
| Conventional polyester | 76.2 | 3.6 | 23.5 | 78 | 4.0 |
| Optimized Modified Polyester | 76.5 | 3.3 | 26.7 | 83 | 22.0 |
| Test Sample | PET | PET +2.0 wt% Nanographene |
|---|---|---|
| Melting point (°C) | 253.35 | 252.08 |
| Crystallization temperature (°C) | 203.41 | 220.59 |
| Pyrolysis temperature (°C) | 390.05 | 395.39 |
| Weight loss 1% Pyrolysis temp. (°C) | 366.0 | 367.43 |
| surface resistance (Ω) | 1012 | 3 × 10⁸ |
Publisher’s Note: MDPI stays neutral with regard to jurisdictional claims in published maps and institutional affiliations. |
© 2022 by the authors. Licensee MDPI, Basel, Switzerland. This article is an open access article distributed under the terms and conditions of the Creative Commons Attribution (CC BY) license (https://creativecommons.org/licenses/by/4.0/).
Share and Cite
Chen, S.-H.; Ahmad, N.; Kuo, C.-F.J. Development of Multifunctional Nano-Graphene-Grafted Polyester to Enhance Thermal Insulation and Performance of Modified Polyesters. Polymers 2022, 14, 3821. https://doi.org/10.3390/polym14183821
Chen S-H, Ahmad N, Kuo C-FJ. Development of Multifunctional Nano-Graphene-Grafted Polyester to Enhance Thermal Insulation and Performance of Modified Polyesters. Polymers. 2022; 14(18):3821. https://doi.org/10.3390/polym14183821
Chicago/Turabian StyleChen, Shih-Hsiung, Naveed Ahmad, and Chung-Feng Jeffrey Kuo. 2022. "Development of Multifunctional Nano-Graphene-Grafted Polyester to Enhance Thermal Insulation and Performance of Modified Polyesters" Polymers 14, no. 18: 3821. https://doi.org/10.3390/polym14183821
APA StyleChen, S.-H., Ahmad, N., & Kuo, C.-F. J. (2022). Development of Multifunctional Nano-Graphene-Grafted Polyester to Enhance Thermal Insulation and Performance of Modified Polyesters. Polymers, 14(18), 3821. https://doi.org/10.3390/polym14183821


