
Optimal Design of Wood/Rice Husk-Waste-Filled PLA Biocomposites Using Integrated CRITIC–MABAC-Based Decision-Making Algorithm

 ,
,  ,
,  and
and 
Abstract
:1. Introduction
2. Materials and Methods
2.1. Materials and Biocomposite Fabrication
2.2. Measurements
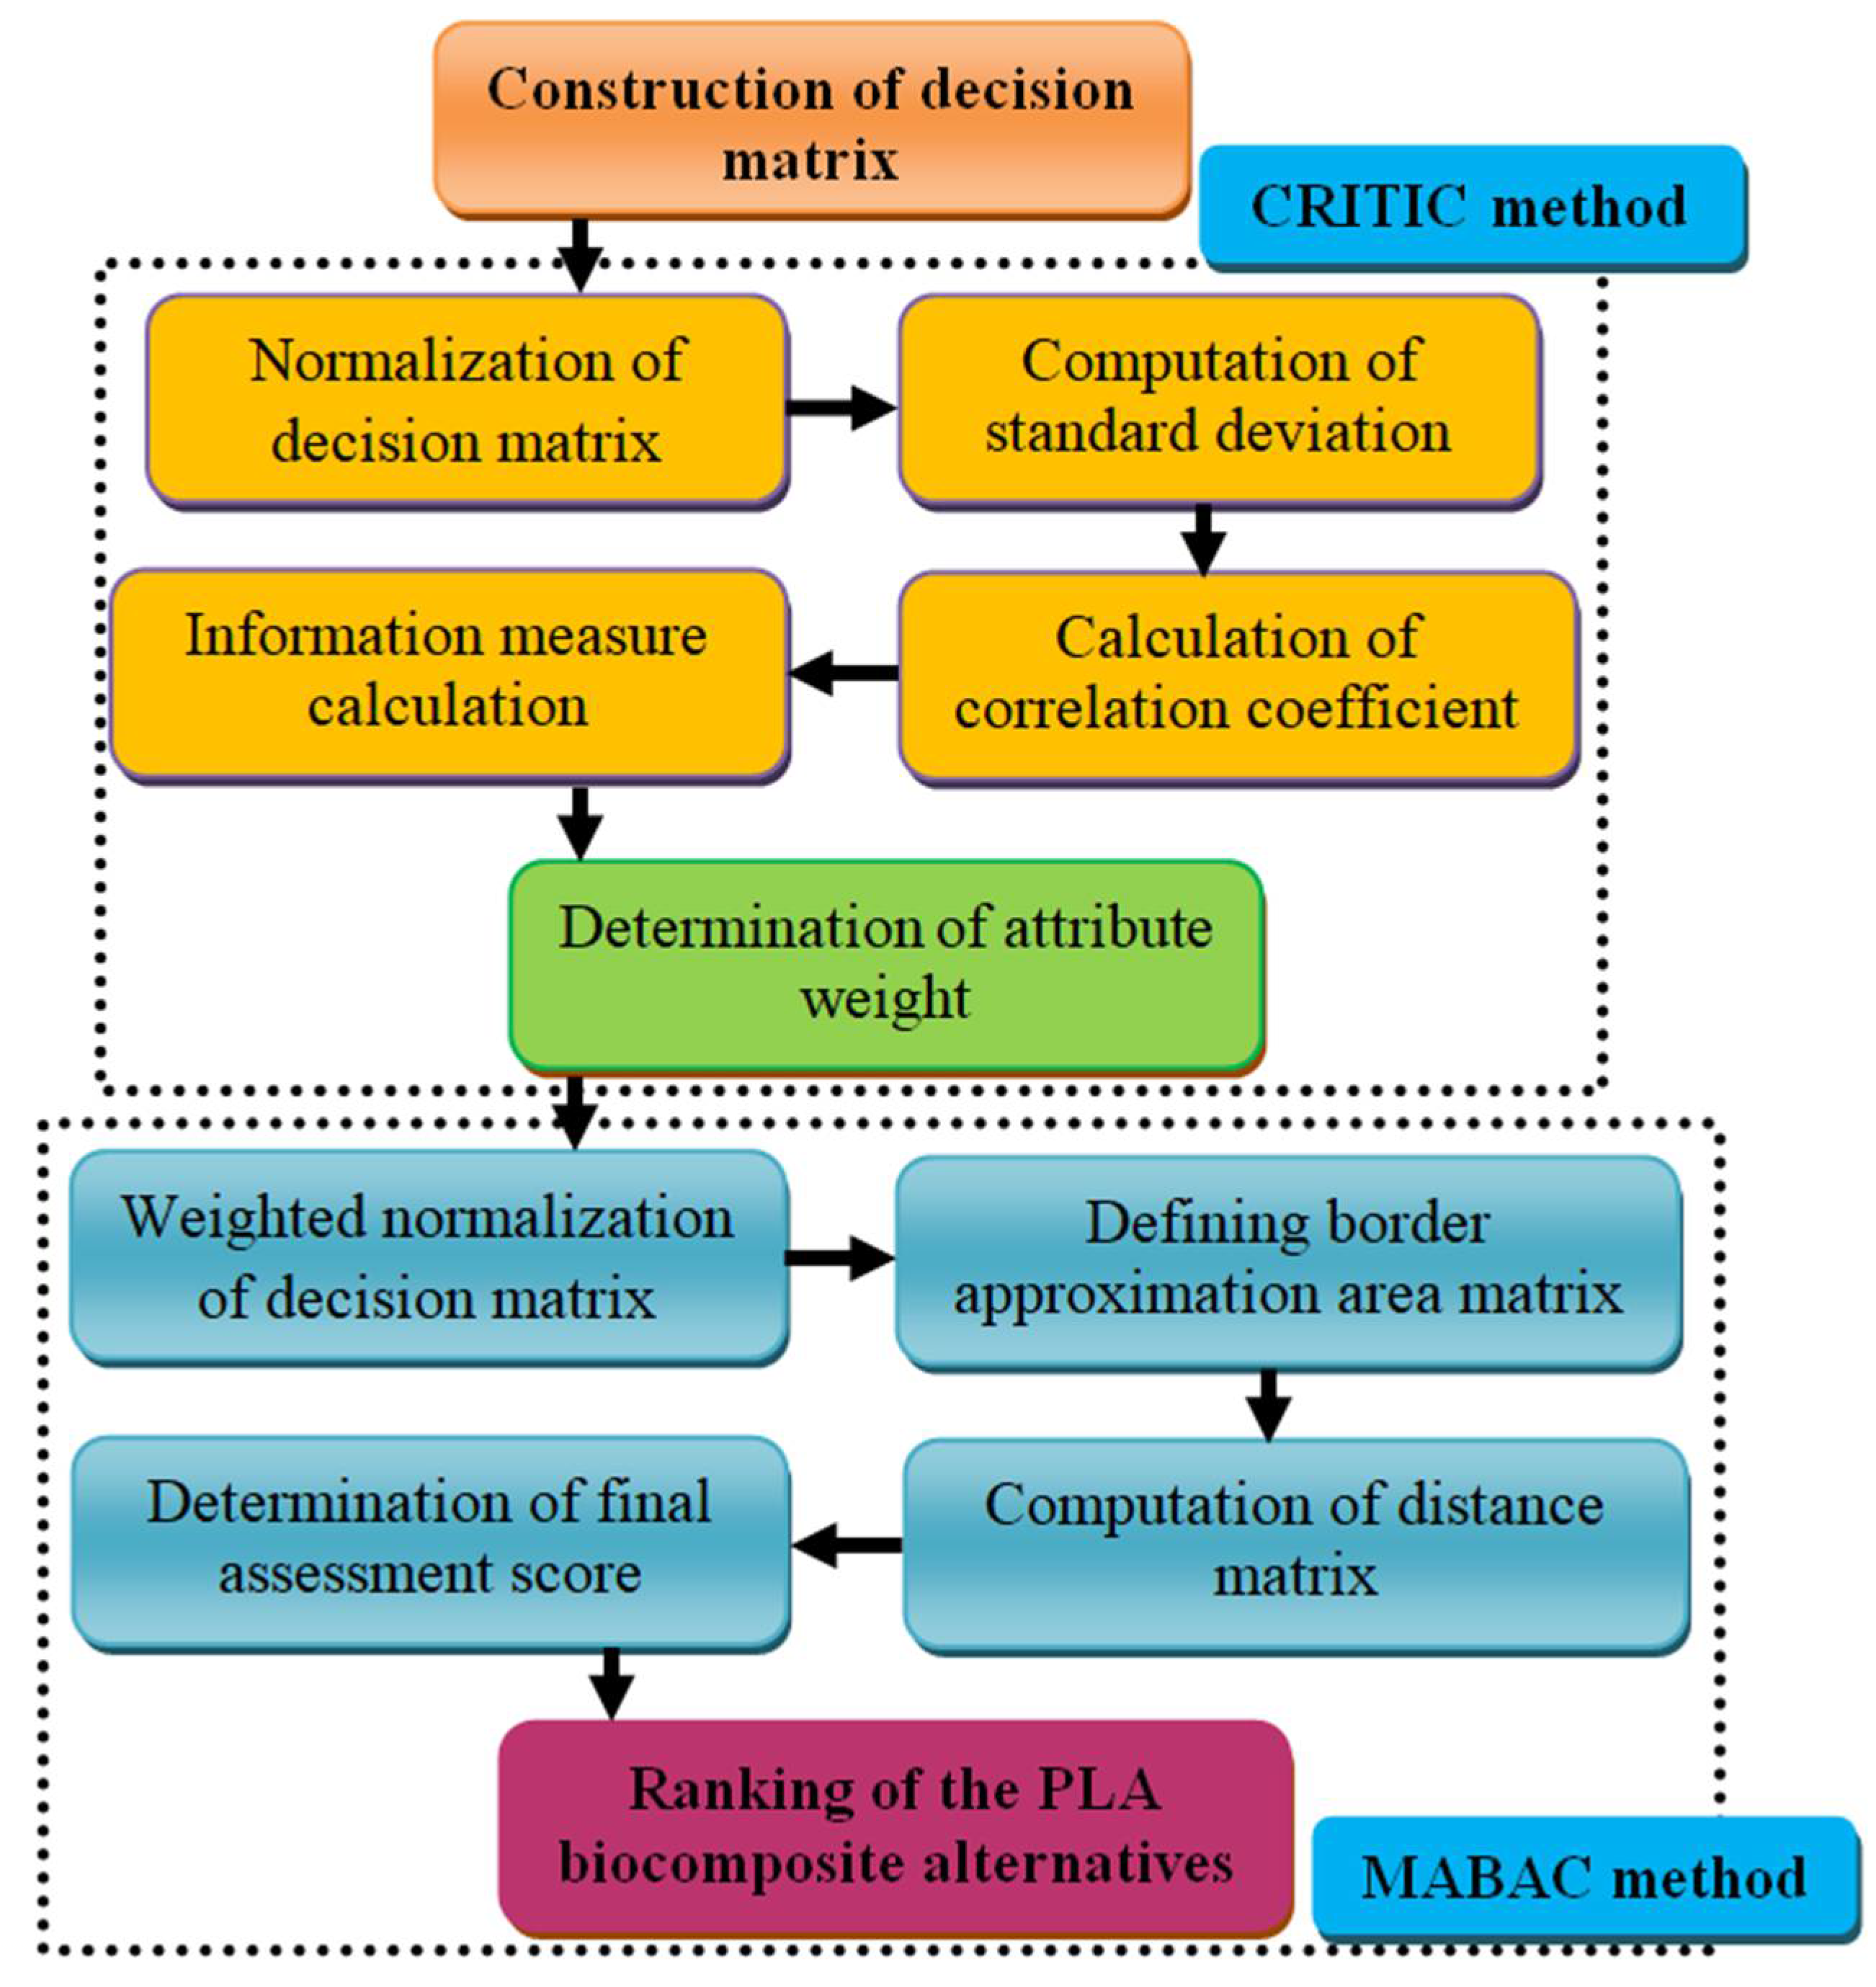
3. Overview of the Integrated CRITIC–MABAC Approach
4. Results and Discussion
4.1. Influence of Waste Loading on the Performance of Various Attributes
4.2. CRITIC Analysis for Weight Calculation
4.3. MABAC Analysis for Alternatives Ranking
5. Conclusions
Author Contributions
Funding
Institutional Review Board Statement
Informed Consent Statement
Data Availability Statement
Conflicts of Interest
References
- Czupich, M.; Łapińska, J.; Bartoš, V. Environmental Sustainability Assessment of the European Union’s Capital Cities. Int. J. Environ. Res. Public Health 2022, 19, 4327. [Google Scholar] [CrossRef] [PubMed]
- Das, O.; Sarmah, A.K.; Bhattacharyya, D. Biocomposites from waste derived biochars: Mechanical, thermal, chemical, and morphological properties. Waste Manag. 2016, 49, 560–570. [Google Scholar] [CrossRef] [PubMed]
- Kaza, S.; Yao, L.C.; Bhada-Tata, P.; Van Woerden, F. What a Waste 2.0: A Global Snapshot of Solid Waste Management to 2050; Urban Development Series; World Bank: Washington, DC, USA, 2018. [Google Scholar] [CrossRef]
- Spišáková, M.; Mandičák, T.; Mésároš, P.; Špak, M. Waste Management in a Sustainable Circular Economy as a Part of Design of Construction. Appl. Sci. 2022, 12, 4553. [Google Scholar] [CrossRef]
- Tucki, K.; Orynycz, O.; Wasiak, A.; Gola, A.; Mieszkalski, L. Potential Routes to the Sustainability of the Food Packaging Industry. Sustainability 2022, 14, 3924. [Google Scholar] [CrossRef]
- Ławińska, O.; Korombel, A.; Zajemska, M. Pyrolysis-Based Municipal Solid Waste Management in Poland-SWOT Analysis. Energies 2022, 15, 510. [Google Scholar] [CrossRef]
- Kheimi, M.; Aziz, I.H.; Abdullah, M.M.A.B.; Almadani, M.; Abd Razak, R. Waste Material via Geopolymerization for Heavy-Duty Application: A Review. Materials 2022, 15, 3205. [Google Scholar] [CrossRef] [PubMed]
- Vaish, S.; Kaur, G.; Sharma, N.K.; Gakkhar, N. Estimation for Potential of Agricultural Biomass Sources as Projections of Bio-Briquettes in Indian Context. Sustainability 2022, 14, 5077. [Google Scholar] [CrossRef]
- Jannat, N.; Latif Al-Mufti, R.; Hussien, A.; Abdullah, B.; Cotgrave, A. Influence of sawdust particle sizes on the physico-mechanical properties of unfired clay blocks. Designs 2021, 5, 57. [Google Scholar] [CrossRef]
- Hejna, A.; Barczewski, M.; Kosmela, P.; Mysiukiewicz, O.; Kuzmin, A. Coffee Silverskin as a Multifunctional Waste Filler for High-Density Polyethylene Green Composites. J. Compos. Sci. 2021, 5, 44. [Google Scholar] [CrossRef]
- Mosnáčková, K.; Opálková Šišková, A.; Kleinová, A.; Danko, M.; Mosnáček, J. Properties and Degradation of Novel Fully Biodegradable PLA/PHB Blends Filled with Keratin. Int. J. Mol. Sci. 2020, 21, 9678. [Google Scholar] [CrossRef] [PubMed]
- Tao, Y.; Wang, H.; Li, Z.; Li, P.; Shi, S.Q. Development and Application of Wood Flour-Filled Polylactic Acid Composite Filament for 3D Printing. Materials 2017, 10, 339. [Google Scholar] [CrossRef] [PubMed] [Green Version]
- Kechagias, J.D.; Zaoutsos, S.P.; Chaidas, D.; Vidakis, N. Multi-parameter optimization of PLA/Coconut wood compound for Fused Filament Fabrication using Robust Design. Int. J. Adv. Manuf. Technol. 2022, 119, 4317–4328. [Google Scholar] [CrossRef]
- Mahalle, L.; Alemdar, A.; Mihai, M.; Legros, N. A cradle-to-gate life cycle assessment of wood fibre-reinforced polylactic acid (PLA) and polylactic acid/thermoplastic starch (PLA/TPS) biocomposites. Int. J. Life Cycle Assess. 2014, 19, 1305–1315. [Google Scholar] [CrossRef]
- Xu, W.; Pranovich, A.; Uppstu, P.; Wang, X.; Kronlund, D.; Hemming, J.; Öblom, H.; Moritz, N.; Preis, M.; Sandler, N.; et al. Novel biorenewable composite of wood polysaccharide and polylactic acid for three dimensional printing. Carbohydr. Polym. 2018, 187, 51–58. [Google Scholar] [CrossRef] [PubMed]
- Das, O.; Babu, K.; Shanmugam, V.; Sykam, K.; Tebyetekerwa, M.; Neisiany, R.E.; Försth, M.; Sas, G.; Gonzalez-Libreros, J.; Capezza, A.J.; et al. Natural and industrial wastes for sustainable and renewable polymer composites. Renew. Sustain. Energy Rev. 2022, 158, 112054. [Google Scholar] [CrossRef]
- Platnieks, O.; Barkane, A.; Ijudina, N.; Gaidukova, G.; Thakur, V.K.; Gaidukovs, S. Sustainable tetra pak recycled cellulose/Poly(Butylene succinate) based woody-like composites for a circular economy. J. Clean. Prod. 2020, 270, 122321. [Google Scholar] [CrossRef]
- Dogossy, G.; Czigany, T. Thermoplastic starch composites reinforced by agricultural by-products: Properties, biodegradability, and application. J. Reinf. Plast. Compos. 2011, 30, 1819–1825. [Google Scholar] [CrossRef]
- Hejna, A.; Formela, K.; Sae, M.R. Processing, mechanical and thermal behavior assessments of polycaprolactone/agricultural wastes biocomposites. Ind. Crop. Prod. 2015, 76, 725–733. [Google Scholar] [CrossRef]
- Treinyte, J.; Bridziuviene, D.; Fataraite-Urboniene, E.; Rainosalo, E.; Rajan, R.; Cesoniene, L.; Grazuleviciene, V. Forestry wastes filled polymer composites for agricultural use. J. Clean. Prod. 2018, 205, 388–406. [Google Scholar] [CrossRef]
- Cunha, B.L.C.; Bahú, J.O.; Xavier, L.F.; Crivellin, S.; de Souza, S.D.A.; Lodi, L.; Jardini, A.L.; Filho, R.M.; Schiavon, M.I.R.B.; Concha, V.O.C.; et al. Lactide: Production Routes, Properties, and Applications. Bioengineering 2022, 9, 164. [Google Scholar] [CrossRef] [PubMed]
- McFarland, A.W., Jr.; Elumalai, A.; Miller, C.C.; Humayun, A.; Mills, D.K. Effectiveness and Applications of a Metal-Coated HNT/Polylactic Acid Antimicrobial Filtration System. Polymers 2022, 14, 1603. [Google Scholar] [CrossRef]
- Lendvai, L.; Brenn, D. Mechanical, morphological and thermal characterization of compatibilized poly(lactic acid)/thermoplastic starch blends. Acta Tech. Jaurinensis 2020, 13, 1–13. [Google Scholar] [CrossRef] [Green Version]
- Frone, A.N.; Ghiurea, M.; Nicolae, C.A.; Gabor, A.R.; Badila, S.; Panaitescu, D.M. Poly(lactic acid)/Poly(3-hydroxybutyrate) Biocomposites with Differently Treated Cellulose Fibers. Molecules 2022, 27, 2390. [Google Scholar] [CrossRef]
- Shanmugam, V.; Mensah, R.A.; Försth, M.; Sas, G.; Restás, Á.; Addy, C.; Xu, Q.; Jiang, L.; Neisiany, R.E.; Singha, S.; et al. Circular economy in biocomposite development: State-of-the-art, challenges and emerging trends. Compos. Part C Open Access 2021, 5, 100138. [Google Scholar] [CrossRef]
- De Baynast, H.; Tribot, A.; Niez, B.; Audonnet, F.; Badel, E.; Cesar, G.; Claude-Gilles, D.; Gastaldi, E.; Massacrier, L.; Michaud, P.; et al. Effects of Kraft lignin and corn cob agro-residue on the properties of injected-moulded biocomposites. Ind. Crop. Prod. 2022, 177, 114421. [Google Scholar] [CrossRef]
- Garcia-Brand, A.J.; Morales, M.A.; Hozman, A.S.; Ramirez, A.C.; Cruz, L.J.; Maranon, A.; Muñoz-Camargo, C.; Cruz, J.C.; Porras, A. Bioactive Poly(lactic acid)-Cocoa Bean Shell Composites for Biomaterial Formulation: Preparation and Preliminary In Vitro Characterization. Polymers 2021, 13, 3707. [Google Scholar] [CrossRef]
- Wu, C.S.; Tsou, C.H. Fabrication, characterization, and application of biocomposites from poly(lactic acid) with renewable rice husk as reinforcement. J. Polym. Res. 2019, 26, 44. [Google Scholar] [CrossRef]
- Nizamuddin, S.; Jadhav, A.; Qureshi, S.S.; Baloch, H.A.; Siddiqui, M.T.H.; Mubarak, N.M.; Griffin, G.; Madapusi, S.; Tanksale, A.; Ahamed, M.I. Synthesis and characterization of polylactide/rice husk hydrochar composite. Sci. Rep. 2019, 9, 5445. [Google Scholar] [CrossRef] [PubMed]
- Boubekeur, B.; Belhaneche-Bensemra, N.; Massardier, V. Low-density polyethylene/poly(lactic acid) blends reinforced by waste wood flour. J. Vinyl Addit. Technol. 2020, 26, 443–451. [Google Scholar] [CrossRef]
- Andrzejewski, J.; Szostak, M.; Barczewski, M.; Łuczak, P. Cork-wood hybrid filler system for polypropylene and poly(lactic acid) based injection molded composites. Structure evaluation and mechanical performance. Compos. Part B 2019, 163, 655–668. [Google Scholar] [CrossRef]
- Barczewski, M.; Matykiewicz, D.; Krygier, A.; Andrzejewski, J.; Skórczewska, K. Characterization of poly(lactic acid) biocomposites filled with chestnut shell waste. J. Mater. Cycles Waste Manag. 2018, 20, 914–924. [Google Scholar] [CrossRef]
- Shevtsov, S.; Zhilyaev, I.; Chang, S.-H.; Wu, J.-K.; Snezhina, N. Multi-Criteria Decision Approach to Design a Vacuum Infusion Process Layout Providing the Polymeric Composite Part Quality. Polymers 2022, 14, 313. [Google Scholar] [CrossRef] [PubMed]
- Bakhsh, A.A. Gamma-Ray Modified Polymer/Clay Composites: Synthesis, Characterization, and Formulation Optimization Using Multivariate Calculus and Graph Theory. Energies 2021, 14, 2724. [Google Scholar] [CrossRef]
- Paul, A.; Shukla, N.; Paul, S.K.; Trianni, A. Sustainable Supply Chain Management and Multi-Criteria Decision-Making Methods: A Systematic Review. Sustainability 2021, 13, 7104. [Google Scholar] [CrossRef]
- Erdogan, M.; Ayyildiz, E. Comparison of hospital service performances under COVID-19 pandemics for pilot regions with low vaccination rates. Expert Syst. Appl. 2022, 206, 117773. [Google Scholar] [CrossRef] [PubMed]
- Singh, T. A hybrid multiple-criteria decision-making approach for selecting optimal automotive brake friction composite. Mater. Des. Process. Commun. 2021, 3, e266. [Google Scholar] [CrossRef]
- Erdoğan, M. Assessing farmers’ perception to Agriculture 4.0 technologies: A new interval-valued spherical fuzzy sets based approach. Int. J. Intell. Syst. 2022, 37, 1751–1801. [Google Scholar] [CrossRef]
- Singh, T. Utilization of cement bypass dust in the development of sustainable automotive brake friction composite materials. Arab. J. Chem. 2021, 14, 103324. [Google Scholar] [CrossRef]
- Bączkiewicz, A.; Kizielewicz, B.; Shekhovtsov, A.; Wątróbski, J.; Sałabun, W. Methodical Aspects of MCDM Based E-Commerce Recommender System. J. Theor. Appl. Electron. Commer. Res. 2021, 16, 2192–2229. [Google Scholar] [CrossRef]
- Tan, J.; Liu, Y.; Senapati, T.; Garg, H.; Rong, Y. An extended MABAC method based on prospect theory with unknown weight information under Fermatean fuzzy environment for risk investment assessment in B&R. J. Ambient Intell. Hum. Comput. 2022, 13, 1–13. [Google Scholar] [CrossRef]
- Singh, T. Optimum design based on fabricated natural fiber reinforced automotive brake friction composites using hybrid CRITIC-MEW approach. J. Mater. Res. Technol. 2021, 14, 81–92. [Google Scholar] [CrossRef]
- Abas, M.; Alkahtani, M.; Khalid, Q.S.; Hussain, G.; Abidi, M.H.; Buhl, J. Parametric Study and Optimization of End-Milling Operation of AISI 1522H Steel Using Definitive Screening Design and Multi-Criteria Decision-Making Approach. Materials 2022, 15, 4086. [Google Scholar] [CrossRef] [PubMed]
- Wei, G.; Wei, C.; Wu, J.; Wang, H. Supplier Selection of Medical Consumption Products with a Probabilistic Linguistic MABAC Method. Int. J. Environ. Res. Public Health 2019, 16, 5082. [Google Scholar] [CrossRef] [PubMed] [Green Version]
- Berthet, M.-A.; Angellier-Coussy, H.; Chea, V.; Guillard, V.; Gastaldi, E.; Gontard, N. Sustainable food packaging: Valorising wheat straw fibres for tuning PHBV-based composites properties. Compos. Part A 2015, 72, 139–147. [Google Scholar] [CrossRef]
- Diakoulaki, D.; Mavrotas, G.; Papayannakis, L. Determining Objective Weights in Multiple Criteria Problems: The Critic Method. Comp. Oper. Res. 1995, 22, 763–770. [Google Scholar] [CrossRef]
- Wu, H.-W.; Zhen, J.; Zhang, J. Urban rail transit operation safety evaluation based on an improved CRITIC method and cloud model. J. Rail Transp. Plan. Manag. 2020, 16, 100206. [Google Scholar] [CrossRef]
- Krishnan, A.R.; Kasim, M.M.; Hamid, R.; Ghazali, M.F. A Modified CRITIC Method to Estimate the Objective Weights of Decision Criteria. Symmetry 2021, 13, 973. [Google Scholar] [CrossRef]
- Haktanır, E.; Kahraman, C. A novel picture fuzzy CRITIC & REGIME methodology: Wearable health technology application. Eng. Appl. Artif. Intell. 2022, 113, 104942. [Google Scholar] [CrossRef]
- Pamučar, D.; Ćirović, G. The selection of transport and handling resources in logistics centers using Multi-Attributive Border Approximation area Comparison (MABAC). Expert Syst. Appl. 2015, 42, 3016–3028. [Google Scholar] [CrossRef]
- Yu, S.-M.; Wang, J.; Wang, J.-Q. An interval type-2 fuzzy likelihood-based MABAC approach and its application in selecting hotels on a tourism website. Int. J. Fuzzy Syst. 2017, 19, 47–61. [Google Scholar] [CrossRef]
- Sun, R.; Hu, J.; Zhou, J.; Chen, X. A hesitant fuzzy linguistic projection-based MABAC method for patients’ prioritization. Int. J. Fuzzy Syst. 2018, 20, 2144–2160. [Google Scholar] [CrossRef]
- Xu, X.-G.; Shi, H.; Zhang, L.-J.; Liu, H.-C. Green Supplier Evaluation and Selection with an Extended MABAC Method Under the Heterogeneous Information Environment. Sustainability 2019, 11, 6616. [Google Scholar] [CrossRef] [Green Version]
- Wang, J.; Wei, G.; Wei, C.; Wei, Y. MABAC method for multiple attribute group decision making under q-rung orthopair fuzzy environment. Def. Technol. 2020, 16, 208–216. [Google Scholar] [CrossRef]
- Huang, G.; Xiao, L.; Pedrycz, W.; Pamucar, D.; Zhang, G.; Martínez, L. Design alternative assessment and selection: A novel Z-cloud rough number-based BWM-MABAC model. Inf. Sci. 2022, 603, 149–189. [Google Scholar] [CrossRef]
- Büyüközkan, G.; Mukul, E.; Kongar, E. Health tourism strategy selection via SWOT analysis and integrated hesitant fuzzy linguistic AHP-MABAC approach. Socio-Econ. Plan. Sci. 2021, 74, 100929. [Google Scholar] [CrossRef]
- Pamučar, D.; Puška, A.; Stević, Ž.; Ćirović, G. A new intelligent MCDM model for HCW management: The integrated BWM–MABAC model based on D numbers. Expert Syst. Appl. 2021, 175, 114862. [Google Scholar] [CrossRef]
- Simic, V.; Gokasar, I.; Deveci, M.; Karakurt, A. An integrated CRITIC and MABAC based type-2 neutrosophic model for public transportation pricing system selection. Socio-Econ. Plan. Sci. 2022, 80, 101157. [Google Scholar] [CrossRef]
- Quiles-Carrillo, L.; Montanes, N.; Garcia-Garcia, D.; Carbonell-Verdu, A.; Balart, R.; Torres-Giner, S. Effect of different compatibilizers on injection-molded green composite pieces based on polylactide filled with almond shell flour. Compos. Part B Eng. 2018, 147, 76–85. [Google Scholar] [CrossRef]
- Sánchez-Safont, E.L.; Aldureid, A.; Lagarón, J.M.; Gámez-Pérez, J.; Cabedo, L. Biocomposites of different lignocellulosic wastes for sustainable food packaging applications. Compos. Part B Eng. 2018, 145, 215–225. [Google Scholar] [CrossRef]
- Pudełko, A.; Postawa, P.; Stachowiak, T.; Malińska, K.; Dróżdż, D. Waste derived biochar as an alternative filler in biocomposites—Mechanical, thermal and morphological properties of biochar added biocomposites. J. Clean. Prod. 2021, 278, 123850. [Google Scholar] [CrossRef]
- Kim, H.-S.; Yang, H.-S.; Kim, H.-J. Biodegradability and mechanical properties of agro-flour-filled polybutylene succinate biocomposites. J. Appl. Polym. Sci. 2005, 97, 1513–1521. [Google Scholar] [CrossRef]
- Chen, R.S.; Ghani, M.H.A.; Salleh, M.N.; Ahmad, S.; Tarawneh, M.A. Mechanical, water absorption, and morphology of recycled polymer blend rice husk flour biocomposites. J. Appl. Polym. Sci. 2015, 132, 41494. [Google Scholar] [CrossRef]
- Das, O.; Kim, N.K.; Sarmah, A.K.; Bhattacharyya, D. Development of waste based biochar/wool hybrid biocomposites: Flammability characteristics and mechanical properties. J. Clean. Prod. 2017, 144, 79–89. [Google Scholar] [CrossRef]
- Singh, T.; Lendvai, L.; Dogossy, G.; Fekete, G. Physical, mechanical and thermal properties of Dalbergia sissoo wood waste filled poly(lactic acid) composites. Polym. Compos. 2021, 42, 4380–4389. [Google Scholar] [CrossRef]
- Singh, T.; Patnaik, A.; Ranakoti, L.; Dogossy, G.; Lendvai, L. Thermal and sliding wear properties of wood waste filled poly(lactic acid) biocomposites. Polymers 2022, 14, 2230. [Google Scholar] [CrossRef]
- Mysiukiewicz, O.; Sulej-Chojnacka, J.; Kotkowiak, M.; Wiśniewski, T.; Piasecki, A.; Barczewski, M. Evaluation of the Oil-Rich Waste Fillers’ Influence on the Tribological Properties of Polylactide-Based Composites. Materials 2022, 15, 1237. [Google Scholar] [CrossRef]
- Snowdon, M.R.; Wu, F.; Mohanty, A.K.; Misra, M. Comparative study of the extrinsic properties of poly(lactic acid)-based biocomposites filled with talc versus sustainable biocarbon. RSC Adv. 2019, 9, 6752–6761. [Google Scholar] [CrossRef] [PubMed] [Green Version]
- Bajpai, P.K.; Singh, I.; Madaan, J. Tribological behavior of natural fiber reinforced PLA composites. Wear 2013, 297, 829–840. [Google Scholar] [CrossRef]


| Ingredients | Composition (wt.%) of Biocomposite Alternatives | ||||||||
|---|---|---|---|---|---|---|---|---|---|
| p-1 | p-2 | p-3 | p-4 | p-5 | p-6 | p-7 | p-8 | p-9 | |
| PLA | 100 | 97.5 | 95 | 92.5 | 90 | 97.5 | 95 | 92.5 | 90 |
| Rice husk | 0 | 1.25 | 2.5 | 3.75 | 5 | 0 | 0 | 0 | 0 |
| Wood waste | 0 | 1.25 | 2.5 | 3.75 | 5 | 2.5 | 5 | 7.5 | 10 |
| Attribute | Test Condition | Performance Implication |
|---|---|---|
| q-1: Tensile strength (MPa) | EN ISO 527 | Higher-the-better |
| q-2: Compressive strength (MPa) | EN ISO 604 | Higher-the-better |
| q-3: Impact strength (kJ/m2) | EN ISO 179 | Higher-the-better |
| q-4: Flexural strength (MPa) | EN ISO 178 | Higher-the-better |
| q-5: Tensile modulus (GPa) | EN ISO 527 | Higher-the-better |
| q-6: Compressive modulus (GPa) | EN ISO 604 | Higher-the-better |
| q-7: Flexural modulus (GPa) | EN ISO 178 | Higher-the-better |
| q-8: Density (g/cm3) | Archimedes’ principle | Lower-the-better |
| q-9: Water absorption (%) | ASTM D570-98 | Lower-the-better |
| q-10: Wear (g) | Load = 50 N, sliding distance = 2.5 km, sliding velocity = 3 m/s | Lower-the-better |
| Attributes | |||||||||||
|---|---|---|---|---|---|---|---|---|---|---|---|
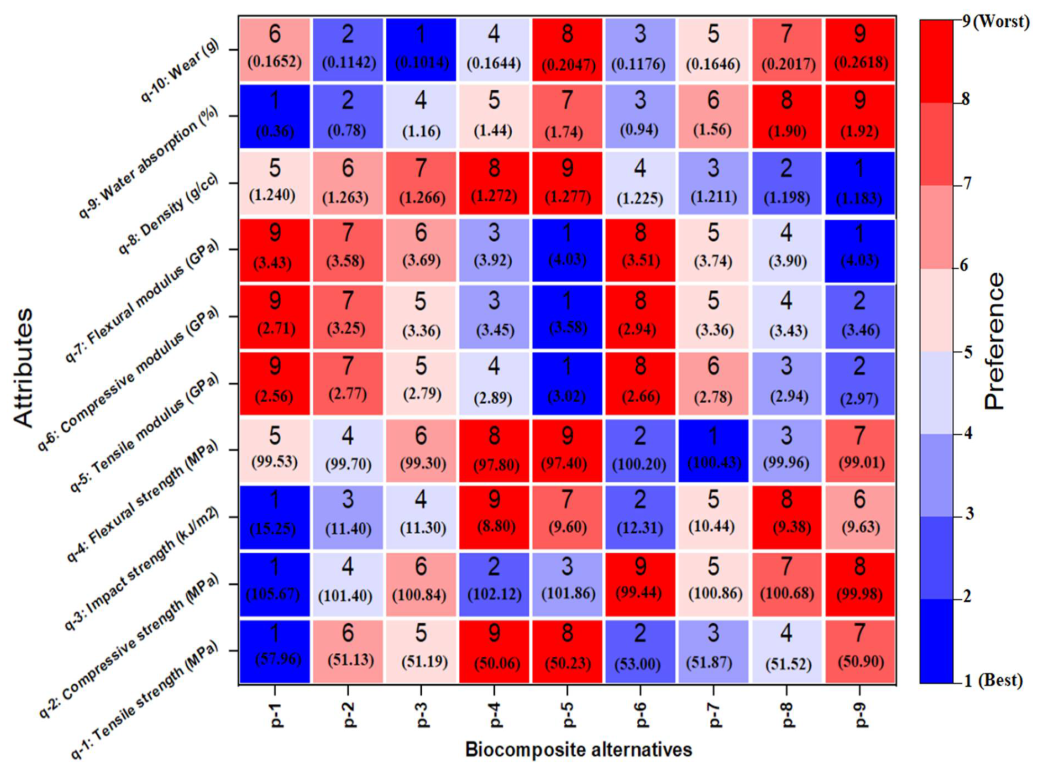
| q-1: Tensile Strength (MPa) | q-2: Compressive Strength (MPa) | q-3: Impact Strength (kJ/m2) | q-4: Flexural Strength (MPa) | q-5: Tensile Modulus (GPa) | q-6: Compressive Modulus (GPa) | q-7: Flexural Modulus (GPa) | q-8: Density (g/cm3) | q-9: Water Absorption (%) | q-10: Wear (g) | ||
| Biocomposite alternatives | p-1 | 57.96 ± 0.27 | 105.67 ± 1.06 | 15.25 ± 1.66 | 99.53 ± 0.21 | 2.56 ± 0.04 | 2.71 ± 0.11 | 3.43 ± 0.02 | 1.240 ± 0.032 | 0.36 ± 0.015 | 0.1652 ± 0.004 |
| p-2 | 51.13 ± 0.97 | 101.40 ± 1.95 | 11.42 ± 0.88 | 99.67 ± 0.61 | 2.77 ± 0.05 | 3.25 ± 0.17 | 3.58 ± 0.02 | 1.263 ± 0.008 | 0.78 ± 0.026 | 0.1142 ± 0.002 | |
| p-3 | 51.19 ± 1.44 | 100.84 ± 1.58 | 11.25 ± 1.32 | 99.33 ± 0.87 | 2.79 ± 0.04 | 3.36 ± 0.13 | 3.69 ± 0.07 | 1.266 ± 0.012 | 1.16 ± 0.012 | 0.1014 ± 0.002 | |
| p-4 | 50.06 ± 0.31 | 102.12 ± 3.27 | 8.75 ± 1.50 | 97.84 ± 0.52 | 2.89 ± 0.06 | 3.45 ± 0.13 | 3.92 ± 0.03 | 1.272 ± 0.010 | 1.44 ± 0.021 | 0.1644 ± 0.003 | |
| p-5 | 50.23 ± 0.51 | 101.86 ± 1.63 | 9.63 ± 1.05 | 97.36 ± 1.44 | 3.02 ± 0.05 | 3.58 ± 0.11 | 4.03 ± 0.03 | 1.277 ± 0.010 | 1.74 ± 0.032 | 0.2047 ± 0.003 | |
| p-6 | 53.01 ± 0.62 | 99.44 ± 2.42 | 12.31 ± 2.25 | 100.20 ± 0.67 | 2.66 ± 0.04 | 2.94 ± 0.06 | 3.51 ± 0.01 | 1.225 ± 0.030 | 0.94 ± 0.021 | 0.1176 ± 0.003 | |
| p-7 | 51.87 ± 0.54 | 100.86 ± 2.44 | 10.44 ± 0.52 | 100.43 ± 0.59 | 2.78 ± 0.04 | 3.36 ± 0.09 | 3.74 ± 0.03 | 1.211 ± 0.022 | 1.56 ± 0.035 | 0.1646 ± 0.005 | |
| p-8 | 51.52 ± 1.31 | 100.68 ± 1.72 | 9.38 ± 1.79 | 99.96 ± 1.08 | 2.94 ± 0.04 | 3.43 ± 0.08 | 3.90 ± 0.04 | 1.198 ± 0.020 | 1.90 ± 0.040 | 0.2017 ± 0.005 | |
| p-9 | 50.90 ± 0.41 | 99.98 ± 2.07 | 9.63 ± 1.80 | 99.01 ± 0.66 | 2.97 ± 0.04 | 3.46 ± 0.27 | 4.03 ± 0.02 | 1.183 ± 0.028 | 1.92 ± 0.035 | 0.2618 ± 0.006 | |
| Attributes | |||||||||||
|---|---|---|---|---|---|---|---|---|---|---|---|
| q-1: Tensile Strength | q-2: Compressive Strength | q-3: Impact Strength | q-4: Flexural Strength | q-5: Tensile Modulus | q-6: Compressive Modulus | q-7: Flexural Modulus | q-8: Density | q-9: Water Absorption | q-10: Wear | ||
| Biocomposite alternatives | p-1 | 1.0000 | 1.0000 | 1.0000 | 0.7030 | 0.0000 | 0.0000 | 0.0000 | 0.3936 | 1.0000 | 0.6022 |
| p-2 | 0.1354 | 0.3146 | 0.4031 | 0.7591 | 0.4565 | 0.6207 | 0.2500 | 0.1489 | 0.7308 | 0.9202 | |
| p-3 | 0.1430 | 0.2247 | 0.3876 | 0.6271 | 0.5000 | 0.7471 | 0.4333 | 0.1170 | 0.4872 | 1.0000 | |
| p-4 | 0.0000 | 0.4302 | 0.0000 | 0.1320 | 0.7174 | 0.8506 | 0.8167 | 0.0532 | 0.3077 | 0.6072 | |
| p-5 | 0.0215 | 0.3884 | 0.1240 | 0.0000 | 1.0000 | 1.0000 | 1.0000 | 0.0000 | 0.1154 | 0.3560 | |
| p-6 | 0.3722 | 0.0000 | 0.5442 | 0.9241 | 0.2174 | 0.2644 | 0.1333 | 0.5532 | 0.6282 | 0.8990 | |
| p-7 | 0.2291 | 0.2279 | 0.2543 | 1.0000 | 0.4783 | 0.7471 | 0.5167 | 0.7021 | 0.2308 | 0.6060 | |
| p-8 | 0.1848 | 0.1990 | 0.0899 | 0.8449 | 0.8261 | 0.8276 | 0.7833 | 0.8404 | 0.0128 | 0.3747 | |
| p-9 | 0.1063 | 0.0867 | 0.1287 | 0.5314 | 0.8913 | 0.8621 | 1.0000 | 1.0000 | 0.0000 | 0.0000 | |
| q-1: Tensile Strength | q-2: Compressive Strength | q-3: Impact Strength | q-4: Flexural Strength | q-5: Tensile Modulus | q-6: Compressive Modulus | q-7: Flexural Modulus | q-8: Density | q-9: Water Absorption | q-10: Wear | |
|---|---|---|---|---|---|---|---|---|---|---|
| 2.5713 | 2.5996 | 2.6361 | 3.0507 | 3.6803 | 3.643 | 4.1872 | 3.5011 | 3.0887 | 3.1114 | |
| 0.0802 | 0.0810 | 0.0822 | 0.0951 | 0.1148 | 0.1136 | 0.1306 | 0.1092 | 0.0963 | 0.0970 |
| Attributes | |||||||||||
|---|---|---|---|---|---|---|---|---|---|---|---|
| q-1: Tensile Strength | q-2: Compressive Strength | q-3: Impact Strength | q-4: Flexural Strength | q-5: Tensile Modulus | q-6: Compressive Modulus | q-7: Flexural Modulus | q-8: Density | q-9: Water Absorption | q-10: Wear | ||
| Biocomposite alternatives | p-1 | 0.1604 | 0.1620 | 0.1644 | 0.1620 | 0.1148 | 0.1136 | 0.1306 | 0.1522 | 0.1926 | 0.1554 |
| p-2 | 0.0911 | 0.1065 | 0.1153 | 0.1673 | 0.1672 | 0.1841 | 0.1633 | 0.1255 | 0.1667 | 0.1863 | |
| p-3 | 0.0917 | 0.0992 | 0.1141 | 0.1547 | 0.1722 | 0.1985 | 0.1872 | 0.1220 | 0.1432 | 0.1940 | |
| p-4 | 0.0802 | 0.1158 | 0.0822 | 0.1077 | 0.1972 | 0.2102 | 0.2373 | 0.1150 | 0.1259 | 0.1559 | |
| p-5 | 0.0819 | 0.1125 | 0.0924 | 0.0951 | 0.2296 | 0.2272 | 0.2612 | 0.1092 | 0.1074 | 0.1315 | |
| p-6 | 0.1100 | 0.0810 | 0.1269 | 0.1830 | 0.1398 | 0.1436 | 0.1480 | 0.1696 | 0.1568 | 0.1842 | |
| p-7 | 0.0986 | 0.0995 | 0.1031 | 0.1902 | 0.1697 | 0.1985 | 0.1981 | 0.1859 | 0.1185 | 0.1558 | |
| p-8 | 0.0950 | 0.0971 | 0.0896 | 0.1754 | 0.2096 | 0.2076 | 0.2329 | 0.2010 | 0.0975 | 0.1333 | |
| p-9 | 0.0887 | 0.0880 | 0.0928 | 0.1456 | 0.2171 | 0.2115 | 0.2612 | 0.2184 | 0.0963 | 0.0970 | |
| Attributes | |||||||||
|---|---|---|---|---|---|---|---|---|---|
| q-1: Tensile Strength | q-2: Compressive Strength | q-3: Impact Strength | q-4: Flexural Strength | q-5: Tensile Modulus | q-6: Compressive Modulus | q-7: Flexural Modulus | q-8: Density | q-9: Water Absorption | q-10: Wear |
| 0.0976 | 0.1049 | 0.1067 | 0.1499 | 0.1759 | 0.1845 | 0.1967 | 0.1509 | 0.1303 | 0.1518 |
| Attributes | |||||||||||
|---|---|---|---|---|---|---|---|---|---|---|---|
| q-1: Tensile Strength | q-2: Compressive Strength | q-3: Impact Strength | q-4: Flexural Strength | q-5: Tensile Modulus | q-6: Compressive Modulus | q-7: Flexural Modulus | q-8: Density | q-9: Water Absorption | q-10: Wear | ||
| Biocomposite alternatives | p-1 | 0.0628 | 0.0571 | 0.0577 | 0.0121 | −0.0611 | −0.0709 | −0.0661 | 0.0013 | 0.0623 | 0.0036 |
| p-2 | −0.0065 | 0.0016 | 0.0086 | 0.0174 | −0.0087 | −0.0004 | −0.0334 | −0.0254 | 0.0364 | 0.0345 | |
| p-3 | −0.0059 | −0.0057 | 0.0074 | 0.0048 | −0.0037 | 0.0140 | −0.0095 | −0.0289 | 0.0129 | 0.0422 | |
| p-4 | −0.0174 | 0.0109 | −0.0245 | −0.0422 | 0.0213 | 0.0257 | 0.0406 | −0.0359 | −0.0044 | 0.0041 | |
| p-5 | −0.0157 | 0.0076 | −0.0143 | −0.0548 | 0.0537 | 0.0427 | 0.0645 | −0.0417 | −0.0229 | −0.0203 | |
| p-6 | 0.0124 | −0.0239 | 0.0202 | 0.0331 | −0.0361 | −0.0409 | −0.0487 | 0.0187 | 0.0265 | 0.0324 | |
| p-7 | 0.0010 | −0.0054 | −0.0036 | 0.0403 | −0.0062 | 0.0140 | 0.0014 | 0.0350 | −0.0118 | 0.0040 | |
| p-8 | −0.0026 | −0.0078 | −0.0171 | 0.0255 | 0.0337 | 0.0231 | 0.0362 | 0.0501 | −0.0328 | −0.0185 | |
| p-9 | −0.0089 | −0.0169 | −0.0139 | −0.0043 | 0.0412 | 0.0270 | 0.0645 | 0.0675 | −0.0340 | −0.0548 | |
Publisher’s Note: MDPI stays neutral with regard to jurisdictional claims in published maps and institutional affiliations. |
© 2022 by the authors. Licensee MDPI, Basel, Switzerland. This article is an open access article distributed under the terms and conditions of the Creative Commons Attribution (CC BY) license (https://creativecommons.org/licenses/by/4.0/).
Share and Cite
Singh, T.; Pattnaik, P.; Aherwar, A.; Ranakoti, L.; Dogossy, G.; Lendvai, L. Optimal Design of Wood/Rice Husk-Waste-Filled PLA Biocomposites Using Integrated CRITIC–MABAC-Based Decision-Making Algorithm. Polymers 2022, 14, 2603. https://doi.org/10.3390/polym14132603
Singh T, Pattnaik P, Aherwar A, Ranakoti L, Dogossy G, Lendvai L. Optimal Design of Wood/Rice Husk-Waste-Filled PLA Biocomposites Using Integrated CRITIC–MABAC-Based Decision-Making Algorithm. Polymers. 2022; 14(13):2603. https://doi.org/10.3390/polym14132603
Chicago/Turabian StyleSingh, Tej, Punyasloka Pattnaik, Amit Aherwar, Lalit Ranakoti, Gábor Dogossy, and László Lendvai. 2022. "Optimal Design of Wood/Rice Husk-Waste-Filled PLA Biocomposites Using Integrated CRITIC–MABAC-Based Decision-Making Algorithm" Polymers 14, no. 13: 2603. https://doi.org/10.3390/polym14132603