Separation and Semi-Empiric Modeling of Ethanol–Water Solutions by Pervaporation Using PDMS Membrane

 ,
, 
Abstract
:
1. Introduction

2. Materials and Methods
2.1. Reagent
2.2. Ethanol Quantification
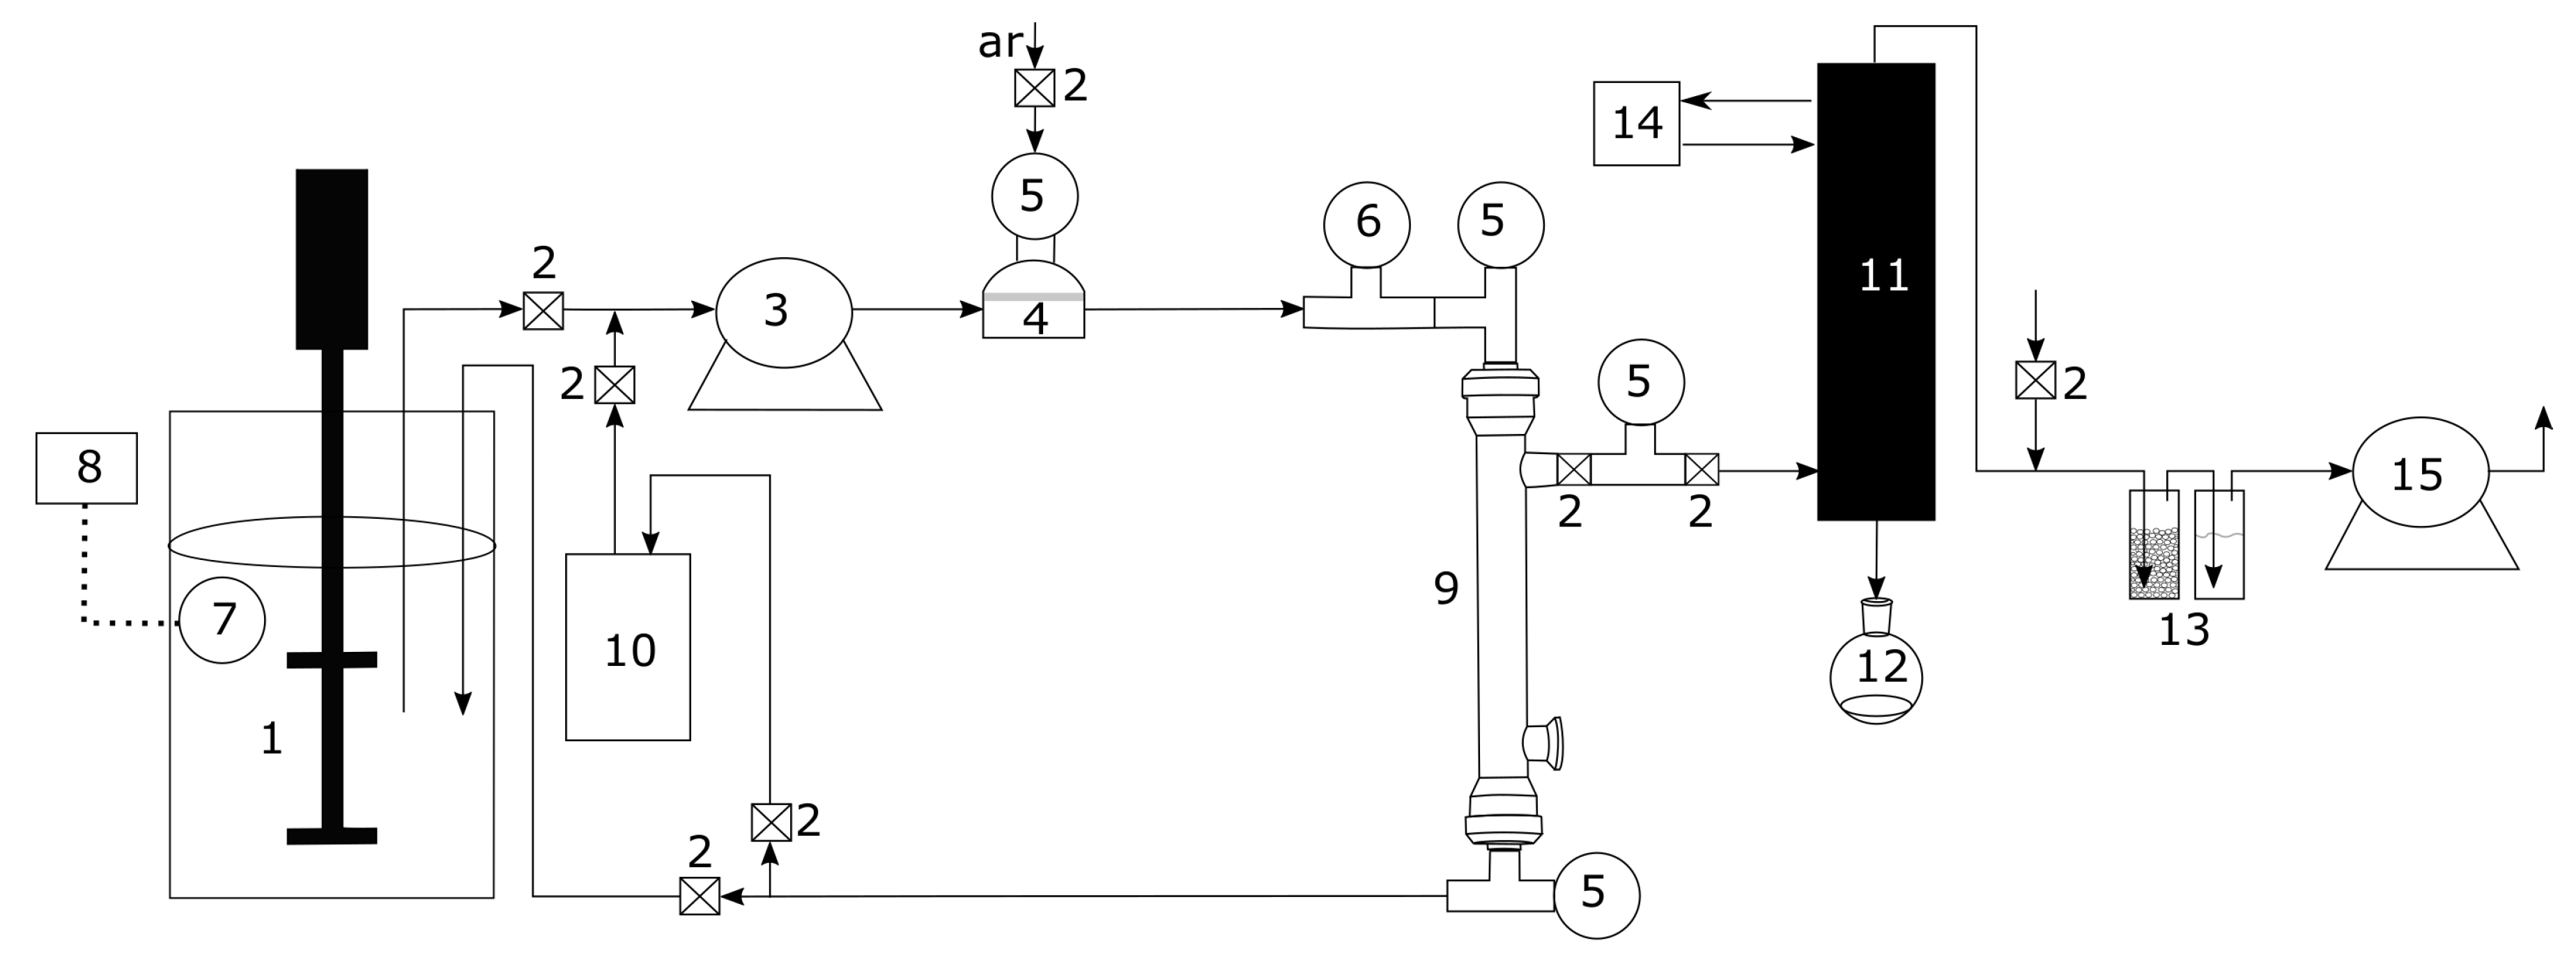
2.3. Equipment
2.4. Experimental Test
2.5. Semi-Empirical Model for Flux Determination
3. Results
3.1. Pervaporation Performance
| Feed | Pervaporation | Membrane | Ref. | |||||
|---|---|---|---|---|---|---|---|---|
| wt% | T (C) | (Barrer) | (Barrer) | P (Pa) | Composition | ℓ (m) | ||
| 5 | 25 | — | — | 0.7 | — | Pervap 4060 | — | [58] |
| 5 | 25 | — | — | 0.6 | — | Pervatech | — | [58] |
| 5 | 25 | — | — | 0.6 | — | PolyAn | — | [58] |
| 10–25 | 40–60 | 7210–8345 | 9043–11,292 | 0.6–0.9 | 500 | PDMS | 30 | [59] |
| 10–25 | 40–60 | 32,294–43,743 | 20,883–64,829 | 0.7–1.9 | 500 | POSS-g-PDMS | 30 | [59] |
| 2 | 60 | 10,368 | 17,034 | 0.6 | — | PDMS | — | [62] |
| 2 | 60 | 17,914 | 23,315 | 0.8 | — | ZIF-71/PDMS | — | [62] |
| 6 | 37–69 | 12,555–16,920 | 17,159–20,564 | 0.7–0.9 | 300 | PDMS | 9 | [63] |
| 2–10 | 37–69 | 22,899–34,756 | 29,212–39,639 | 0.6–1.0 | 300 | PDVB-coated PDMS | 15 | [63] |
| 10–50 | 40–60 | 17,096–30,601 | 12,734–17,758 | 1.2–1.7 | 200 | OPS/PDMS | 30 | [64] |
| 3–16 | 20–40 | — | — | 0.9–1.0 | 50 | PDMS | — | [65] |
| 1–10 | 40–70 | 5594–16,024 | 4559–9202 | 1.0–1.8 | 300 | PDMS/ZIF-8 | 1.16 | [66] |
| 5 | 50 | 49,873 | 25,564 | 2.0 | 532 | PDMS vinyl | 83 | [67] |
| 19 | 34–50 | 4145–9252 | 12,368–17,259 | 0.3–0.5 | 1200 | PDMS | 4 | This work |
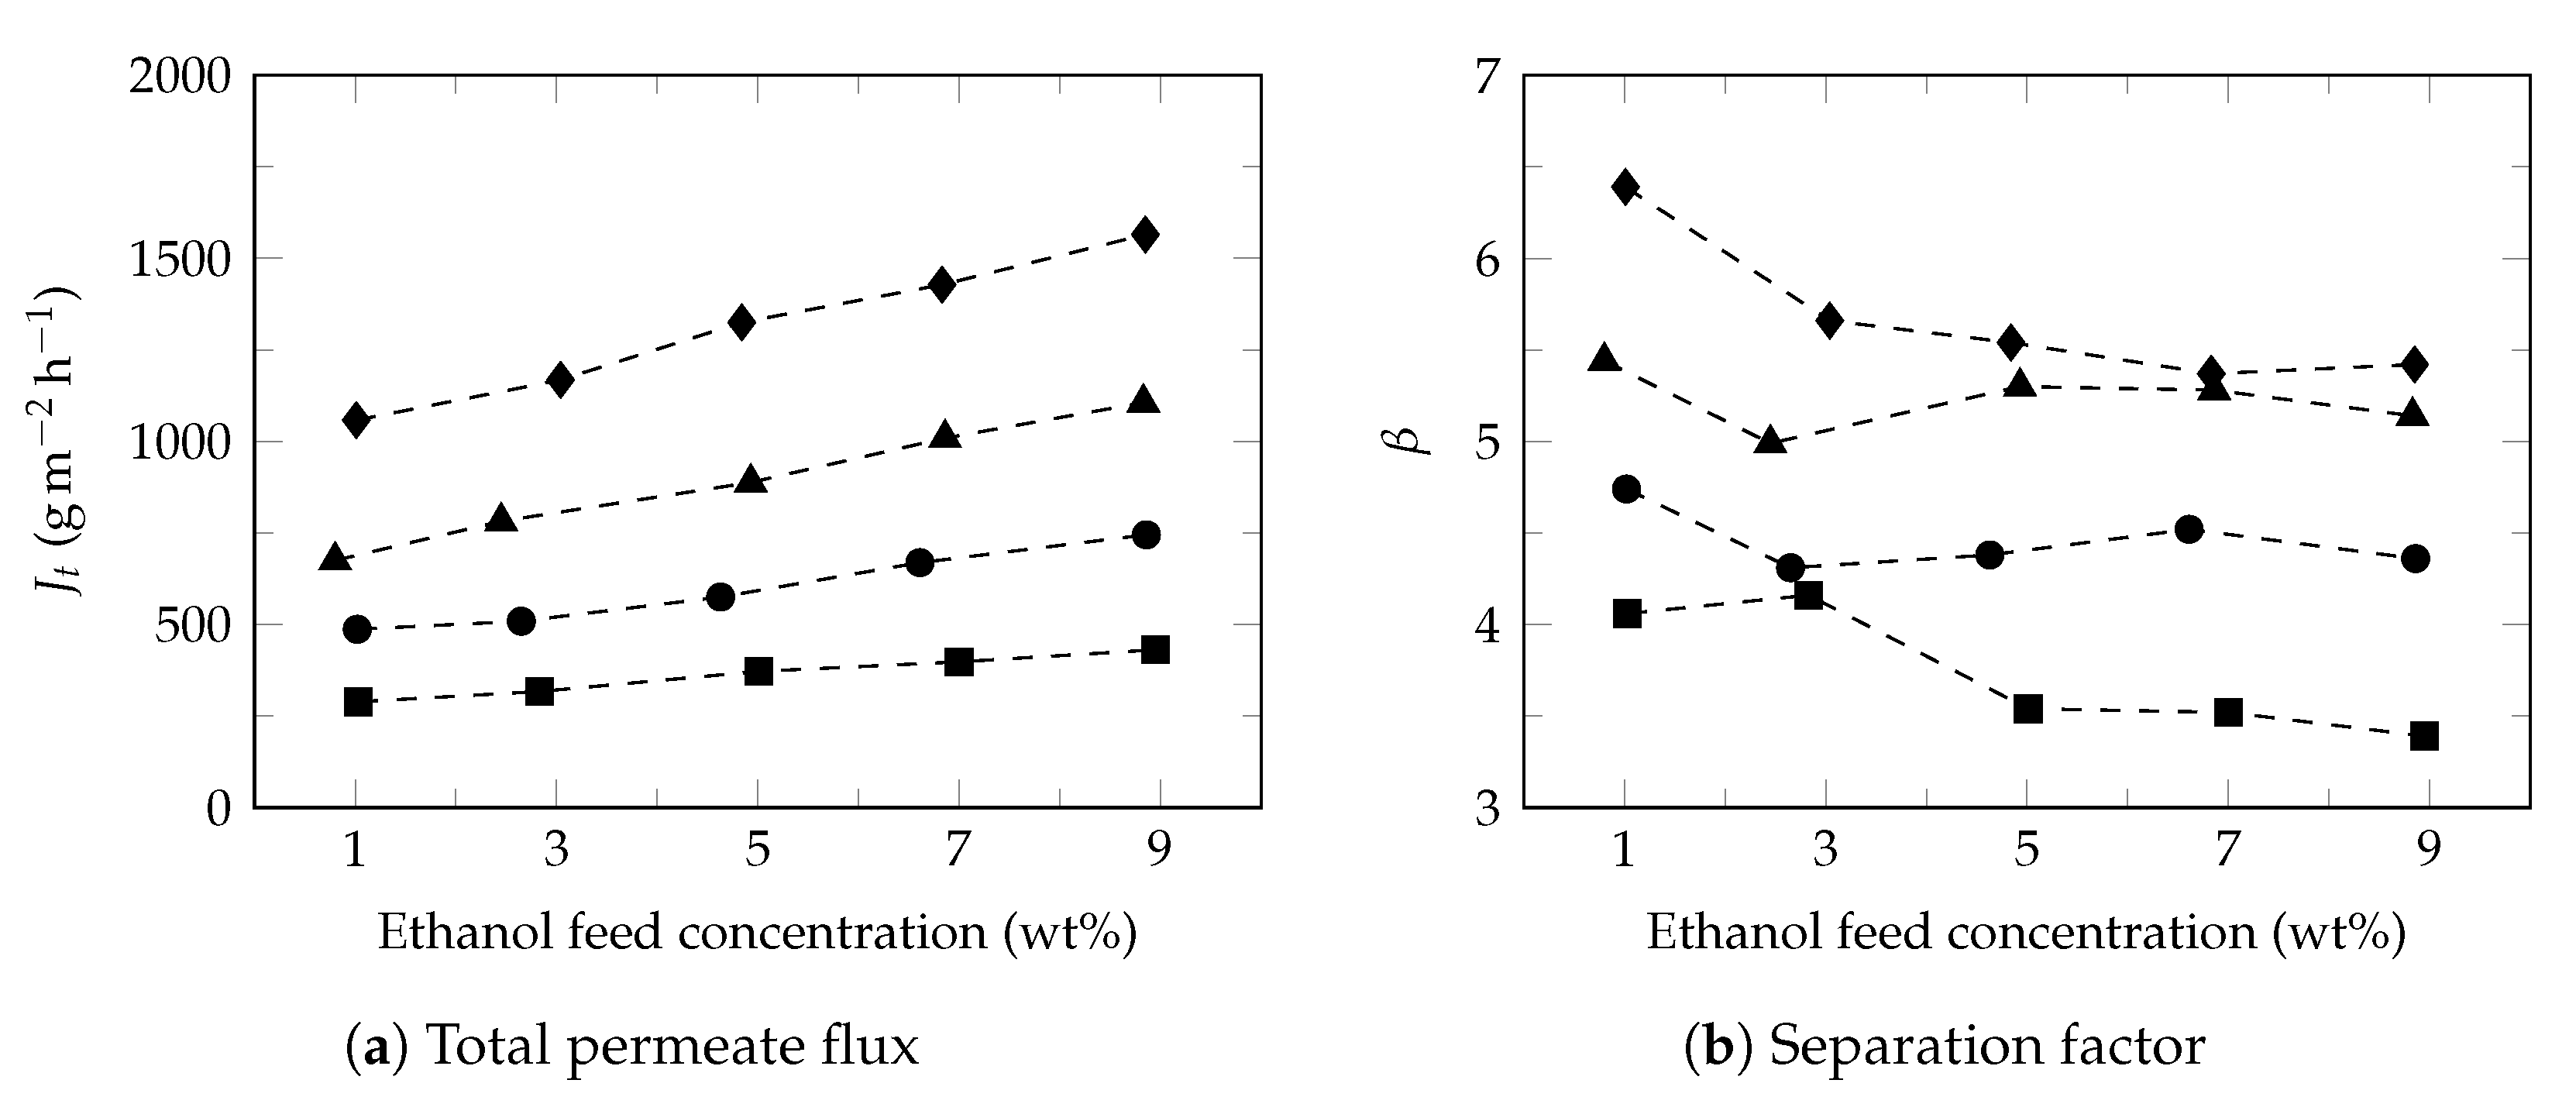
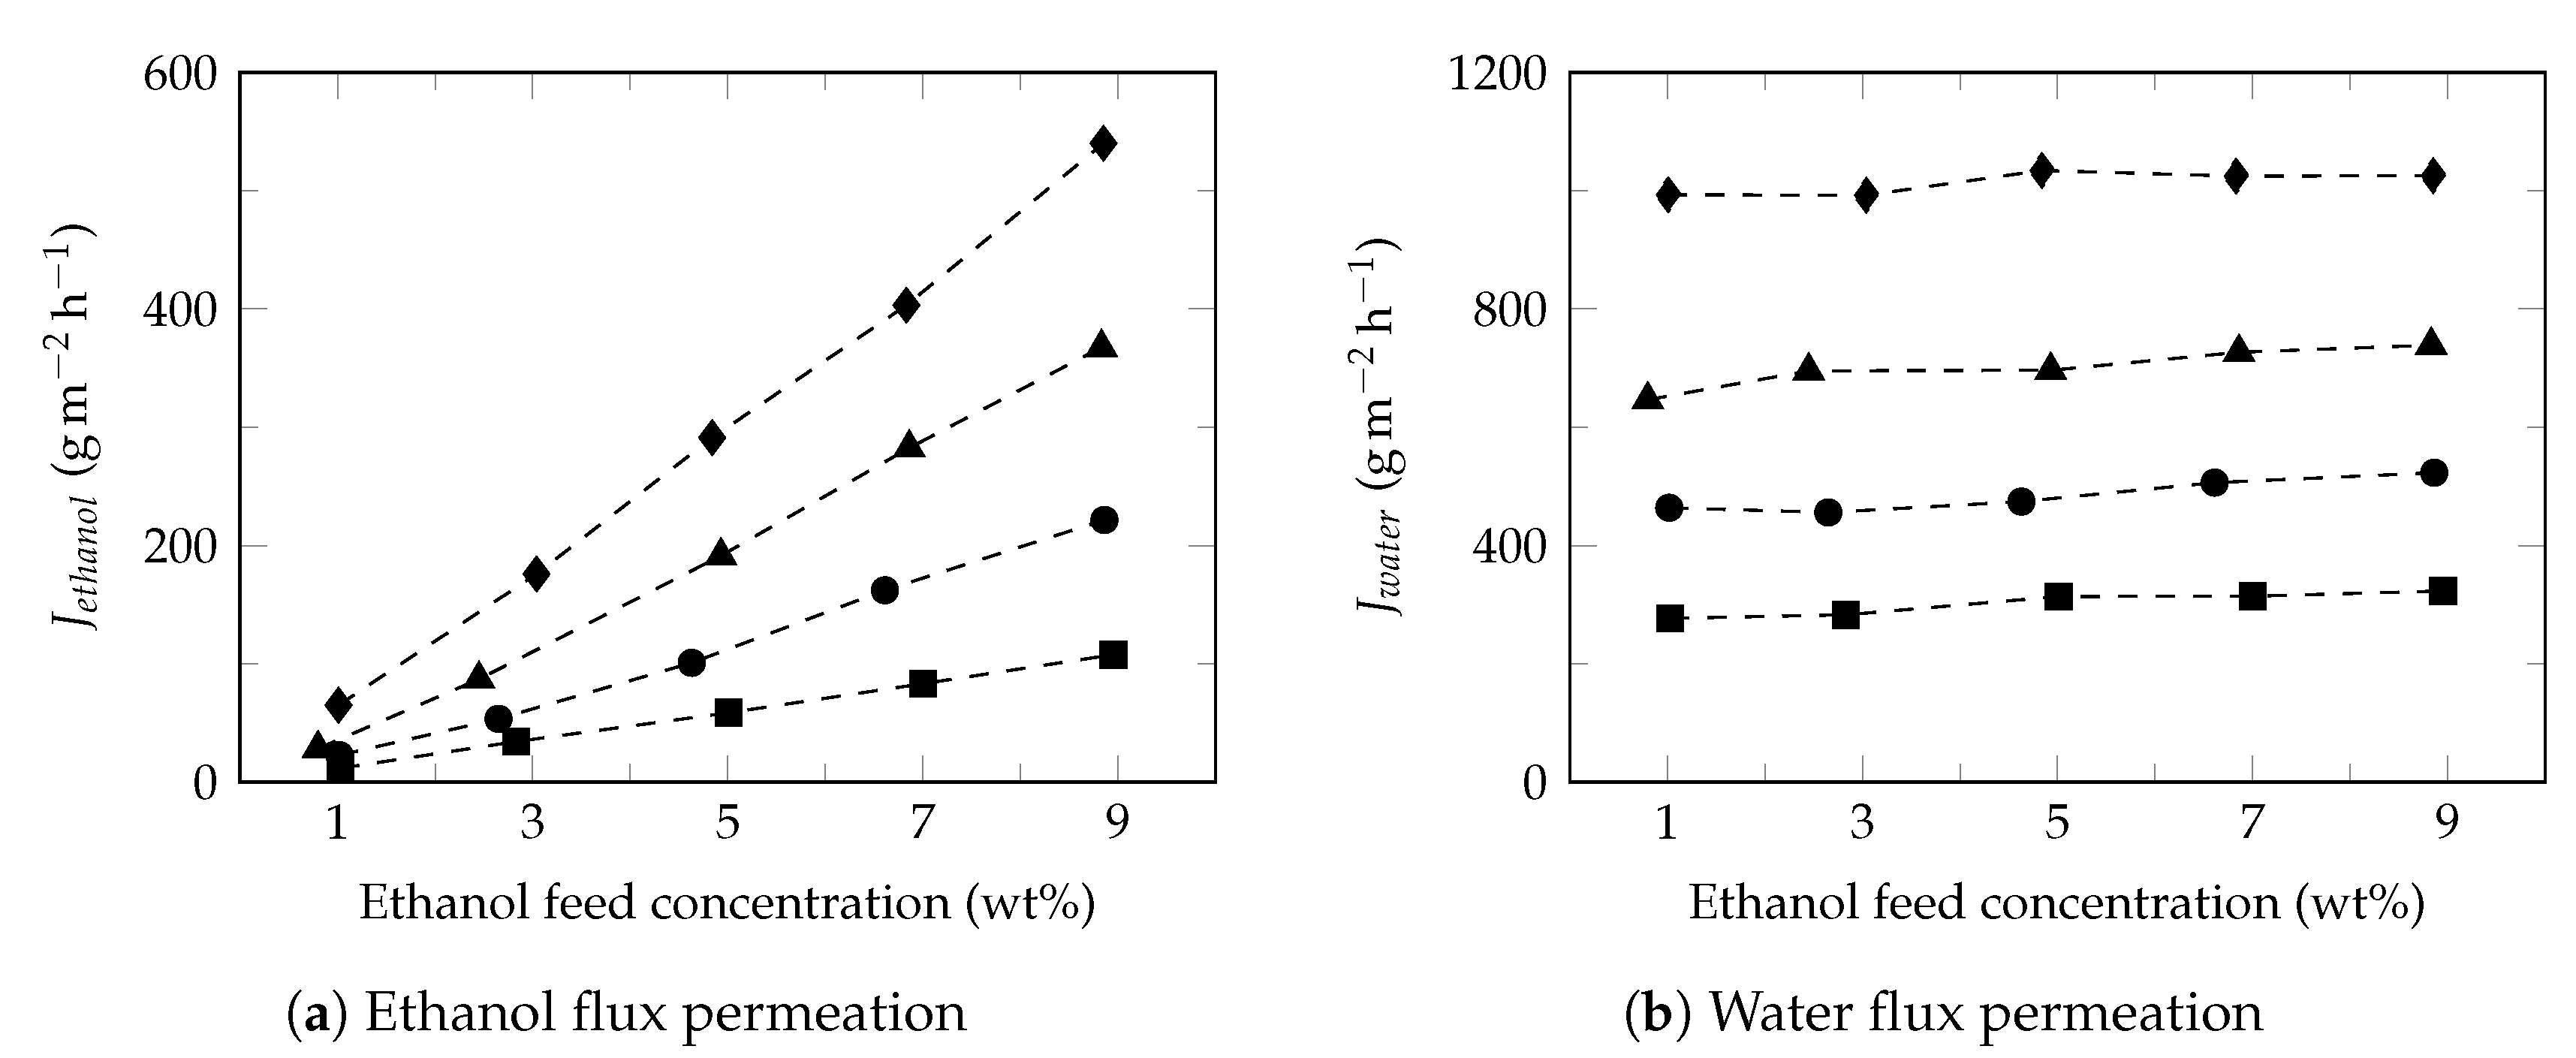
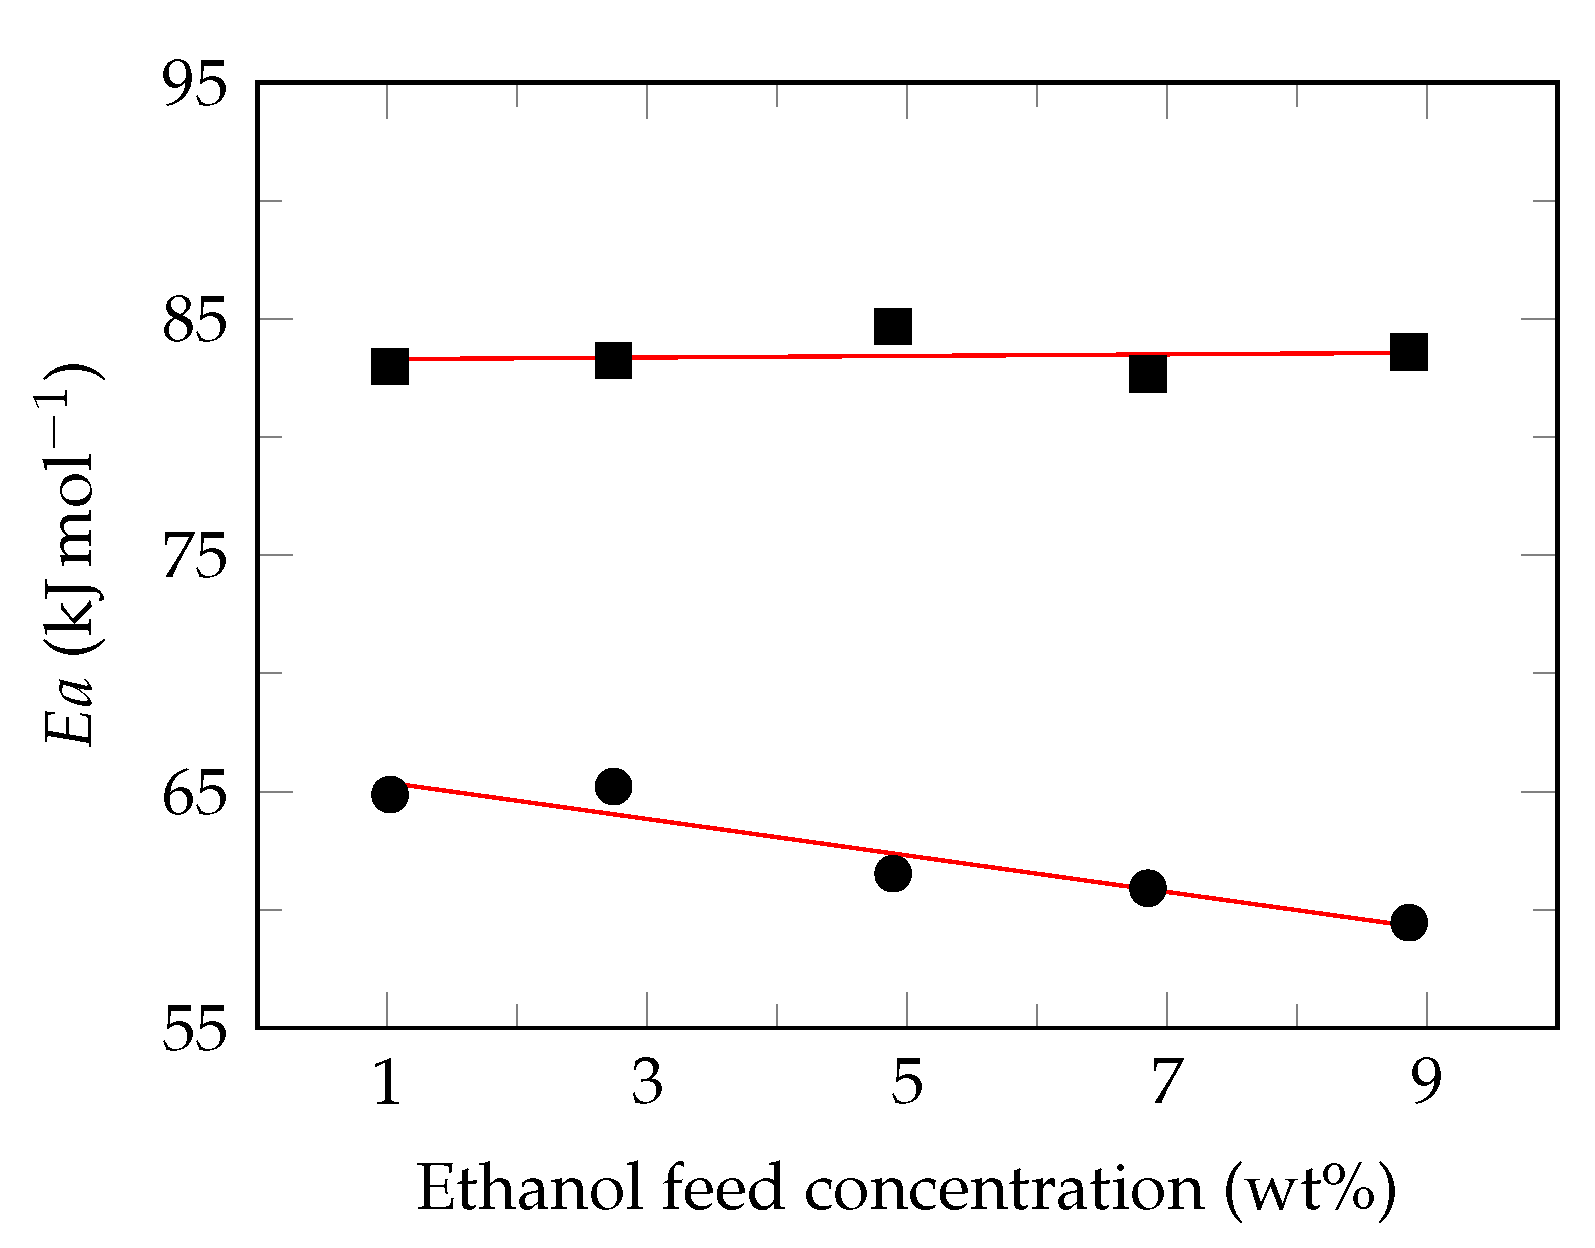
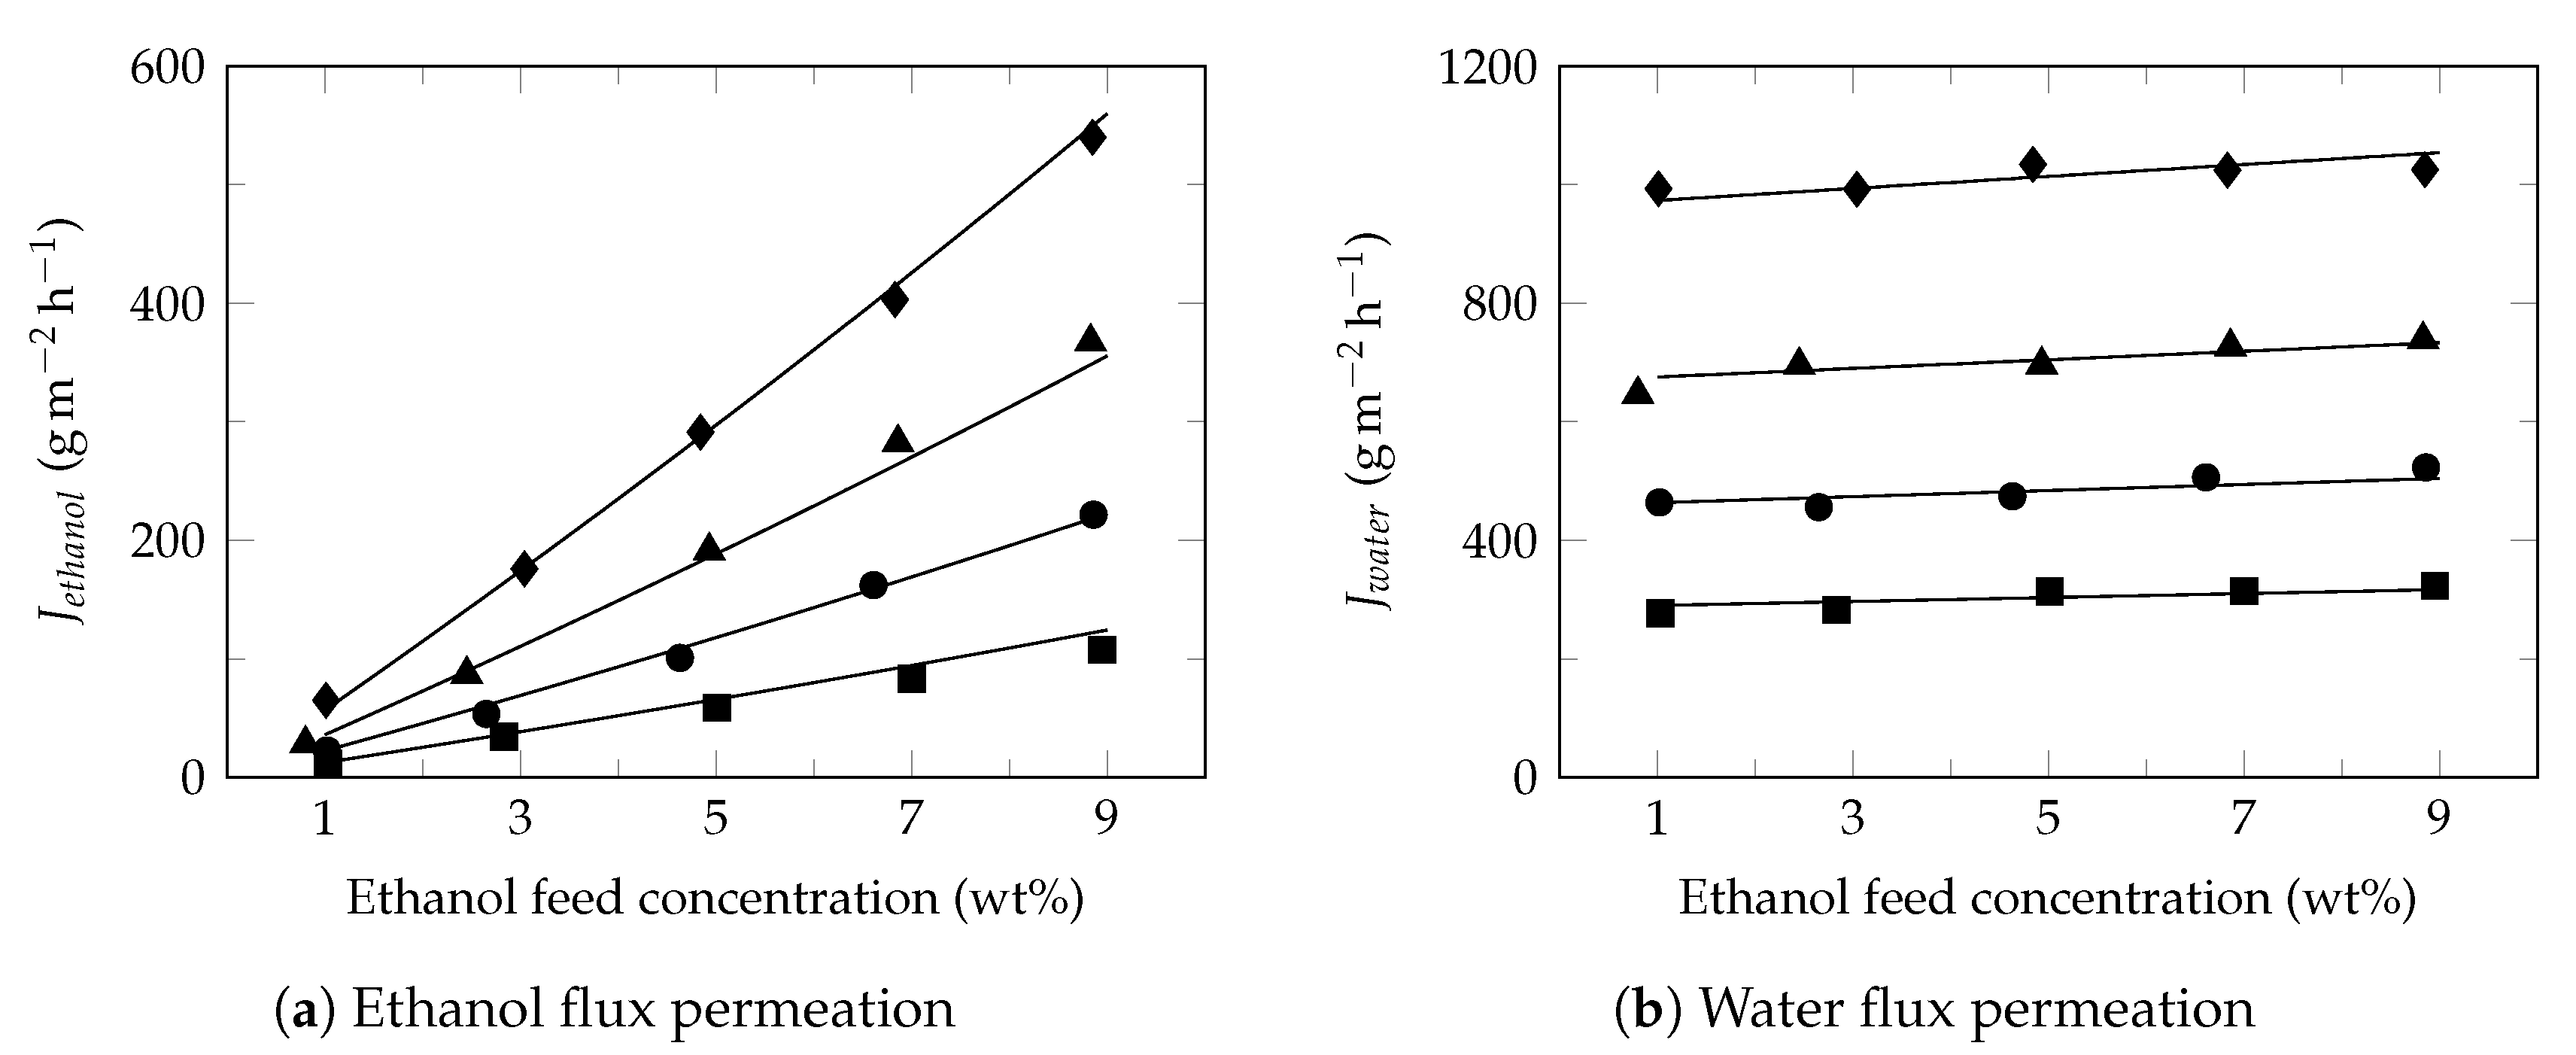
3.2. Effect of Feed Concentration
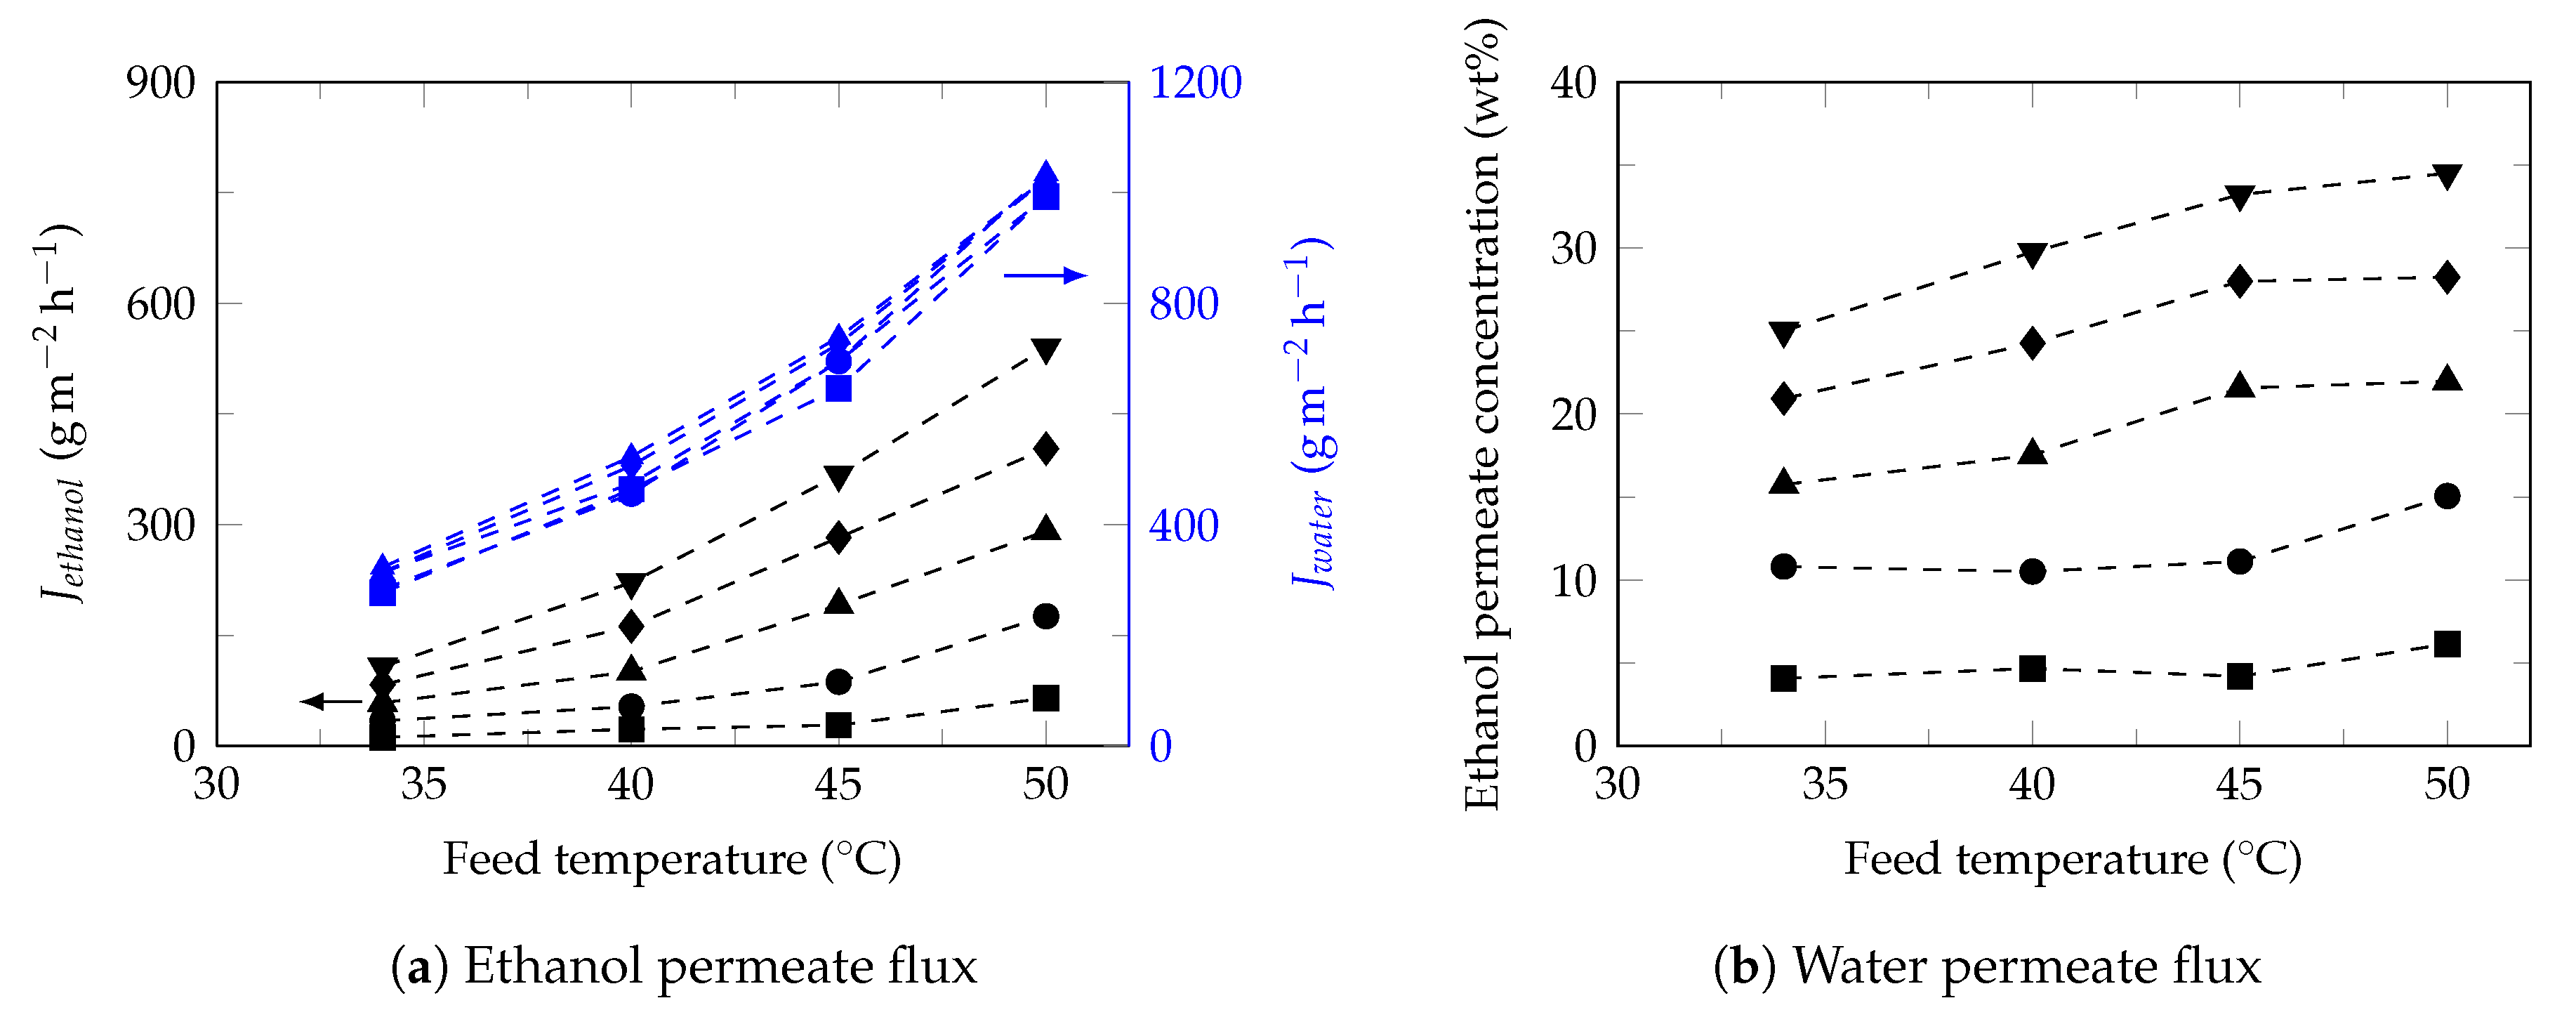
3.3. Effect of Feed Temperature
3.4. Semi-Empirical Model
3.5. Partial Flux Model Application
4. Conclusions
Author Contributions
Funding
Conflicts of Interest
Abbreviations
| Acronym | |
| A | Area |
| Con | Concentration |
| HPLC | High-performance liquid chromatography |
| MMMs | Mixed matrix membranes |
| Mw | Molecular weight |
| P | Pressure |
| PDMS | Polydimethylsiloxane |
| PEBA | Poly (ether-block-amide) |
| PLS | Partial Least Squares |
| R | Gas constant |
| RMSE | Root mean square error |
| T | Temperature |
| VLE | Vapor–liquid equilibrium |
| Greek symbols | |
| membrane selectivity | |
| Separation factor | |
| Activity coefficient | |
| ∏ | Permeability |
| Other symbols | |
| a | Model parameter |
| Adj-R | Adjusted R-squared |
| b | Model parameter |
| c | Model parameter |
| Degrees of freedom | |
| Apparent activation energy | |
| average permeate flux | |
| J | permeate flux |
| Arrhenius coefficient | |
| ℓ | Membrane thickness |
| m | Mass |
| t | Time |
| wt | Weight fraction |
| x | Feed mole fraction |
| y | Permeate mole fraction |
| Subscript | |
| Error | |
| Experimental | |
| i | Mixture component |
| j | Mixture component |
| Total | |
| Superscripts | |
| f | Feed side |
| p | Permeate side |
| Saturated vapor pressure |
Appendix A. Partial Flux Model Application on Experimental Pervaporation Reported in the Literature
Model Applications


References
- Figoli, A.; Santoro, S.; Galiano, F.; Basile, A. Pervaporation membranes: Preparation, characterization, and application. In Pervaporation, Vapour Permeation and Membrane Distillation; Woodhead Publishing Series in Energy; Woodhead Publishing: Oxford, UK, 2015; Chapter 2; pp. 19–63. [Google Scholar] [CrossRef]
- Baker, R.W. Pervaporation. In Membrane Technology and Applications, 3rd ed.; Baker, R.W., Ed.; John Wiley & Sons, Ltd.: Newark, CA, USA, 2012; Chapter 9; pp. 355–392. [Google Scholar] [CrossRef]
- Smitha, B.; Suhanya, D.; Sridhar, S.; Ramakrishna, M. Separation of organic-organic mixtures by pervaporation—A review. J. Membr. Sci. 2004, 241, 1–21. [Google Scholar] [CrossRef]
- Shao, P.; Huang, R. Polymeric membrane pervaporation. J. Membr. Sci. 2007, 287, 162–179. [Google Scholar] [CrossRef]
- Bermudez Jaimes, J.H.; Alvarez, M.; Villarroel, J.; Maciel Filho, R. Pervaporation: Promissory method for the bioethanol separation of fermentation. Chem. Eng. Trans. 2014, 38, 139–144. [Google Scholar] [CrossRef]
- Khazaei, A.; Mohebbi, V.; Behbahani, R.M.; Ramazani, S.A. Energy consumption in pervaporation, conventional and hybrid processes to separate toluene and i-octane. Chem. Eng. Process. Process Intensif. 2018, 128, 46–52. [Google Scholar] [CrossRef]
- Lewandowska, M.; Kujawski, W. Ethanol production from lactose in a fermentation/pervaporation system. J. Food Eng. 2007, 79, 430–437. [Google Scholar] [CrossRef]
- Li, W.; Estager, J.; Monbaliu, J.C.M.; Debecker, D.P.; Luis, P. Separation of bio-based chemicals using pervaporation. J. Chem. Technol. Biotechnol. 2020, 95, 2311–2334. [Google Scholar] [CrossRef]
- Luis, P.; Amelio, A.; Vreysen, S.; Calabro, V.; Van der Bruggen, B. Simulation and environmental evaluation of process design: Distillation vs. hybrid distillation–pervaporation for methanol/tetrahydrofuran separation. Appl. Energy 2014, 113, 565–575. [Google Scholar] [CrossRef]
- Jain, A.; Chaurasia, S.P. Bioethanol production in membrane bioreactor (MBR) system: A review. IJERD 2014, 4, 387–394. [Google Scholar]
- Castro-Muñoz, R. Pervaporation-based membrane processes for the production of non-alcoholic beverages. J. Food Sci. Technol. 2019, 1–12. [Google Scholar] [CrossRef]
- Castro-Muñoz, R.; Galiano, F.; Figoli, A. Chemical and bio-chemical reactions assisted bypervaporation technology. Crit. Rev. Biotechnol. 2019, 39, 884–903. [Google Scholar] [CrossRef]
- Thiess, H.; Schmidt, A.; Strube, J. Development of a Scale-up Tool for Pervaporation Processes. Membranes 2018, 8, 4. [Google Scholar] [CrossRef] [PubMed] [Green Version]
- Jin, W. Butanol-Water Mixtures: Separation by Pervaporation. In Encyclopedia of Membranes; Drioli, E., Giorno, L., Eds.; Springer: Berlin/Heidelberg, Germany, 2016; pp. 283–284. [Google Scholar] [CrossRef] [Green Version]
- Zhu, H.; Li, X.; Pan, Y.; Liu, G.; Wu, H.; Jiang, M.; Jin, W. Fluorinated PDMS membrane with anti-biofouling property for in-situ biobutanol recovery from fermentation-pervaporation coupled process. J. Membr. Sci. 2020, 118225. [Google Scholar] [CrossRef]
- Zhu, T.; Xu, S.; Yu, F.; Yu, X.; Wang, Y. ZIF-8@GO composites incorporated polydimethylsiloxane membrane with prominent separation performance for ethanol recovery. J. Membr. Sci. 2020, 598, 117681. [Google Scholar] [CrossRef]
- Zhang, W.D.; Sun, W.; Yang, J.; Ren, Z.q. The study on pervaporation behaviors of dilute organic solution through PDMS/PTFE composite membrane. Appl. Biochem. Biotechnol. 2010, 160, 156–167. [Google Scholar] [CrossRef] [PubMed]
- Jyoti, G.; Keshav, A.; Anandkumar, J. Review on pervaporation: Theory, membrane performance, and application to intensification of esterification reaction. J. Eng. 2015, 2015, 24. [Google Scholar] [CrossRef] [Green Version]
- Haaz, E.; Toth, A.J. Methanol dehydration with pervaporation: Experiments and modelling. Sep. Purif. Technol. 2018, 205, 121–129. [Google Scholar] [CrossRef]
- Conde-Mejía, C.; Jiménez-Gutiérrez, A. Analysis of ethanol dehydration using membrane separation processes. Open Life Sci. 2020, 15, 122–132. [Google Scholar] [CrossRef]
- Zuo, J.; Hua, D.; Maricar, V.; Ong, Y.K.; Chung, T.S. Dehydration of industrial isopropanol (IPA) waste by pervaporation and vapor permeation membranes. J. Appl. Polym. Sci. 2018, 135, 45086. [Google Scholar] [CrossRef]
- Guo, W.F.; Chung, T.S.; Matsuura, T. Pervaporation study on the dehydration of aqueous butanol solutions: A comparison of flux vs. permeance, separation factor vs. selectivity. J. Membr. Sci. 2004, 245, 199–210. [Google Scholar] [CrossRef]
- Amaley, S.H.; Sapkal, R.; Sapkal, V. Pervaporation: A novel process for ethanol separation using fermentation. Int. J. Eng. Res. 2015, 4, 64–68. [Google Scholar] [CrossRef]
- Chen, J.; Zhang, H.; Wei, P.; Zhang, L.; Huang, H. Pervaporation behavior and integrated process for concentrating lignocellulosic ethanol through polydimethylsiloxane (PDMS) membrane. Bioprocess Biosyst. Eng. 2014, 37, 183–191. [Google Scholar] [CrossRef] [PubMed]
- Liu, G.; Wei, W.; Jin, W. Pervaporation membranes for biobutanol production. ACS Sustain. Chem. Eng. 2014, 2, 546–560. [Google Scholar] [CrossRef]
- Amrei, S.S.; Asghari, M.; Esfahanianb, M.; Zahraeic, Z. Highly selective carbon nanotube-coupled graphene oxide-incorporated polydimethylsiloxane membrane for pervaporative for pervaporative membrane bioreactor ethanol production. J. Chem. Technol. Biotechnol. 2020, 95. [Google Scholar] [CrossRef]
- Chen, C.; Wang, L.; Xiao, G.; Liu, Y.; Xiao, Z.; Deng, Q.; Yao, P. Continuous acetone-butanol-ethanol (ABE) fermentation and gas production under slight pressure in a membrane bioreactor. Bioresour. Technol. 2014, 163, 6–11. [Google Scholar] [CrossRef] [PubMed]
- Fontalvo, J.; Keurentjes, J. A hybrid distillation-pervaporation system in a single unit for breaking distillation boundaries in multicomponent mixtures. Chem. Eng. Res. Des. 2015, 99, 158–164. [Google Scholar] [CrossRef]
- Cao, Z.; Xia, C.; Jia, W.; Qing, W.; Zhang, W. Enhancing bioethanol productivity by a yeast-immobilized catalytically active membrane in a fermentation-pervaporation coupling process. J. Membr. Sci. 2020, 595, 117485. [Google Scholar] [CrossRef]
- Zheng, P.; Li, C.; Wang, N.; Li, J.; An, Q. The potential of pervaporation for biofuel recovery from fermentation: An energy consumption point of view. Chin. J. Chem. Eng. 2019, 27, 1296–1306. [Google Scholar] [CrossRef]
- Nangare, D.; Mayadevi, S. Hybrid pervaporation/distillation process for ethanol—Water separation, effect of distillation column side stream. Asian J. Sci. Technol. 2017, 8, 6522–6525. [Google Scholar]
- Klinov, A.V.; Akberov, R.R.; Fazlyev, A.R.; Farakhov, M.I. Experimental investigation and modeling through using the solution-diffusion concept of pervaporation dehydration of ethanol and isopropanol by ceramic membranes HybSi. J. Membr. Sci. 2017, 524, 321–333. [Google Scholar] [CrossRef]
- Shin, C.; Baer, Z.C.; Chen, X.C.; Ozcam, A.E.; Clark, D.S.; Balsara, N.P. Block copolymer pervaporation membrane for in situ product removal during acetone-butanol-ethanol fermentation. J. Membr. Sci. 2015, 484, 57–63. [Google Scholar] [CrossRef] [Green Version]
- Chen, F.; Chen, H. A diffusion model of the pervaporation separation of ethylene glycol-water mixtures through crosslinked poly(vinyl alcohol) membrane. J. Membr. Sci. 1998, 139, 201–209. [Google Scholar] [CrossRef]
- Alvarez, M.E.T.; Moraes, E.B.; Araujo, W.A.; Maciel Filho, R.; Wolf-Maciel, M.R. Development of a mathematical model for studying bioethanol-water separation using hydrophilic polyetherimide membrane. J. Appl. Polym. Sci. 2008, 107, 2256–2265. [Google Scholar] [CrossRef]
- Valentínyi, N.; Cséfalvay, E.; Mizsey, P. Modelling of pervaporation: Parameter estimation and model development. Chem. Eng. Res. Des. 2013, 91, 174–183. [Google Scholar] [CrossRef]
- der Bruggen, B.V.; Luis, P. Pervaporation. In Progress in Filtration and Separation; Tarleton, S., Ed.; Academic Press: Oxford, UK, 2015; Chapter 4; pp. 101–154. [Google Scholar] [CrossRef]
- González, B.; Ortiz, I. Mathematical modeling of the pervaporative separation of methanol-methylterbutyl ether mixtures. Ind. Eng. Chem. Res. 2001, 40, 1720–1731. [Google Scholar] [CrossRef]
- Verliefde, A.R.D.; Van der Meeren, P.; Van der Bruggen, B. Solution-diffusion processes. In Encyclopedia of Membrane Science and Technology; Hoek, E.M.V., Tarabara, V.V., Eds.; Wiley: Hoboken, NJ, USA, 2013; Volume 1. [Google Scholar] [CrossRef]
- Qiu, B.; Wang, Y.; Fan, S.; Liu, J.; Jian, S.; Qin, Y.; Xiao, Z.; Tang, X.; Wang, W. Ethanol mass transfer during pervaporation with PDMS membrane based on solution-diffusion model considering concentration polarization. Sep. Purif. Technol. 2019, 220, 276–282. [Google Scholar] [CrossRef]
- Yeom, C.K.; Baig, F.U. Simulation of pervaporation process through hollow fiber module for treatment of reactive waste stream from a phenolic resin manufacturing process. Membr. J. 2003, 13, 257–267. [Google Scholar]
- Baker, R.W.; Wijmans, J.; Huang, Y. Permeability, permeance and selectivity: A preferred way of reporting pervaporation performance data. J. Membr. Sci. 2010, 348, 346–352. [Google Scholar] [CrossRef]
- Yang, J.; Han, M. Optimization of distillation-pervaporation membrane hybrid process for separation of water/organic solvent mixtures. Korean Chem. Eng. Res. 2018, 56, 29–41. [Google Scholar] [CrossRef]
- Tgarguifa, A.; Abderafi, S.; Bounahmidi, T. Energy efficiency improvement of a bioethanol distillery, by replacing a rectifying column with a pervaporation unit. Renew. Energ. 2018, 122, 239–250. [Google Scholar] [CrossRef]
- Ashraf, M.T.; Schmidt, J.E.; Kujawa, J.; Kujawski, W.; Arafat, H.A. One-dimensional modeling of pervaporation systems using a semi-empirical flux model. Sep. Purif. Technol. 2017, 174, 502–512. [Google Scholar] [CrossRef]
- Schiffmann, P.; Repke, J.U. Experimental investigation and simulation of organophilic pervaporation in laboratory and pilot scale. Chem. Eng. Technol. 2015, 38, 879–890. [Google Scholar] [CrossRef]
- Meintjes, M.M. Fermentation Coupled with Pervaporation: A Kinetic Study. Master’s Thesis, North-West University, Vanderbijlpark, South Africa, 2011. [Google Scholar]
- Noriega, M.A. Remoción de Etanol en Sistemas de Fermentación AlcohóLica Mediante PervaporacióN. Master’s Thesis, Universidad Nacional de Colombia, Bogotá, Colombia, 2010. [Google Scholar]
- Torres-Alvarez, M.; Wolf-Maciel, M. Simulation of the Pervaporation Process for Separating Organic Mixtures Uisng Solution-Diffusion Model; FOCAPO: Coral Springs, FL, USA, 2003; pp. 513–516. [Google Scholar]
- Yeom, C.; Kazi, M.; Baig, F.U. Simulation and process design of pervaporation plate-and-frame modules for dehydration of organic solvents. Membr. J. 2002, 12, 226–239. [Google Scholar]
- Hietaharju, J.; Kangas, J.; Tanskanen, J. Analysis of the permeation behavior of ethanol/water mixtures through a polydimethylsiloxane (PDMS) membrane in pervaporation and vapor permeation conditions. Sep. Purif. Technol. 2019, 227, 115738. [Google Scholar] [CrossRef]
- Bermudez Jaimes, J.; Silva, B.T.; Jaimes Figueroa, J.E.; Lunelli, B.H.; Maciel Filho, R.; Wolf Maciel, M.R.; Morita, A.T.; Coutinho, P.L.A. Hybrid Route to Produce Acrylic Acid from Sugarcane Molasses. Chem. Eng. Trans. 2014, 37, 427–432. [Google Scholar] [CrossRef]
- Rosipal, R.; Krämer, N. Overview and Recent Advances in Partial Least Squares. In Subspace, Latent Structure and Feature Selection; Saunders, C., Grobelnik, M., Gunn, S., Shawe-Taylor, J., Eds.; Springer: Berlin/Heidelberg, Germany, 2006; pp. 34–51. [Google Scholar]
- Krishnan, A.; Williams, L.J.; McIntosh, A.R.; Abdi, H. Partial least squares methods: Partial least squares correlation and partial least square regression. NeuroImage 2011, 56, 455–475. [Google Scholar] [CrossRef]
- Wooldridge, J.M. A note on computing r-squared and adjusted r-squared for trending and seasonal data. Econ. Lett. 1991, 36, 49–54. [Google Scholar] [CrossRef]
- Li, M.; Tang, X.P.; Wu, W.; Liu, H.B. General models for estimating daily global solar radiation for different solar radiation zones in mainland China. Energy Convers. Manag. 2013, 70, 139–148. [Google Scholar] [CrossRef]
- Trinh, L.T.P.; Lee, Y.J.; Park, C.S.; Bae, H.J. Aqueous acidified ionic liquid pretreatment for bioethanol production and concentration of produced ethanol by pervaporation. J. Ind. Eng. Chem. 2019, 69, 57–65. [Google Scholar] [CrossRef]
- Rozicka, A.; Niemistö, J.; Keiski, R.; Kujawski, W. Apparent and intrinsic properties of commercial PDMS based membranes in pervaporative removal of acetone, butanol and ethanol from binary aqueous mixtures. J. Membr. Sci. 2014, 453, 108–118. [Google Scholar] [CrossRef]
- Zhan, X.; Wang, M.; Gao, T.; Lu, J.; He, Y.; Li, J. A highly selective sorption process in POSS-g-PDMS mixed matrix membranes for ethanol recovery via pervaporation. Sep. Purif. Technol. 2020, 236, 116238. [Google Scholar] [CrossRef]
- Wang, H.; Tang, S.; Ni, Y.; Zhang, C.; Zhu, X.; Zhao, Q. Covalent cross-linking for interface engineering of high flux UiO-66-TMS/PDMS pervaporation membranes. J. Membr. Sci. 2020, 598, 117791. [Google Scholar] [CrossRef]
- Li, S.; Qin, F.; Qin, P.; Karim, M.N.; Tan, T. Preparation of PDMS membrane using water as solvent for pervaporation separation of butanol-water mixture. Green Chem. 2013, 15, 2180–2190. [Google Scholar] [CrossRef]
- Yin, H.; Cay-Durgun, P.; Lai, T.; Zhu, G.; Engebretson, K.; Setiadji, R.; Green, M.D.; Lind, M.L. Effect of ZIF-71 ligand-exchange surface modification on biofuel recovery through pervaporation. Polymer 2020, 195, 122379. [Google Scholar] [CrossRef]
- He, X.; Wang, T.; Huang, J.; Chen, J.; Li, J. Fabrication and characterization of superhydrophobic PDMS composite membranes for efficient ethanol recovery via pervaporation. Sep. Purif. Technol. 2020, 241, 116675. [Google Scholar] [CrossRef]
- Zhan, X.; Lu, J.; Xu, H.; Liu, J.; Liu, X.; Cao, X.; Li, J. Enhanced pervaporation performance of PDMS membranes based on nano-sized Octa[(trimethoxysilyl)ethyl]-POSS as macro-crosslinker. Appl. Surf. Sci. 2019, 473, 785–798. [Google Scholar] [CrossRef]
- Fu, C.; Cai, D.; Hu, S.; Miao, Q.; Wang, Y.; Qin, P.; Wang, Z.; Tan, T. Ethanol fermentation integrated with PDMS composite membrane: An effective process. Bioresour. Technol. 2016, 200, 648–657. [Google Scholar] [CrossRef] [PubMed]
- Mao, H.; Zhen, H.G.; Ahmad, A.; Zhang, A.S.; Zhao, Z.P. In situ fabrication of MOF nanoparticles in PDMS membrane via interfacial synthesis for enhanced ethanol permselective pervaporation. J. Membr. Sci. 2019, 573, 344–358. [Google Scholar] [CrossRef]
- Vane, L.M.; Namboodiri, V.V.; Bowen, T.C. Hydrophobic zeolite–silicone rubber mixed matrix membranes for ethanol–water separation: Effect of zeolite and silicone component selection on pervaporation performance. J. Membr. Sci. 2008, 308, 230–241. [Google Scholar] [CrossRef]
- Niemistö, J.; Kujawski, W.; Keiski, R.L. Pervaporation performance of composite poly(dimethyl siloxane) membrane for butanol recovery from model solutions. J. Membr. Sci. 2013, 434, 55–64. [Google Scholar] [CrossRef]
- Zhou, H.; Su, Y.; Chen, X.; Wan, Y. Separation of acetone, butanol and ethanol (ABE) from dilute aqueous solutions by silicalite-1/PDMS hybrid pervaporation membranes. Sep. Purif. Technol. 2011, 79, 375–384. [Google Scholar] [CrossRef]
- Ulbricht, M. Advanced functional polymer membranes. Polymer 2006, 47, 2217–2262. [Google Scholar] [CrossRef] [Green Version]
- Zhou, H.; Shi, R.; Jin, W. Novel organic-inorganic pervaporation membrane with a superhydrophobic surface for the separation of ethanol from an aqueous solution. Sep. Purif. Technol. 2014, 127, 61–69. [Google Scholar] [CrossRef]
- Zhang, G.; Li, J.; Wang, N.; Fan, H.; Zhang, R.; Ji, S. Enhanced flux of polydimethylsiloxane membrane for ethanol permselective pervaporation via incorporation of MIL-53 particles. J. Membr. Sci. 2015, 492, 322–330. [Google Scholar] [CrossRef]
- Feng, X.; Huang, R.Y. Estimation of activation energy for permeation in pervaporation processes. J. Membr. Sci. 1996, 118, 127–131. [Google Scholar] [CrossRef]
- Xu, S.; Wang, Y. Novel thermally cross-linked polyimide membranes for ethanol dehydration via pervaporation. J. Membr. Sci. 2015, 496, 142–155. [Google Scholar] [CrossRef]
- Liu, D.; Liu, G.; Meng, L.; Dong, Z.; Huang, K.; Jin, W. Hollow fiber modules with ceramic-supported PDMS composite membranes for pervaporation recovery of bio-butanol. Sep. Purif. Technol. 2015, 146, 24–32. [Google Scholar] [CrossRef]
- Mafi, A.; Raisi, A.; Hatam, M.; Aroujalian, A. A mass transfer model for pure alcoholic permeation through the PDMS membrane. Desalin. Water Treat. 2014, 52, 7628–7636. [Google Scholar] [CrossRef]
- Yeom, C.K.; Yoon, S.B.; Park, Y.I. Study on the effect of membrane module configuration on pervaporative performance through model simulation. Membr. J. 2008, 18, 294–305. [Google Scholar]
- Coker, A.K. Numerical Computation. In Fortran Programs for Chemical Process Design, Analysis, and Simulation; Coker, A.K., Ed.; Gulf Professional Publishing: Houston, TX, USA, 1995; Chapter 1; pp. 1–102. [Google Scholar] [CrossRef]
- Liu, Q.; Li, Y.; Li, Q.; Liu, G.; Liu, G.; Jin, W. Mixed-matrix hollow fiber composite membranes comprising of PEBA and MOF for pervaporation separation of ethanol/water mixtures. Sep. Purif. Technol. 2019, 214, 2–10. [Google Scholar] [CrossRef]
- Jia, W.; Sun, W.; Yu, Y.; Cao, Z.; Qing, W.; Zhang, W. Low-surface-energy monomer for ultrathin silicone membrane fabrication: Towards enhanced ethanol/water pervaporation performance. Sep. Purif. Technol. 2019, 222, 361–368. [Google Scholar] [CrossRef]
- Chen, J.; Huang, J.; Li, J.; Zhan, X.; Chen, C. Mass transport study of PVA membranes for the pervaporation separation of water/ethanol mixtures. Desalination 2010, 256, 148–153. [Google Scholar] [CrossRef]

| Parameter | Ethanol | Water | Unit |
|---|---|---|---|
| a | 2.1847 × 10¹⁴ | 1.2170 × 10¹¹ | g m−2 h−1 |
| b | 3.0433 × 101 | −5.4992 × 101 | J mol−1 |
| c | −7.7889 × 10⁴ | −5.6995 × 10⁴ | J mol−1 |
| Feed | Pervaporation | Membrane | Ref. | |||||
|---|---|---|---|---|---|---|---|---|
| wt% | T (C) | (mol m h) | P (Pa) | Composition | A (cm) | ℓ (m) | ||
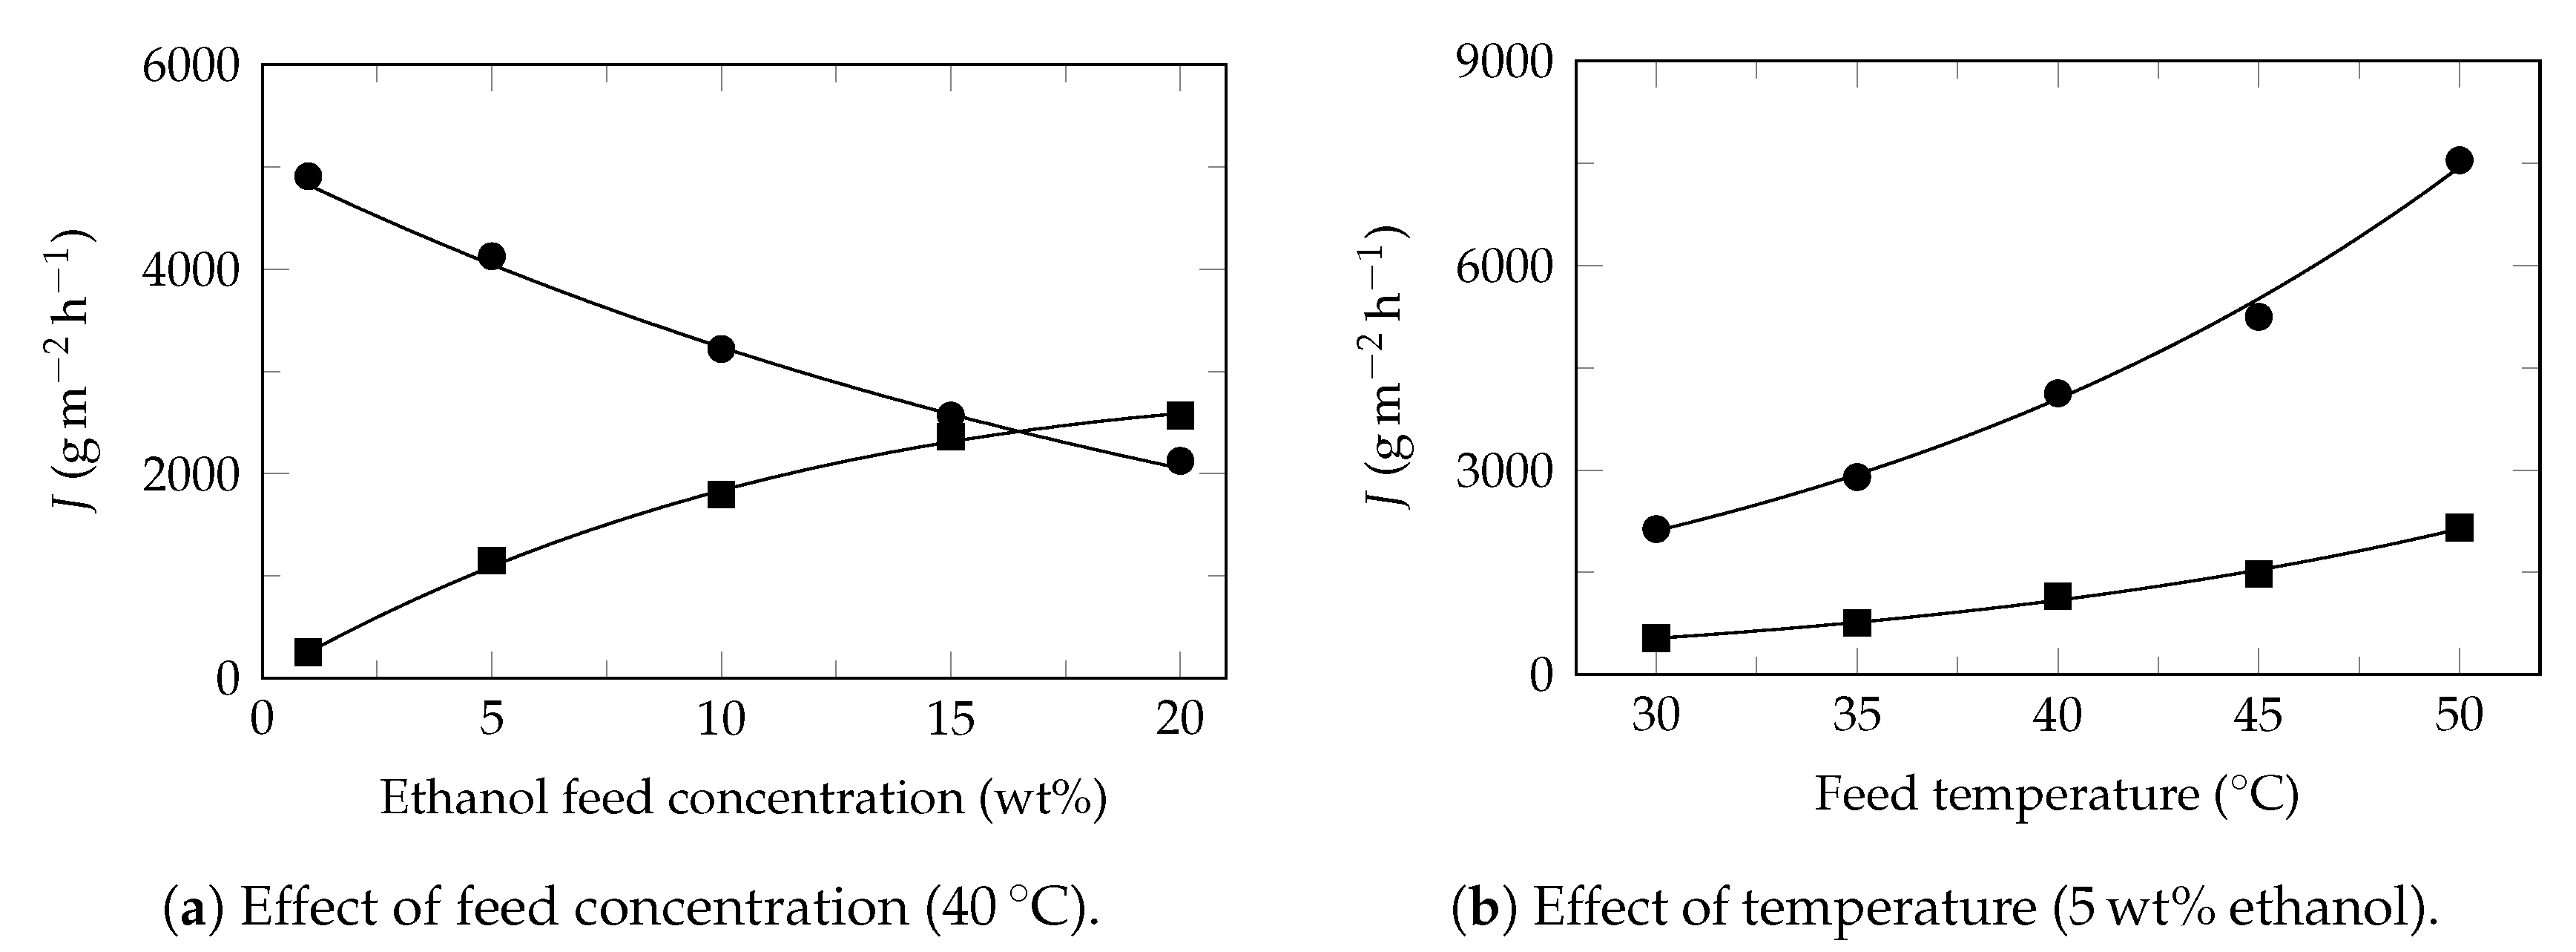
| 1–20 | 30–50 | 2673–9704 | 4.8–5.4 | 150 | PDMS/UiO-66-TMS | 19.6 | — | [60] |
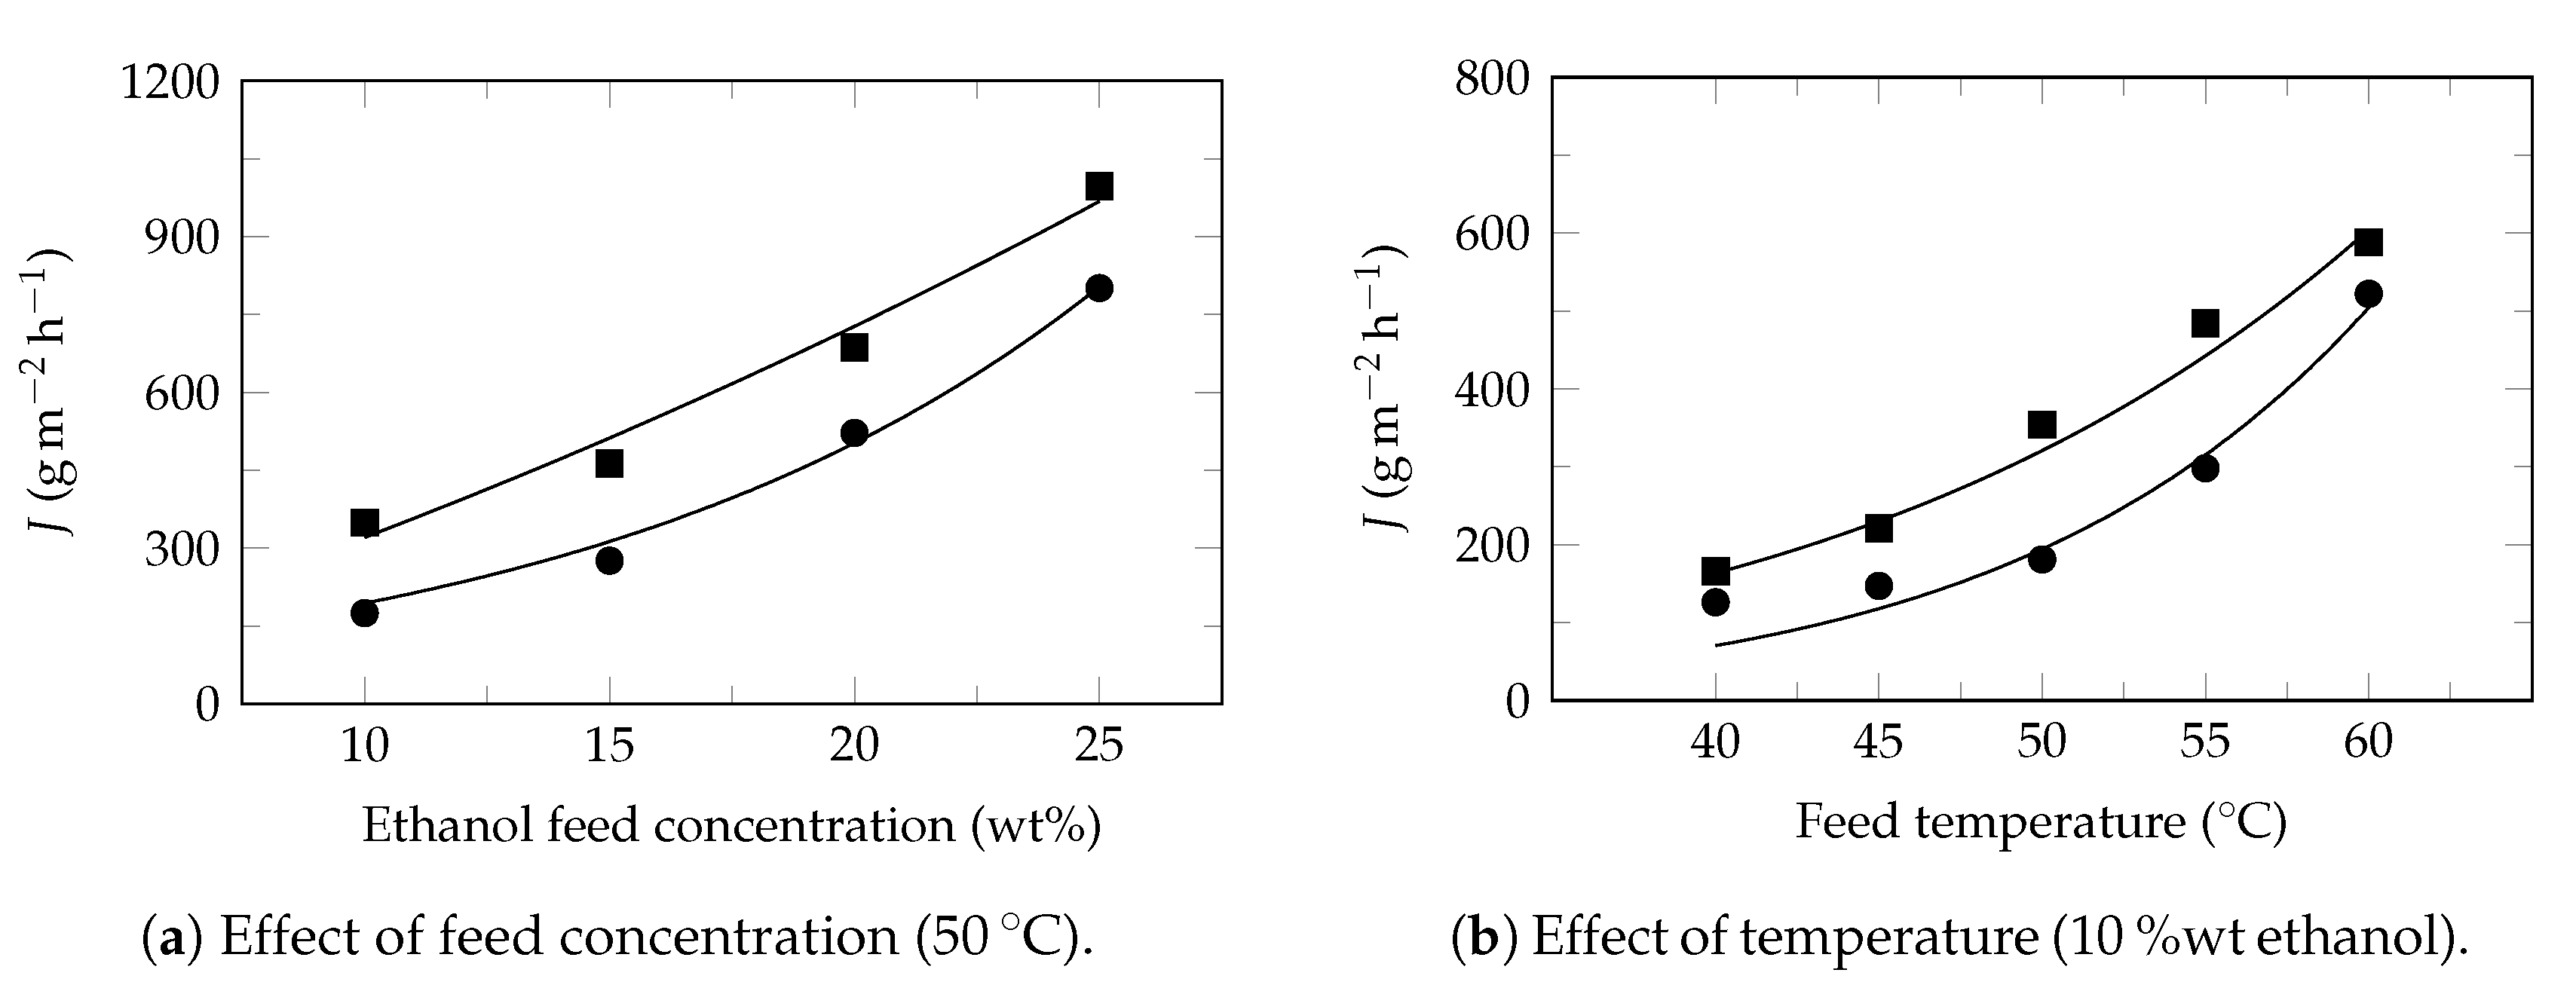
| 10–25 | 40–60 | 293–1792 | 3.7–17.9 | 500 | POSS-g-PDMS | 22 | 30 | [59] |
| 1–10 | 40–70 | 1387–4417 | 9.7–20.6 | 300 | PDMS/ZIF-8 | 20 | 1.16 | [66] |
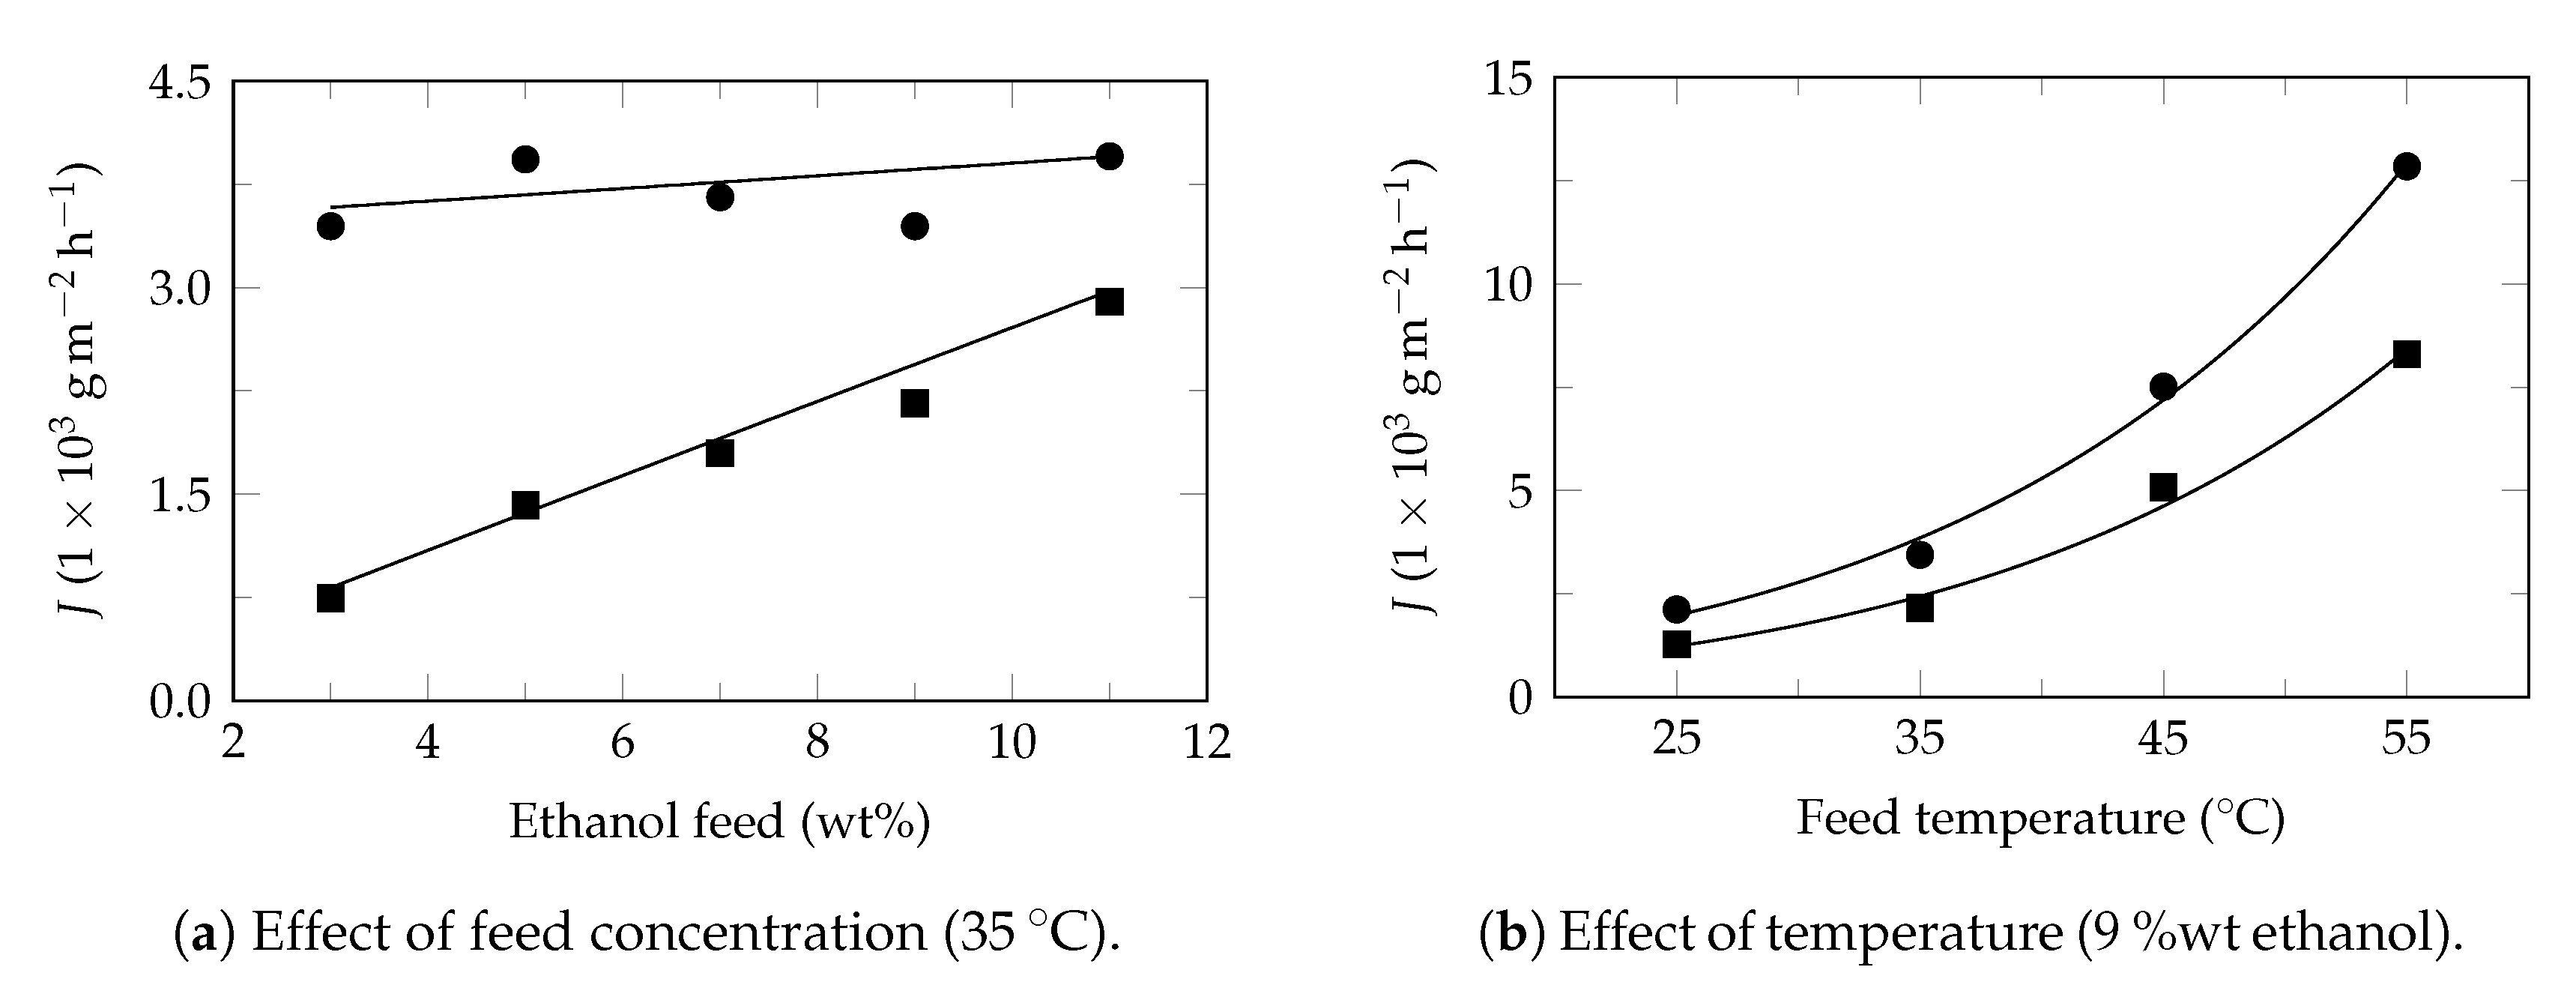
| 5–20 | 25–60 | 982–4448 | 3.0–5.6 | 300 | MAF-6/PEBA | — | 5 | [79] |
| 3–11 | 25–55 | 3410–21,147 | 5.9–7.0 | — | PDMDES | 55.4 | 1 | [80] |
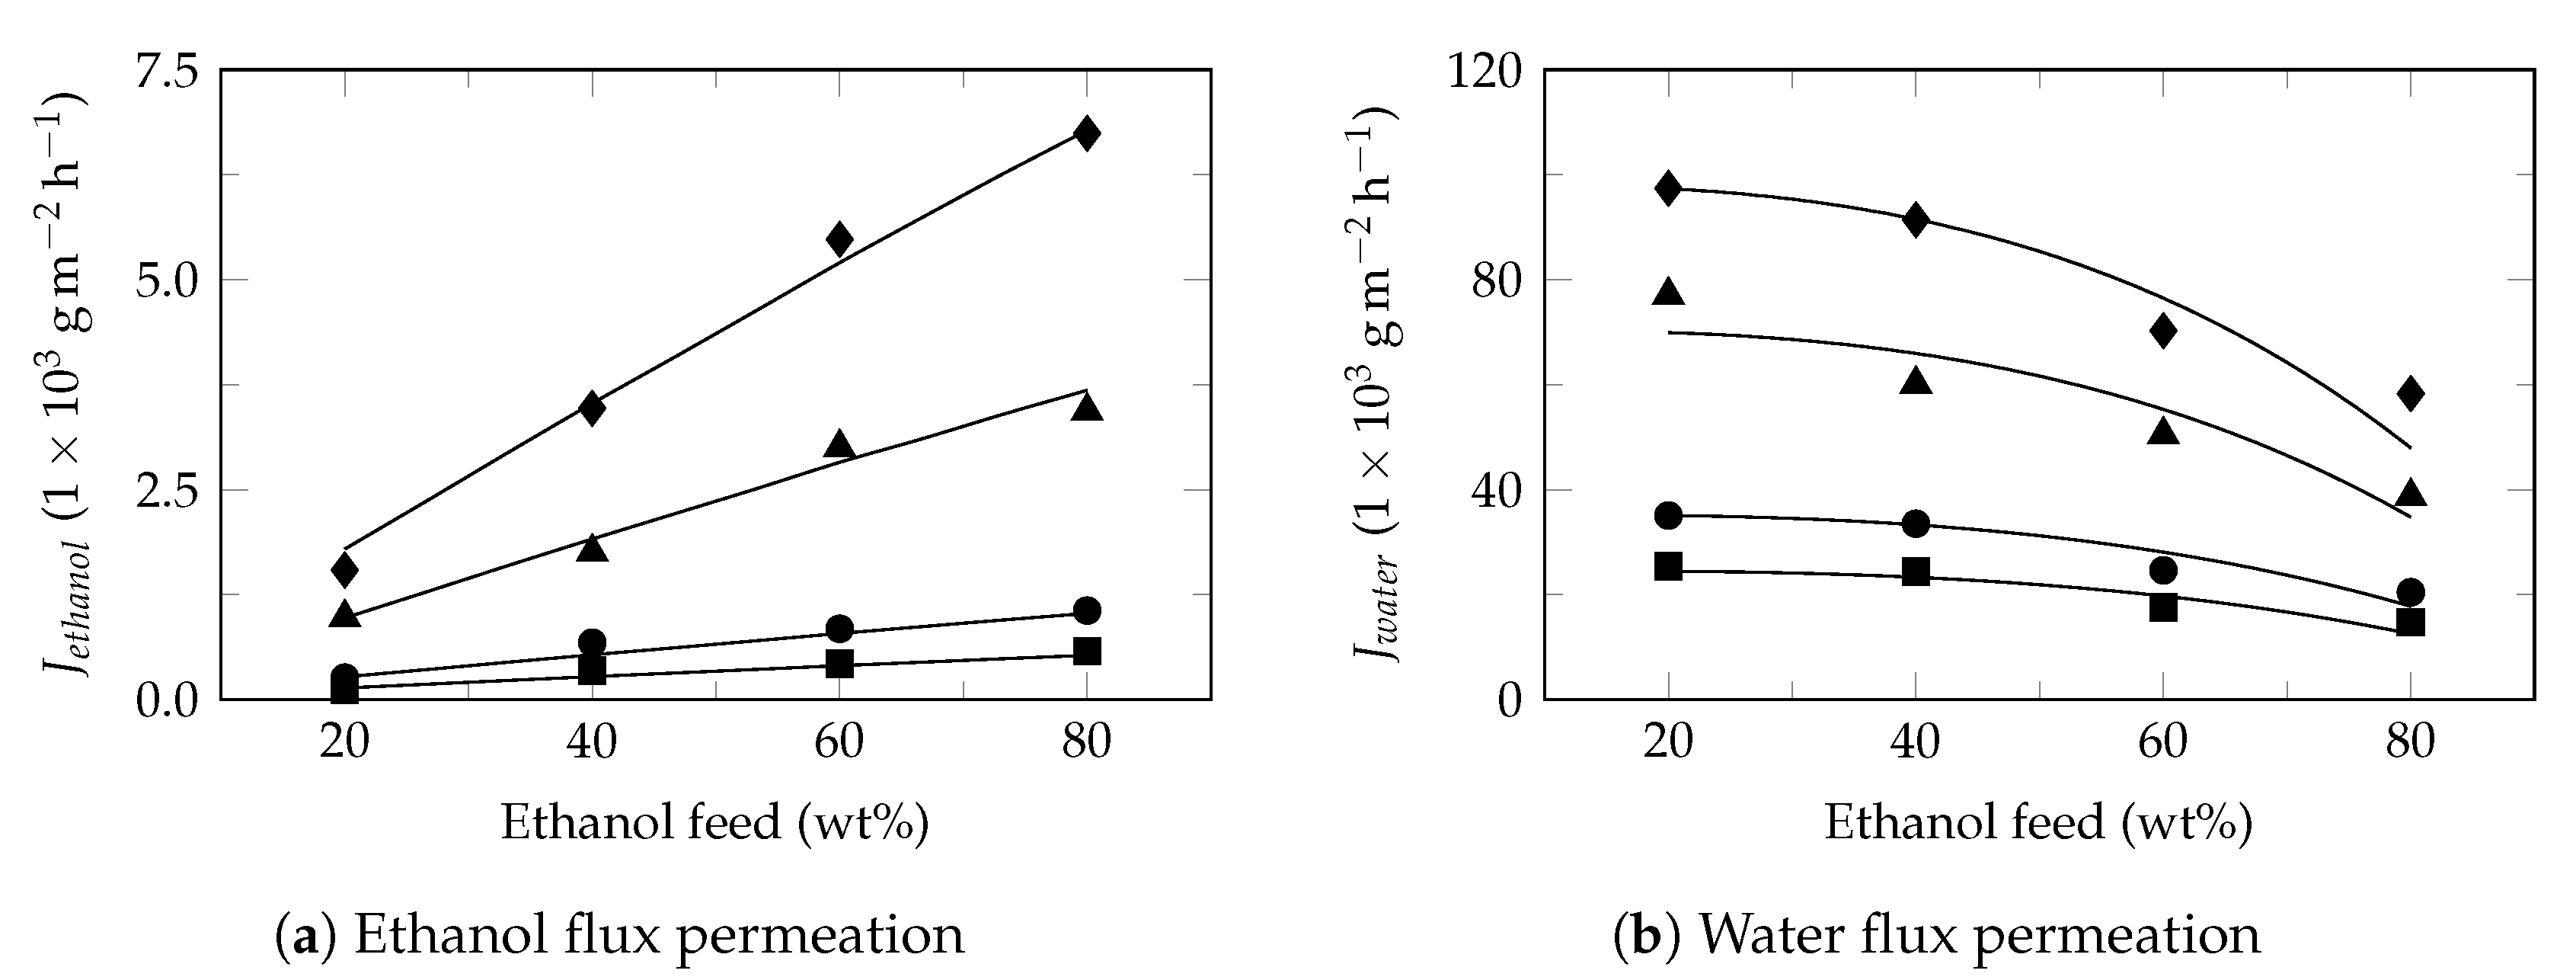
| 20–80 | 70–90 | 15,335–98,933 | 15.7–101.9 | 500 | PVA | 28.3 | 20 | [81] |
| 5.1–15.8 | 60–100 | 685–4819 | 32.8–188.8 | 300 | Pervap 2510 | 178 | — | [45] |
| 1–9 | 3–50 | 288–1565 | 3.4–6.4 | 1200 | PDMS | 50 | 4 | This work |
| Component | a | b | c | RMSE | Ref. | ||
|---|---|---|---|---|---|---|---|
| g m h | J mol | J mol | % | ||||
| ethanol | 2.1847 × 10¹⁴ | 3.0433 × 101 | −7.7889 × 10⁴ | 0.9956 | 5.45 | This work | |
| water | 1.2170 × 10¹¹ | −5.4992 × 101 | −5.6995 × 10⁴ | 0.9968 | 2.29 | ||
| ethanol | 5.7744 × 10¹¹ | −9.0935 × 101 | −5.6031 × 10⁴ | 0.9971 | 2.51 | [60] | |
| water | 1.5557 × 10¹⁰ | 8.7905 × 101 | −5.9686 × 10⁴ | 0.9947 | 2.76 | ||
| ethanol | 4.7114 × 10¹⁰ | 3.3738 × 101 | −5.7050 × 10⁴ | 0.9773 | 6.54 | [59] | |
| water | 1.4105 × 10¹⁴ | −2.8712 × 10² | −5.9628 × 10⁴ | 0.9781 | 8.17 | ||
| ethanol | 4.9447 × 10⁶ | −9.1482 × 101 | −2.6643 × 10⁴ | 0.9869 | 4.56 | [66] | |
| water | 9.8762 × 10⁴ | −3.4970 × 101 | −2.0040 × 10⁴ | 0.9869 | 3.27 | ||
| ethanol | 8.1045 × 10⁸ | 2.5624 × 10⁻¹ | −4.2036 × 10⁴ | 0.9921 | 4.58 | [79] | |
| water | 4.6406 × 10⁶ | −6.8452 × 101 | −2.6003 × 10⁴ | 0.9800 | 4.84 | ||
| ethanol | 1.8201 × 10¹¹ | −3.6583 | −5.2039 × 10⁴ | 0.9896 | 6.91 | [80] | |
| water | 1.7481 × 10¹⁰ | −5.8910 × 101 | −4.5465 × 10⁴ | 0.9935 | 4.34 | ||
| water | 2.3440 × 10¹³ | −3.4132 × 101 | −6.8774 × 10⁴ | 0.9677 | 9.37 | [81] | |
| ethanol | 8.8538 × 10²⁰ | −2.6617 | −1.3201 × 10⁵ | 0.9939 | 7.23 | ||
| water | 5.5648 × 10⁶ | 1.6967 × 101 | −3.0690 × 10⁴ | 0.9917 | 4.70 | [45] | |
| 1-butanol | 1.3693 × 10⁹ | −4.8434 × 10² | −1.6507 × 10⁴ | 0.9923 | 7.52 | ||
Publisher’s Note: MDPI stays neutral with regard to jurisdictional claims in published maps and institutional affiliations. |
© 2020 by the authors. Licensee MDPI, Basel, Switzerland. This article is an open access article distributed under the terms and conditions of the Creative Commons Attribution (CC BY) license (http://creativecommons.org/licenses/by/4.0/).
Share and Cite
Bermudez Jaimes, J.H.; Torres Alvarez, M.E.; Bannwart de Moraes, E.; Wolf Maciel, M.R.; Maciel Filho, R. Separation and Semi-Empiric Modeling of Ethanol–Water Solutions by Pervaporation Using PDMS Membrane. Polymers 2021, 13, 93. https://doi.org/10.3390/polym13010093
Bermudez Jaimes JH, Torres Alvarez ME, Bannwart de Moraes E, Wolf Maciel MR, Maciel Filho R. Separation and Semi-Empiric Modeling of Ethanol–Water Solutions by Pervaporation Using PDMS Membrane. Polymers. 2021; 13(1):93. https://doi.org/10.3390/polym13010093
Chicago/Turabian StyleBermudez Jaimes, John Hervin, Mario Eusebio Torres Alvarez, Elenise Bannwart de Moraes, Maria Regina Wolf Maciel, and Rubens Maciel Filho. 2021. "Separation and Semi-Empiric Modeling of Ethanol–Water Solutions by Pervaporation Using PDMS Membrane" Polymers 13, no. 1: 93. https://doi.org/10.3390/polym13010093