The Study of EDLC Device with High Electrochemical Performance Fabricated from Proton Ion Conducting PVA-Based Polymer Composite Electrolytes Plasticized with Glycerol

 , ,
, , 
 , ,
, ,  and
and
Abstract
:
1. Introduction
2. Materials and Methods
2.1. Materials
2.2. Electrolyte Preparation
2.3. Characterization Techniques
2.3.1. X-ray Diffraction (XRD) Measurements
2.3.2. Fourier-Transform Infrared Spectroscopy (FTIR)
2.3.3. Field Emission Scanning Electron Microscopy (FESEM)
2.3.4. Electrochemical Impedance Spectroscopy (EIS)
2.4. Electrolyte Characterization
Ionic Transference Number Analysis and Linear Sweep Voltammetry
2.5. Electrode Preparation
2.6. EDLC Characterization
3. Results and Discussion
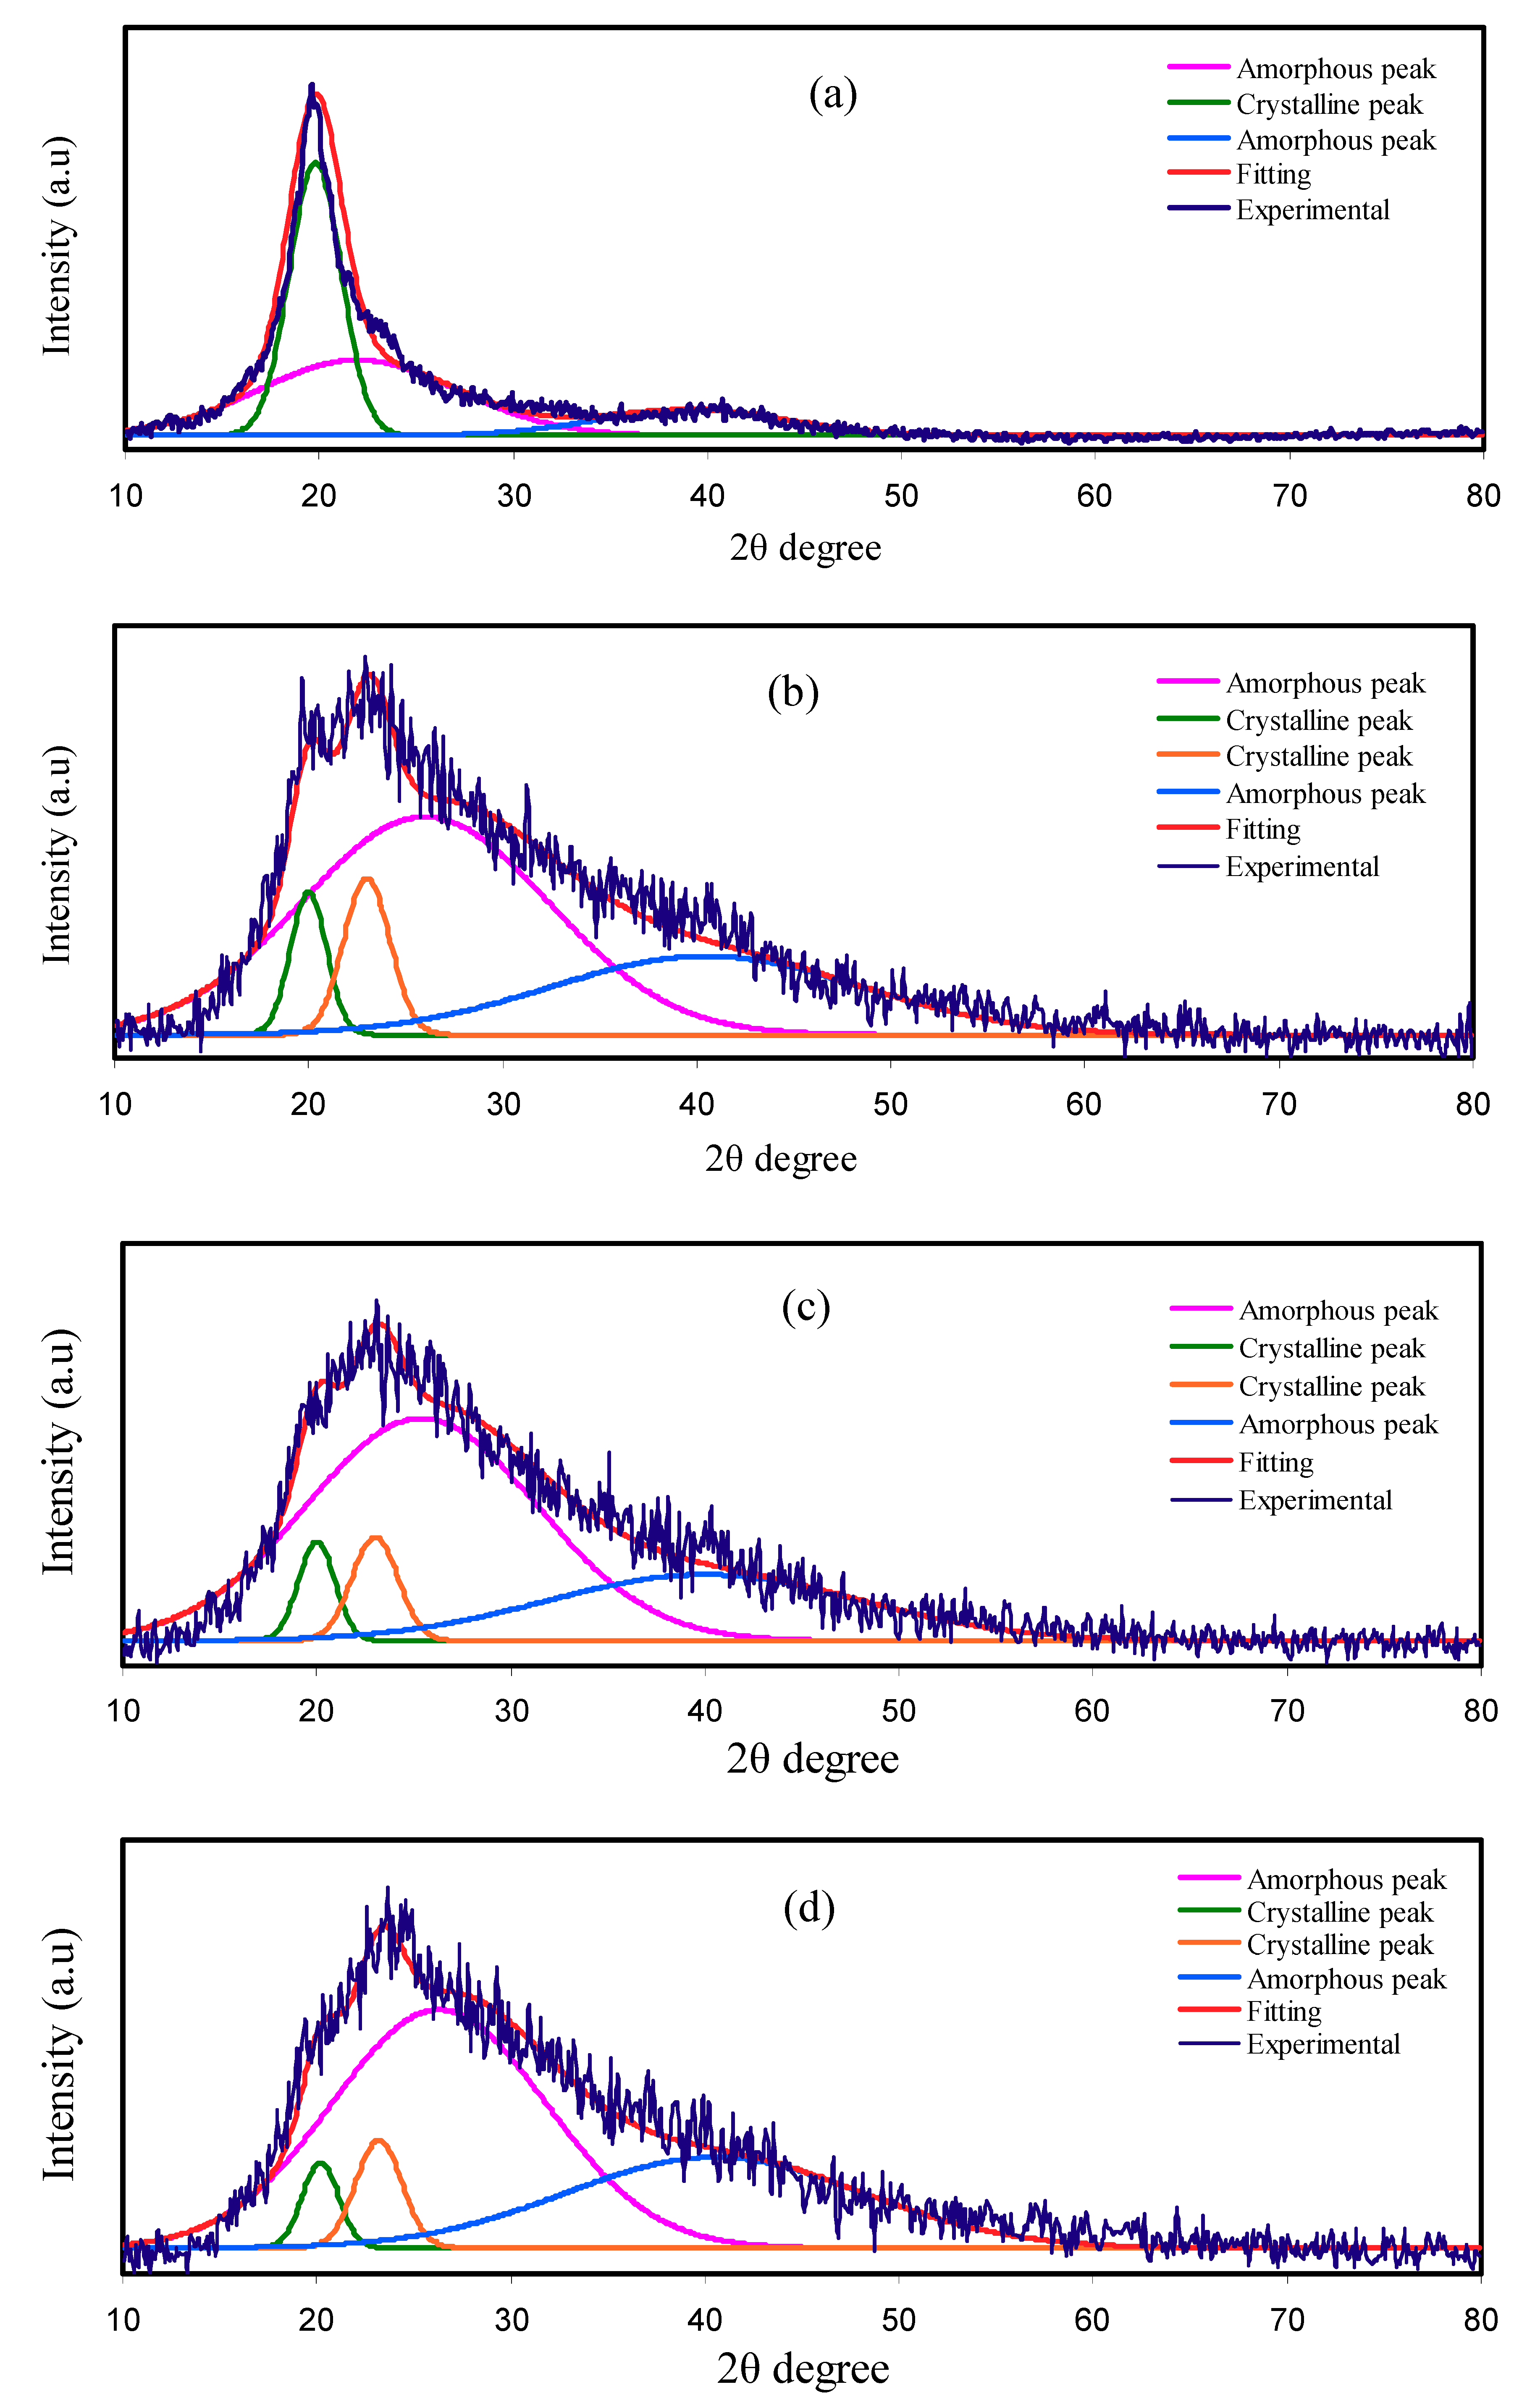
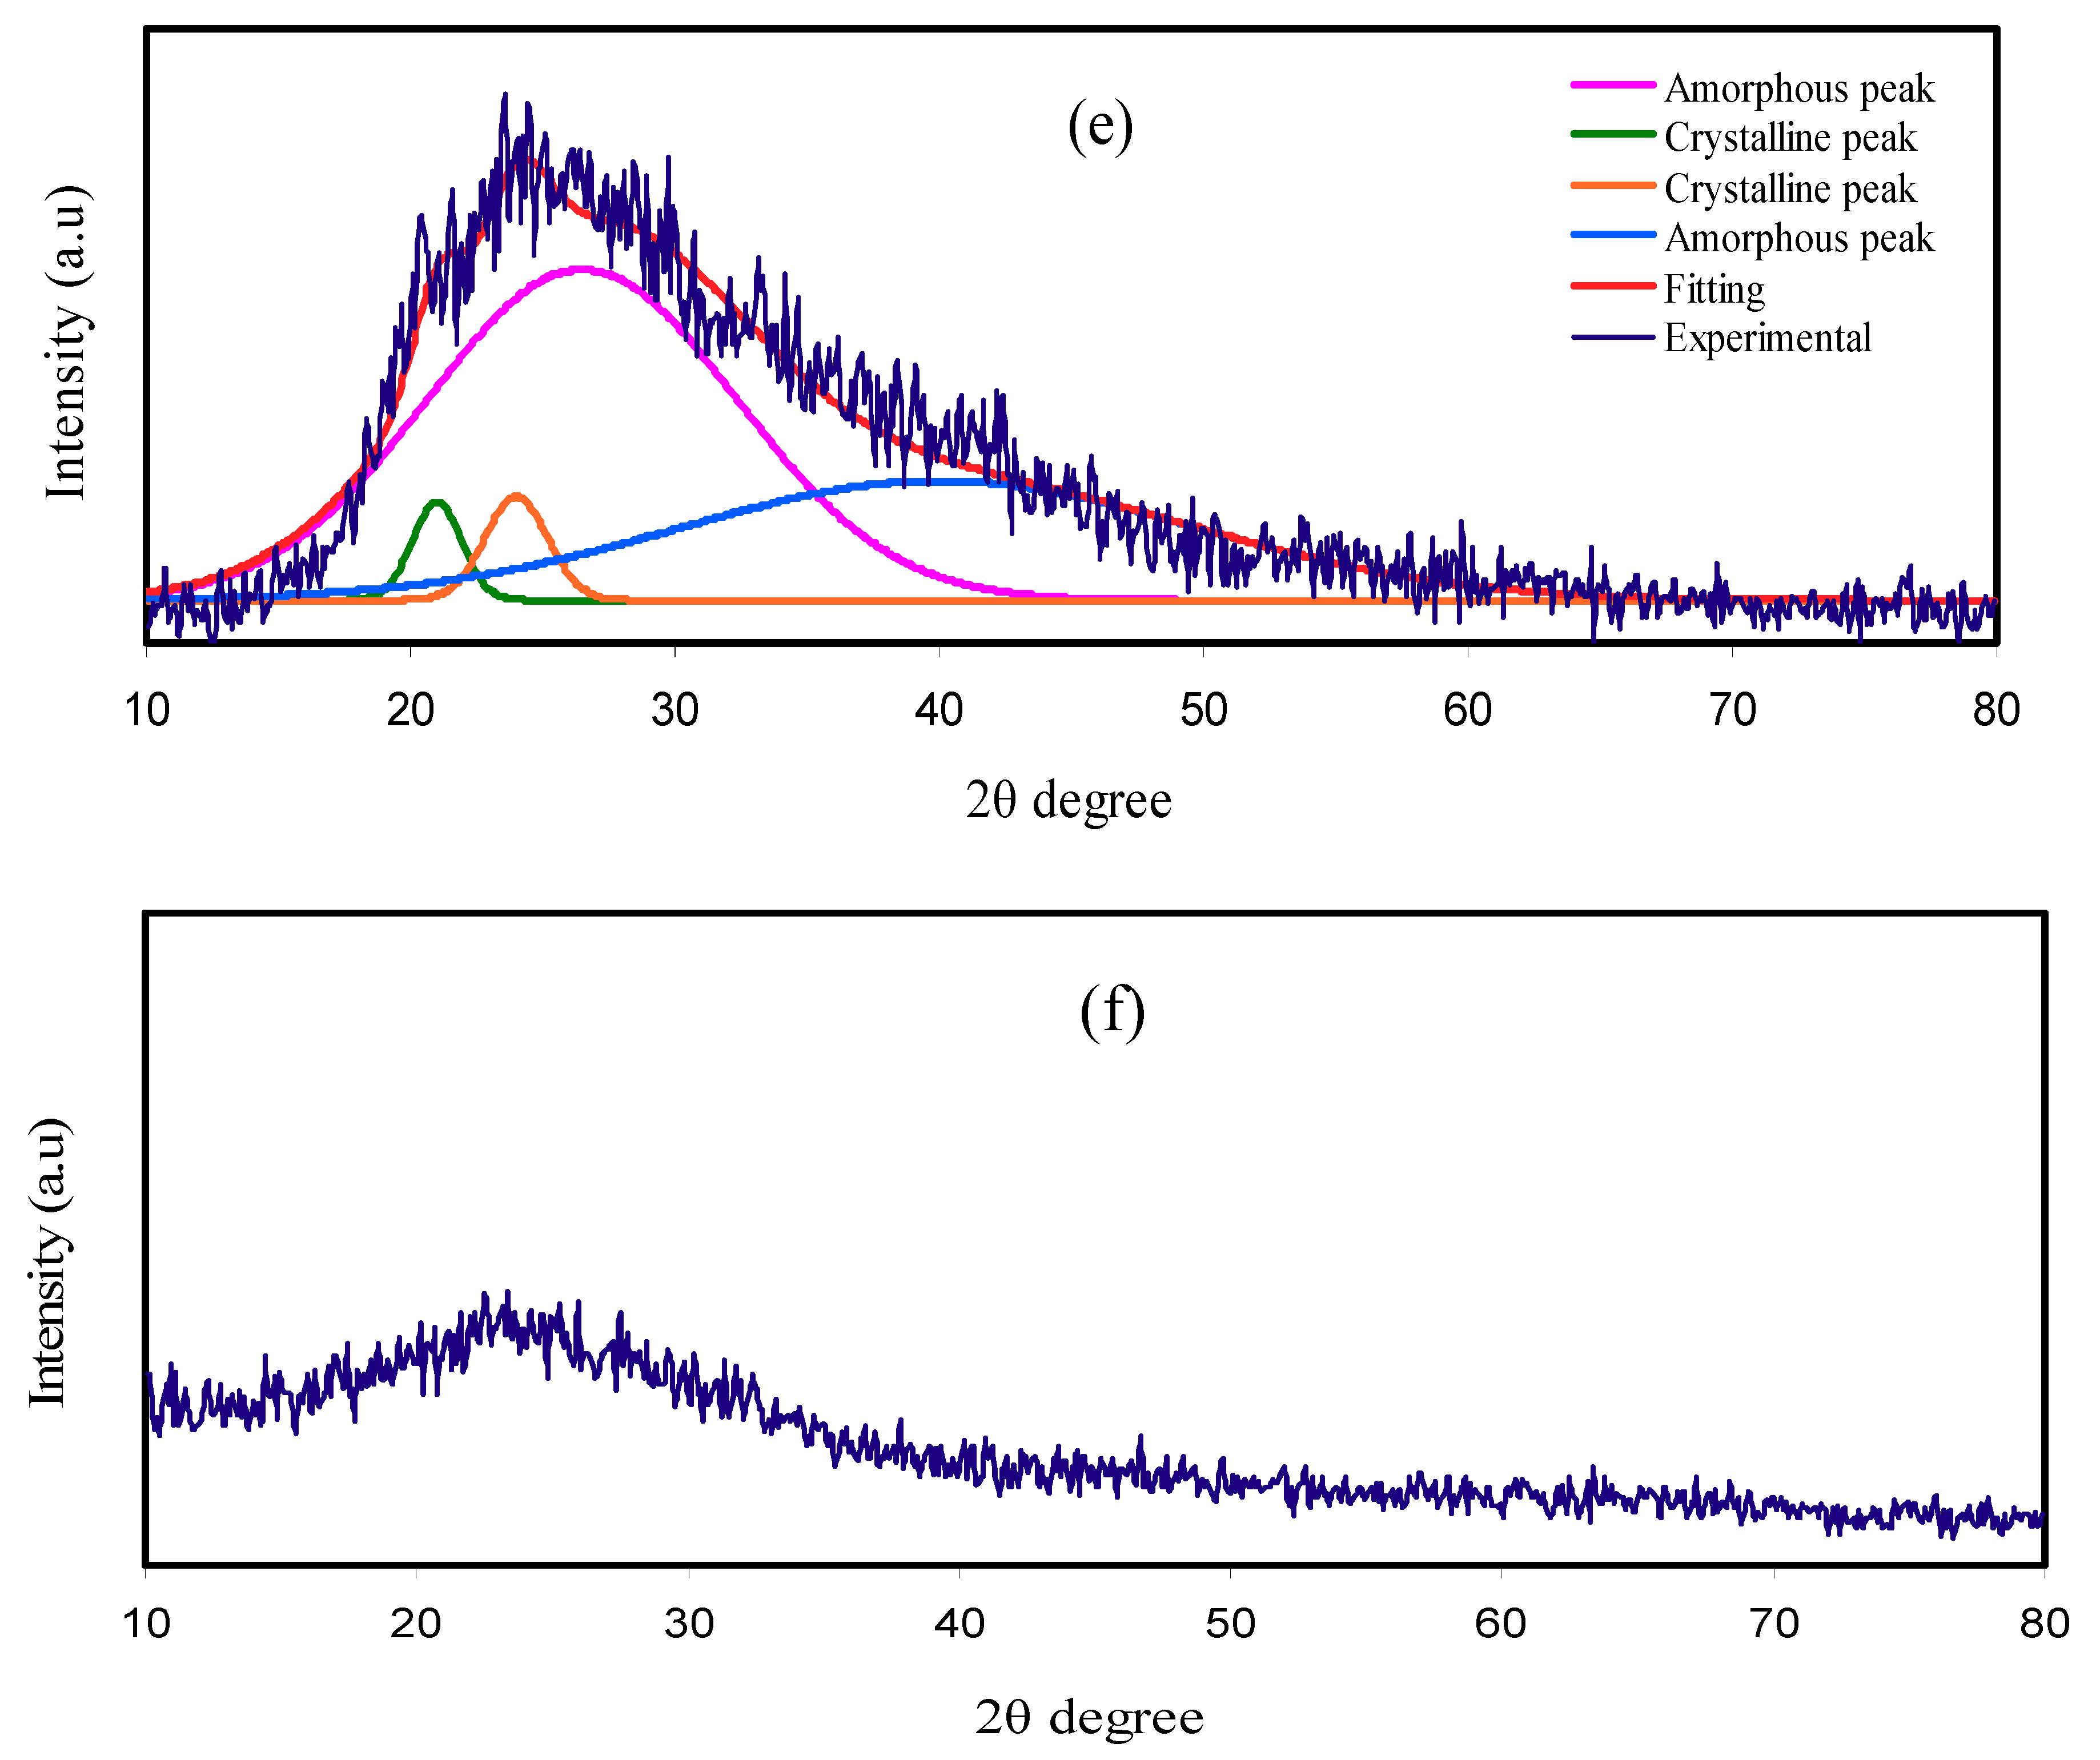
3.1. XRD Analysis
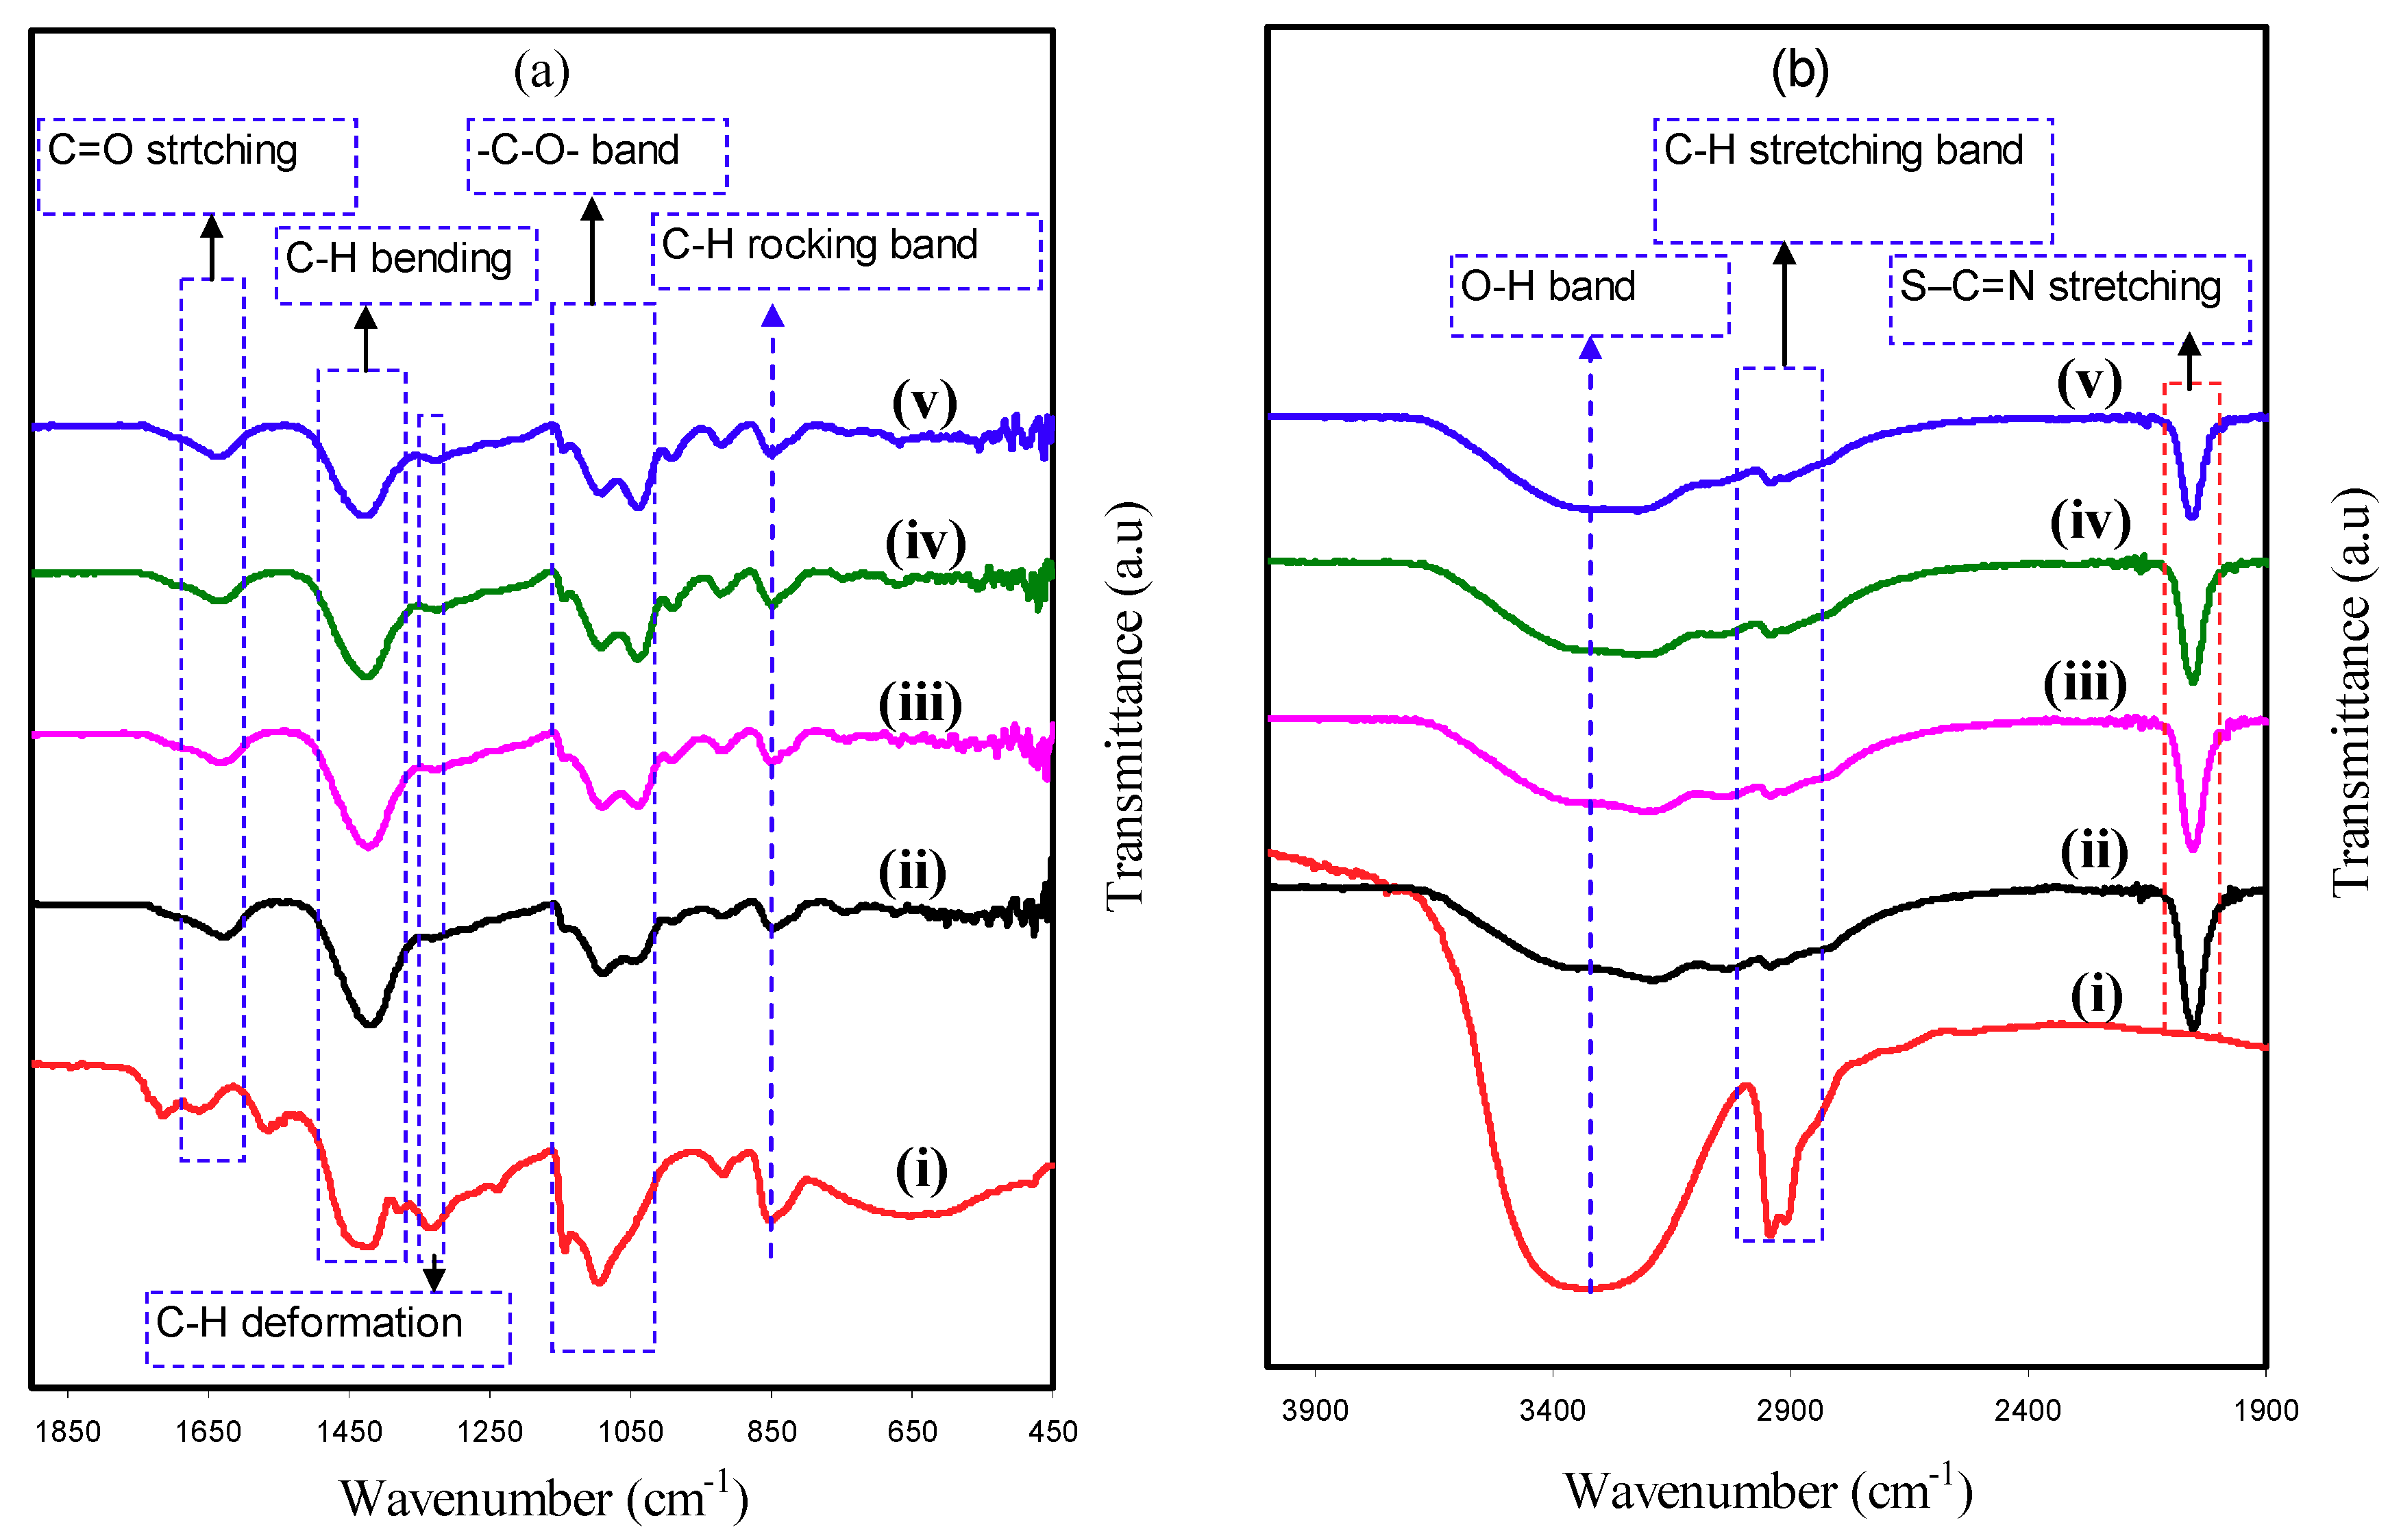
3.2. FTIR Analysis
3.3. Morphological Study
3.4. Impedance Analysis
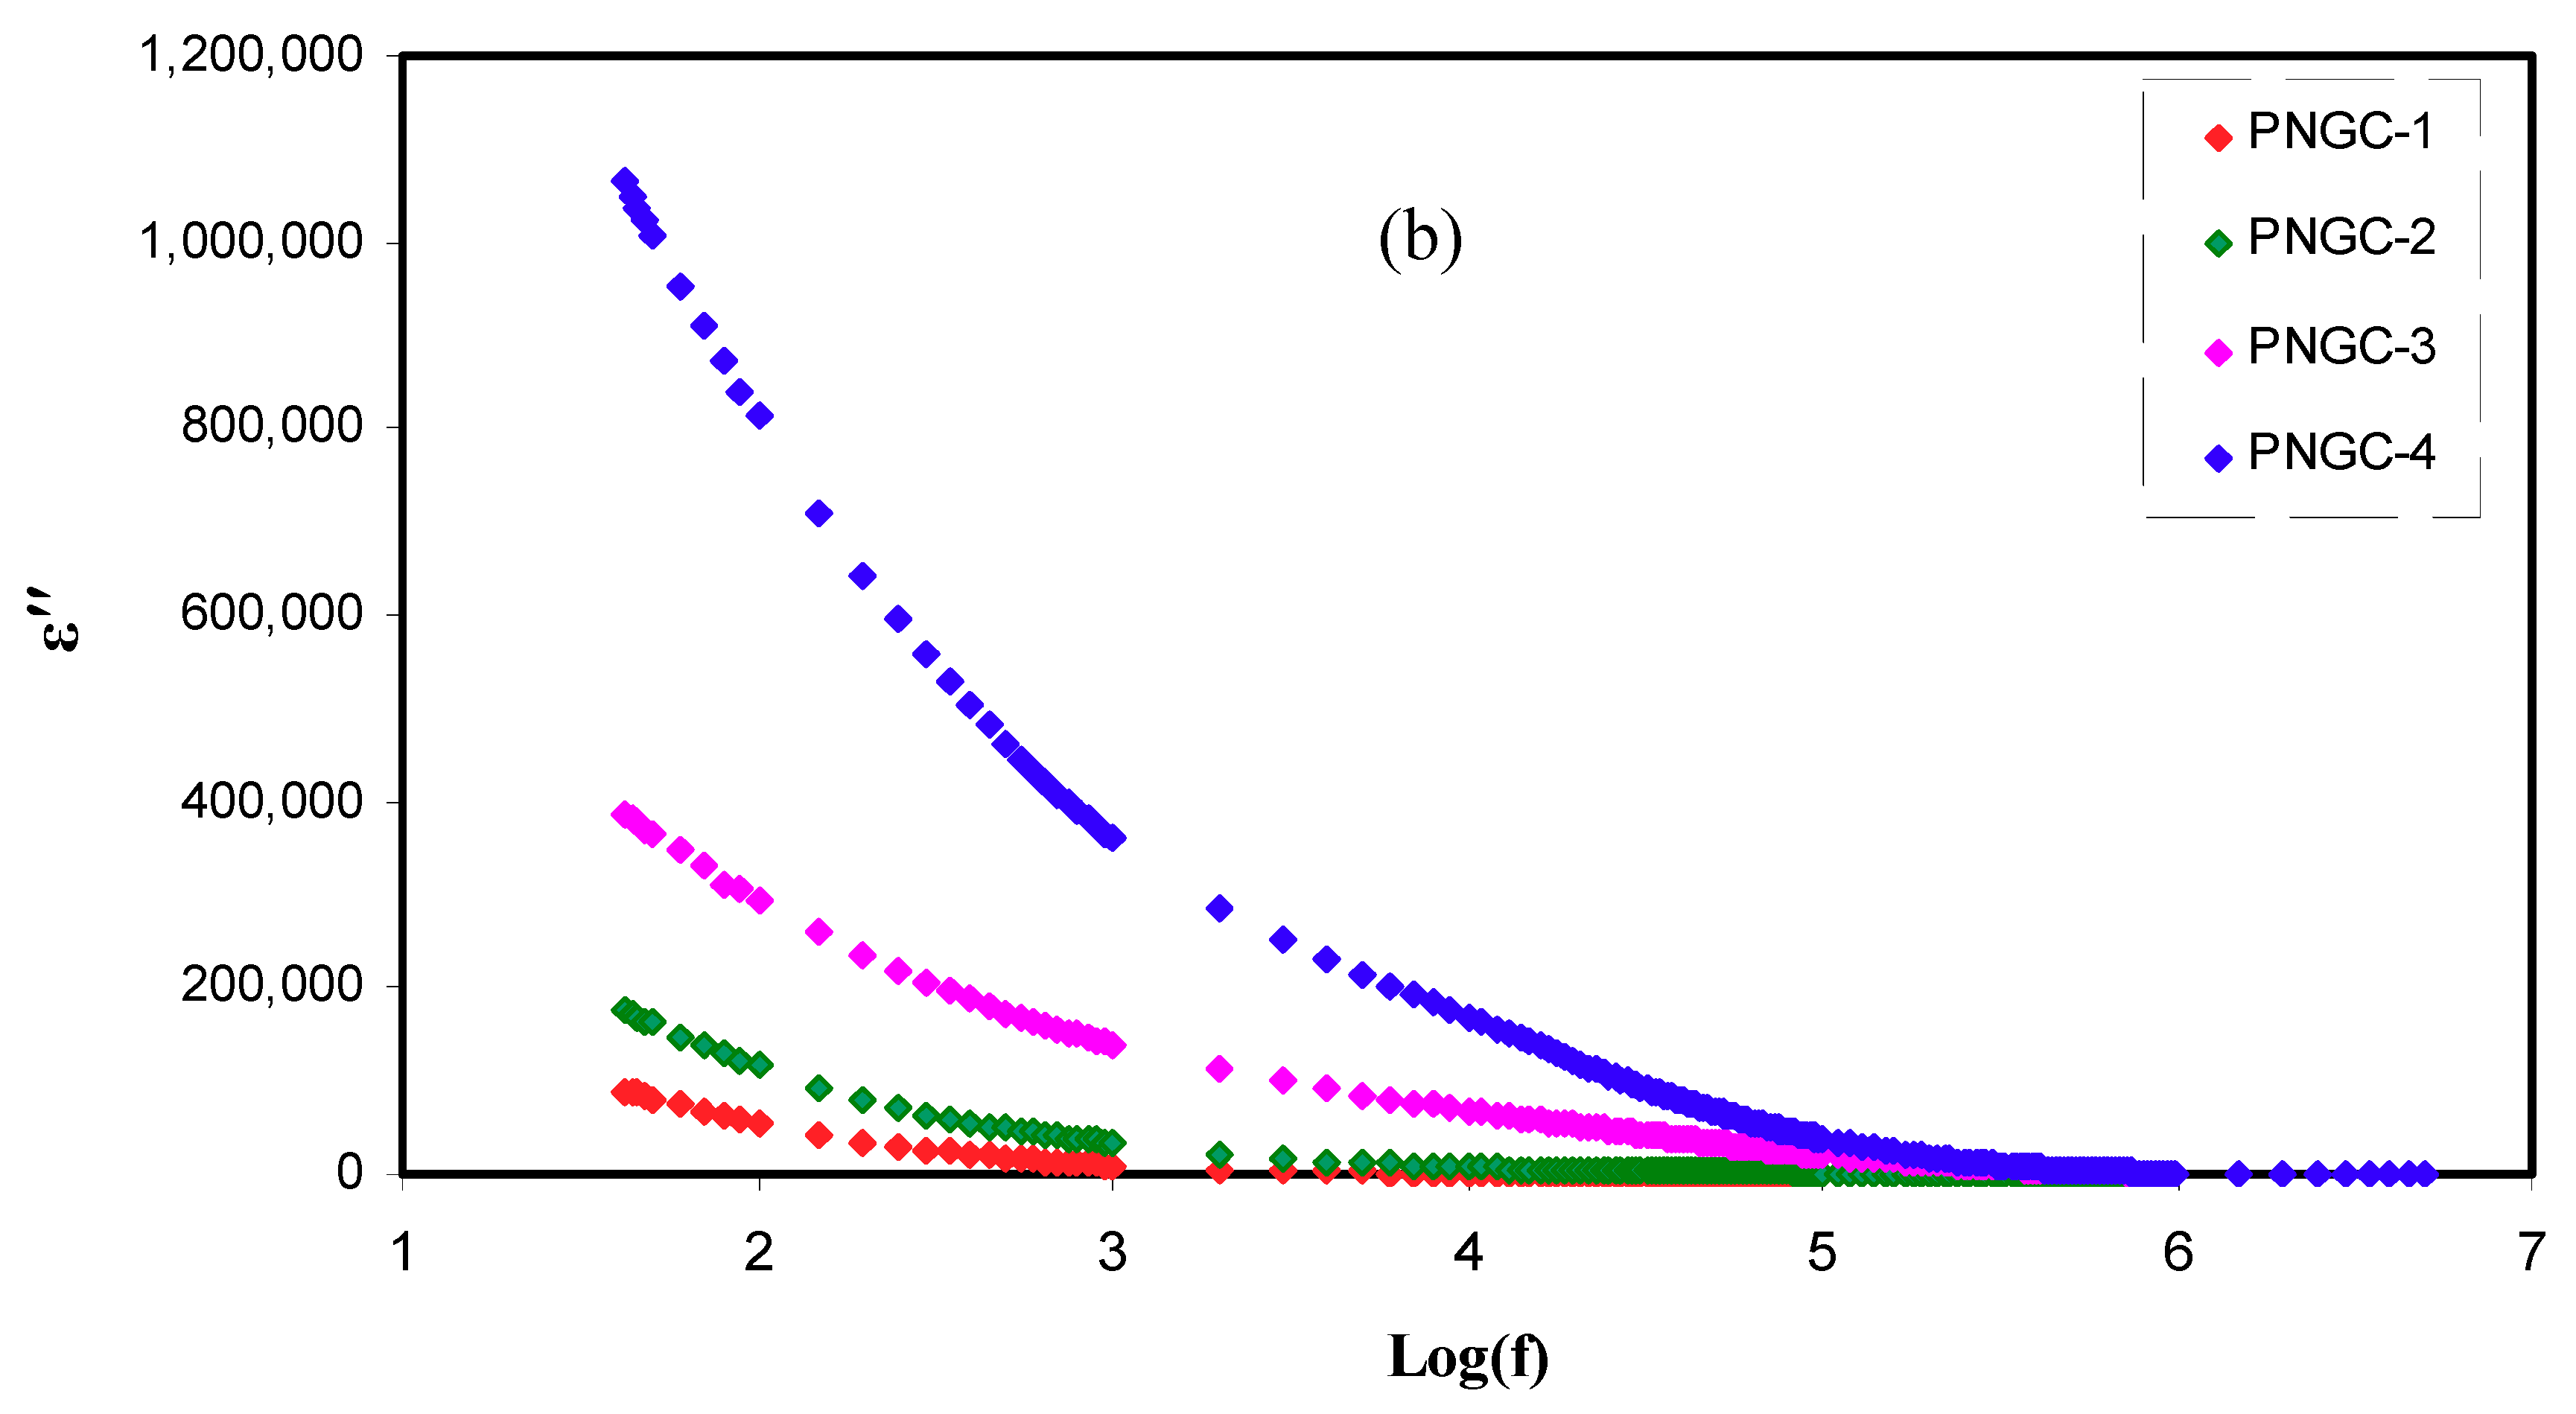
3.5. Dielectric Studies
3.6. EDLC Characteristics
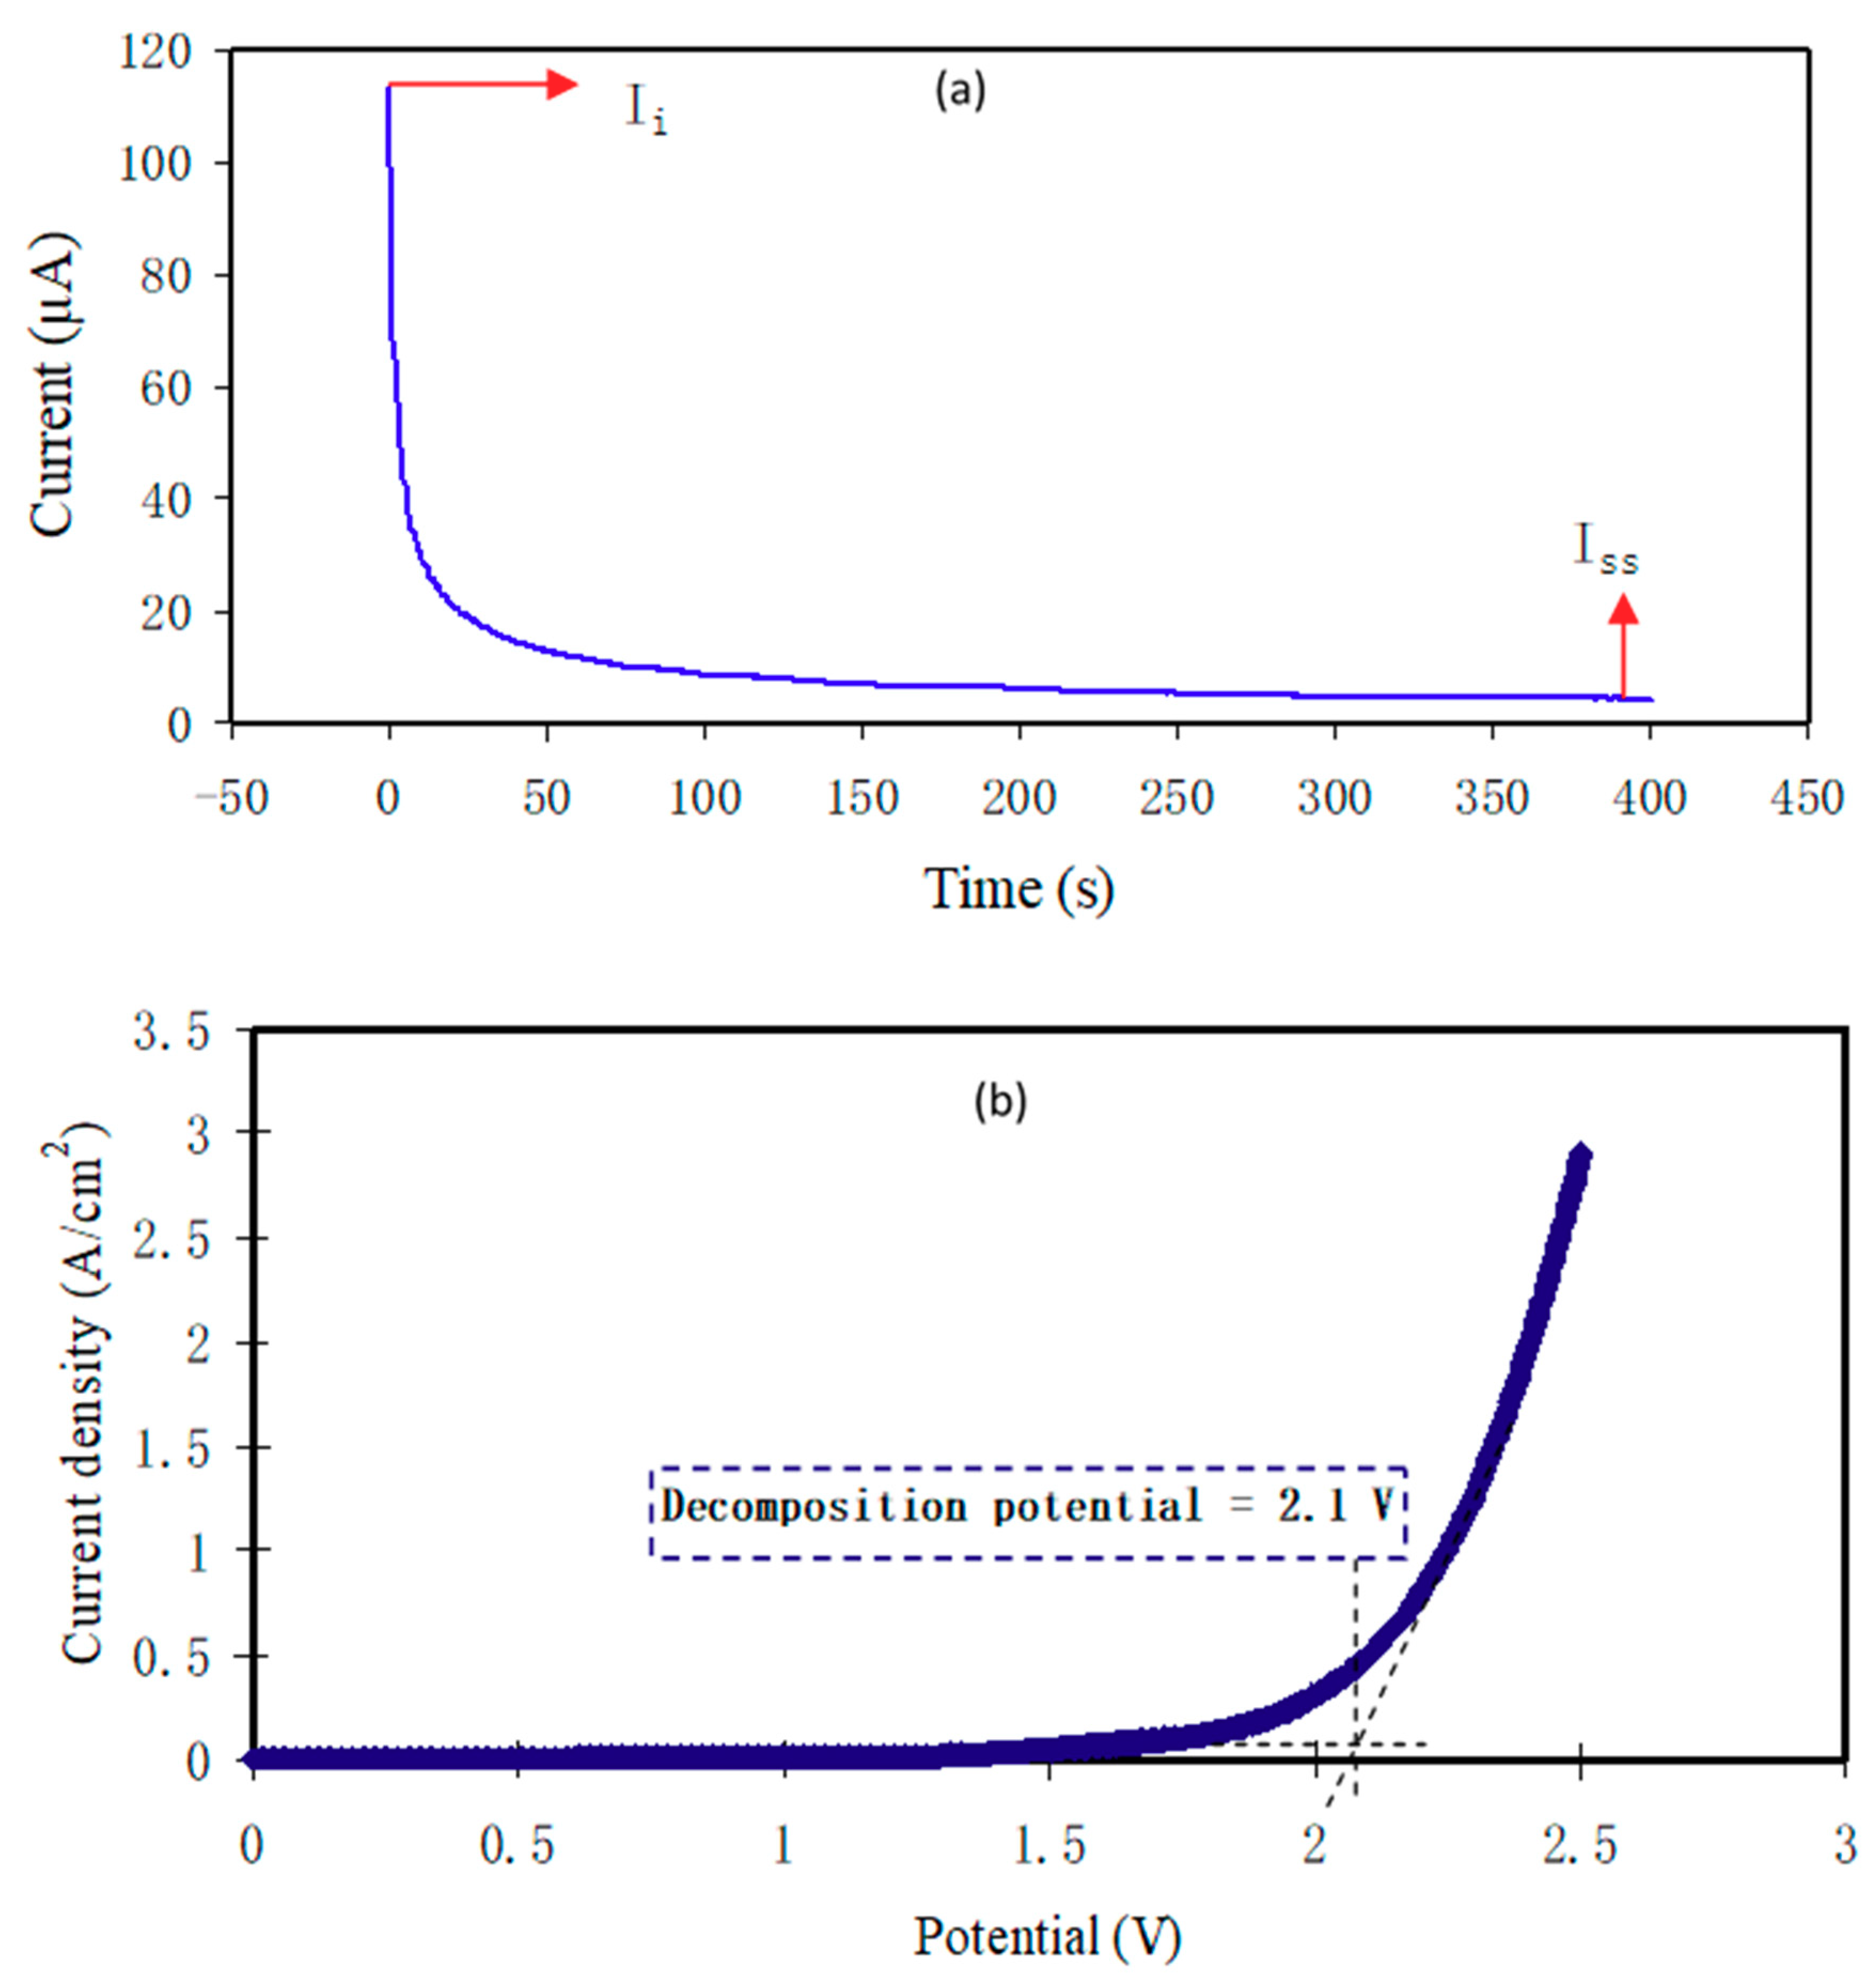
3.6.1. Transference Number Measurement
3.6.2. Electrochemical Stability Study
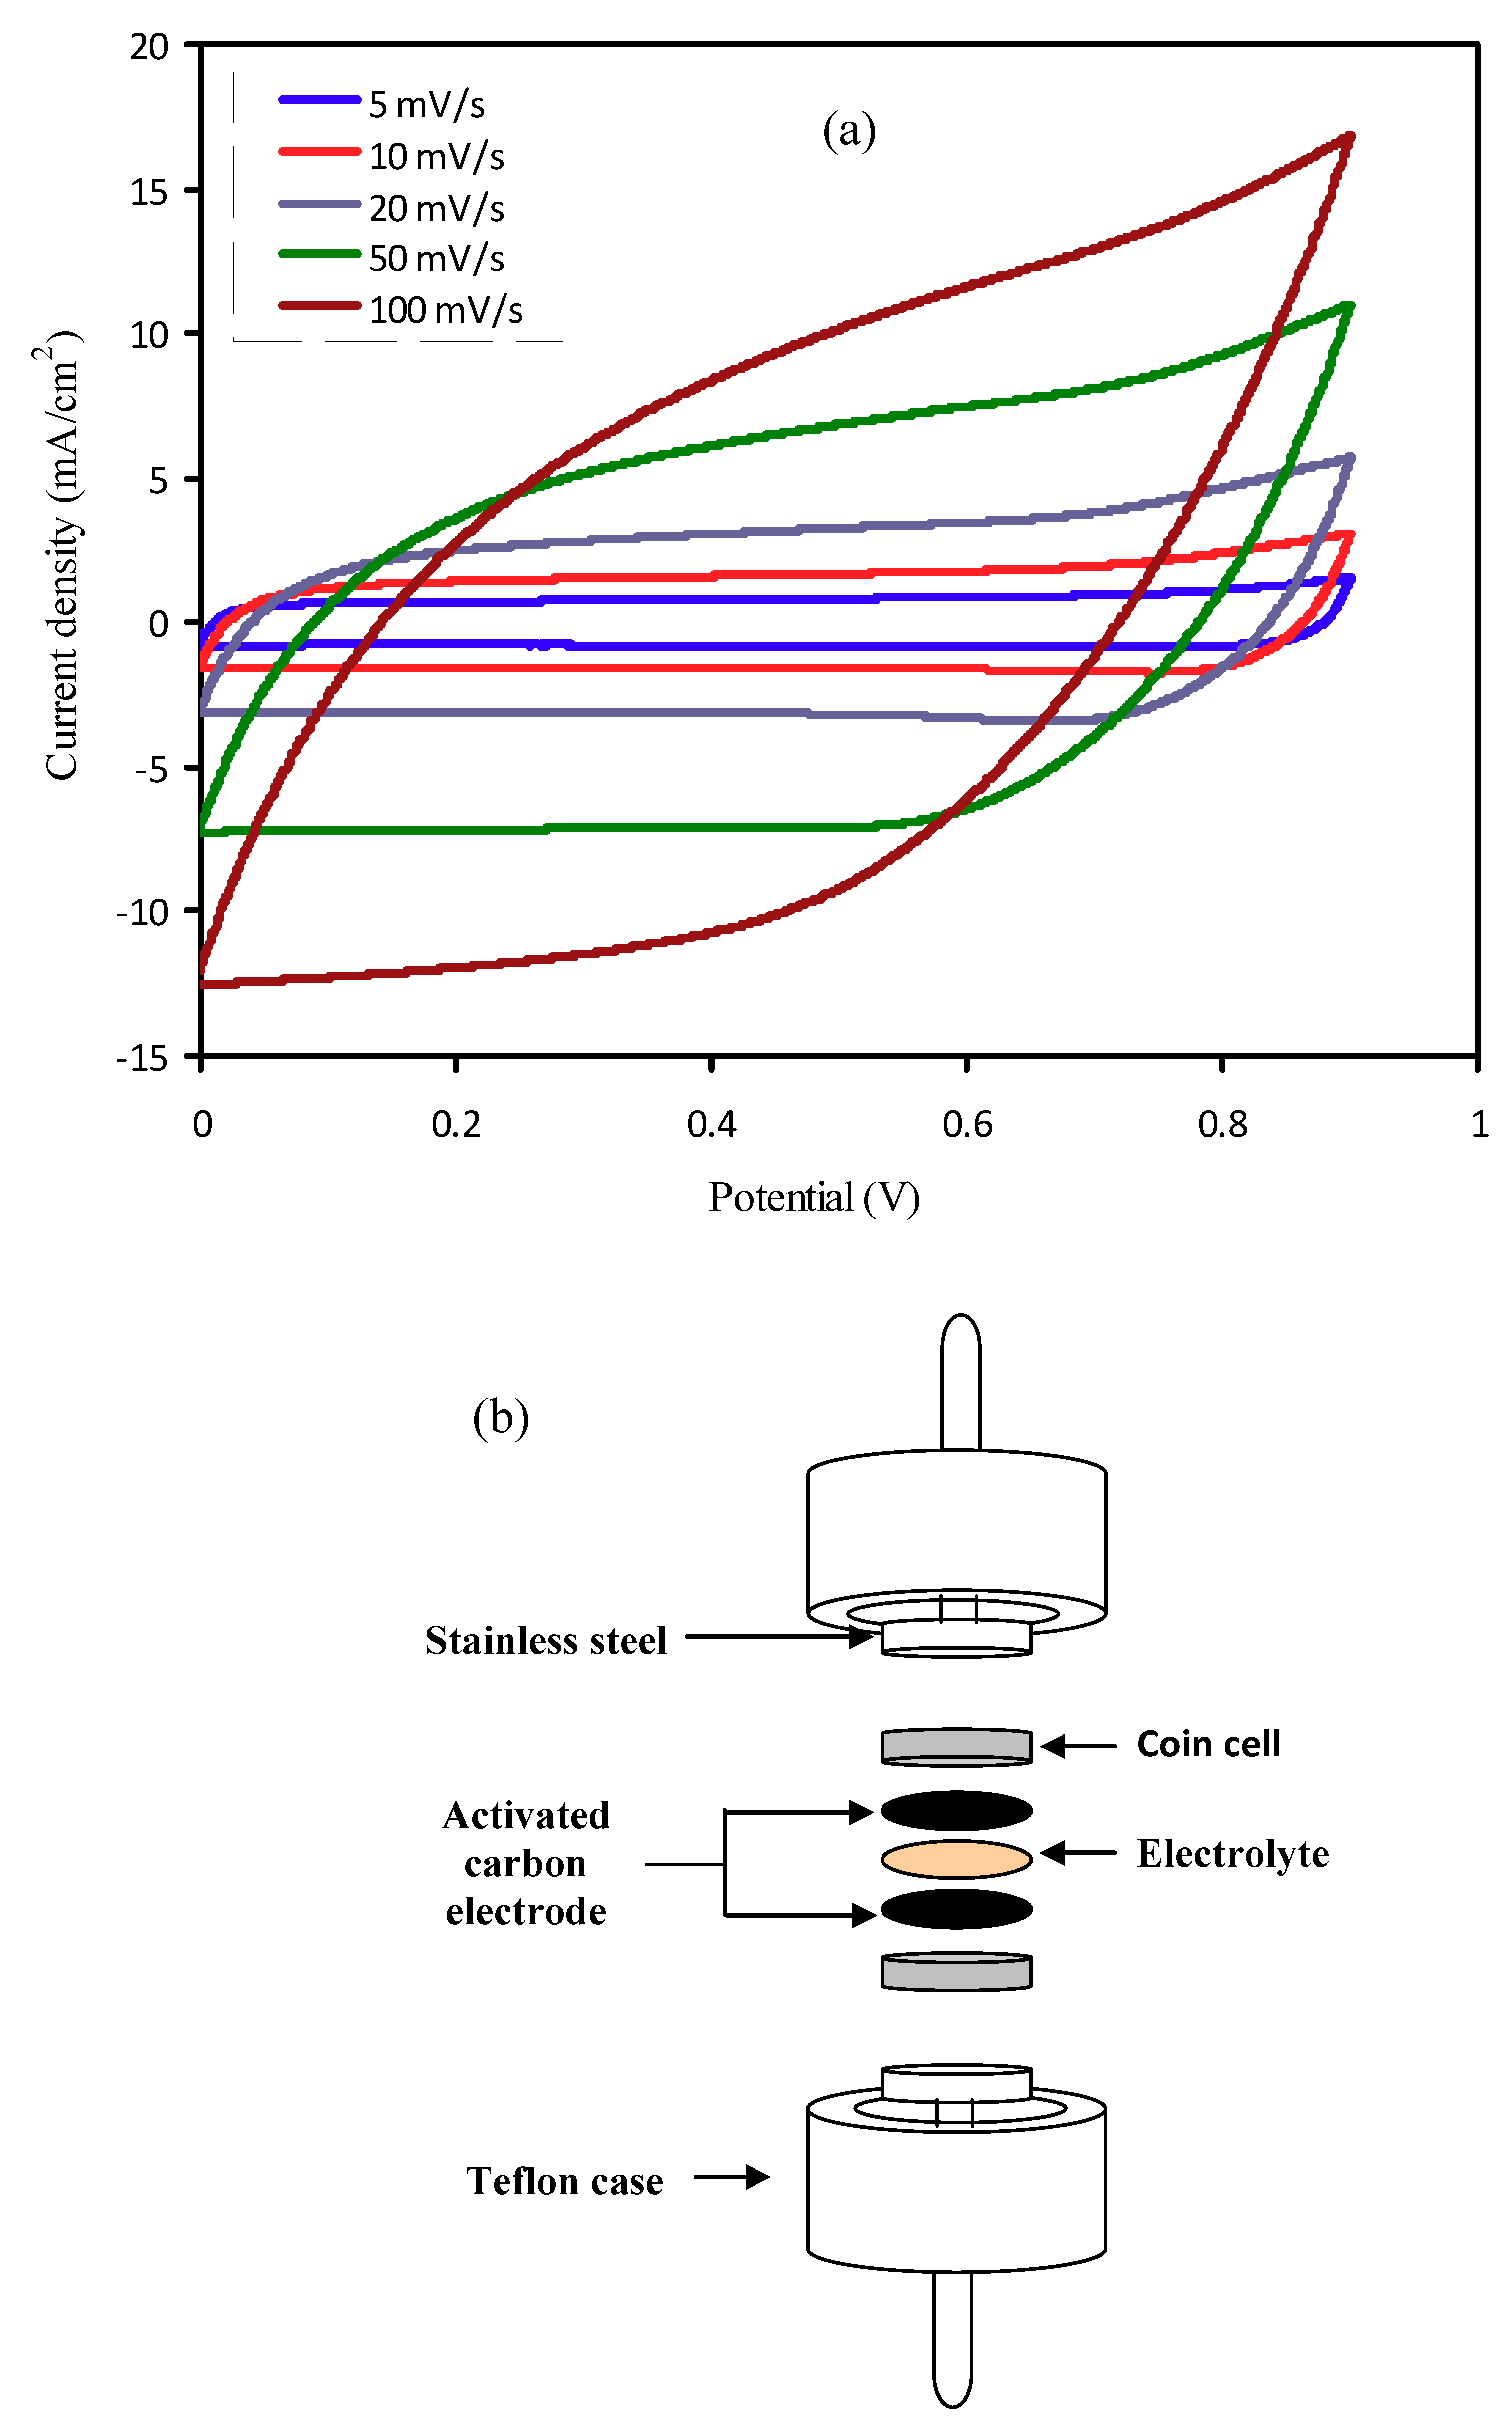
3.6.3. Cyclic Voltammetry Study
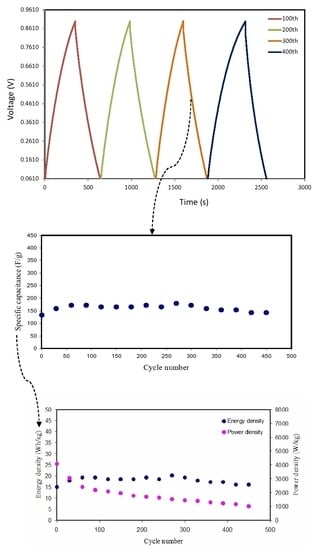
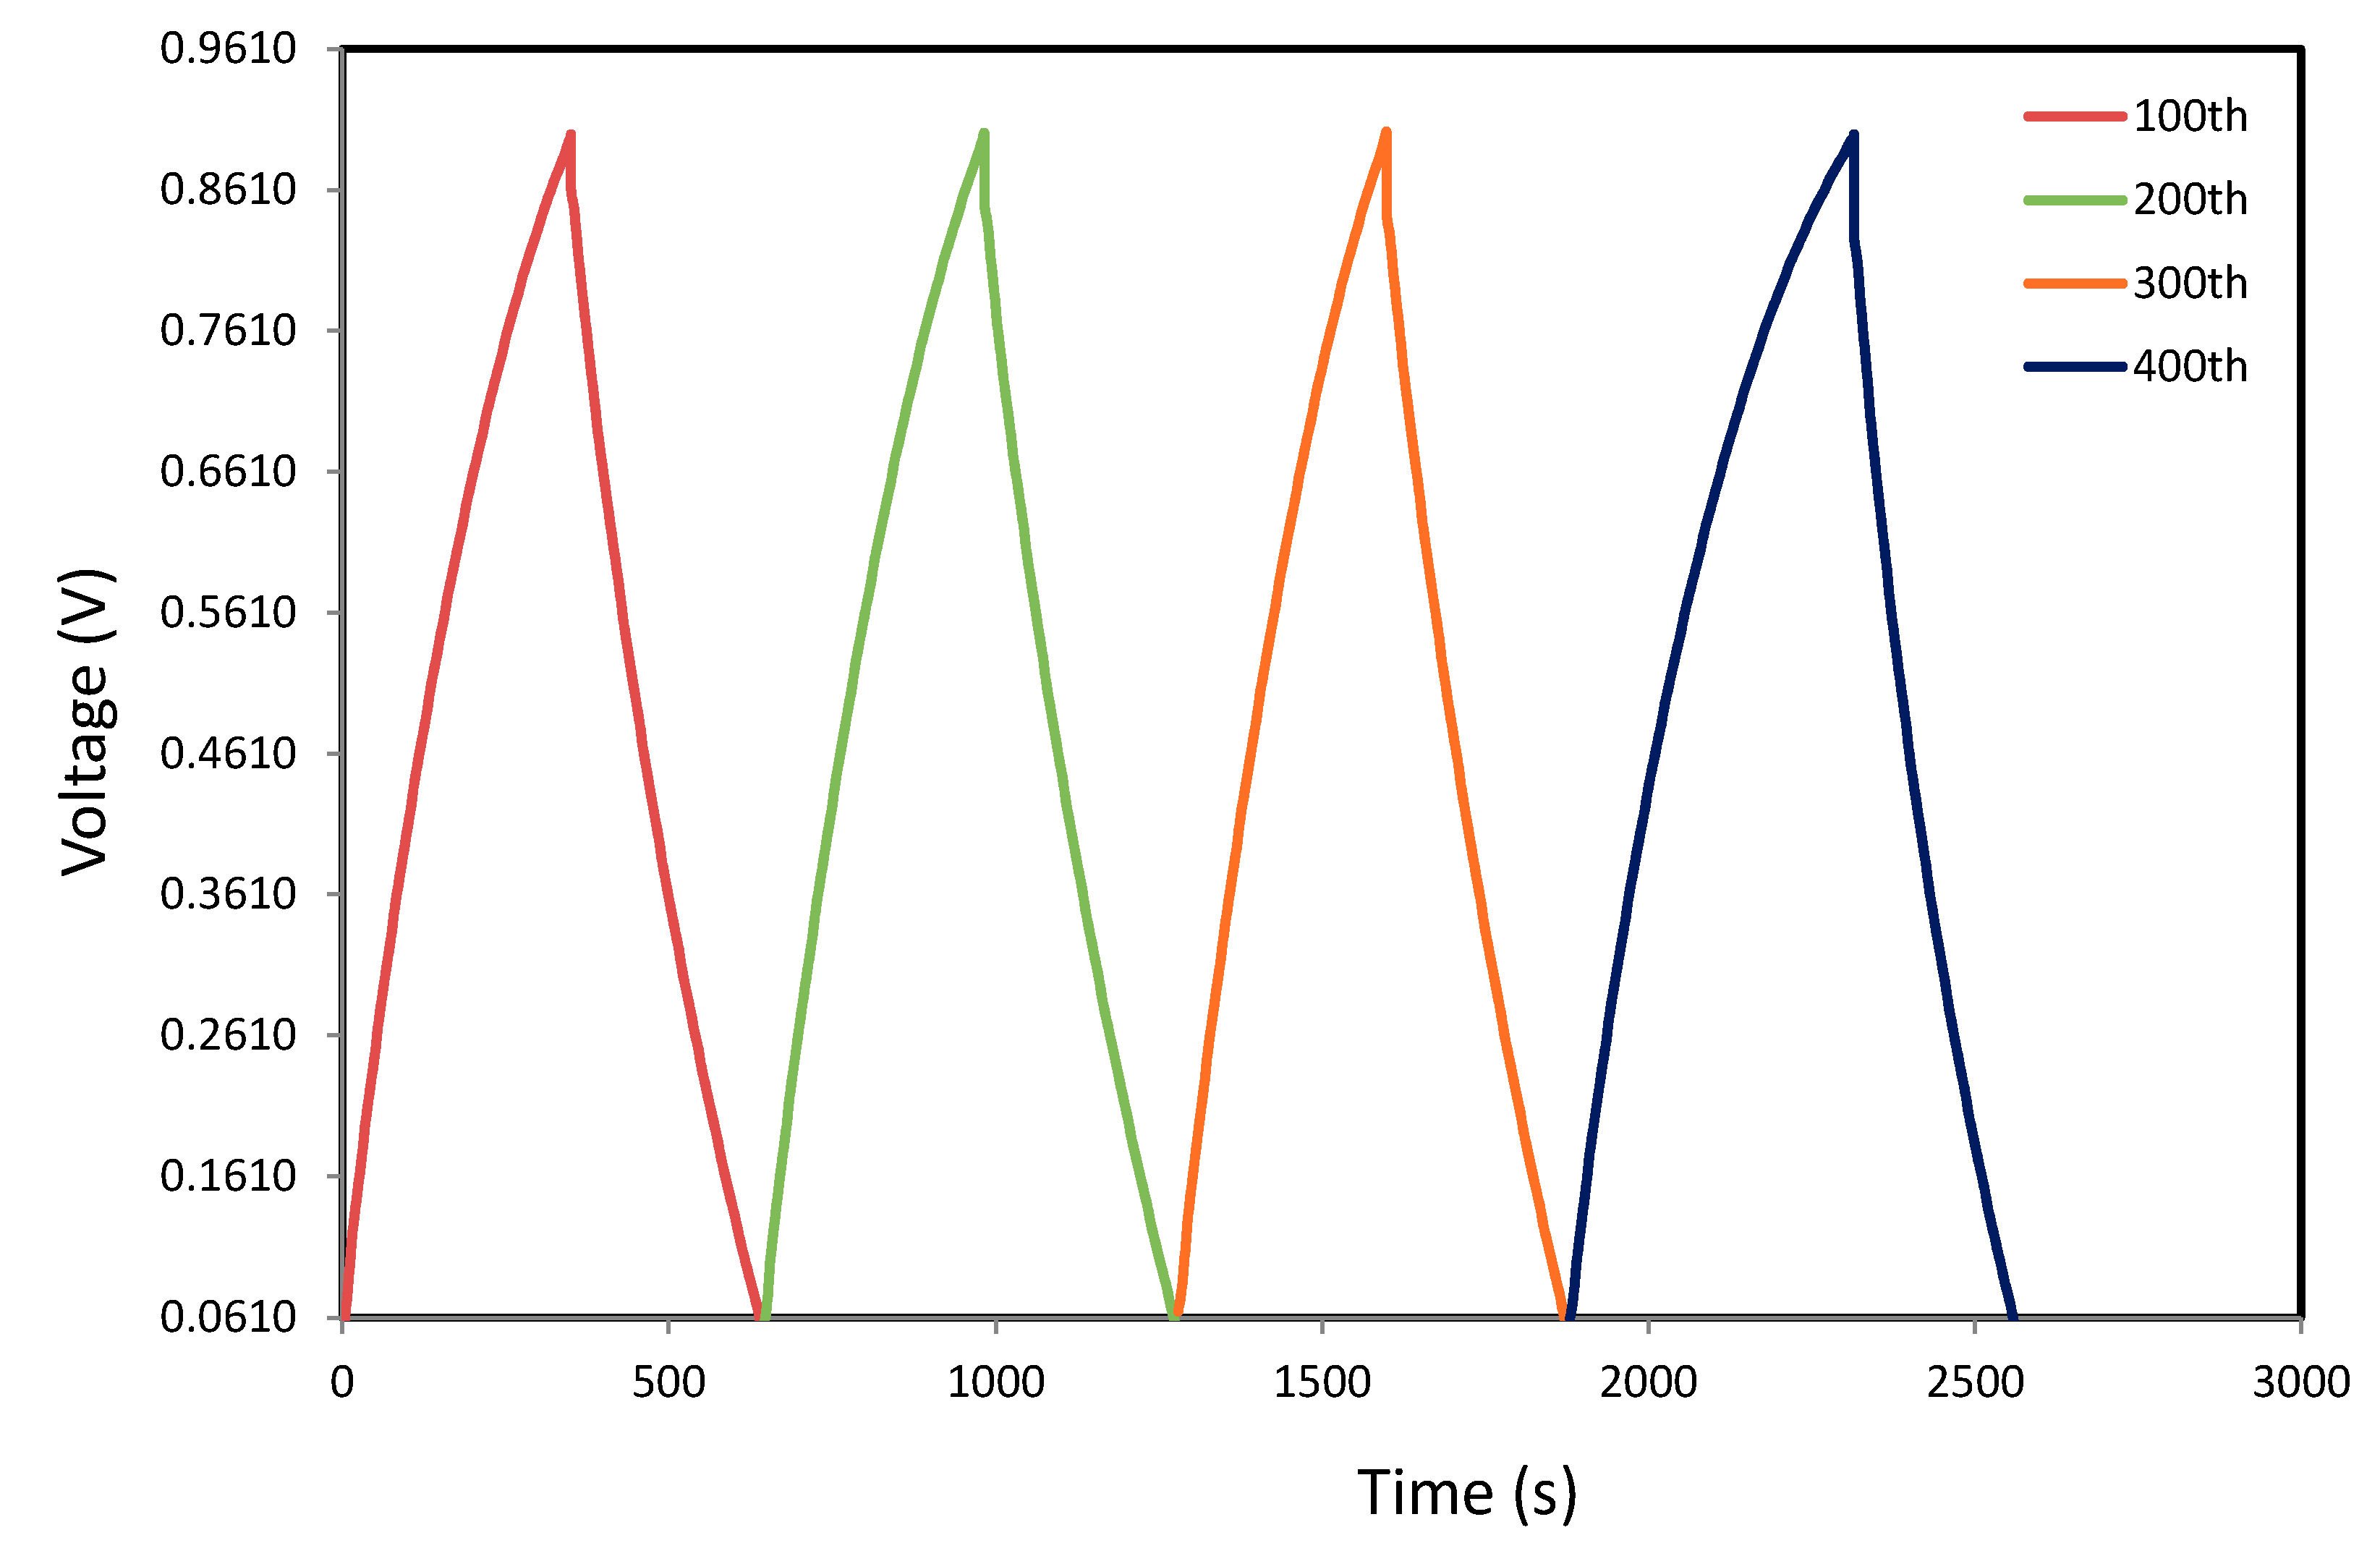
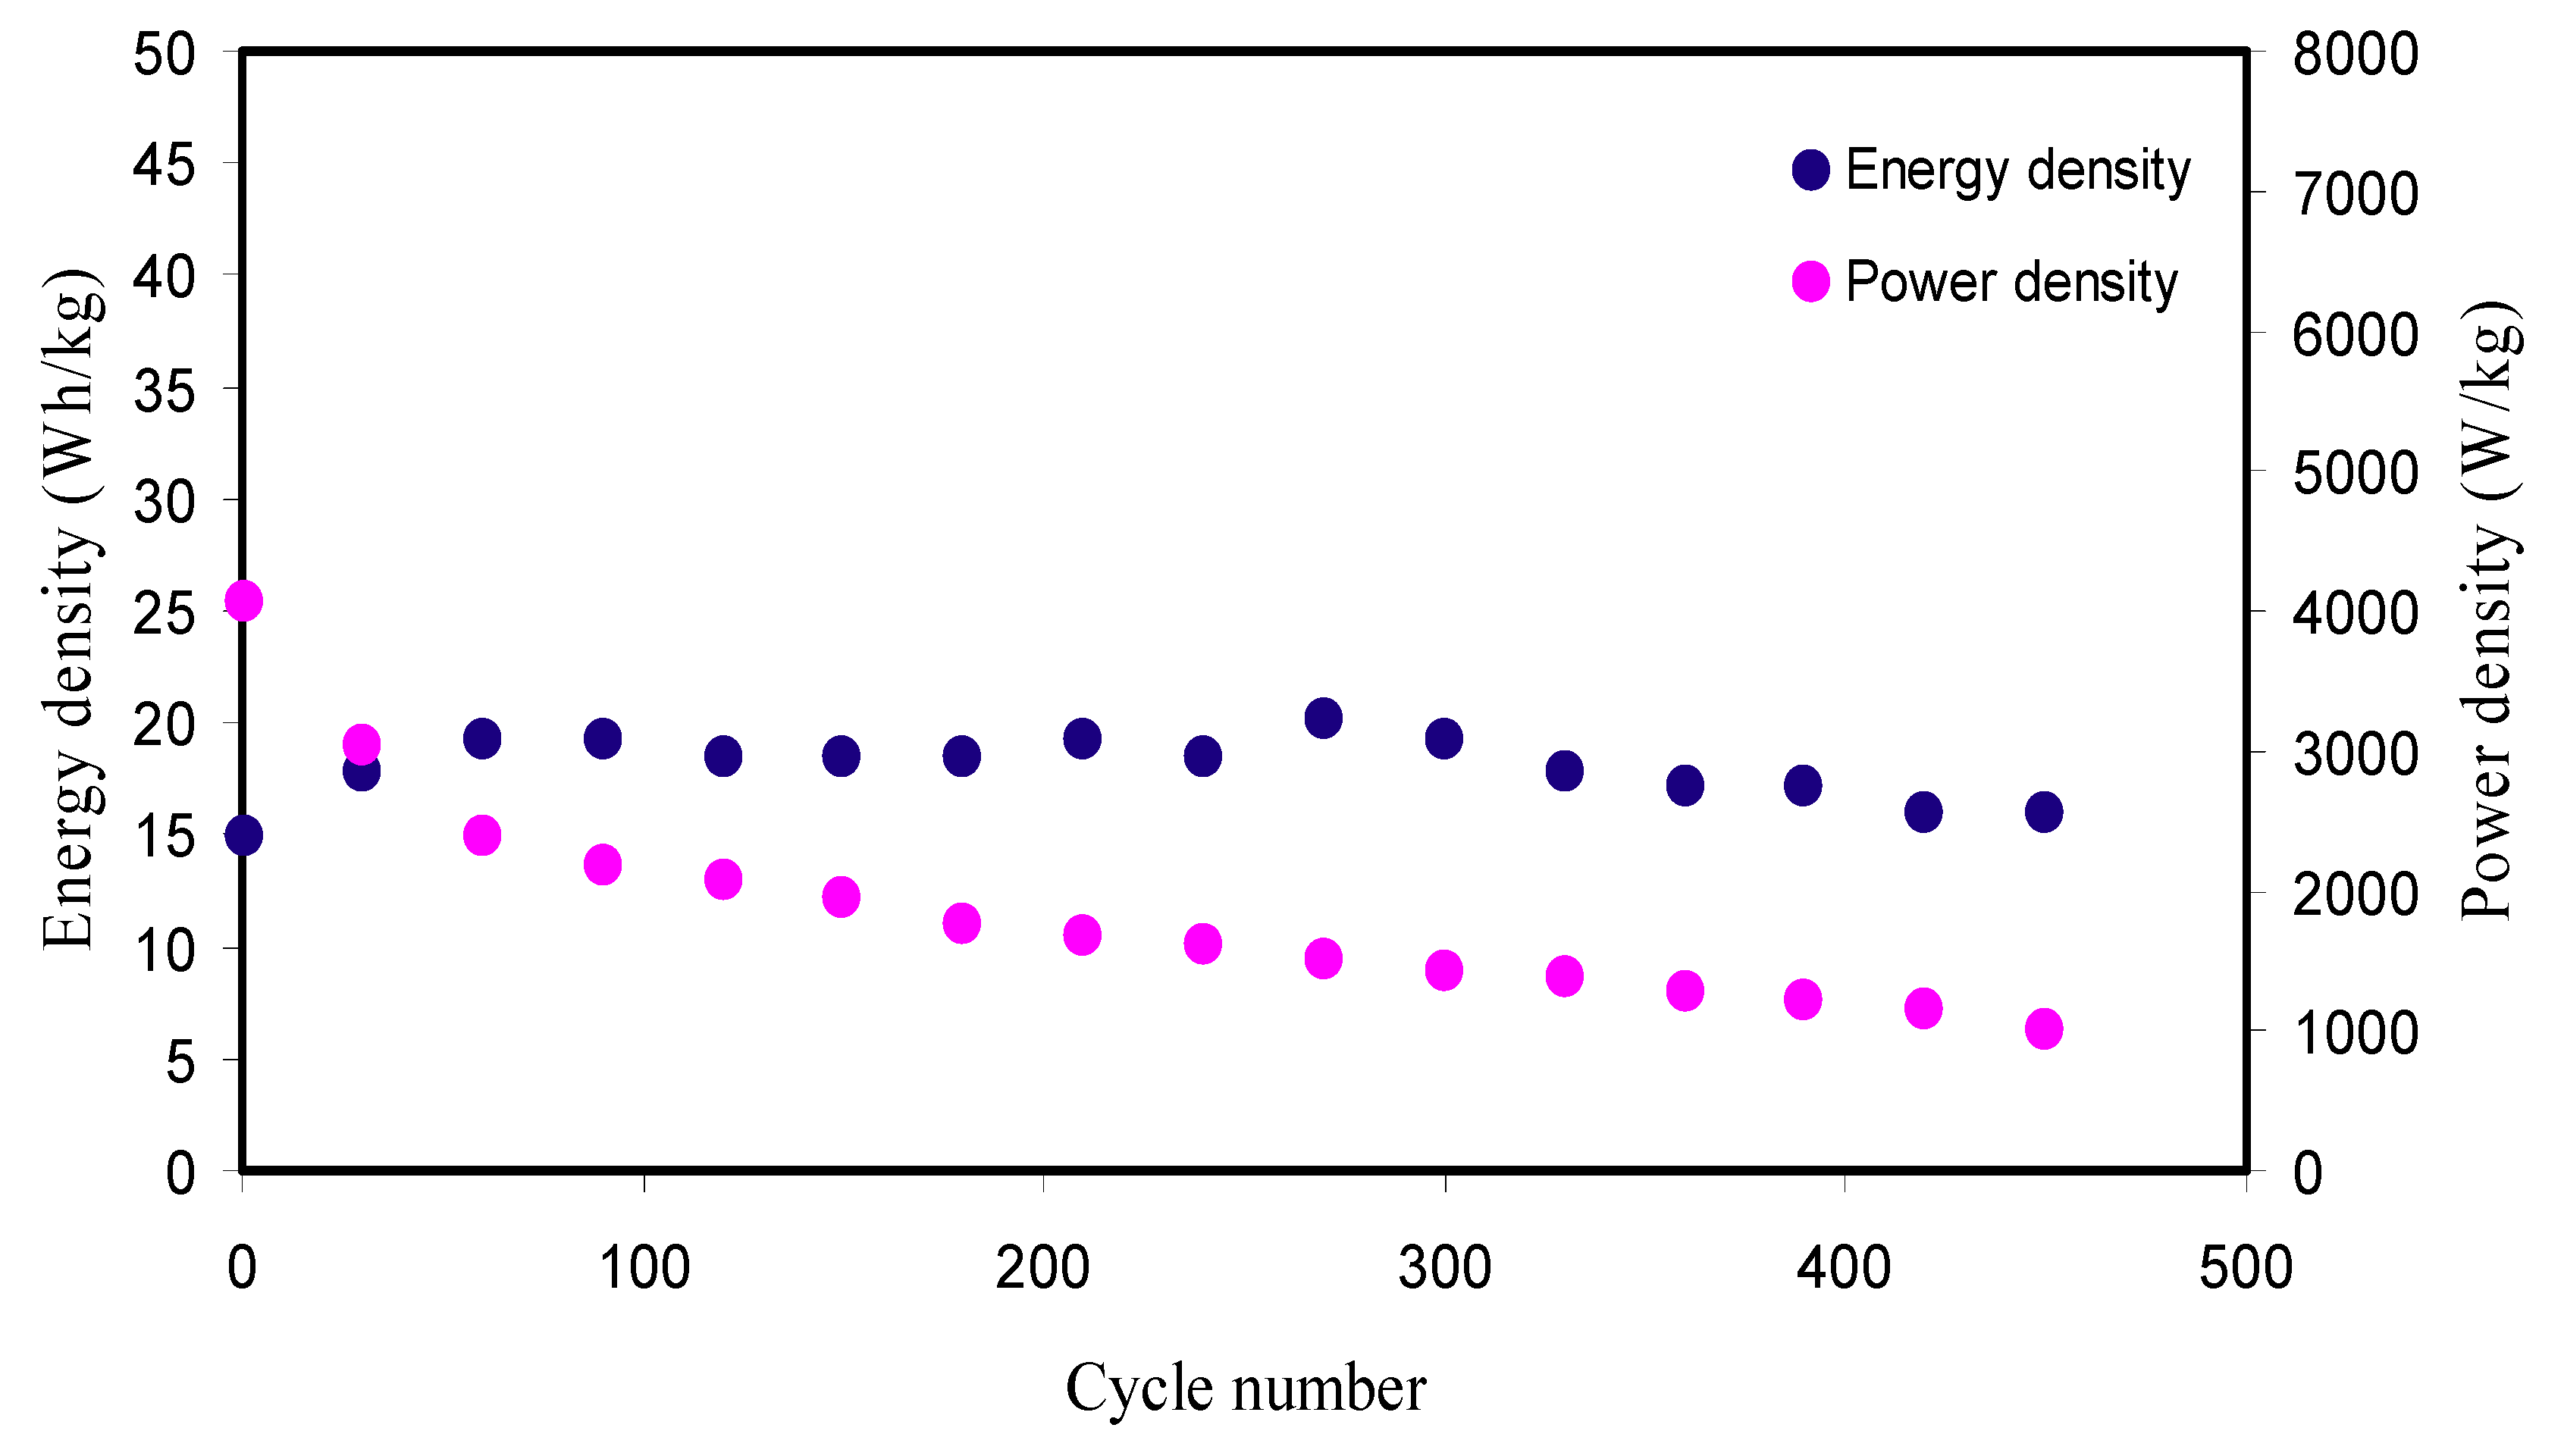
3.7. Galvanostatic Charge–discharge Analyses
4. Conclusions
Author Contributions
Funding
Acknowledgments
Conflicts of Interest
References
- Ali, A.M.M.; Mohamed, N.S.; Arof, A.K. Polyethylene oxide PEO–ammonium sulfate ((NH4)2SO4) complexes and electrochemical cell performance. J. Power Sources 1998, 74, 135–141. [Google Scholar] [CrossRef]
- Asnawi, A.S.F.M.; Aziz, S.B.; Nofal, M.M.; Yusof, Y.M.; Brevik, I.; Hamsan, M.H.; Brza, M.A.; Abdulwahid, R.T.; Kadir, M.F.Z. Metal complex as a novel approach to enhance the amorphous phase and improve the EDLC performance of plasticized proton conducting chitosan-based polymer electrolyte. Membranes 2020, 10, 132. [Google Scholar] [CrossRef] [PubMed]
- Raj, C.J.; Varma, K.B.R. Synthesis and electrical properties of the (PVA)0.7(KI)0.3•xH2SO4 (0 ≤ x ≤ 5) polymer electrolytes and their performance in a primary Zn/MnO2 battery. Electrochim. Acta 2010, 5, 649–656. [Google Scholar] [CrossRef]
- Yan, S.; Zeng, S.; Su, X.; Yin, H.; Xiong, Y.; Xu, W. H3PO4-doped 1,2,4-triazole-polysiloxane proton conducting membrane prepared by sol–gel method. Solid State Ion. 2011, 198, 1–5. [Google Scholar] [CrossRef]
- Hema, M.; Selvasekarapandian, S.; Sakunthala, A.; Arunkumar, D.; Nithya, H. Structural, vibrational and electrical characterization of PVA-NH4Br polymer electrolyte system. Phys. B Condens. Matter 2008, 403, 2740–2747. [Google Scholar] [CrossRef]
- Woo, H.J.; Arof, A.K. Vibrational studies of flexible solid polymer electrolyte based on PCL–EC incorporated with proton conducting NH4SCN. Spectrochim. Acta A Mol. Biomol. Spectrosc. 2016, 161, 44–51. [Google Scholar] [CrossRef]
- Hemalatha, R.; Alagar, M.; Selvasekarapandian, S.; Sundaresan, B.; Moniha, V. Studies of proton conducting polymer electrolyte based on PVA, amino acid proline and NH4SCN. J. Sci. Adv. Mater. Devices 2019. [Google Scholar] [CrossRef]
- Kubota, S.; Ozaki, S.; Onishi, J.; Kano, K.; Shiral, O. Selectivity on Ion Transport across Bilayer Lipid Membranes in the Presence of Gramicidin, A. Anal. Sci. 2009, 25, 189–193. [Google Scholar] [CrossRef] [Green Version]
- Su’ait, M.S.; Ahmad, A.; Badri, K.H.; Mohamed, N.S.; Rahman, M.Y.A.; Ricardo, C.L.A. The potential of polyurethane bio-based solid polymer electrolyte for photo electrochemical cell application. Int. J. Hydrog. Energy 2014, 39, 3005–3017. [Google Scholar] [CrossRef]
- Nadiah, N.S.; Omar, F.S.; Numan, A.; Mahipal, Y.K.; Ramesh, S.; Ramesh, K. Influence of acrylic acid on ethylene carbonate/dimethyl carbonate based liquid electrolyte and its supercapacitor application. Int. J. Hydrogen Energy 2017, 42, 30683–30690. [Google Scholar] [CrossRef]
- Noor, N.A.M.; Isa, M.I.N. Investigation on transport and thermal studies of solid polymer electrolyte based on carboxymethyl cellulose doped ammonium thiocyanate for potential application in electrochemical devices. Int. J. Hydrogen Energy 2019, 44, 8298–8306. [Google Scholar] [CrossRef]
- Ahmed, F.; Sutradhar, S.C.; Ryu, T.; Jang, H.; Choi, K.; Yang, H. Comparative study of sulfonated branched and linear poly(phenylene)s polymer electrolyte membranes for fuel cells. Int. J. Hydrog. Energy 2018, 43, 5374–5385. [Google Scholar] [CrossRef]
- Hema, M.; Selvasekarapandian, S.; Arunkumar, D.; Sakunthala, A.; Nithya, H. FTIR, XRD and ac impedance spectroscopic study on PVA based polymer electrolyte doped with NH4X (X = Cl, Br, I). J. Non-Cryst. Solids 2009, 355, 84–90. [Google Scholar] [CrossRef]
- Brza, M.A.; Aziz, S.B.; Anuar, H.; Al Hazza, M.H.F. From Green Remediation to Polymer Hybrid Fabrication with Improved Optical Band Gaps. Int. J. Mol. Sci. 2019, 20, 3910. [Google Scholar] [CrossRef] [PubMed] [Green Version]
- Pawlicka, A.; Danczuk, M.; Wieczorek, W.; Zygadło-Monikowska, E. Influence of plasticizer type on the properties of polymer electrolytes based on chitosan. J. Phys. Chem. A 2008, 112, 8888–8895. [Google Scholar] [CrossRef]
- Shukur, M.F.; Yusof, Y.M.; Zawawi, S.M.M.; Illias, H.A.; Kadir, M.F.Z. Conductivity and transport studies of plasticized chitosan based proton conducting biopolymer electrolytes. Phys. Scr. 2013, 157, 014050–014055. [Google Scholar] [CrossRef]
- Amran, N.N.A.; Manan, N.S.A.; Kadir, M.F.Z. The effect of LiCF3SO3 on the complexation with potato starch-chitosan blend polymer electrolytes. Ionics 2016, 22, 1647–1658. [Google Scholar] [CrossRef]
- Karaman, B.; Bozkurt, A. Enhanced performance of supercapacitor based on boric acid doped PVA-H2SO4 gel polymer electrolyte system. Int. J. Hydrogen Energy 2018, 43, 6229–6237. [Google Scholar] [CrossRef]
- Liew, C.-W.; Ramesh, S.; Arof, A.K. Characterization of ionic liquid added poly(vinyl alcohol)-based proton conducting polymer electrolytes and electrochemical studies on the supercapacitors. Int. J. Hydrogen Energy 2015, 40, 852–862. [Google Scholar] [CrossRef]
- Mirzaeian, M.; Abbas, Q.; Ogwu, A.; Hall, P.; Goldin, M.; Mirzaeian, M. Electrode and electrolyte materials for electrochemical capacitors. Int. J. Hydrogen Energy 2017, 42, 25565–25587. [Google Scholar] [CrossRef] [Green Version]
- Mundinamani, S. The choice of noble electrolyte for symmetric polyurethane-graphene composite supercapacitors. Int. J. Hydrogen Energy 2019, 44, 11240–11246. [Google Scholar] [CrossRef]
- Ahmed, S.F.M.A.; Shujahadeen, B.A.; Muaffaq, M.N.; Muhamad, H.H.; Mohamad, A.B.; Yuhanees, M.Y.; Rebar, T.A.; Saifful, K.M.; Mohd, F.Z.K. Glycerolized Li+ Ion Conducting Chitosan-Based Polymer Electrolyte for Energy Storage EDLC Device Applications with Relatively High Energy Density. Polymers 2020, 12, 1433. [Google Scholar] [CrossRef]
- Syahidah, S.N.; Majid, S.R. Super-capacitive electro-chemical performance of polymer blend gel polymer electrolyte (GPE) in carbon-based electrical double-layer capacitors. Electrochim. Acta 2013, 112, 678–685. [Google Scholar] [CrossRef]
- Zhao, X.-Y.; Wu, Y.; Cao, J.-P.; Zhuang, Q.-Q.; Wan, X.; He, S.; Wei, X.-Y. Preparation and Characterization of Activated Carbons from Oxygen-rich Lignite for Electric Double-layer Capacitor. Int. J. Electrochem. Sci. 2018, 13, 2800–2816. [Google Scholar] [CrossRef] [Green Version]
- Heimbockel, R.; Hoffman, F.; Froba, M. Insights into the influence of the pore size and surface area of activated carbons on the energy storage of electric double layer capacitors with a new potentially universally applicable capacitor model. Phys. Chem. Chem. Phys. 2019, 21, 3122. [Google Scholar] [CrossRef] [Green Version]
- Arof, A.K.; Shuhaimi, N.E.A.; Alias, N.A.; Kufian, M.Z.; Majid, S.R. Application of chitosan/iota-carrageenan polymer electrolytes in electrical double layer capacitor (EDLC). J. Solid State Electrochem. 2010, 14, 2145–2152. [Google Scholar] [CrossRef]
- Liew, C.-W. Nanocomposite Polymer Electrolytes for Electric Double Layer Capacitors (EDLCs) Application. In Nanomaterials in Energy Devices. In Energy Storage Derivatives and Emerging Solar Cells; CRC Press: Boca Raton, FL, USA; Taylor & Francis Group: Abingdon, UK, 2017. [Google Scholar]
- Lim, C.-S.; Teoh, K.H.; Liew, C.-W.; Ramesh, S. Capacitive behavior studies on electrical double layer capacitor using poly (vinyl alcohol)-lithium perchlorate based polymer electrolyte incorporated with TiO2. Mater. Chem. Phys. 2014, 143, 661–667. [Google Scholar] [CrossRef]
- Aziz, S.B.; Rasheed, M.A.; Hussein, A.M.; Ahmed, H.M. Fabrication of polymer blend composites based on [PVA-PVP](1 − x):(Ag2S) x (0.01 ≤ x ≤ 0.03) with small optical band gaps: Structural and optical properties. Mater. Sci. Semicond. Process. 2017, 71, 197–203. [Google Scholar] [CrossRef]
- Aziz, S.B. Modifying Poly (Vinyl Alcohol) (PVA) from Insulator to Small- Band gap Polymer: A Novel c and Optoelectronic Devices. J. Electron. Mater. 2015, 45, 736–745. [Google Scholar] [CrossRef]
- Malathi, J.; Kumaravadivel, M.; Brahmanandhan, G.M.; Hema, M.; Baskaran, R.; Selvasekarapandian, S. Structural, thermal and electrical properties of PVALiCF3SO3 polymer electrolyte. J. Non-Cryst. Solids 2010, 356, 2277. [Google Scholar] [CrossRef]
- Rangasamy, V.S.; Thayumanasundaram, S.; Locquet, J.-P. Solid polymer electrolytes with poly(vinyl alcohol) and piperidinium based ionic liquid for Li-ion batteries. Solid State Ion. 2019, 333, 76–82. [Google Scholar] [CrossRef]
- Shukur, M.F.; Kadir, M.F.Z. Hydrogen ion conducting starch-chitosan blend based electrolyte for application in electrochemical devices. Electrochim. Acta 2015, 158, 152–165. [Google Scholar] [CrossRef]
- Noor, N.A.M.; Isa, M.I.N. Structural and Conduction Studies of Solid Biopolymer Electrolytes System Based on Carboxymethyl Cellulose. Am. Eurasian J. Sustain. Agric. 2015, 9, 15–22. [Google Scholar]
- Salleh, N.S.; Aziz, S.B.; Aspanut, Z.; Kadir, M.F.Z. Electrical impedance and conduction mechanism analysis of biopolymer electrolytes based on methyl cellulose doped with ammonium iodide. Ionics 2016, 22, 2157–2167. [Google Scholar] [CrossRef]
- Hamsan, M.H.; Shukur, M.F.; Kadir, M.F.Z. NH4NO3 as charge carrier contributor in glycrolized potato starch-methyl cellulose blend-based polymer electrolyte and the application in electrochemical double-layer capacitor. Ionics 2017, 23, 3429–3453. [Google Scholar] [CrossRef]
- Makled, M.H.; Sheha, E.; Shanap, T.S.; El-Mansy, M.K. Electrical conduction and dielectric relaxation in p-type PVA/CuI polymer composite. J. Adv. Res. 2013, 4, 531–538. [Google Scholar] [CrossRef] [Green Version]
- Srivastava, N.; Chandra, A.; Chandra, S. Dense branched growth of (SCN)x and ion transport in the poly(ethyleneoxide) NH4SCN polymer electrolyte. Phys. Rev. B 1995, 52, 225–230. [Google Scholar] [CrossRef]
- Liang, S.; Huang, Q.; Liu, L.; Yam, K.L. Microstructure and molecular interaction in glycerol plasticized chitosan/poly(vinyl alcohol) blending films. Macromol. Chem. Phys. 2009, 210, 832–839. [Google Scholar] [CrossRef]
- Alireza, K.; Nastaran, F.; Roslina, M.H.; Elias Saion, W. Mahmood Mat Yunus and Kasra Behzad, Structural, optical, opto-thermal and thermal properties of ZnS–PVA nanofluids synthesized through a radiolytic approach. Beilstein J. Nanotechnol. 2015, 6, 529–536. [Google Scholar]
- Jiang, L.; Yang, T.; Peng, L.; Dan, Y. Acrylamide modified poly(vinyl alcohol): Crystalline and enhanced water solubility. RSC Adv. 2015, 5, 86598–86605. [Google Scholar] [CrossRef]
- Mobarak, N.N.; Ahmad, A.; Abdullah, M.P.; Ramli, N.; Rahman, M.Y.A. Conductivity enhancement via chemical modification of chitosan based green polymer electrolyte. Electrochim. Acta 2013, 92, 161–167. [Google Scholar] [CrossRef]
- Kadir, M.F.Z.; Majid, S.R.; Arof, A.K. Plasticized chitosan–PVA blend polymer electrolyte based proton battery. Electrochim. Acta 2010, 55, 1475–1482. [Google Scholar] [CrossRef]
- Aziz, S.B.; Brza, M.A.; Hamsan, H.M.; Kadir, M.F.Z.; Abdulwahid, R.T. Electrochemical characteristics of solid state double—layer capacitor constructed from proton conducting chitosan—based polymer blend electrolytes. Polym. Bull. 2020. [Google Scholar] [CrossRef]
- Samsudin, A.S.; Khairul, W.M.; Isa, M.I.N. Characterization on the potential of carboxy methylcellulose for application as proton conducting biopolymer electrolytes. J. Non-Cryst. Solids 2012, 358, 1104. [Google Scholar] [CrossRef]
- Pradhan, D.K.; PChoudhary Samantaray, B.K.; Karan, N.K.; Katiyar, R.S. Effect of Plasticizer on Structural and Electrical Properties of Polymer Nanocompsoite Electrolytes. Int. J. Electrochem. Sci. 2007, 2, 861–871. [Google Scholar]
- Aziz, S.B.; Abdullah, R.M. Crystalline and amorphous phase identification from the tanδ relaxation peaks and impedance plots in polymer blend electrolytes based on [CS:AgNt]x:PEO (x−1) (10 ≤ x ≤ 50). Electrochim. Acta 2018, 285, 30–46. [Google Scholar] [CrossRef]
- Shukur, M.F.; Ithnin, R.; Illias, H.A.; Kadir, M.F.Z. Proton conducting polymer electrolyte based on plasticized chitosan-PEO blend and application in electrochemical devices. Opt. Mater. 2013, 35, 1834. [Google Scholar] [CrossRef]
- Liew, C.-W.; Ramesh, S.; Arof, A. Good prospect of ionic liquid based-poly (vinyl alcohol) polymer electrolytes for supercapacitors with excellent electrical, electrochemical and thermal properties. Int. J. Hydrog. Energy 2014, 39, 2953e63. [Google Scholar] [CrossRef]
- Woo, H.J.; Majid, S.R.; Arof, A.K. Dielectric properties and morphology of polymer electrolyte based on poly(ε-caprolactone) and ammonium thiocyanate. Mater. Chem. Phys. 2012, 134, 755–761. [Google Scholar] [CrossRef]
- Abdullah, A.; Abdullah, S.Z.; Ali, A.M.M.; Winie, T.; Yahya, M.Z.A.; Subban, R.H.Y. Electrical properties of PEO-LiCF3SO3-SiO2 nanocomposite polymer electrolytes. Mater. Res. Innov. 2009, 13, 255. [Google Scholar] [CrossRef]
- Shukur, M.F.; Ithnin, R.; Kadir, M.F.Z. Electrical characterization of corn starch-LiOAc electrolytes and application in electrochemical double layer capacitor. Electrochim. Acta 2014, 136, 204–216. [Google Scholar] [CrossRef]
- Harun, N.I.; Ali, R.M.; Ali, A.M.M.; Yahya, M.Z.A. Conductivity studies on cellulose acetate-ammonium tetrafluoroborate based polymer electrolytes. Mater. Res. Innov. 2011, 15, S168. [Google Scholar] [CrossRef]
- Selvasekarapandian, S.; Chithra, D.R. Dielectric studies on a solid electrolyte AgI-PbBr2-Ag2O-B2O3. Mater. Chem. Phys. 1999, 58, 90–93. [Google Scholar] [CrossRef]
- Iqbal, M.Z.; Rafiuddin, S.R. Structural, electrical conductivity and dielectric behavior of Na2SO4–LDT composite solid electrolyte. J. Adv. Res. 2016, 7, 135–141. [Google Scholar] [CrossRef] [PubMed] [Green Version]
- Ramya, C.S.; Selvasekarapandian, S.; Hirankumar, G.; Savitha, T.; Angelo, P.C. Investigation on dielectric relaxations of PVP–NH4SCN polymer electrolyte. J. Non-Cryst. Solids 2008, 354, 1494–1502. [Google Scholar] [CrossRef]
- Aziz, S.B. Study of electrical percolation phenomenon from the dielectric and electric modulus analysis. Bull. Mater. Sci. 2015, 38, 1597–1602. [Google Scholar] [CrossRef]
- Shujahadeen, B.A.; Wrya, O.K.; Brza, M.A.; Abdulwahid, R.T.; Saeed, S.R.; Al-Zangana, S.; Kadir, M.F.Z. Ion Transport Study in CS: POZ Based Polymer Membrane Electrolytes Using Trukhan Model. Int. J. Mol. Sci. 2019, 20, 5265. [Google Scholar] [CrossRef] [Green Version]
- Rani, M.S.A.; Ahmad, A.; Mohamed, N.S. Influence of nano-sized fumed silica on physicochemical and electrochemical properties of cellulose derivatives-ionic liquid biopolymer electrolytes. Ionics 2017, 24, 807–814. [Google Scholar] [CrossRef]
- Kufian, M.Z.; Aziz, M.F.; Shukur, M.F.; Rahim, A.S.; Ariffin, N.E.; Shuhaimi, N.E.A.; Arof, A.K. PMMA-LiBOB gel electrolyte for application in lithium ion batteries. Solid State Ion. 2012, 208, 36–42. [Google Scholar] [CrossRef]
- Pandey, G.P.; Kumar, Y.; Hashmi, S.A. Ionic liquid incorporated polymer electrolytes for supercapacitor application, Indian. J. Chem. 2010, 49, 743. [Google Scholar]
- Asmara, S.N.; Kufian, M.Z.; Majid, S.R.; Arof, A.K. Preparation and characterization of magnesium ion gel polymer electrolytes for application in electrical double layer capacitors. Electrochim. Acta 2011, 57, 91–97. [Google Scholar] [CrossRef]
- Liew, C.W.; Ramesh, S. Electrical, structural, thermal and electrochemical properties of corn starch-based biopolymer electrolytes. Carbohydr. Polym. 2015, 124, 222–228. [Google Scholar] [CrossRef] [PubMed]
- Kant, R.; Singh, M.B. Theory of the electrochemical impedance of mesostructured electrodes embedded with heterogeneous micropores. J. Phys. Chem. C 2017, 121, 7164–7174. [Google Scholar] [CrossRef]
- Kadir, M.F.Z.; Arof, A.K. Application of PVA–chitosan blend polymer electrolyte membrane in electrical double layer capacitor. Mater. Res. Innov. 2011, 15, s217–s220. [Google Scholar] [CrossRef]
- Teoh, K.H.; Liew, C.W.; Ramesh, S. Electric double layer capacitor based on activated carbon electrode and biodegradable composite polymer electrolyte. Ionics 2014, 20, 251–258. [Google Scholar]
- Lewandowski, A. Supercapacitor based on activated carbon and polyethylene oxide–KOH–H2O polymer electrolyte. Electrochim. Acta 2001, 46, 2777–2780. [Google Scholar] [CrossRef]
- Zainuddin, N.K.; Rasali, N.M.J.; Mazuki, N.F.; Saadiah, M.A.; Samsudin, A.S. Investigation on favourable ionic conduction based on CMC-K carrageenan proton conducting hybrid solid bio-polymer electrolytes for applications in EDLC. Int. J. Hydrogen Energy 2020. [Google Scholar] [CrossRef]
- Cho, S.; Chen, C.; Mukherjee, P.P. Influence of Microstructure on Impedance Response in Intercalation Electrodes. J. Electrochem. Soc. 2015, 162, 1202–1214. [Google Scholar] [CrossRef]
- Yang, C.-C.; Hsu, S.-T.; Chien, W.-C. All solid-state electric double-layer capacitors based on alkaline polyvinyl alcohol polymer electrolytes. J. Power Sources 2005, 152, 303–310. [Google Scholar] [CrossRef]
- Fan, L.; Wang, M.; Zhang, Z.; Qin, G.; Hu, X.; Chen, Q. Preparation and Characterization of PVA Alkaline Solid Polymer Electrolyte with Addition of Bamboo Charcoal. Materials 2018, 11, 679. [Google Scholar] [CrossRef] [Green Version]
- Aziz, S.B.; Brza, M.A.; Mishra, K.; Hamsan, M.H.; Karim, W.O.; Abdullah, R.M.; Kadir, M.F.Z.; Abdulwahid, R.T. Fabrication of high performance energy storage EDLC device from proton conducting methylcellulose: Dextran polymer blend electrolytes. J. Mater. Res. Technol. 2020, 9, 1137–1150. [Google Scholar] [CrossRef]
- Lee, J.; Kim, W.; Kim, W. Stretchable Carbon Nanotube/Ion–Gel Supercapacitors with High Durability Realized through Interfacial Microroughness. ACS Appl. Mater. Interfaces 2014, 6, 13578–13586. [Google Scholar] [CrossRef] [PubMed]
- Sun, Y.; Wu, Q.; Shi, G. Supercapacitors based on self-assembled grapheme organogel. Phys. Chem. Chem. Phys. 2011, 13, 17249. [Google Scholar] [CrossRef] [PubMed]
- Arof, A.K.; Kufian, M.Z.; Syukur, M.F.; Aziz, M.F.; Abdelrahman, A.E.; Majid, S.R. Electrical double layer capacitor using poly(methyl methacrylate)–C4BO8Li gel polymer electrolyte and carbonaceous material from shells of mata kucing (Dimocarpuslongan) fruit. Electrochim. Acta 2012, 74, 39. [Google Scholar] [CrossRef]
- Aziz, S.B.; Brza, M.A.; Hamsan, M.H.; Kadir, M.F.Z.; Muzakir, S.K.; Abdulwahid, R.T. Effect of ohmic-drop on electrochemical performance of EDLC fabricated from PVA:dextran:NH4I based polymer blend electrolytes. J. Mater. Res. Technol. 2020. [Google Scholar] [CrossRef]
- Wei, Y.Z.; Fang, B.; Iwasa, S.; Kumagai, M. A novel electrode material for electric double-layer capacitors. J. Power Source 2005, 141, 386–391. [Google Scholar] [CrossRef]
- Sharma, K.; Arora, A.; Tripathi, S.K. Review of supercapacitors: Materials and devices. J. Energy Storage 2019, 21, 801–825. [Google Scholar] [CrossRef]
- Liew, C.W.; Ramesh, S.; Arof, A.K. Enhanced capacitance of EDLCs (electrical double layer capacitors) based on ionic liquid added polymer electrolytes. Energy 2016, 109, 546–556. [Google Scholar] [CrossRef]
- Zhong, C.; Yida, D.; Hu, W.; Zhang, J. A review of electrolyte materials and compositions for electrochemical supercapacitors. Chem. Soc. Rev. 2015, 44, 7431–7920. [Google Scholar] [CrossRef]


| Electrolyte | Degree of Crystallinity (%) |
|---|---|
| Pure PVA | 41.68 |
| PNCG-1 | 13.64 |
| PNCG-2 | 10.39 |
| PNCG-3 | 9.38 |
| PNCG-4 | 6.47 |
| Assignments | Wavenumber (cm−1) | ||||
|---|---|---|---|---|---|
| PVA | PNCG-1 | PNCG-2 | PNCG-3 | PNCG-4 | |
| O–H stretching | 3317 | 3353 | 3361 | 3349 | 3361 |
| C–H stretching | 2913 | 2924 | 2916 | 2924 | 2928 |
| Aromatic S–C=N stretching | – | 2045 | 2043 | 2049 | 2047 |
| C=O stretching | 1643 | 1612 | 1611 | 1615 | 1620 |
| C–H bending vibration of CH2 | 1415 | 1409 | 1412 | 1409 | 1418 |
| C–H deformation | 1319 | 1316 | 1313 | 1305 | 1308 |
| –C–O– stretching | 1082 | 1026 | 1037 | 1030 | 1034 |
| C–H rocking | 838 | 833 | 838 | 840 | 838 |
| Sample | P1 (rad) | P2(rad) | K1(F−1) | K2(F−1) | C1(F) | C2(F) |
|---|---|---|---|---|---|---|
| PNCG-1 | 0.83 | 0.58 | 4.2 × 10⁸ | 2 × 10⁵ | 2.38 × 10⁻⁹ | 5 × 10⁻⁶ |
| PNCG-2 | 0.87 | 0.47 | 7 × 10⁶ | 4.7 × 10⁴ | 1.43 × 10⁻⁷ | 2.13 × 10⁻⁵ |
| PNCG-3 | – | – | – | 2.2 × 10⁴ | – | 4.55 × 10⁻⁵ |
| PNCG-4 | – | 0.65 | – | 2.1 × 10⁴ | – | 4.76 × 10⁻⁵ |
| Designation | Composition (PVA wt.%:NH4SCN wt.% :Cd(II)-complex mL:Gly wt.%) | σDC (S cm−1) |
|---|---|---|
| PNCG-1 | 50:50:10:10 | 7.21 × 10⁻⁶ |
| PNCG-2 | 50:50:10:20 | 6.52 × 10⁻⁵ |
| PNCG-3 | 50:50:10:30 | 1.38 × 10⁻³ |
| PNCG-4 | 50:50:10:40 | 2.01 × 10⁻³ |
| Scan Rates (mv/s) | Capacitance (F/g) |
|---|---|
| 100 | 56.47 |
| 50 | 86.42 |
| 20 | 116.59 |
| 10 | 128.48 |
| 5 | 130.77 |
| Electrolyte Composition | Cd (F g−1) | Ed (Wh kg−1) | Cycle No. | Reference |
|---|---|---|---|---|
| PVA:LiClO4:TiO2 | 12.5 | 1.56 | 1000 | [28] |
| PS:MC:NH4NO3:Gly | 31 | 3.1 | 1000 | [36] |
| PVA-CH3COONH4-BmImCl | 28.36 | 2.39 | 500 | [49] |
| PVA:CH3COONH4:BmImBr | 21.89 | 1.36 | 500 | [19] |
| MC:dextran:NH4I | 79 | 8.81 | 100 | [72] |
| PEO–KOH–H2O | 90 | – | – | [67] |
| PVA-KOH | 112.48 | 10 | 1000 | [70] |
| EMIM-TFSI:PVDF-HFP | 51.8 | 15.7 | 3000 | [73] |
| PVA:NH4SCN: Cd(II)-complex:Gly | 160.07 | 18.01 | 450 | This work |
© 2020 by the authors. Licensee MDPI, Basel, Switzerland. This article is an open access article distributed under the terms and conditions of the Creative Commons Attribution (CC BY) license (http://creativecommons.org/licenses/by/4.0/).
Share and Cite
Brza, M.A.; B. Aziz, S.; Anuar, H.; Dannoun, E.M.A.; Ali, F.; Abdulwahid, R.T.; Al-Zangana, S.; Kadir, M.F.Z. The Study of EDLC Device with High Electrochemical Performance Fabricated from Proton Ion Conducting PVA-Based Polymer Composite Electrolytes Plasticized with Glycerol. Polymers 2020, 12, 1896. https://doi.org/10.3390/polym12091896
Brza MA, B. Aziz S, Anuar H, Dannoun EMA, Ali F, Abdulwahid RT, Al-Zangana S, Kadir MFZ. The Study of EDLC Device with High Electrochemical Performance Fabricated from Proton Ion Conducting PVA-Based Polymer Composite Electrolytes Plasticized with Glycerol. Polymers. 2020; 12(9):1896. https://doi.org/10.3390/polym12091896
Chicago/Turabian StyleBrza, Mohamad A., Shujahadeen B. Aziz, Hazleen Anuar, Elham M. A. Dannoun, Fathilah Ali, Rebar T. Abdulwahid, Shakhawan Al-Zangana, and Mohd F.Z. Kadir. 2020. "The Study of EDLC Device with High Electrochemical Performance Fabricated from Proton Ion Conducting PVA-Based Polymer Composite Electrolytes Plasticized with Glycerol" Polymers 12, no. 9: 1896. https://doi.org/10.3390/polym12091896