Synthesis of New Cyclodextrin-Based Adsorbents to Remove Direct Red 83:1


 ,
,  and
and 
Abstract
: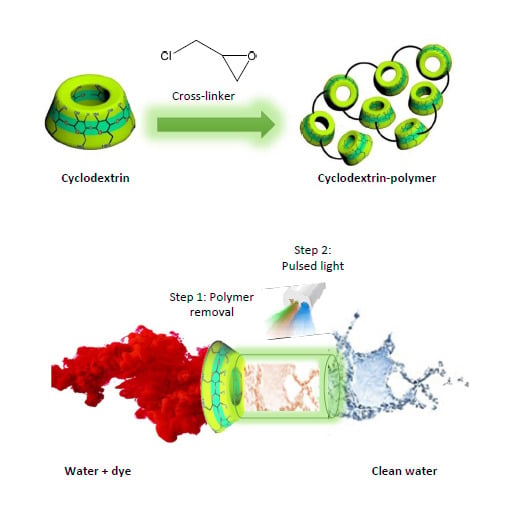
1. Introduction
2. Materials and Methods
2.1. Chemicals
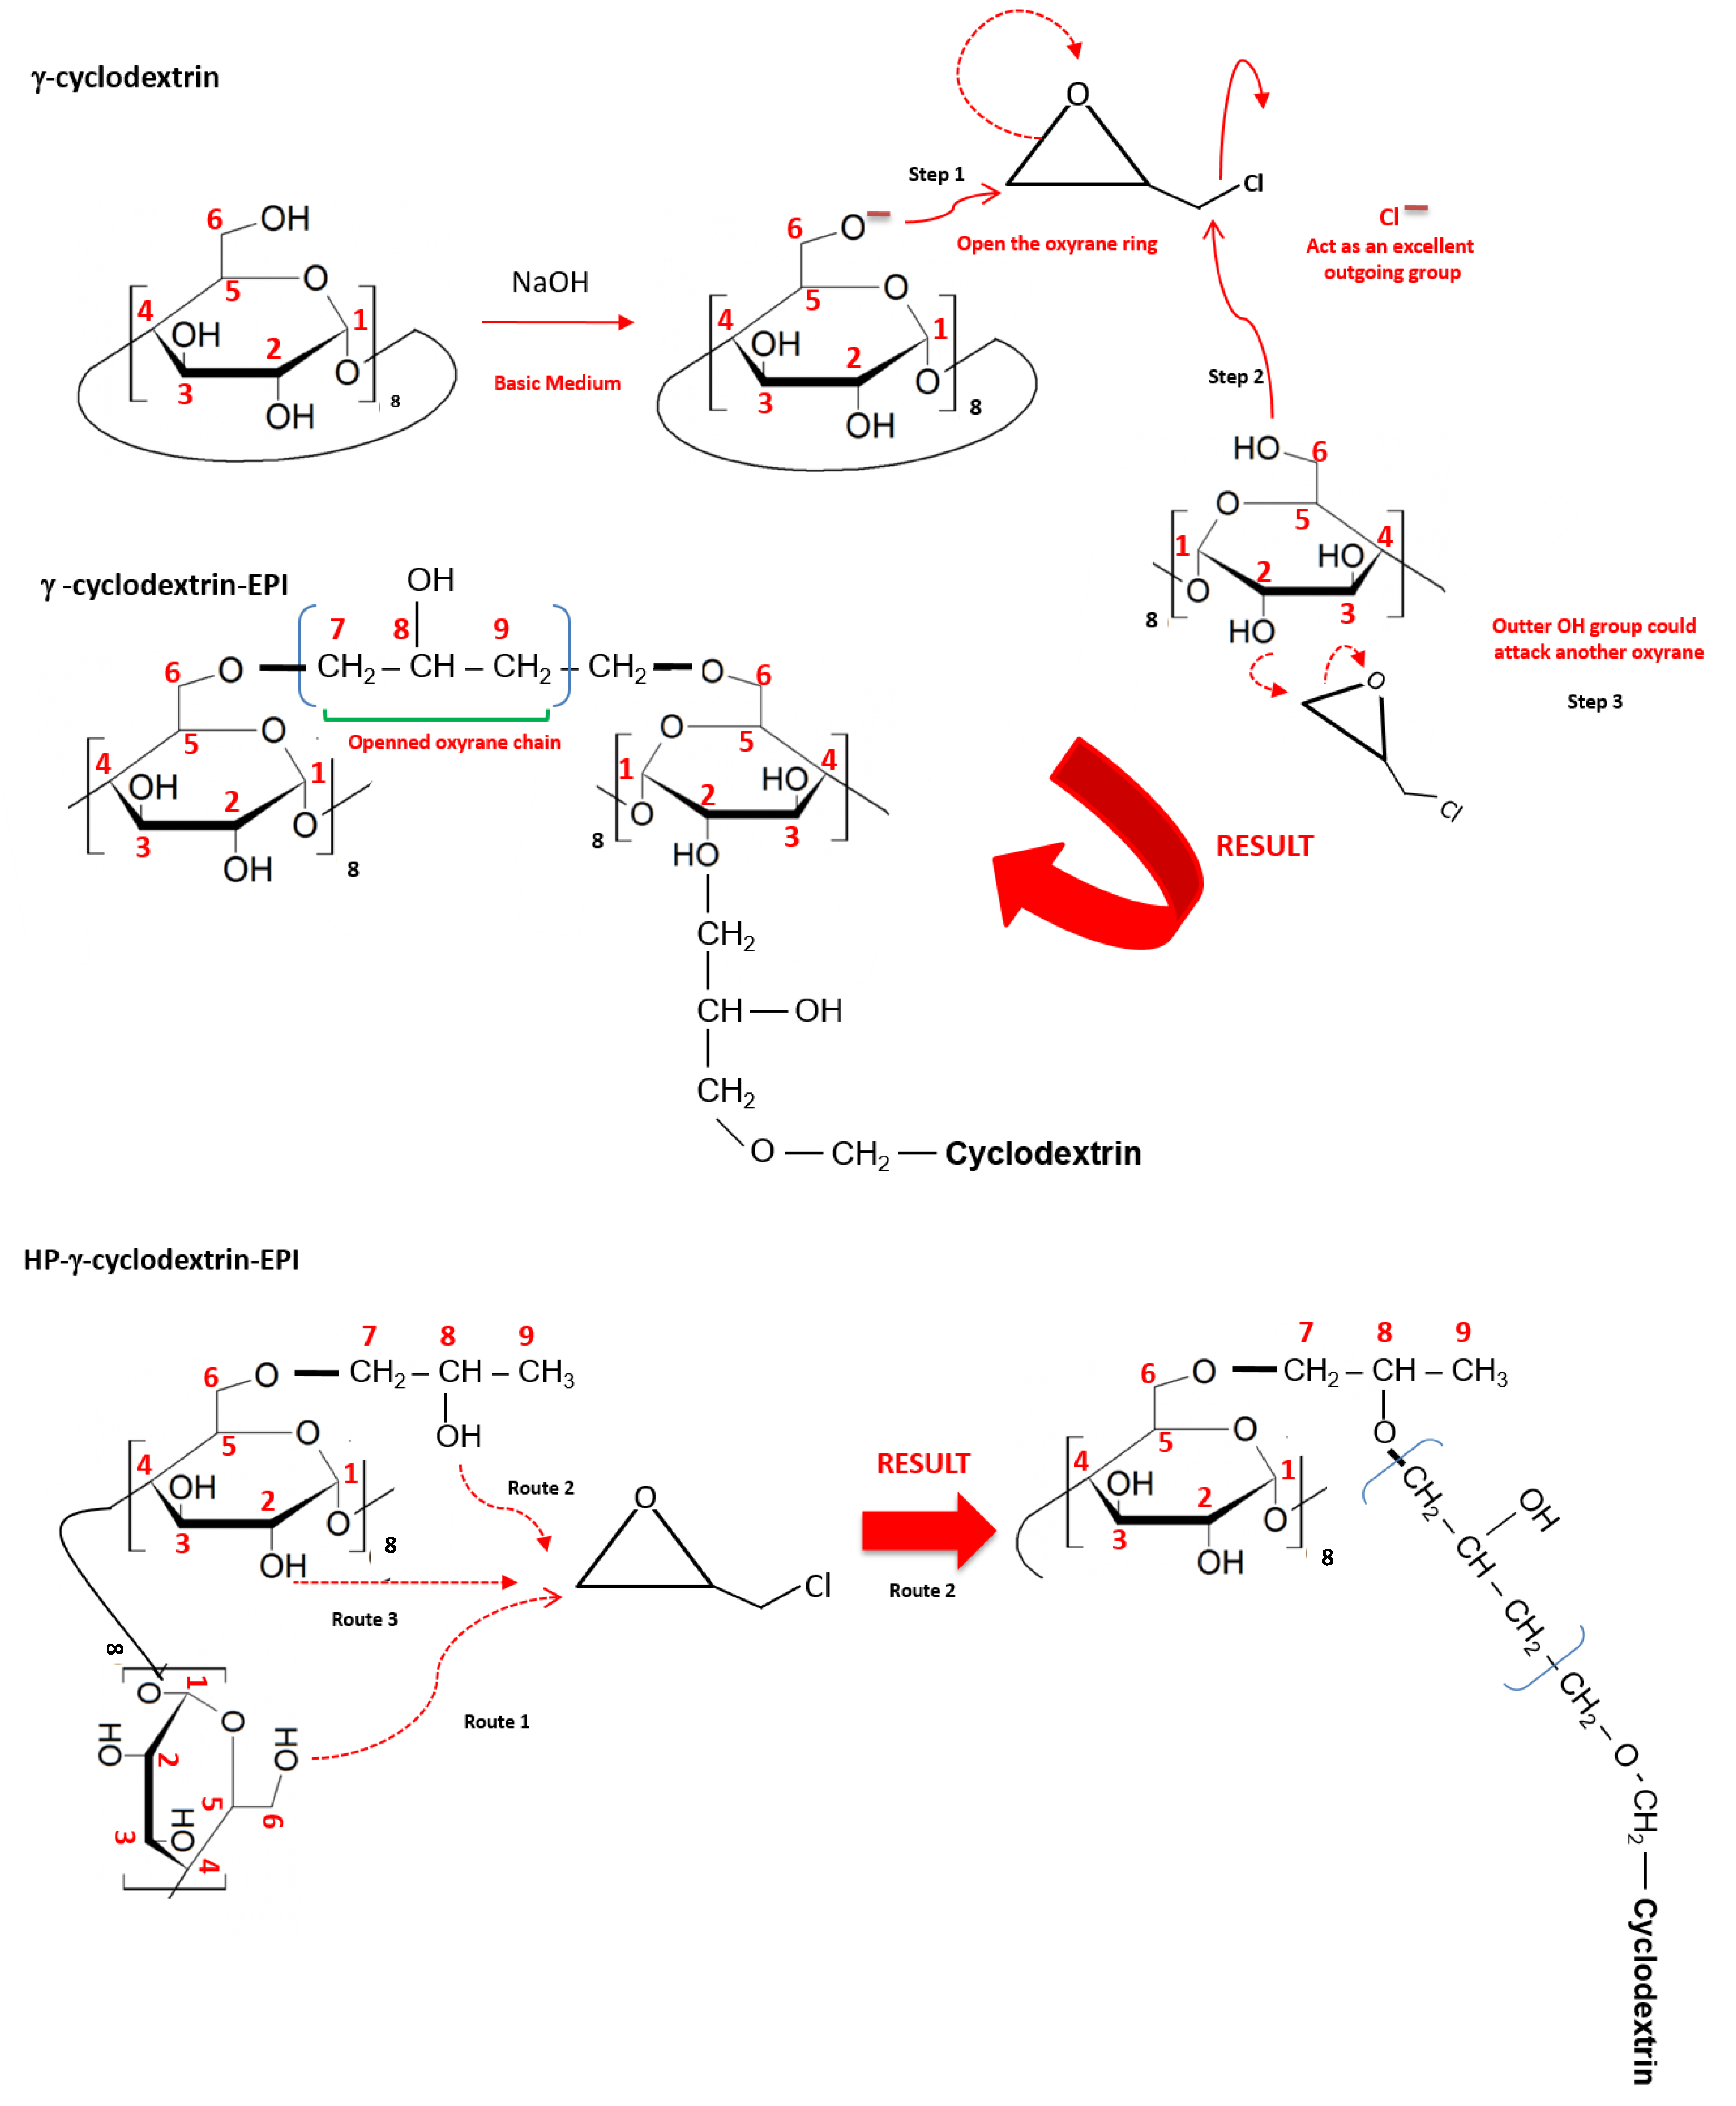
2.2. Polymer Synthesis
2.3. Adsorption Experiments
2.4. Polymer Characterization
2.5. Advanced Oxidation Process (AOP)
3. Results and Discussion
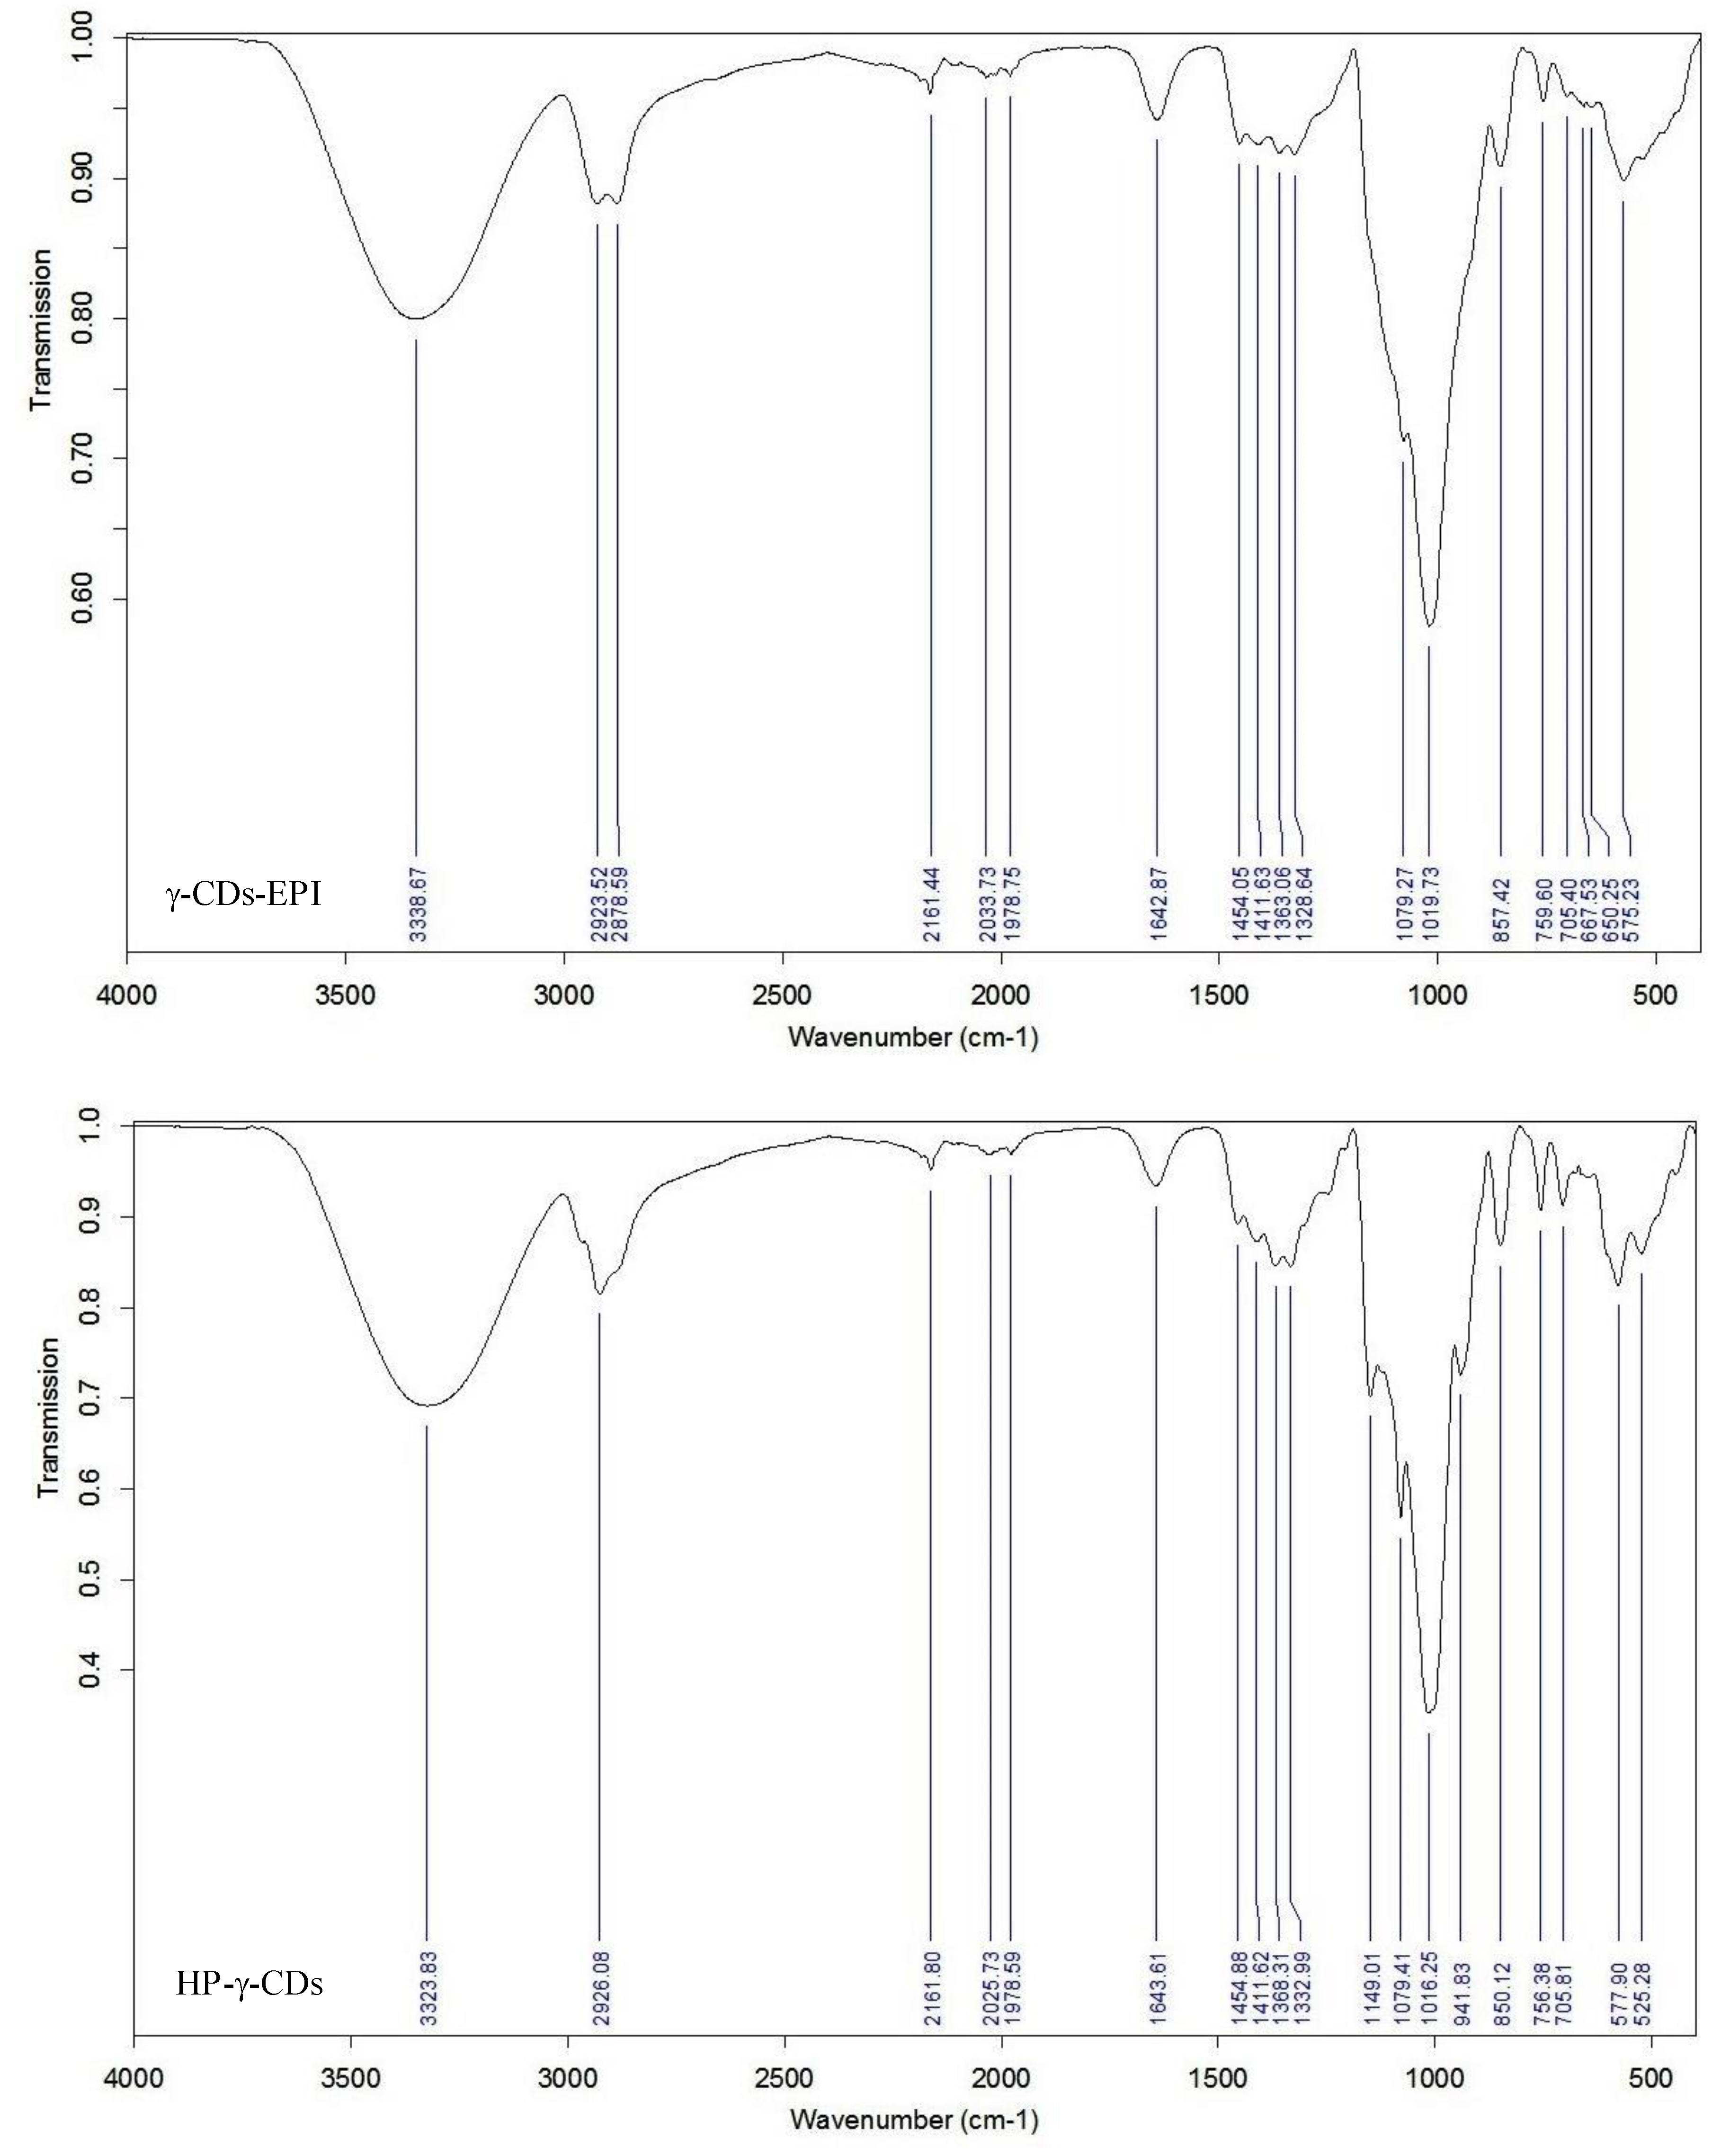
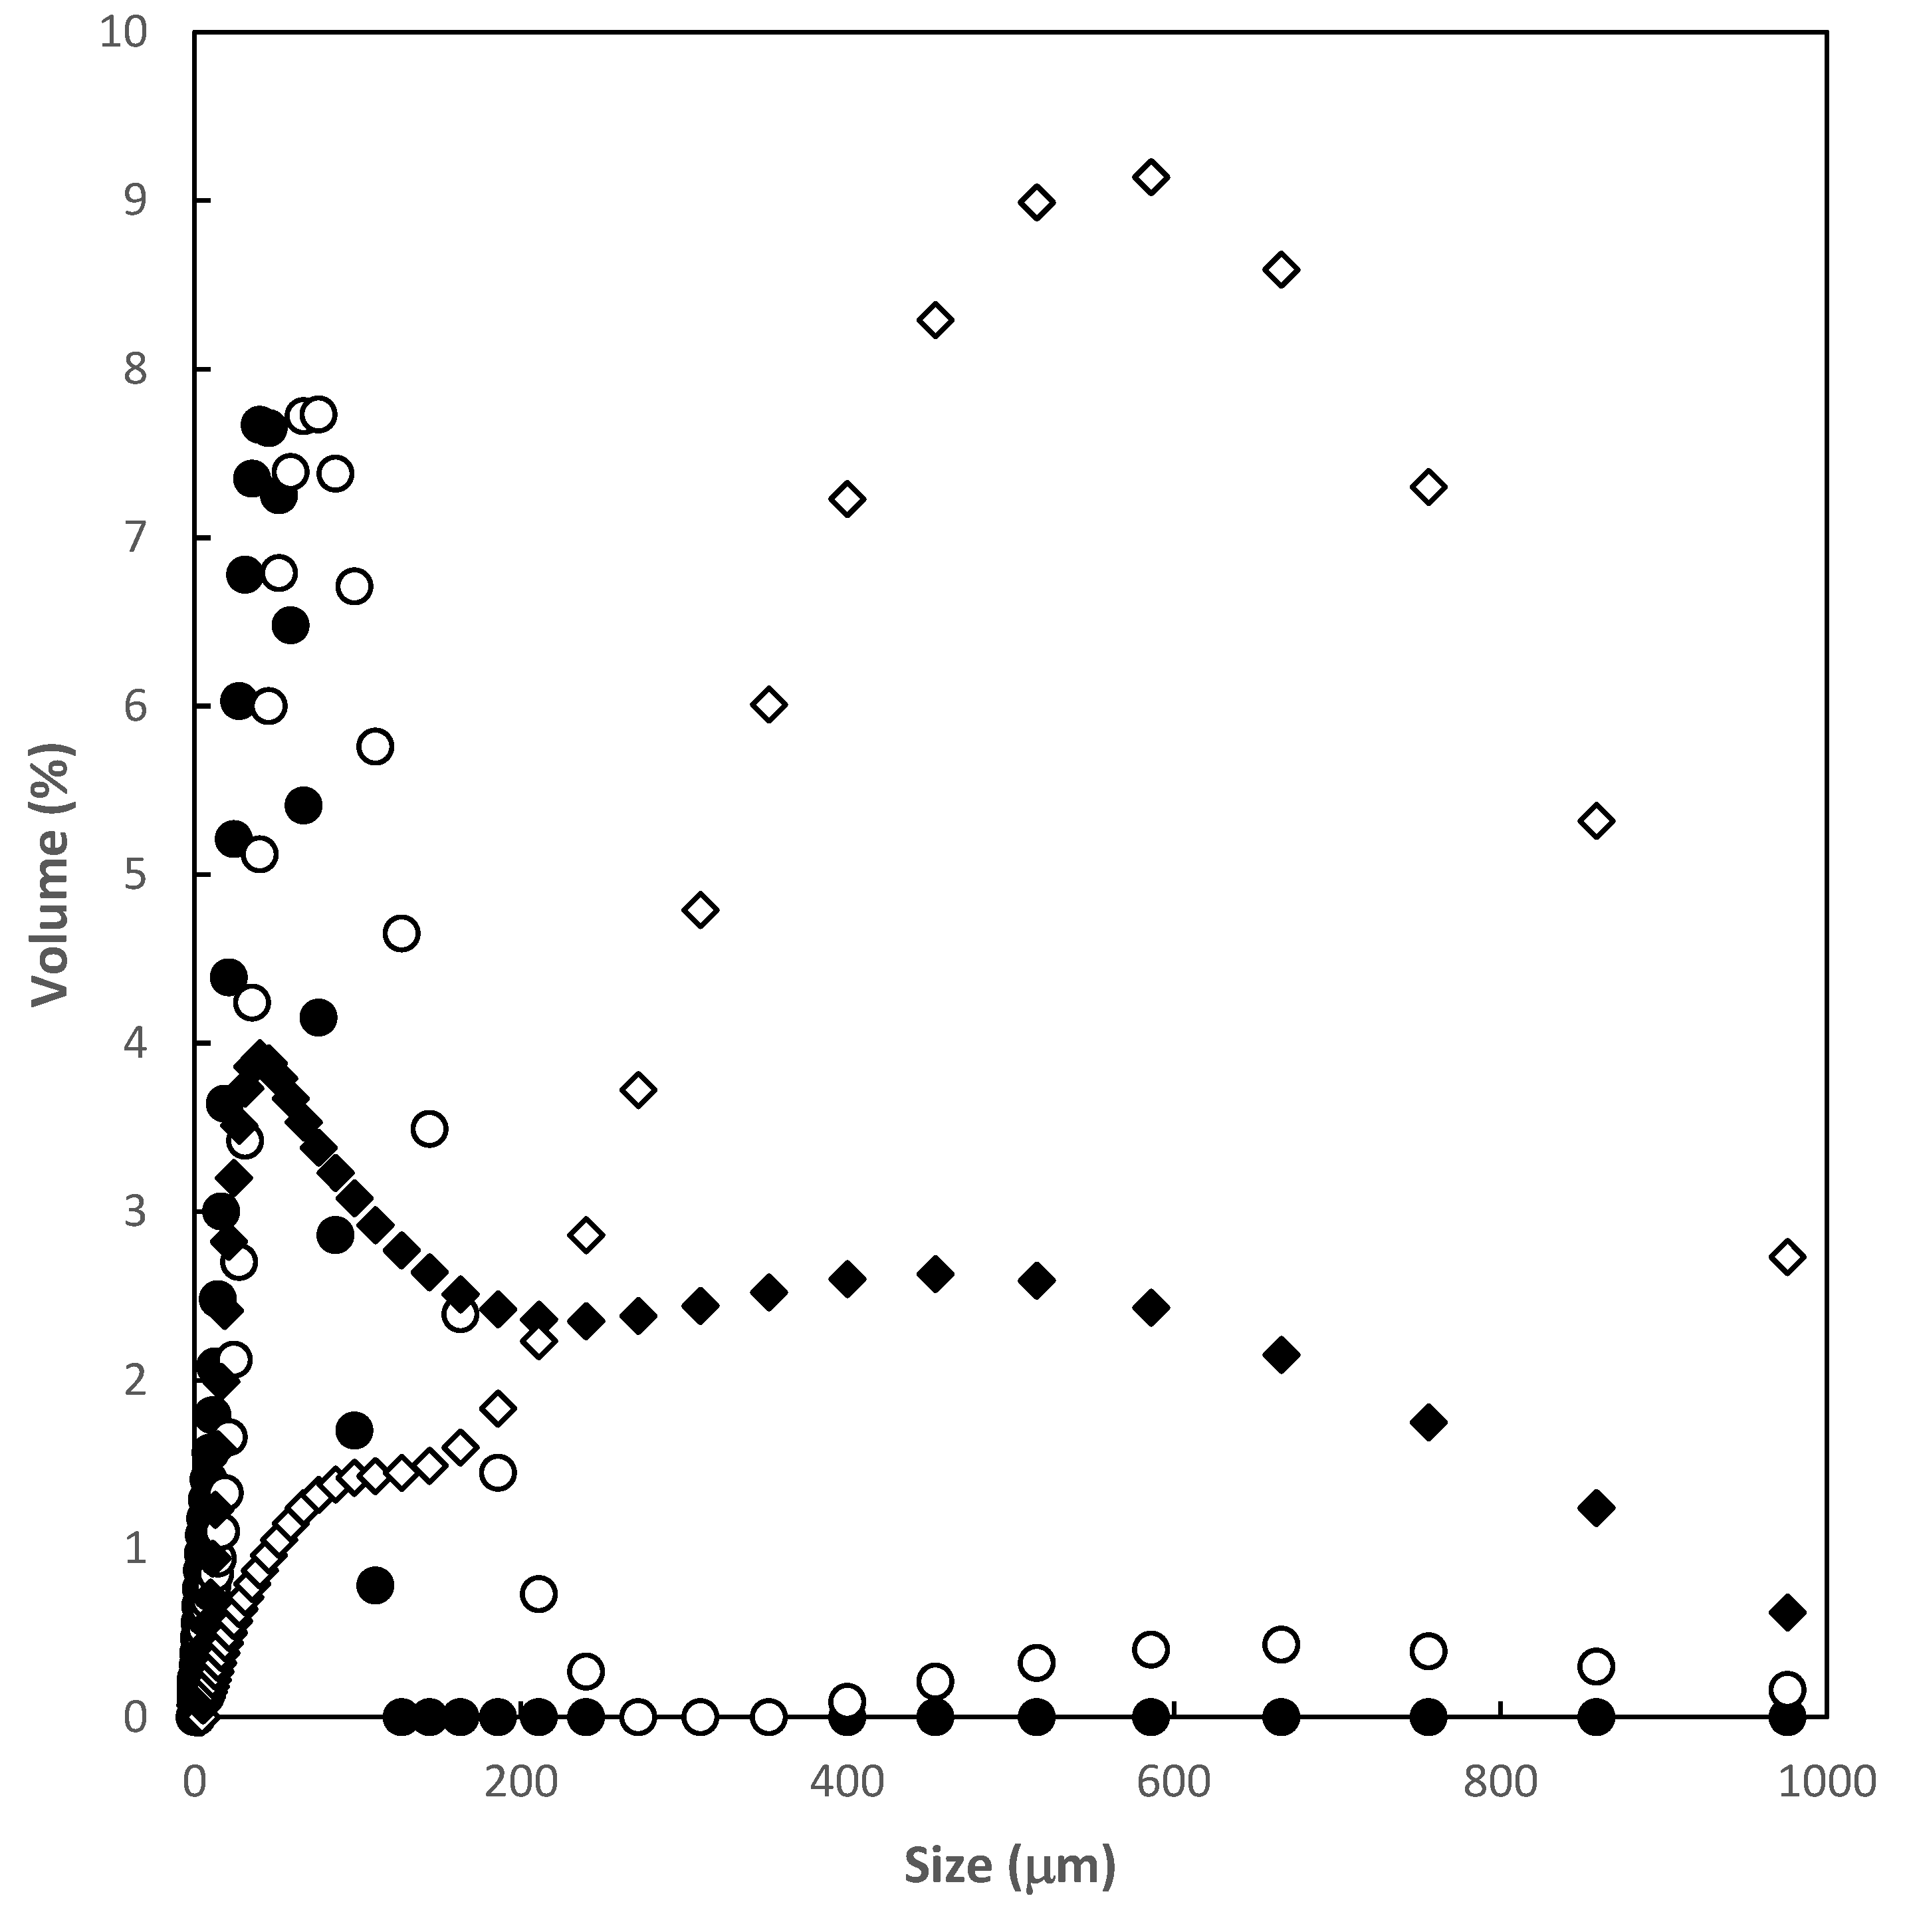
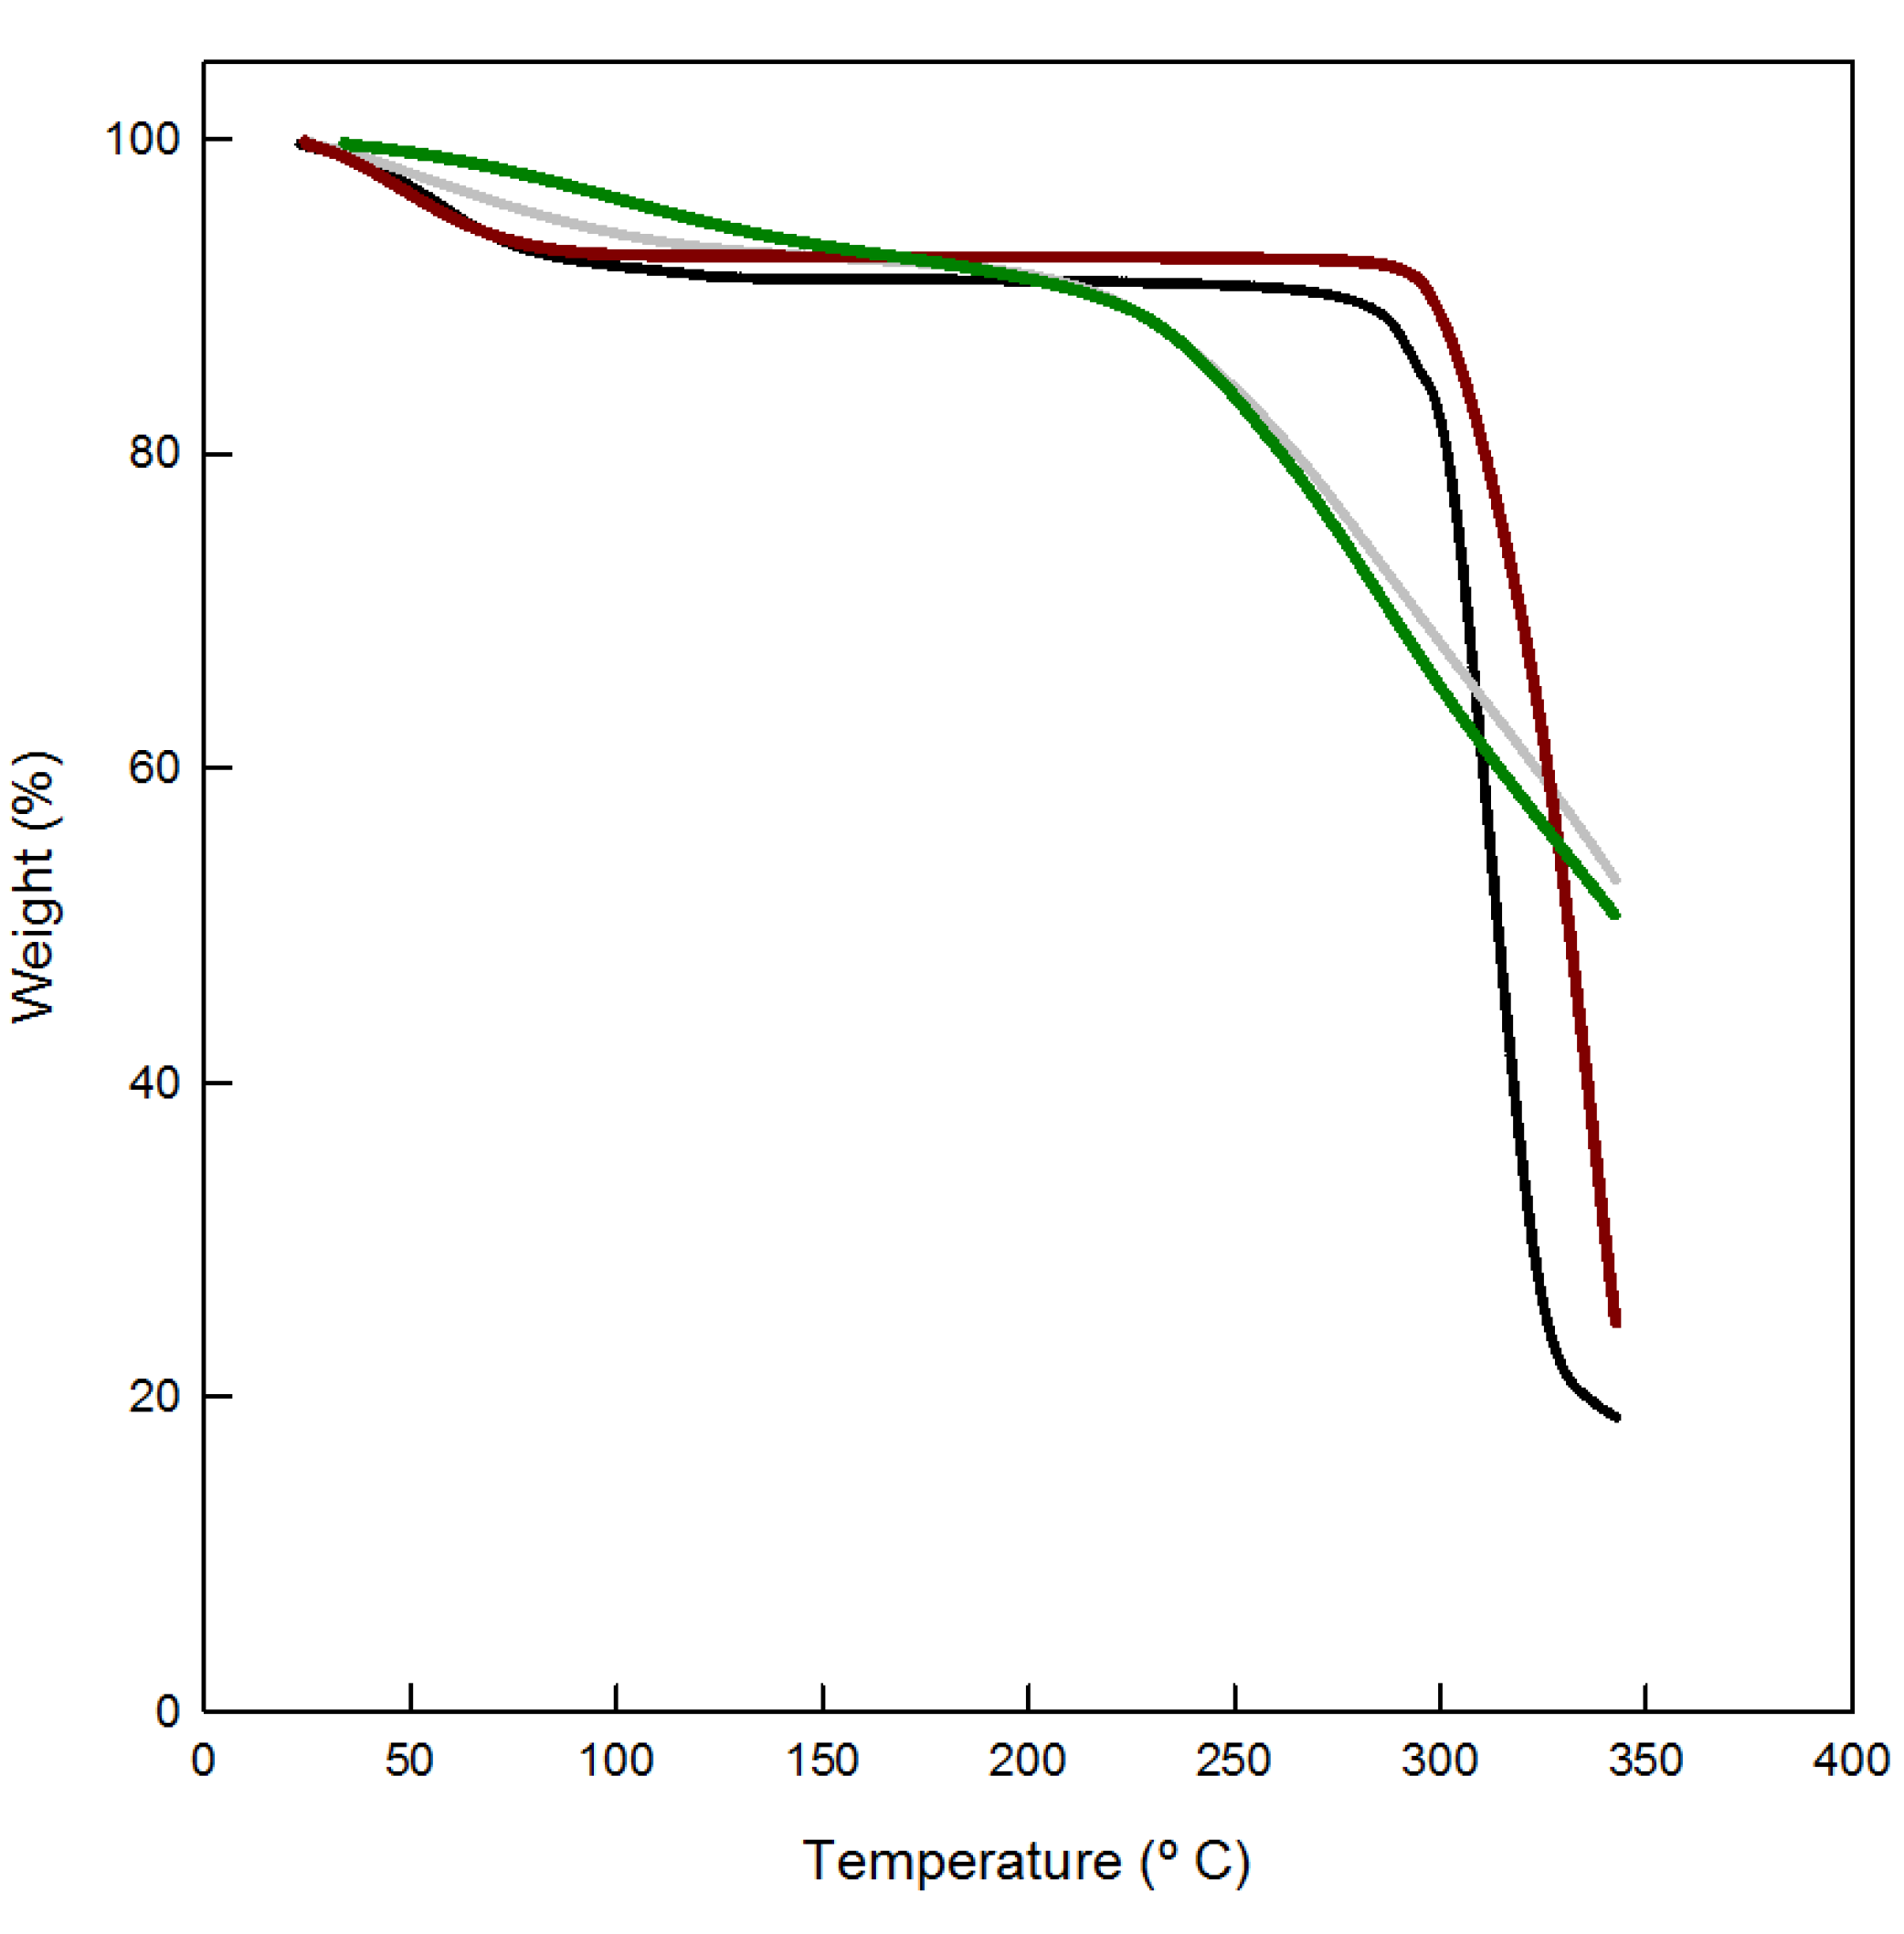
3.1. Polymer Characterization
3.2. Effect of Contact Time
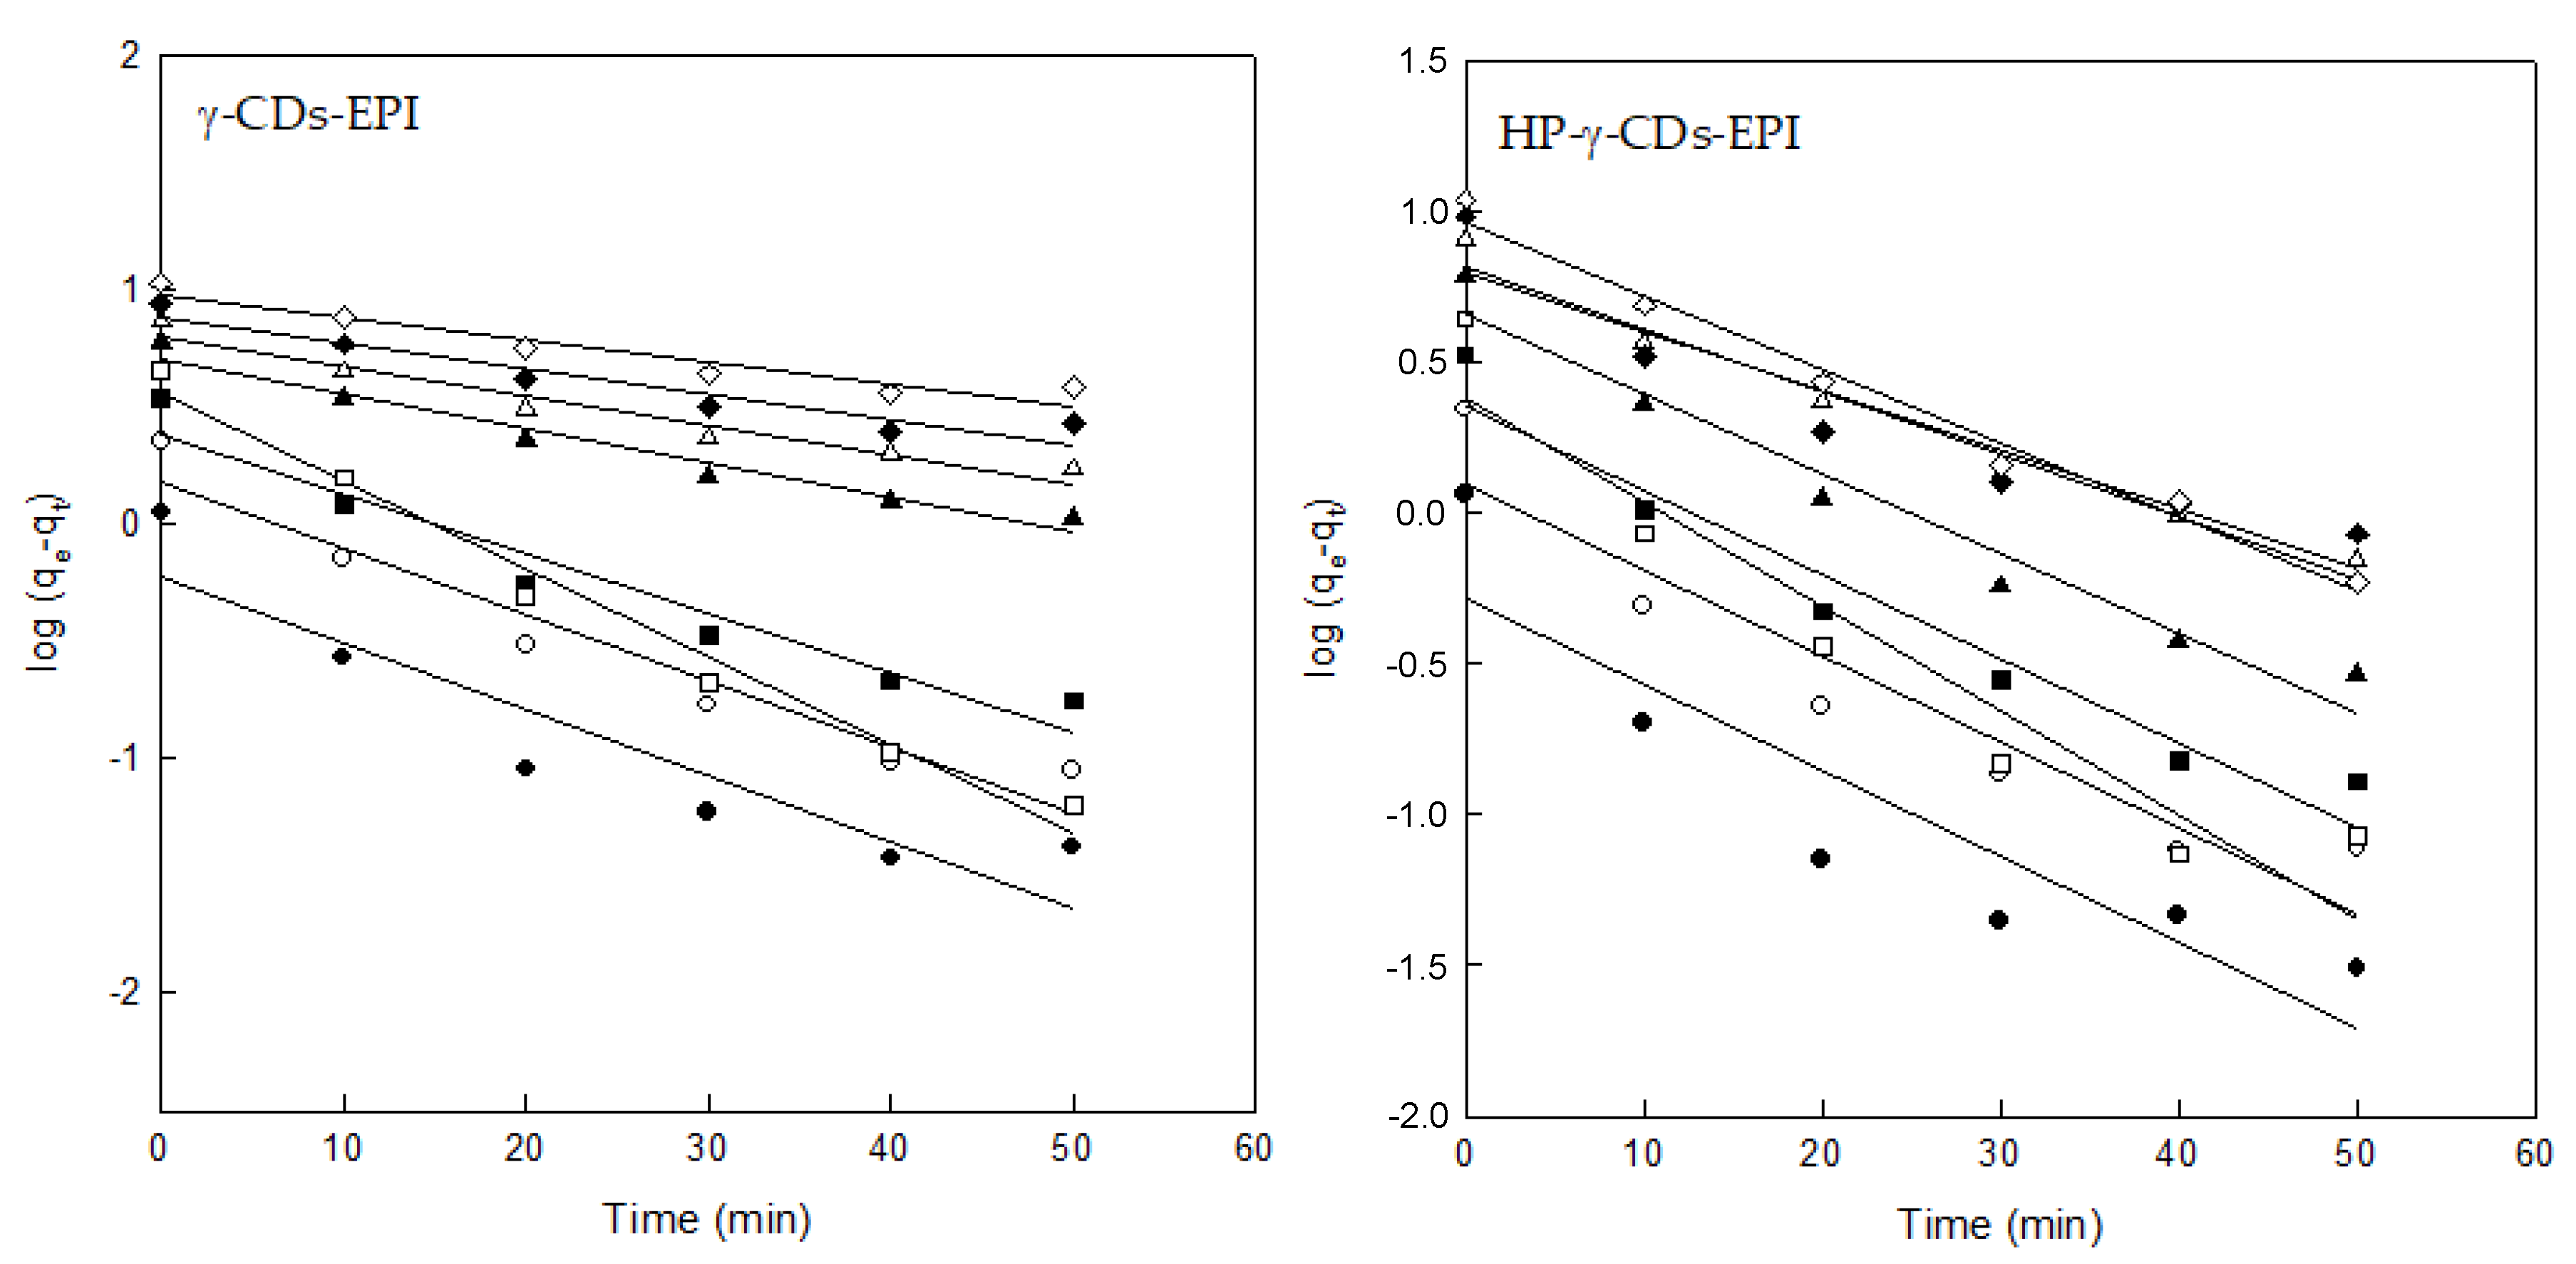
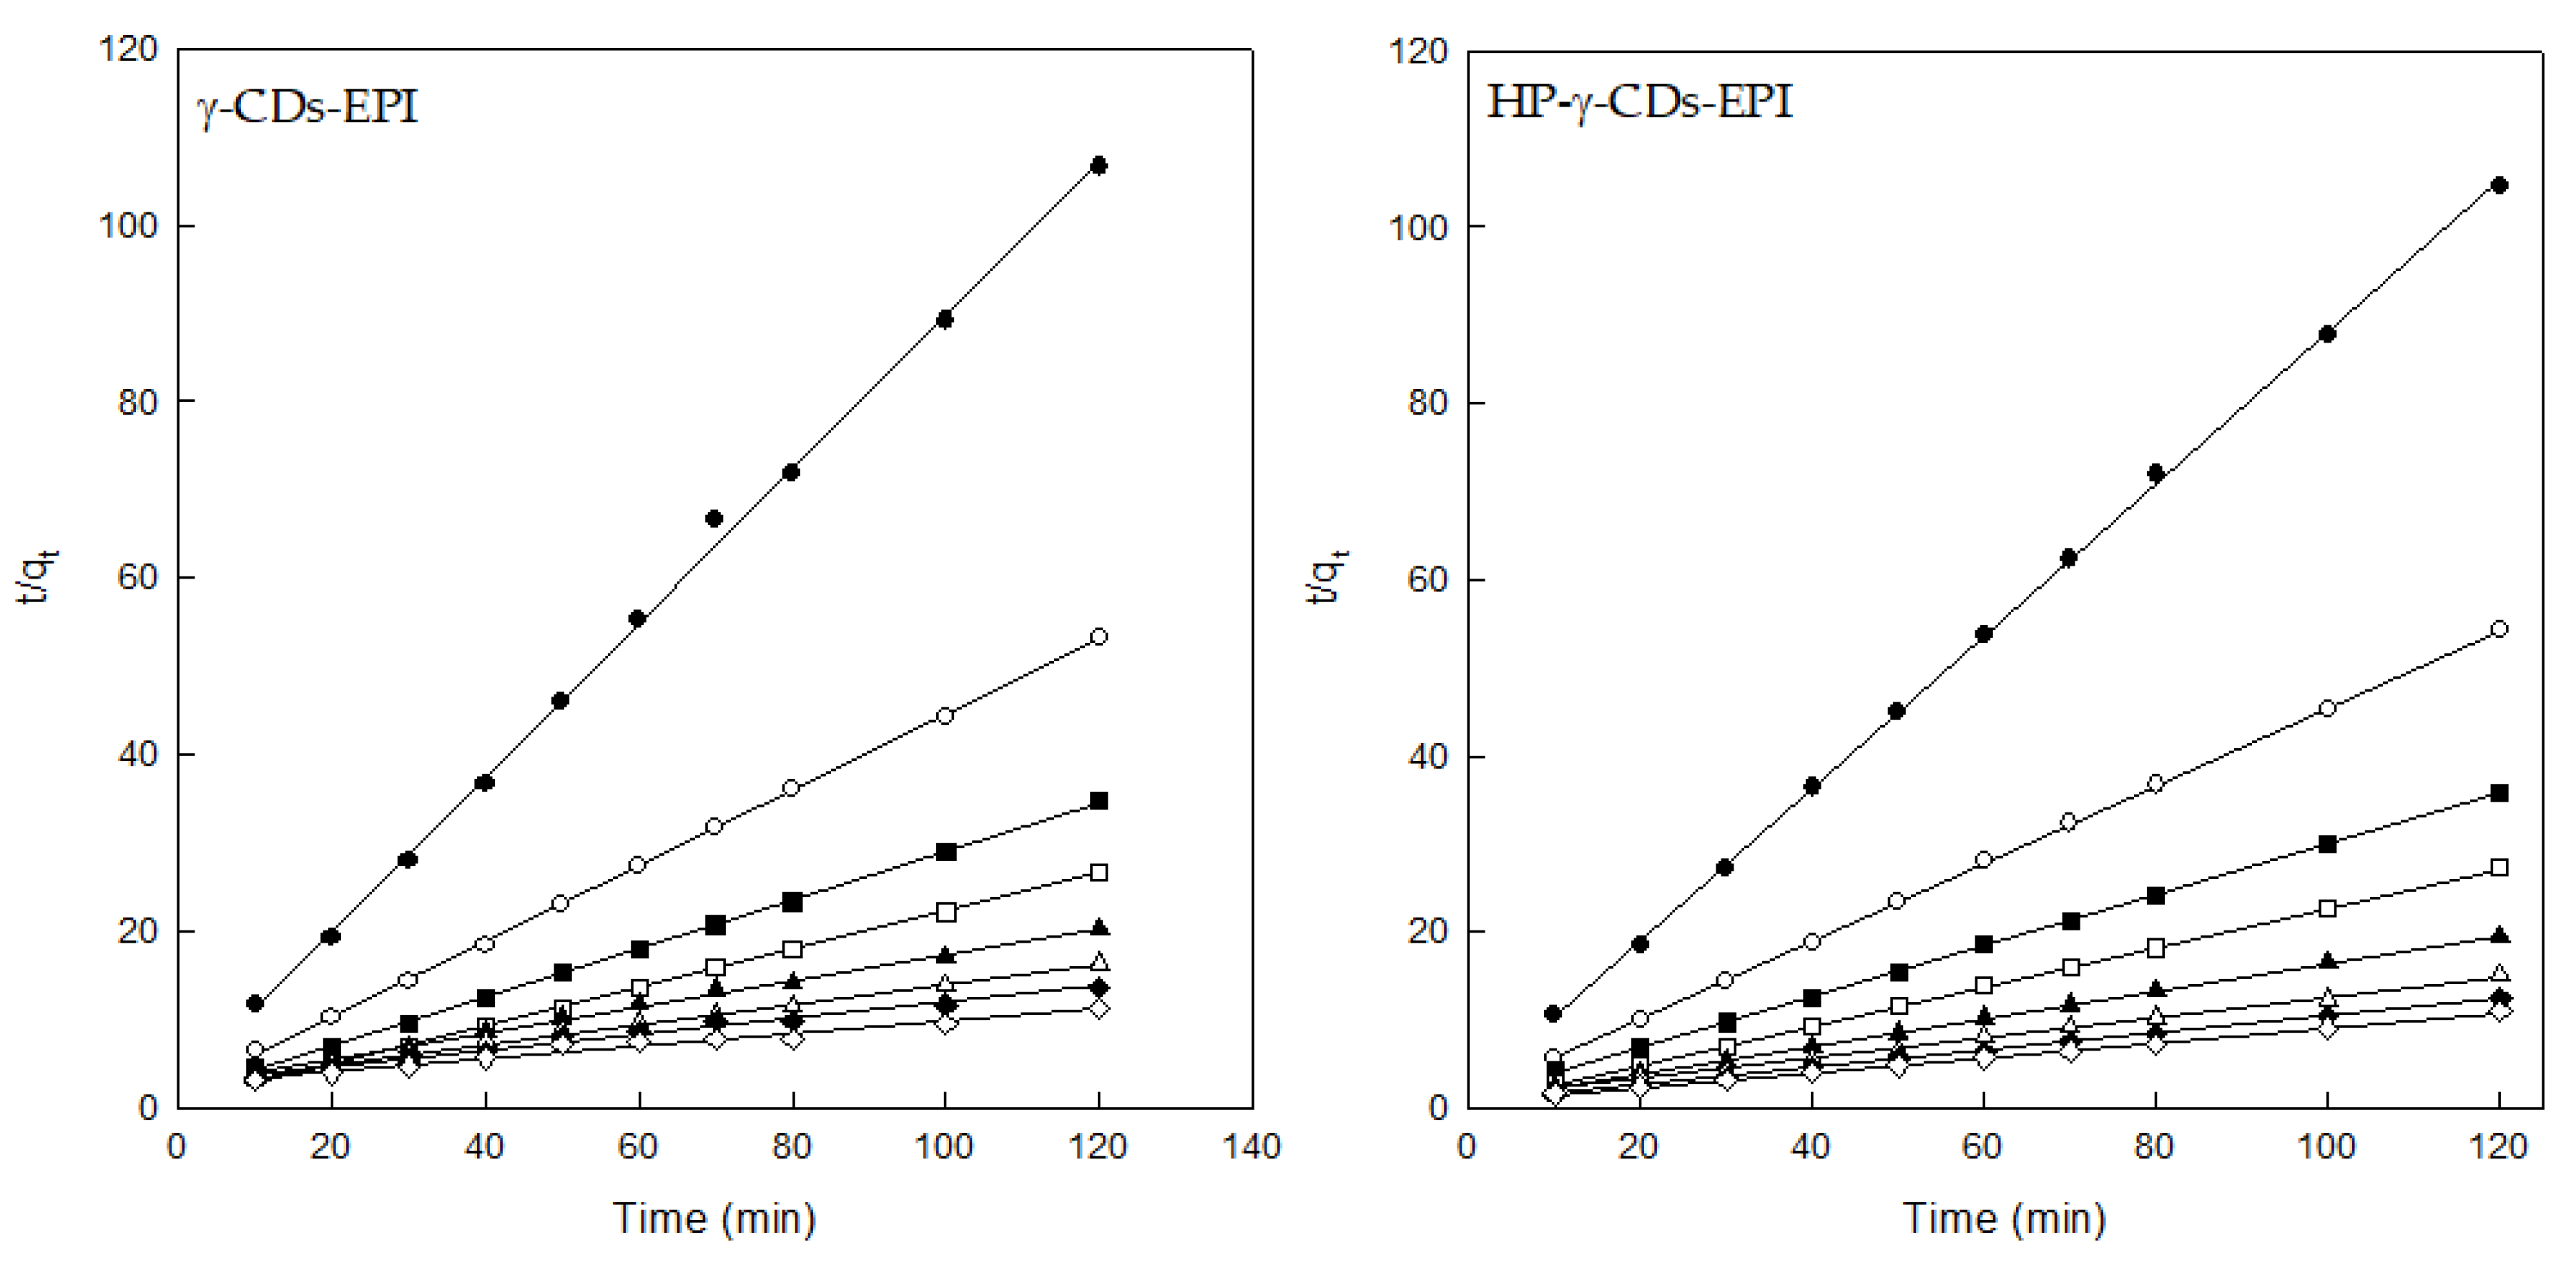
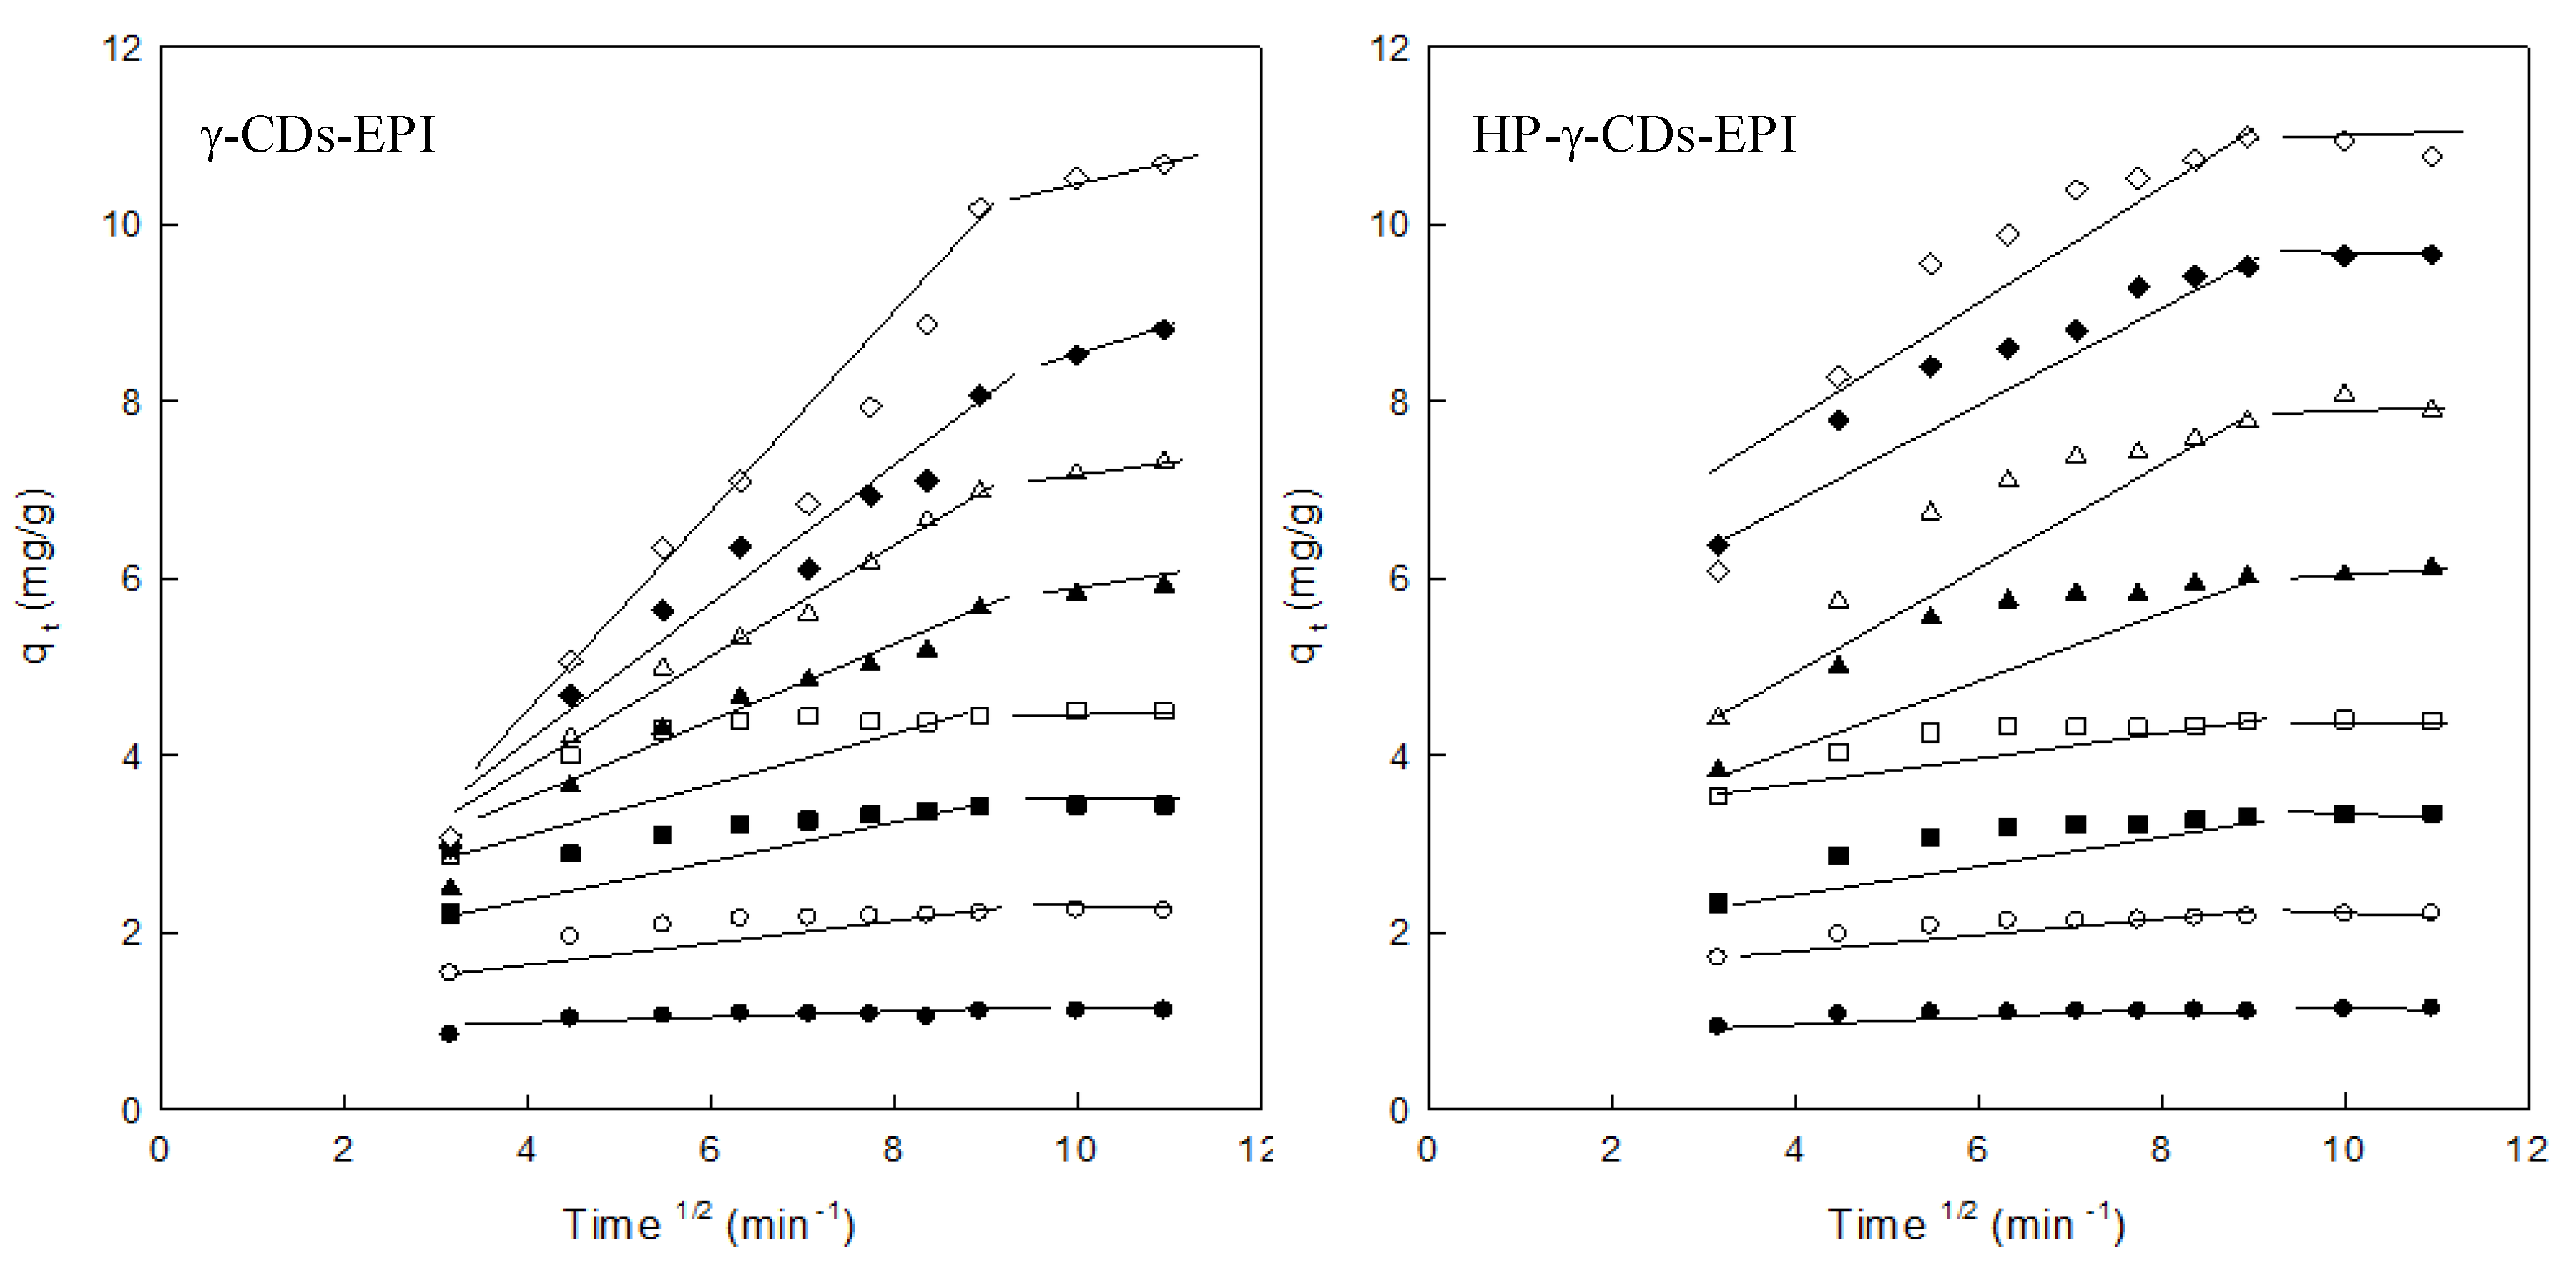
3.3. Adsorption Kinetics
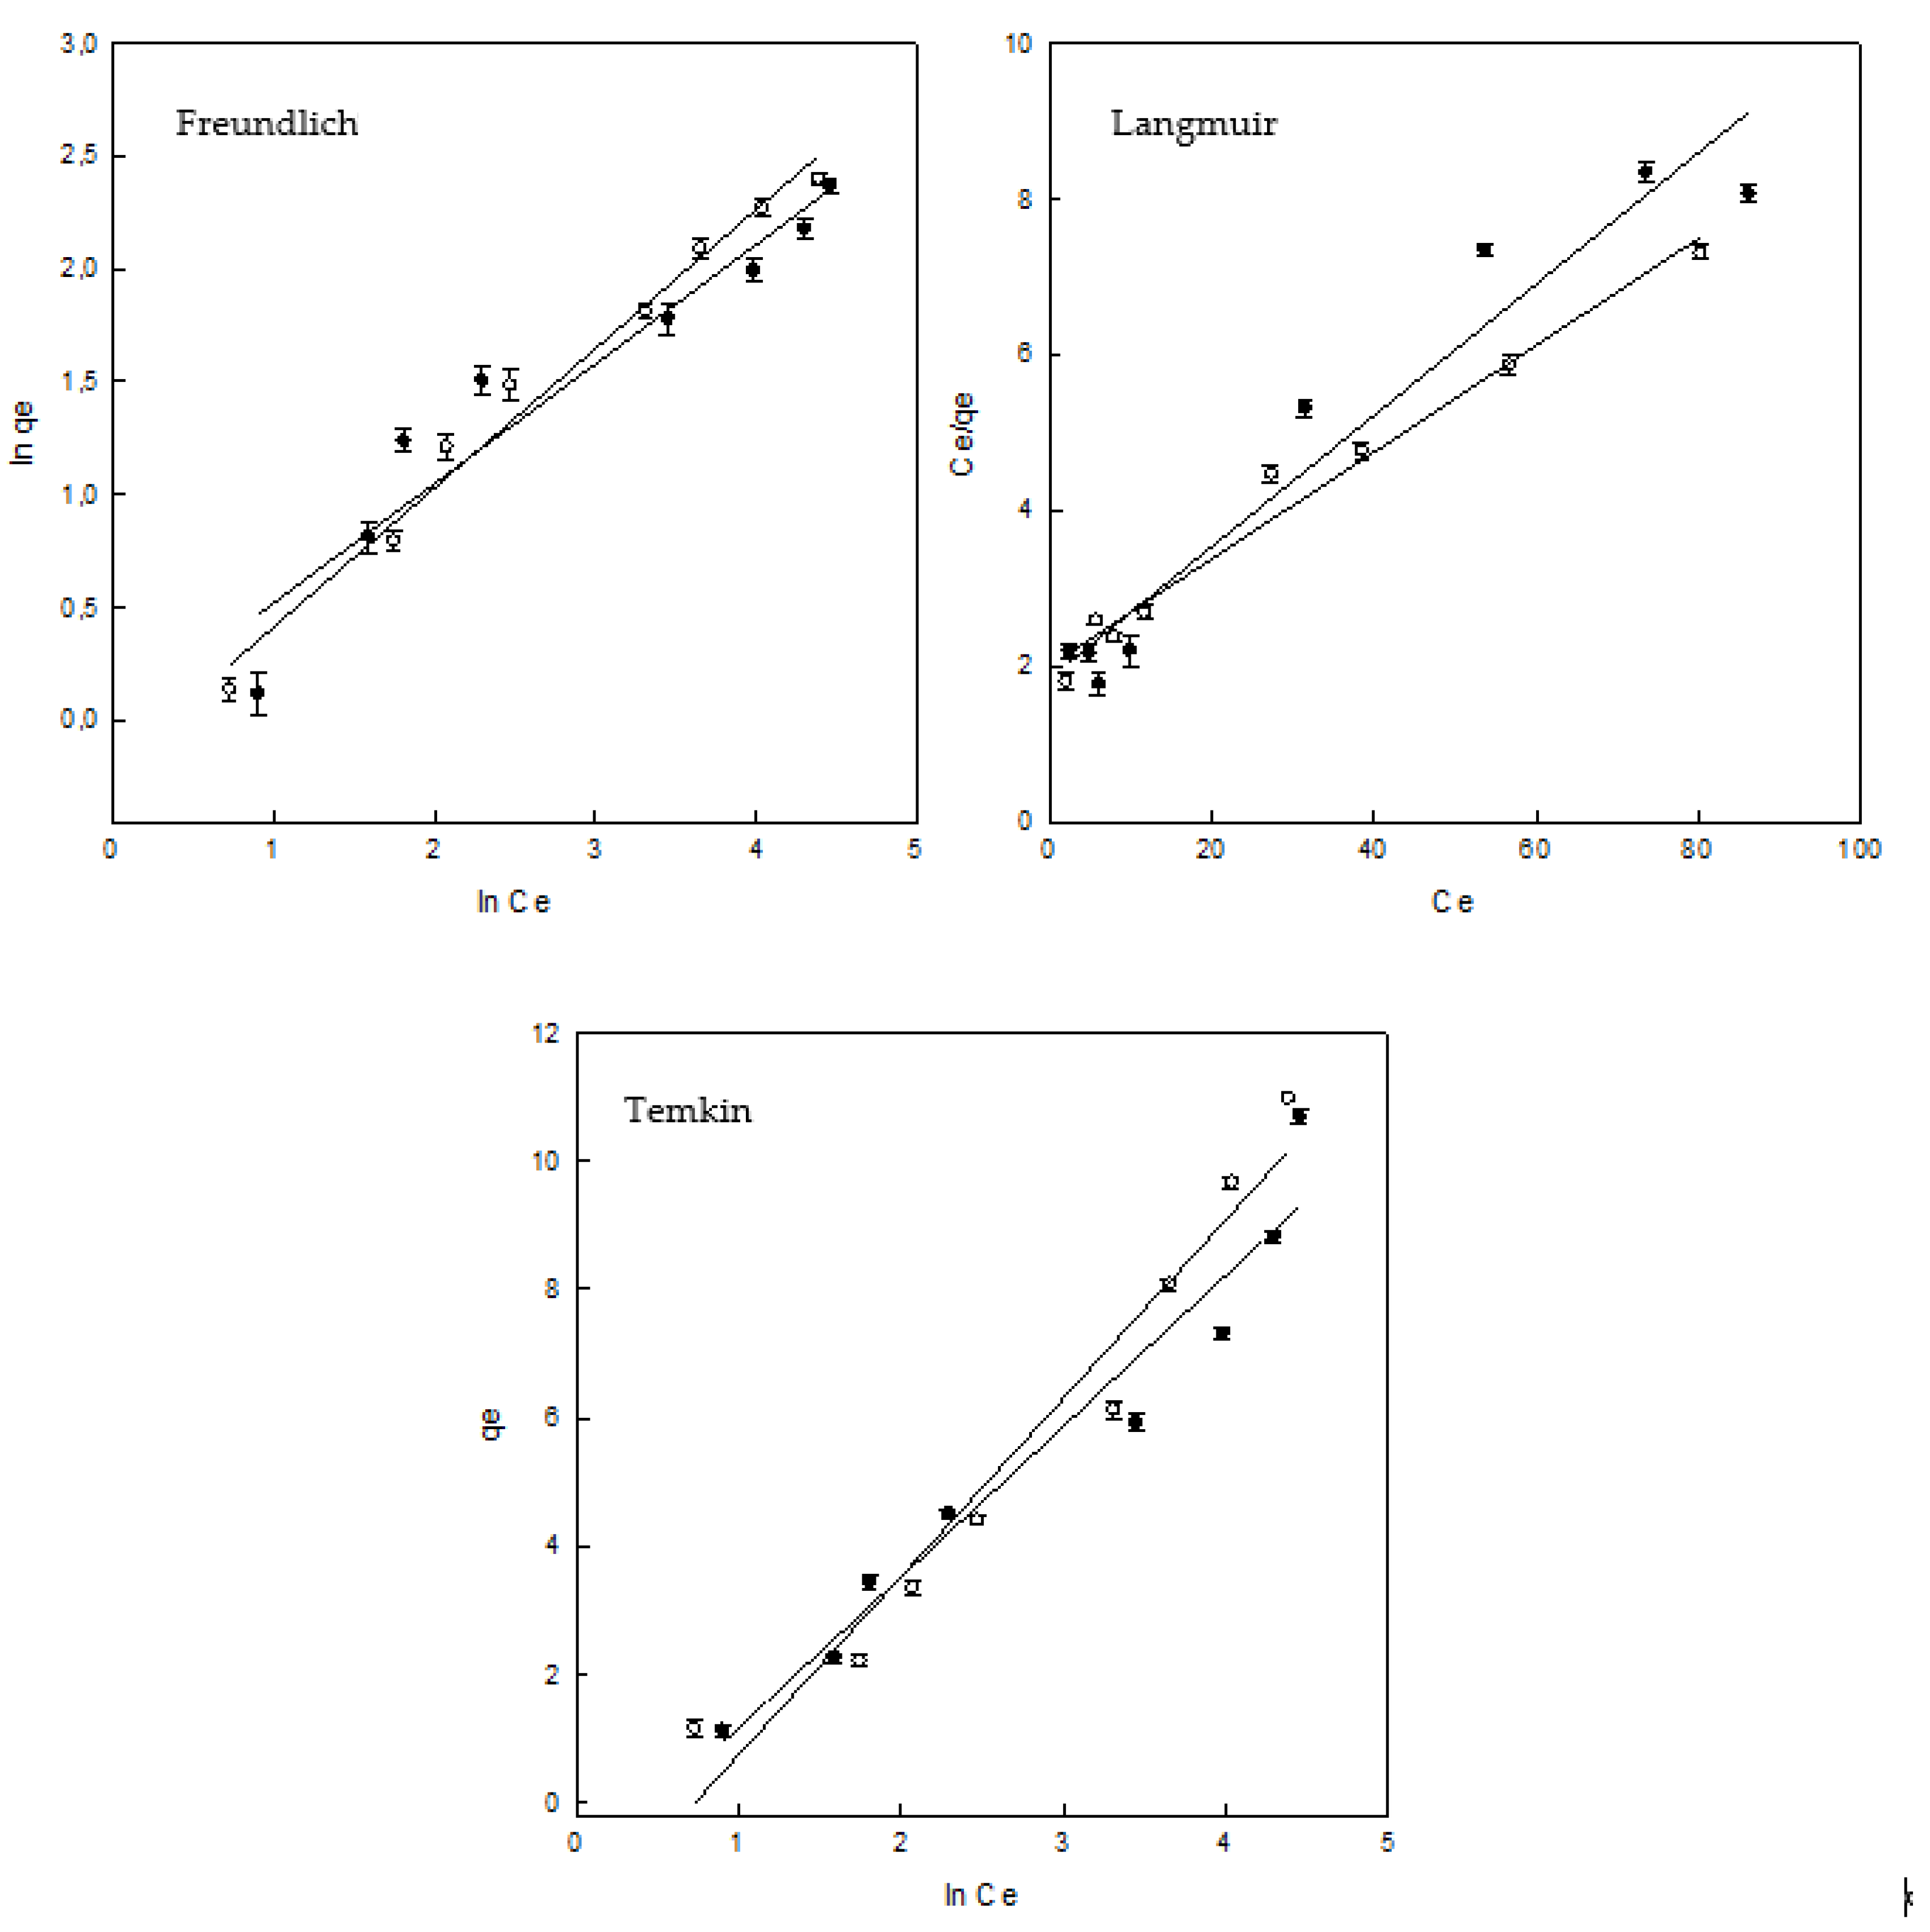
3.4. Adsorption Equilibrium
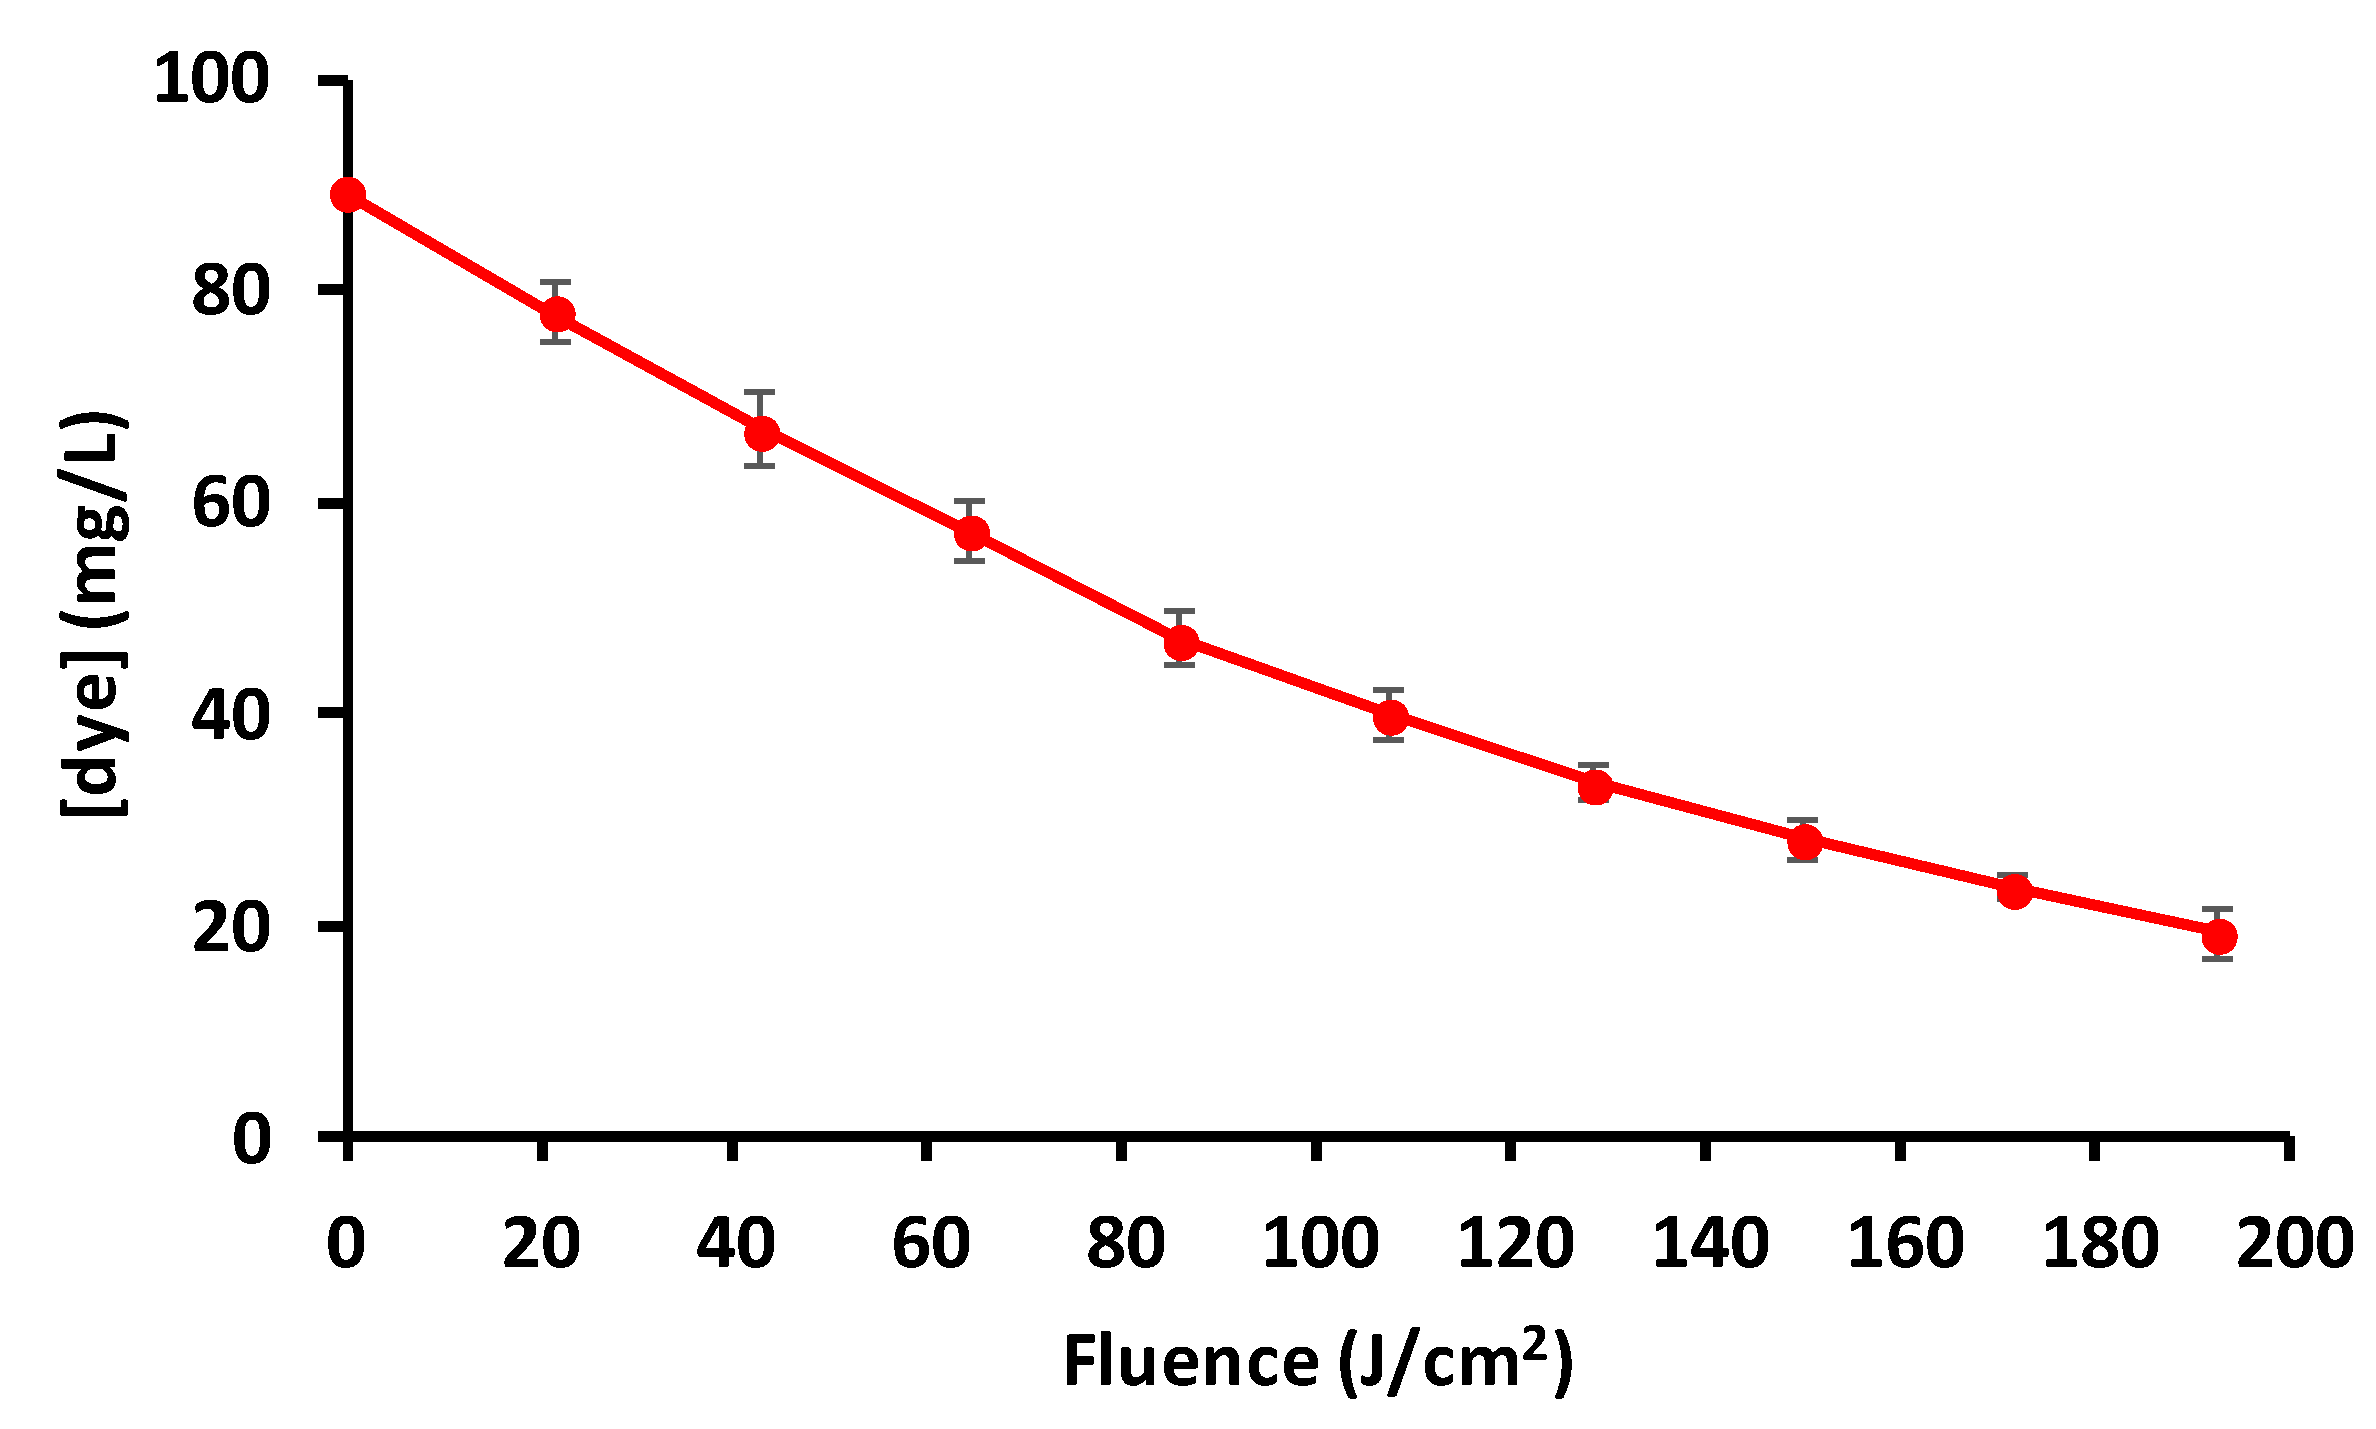
3.5. Advanced Oxidation Process (AOP)
4. Conclusions
Supplementary Materials
Author Contributions
Funding
Conflicts of Interest
References
- Khan, M.; Lo, I.M. Removal of ionizable aromatic pollutants from contaminated water using nano γ-Fe2O3 based magnetic cationic hydrogel: Sorptive performance, magnetic separation and reusability. J. Hazard. Mater. 2017, 322, 195–204. [Google Scholar] [CrossRef]
- Forgacs, E.; Cserháti, T.; Oros, G. Removal of synthetic dyes from wastewaters: A review. Environ. Int. 2004, 30, 953–971. [Google Scholar] [CrossRef]
- Rizzi, V.; D’Agostino, F.; Fini, P.; Semeraro, P.; Cosma, P. An interesting environmental friendly cleanup: The excellent potential of olive pomace for disperse blue adsorption/desorption from wastewater. Dye. Pigment. 2017, 140, 480–490. [Google Scholar] [CrossRef]
- Luo, X.; Zhang, L. High effective adsorption of organic dyes on magnetic cellulose beads entrapping activated carbon. J. Hazard. Mater. 2009, 171, 340–347. [Google Scholar] [CrossRef]
- Yagub, M.T.; Sen, T.K.; Afroze, S.; Ang, H. Dye and its removal from aqueous solution by adsorption: A review. Adv. Colloid Interface Sci. 2014, 209, 172–184. [Google Scholar] [CrossRef]
- Zhu, H.-Y.; Fu, Y.-Q.; Jiang, R.; Jiang, J.-H.; Xiao, L.; Zeng, G.-M.; Zhao, S.-L.; Wang, Y. Adsorption removal of congo red onto magnetic cellulose/Fe3O4/activated carbon composite: Equilibrium, kinetic and thermodynamic studies. Chem. Eng. J. 2011, 173, 494–502. [Google Scholar] [CrossRef]
- Murcia-Salvador, A.; Pellicer, J.A.; Gorbe, M.I.F.; Gómez-López, V.M.; Rodríguez-López, M.I.; Núñez-Delicado, E.; Gabaldón, J. Adsorption of Direct Blue 78 Using Chitosan and Cyclodextrins as Adsorbents. Polymers 2019, 11, 1003. [Google Scholar] [CrossRef] [Green Version]
- Elwakeel, K.Z. Removal of Reactive Black 5 from aqueous solutions using magnetic chitosan resins. J. Hazard. Mater. 2009, 167, 383–392. [Google Scholar] [CrossRef]
- Elwakeel, K.Z.; Shahat, A.; Khan, Z.A.; Alshitari, W.; Guibal, E. Magnetic metal oxide-organic framework material for ultrasonic-assisted sorption of titan yellow and rose bengal from aqueous solutions. Chem. Eng. J. 2020, 392, 123635. [Google Scholar] [CrossRef]
- Atia, A.A.; Donia, A.M.; Al-Amrani, W.A. Adsorption/desorption behavior of acid orange 10 on magnetic silica modified with amine groups. Chem. Eng. J. 2009, 150, 55–62. [Google Scholar] [CrossRef]
- Yao, Y.; Miao, S.; Liu, S.; Ma, L.P.; Sun, H.; Wang, S. Synthesis, characterization, and adsorption properties of magnetic Fe3O4@graphene nanocomposite. Chem. Eng. J. 2012, 184, 326–332. [Google Scholar] [CrossRef]
- Fungaro, D.A.; Yamaura, M.; Carvalho, T.E.M. Adsorption of anionic dyes from aqueous solution on zeolite from fly ash-iron oxide magnetic nanocomposite. J. At. Mol. Sci. 2011, 2, 305–316. [Google Scholar] [CrossRef]
- Khan, M.A.; Siddiqui, M.R.; Otero, M.; Alshareef, S.A.; Rafatullah, M. Removal of Rhodamine B from Water Using a Solvent Impregnated Polymeric Dowex 5WX8 Resin: Statistical Optimization and Batch Adsorption Studies. Polymers 2020, 12, 500. [Google Scholar] [CrossRef] [Green Version]
- Khan, M.A.; Wabaidur, S.M.; Siddiqui, M.R.; Alqadami, A.A.; Khan, A.H. Silico-manganese fumes waste encapsulated cryogenic alginate beads for aqueous environment de-colorization. J. Clean. Prod. 2020, 244, 118867. [Google Scholar] [CrossRef]
- Kenawy, E.-R.; Ghfar, A.A.; Wabaidur, S.M.; Khan, M.A.; Siddiqui, M.R.; Alothman, Z.A.; Alqadami, A.A.; Hamid, M. Cetyltrimethylammonium bromide intercalated and branched polyhydroxystyrene functionalized montmorillonite clay to sequester cationic dyes. J. Environ. Manag. 2018, 219, 285–293. [Google Scholar] [CrossRef]
- Pellicer, J.A.; Rodríguez-López, M.I.; Fortea, M.I.; Hernández, J.A.G.; Lucas-Abellán, C.; Ros, M.T.M.; Serrano-Martínez, A.; Núñez-Delicado, E.; Cosma, P.; Fini, P.; et al. Removing of Direct Red 83:1 using α- and HP-α-CDs polymerized with epichlorohydrin: Kinetic and equilibrium studies. Dye. Pigment. 2018, 149, 736–746. [Google Scholar] [CrossRef]
- Pellicer, J.A.; Rodríguez-López, M.I.; Gorbe, M.I.F.; Lucas-Abellán, C.; Ros, M.T.M.; López-Miranda, S.; Gómez-López, V.M.; Semeraro, P.; Cosma, P.; Fini, P.; et al. Adsorption Properties of β- and Hydroxypropyl-β-Cyclodextrins Cross-Linked with Epichlorohydrin in Aqueous Solution. A Sustainable Recycling Strategy in Textile Dyeing Process. Polymers 2019, 11, 252. [Google Scholar] [CrossRef] [Green Version]
- Crini, G. Review: A History of Cyclodextrins. Chem. Rev. 2014, 114, 10940–10975. [Google Scholar] [CrossRef]
- Lucas-Abellán, C.; Fortea, M.; Gabaldon, J.; Núñez-Delicado, E. Complexation of resveratrol by native and modified cyclodextrins: Determination of complexation constant by enzymatic, solubility and fluorimetric assays. Food Chem. 2008, 111, 262–267. [Google Scholar] [CrossRef]
- Gidwani, B.; Vyas, A. Synthesis, characterization and application of Epichlorohydrin-β-cyclodextrin polymer. Colloids Surfaces B Biointerfaces 2014, 114, 130–137. [Google Scholar] [CrossRef] [PubMed]
- Crini, G.; Morcellet, M. Synthesis and applications of adsorbents containing cyclodextrins. J. Sep. Sci. 2002, 25, 789–813. [Google Scholar] [CrossRef]
- Gómez-López, V.M.; Ragaert, P.; Debevere, J.; Devlieghere, F. Pulsed light for food decontamination: A review. Trends Food Sci. Technol. 2007, 18, 464–473. [Google Scholar] [CrossRef]
- Martínez-López, S.; Lucas-Abellán, C.; Serrano-Martínez, A.; Mercader-Ros, M.T.; Cuartero, N.; Navarro, P.; Pérez, S.; Gabaldón, J.A.; Gómez-López, V.M. Pulsed light for a cleaner dyeing industry: Azo dye degradation by an advanced oxidation process driven by pulsed light. J. Clean. Prod. 2019, 217, 757–766. [Google Scholar] [CrossRef]
- Renard, E.; Deratani, A.; Volet, G.; Sebille, B. Preparation and characterization of water soluble high molecular weight β-cyclodextrin-epichlorohydrin polymers. Eur. Polym. J. 1997, 33, 49–57. [Google Scholar] [CrossRef]
- Yuan, J.; Qiu, F.; Li, P. Synthesis and characterization of β-cyclodextrin–carboxymethyl cellulose–graphene oxide composite materials and its application for removal of basic fuchsin. J. Iran. Chem. Soc. 2017, 193, 1827–1837. [Google Scholar] [CrossRef]
- Shi, X.-N.; Wang, W.-B.; Wang, A. Effect of surfactant on porosity and swelling behaviors of guar gum-g-poly(sodium acrylate-co-styrene)/attapulgite superabsorbent hydrogels. Colloids Surfaces B Biointerfaces 2011, 88, 279–286. [Google Scholar] [CrossRef]
- Cudemos, E.; Izquier, A.; Medina-Martínez, M.; Gómez-López, V.M. Effects of shading and growth phase on the microbial inactivation by pulsed light. Czech J. Food Sci. 2013, 31, 189–193. [Google Scholar] [CrossRef] [Green Version]
- Lagergren, S. Zur theorie der sogenannten adsorption gelöster stoffe, kungliga svenska vetenskapsakademiens. Handlingar 1898, 24, 1–39. [Google Scholar]
- Ho, Y. Review of second-order models for adsorption systems. J. Hazard. Mater. 2006, 136, 681–689. [Google Scholar] [CrossRef] [Green Version]
- Bengtson, R.L.; Carter, C.E.; Morris, H.F.; Kowalczuk, J.G. Reducing Water Pollution with Subsurface Drainage. Trans. ASAE 1984, 27, 0080–0083. [Google Scholar] [CrossRef]
- Banerjee, S.; Sharma, G.C.; Chattopadhyaya, M.; Sharma, Y.C. Kinetic and equilibrium modeling for the adsorptive removal of methylene blue from aqueous solutions on of activated fly ash (AFSH). J. Environ. Chem. Eng. 2014, 2, 1870–1880. [Google Scholar] [CrossRef]
- Anbia, M.; Salehi, S. Removal of acid dyes from aqueous media by adsorption onto amino-functionalized nanoporous silica SBA-3. Dye. Pigment. 2012, 94, 1–9. [Google Scholar] [CrossRef]
- Sarma, J.; Sarma, A.; Bhattacharyya, K.G. Biosorption of Commercial Dyes on Azadirachta indica Leaf Powder: A Case Study with a Basic Dye Rhodamine B. Ind. Eng. Chem. Res. 2008, 47, 5433–5440. [Google Scholar] [CrossRef]
- Freundlich, H.M.F. Over the adsorption in solution. J. Phys. Chem. A. 1906, 57, 385–471. [Google Scholar]
- Langmuir, I. The adsorption of gases on plane surfaces of glass, mica and platinum. J. Am. Chem. Soc. 1918, 40, 1361–1403. [Google Scholar] [CrossRef] [Green Version]
- Temkin, M.I.; Pyzhev, V. Kinetic of ammonia synthesis on promoted iron catalyst. Acta Phy. Chem USSR 1940, 12, 327–356. [Google Scholar]
- Rizzi, V.; Fiorini, F.; Lamanna, G.; Gubitosa, J.; Prasetyanto, E.A.; Fini, P.; Fanelli, F.; Nacci, A.; De Cola, L.; Cosma, P. Polyamidoamine-Based Hydrogel for Removal of Blue and Red Dyes from Wastewater. Adv. Sustain. Syst. 2018, 2, 1700146. [Google Scholar] [CrossRef]
- Rizzi, V.; Prasetyanto, E.A.; Chen, P.; Gubitosa, J.; Fini, P.; Agostiano, A.; De Cola, L.; Cosma, P. Amino grafted MCM-41 as highly efficient and reversible ecofriendly adsorbent material for the Direct Blue removal from wastewater. J. Mol. Liq. 2019, 273, 435–446. [Google Scholar] [CrossRef]
- Hu, X.-J.; Wang, J.-S.; Liu, Y.; Li, X.; Zeng, G.-M.; Bao, Z.-L.; Zeng, X.-X.; Chen, A.; Long, F. Adsorption of chromium (VI) by ethylenediamine-modified cross-linked magnetic chitosan resin: Isotherms, kinetics and thermodynamics. J. Hazard. Mater. 2011, 185, 306–314. [Google Scholar] [CrossRef]
- Wang, D.; Liu, L.; Jiang, X.; Yu, J.; Chen, X. Adsorption and removal of malachite green from aqueous solution using magnetic β-cyclodextrin-graphene oxide nanocomposites as adsorbents. Colloids Surfaces A Physicochem. Eng. Asp. 2015, 466, 166–173. [Google Scholar] [CrossRef]
- Teng, M.; Li, F.; Zhang, B.; Taha, A.A. Electrospun cyclodextrin-functionalized mesoporous polyvinyl alcohol/SiO2 nanofiber membranes as a highly efficient adsorbent for indigo carmine dye. Colloids Surfaces A Physicochem. Eng. Asp. 2011, 385, 229–234. [Google Scholar] [CrossRef]
- Vahedi, S.; Tavakoli, O.; Khoobi, M.; Ansari, A.; Faramarzi, M.A. Application of novel magnetic β -cyclodextrin-anhydride polymer nano-adsorbent in cationic dye removal from aqueous solution. J. Taiwan Inst. Chem. Eng. 2017, 80, 452–463. [Google Scholar] [CrossRef]
- Badruddoza, A.; Hazel, G.S.S.; Hidajat, K.; Uddin, M. Synthesis of carboxymethyl-β-cyclodextrin conjugated magnetic nano-adsorbent for removal of methylene blue. Colloids Surfaces A Physicochem. Eng. Asp. 2010, 367, 85–95. [Google Scholar] [CrossRef]
- Massaro, M.; Colletti, C.G.; Lazzara, G.; Guernelli, S.; Noto, R.; Riela, S. Synthesis and Characterization of Halloysite–Cyclodextrin Nanosponges for Enhanced Dyes Adsorption. ACS Sustain. Chem. Eng. 2017, 5, 3346–3352. [Google Scholar] [CrossRef] [Green Version]
- Zhao, N.; Zhao, L.; Zhu, C.-S.; Huang, W.-Q.; Hu, J.-L. Water-insoluble β-cyclodextrin polymer crosslinked by citric acid: Synthesis and adsorption properties toward phenol and methylene blue. J. Incl. Phenom. Macrocycl. Chem. 2008, 63, 195–201. [Google Scholar] [CrossRef]
- Crini, G.; Peindy, H.; Gimbert, F.; Robert, C. Removal of C.I. Basic Green 4 (Malachite Green) from aqueous solutions by adsorption using cyclodextrin-based adsorbent: Kinetic and equilibrium studies. Sep. Purif. Technol. 2007, 53, 97–110. [Google Scholar] [CrossRef]
- Mohamed, M.H.; Wilson, L.D.; Headley, J.V.; Peru, K.M. Investigation of the sorption properties of β-cyclodextrin-based polyurethanes with phenolic dyes and naphthenates. J. Colloid Interface Sci. 2011, 356, 217–226. [Google Scholar] [CrossRef]
- Kyzas, G.Z.; Lazaridis, N.K.; Bikiaris, D.N. Optimization of chitosan and β-cyclodextrin molecularly imprinted polymer synthesis for dye adsorption. Carbohydr. Polym. 2013, 91, 198–208. [Google Scholar] [CrossRef]
- Alsbaiee, A.; Smith, B.J.; Xiao, L.; Ling, Y.; Helbling, D.E.; Dichtel, W.R. Rapid removal of organic micropollutants from water by a porous β-cyclodextrin polymer. Nature 2015, 529, 190–194. [Google Scholar] [CrossRef]
- Semeraro, P.; Gabaldón, J.; Fini, P.; Núñez-Delicado, E.; Pellicer, J.A.; Rizzi, V.; Cosma, P. Removal of an Azo Textile Dye from Wastewater by Cyclodextrin-Epichlorohydrin Polymers; IntechOpen: London, UK, 2018; p. 303. [Google Scholar]
- Ozyilmaz, E.; Memon, S.; Yilmaz, M. Removal of direct azo dyes and aromatic amines from aqueous solutions using two β-cyclodextrin-based polymers. J. Hazard. Mater. 2010, 174, 592–597. [Google Scholar] [CrossRef]
- Pratt, D.Y.; Wilson, L.D.; Kozinski, J.A.; Mohart, A.M. Preparation and sorption studies of β-cyclodextrin/epichlorohydrin copolymers. J. Appl. Polym. Sci. 2010, 116, 2982–2989. [Google Scholar] [CrossRef]
- Zhao, F.; Repo, E.; Yin, D.; Meng, Y.; Jafari, S.; Sillanpää, M. EDTA-Cross-Linked β-Cyclodextrin: An Environmentally Friendly Bifunctional Adsorbent for Simultaneous Adsorption of Metals and Cationic Dyes. Environ. Sci. Technol. 2015, 49, 10570–10580. [Google Scholar] [CrossRef] [PubMed]
- Zhou, X.; Zhou, X. The unit problem in the thermodynamic calculation of adsorption using the Langmuir equation. Chem. Eng. Commun. 2014, 201, 1459–1467. [Google Scholar] [CrossRef]
- Murcia-Salvador, A.; Pellicer, J.A.; Rodríguez-López, M.I.; Gómez-López, V.M.; Núñez-Delicado, E.; Gabaldón, J. Egg By-Products as a Tool to Remove Direct Blue 78 Dye from Wastewater: Kinetic, Equilibrium Modeling, Thermodynamics and Desorption Properties. Materials 2020, 13, 1262. [Google Scholar] [CrossRef] [PubMed] [Green Version]
- Chen, D.; Chen, P.; Cheng, Y.; Peng, P.; Liu, J.; Ma, Y.; Liu, Y.; Ruan, R. Deoxynivalenol Decontamination in Raw and Germinating Barley Treated by Plasma-Activated Water and Intense Pulsed Light. Food Bioprocess Technol. 2018, 12, 246–254. [Google Scholar] [CrossRef]


| Adsorbent Properties | γ–CDs–EPI | HP–γ–CDs–EPI |
|---|---|---|
| Swelling capacity (Qeq, g/g) | 0.59 ± 0.02 | 0.61 ± 0.03 |
| Porosity (%) | 55.6 ± 2.5 | 52.1 ± 1.1 |
| Density (g/cm3) | 1.4 ± 0.1 | 1.5 ± 0.2 |
| Particle size distribution D[4:3] (μm) | 54 | 555 |
| Span values | 6.7 | 1.8 |
| Pseudo-First Order Model (PFOM) | ||||||||
|---|---|---|---|---|---|---|---|---|
| γ–CDs–EPI | HP–γ–CDs–EPI | |||||||
| Co (mg/L) | qe exp | qe cal | k1 (min −1) | R2 | qe exp | qe cal | k1 (min −1) | R2 |
| 25 | 1.126 | 0.597 | 0.065 | 0.853 | 1.146 | 0.517 | 0.065 | 0.817 |
| 50 | 2.259 | 1.520 | 0.065 | 0.935 | 2.213 | 1.238 | 0.065 | 0.895 |
| 75 | 3.444 | 2.421 | 0.058 | 0.941 | 3.352 | 2.275 | 0.064 | 0.944 |
| 100 | 4.503 | 3.589 | 0.086 | 0.980 | 4.408 | 2.426 | 0.080 | 0.905 |
| 150 | 5.924 | 5.035 | 0.034 | 0.962 | 6.129 | 4.581 | 0.061 | 0.958 |
| 200 | 7.315 | 6.223 | 0.029 | 0.947 | 8.076 | 6.591 | 0.048 | 0.973 |
| 250 | 8.821 | 7.585 | 0.025 | 0.905 | 9.667 | 6.295 | 0.045 | 0.890 |
| 300 | 10.690 | 9.462 | 0.022 | 0.909 | 10.985 | 9.268 | 0.056 | 0.983 |
| Pseudo-Second Order Model (PSOM) | ||||||||
| Co (mg/L) | qe exp | qe cal | k2 (g/mg min) | R2 | qe exp | qe cal | k2 (g/mg min) | R2 |
| 25 | 1.126 | 1.148 | 0.293 | 0.998 | 1.146 | 1.160 | 0.416 | 0.999 |
| 50 | 2.259 | 2.341 | 0.104 | 0.999 | 2.213 | 2.272 | 0.147 | 0.999 |
| 75 | 3.444 | 3.623 | 0.052 | 0.999 | 3.352 | 3.484 | 0.068 | 0.999 |
| 100 | 4.503 | 4.672 | 0.059 | 0.999 | 4.408 | 4.504 | 0.110 | 0.999 |
| 150 | 5.924 | 6.849 | 0.0079 | 0.996 | 6.129 | 6.410 | 0.028 | 0.999 |
| 200 | 7.315 | 8.771 | 0.0049 | 0.995 | 8.076 | 8.695 | 0.012 | 0.998 |
| 250 | 8.821 | 10.869 | 0.0030 | 0.983 | 9.667 | 10.309 | 0.014 | 0.999 |
| 300 | 10.690 | 14.492 | 0.0016 | 0.966 | 10.985 | 11.764 | 0.011 | 0.998 |
| Intraparticle Diffusion Model (IDM) | ||||||||
| Co (mg/L) | qe exp | (C) | ki (mg/g min1/2) | R2 | qe exp | qe cal (C) | ki (mg/g min1/2) | R2 |
| 25 | 1.126 | 0.879 | 0.0253 | 0.622 | 1.146 | 0.959 | 0.019 | 0.667 |
| 50 | 2.259 | 1.569 | 0.0738 | 0.701 | 2.213 | 1.719 | 0.052 | 0.748 |
| 75 | 3.444 | 2.205 | 0.133 | 0.747 | 3.352 | 2.329 | 0.109 | 0.737 |
| 100 | 4.503 | 3.153 | 0.148 | 0.575 | 4.408 | 3.611 | 0.086 | 0.649 |
| 150 | 5.924 | 1.735 | 0.417 | 0.931 | 6.129 | 3.831 | 0.243 | 0.729 |
| 200 | 7.315 | 1.568 | 0.573 | 0.952 | 8.076 | 3.958 | 0.421 | 0.832 |
| 250 | 8.821 | 1.302 | 0.719 | 0.959 | 9.667 | 5.897 | 0.393 | 0.865 |
| 300 | 10.690 | 0.458 | 0.993 | 0.960 | 10.985 | 5.818 | 0.551 | 0.761 |
| Isotherm | Parameters | γ–CDs–EPI | HP–γ–CDs–EPI |
|---|---|---|---|
| Freundlich | KF (mg/g) (L/mg) 1/n | 0.992 | 0.818 |
| nF | 1.893 | 1.626 | |
| R2 | 0.920 | 0.982 | |
| Langmuir | qmax (mg/g) | 11.92 | 14.60 |
| KL (L/g) | 0.541 | 0.498 | |
| aL (L/mg) | 0.045 | 0.034 | |
| ΔG (J/mol) | −25175.97 | −24691.24 | |
| R2 | 0.942 | 0.977 | |
| RL | 0.468–0.068 | 0.539–0.089 | |
| Temkin | aT (L/g) | 0.604 | 0.480 |
| bT (J/mol) | 1.053 | 0.890 | |
| R2 | 0.946 | 0.955 |
| Polymer | Dye | qmax (mg/g) | Experimental Conditions | Reference |
|---|---|---|---|---|
| MNP–β–CDs–GO | Malachite green | 740 | Adsorbent: 5 mg Dye: 50–700 mg/L 25–45 °C | [40] |
| β–CDs–PVA | Indigo carmine | 287–495 | Adsorbent: 0.01g Dye: 90–720 mg/L 25 °C | [41] |
| β–CDs–MNP | Rhodamine B Methylene Blue | 250 333 | Adsorbent: 0.5–2 g/L Dye: 50–500 mg/L 25 °C | [42] |
| CM–β–CDs–MNP | Methylene Blue | 140–277 | Adsorbent: 120–130 mg Dye: 0.1–3 mg/mL 25 °C | [43] |
| HNT–CDs | Rhodamine B | 226 | Adsorbent: 5 mg Dye: 2 × 10⁻⁵ M 25 °C | [44] |
| β–CDs–EPI | DR 83:1 | 107.5 | Adsorbent: 1 g Dye: 25–300 mg/L 25 °C | [17] |
| β–CDs–CA | Methylene Blue | 105 | Adsorbent: 0.1 g Dye: 10–50 mg/L 30 °C | [45] |
| β–CDs–EPI | Malachite green | 91.9 | Adsorbent: 0.15 g Dye: 20–200 mg/L 25 °C | [46] |
| β–CDs–PE | p-Nitrophenol Phenolphthalein Naphthenates | 20–75 | Adsorbent: 20 mg Dye: 10–100 mg/L 25 °C | [47] |
| β–CDs–MIP | Trichromatic mixture | 35.0 | Adsorbent: 0.05 g Dye: 10–70 mg/L 25 °C | [48] |
| α–CDs–EPI | DR 83:1 | 31.5 | Adsorbent: 1 g Dye: 25–300 mg/L 25 °C | [16] |
| HP–α–CDs–EPI | DR 83:1 | 23.4 | Adsorbent: 1 g Dye: 25–300 mg/L 25 °C | [16] |
| β–CDs–TFT | Bisphenol A | 19–24 | Adsorbent: 0.5 mg/mL Dye: 0.04 mM 25 °C | [49] |
| β–CDs–EPI | Direct Blue 78 | 23.5 | Adsorbent: 1 g Dye: 25–300 mg/L 25 °C | [7] |
| HP–β–CDs–EPI | DR 83:1 | 18.2 | Adsorbent: 1 g Dye: 25–300 mg/L 25 °C | [17] |
| HP–γ–CDs–EPI | DR 83:1 | 14.6 | Adsorbent: 1 g Dye: 25–300 mg/L 25 °C | This work |
| γ–CDs–EPI | Direct Blue 78 | 14.15 | Adsorbent: 1 g Dye: 11–70 mg/L 25 °C | [50] |
| γ–CDs–EPI | DR 83:1 | 11.9 | Adsorbent: 1 g Dye: 25–300 mg/L 25 °C | This work |
| β–CDs–HDMI | Evans Blue Chicago Sky Blue | 10.6–12.1 | Adsorbent: 25 mg Dye: 1 × 10⁻³ M 25 °C | [51] |
| β–CDs–MDI | Evans Blue Chicago Sky Blue | 7.6–9.6 | Adsorbent: 25 mg Dye: 1 × 10⁻³ M 25 °C | [51] |
| β–CDs–EPI | p-Nitrophenol | 0.8 | Adsorbent: 20 mg Dye: 0.2–10 mM 22–45 °C | [52] |
| β–CDs–EDTA | Methylene Blue Safranin O Crystal Violet | 0.26 0.17 0.28 | Adsorbent: 10 mg Dye: 10–500 mg/L 25 °C | [53] |
| Advantages of CDs Polymers |
|---|
| Limited use of reagents employed in the synthesis |
| Cyclodextrins are cheap compounds |
| No toxic or harmful components remains in the polymeric adsorbents |
| Cyclodextrin polymers can be stored for long periods |
| These polymers can be reused many times effectively |
| The desorption is easily achieved |
© 2020 by the authors. Licensee MDPI, Basel, Switzerland. This article is an open access article distributed under the terms and conditions of the Creative Commons Attribution (CC BY) license (http://creativecommons.org/licenses/by/4.0/).
Share and Cite
Pellicer, J.A.; Rodríguez-López, M.I.; Fortea, M.I.; Gómez-López, V.M.; Auñón, D.; Núñez-Delicado, E.; Gabaldón, J.A. Synthesis of New Cyclodextrin-Based Adsorbents to Remove Direct Red 83:1. Polymers 2020, 12, 1880. https://doi.org/10.3390/polym12091880
Pellicer JA, Rodríguez-López MI, Fortea MI, Gómez-López VM, Auñón D, Núñez-Delicado E, Gabaldón JA. Synthesis of New Cyclodextrin-Based Adsorbents to Remove Direct Red 83:1. Polymers. 2020; 12(9):1880. https://doi.org/10.3390/polym12091880
Chicago/Turabian StylePellicer, José A., María Isabel Rodríguez-López, María Isabel Fortea, Vicente M. Gómez-López, David Auñón, Estrella Núñez-Delicado, and José A. Gabaldón. 2020. "Synthesis of New Cyclodextrin-Based Adsorbents to Remove Direct Red 83:1" Polymers 12, no. 9: 1880. https://doi.org/10.3390/polym12091880
APA StylePellicer, J. A., Rodríguez-López, M. I., Fortea, M. I., Gómez-López, V. M., Auñón, D., Núñez-Delicado, E., & Gabaldón, J. A. (2020). Synthesis of New Cyclodextrin-Based Adsorbents to Remove Direct Red 83:1. Polymers, 12(9), 1880. https://doi.org/10.3390/polym12091880