Kinetics and Thermodynamics of Thermal Degradation of Different Starches and Estimation the OH Group and H2O Content on the Surface by TG/DTG-DTA


Abstract
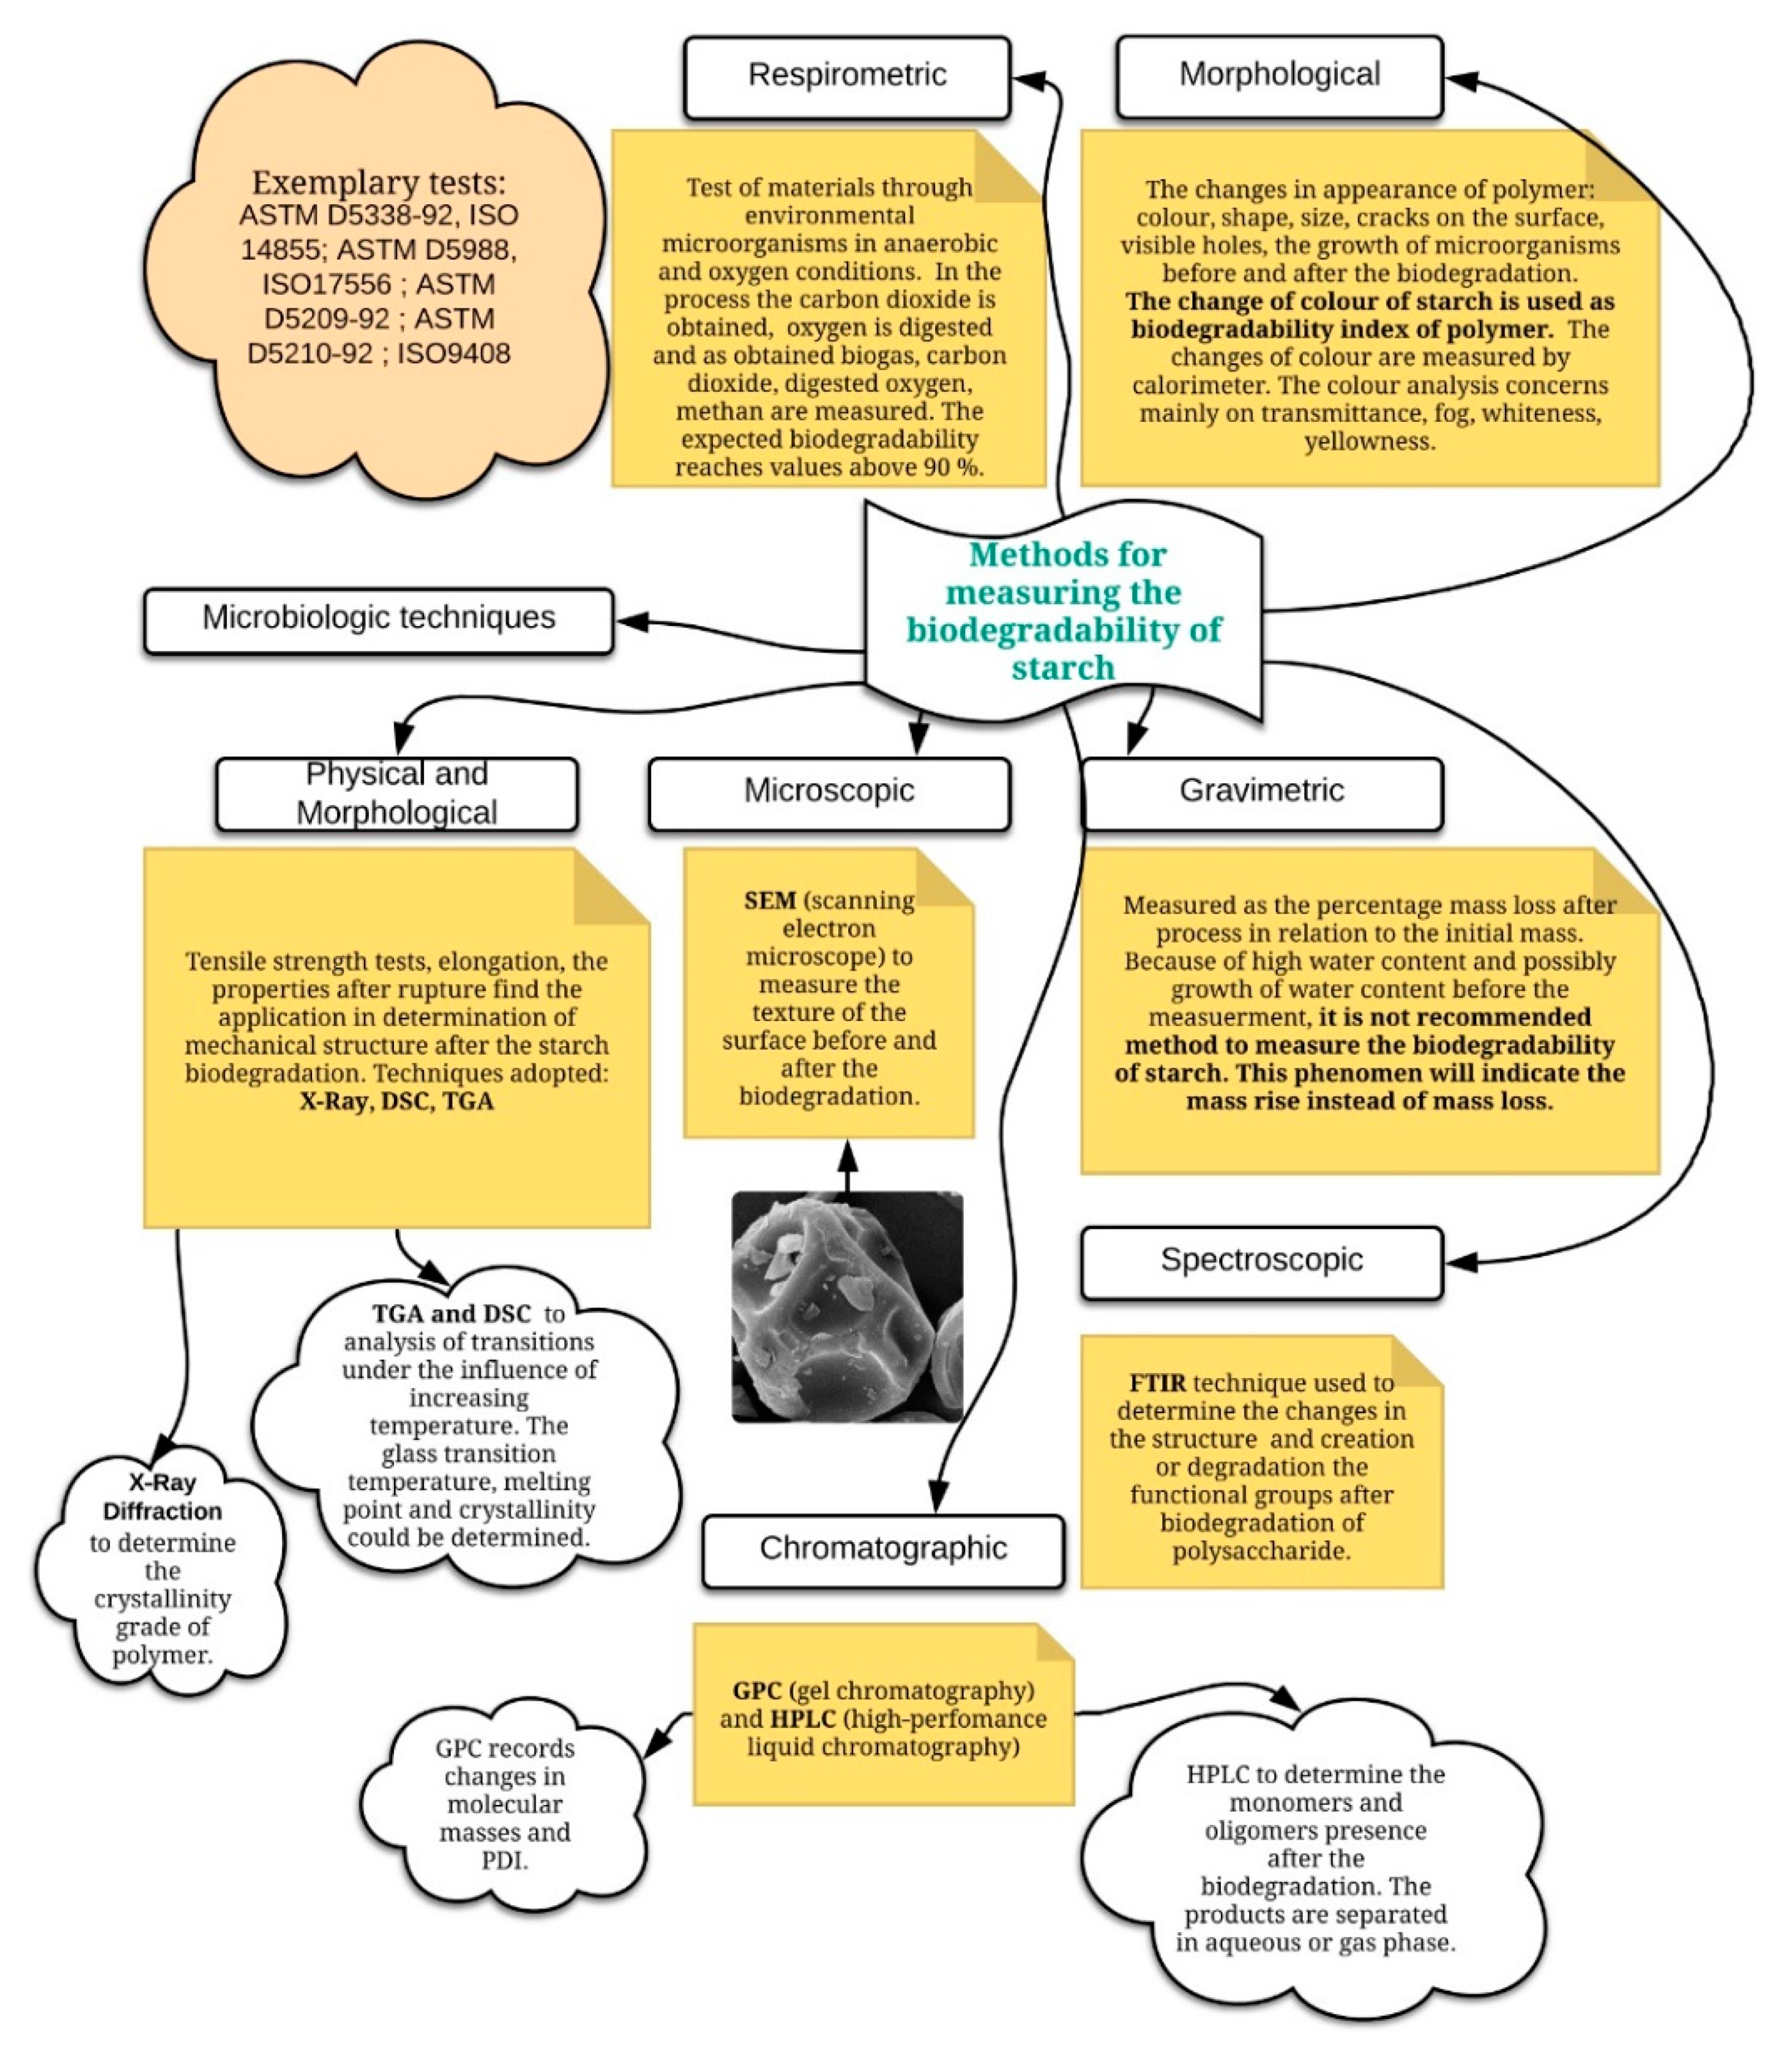
:1. Introduction
2. Materials and Methods
2.1. Materials
2.2. Thermogravimetric Analysis/Difference Thermal Gravimetry/Differental Thermal Analysis (TG/DTG-DTA) Experimental
2.3. Methods Adopted to Obtain the Kinetics
3. Results
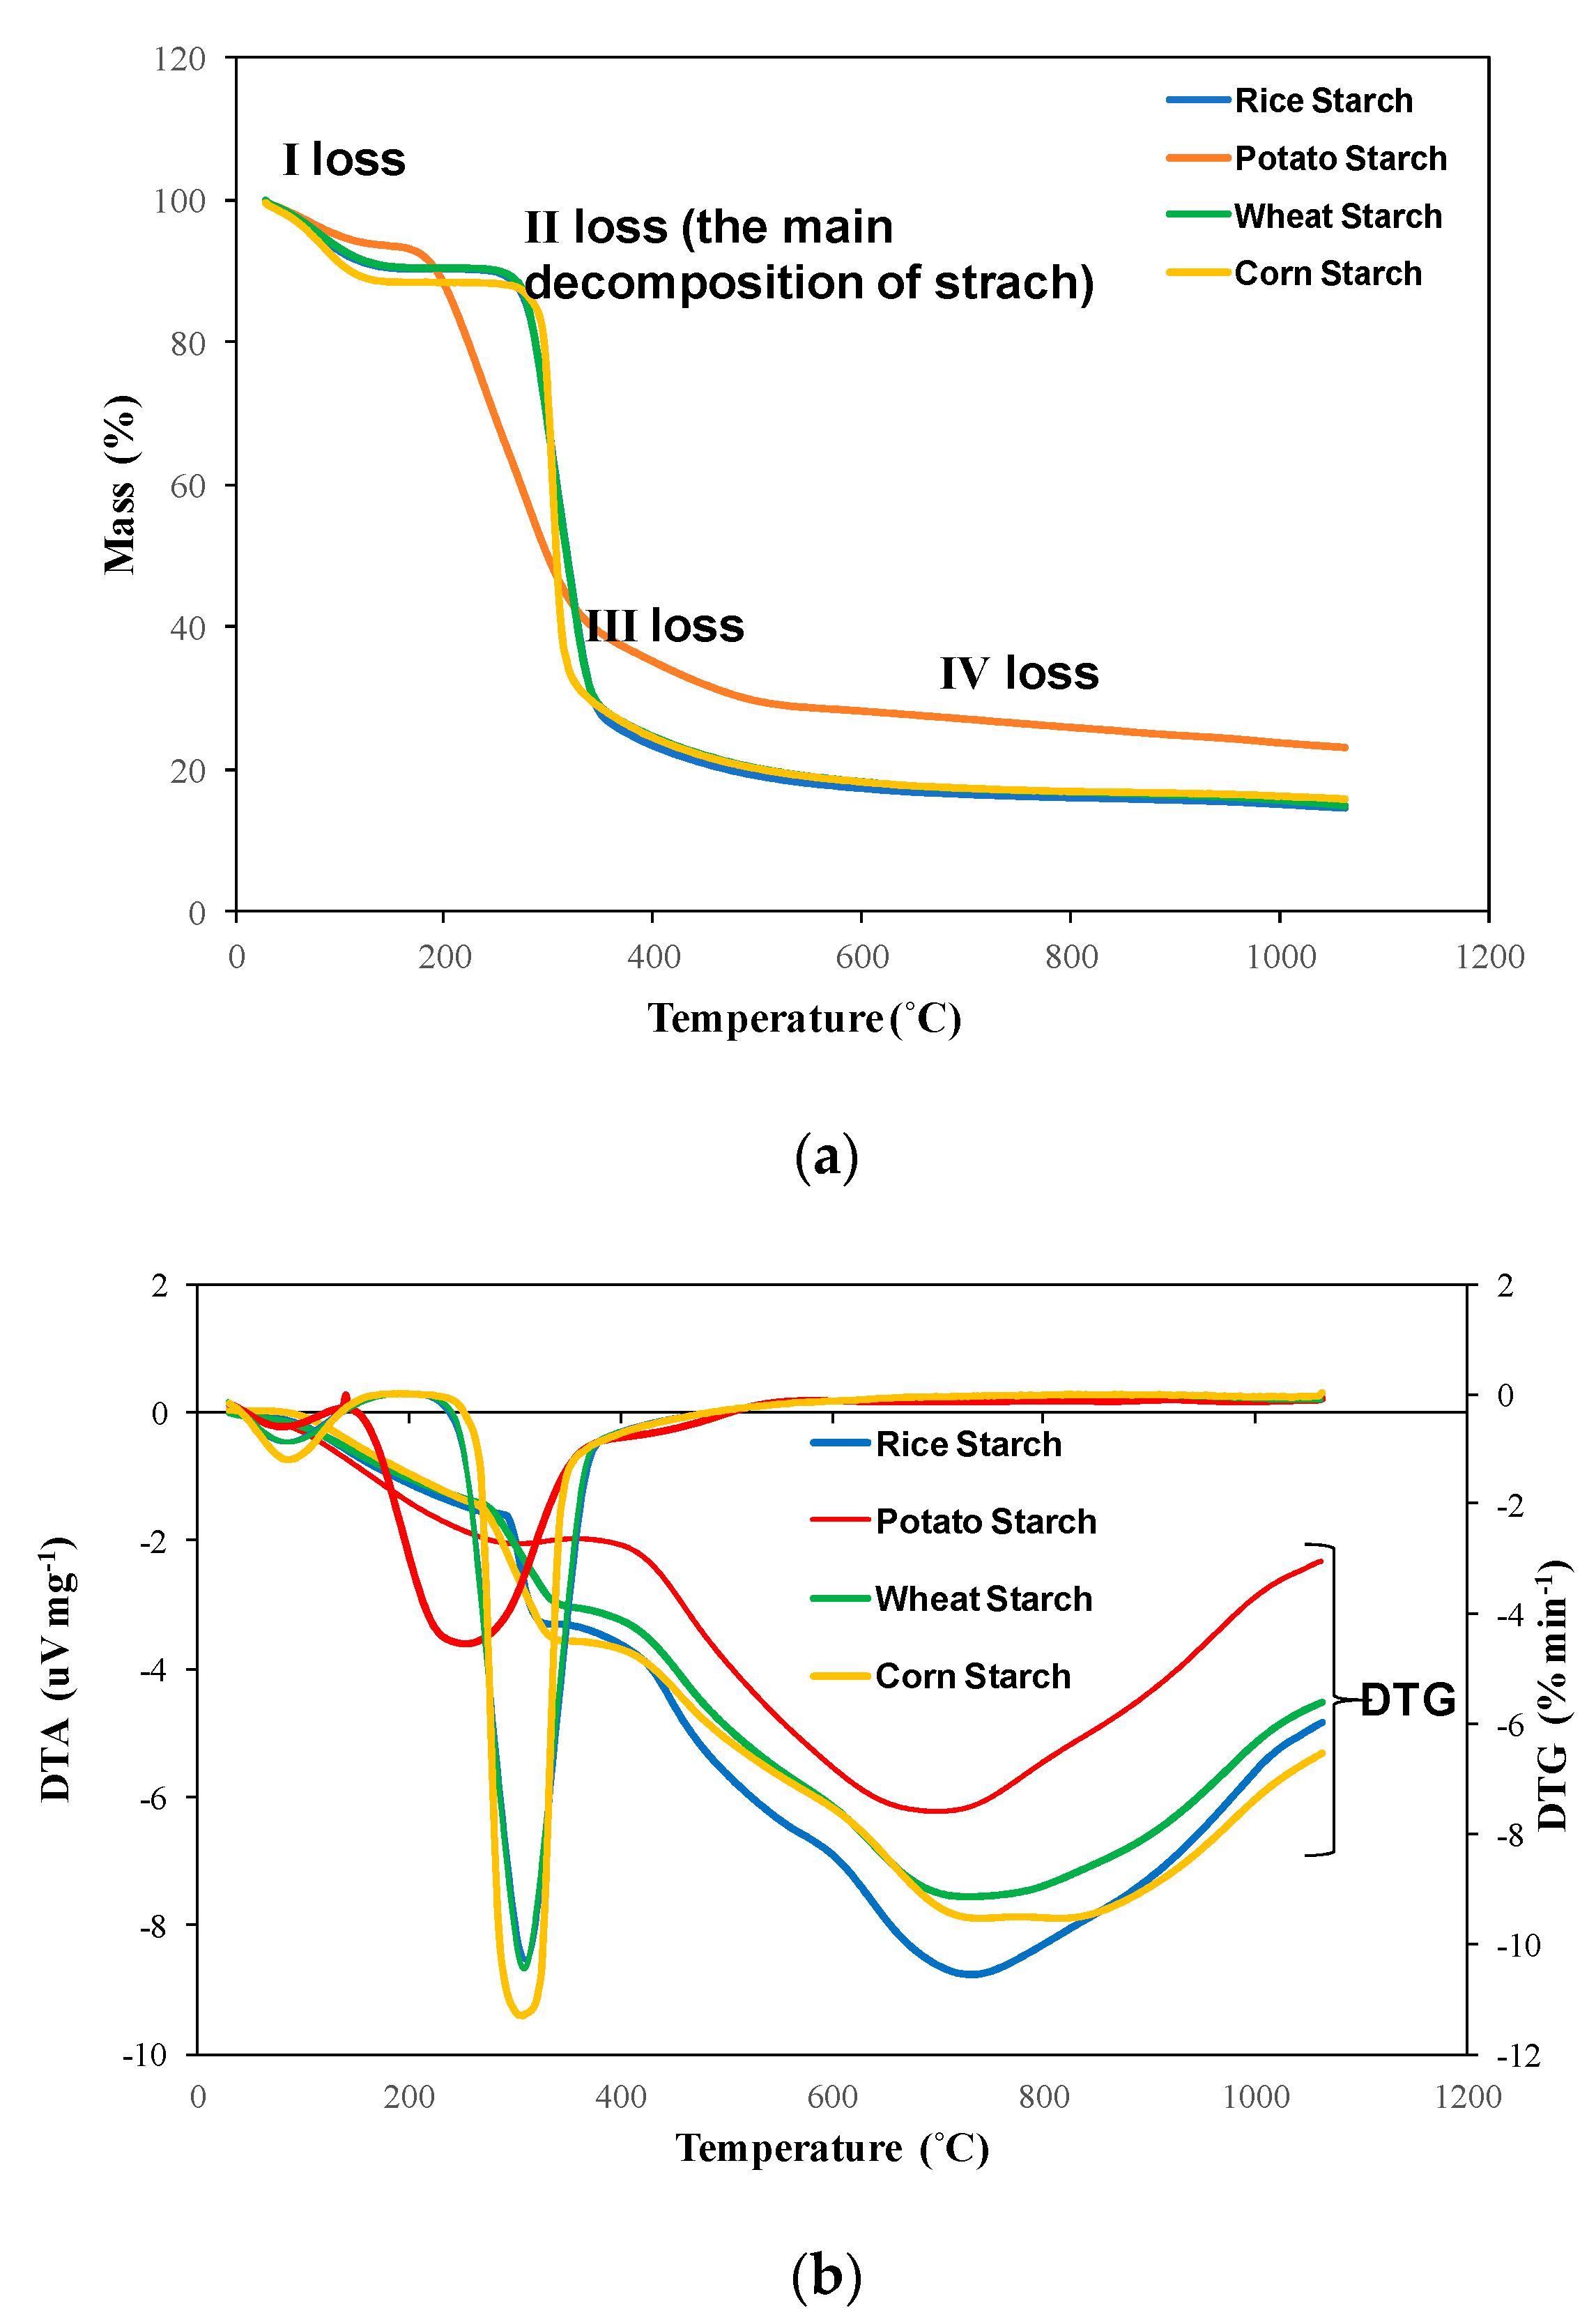
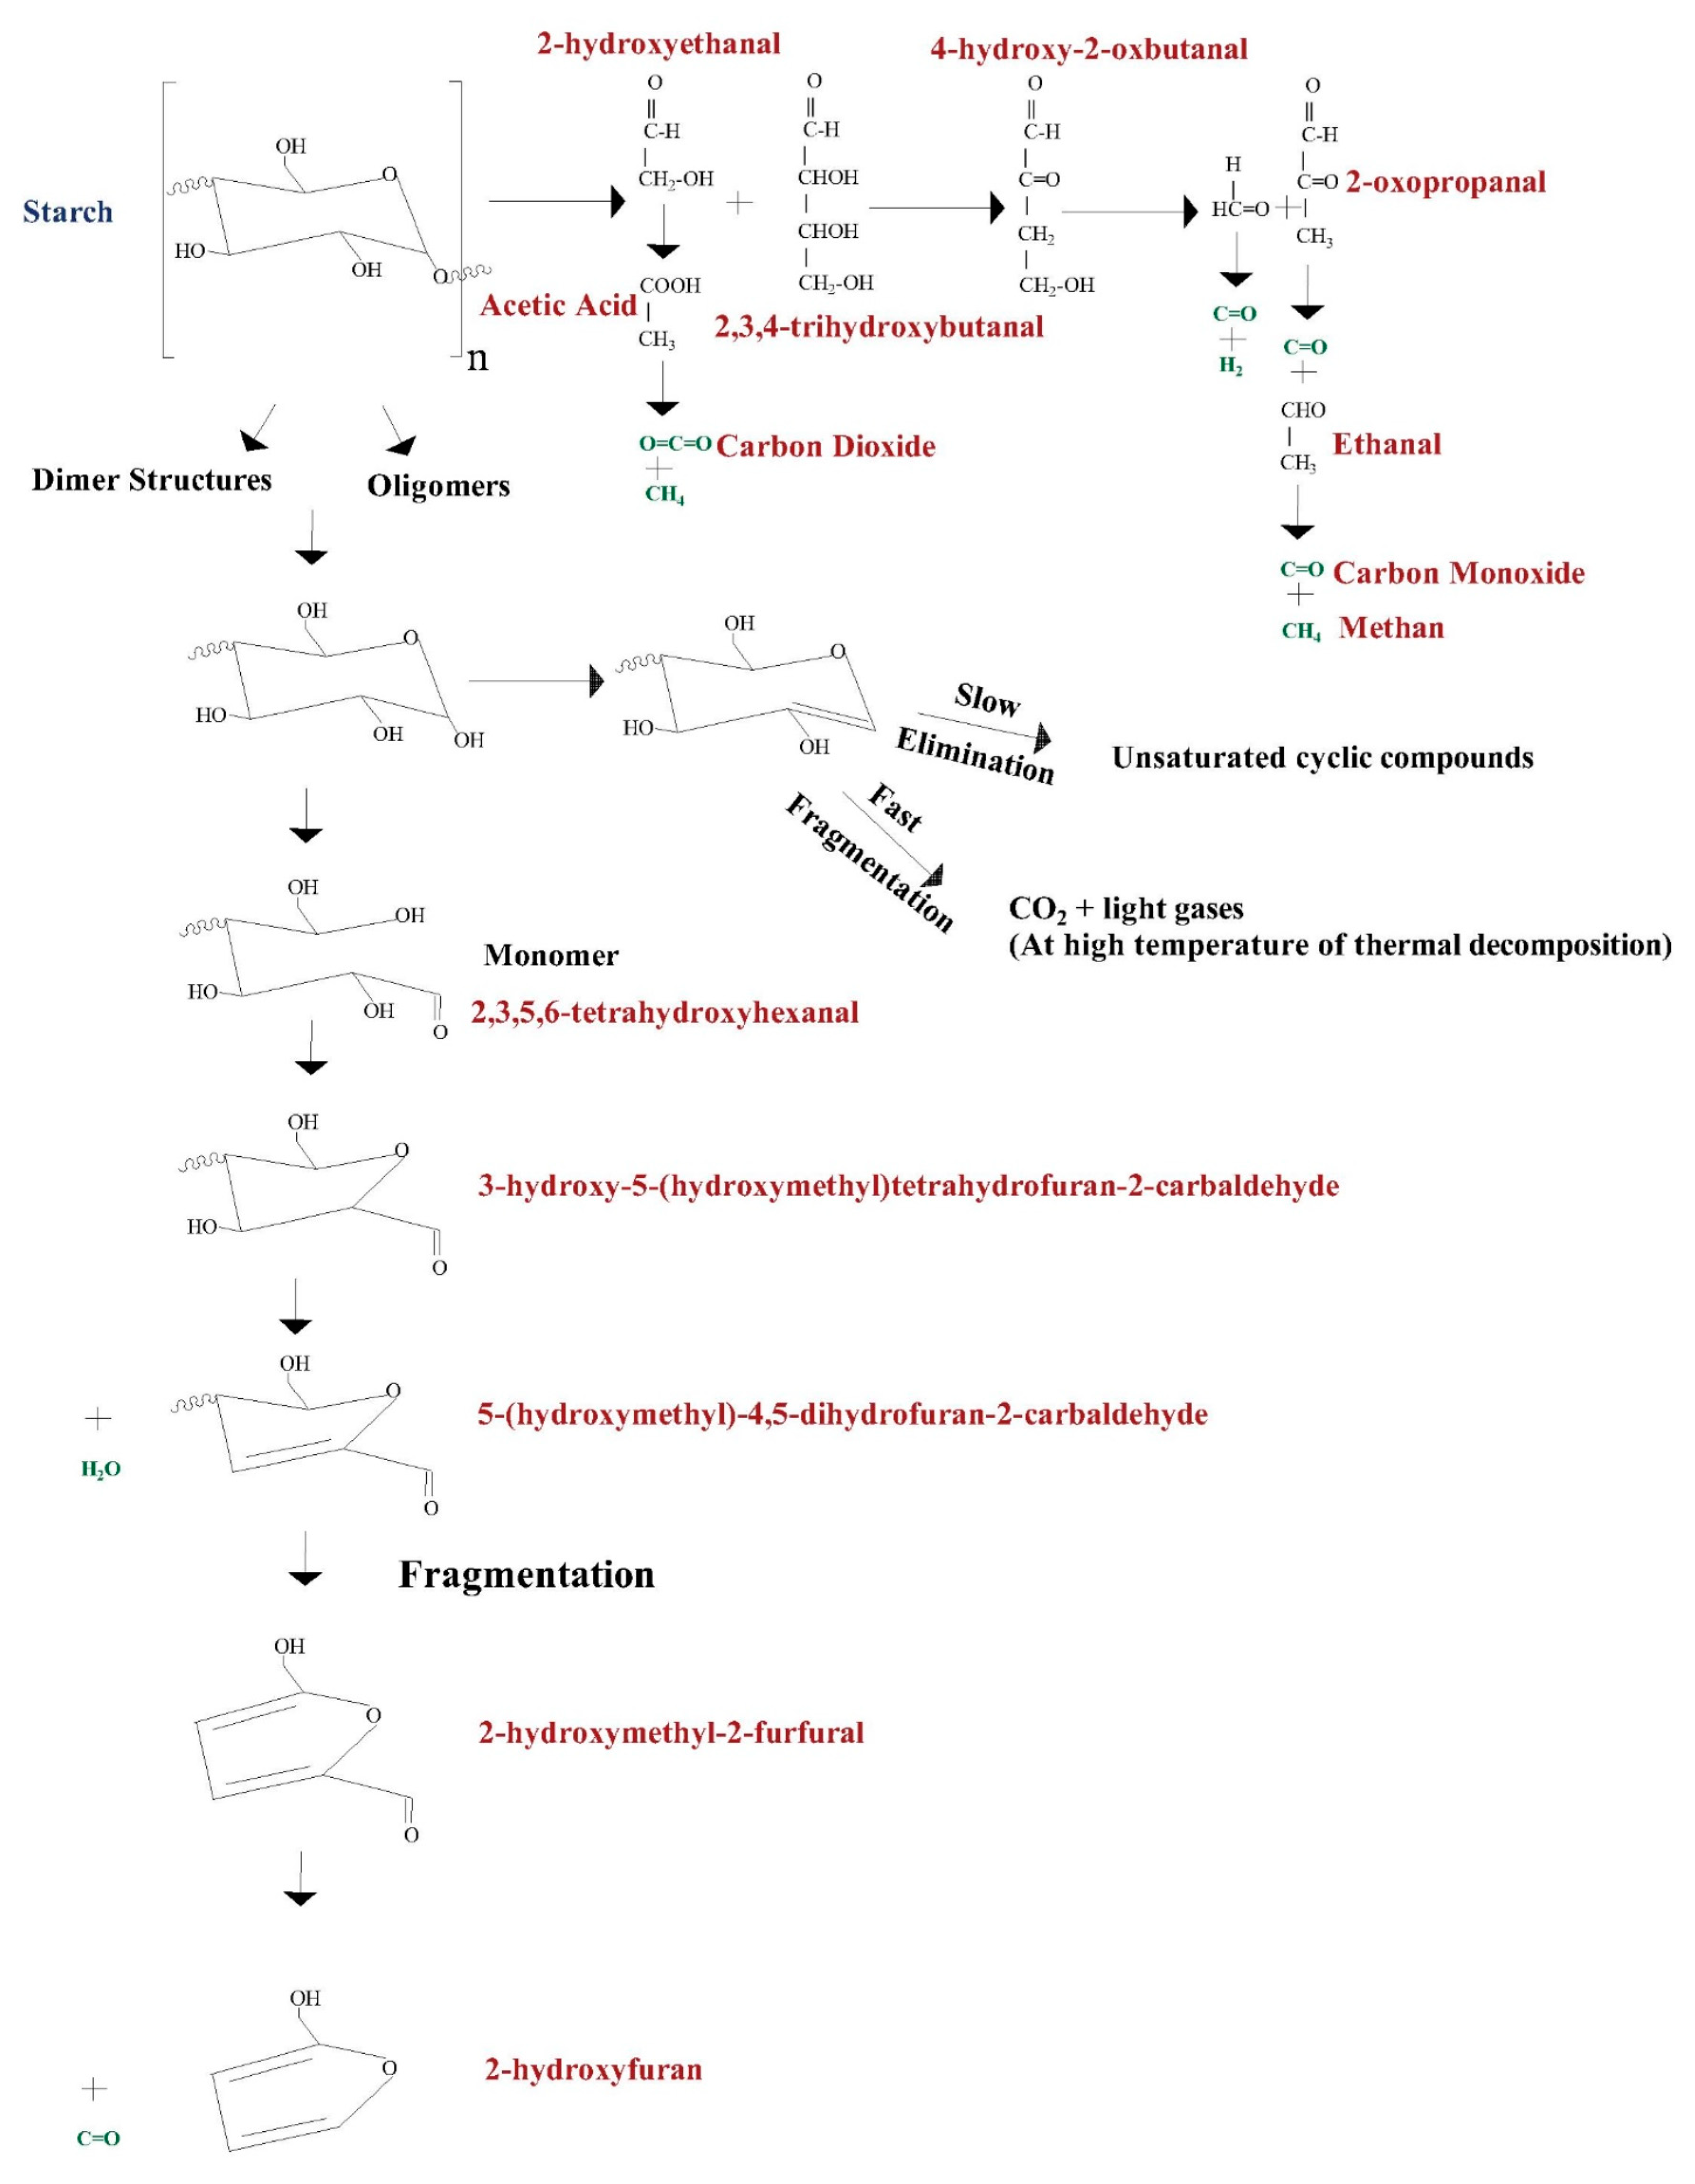
3.1. TG/DTG-DTA
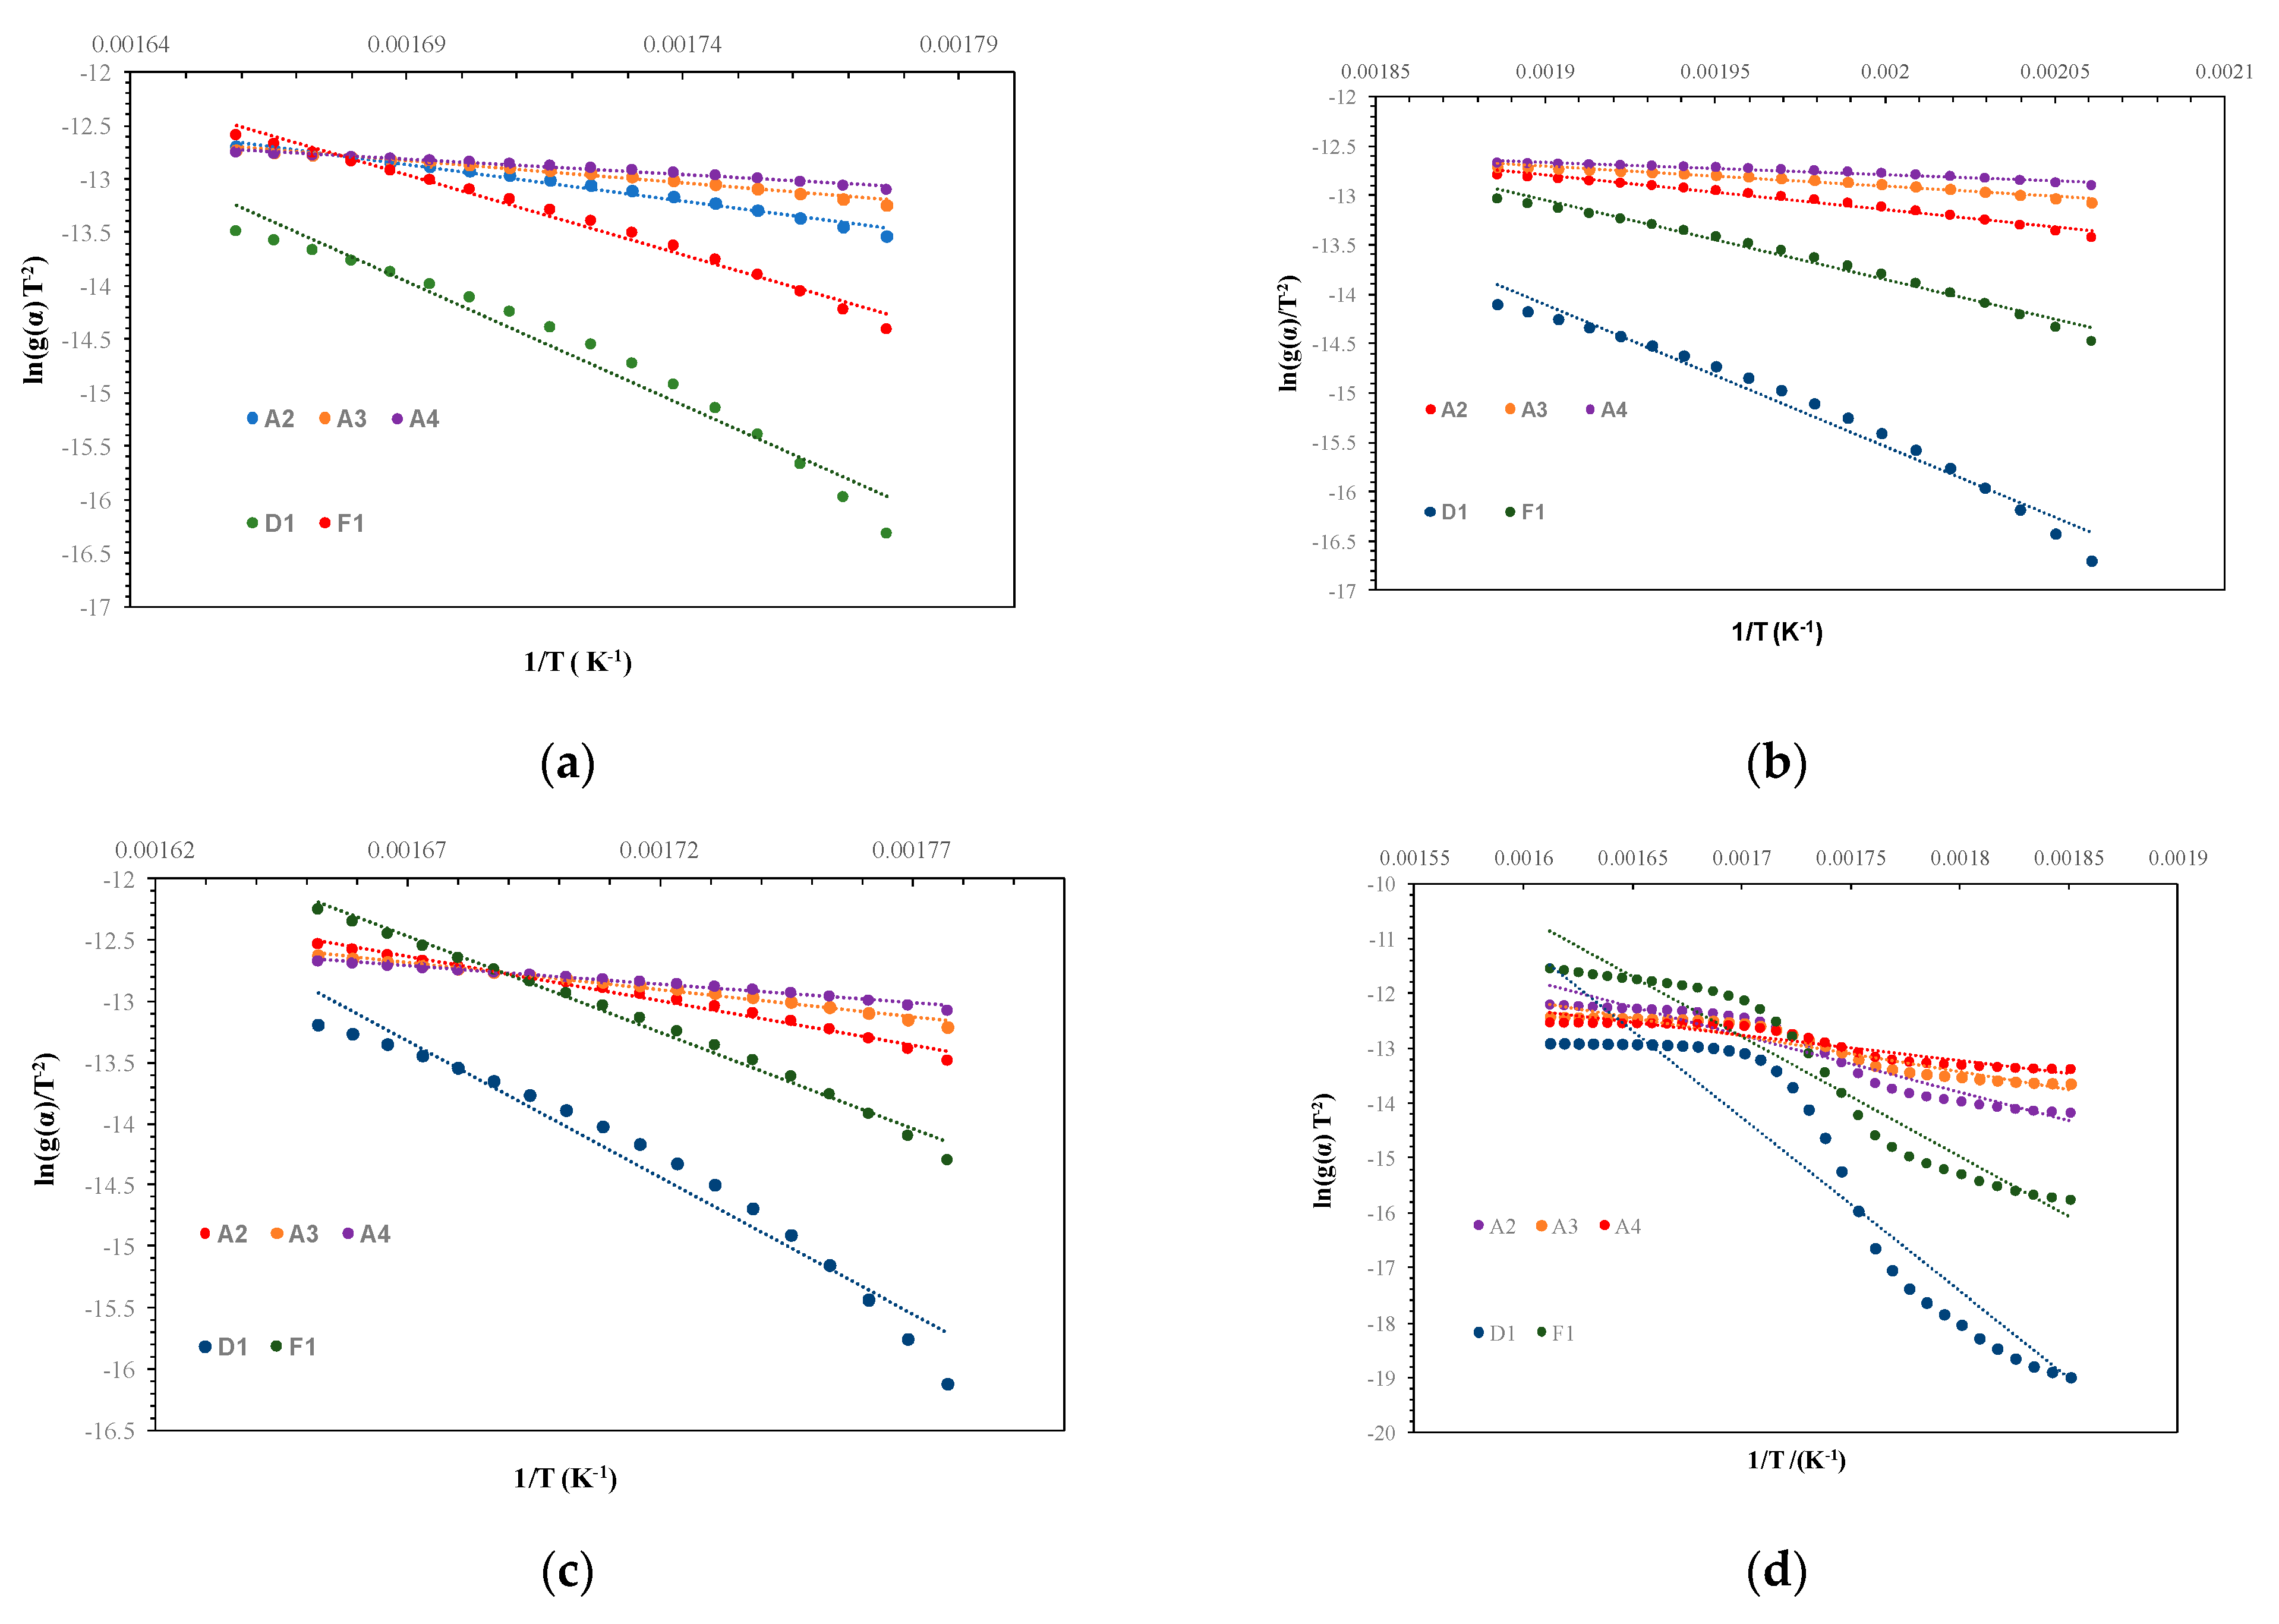
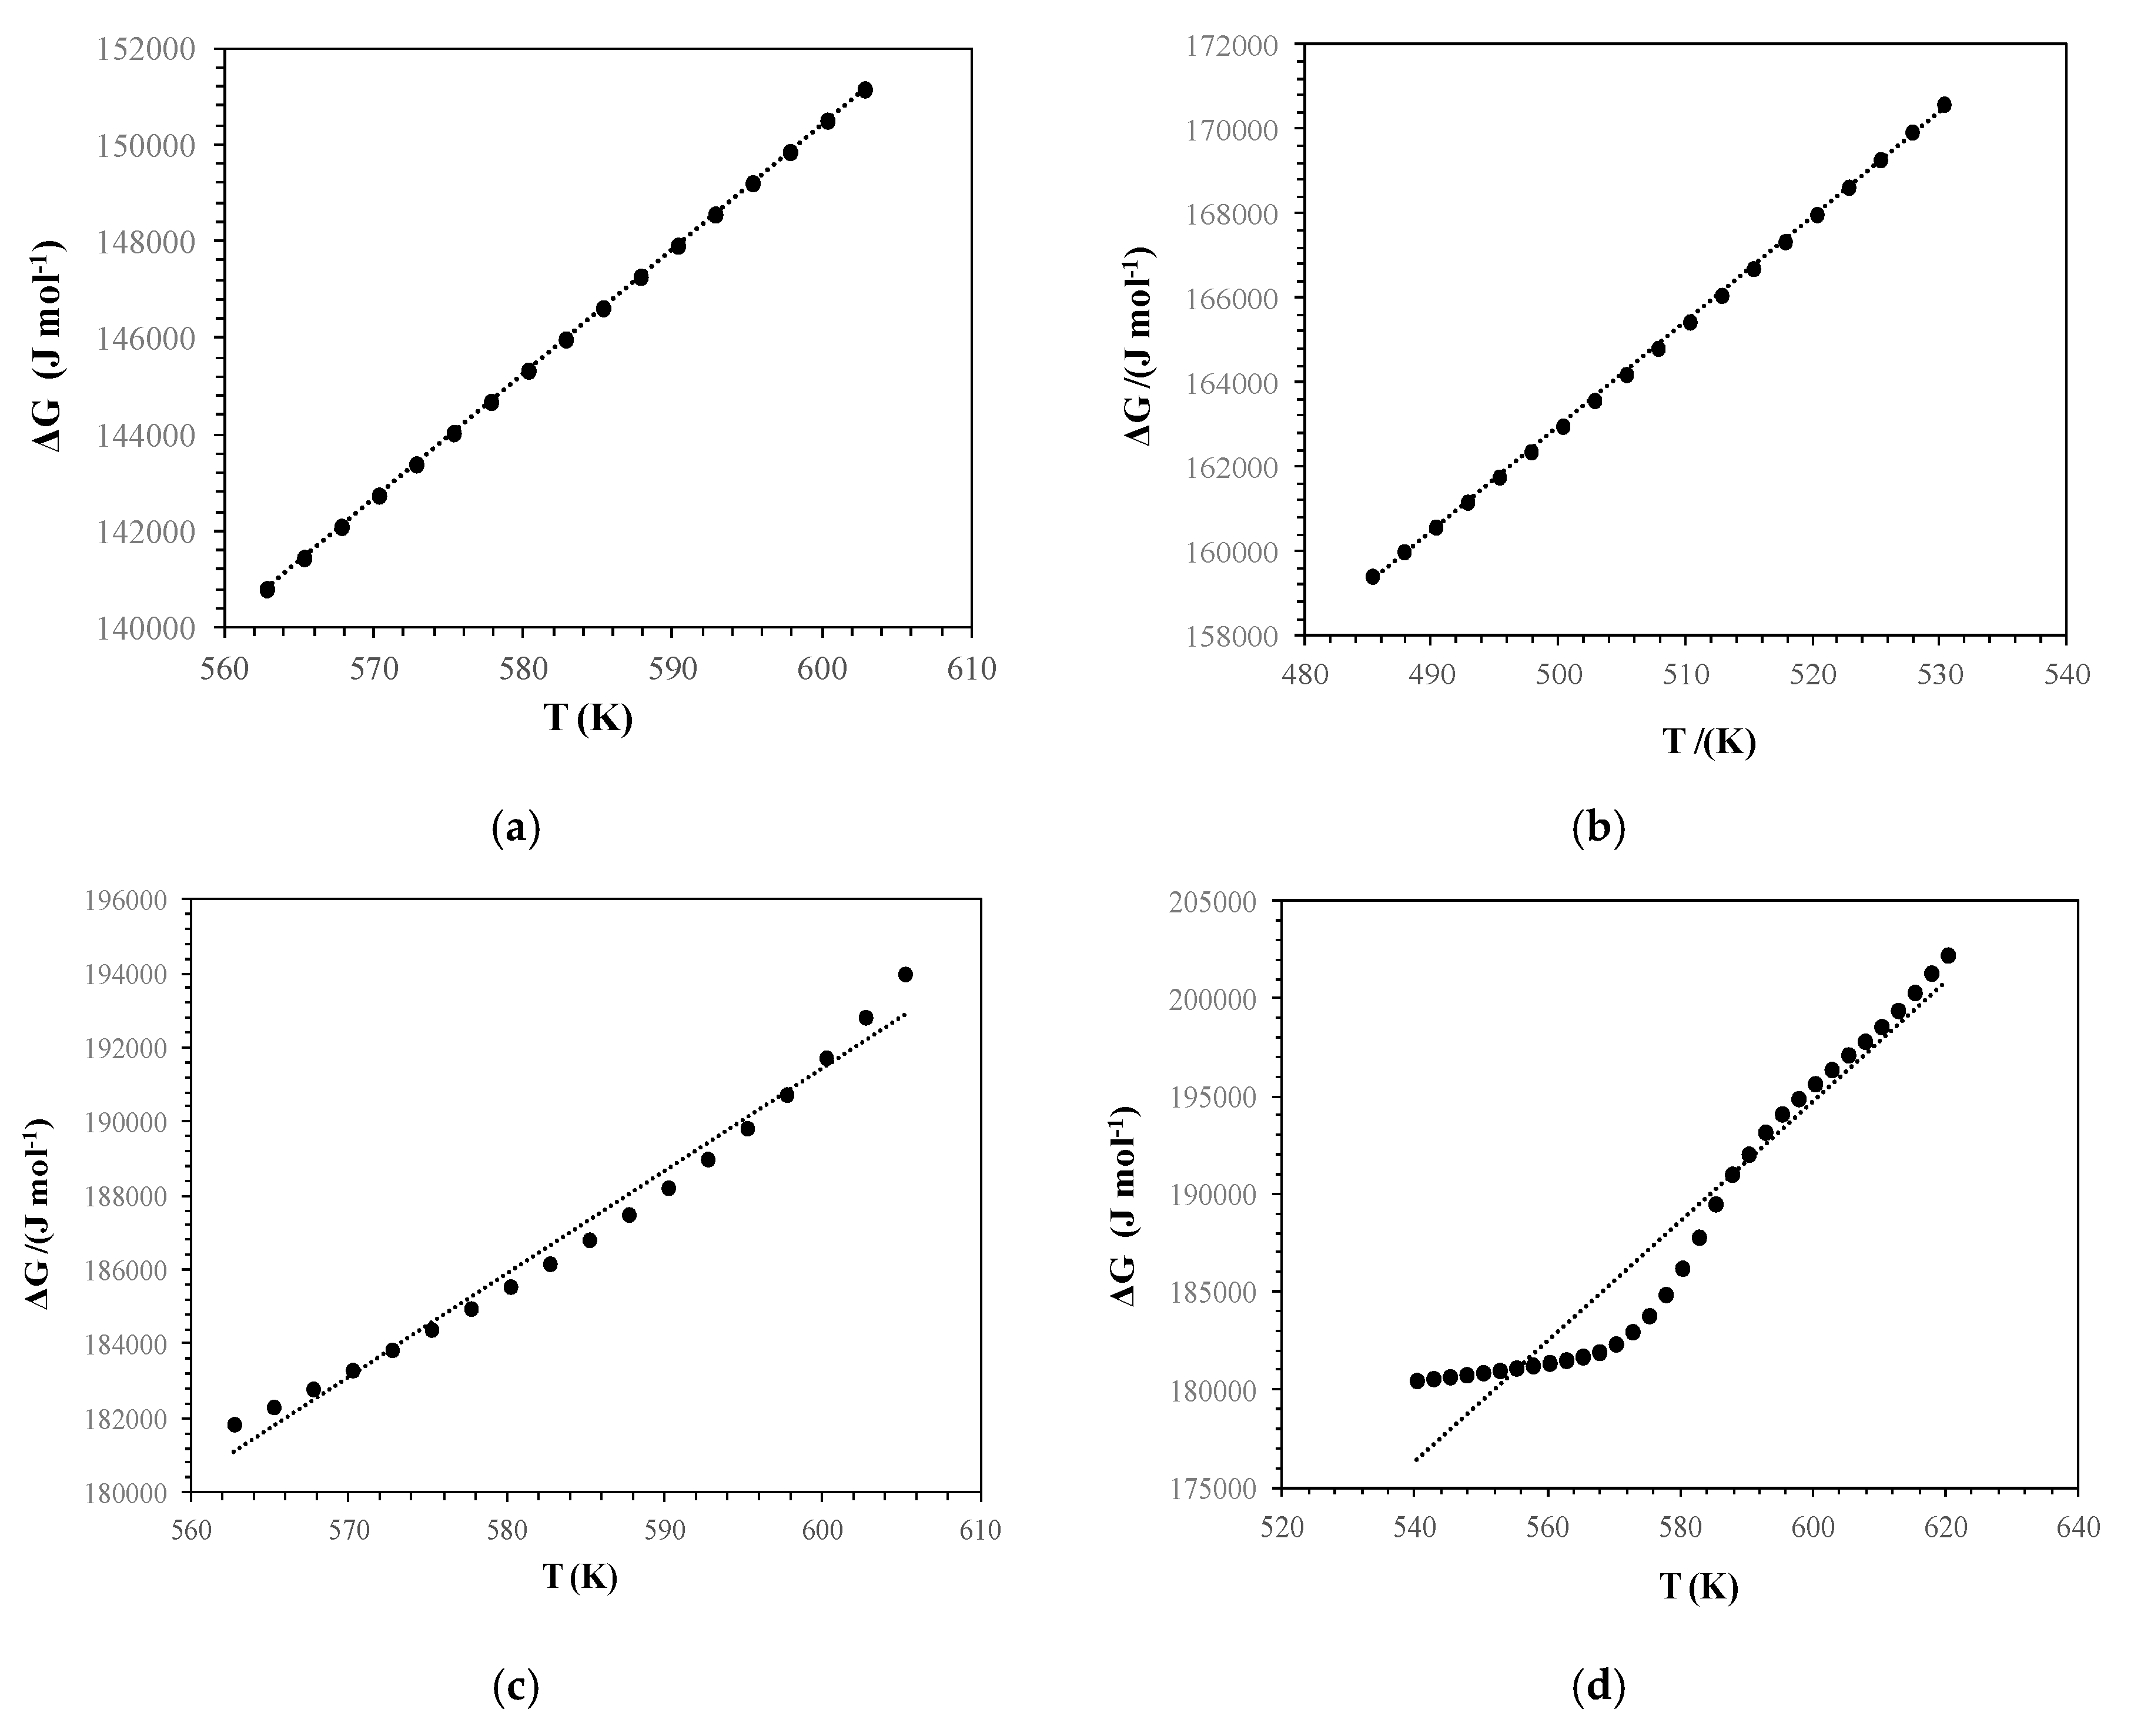
3.2. Kinetics of Thermal Decomposition
3.3. Determination of Hydroxyl Groups of Starches Using Second Mass Loss From TGA
4. Conclusions
Author Contributions
Acknowledgments
Conflicts of Interest
References
- Neelam, K. Various techniques for the modification of starch and the applications of its derivatives. Int. Res. J. Pharm. 2012, 3, 25–33. [Google Scholar]
- Haq, F.; Yu, H.; Wang, L. Advances in chemical modifications of starches and their applications. Carbohydr. Res. 2019, 476, 12–35. [Google Scholar] [CrossRef] [PubMed]
- Dos Santos, M.C.; Maynart, M.C.; Aveiro, L.R.; da Paz, E.C.; dos Santos Pinheiro, V. Carbon-Based Materials: Recent Advances, Challenges, and Perspectives; Federal University of ABC, Elsevier Inc.: Santo André, Brazil, 2017. [Google Scholar]
- Todica, M.; Nagy, E.M.; Niculaescu, C.; Stan, O.; Cioica, N.; Pop, C.V. XRD Investigation of Some Thermal Degraded Starch Based Materials. Hindawi Publishing Corpotation. J. Spectrosc. 2016, 2016, 9605312. [Google Scholar] [CrossRef]
- Hornung, P.S. Brazilian Yam and Turmeric Native Starches: Characterization, Modification and Application. Ph.D. Thesis, Department of Food and Human Nutritional Sciences, Food Engineering, Winnipeg, MB, Canada, 2018. [Google Scholar]
- Biliaderis, C. Structural Transitions and Related Physical Properties of Starch. In Starch Chemistry and Technology, 3th ed.; Aristotle University: Thessaloniki, Greece, 2009; p. 300. [Google Scholar]
- Perez, S.; Bertoft, E. The molecular structures of starch components and their contribution to the architecture of starch granules: A comprehensive review. Starch/Stärke 2010, 62, 389–420. [Google Scholar] [CrossRef]
- Xie, F.; Pollet, E.; Halley, P.J.; Avérous, L. Starch-based nano-biocomposites. Prog. Polym. Sci. 2013, 38, 1590–1628. [Google Scholar] [CrossRef] [Green Version]
- Li, Q.; Wu, Q.-Y.; Jiang, W.; Qian, J.-Y.; Zhang, L. Effect of pulsed electric field on structural properties and digestibility of starches with different crystalline type in solid state. Carbohydr. Polym. 2019, 207, 362–370. [Google Scholar] [CrossRef]
- Buleon, A.; Gallant, D.J.; Bouchet, B.; Mouille, G.; D’Hulst, C.; Kossmann, J.; Ball, S. Starches from A to C. Plant Physiol. 1997, 115, 949–957. [Google Scholar] [CrossRef] [Green Version]
- Mason, W.R. Modified Food Starches. Starch Chemistry and Technology, 3th ed.; Starch Use in Food; IntechOpen: Rijeka, Croatia, 2009; p. 761. [Google Scholar] [CrossRef] [Green Version]
- Green, C.T. Wood, The thermal degradation of starch. Adv. Carbohydr. Chem. 1967, 22, 486. [Google Scholar]
- Sangwan, P.; Petinakis, E.; Dean, K. Effects of Formulation, Structure and Processing on Biodegradation of Starches. Starch Polym. 2014, 357–378. [Google Scholar] [CrossRef]
- Liu, X.; Wang, Y.; Yu, L.; Tong, Z. Thermal degradation and stability of starch under different processing conditions. Starch/Stärke 2013, 65, 48–60. [Google Scholar] [CrossRef]
- Merci, A.; Mali, S.; Carvalho, G. Waxy maize, corn and cassava starch: Thermal degradation kinetics. Ciências Exatas E Tecnológicas Londrina 2019, 40, 13–22. [Google Scholar] [CrossRef]
- Yang, L.; Xia, Y.; Tao, Y.; Geng, H.; Ding, Y.; Zhou, Y. Multi-scale structural changes in lintnerized starches from three coloured potatoes. Carbohydr. Polym. 2018, 188, 228–235. [Google Scholar] [CrossRef] [PubMed]
- Liu, Y.; Yang, L.; Ma, C.; Zhang, Y. Thermal Behavior of Sweet Potato Starch by Non-Isothermal Thermogravimetric Analysis. Materials 2019, 12, 699. [Google Scholar] [CrossRef] [PubMed] [Green Version]
- Tian, Y.; Li, Y.; Xu, X.; Jin, Z. Starch retrogradation studied by thermogravimetric analysis (TGA). Carbohydr. Polym. 2011, 84, 1165–1168. [Google Scholar] [CrossRef]
- Altynbaeva, D.; Astafev, A.; Tabakaev, R. Kinetics of biomass low-temperature pyrolysis by coats-redfern method. Matec. Web. Conf. 2018, 194, 2. [Google Scholar] [CrossRef] [Green Version]
- Seshadri, V.; Westmoreland, P.R. Concerted Reactions and Mechanism of Glucose Pyrolysis and Implications for Cellulose Kinetics. J. Phys. Chem. A 2012, 116, 11997–12013. [Google Scholar] [CrossRef]
- Thakur, R.; Pristijono, P.; Golding, J.B. Effect on Starch Physiology, Gelatinization and Retrogradation on the Attributes of Rice Starch-l-Carrageenan Film. Starch/Stärke 2017, 70, 1–28. [Google Scholar] [CrossRef] [Green Version]
- Ek, S.; Root, A.; Peussa, M.; Niinistö, L. Determination of the hydroxyl group content in silica by thermogravimetry and a comparison with H MAS NMR results. Thermochim. Acta 2001, 379, 201–212. [Google Scholar] [CrossRef]
- Spychaj, T.; Wilpiszewska, K.; Zdanowicz, M. Medium and high substituted carboxymethyl starch: Synthesis, characterization and application. Starch Stärke 2013, 65, 22–23. [Google Scholar] [CrossRef]
- Vega, D.; Villar, A.M.; Failla, D.M.; Vallés, M.E. Thermogravimetric analysis of starch-based biodegradable blends. Polym. Bull. 1996, 37, 229–235. [Google Scholar] [CrossRef]
- He, L.; Li, X.; Li, W.; Yuan, J.; Zhou, H. A method for determining reactive hydroxyl groups in natural fibers: Application to ramie fiber and its modification. Carbohydr. Res. 2012, 348, 96. [Google Scholar] [CrossRef] [PubMed]
- Liu, X.; Yu, L.; Xie, F. Kinetics and mechanism of thermal decomposition of cornstarches with different amylose/amylopectin ratios. Starch/Stärke 2010, 62, 139–146. [Google Scholar] [CrossRef]

| Mechanism | g(α) | f(α) |
|---|---|---|
| A2, Random nucleation and growth, Avrami Erofe’ve Equation | ) | |
| A3, Random nucleation and growth, Avrami Erofe’ve Equation | ||
| A4, Random nucleation and growth, Avrami Erofe’ve Equation | ||
| R1, Unidimensional contraction | ||
| R2, Cylindrical phase boundary | ) | |
| R3, Spherical phase boundary | ||
| D1, One-dimensional diffusion | ||
| D2, Two-dimensional diffusion (Valensi Equation) | ||
| D3, Three-dimensional diffusion (Jander Equation) | ||
| D4, Three-dimensional diffusion (Ginstling–Brounshtein Equation) | ||
| F1, First order (random nucleation with one nucleus on the individual particle) | ||
| F2, Second-order (random nucleation with two nuclei on the individual particle) | ||
| F3, Third-order (random nucleation with three nuclei on the individual particle) |
| Kinetic Model | R2 Rice Starch | R2 Potato Starch | R2 Wheat Starch | R2 Corn Starch |
|---|---|---|---|---|
| A2 | 0.9842 | 0.9771 | 0.9893 | 0.9134 |
| A3 | 0.9809 | 0.9682 | 0.9872 | 0.9023 |
| A4 | 0.9766 | 0.9535 | 0.9844 | 0.8892 |
| D1 | 0.9645 | 0.9743 | 0.9599 | 0.8521 |
| F1 | 0.9867 | 0.9828 | 0.9909 | 0.9228 |
| Starch | RICE | POTATO | WHEAT | CORN | |
|---|---|---|---|---|---|
| Parameter | |||||
| Mechanism | F1 | F1 | F1 | F1 | |
| R2 | 0.9867 | 0.9828 | 0.9909 | 0.9228 | |
| Linear regression equation | y = −14890x + 12.199 | y = −8003.6x + 2.1524 | y = −15653x + 13.67 | y = −20078x + 21.231 | |
| Ea (kJ·mol−1) | 123.733 | 66.542 | 130.139 | 166.928 | |
| A (min−1) | 2.96 × 10¹⁰ | 6.89 × 10⁵ | 1.35 × 10¹¹ | 3.34 × 10¹⁴ | |
| lnA | 24.110 | 13.44 | 25.631 | 33.441 | |
| k (min−1) | 1.301 × 10⁻² | 7.115 × 10⁻³ | 1.387 × 10⁻² | 7.995 × 10⁻³ | |
| ΔG (kJ·mol−1) | 145.963 | 164.886 | 186.995 | 188.768 | |
| ΔH (kJ·mol−1 = Qp) | 118.887 | 62.320 | 125.283 | 162.104 | |
| ΔS (kJ·mol−1·K−1) | −46.264 | −201.961 | −105.583 | −45.504 | |
| K (-) | 8.25 × 10⁻¹⁴ | 1.114 × 10⁻¹⁷ | 1.896 × 10⁻¹⁷ | 1.101 × 10⁻¹⁷ | |
| STARCH | RICE | POTATO | WHEAT | CORN |
|---|---|---|---|---|
| Initial mass (mg) | 11.8 | 12.3 | 13.4 | 15.1 |
| Final mass (mg) | 1.76 | 2.88 | 2.04 | 2.43 |
| Whole mass loss (%) | 85.059 | 76.591 | 84.789 | 83.920 |
| Whole mass loss (g) | 0.01004 | 0.00942 | 0.01136 | 0.01267 |
| Mass loss associated with water release (%) | 9.8276 | 6.2299 | 9.8096 | 9.708 |
| nH2O (mg·g−1 of starch) (physisorption) | 98.276 | 62.299 | 98.096 | 97.080 |
| nH2O (mmol·g−1 of starch) | 5.46 | 3.46 | 5.45 | 5.39 |
| Mass loss associated with hydroxyl groups release (%) | 54.2176 | 50.8533 | 53.7761 | 57.1315 |
| nOH (mol·g−1 of starch) | 0.06019 | 0.05646 | 0.05970 | 0.06343 |
| nOH (mmol·g−1 of starch) | 60.24 | 56.46 | 59.70 | 63.43 |
| nOH (mg·g−1 of starch) | 1023.74 | 960.21 | 1015.40 | 1078.76 |
© 2020 by the authors. Licensee MDPI, Basel, Switzerland. This article is an open access article distributed under the terms and conditions of the Creative Commons Attribution (CC BY) license (http://creativecommons.org/licenses/by/4.0/).
Share and Cite
Pigłowska, M.; Kurc, B.; Rymaniak, Ł.; Lijewski, P.; Fuć, P. Kinetics and Thermodynamics of Thermal Degradation of Different Starches and Estimation the OH Group and H2O Content on the Surface by TG/DTG-DTA. Polymers 2020, 12, 357. https://doi.org/10.3390/polym12020357
Pigłowska M, Kurc B, Rymaniak Ł, Lijewski P, Fuć P. Kinetics and Thermodynamics of Thermal Degradation of Different Starches and Estimation the OH Group and H2O Content on the Surface by TG/DTG-DTA. Polymers. 2020; 12(2):357. https://doi.org/10.3390/polym12020357
Chicago/Turabian StylePigłowska, Marita, Beata Kurc, Łukasz Rymaniak, Piotr Lijewski, and Paweł Fuć. 2020. "Kinetics and Thermodynamics of Thermal Degradation of Different Starches and Estimation the OH Group and H2O Content on the Surface by TG/DTG-DTA" Polymers 12, no. 2: 357. https://doi.org/10.3390/polym12020357