Experimental and Numerical Investigation of the Extrusion and Deposition Process of a Poly(lactic Acid) Strand with Fused Deposition Modeling

 , , ,
, , ,  , and
, and
Abstract
:
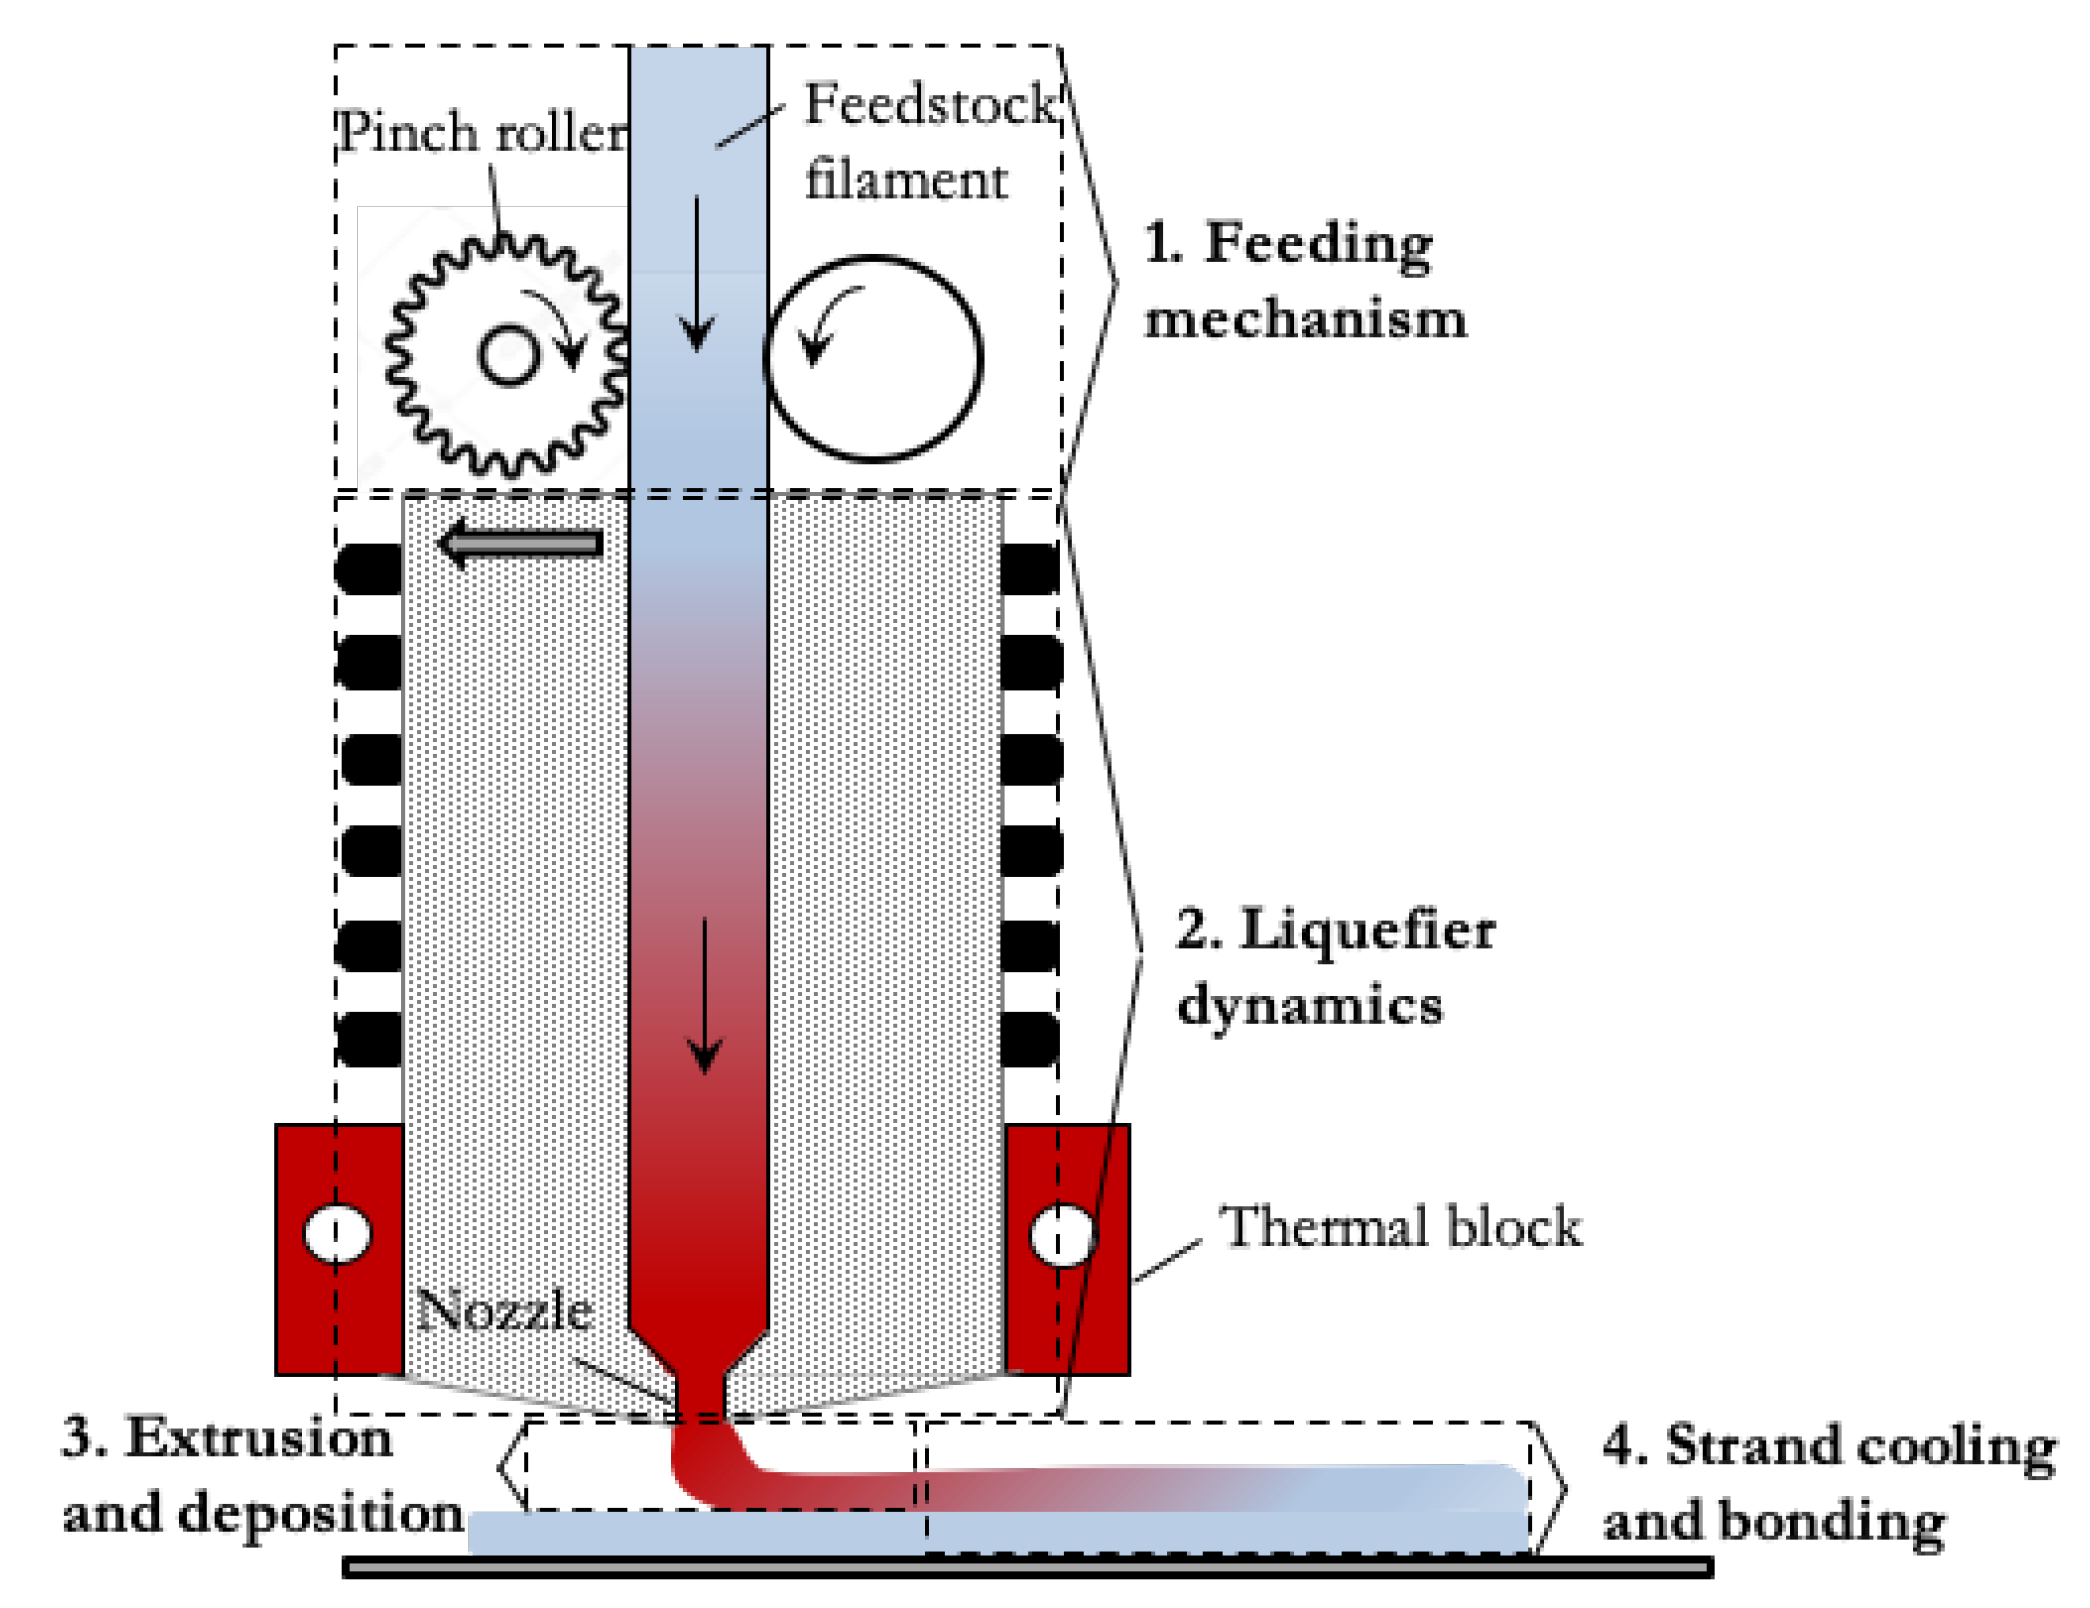
1. Introduction
2. Materials and Methods
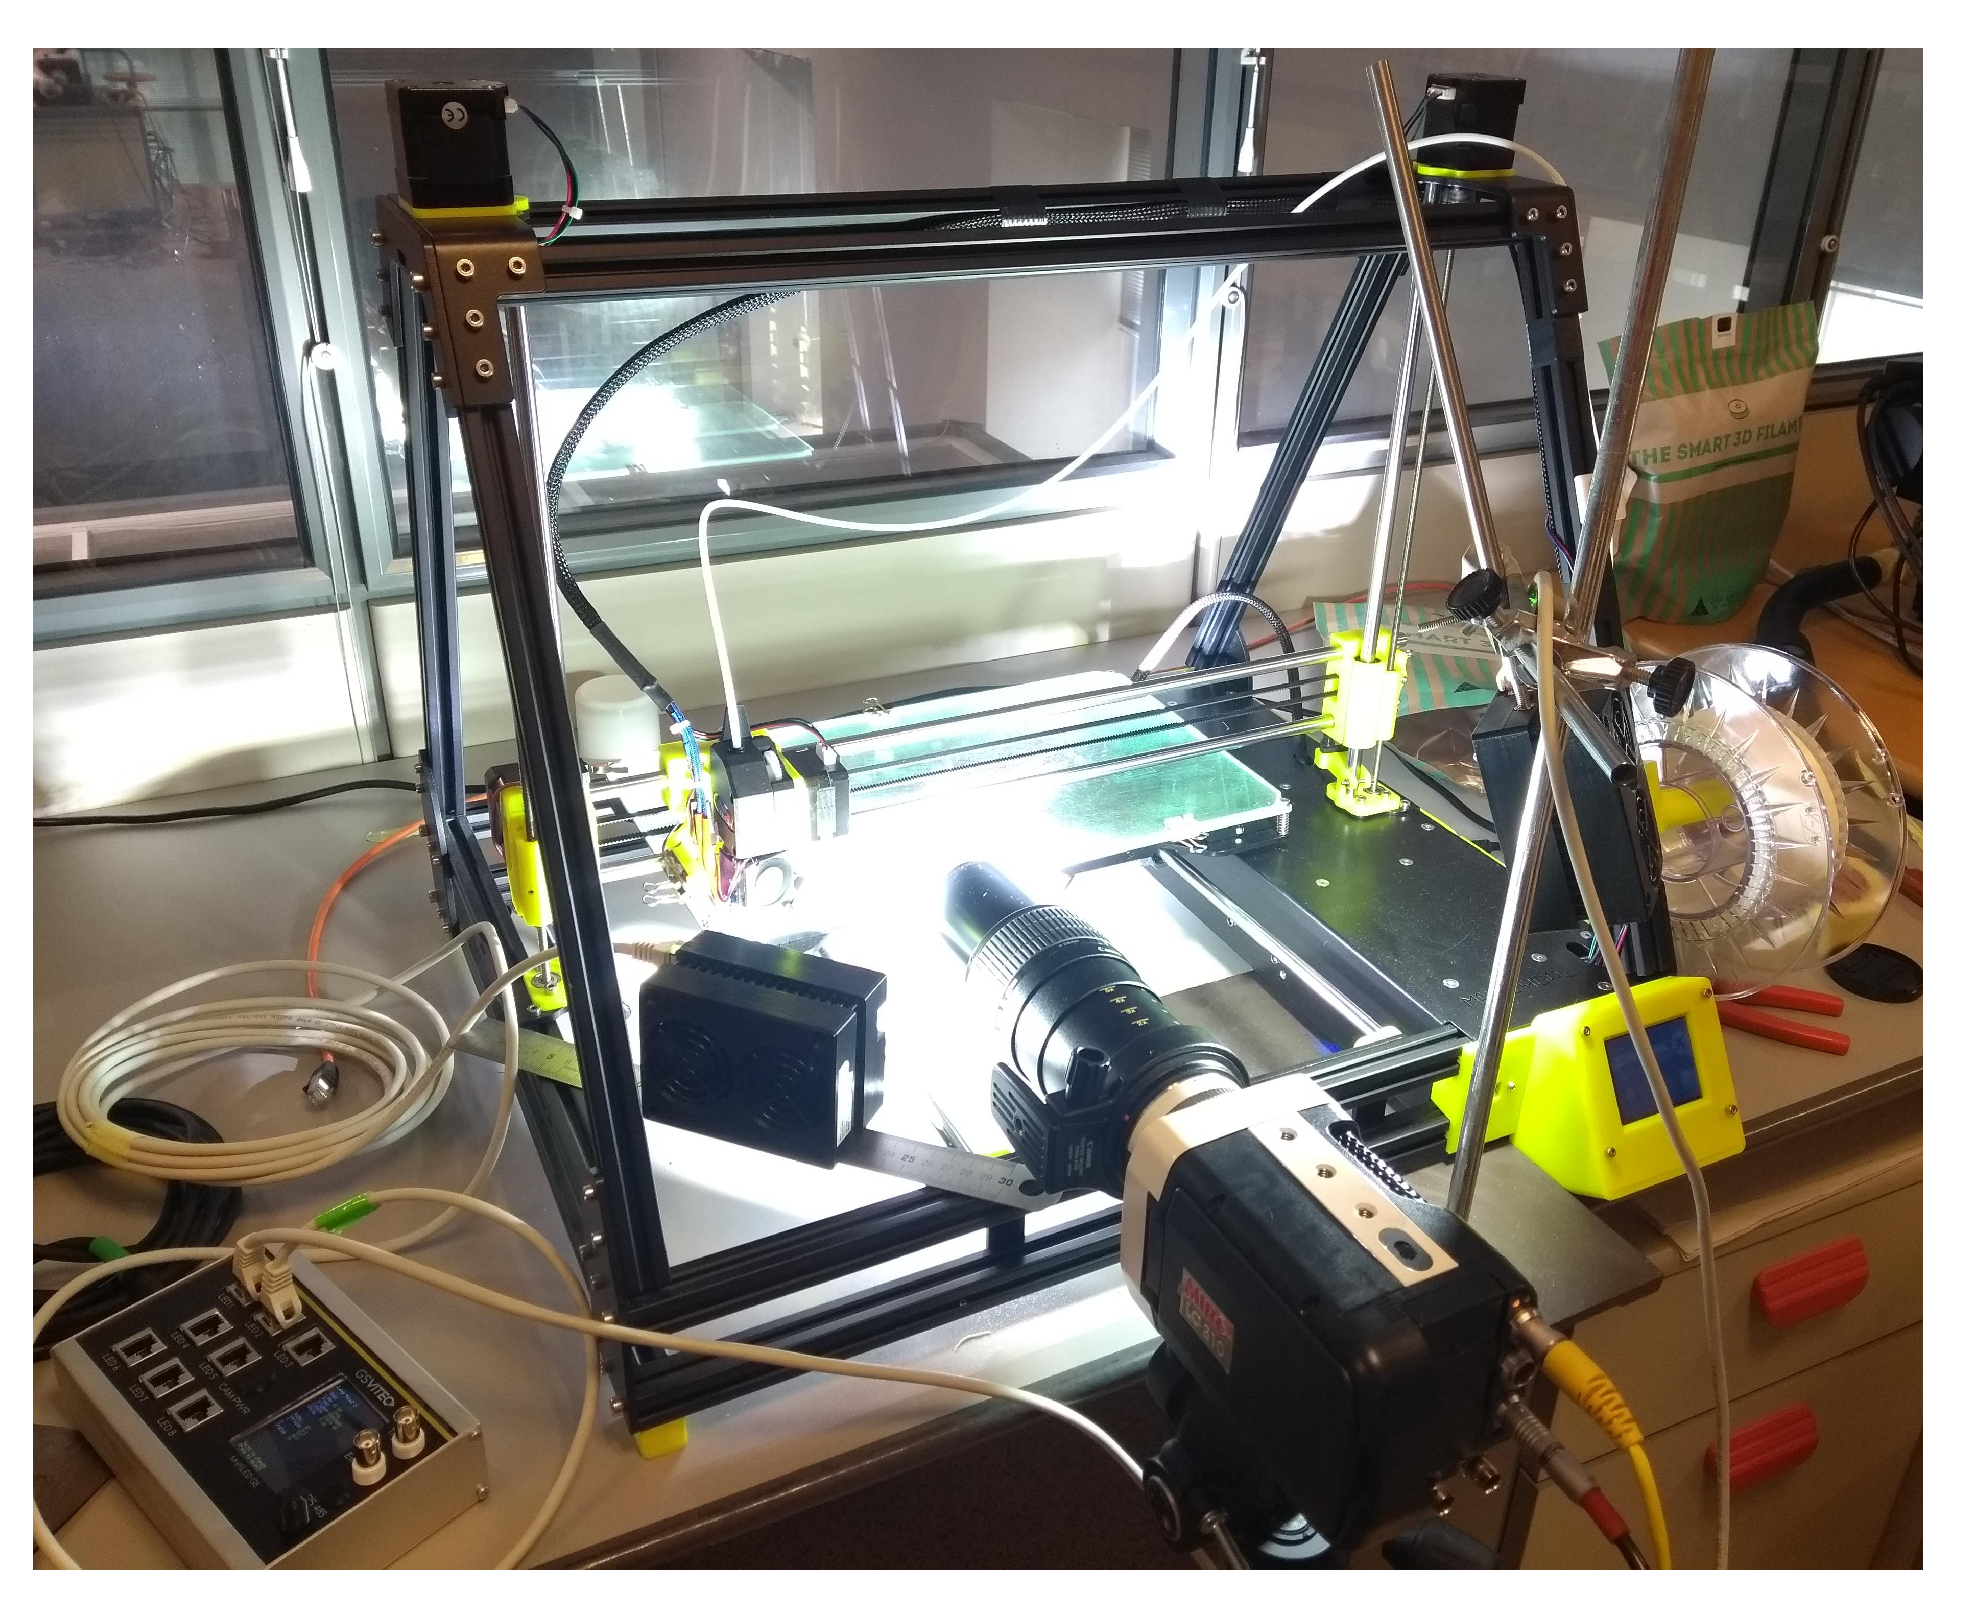
2.1. Experimental Measurements
2.1.1. Setup
2.1.2. Rheological Characterization of Material
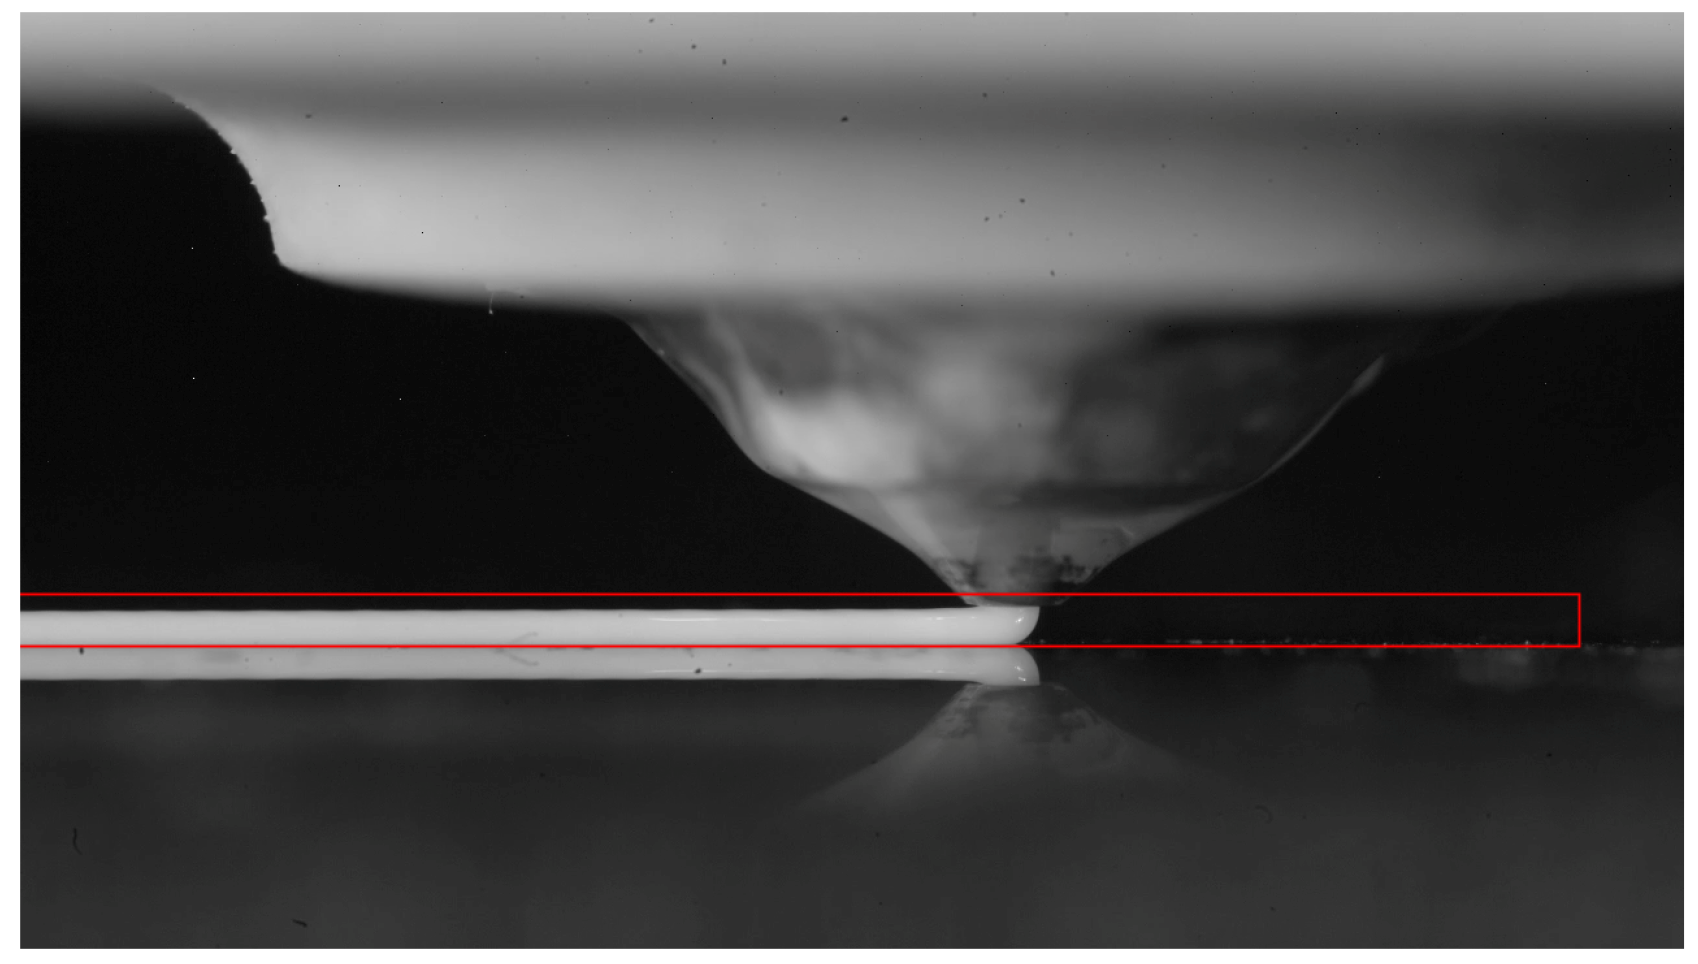
2.1.3. Image Processing
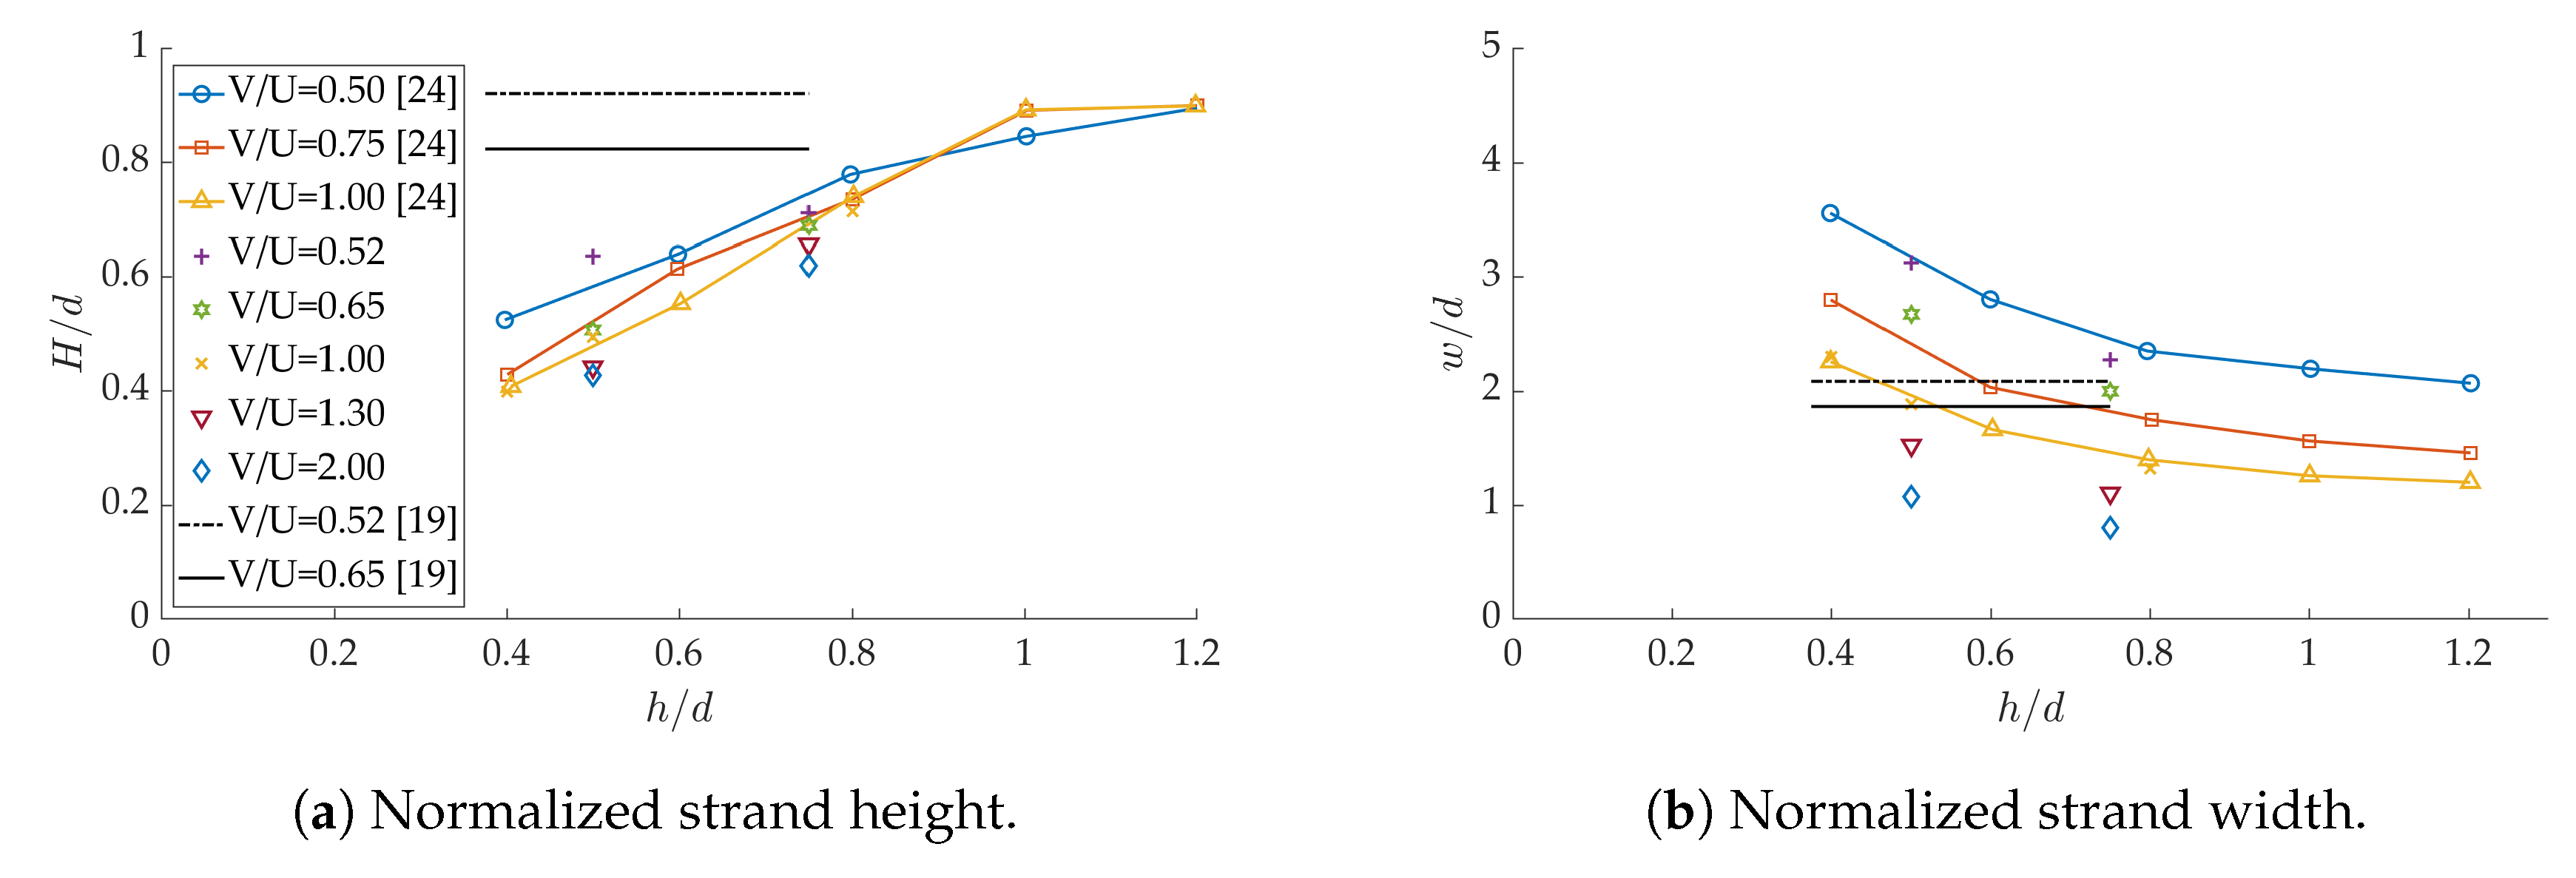
2.1.4. Characterization of the Deposited Strands
2.2. Numerical Simulations
2.2.1. Numerical Models and Approximations
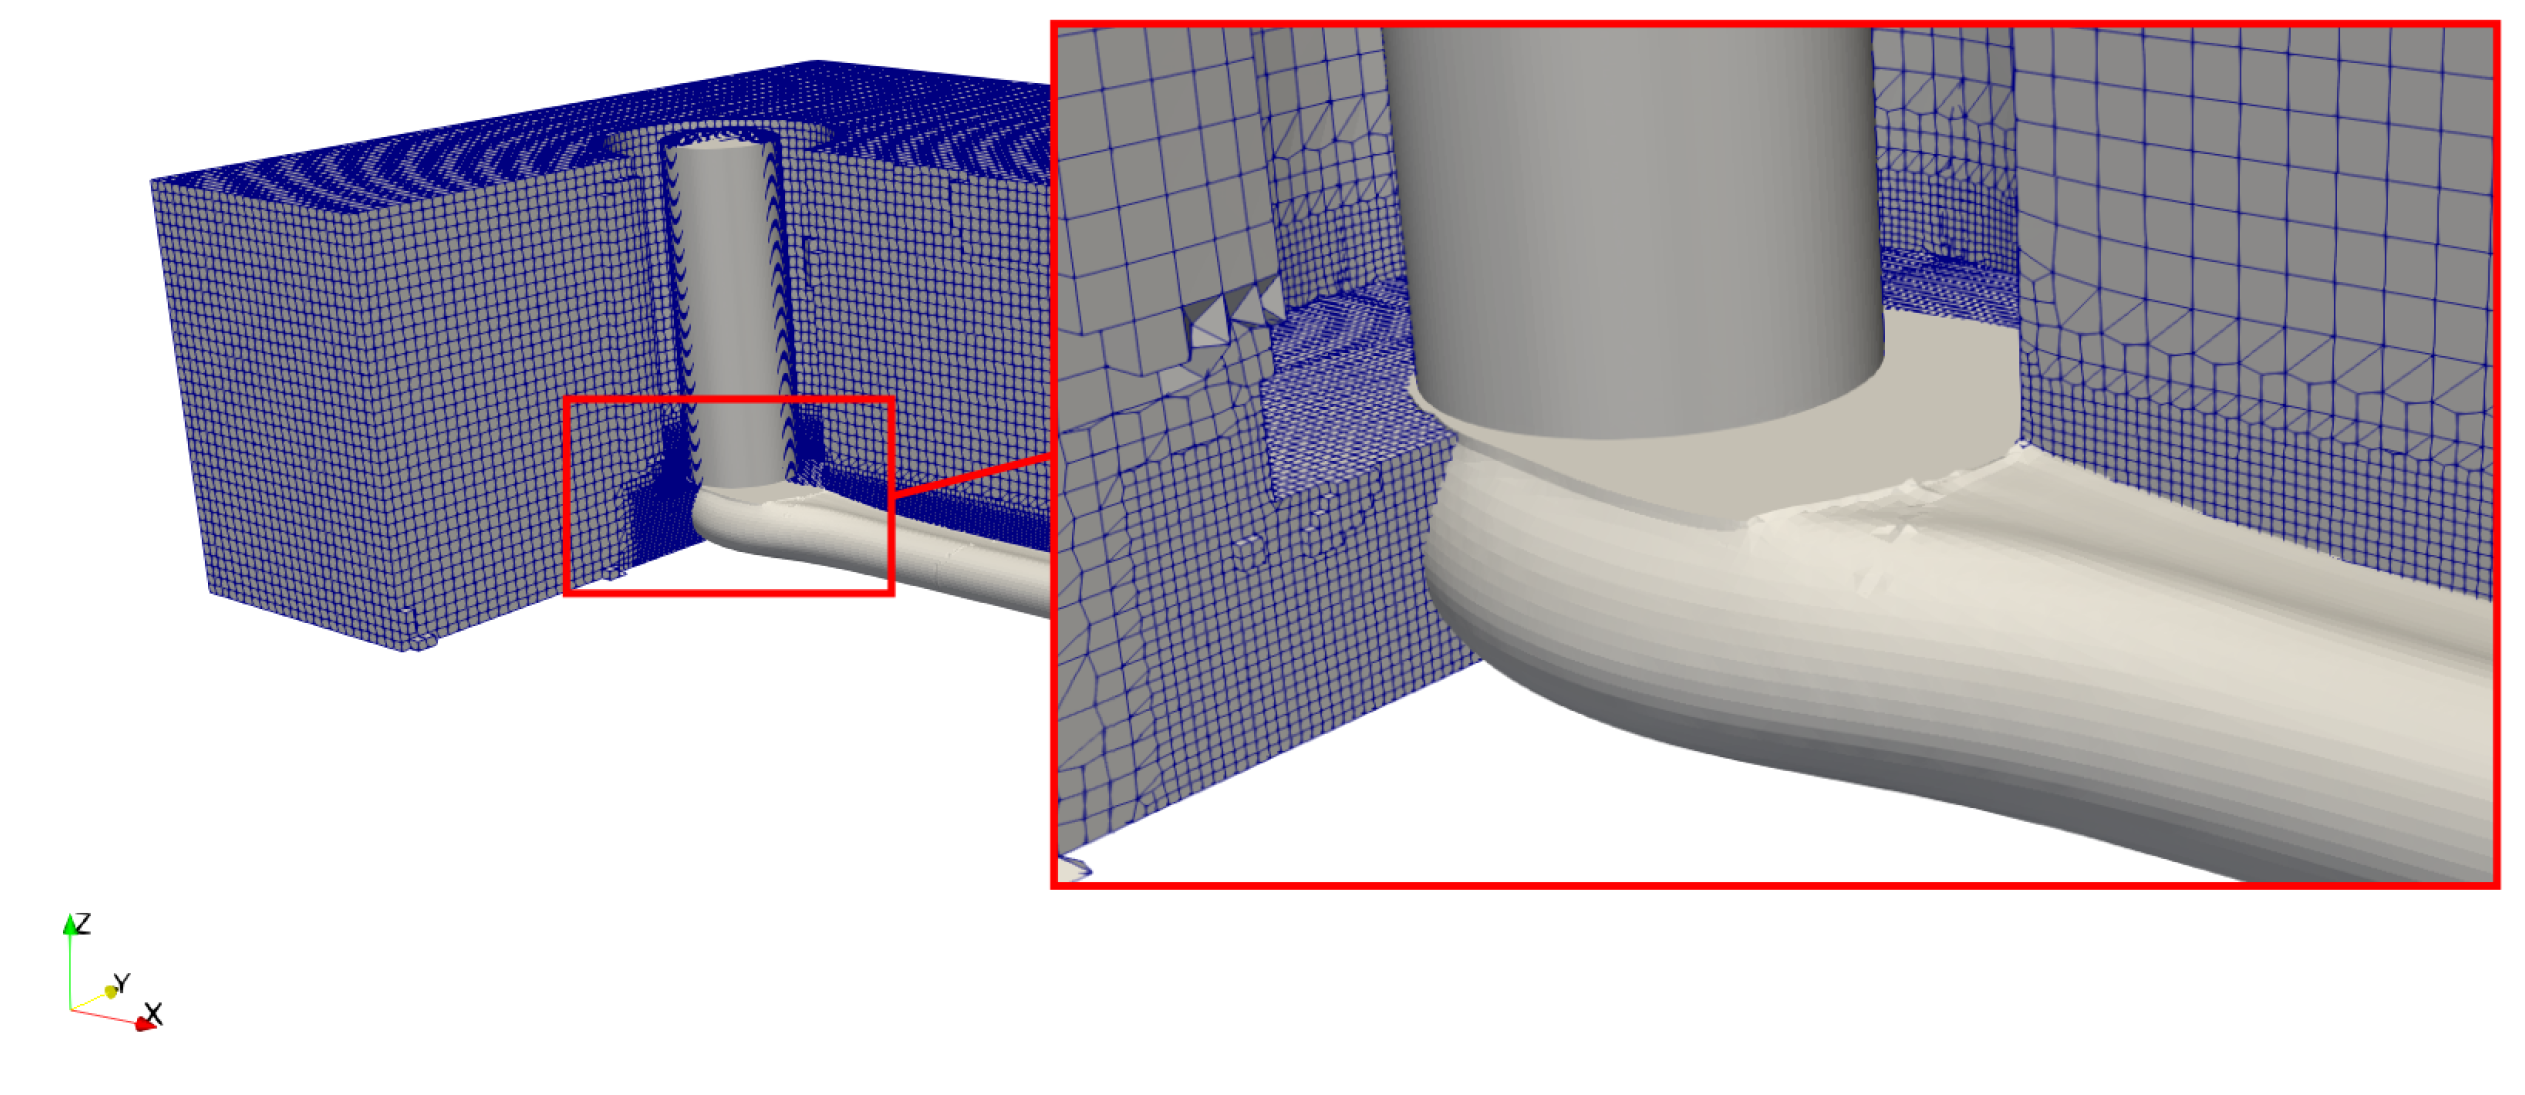
2.2.2. Flow Conditions and Domain
3. Results and Discussion
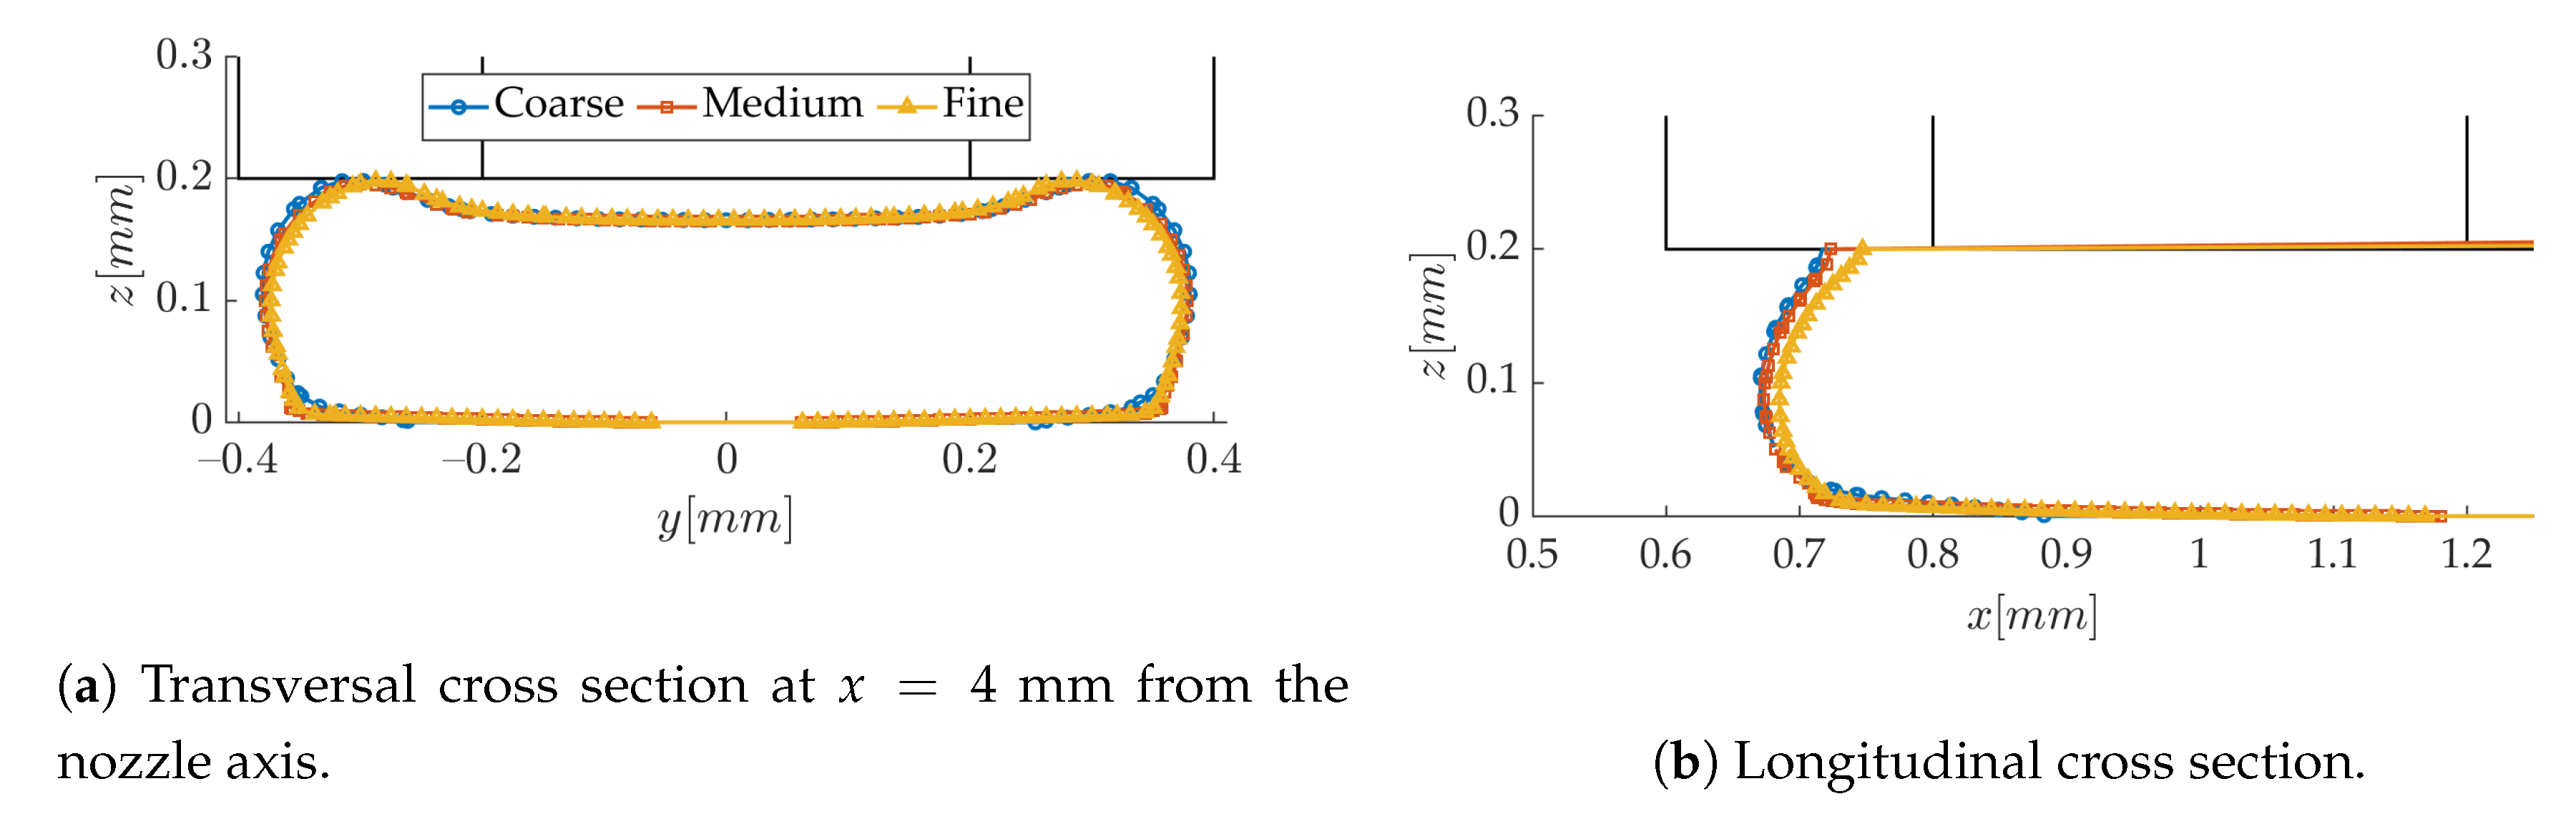
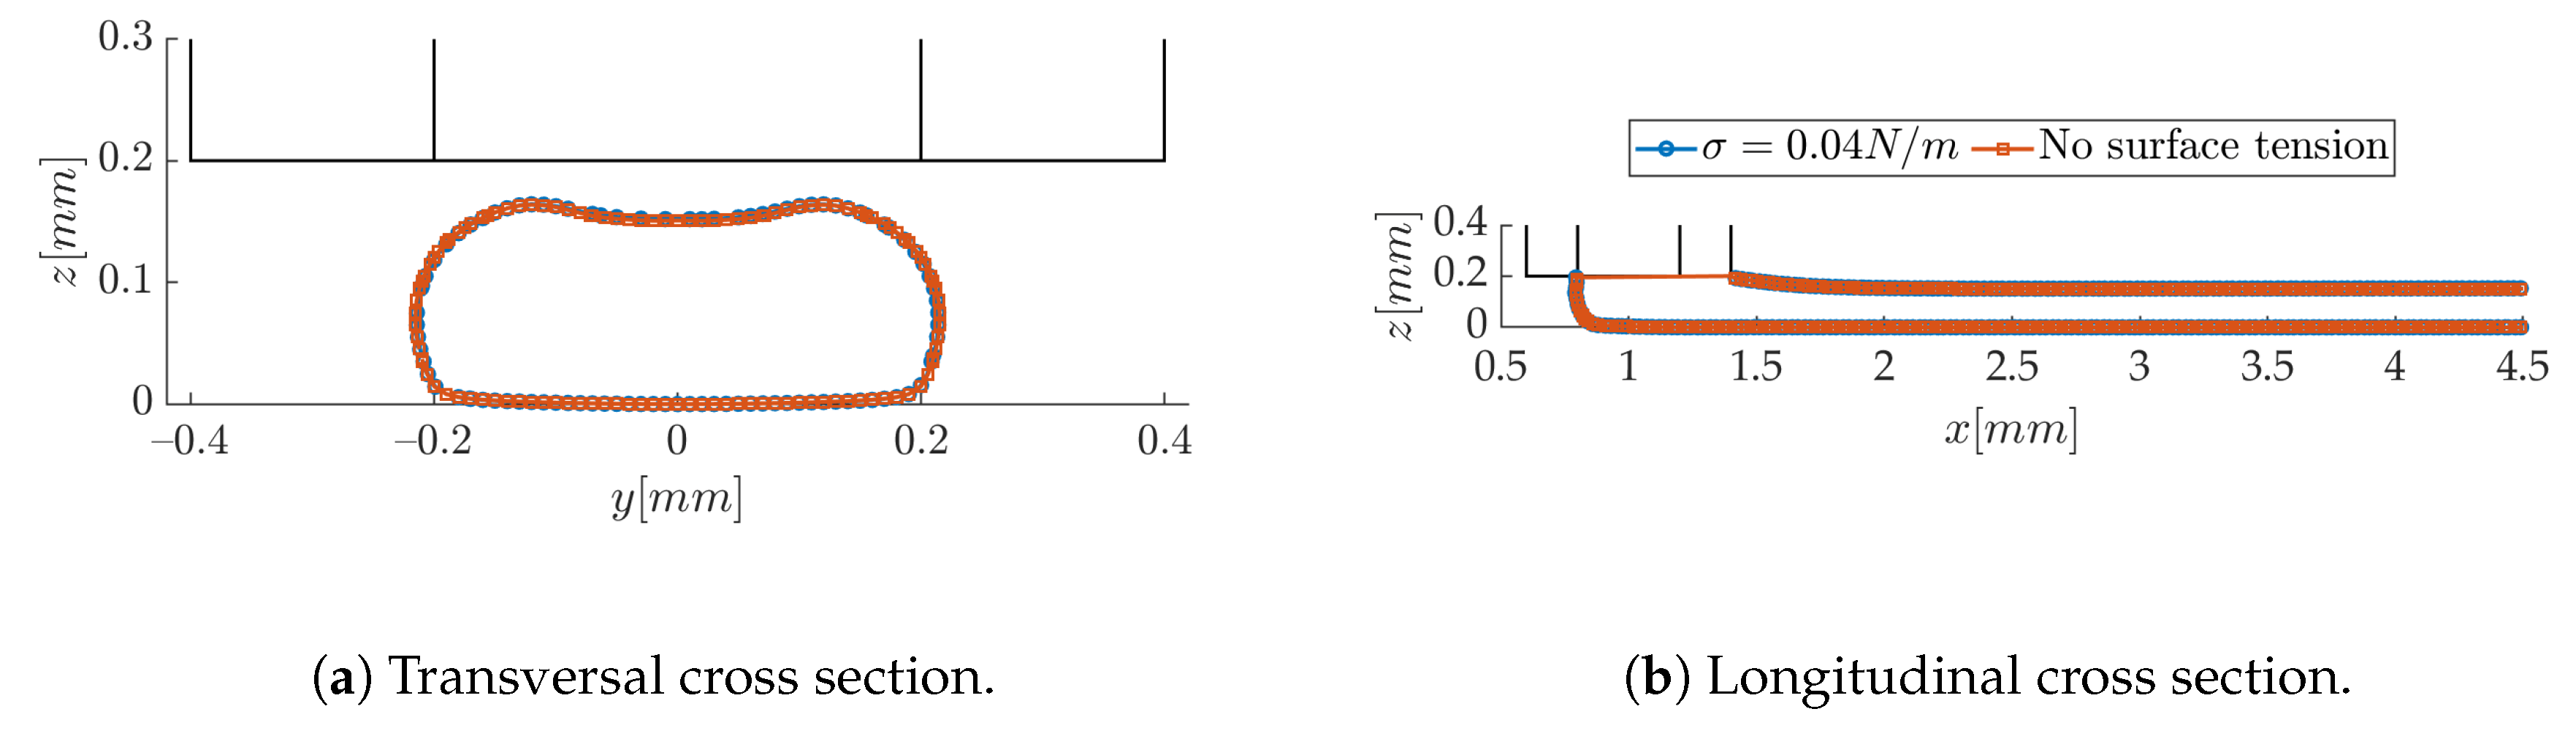
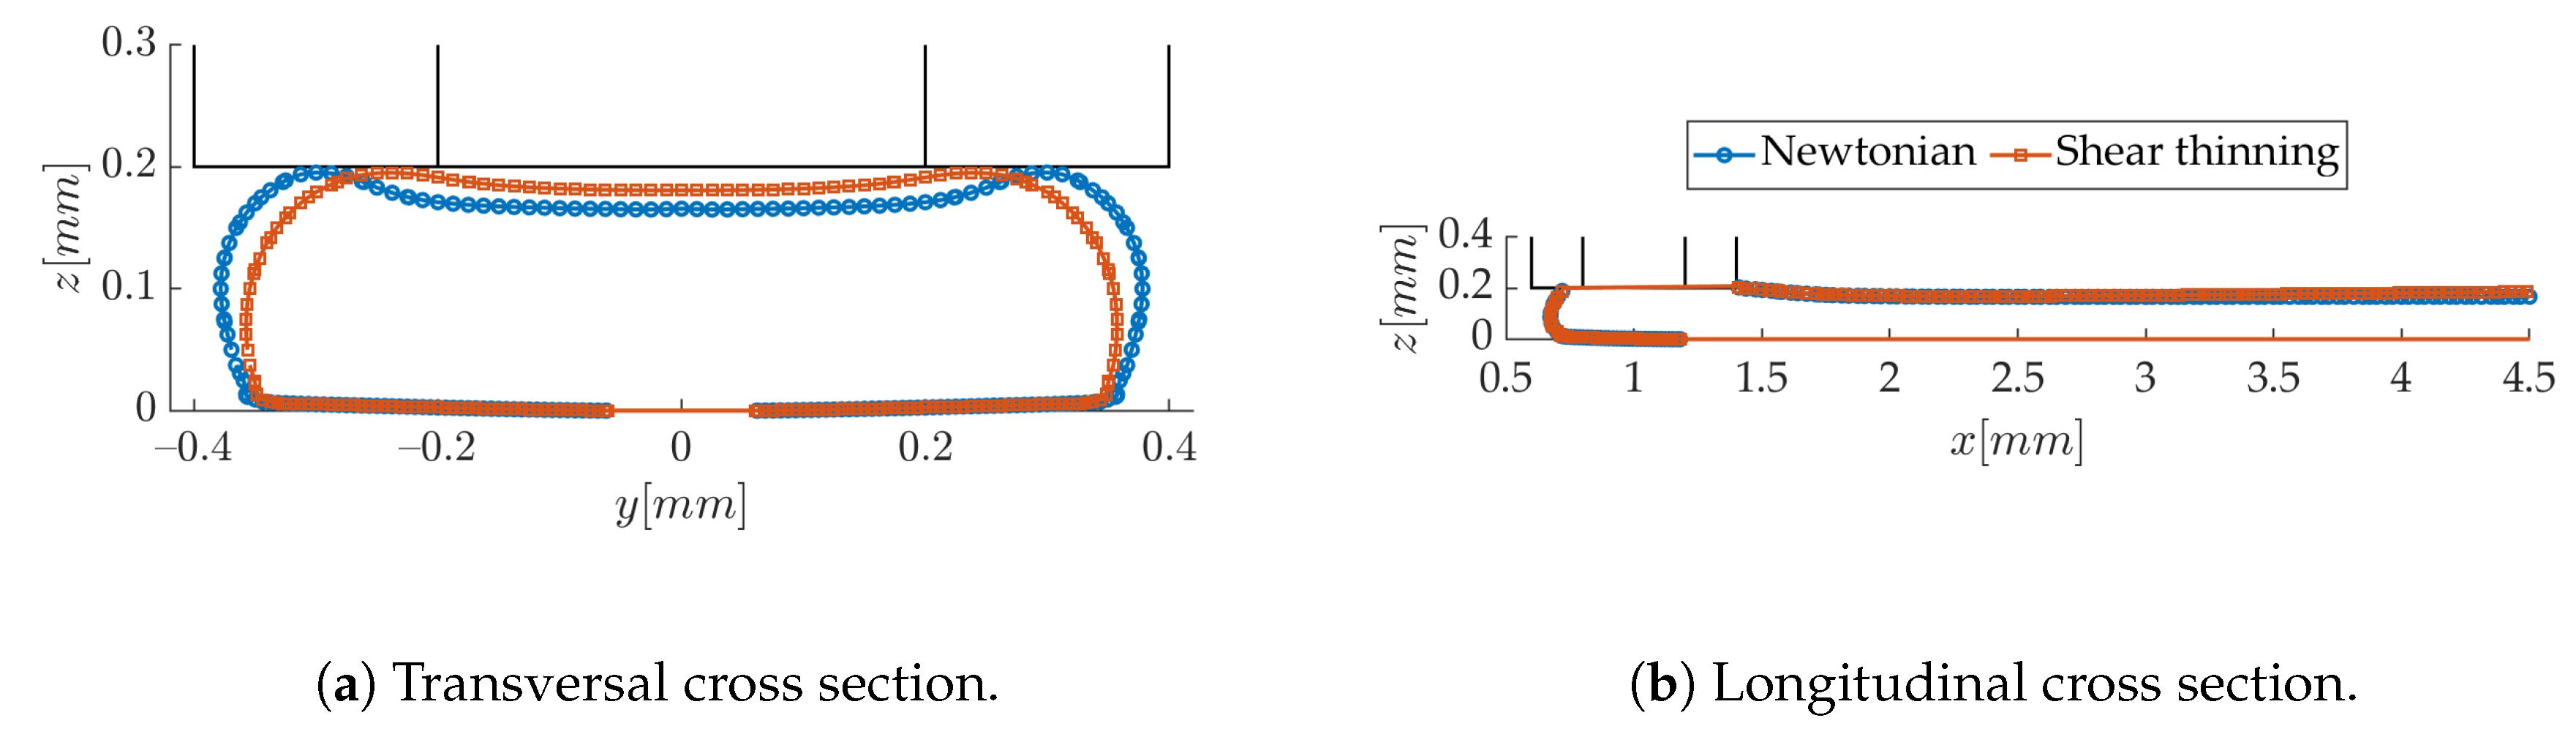
3.1. Numerical Results-Sensitivity to Modeling Parameters
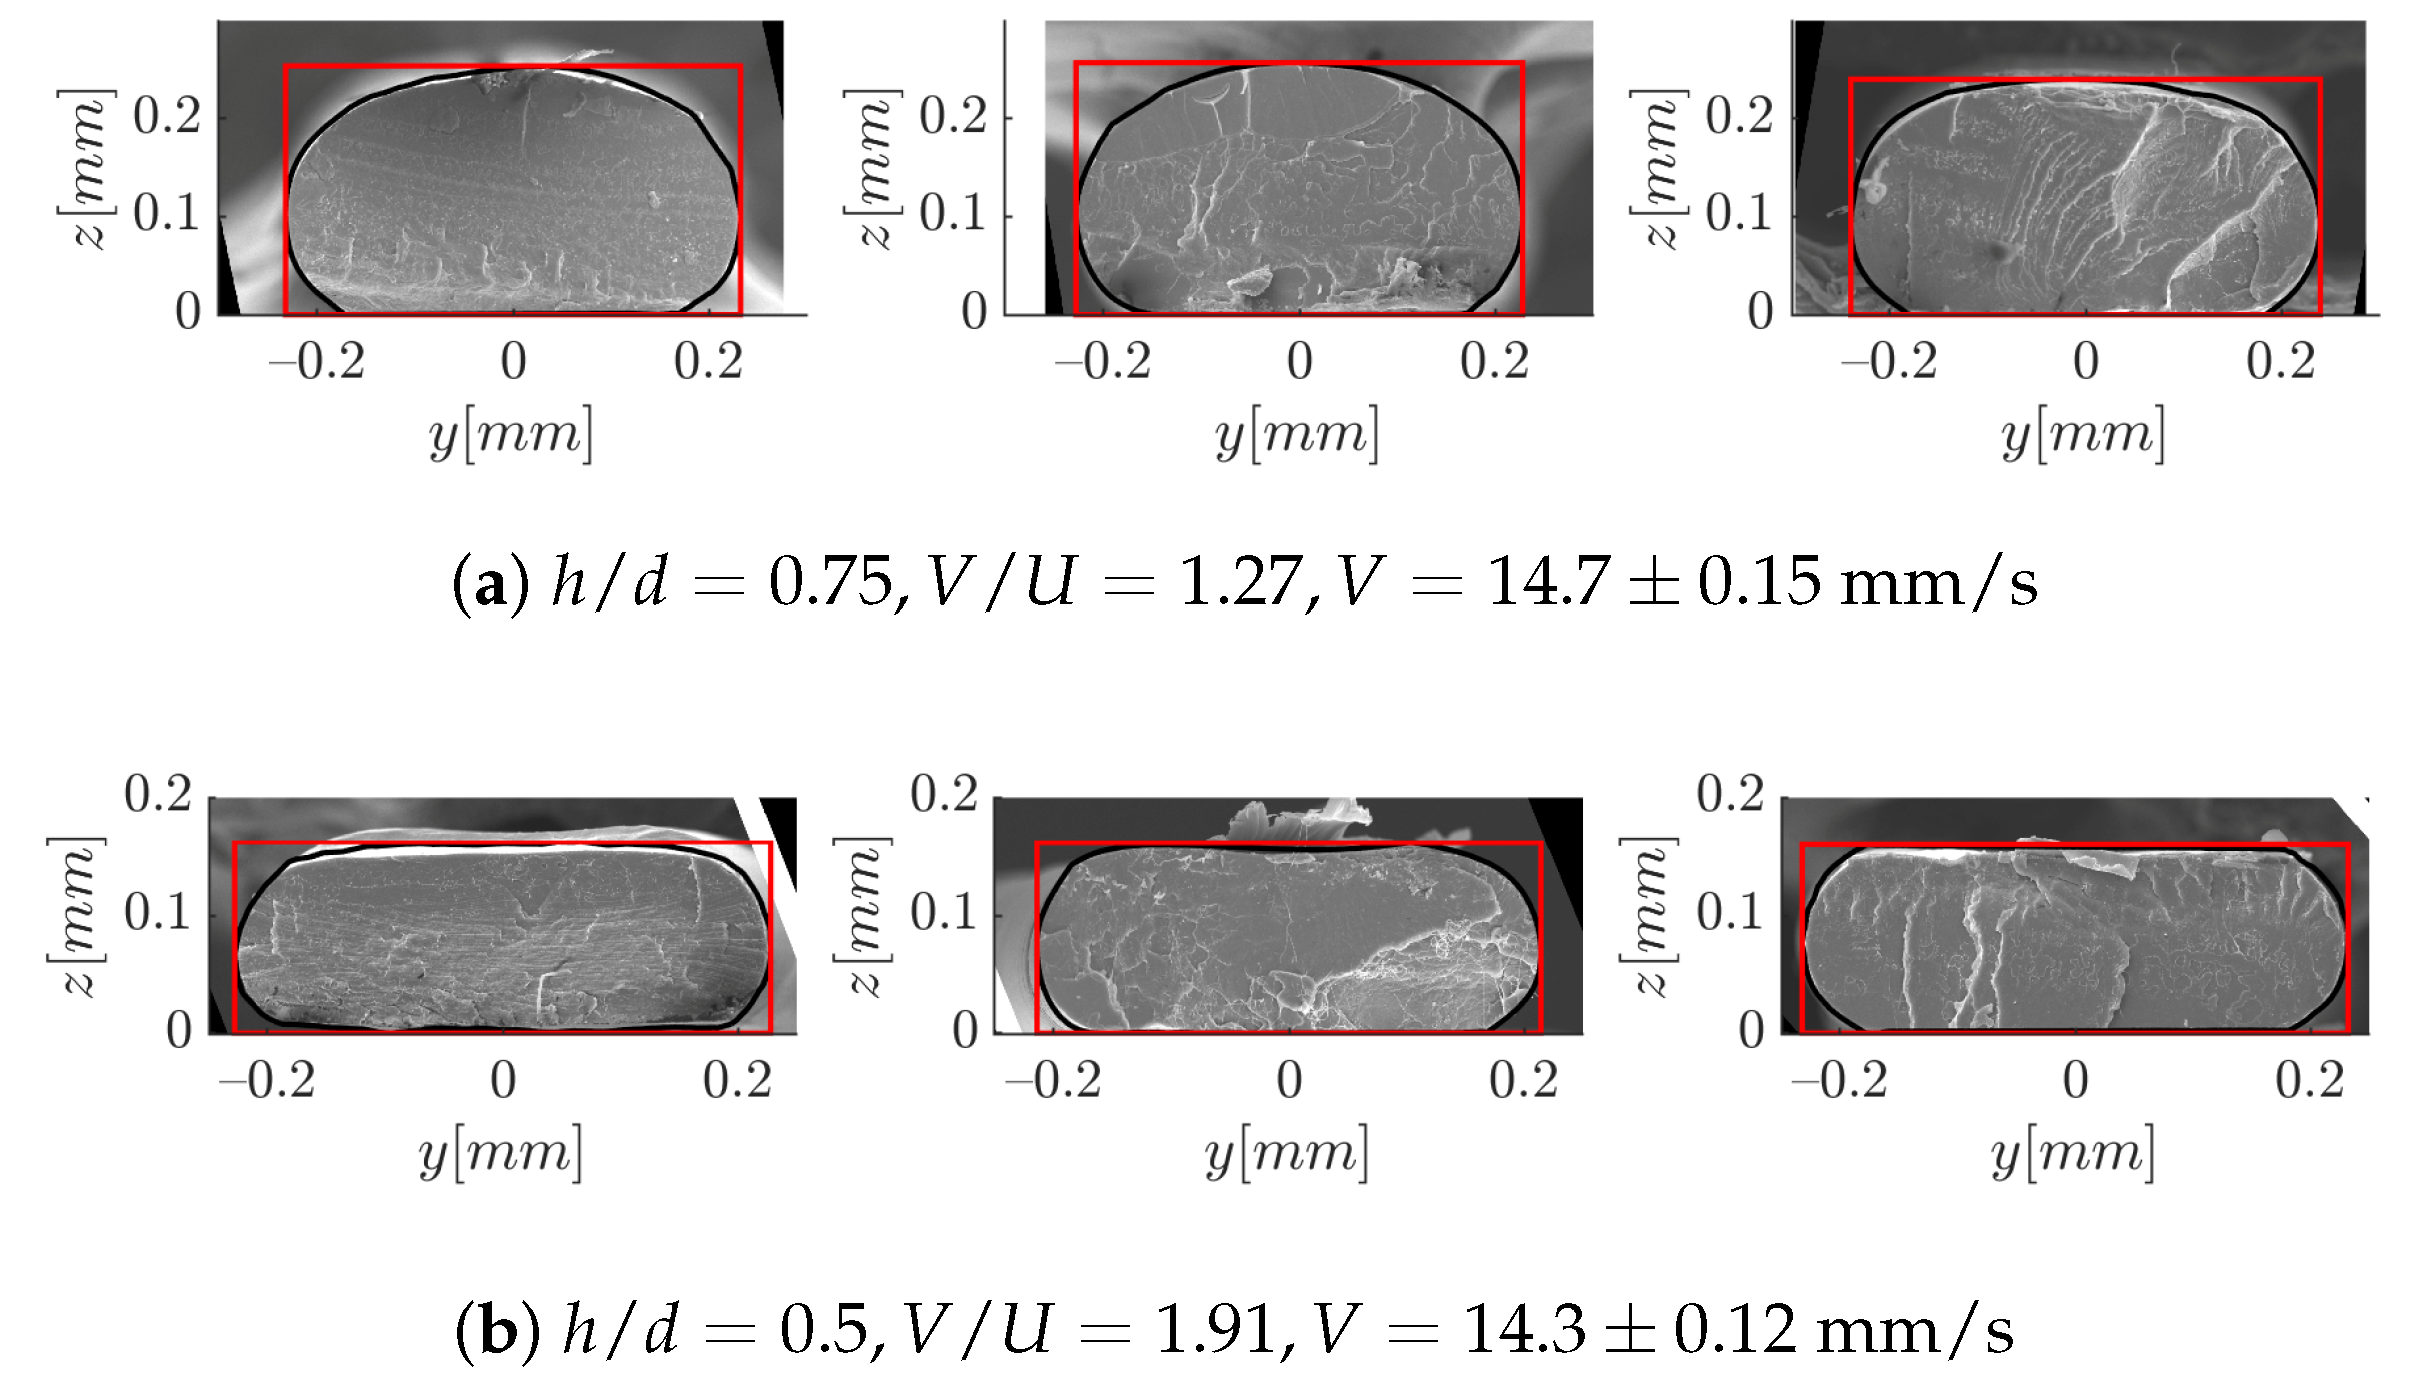
3.2. Confrontation of Numerical and Experimental Results
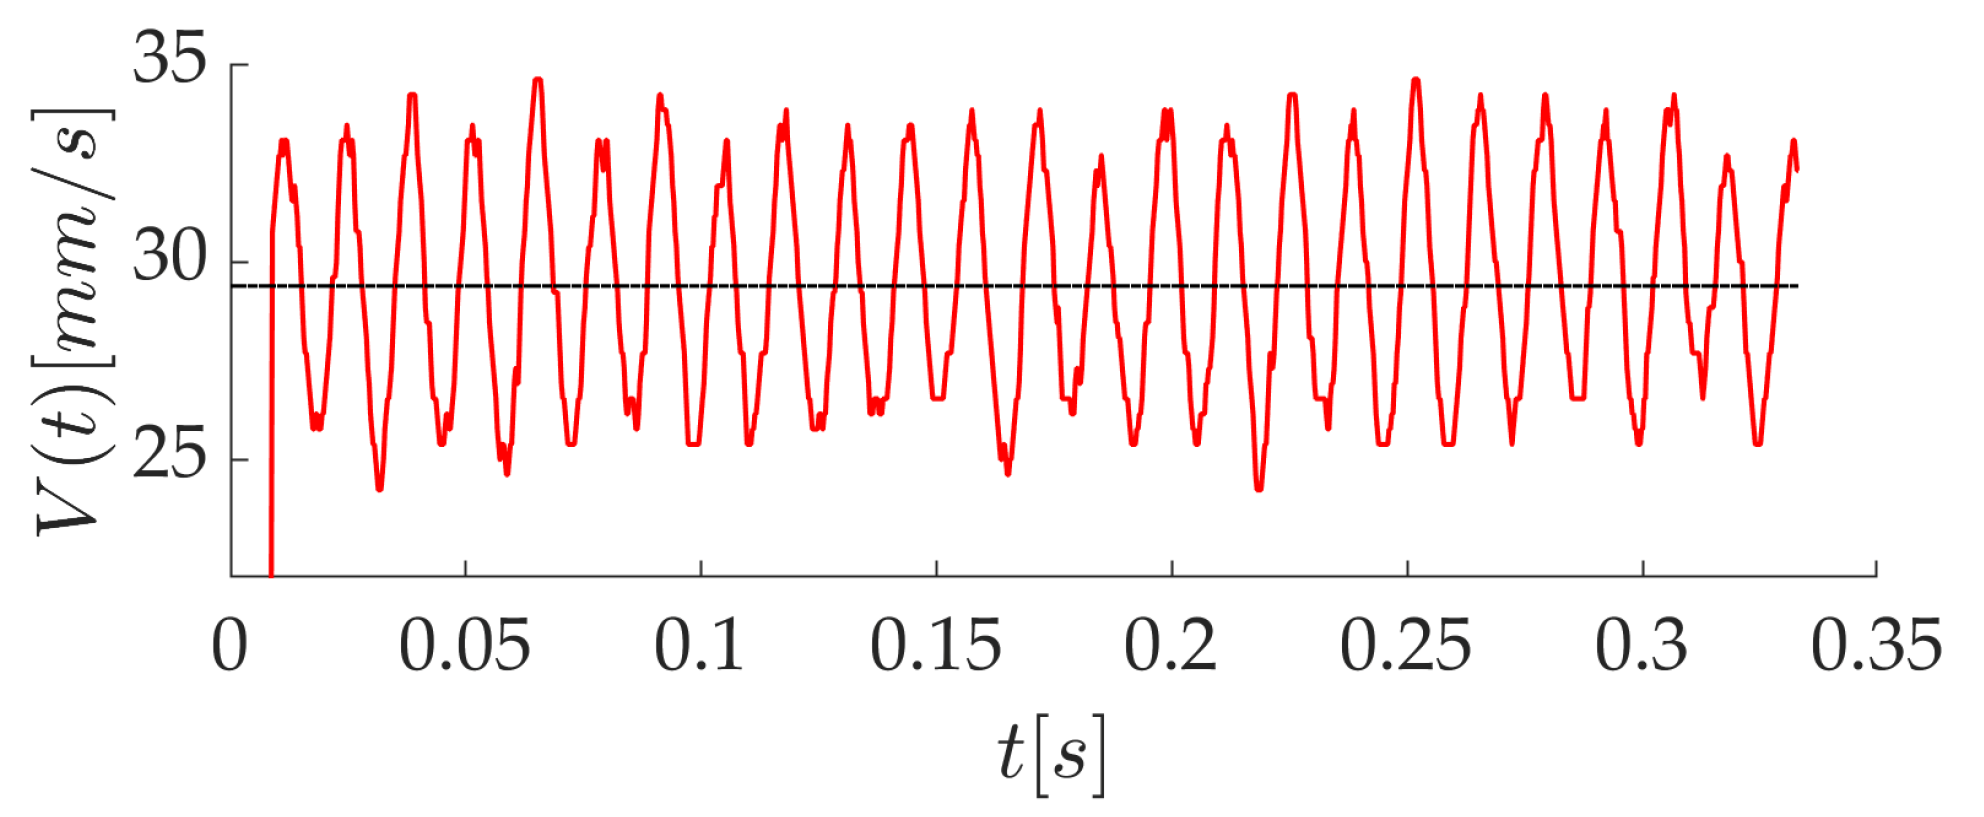
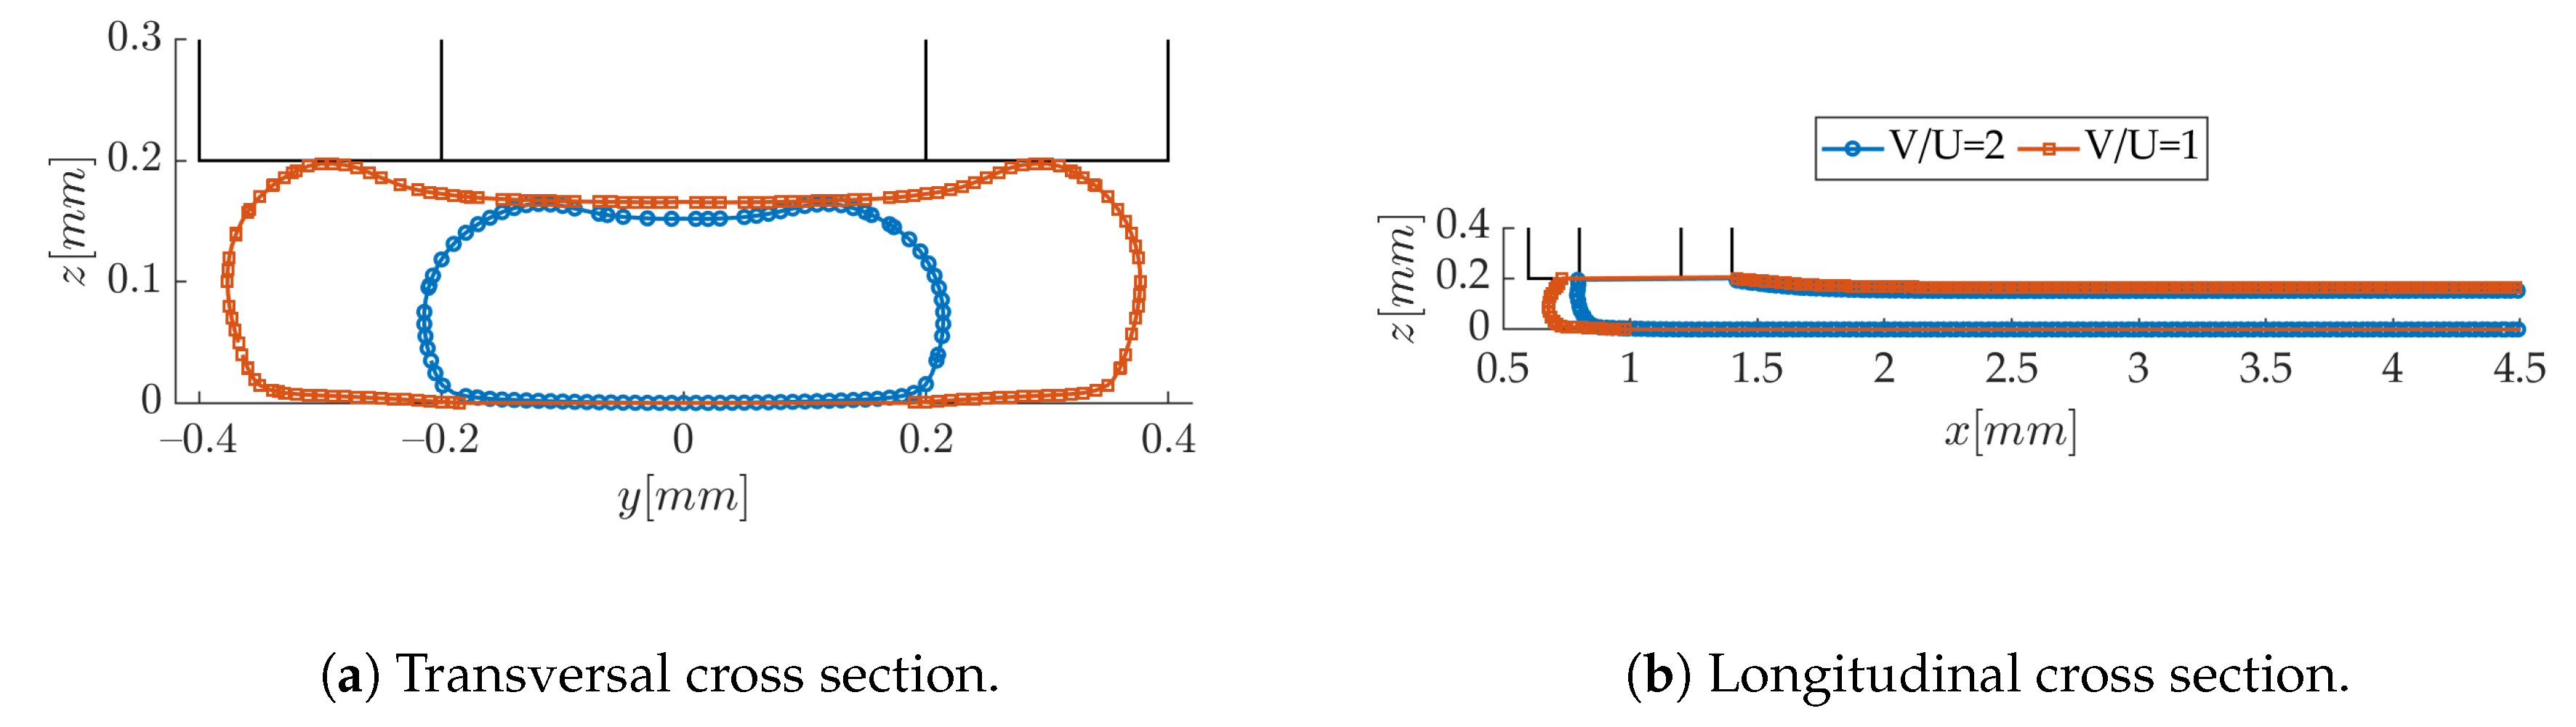
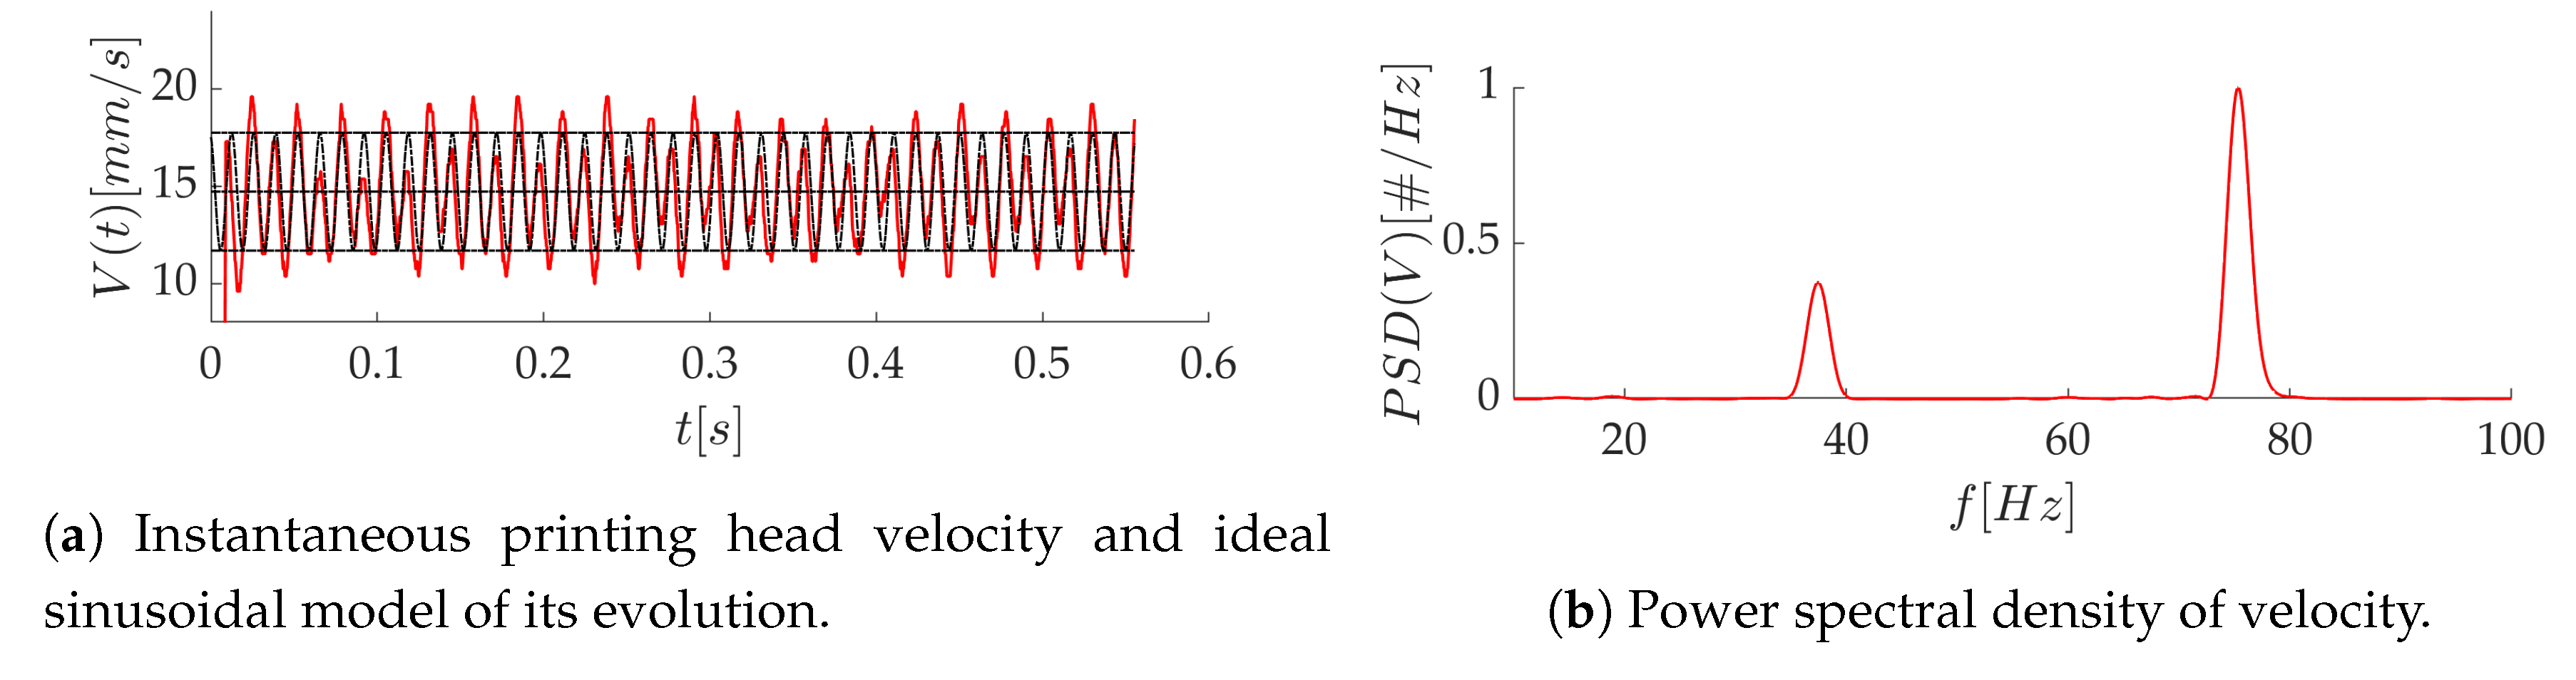
3.3. Influence of the Printing Head Velocity Fluctuations
4. Conclusions
- The measurement of the print speed and the deposited volumetric flux of material allows for a precise estimation of the extruded flow velocity.
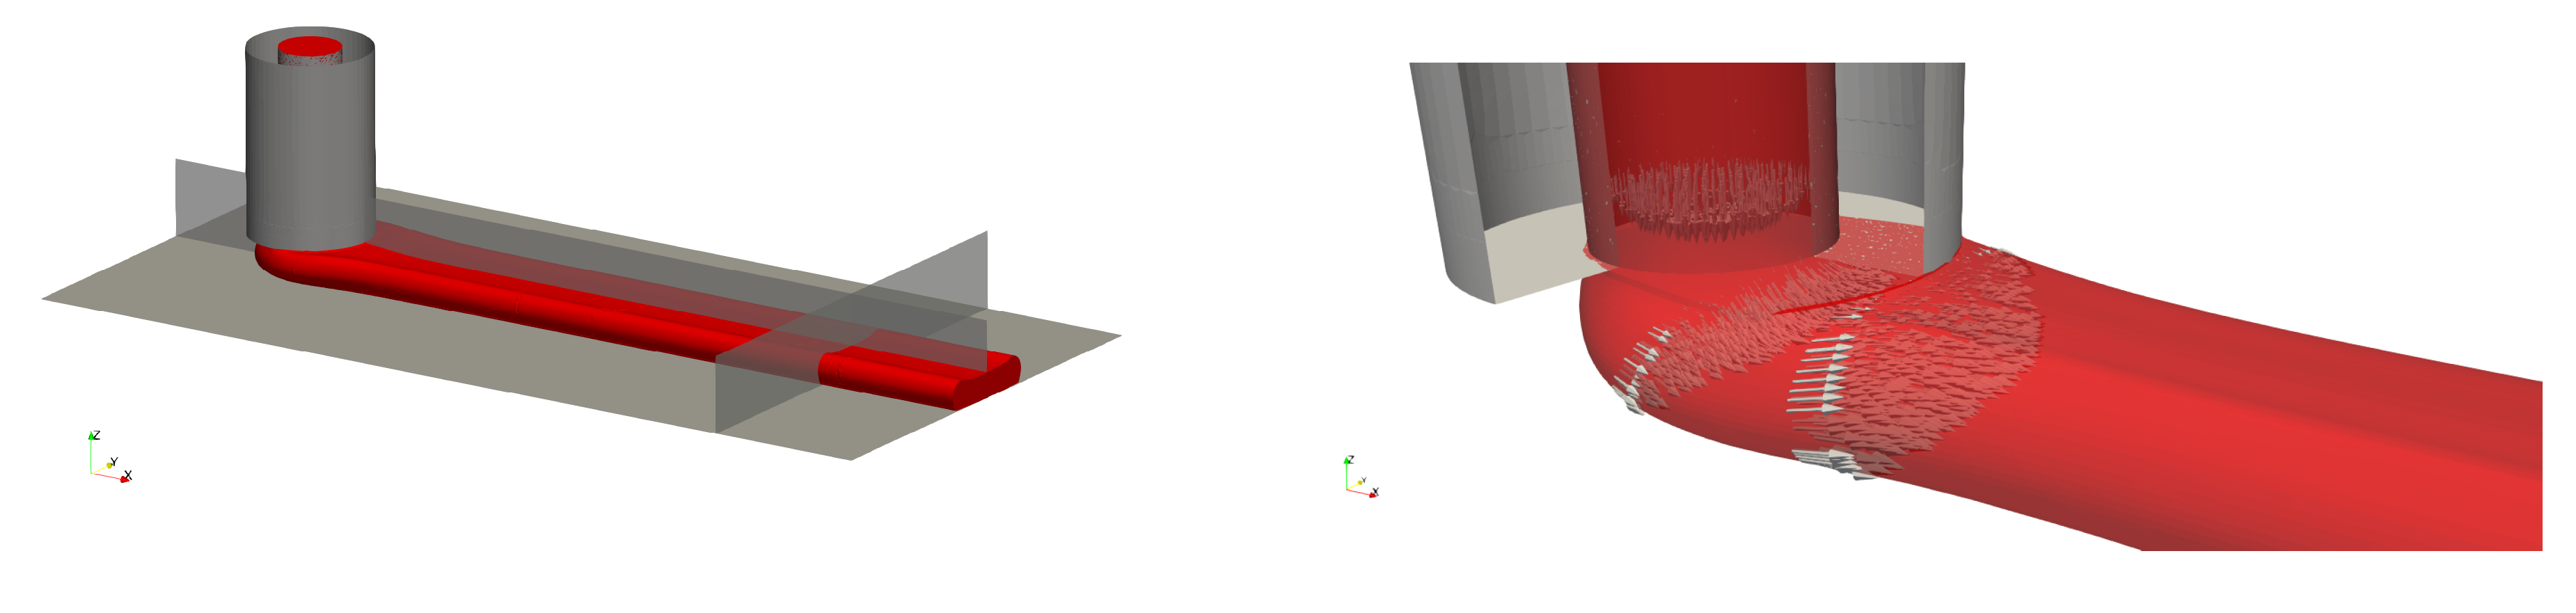
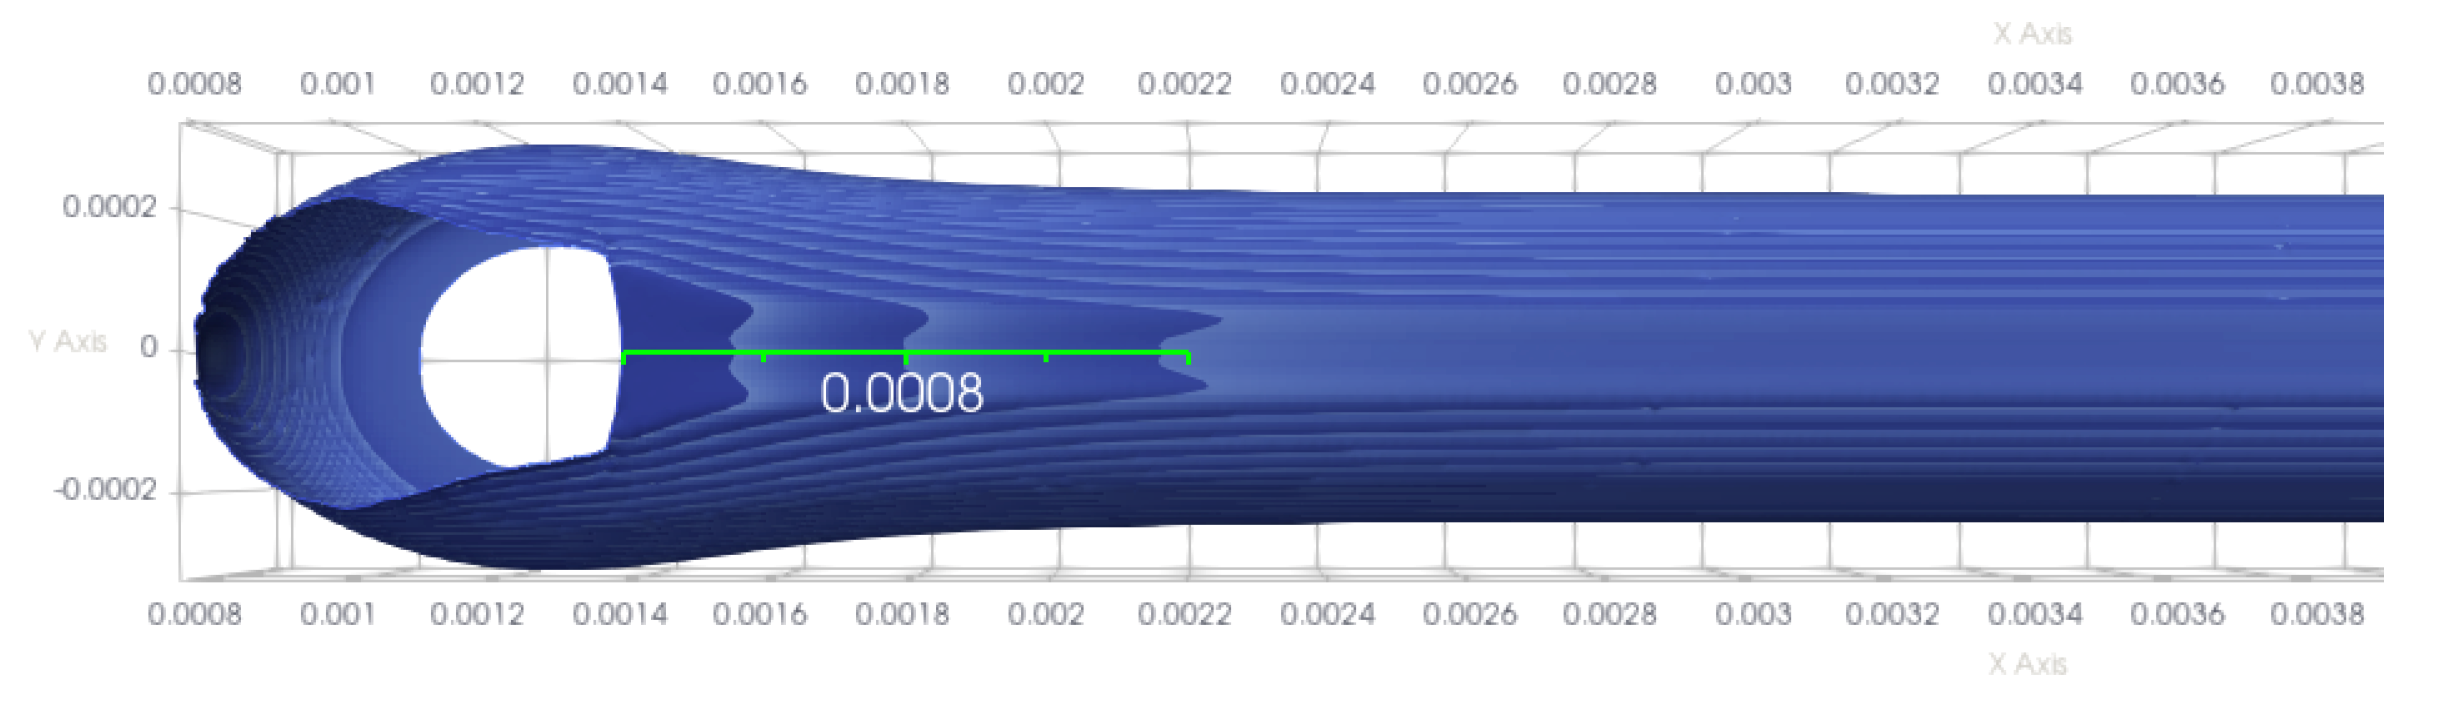
- The predicted shape of the extruded flow in the meniscus region is well validated by high-speed visualization in the range of parameters studied.
- The average strand shape and dimensions predicted by CFD coincides in general very well with the ones of the solidified samples measured by SEM. This extends the conclusions in Reference [24] to high printing speeds.
- The sinusoidal behavior of the printing head velocity leads to a visible roughness pattern on the strand. This instability is not predicted by the CFD approach used here, presumably because solidification is not accounted for.
Author Contributions
Funding
Acknowledgments
Conflicts of Interest
Abbreviations
| ABS | Acrylonitrile Butadiene Styrene |
| AM | Additive Manufacturing |
| CFD | Computational Fluid Dynamics |
| FDM | Fused Deposition Modeling |
| FFF | Filament Fused Fabrication |
| LED | Light Emitting Diode |
| PET | Polyethylene Terephthalate |
| PLA | Poly-Lactic Acid |
| VOF | Volume Of Fluid |
References
- Turner, B.N.; Strong, R.; Gold, S.A. A review of melt extrusion additive manufacturing processes: I. Process design and modeling. Rapid Protot. J. 2014, 20, 192–204. [Google Scholar] [CrossRef]
- Turner, B.N.; Gold, S.A. A review of melt extrusion additive manufacturing processes: II. Materials, dimensional accuracy and surface roughness. Rapid Protot. J. 2015, 21, 250–261. [Google Scholar] [CrossRef]
- Zhou, Y.-G.; Su, B.; Turng, L.-S. Deposition-induced effects of isotactic polypropylene and polycarbonate composites during fused deposition modeling. Rapid Protot. J. 2017, 23, 869–880. [Google Scholar] [CrossRef]
- Pérez, M.; Medina-Sánchez, G.; García-Collado, A.; Gupta, M.; Carou, D. Surface Quality Enhancement of Fused Deposition Modeling (FDM) Printed Samples Based on the Selection of Critical Printing Parameters. Materials 2018, 11, 1382. [Google Scholar] [CrossRef] [Green Version]
- Buj-Corral, I.; Domínguez-Fernández, A.; Durán-Llucià, R. Influence of Print Orientation on Surface Roughness in Fused Deposition Modeling (FDM) Processes. Materials 2019, 12, 3834. [Google Scholar] [CrossRef] [Green Version]
- Wickramasinghe, S.; Do, T.; Tran, P. FDM-Based 3D Printing of Polymer and Associated Composite: A Review on Mechanical Properties, Defects and Treatments. Polymers 2020, 12, 1529. [Google Scholar] [CrossRef]
- Mohamed, O.A.; Masood, S.H.; Bhowmik, J.L. Optimization of fused deposition modeling process parameters: A review of current research and future prospects. Adv. Manuf. 2015, 3, 42–53. [Google Scholar] [CrossRef]
- Greeff, G.P.; Schilling, M. Single print optimisation of fused filament fabrication parameters. Int. J. Adv. Manufact. Technol. 2018, 99, 845–858. [Google Scholar] [CrossRef]
- Abeykoon, C.; Sri-Amphorn, P.; Fernando, A. Optimization of fused deposition modeling parameters for improved PLA and ABS 3D printed structures. Int. J. Lightweight Mat. Manuf. 2020, 3, 284–297. [Google Scholar] [CrossRef]
- Hyndhavi, D.; Raghu Babu, G.; Bhanu Murthy, S. Investigation of dimensional accuracy and material performance in Fused Deposition Modeling. Mater. Today Proc. 2018, 5, 23508–23517. [Google Scholar] [CrossRef]
- Peng, A.; Xiao, X.; Yue, R. Process parameter optimization for fused deposition modeling using response surface methodology combined with fuzzy inference system. Int. J. Adv. Manuf. Technol. 2014, 73, 87–100. [Google Scholar] [CrossRef]
- Papazetis, G.; Vosniakos, G.-C. Mapping of deposition-stable and defect-free additive manufacturing via material extrusion from minimal experiments. Int. J. Adv. Manuf. Technol. 2019, 100, 2207–2219. [Google Scholar] [CrossRef] [Green Version]
- Bikas, H.; Stavropoulos, P.; Chryssolouris, G. Additive manufacturing methods and modelling approaches: A critical review. Int. J. Adv. Manuf. Technol. 2016, 83, 389–405. [Google Scholar] [CrossRef] [Green Version]
- Go, J.; Schiffres, S.N.; Stevens, A.G.; Hart, A.J. Rate limits of additive manufacturing by fused filament fabrication and guidelines for high-throughput system design. Add. Manuf. 2017, 16, 1–11. [Google Scholar] [CrossRef]
- Serdeczny, M.P.; Comminal, R.; Pedersen, D.B.; Spangenberg, J. Experimental and analytical study of the polymer melt flow through the hot-end in material extrusion additive manufacturing. Add. Manuf. 2020, 32, 100997. [Google Scholar] [CrossRef]
- Serdeczny, M.P.; Comminal, R.; Tusher Mollah, M.; Pedersen, D.B.; Spangenberg, J. Numerical modeling of the polymer flow through the hot-end in filament-based material extrusion additive manufacturing. Add. Manuf. 2020, 36, 101454. [Google Scholar] [CrossRef]
- Heller, B.P.; Smith, D.E.; Jack, D.A. Effects of extrudate swell and nozzle geometry on fiber orientation in Fused Filament Fabrication nozzle flow. Add. Manuf. 2016, 12, 252–264. [Google Scholar] [CrossRef]
- Agassant, J.-F.; Pigeonneau, F.; Sardo, L.; Vincent, M. Flow analysis of the polymer spreading during extrusion additive manufacturing. Add. Manuf. 2019, 29, 100794. [Google Scholar] [CrossRef] [Green Version]
- Hebda, M.; McIllroy, C.; Whiteside, B.; Caton-Rose, F.; Coates, P. A method for predicting geometric characteristics of polymer deposition during fused-filament-fabrication. Add. Manuf. 2019, 27, 99–108. [Google Scholar] [CrossRef] [Green Version]
- Du, J.; Wei, Z.; Wang, X.; Wang, J.; Chen, Z. An improved fused deposition modeling process for forming large-size thin-walled parts. J. Mat. Proc. Technol. 2016, 234, 332–341. [Google Scholar] [CrossRef]
- Xia, H.; Lu, J.; Dabiri, S.; Tryggvason, G. Fully resolved numerical simulations of fused deposition modeling. Part I- Fluid flow. Rapid Prototyping J. 2017, 24, 463–476. [Google Scholar] [CrossRef]
- Xia, H.; Lu, J.; Dabiri, S.; Tryggvason, G. Fully resolved numerical simulations of fused deposition modeling. Part II- Solidification, Residual stresses and modeling of the nozzle. Rapid Prototyp. J. 2017, 24, 973–987. [Google Scholar] [CrossRef] [Green Version]
- Comminal, R.; Serdeczny, M.P.; Pedersen, D.B.; Spangenberg, J. Numerical modeling of the strand deposition flow in extrusion-based additive manufacturing. Addit. Manuf. 2018, 20, 68–76. [Google Scholar] [CrossRef] [Green Version]
- Serdeczny, M.P.; Comminal, R.; Pedersen, D.B.; Spangenberg, J. Experimental validation of a numerical model for the strand shape in material extrusion additive manufacturing. Add. Manuf. 2018, 24, 145–153. [Google Scholar] [CrossRef]
- Behdani, B.; Senter, M.; Mason, L.; Leu, M.; Park, J. Numerical study on the temperature-dependent viscosity effect on the strand shape in extrusion-based additive Manufacturing. J. Manuf. Mater. Process. 2020, 4, 46. [Google Scholar] [CrossRef]
- Xia, H.; Lu, J.; Tryggvason, G. Simulations of fused filament fabrication using a front tracking method. Int. J. Heat Mass Transf. 2019, 138, 1310–1319. [Google Scholar] [CrossRef]
- Serdeczny, M.P.; Comminal, R.; Pedersen, D.B.; Spangenberg, J. Numerical simulations of the mesostructure formation in material extrusion additive manufacturing. Addit. Manuf. 2019, 28, 419–429. [Google Scholar] [CrossRef]
- Comminal, R.; Pimenta, F.; Hattel, J.H.; Alves, M.A.; Spangenberg, J. Numerical simulation of the planar extrudate swell of pseudoplastic and viscoelastic fluids with the streamfunction and the VOF methods. J. Non Newton. Fluid Mech. 2018, 252, 1–18. [Google Scholar] [CrossRef]
- Xia, H.; Lu, J.; Tryggvason, G. A numerical study of the effect of viscoelastic stresses in fused filament fabrication. Comput. Methods Appl. Mech. Engrg. 2019, 346, 242–259. [Google Scholar] [CrossRef]
- Liu, J.; Andersen, K.L.; Sridhar, N. Direct simulation of polymer Fused Deposition Modeling (FDM)-An implementation of the multi-phase viscoelastic solver in OpenFOAM. Int. J. Comput. Meth. 2020, 17, 1844002. [Google Scholar] [CrossRef] [Green Version]
- Ding, X.; Liu, J.; Harris, T.A.L. A review of the operating limits in slot die coating processes. AIChE J. 2016, 62, 2508–2524. [Google Scholar] [CrossRef]
- Zitzenbacher, G.; Huang, Z.; Langauer, M.; Forsich, C.; Holzer, C. Wetting behavior of polymer melts on coated and uncoated tool steel surfaces. J. Appl. Polym. Sci. 2016, 133, 43469. [Google Scholar] [CrossRef]
- Vera, J.; Contraires, E.; Brulez, A.-C.; Larochette, M.; Valette, S.; Benayoun, S. Wetting of polymer melts on coated and uncoated steel surfaces. Appl. Surf. Sci. 2017, 410, 87–98. [Google Scholar] [CrossRef]
- Zitzenbacher, G.; Dirnberger, H.; Langauer, M.; Holzer, C. Calculation of the contact angle of polymer melts on tool surfaces from viscosity parameters. Polymers 2017, 10, 38. [Google Scholar] [CrossRef] [Green Version]
- De Ruiter, R.; Royon, L.; Snoeijer, J.H.; Brunet, P. Drop spreading and gelation of thermoresponsive polymers. Soft Matter 2018, 16, 3096–3104. [Google Scholar] [CrossRef] [Green Version]
- Tavakoli, F.; Davis, S.H.; Kavehpour, H.P. Spreading and arrest of a molten liquid on cold substrates. Langmuir 2014, 30, 10151–10155. [Google Scholar] [CrossRef]
- Pan, M. Method for Evaluating the Wettability of Polyethylene against Different Surfaces at Processing Temperatures. MSc Thesis, Chalmers University of Technology, Gothenburg, Sweden, 2010. [Google Scholar]
- Crockett, R.S. The Liquid-to-Solid Transition in Stereodeposition Techniques. Ph.D. Thesis, University of Arizona, Tucson, AZ, USA, 1997. [Google Scholar]
- Zare, Y.; Park, S.P.; Rhee, K.Y. Analysis of complex viscosity and shear thinning behavior in poly(lactic acid)/poly(ethylene oxide)/carbon nanotubes biosensor based on Carreau-Yasuda model. Results Phys. 2019, 13, 102245. [Google Scholar] [CrossRef]
- Zhang, Y.; Fuentes, C.A.; Koekoekx, R.; Clasen, C.; van Vuure, A.W.; De Coninck, J.; Seveno, D. Spreading dynamics of molten polymer drops on glass substrates. Langmuir 2017, 33, 8447–8454. [Google Scholar] [CrossRef]
- Serdeczny, M.P.; Comminal, R.; Pedersen, D.B.; Spangenberg, J. Numerical study of the impact of shear thinning behavior on the strand deposition flow in the extrusion-based additive manufacturing. In Proceedings of the European Society for Precision Engineering and Nanotechnology (Euspen) 18th International Conference and Exhibition, Venice, Italy, 4–8 June 2018. [Google Scholar]
- Agassant, J.-F.; Arda, D.R.; Combeaud, C.; Merten, A.; Munstedt, H.; Mackley, M.R.; Robert, L.; Vergnes, B. Polymer processing extrusion instabilities and methods for their elimination or minimization. Int. Polym. Proc. 2006, 21, 239–255. [Google Scholar] [CrossRef] [Green Version]


| Process Parameter | Symbol | Unit | Values |
|---|---|---|---|
| Nozzle separation | h | mm | 0.2, 0.3 |
| Printing head velocity | V | mm/s | 15, 22, 30 |
| Extrusion mean velocity | U | mm/s | 7.5, 11, 15 (), 11.5, 16.9, 23.1 () |
| Normalized printing head velocity | - | 2 (), 1.3 () | |
| Extrusion temperature | T | °C | 215 |
| Property | Symbol | Unit | Value |
|---|---|---|---|
| Density | kg/m3 | 1250 | |
| Dynamic viscosity (newtonian) | Pa·s | 330 | |
| Shear rate dependent viscosity | Pa·s | Equation (3) | |
| Surface tension | N/m | 0.04 | |
| Linear thermal expansion coefficient | °C−1 |
| Mesh | Cell Number | Min. Cell Size |
|---|---|---|
| Coarse | 600,000 | 40 m |
| Medium | 2,400,000 | 20 m |
| Fine | 7,700,000 | 10 m |
Publisher’s Note: MDPI stays neutral with regard to jurisdictional claims in published maps and institutional affiliations. |
© 2020 by the authors. Licensee MDPI, Basel, Switzerland. This article is an open access article distributed under the terms and conditions of the Creative Commons Attribution (CC BY) license (http://creativecommons.org/licenses/by/4.0/).
Share and Cite
Gosset, A.; Barreiro-Villaverde, D.; Becerra Permuy, J.C.; Lema, M.; Ares-Pernas, A.; Abad López, M.J. Experimental and Numerical Investigation of the Extrusion and Deposition Process of a Poly(lactic Acid) Strand with Fused Deposition Modeling. Polymers 2020, 12, 2885. https://doi.org/10.3390/polym12122885
Gosset A, Barreiro-Villaverde D, Becerra Permuy JC, Lema M, Ares-Pernas A, Abad López MJ. Experimental and Numerical Investigation of the Extrusion and Deposition Process of a Poly(lactic Acid) Strand with Fused Deposition Modeling. Polymers. 2020; 12(12):2885. https://doi.org/10.3390/polym12122885
Chicago/Turabian StyleGosset, Anne, David Barreiro-Villaverde, Juan Carlos Becerra Permuy, Marcos Lema, Ana Ares-Pernas, and María José Abad López. 2020. "Experimental and Numerical Investigation of the Extrusion and Deposition Process of a Poly(lactic Acid) Strand with Fused Deposition Modeling" Polymers 12, no. 12: 2885. https://doi.org/10.3390/polym12122885