FeNxC Based Catalysts Prepared by the Calcination of Iron-Ethylenediamine@Polyaniline as the Cathode-Catalyst of Proton Exchange Membrane Fuel Cell


 , ,
, ,
Abstract
:
1. Introduction
2. Experimental
2.1. Materials
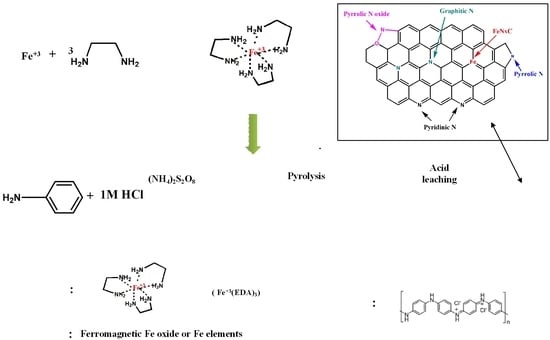
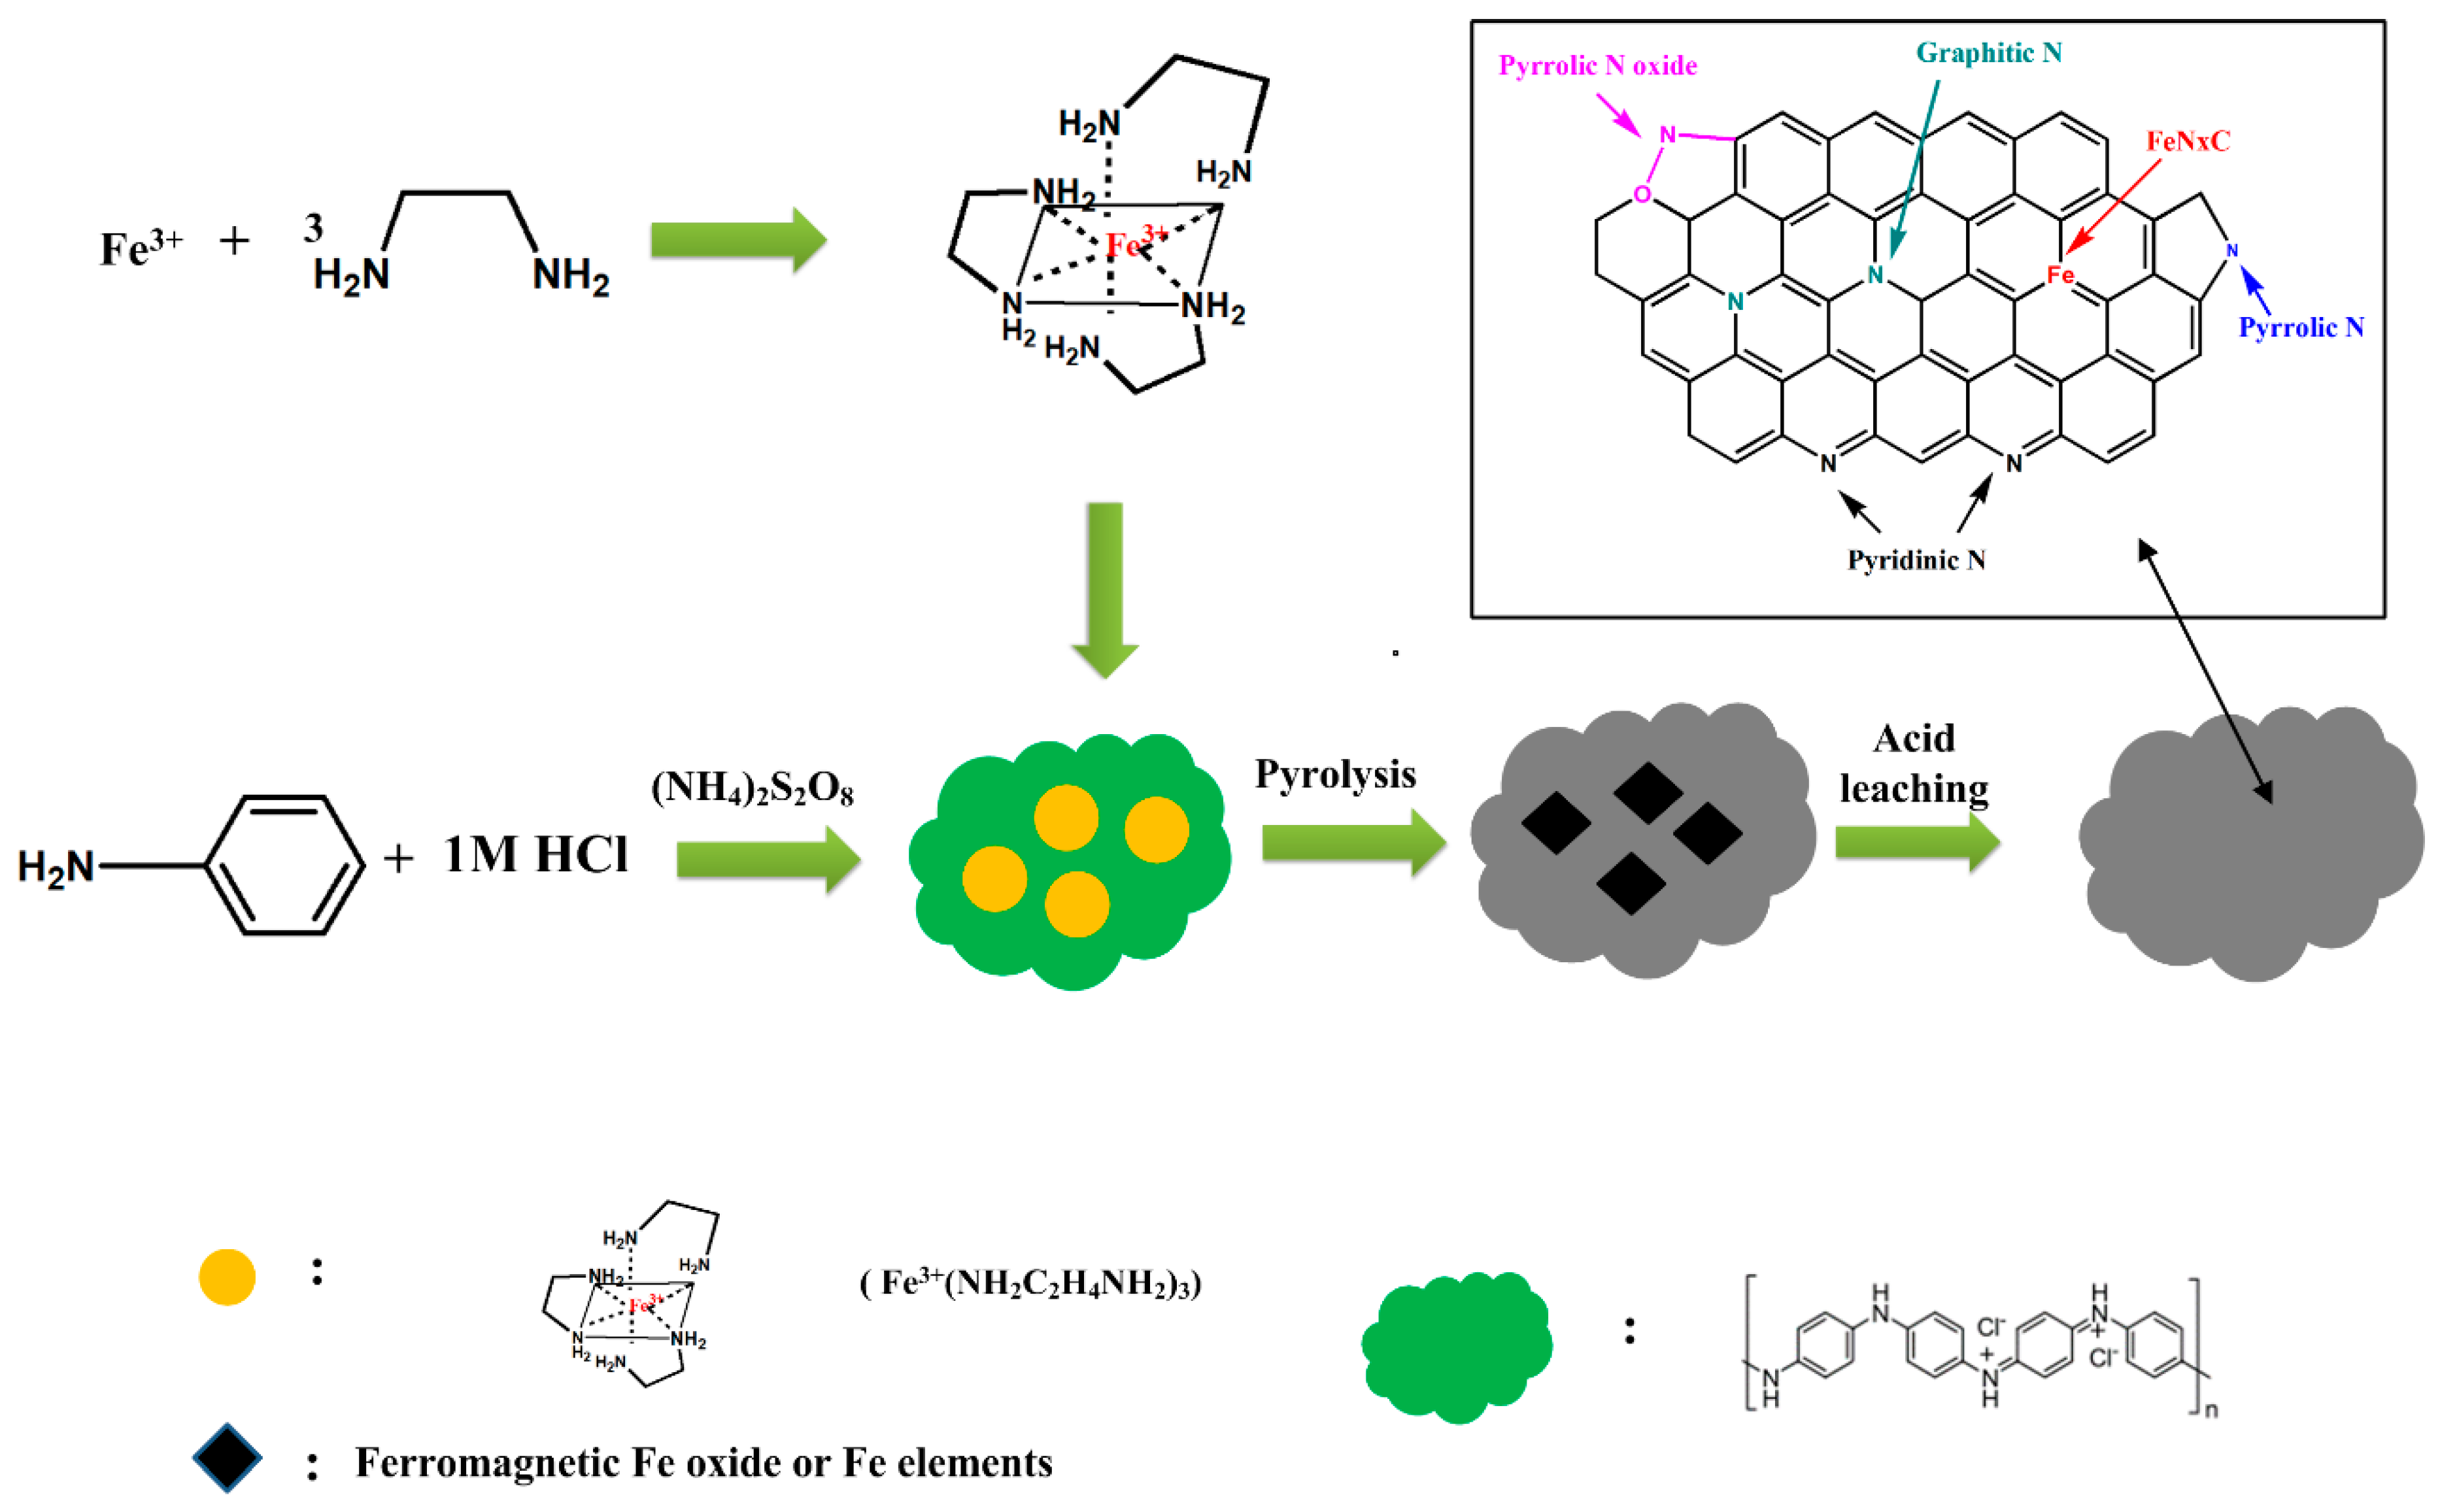
2.2. Preparation of FeNxC Catalyst
2.3. FTIR
2.4. X-ray Photoelectron Spectroscopy (XPS)
2.5. WXRD (Wide angle X-ray Diffraction: Powder X-ray Diffraction)
2.6. Energy Dispersive X-ray Spectra (EDx)
2.7. Scanning Electronic Microscopy (SEM)
2.8. Surface Area and Pore Size Measurement (BET Method)
2.9. Electrochemical Characterization
2.9.1. Current–Potential Polarization-Linear Sweep Voltammetry (LSV)
2.9.2. MEA Preparation
2.9.3. Single-Cell Performance Testing
3. Results and Discussion
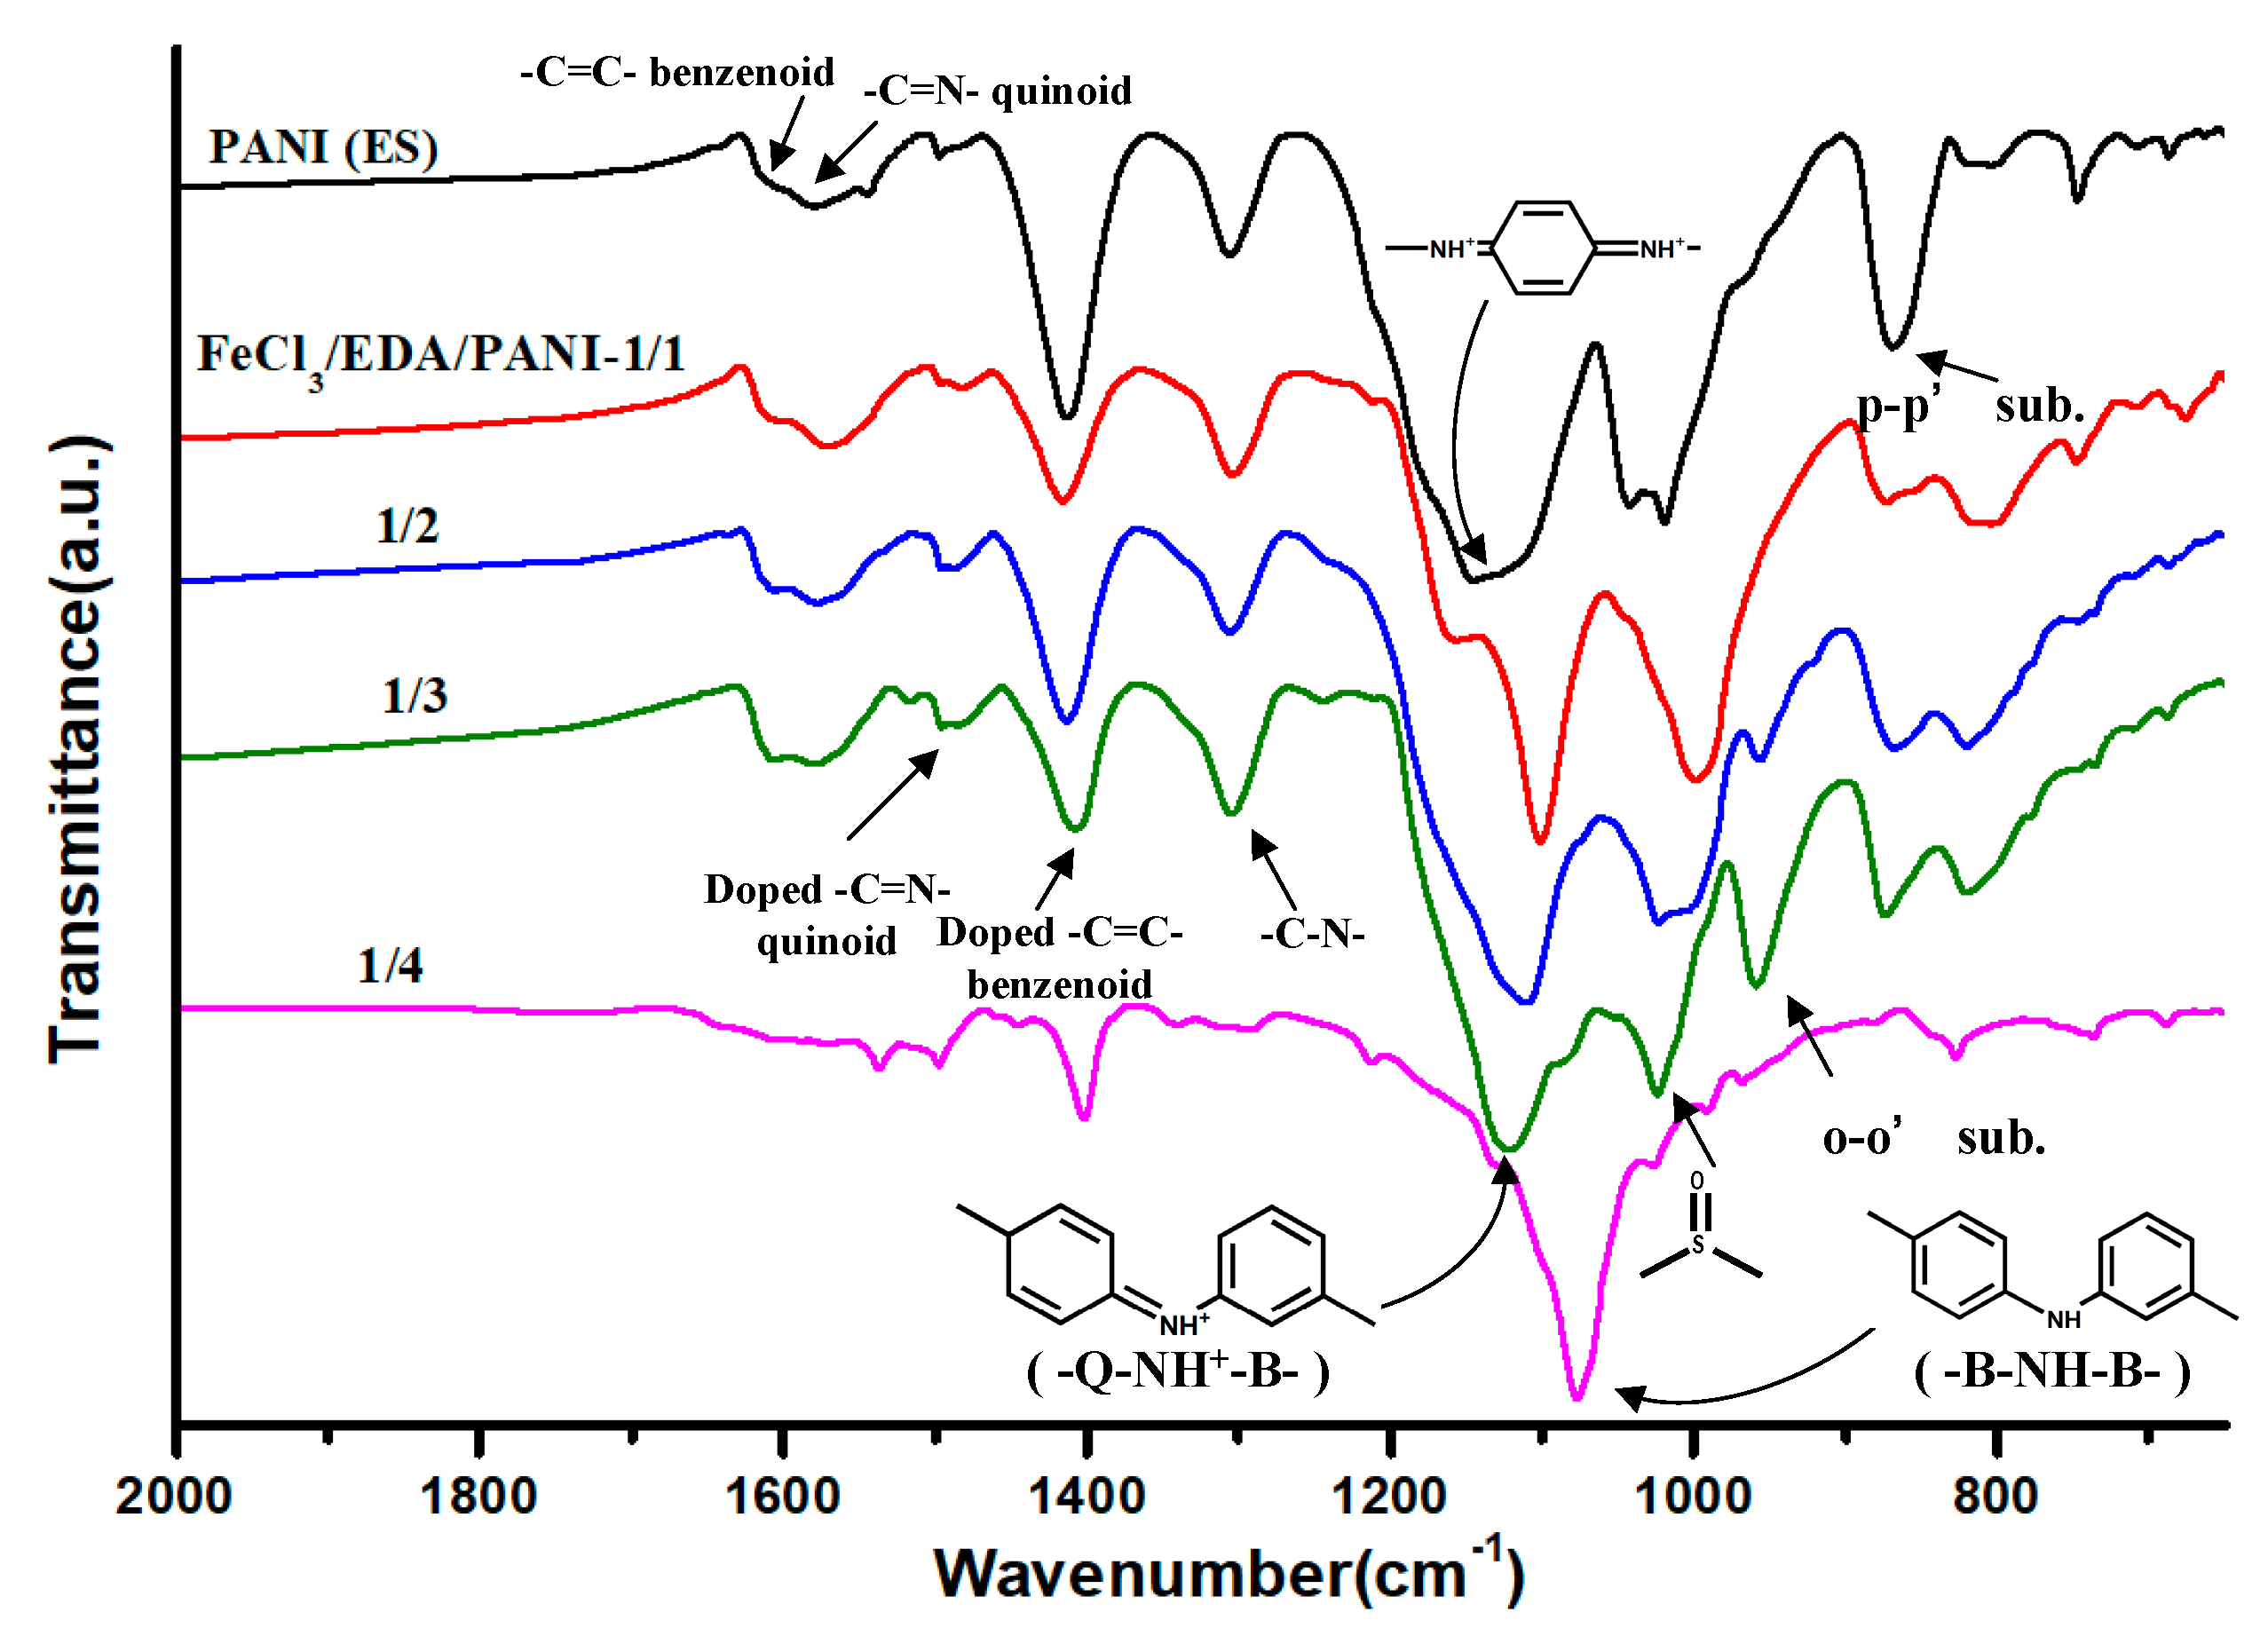
3.1. FTIR Spectra
3.2. XPS
3.3. XRD
3.4. EDx
3.5. SEM
3.6. BET Surface Area
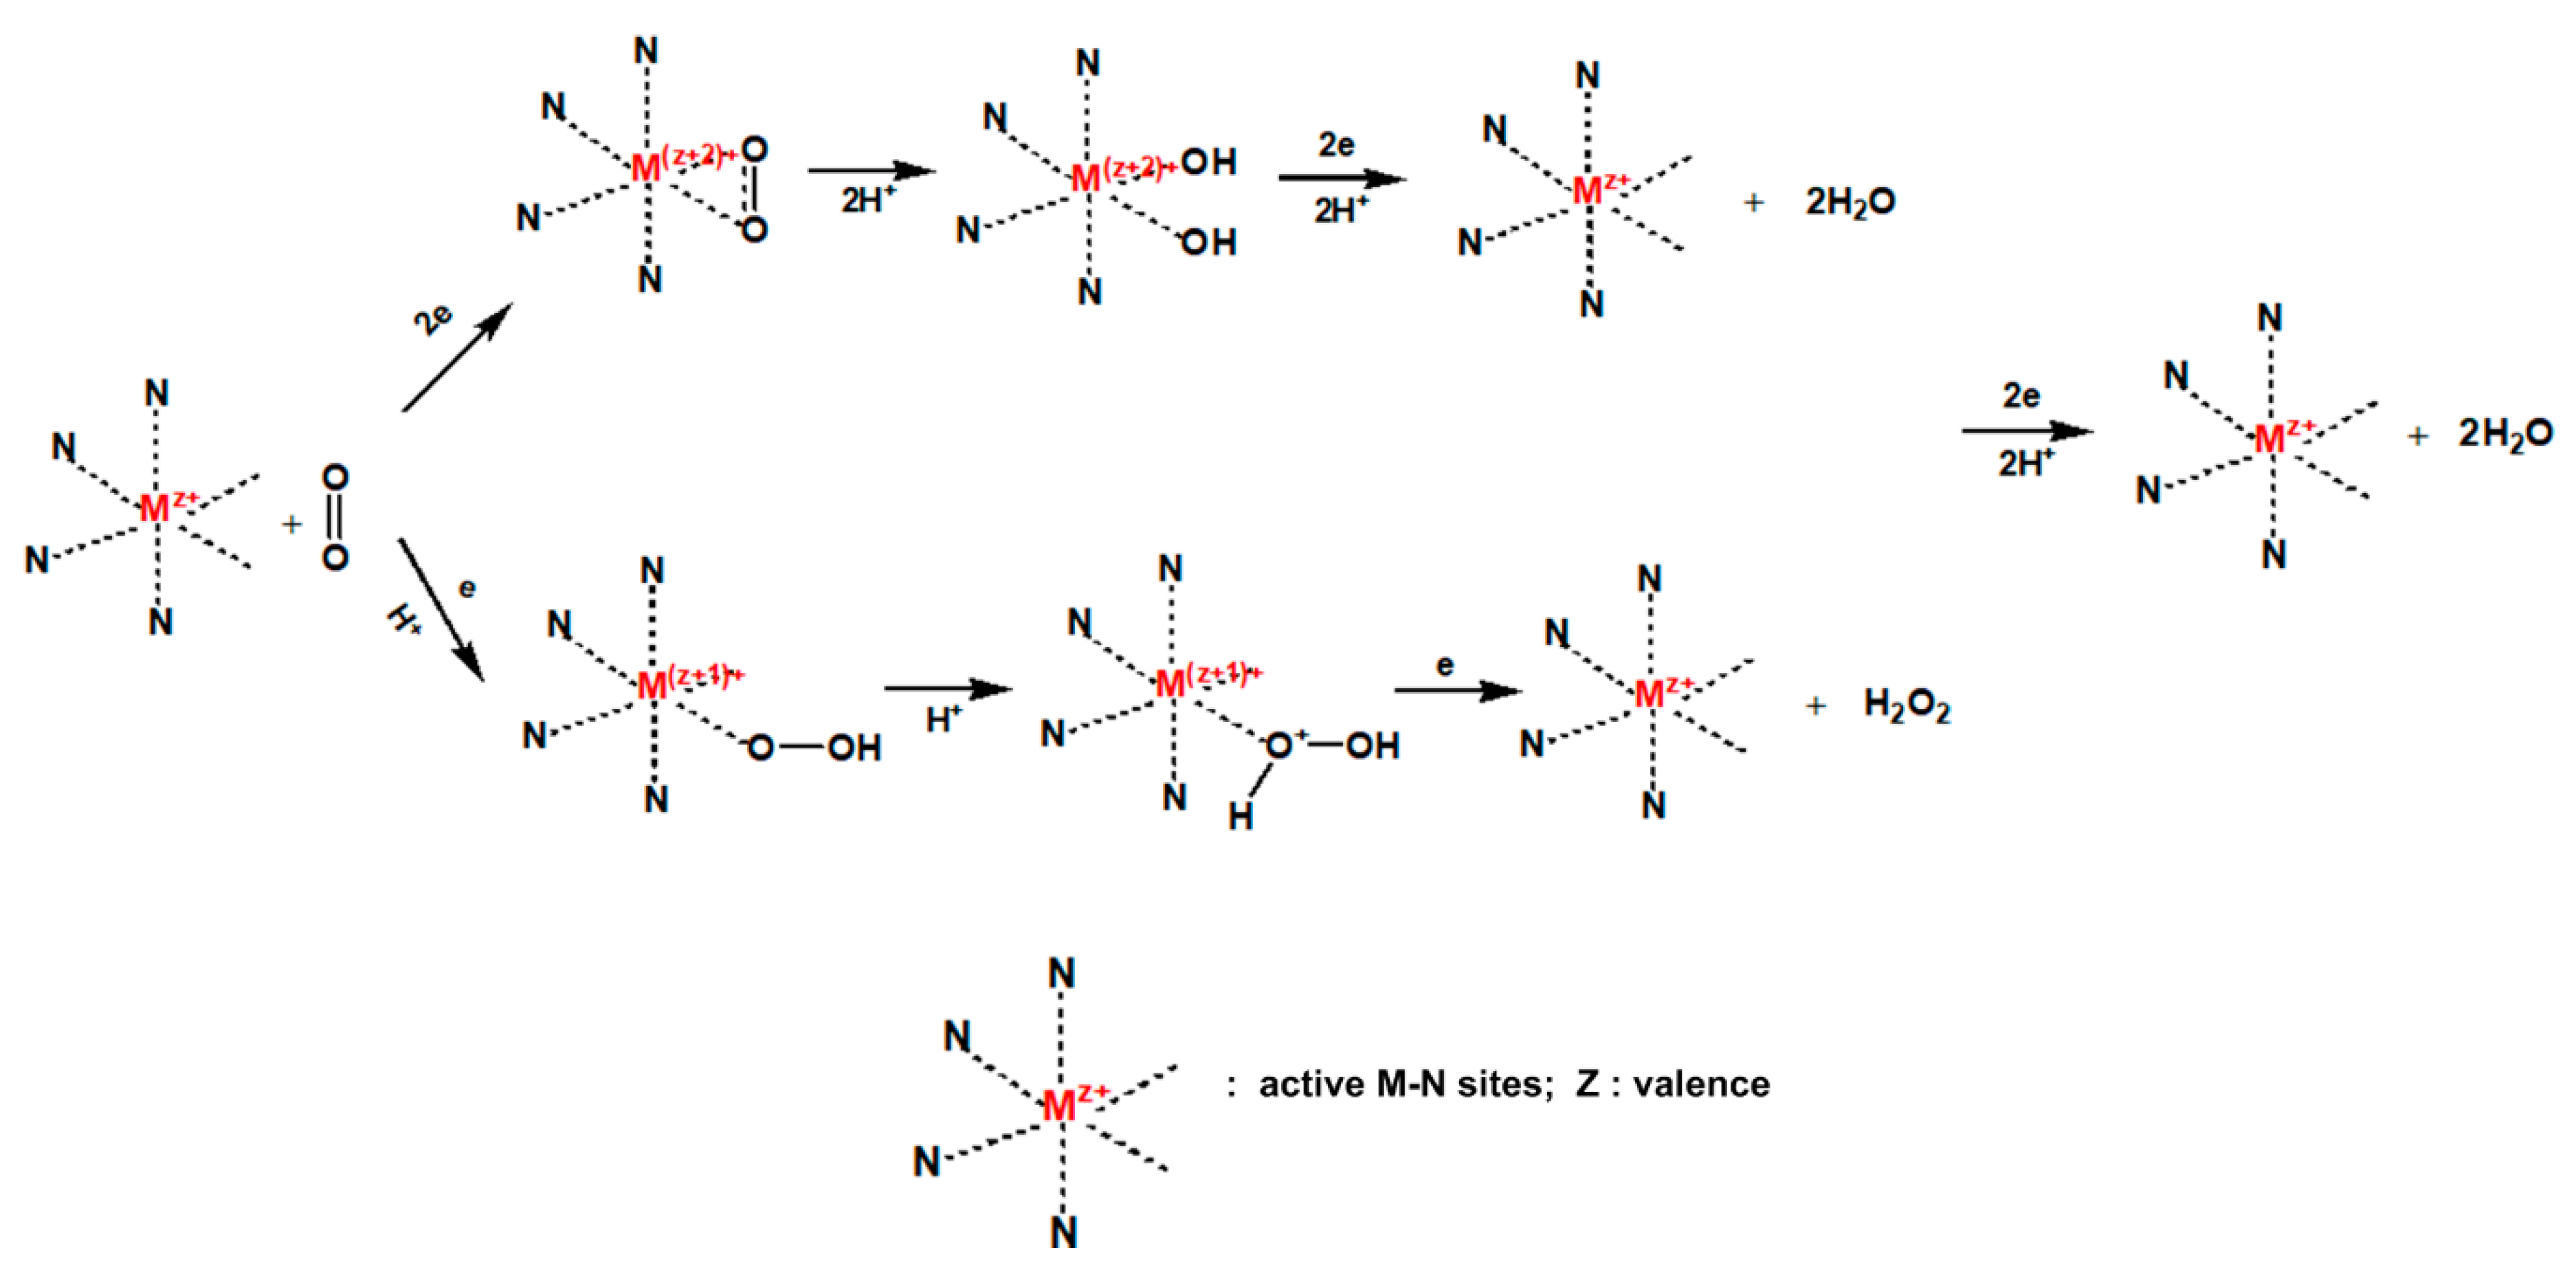
3.7. Oxygen Reduction Reaction (ORR) Performance
3.8. Single Cell Testing
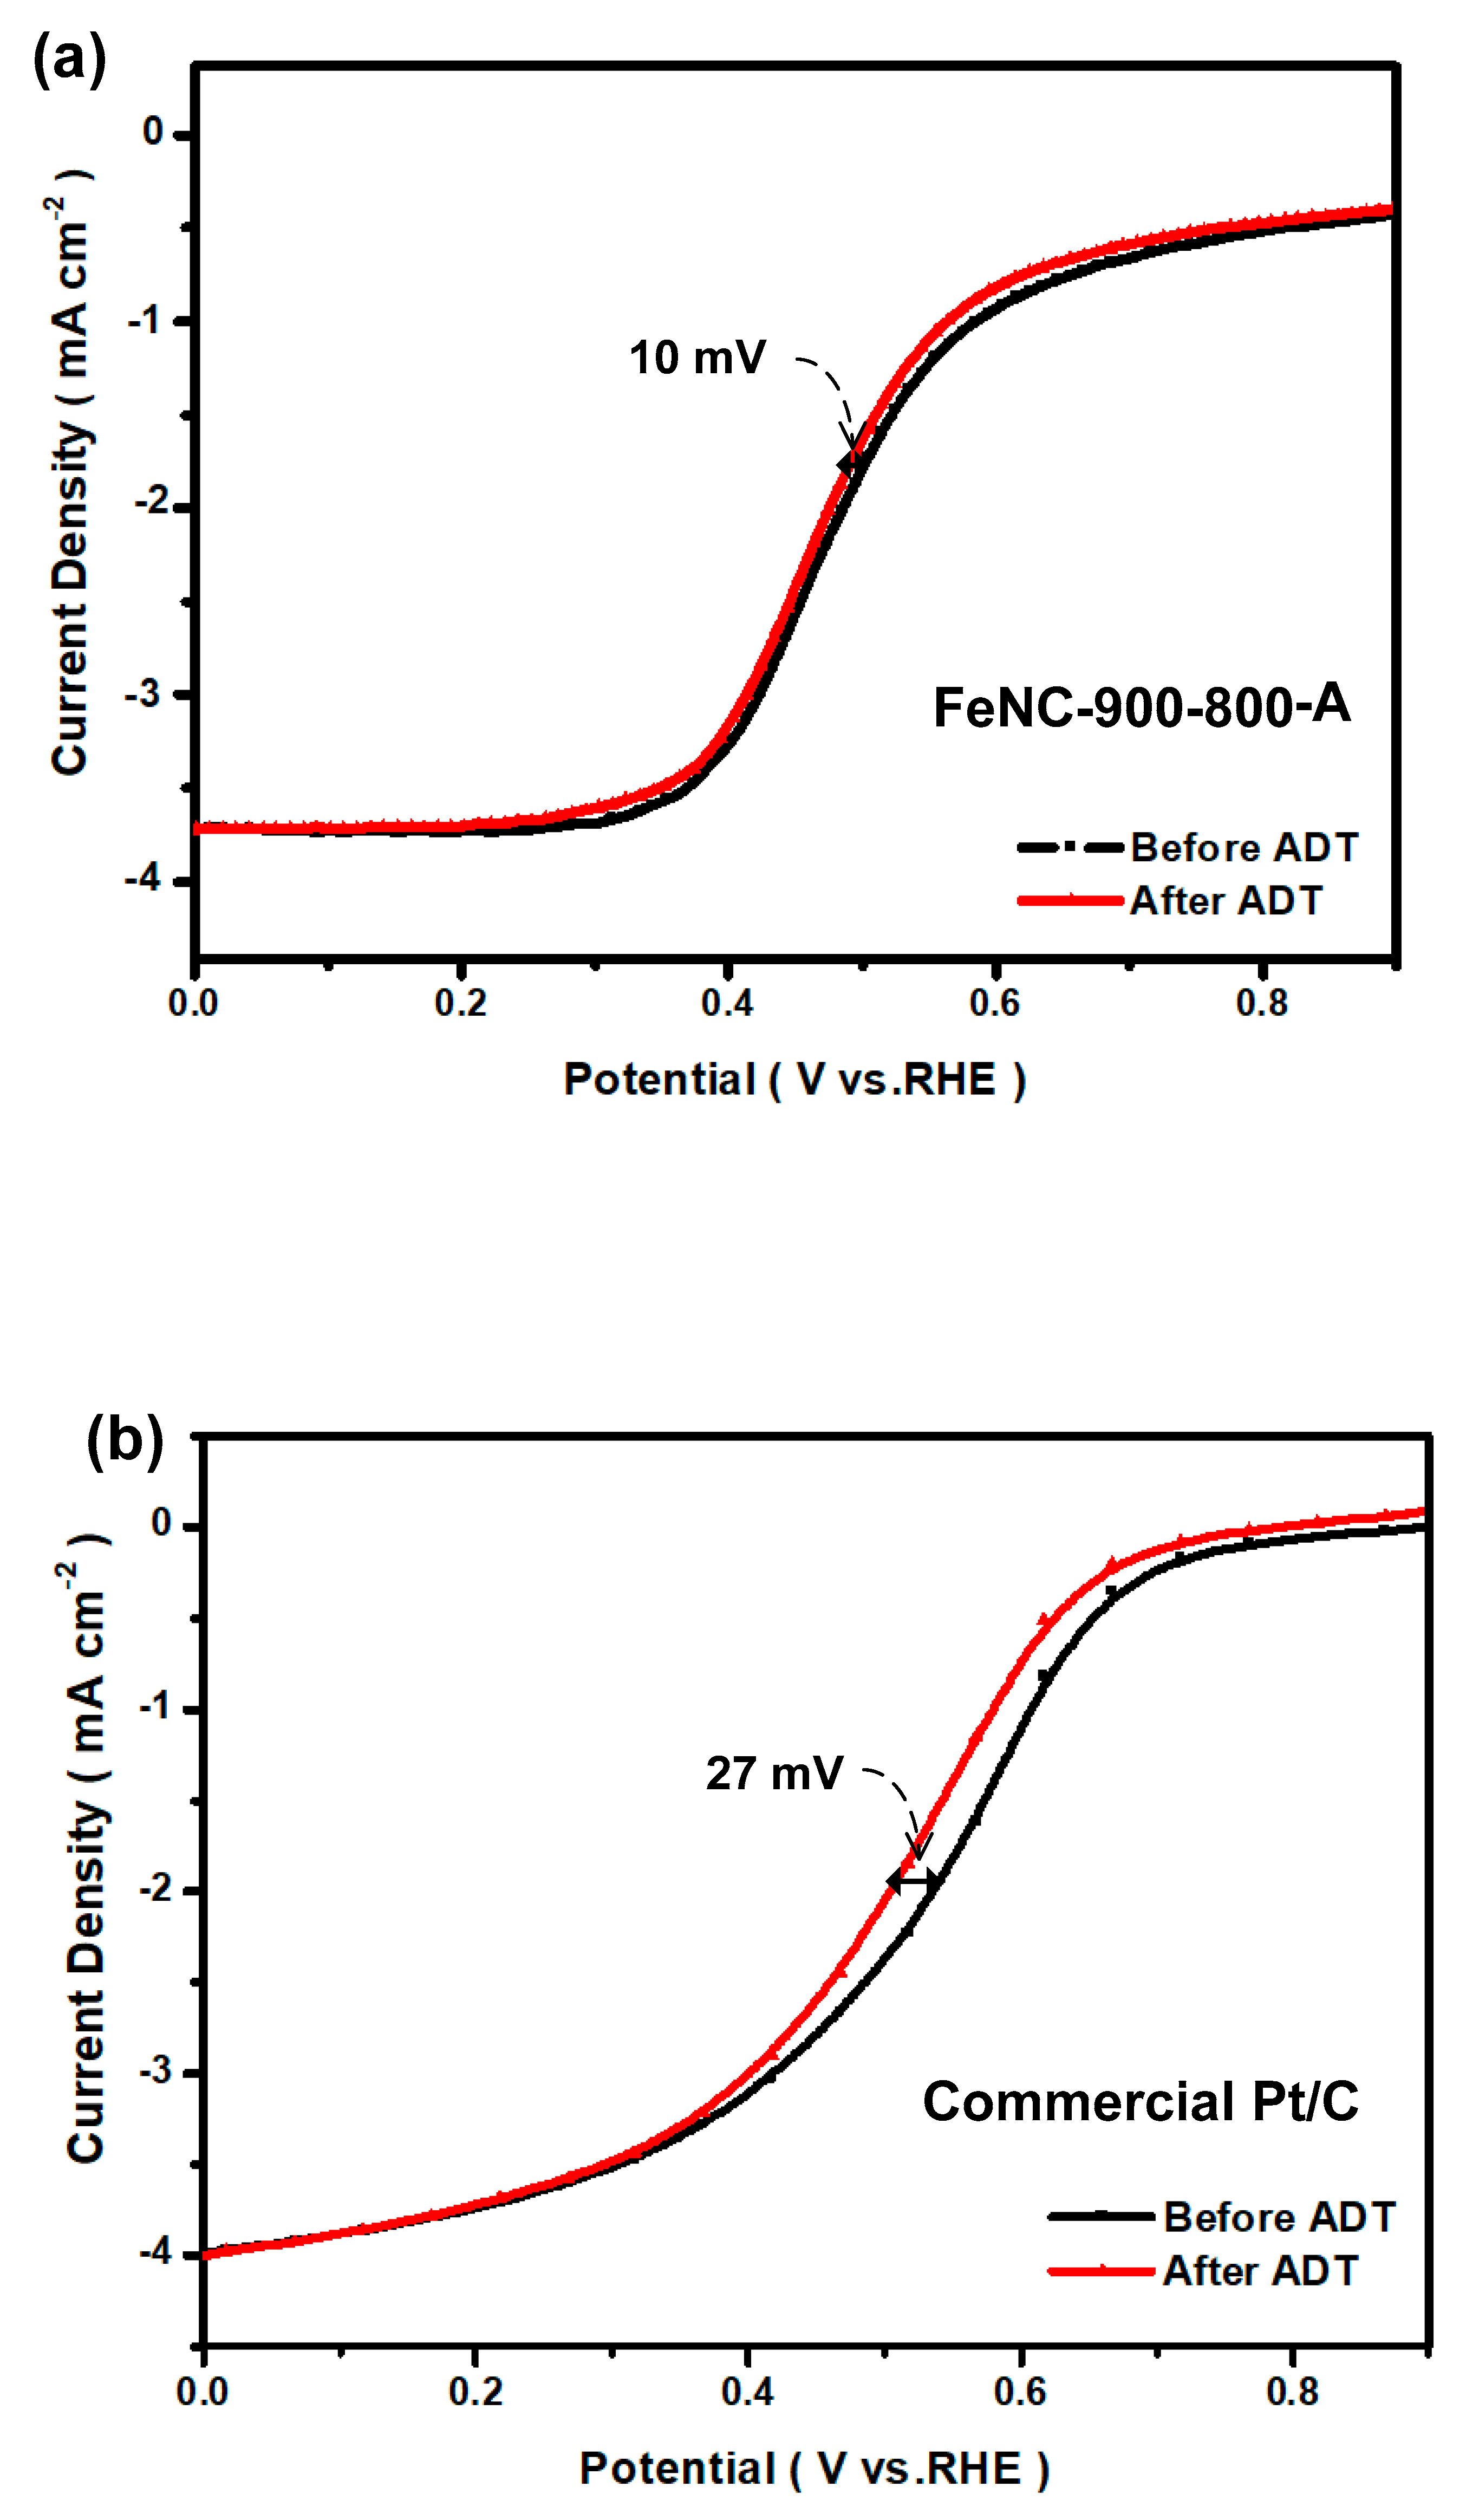
3.9. Stability Test
4. Conclusions
Author Contributions
Funding
Conflicts of Interest
References
- Shao, Y.; Zhang, S.; Engelhard, M.H.; Li, G.; Shao, G.; Wang, Y.; Liu, J.; Aksay, I.A.; Lin, Y. Nitrogen-doped graphene and its electrochemical applications. J. Mater. Chem. 2010, 20, 7491–7496. [Google Scholar] [CrossRef]
- Fu, X.; Zamani, P.; Choi, J.Y.; Hassan, F.M.; Jiang, G.; Higgins, D.C.; Zhang, Y.; Hoque, M.A.; Chen, Z. In Situ polymer graphenization ingrained with nanoporosity in a nitrogenous electrocatalyst boosting the performance of polymer-electrolyte-membrane fuel cells. Adv. Mater. 2017, 29, 1604456. [Google Scholar] [CrossRef] [PubMed]
- Liang, S.; Chen, R.; Yu, P.; Ni, M.; Zhang, Q.; Zhang, X.; Yang, W. Zn single atom catalyst for highly efficient oxygen reduction reaction. Chem. Commun. 2017, 53, 11453–11456. [Google Scholar] [CrossRef] [PubMed]
- Jasinski, R. A new fuel cell cathode catalyst. Nature 1964, 201, 1212. [Google Scholar] [CrossRef]
- Bagotzky, V.S.; Tarasevich, M.R.; Radyushkina, K.A.; Levina, O.A.; Andrusyova, S.I. Electrocatalysis of the oxygen reduction process on metal chelates in acid electrolyte. J. Power Sources 1978, 2, 233–240. [Google Scholar] [CrossRef]
- Gupta, S.; Tryk, D.; Bae, I.; Aldred, W.; Yeager, E. Heat-treated polyacrylonitrile-based catalysts for oxygen electroreduction. J. Appl. Electrochem. 1989, 19, 19–27. [Google Scholar] [CrossRef]
- Chung, H.T.; Johnston, C.M.; Zelena, P. Synthesis and evaluation of heat-treated, cyanamide-derived non-precious catalysts for oxygen reduction. ECS Trans. 2009, 25, 485–492. [Google Scholar]
- Parvez, K.; Yang, S.; Hernandez, Y.; Winter, A.; Turchanin, A.; Feng, X.; Müllen, K. Nitrogen-doped graphene and its iron-based composite as efficient electrocatalysts for oxygen reduction reaction. ACS Nano 2012, 6, 9541–9550. [Google Scholar] [CrossRef] [PubMed]
- Li, X.; Popov, B.N.; Kawahara, T.; Yanagi, H. The effect of the Pt deposition method and the support on Pt dispersion on carbon nanotubes. J. Power Sources 2011, 196, 1717–1722. [Google Scholar] [CrossRef]
- Lee, J.S.; Park, G.S.; Kim, S.T.; Liu, M.; Cho, J. A highly efficient electrocatalyst for the oxygen reduction reaction: N-doped ketjenblack incorporated into Fe/Fe3C-functionalized melamine foam. Angew. Chem. Int. Ed. 2013, 52, 1026–1030. [Google Scholar] [CrossRef]
- Wu, G.; Chen, Z.; Artyushkova, K.; Garzon, F.H.; Zelenay, P. Polyaniline-derived non-precious catalyst for the polymer electrolyte fuel cell cathode. ECS Trans. 2008, 6, 159–170. [Google Scholar]
- Ratso, S.; Sahraie, N.R.; Sougrati, M.T.; Käärik, M.; Kook, M.; Saar, R.; Paiste, P.; Jia, Q.; Leis, J.; Mukerjee, S.; et al. Synthesis of highly-active Fe–N–C catalysts for PEMFC with carbide-derived carbons. J. Mater. Chem. A 2018, 6, 14663–14674. [Google Scholar] [CrossRef]
- Mamtani, K.; Singh, D.; Tian, J.; Millet, J.M.; Miller, J.T.; Co, A.C.; Ozkan, U.S. Evolution of N-coordinated iron–carbon (FeNC) catalysts and their oxygen reduction (ORR) performance in acidic media at various stages of catalyst. Catal. Lett. 2016, 146, 1749–1770. [Google Scholar] [CrossRef]
- Jiang, W.J.; Gu, L.; Li, L.; Zhang, Y.; Zhang, X.; Zhang, L.J.; Wang, J.Q.; Hu, J.S.; Wei, Z.D.; Wan, L.J. Understanding the high activity of Fe–N–C electrocatalysts in oxygen reduction: Fe/Fe3C nanoparticles boost the activity of Fe–Nx. J. Am. Chem. Soc. 2016, 138, 3570–3578. [Google Scholar] [CrossRef] [PubMed]
- Luo, E.; Xiao, M.L.; Wang, Y.M.; Ge, J.J.; Liu, C.P.; Xing, W. Sulfur to boost the catalytic performance of FeNC catalyst towards the oxygen reduction reaction. ChemCatChem 2018, 10, 3653–3658. [Google Scholar] [CrossRef]
- Li, X.G.; Popov, B.N.; Kawahara, T.K.; Yanagi, H.Y. Developing noble metal-free catalysts with low cost, high performance and stability for oxygen reduction reaction (ORR). J. Power Sources 2011, 196, 1717–1722. [Google Scholar] [CrossRef]
- Liu, S.H.; Wu, J.R.; Pan, C.J.; Hwang, B.J. Synthesis and characterization of carbon incorporated Fe–N/carbons for methanol-tolerant oxygen reduction reaction of polymer electrolyte fuel cells. J. Power Sources 2014, 250, 279–285. [Google Scholar] [CrossRef]
- Choi, J.Y.; Hsu, R.S.; Chen, Z.W. Highly active porous carbon-supported nonprecious metal−n electrocatalyst for oxygen reduction reaction in pem fuel cells. J. Phys. Chem. C 2010, 114, 8048–8053. [Google Scholar] [CrossRef]
- Mollamahale, Y.B.; Huang, S.L.; Zhu, P.C.; Zhang, X.R.; Du, Y.H.; Wang, S.B.; Qing, M.; Tian, Z.Q.; Shen, P.K. Microbial catalysis of the oxygen reduction reaction for microbial fuel cells: A review. J. Catal. 2018, 368, 279–290. [Google Scholar]
- Kwak, D.H.; Han, S.B.; Lee, Y.W.; Park, H.S.; Choi, I.A.; Kim, M.C.; Kim, S.J.; Kim, D.H.; Sohn, J.I.; Park, K.W. Fe/N/S-doped mesoporous carbon nanostructures as electrocatalysts for oxygen reduction reaction in acid medium. Appl. Catal. B Environ. 2017, 203, 889–898. [Google Scholar] [CrossRef]
- Huynh, M.; Ozel, T.; Liu, C.; Lau, E.C.; Nocera, D.G. Design of template-stabilized active and earth-abundant oxygen evolution catalysts in acid. Chem. Sci. 2017, 8, 4779–4794. [Google Scholar] [Green Version]
- Bharti, A.; Cheruvally, G. Influence of various carbon nano-forms as supports for Pt catalyst on proton exchange membrane fuel cell performance. J. Power Sources 2017, 360, 196–205. [Google Scholar] [CrossRef]
- Sa, Y.J.; Seo, D.J.; Woo, J.; Lim, J.T.; Cheon, J.Y.; Yang, S.Y.; Lee, J.M.; Kang, D.; Shin, T.J.; Shin, H.S.; et al. on an easy way to prepare metal–nitrogen doped carbon with exclusive presence of MeN4-type sites active for the ORR. J. Am. Chem. Soc. 2016, 138, 15046–15056. [Google Scholar] [CrossRef] [PubMed]
- Xiao, M.; Zhu, J.; Ma, L.; Jin, Z.; Ge, J.; Deng, X.; Hou, Y.; He, Q.; Li, J.; Jia, Q.; et al. Microporous framework induced synthesis of single-atom dispersed Fe–N-C acidic orr catalyst and its in situ reduced Fe–N4 active site identification revealed By X-ray absorption spectroscopy. ACS Catal. 2018, 8, 2824–2832. [Google Scholar] [CrossRef]
- Chen, Y.J.; Ji, S.F.; Wang, Y.G.; Chen, W.X.; Li, Z.; Shen, R.G.; Zheng, L.R.; Zhuang, Z.B.; Wang, D.S.; Li, Y.D. Atomically dispersed iron–Nitrogen species as electrocatalysts for bifunctional oxygen evolution and reduction reactions. Angew. Chem. 2017, 129, 7041–7045. [Google Scholar] [CrossRef]
- Zhang, H.; Hwang, S.; Wang, M.; Feng, Z.; Karakalos, S.; Luo, L.; Qiao, Z.; Xie, X.; Wang, C.; Su, D.; et al. single atomic iron catalysts for oxygen reduction in acidic media: Particle size control and thermal activation. J. Am. Chem. Soc. 2017, 139, 14143–14149. [Google Scholar] [CrossRef] [PubMed]
- Qiheng, L.; Wenxing, C.; Hai, X.; Yue, G.; Zhi, L.; Lirong, Z.; Xusheng, Z.; Wensheng, Y.; Weng-Chon, C.; Rongan, S.; et al. Fe Isolated Single Atoms on S, N codoped carbon by copolymer pyrolysis strategy for highly efficient oxygen reduction reaction. Adv. Mater. 2018, 30, 1800588. [Google Scholar]
- Wang, J.; Huang, Z.; Liu, W.; Chang, C.; Tang, H.; Li, Z.; Chen, W.; Jia, C.; Yao, T.; Wei, S.; et al. Design of N-coordinated dual-metal sites: A Stable and active pt-free catalyst for acidic oxygen reduction Reaction. J. Am. Chem. Soc. 2017, 139, 17281–17284. [Google Scholar] [CrossRef]
- Kim, S.; Kim, H. Oxygen reduction reaction at porphyrin-based electrochemical catalysts: Mechanistic effects of pH and spin states studied by density functional theory. Catal. Today 2017, 295, 119–124. [Google Scholar] [CrossRef]
- Chen, Y.; Ji, S.; Zhao, S.; Chen, W.; Dong, J.; Cheong, W.C.; Shen, R.; Wen, X.; Zheng, L.; Rykov, A.I.; et al. Enhanced oxygen reduction with single-atomic-site iron catalysts for a zinc-air battery and hydrogenair fuel cell. Nat. Commun. 2018, 9, 5422. [Google Scholar] [CrossRef]
- Yeager, E. Dioxygen electrocatalysis: Mechanisms in relation to catalyst structure. J. Mol. Catal. 1986, 38, 5–25. [Google Scholar] [CrossRef]
- Kinoshita, K. Electrochemical Oxygen Technology; Interscience: New York, NY, USA, 1922. [Google Scholar]
- Maldonado, S.; Stevenson, K.J. Influence of nitrogen doping on oxygen reduction electrocatalysis at carbon nanofiber electrodes. J. Phys. Chem. B 2005, 109, 4707–4716. [Google Scholar] [CrossRef]
- Lai, L.; Potts, J.R.; Zhan, D.; Wang, L.; Poh, C.K.; Tang, C.; Gong, H.; Shen, Z.; Lin, J.; Ruoff, R.S. Exploration of the active center structure of nitrogen-doped graphene-based catalysts for oxygen reduction reaction. Energy Environ. Sci. 2012, 5, 7936–7942. [Google Scholar] [CrossRef]
- Lin, Z.; Song, M.K.; Ding, Y.; Liu, Y.; Liu, M.; Wong, C.P. Three-dimensional nitrogen-doped carbon nanotubes/graphene structure used as a metal-free electrocatalyst for the oxygen reduction reaction. Phys. Chem. Chem. Phys. 2012, 14, 3381–3387. [Google Scholar] [CrossRef]
- Zhao, Y.; Watanabe, K.; Hashimoto, K. self-supporting oxygen reduction electrocatalysts made from a nitrogen-rich network polymer. J. Am. Chem. Soc. 2012, 134, 9528–19531. [Google Scholar] [CrossRef]
- Kramm, U.I.; Dodelet, J.P. Structure of the catalytic sites in Fe/N/C-catalysts for O2-reduction in PEM fuel cells. Phys. Chem. Chem. Phys. 2012, 14, 11673–11688. [Google Scholar] [CrossRef]
- Kattel, S.; Wang, G. reaction pathway for oxygen reduction on FeN4 embedded graphene. J. Phys. Chem. Lett. 2014, 5, 452–456. [Google Scholar] [CrossRef] [PubMed]
- Liang, J.; Zheng, Y.; Chen, J.; Liu, J.; Hulicova-Jurcakova, D.; Jaroniec, M.; Qiao, S.Z. Facile oxygen reduction on a three-dimensionally ordered macroporous graphitic C3N4/Carbon composite electrocatalys. Angew. Chem. Int. Ed. 2012, 51, 3892–3896. [Google Scholar] [CrossRef]


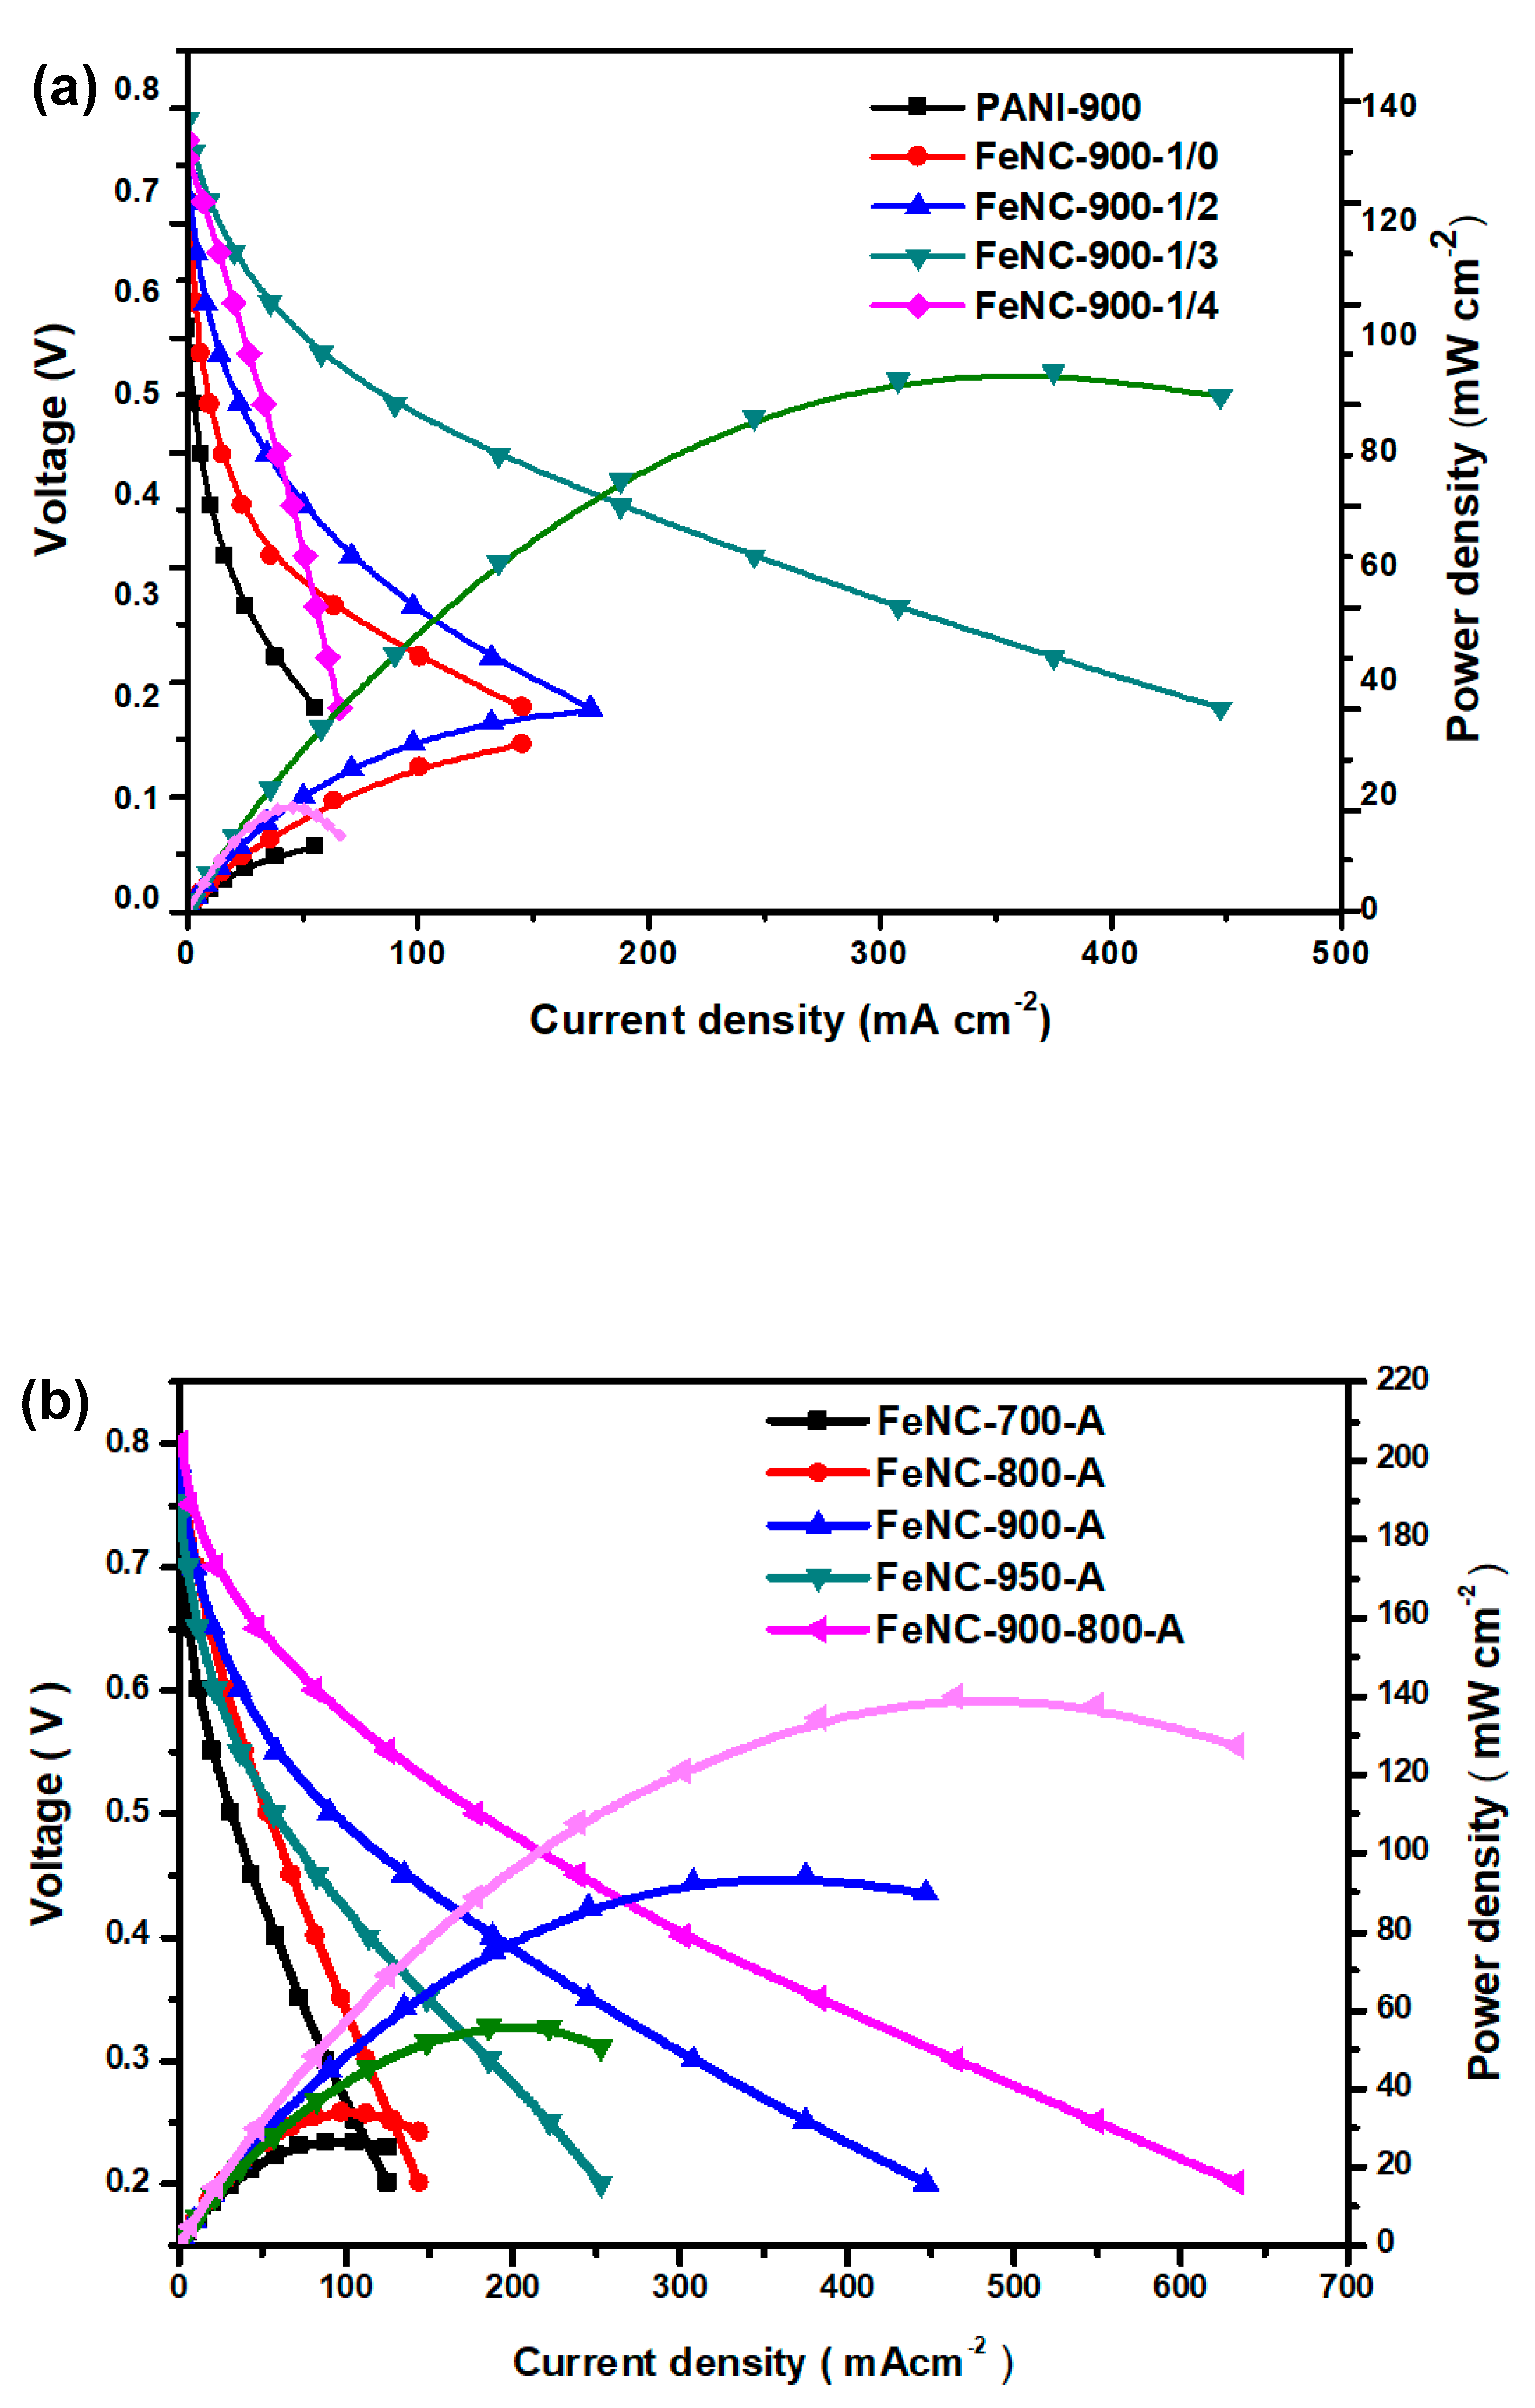
| Element | 700 °C | 800 °C | 900 °C | 950 °C | 900-800 °C |
|---|---|---|---|---|---|
| C | 81.35 | 84.00 | 84.54 | 88.07 | 87.00 |
| N | 12.35 | 9.01 | 9.11 | 6.91 | 7.38 |
| S | 4.02 | 3.83 | 3.65 | 2.30 | 1.78 |
| Fe | 2.27 | 3.06 | 2.91 | 2.72 | 3.84 |
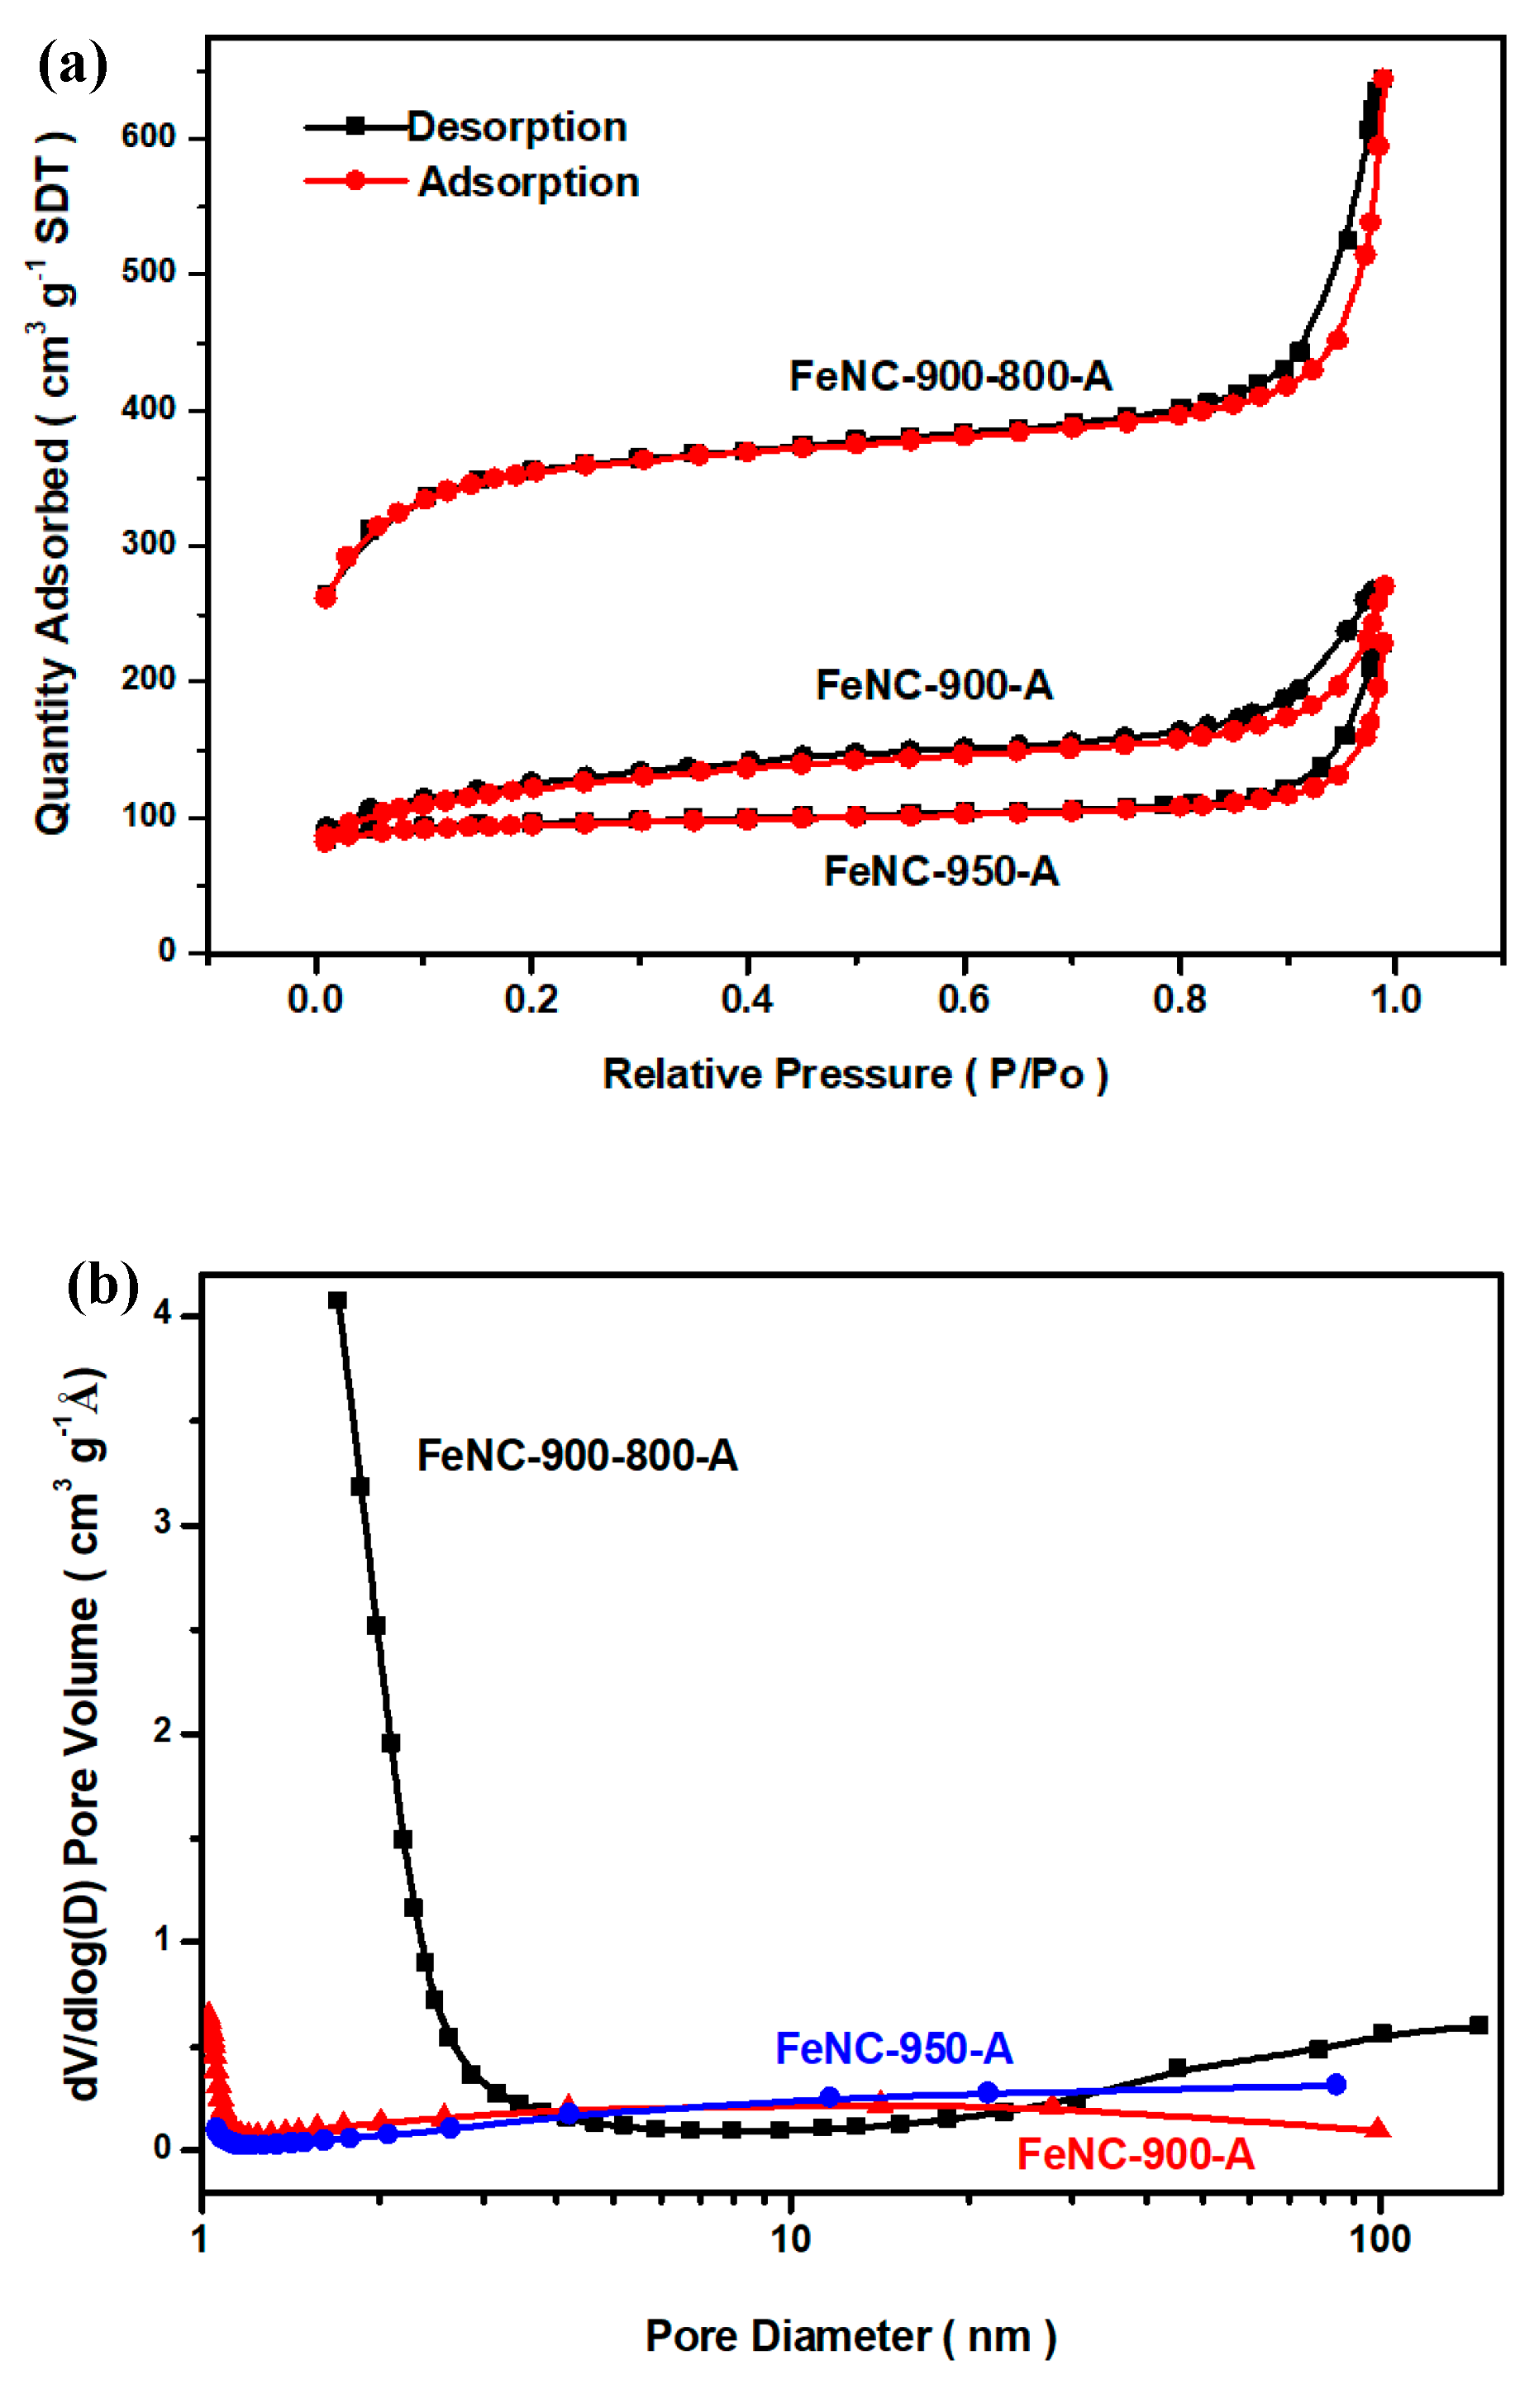
| Sample | BET surface area(m2/g) | Averaged pore diameter(nm) |
|---|---|---|
| FeNC-900 | 395 | 4.23 |
| FeNC-900-800 | 1098 | 3.63 |
© 2019 by the authors. Licensee MDPI, Basel, Switzerland. This article is an open access article distributed under the terms and conditions of the Creative Commons Attribution (CC BY) license (http://creativecommons.org/licenses/by/4.0/).
Share and Cite
Wang, Y.-Z.; Huang, W.-Y.; Hsieh, T.-H.; Jheng, L.-C.; Ho, K.-S.; Huang, S.-W.; Chao, L. FeNxC Based Catalysts Prepared by the Calcination of Iron-Ethylenediamine@Polyaniline as the Cathode-Catalyst of Proton Exchange Membrane Fuel Cell. Polymers 2019, 11, 1368. https://doi.org/10.3390/polym11081368
Wang Y-Z, Huang W-Y, Hsieh T-H, Jheng L-C, Ho K-S, Huang S-W, Chao L. FeNxC Based Catalysts Prepared by the Calcination of Iron-Ethylenediamine@Polyaniline as the Cathode-Catalyst of Proton Exchange Membrane Fuel Cell. Polymers. 2019; 11(8):1368. https://doi.org/10.3390/polym11081368
Chicago/Turabian StyleWang, Yen-Zen, Wen-Yao Huang, Tar-Hwa Hsieh, Li-Cheng Jheng, Ko-Shan Ho, Sin-Wei Huang, and Liang Chao. 2019. "FeNxC Based Catalysts Prepared by the Calcination of Iron-Ethylenediamine@Polyaniline as the Cathode-Catalyst of Proton Exchange Membrane Fuel Cell" Polymers 11, no. 8: 1368. https://doi.org/10.3390/polym11081368