Article

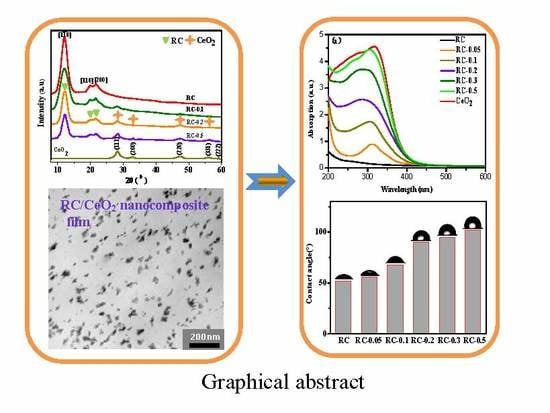
Use of CeO2 Nanoparticles to Enhance UV-Shielding of Transparent Regenerated Cellulose Films

Key Laboratory of Synthetic and Biological Colloids, Ministry of Education, School of Chemical and Material Engineering, Jiangnan University, Wuxi 214122, China
*
Author to whom correspondence should be addressed.
Polymers 2019, 11(3), 458; https://doi.org/10.3390/polym11030458
Submission received: 31 December 2018 / Revised: 25 February 2019 / Accepted: 28 February 2019 / Published: 11 March 2019

Abstract

:
The major challenge in preparing polymer nanocomposites is to prevent the agglomeration of inorganic nanoparticles (NPs). Here, with regenerated cellulose (RC) films as supporting medium, UV-shielding and transparent nanocomposite films with hydrophobicity were fabricated by in situ synthesis of CeO2 NPs. Facilitated through the interaction between organic and inorganic components revealed by X-ray diffraction (XRD) and Fourier transformation infrared spectroscopy (FTIR) characterization, it was found that CeO2 NPs were uniformly dispersed in and immobilized by a cellulose matrix. However some agglomeration of CeO2 NPs occurred at higher precursor concentrations. These results suggest that the morphology and particle size of CeO2 and the corresponding performance of the resulting films are affected by the porous RC films and the concentrations of Ce(NO3)3·6H2O solutions. The optimized nanocomposite film containing 2.95 wt% CeO2 NPs had more than 75% light transmittance (550 nm), high UV shielding properties, and a certain hydrophobicity.

Graphical Abstract

1. Introduction

Nanocomposites of polymers and inorganic nanoparticles (INPs) have attracted increasing interest due to their value-added applications derived from their unique optoelectrical, magnetic, electrical, thermal, and antibacterial properties [1,2,3,4]. However it is difficult to maintain a good dispersion and nanoscale stability of the INPs in the polymer matrix, due to the aggregation of the INPs [4]. Among the various polymeric materials, biopolymers are considered as environmentally friendly and sustainable materials with versatile functionalities which could meet the requirements for numerous applications [5]. Recently cellulose materials were reported as an ideal platform for the design and preparation of advanced inorganic-polymer hybrid materials, either as template, support or precursor [6,7], because this most important natural polymer, with a special hierarchical order of supramolecular structure, possesses distinguishing properties such as hydrophilicity, strong mechanical properties, high flexibility, as well as significant adsorption and swelling behavior, resulting in the possibility for potential application in various advanced materials [8].
In general, three ways are applicable to prepare inorganic-cellulose nanocomposites. (i) By mixing of the suspensions of nanocelluloses (CNs) and INPs, nanocomposites based on CNs can be prepared. CNs usually need to be surface modified to promote the dispersion of INPs in the cellulose matrix [9]. (ii) By incorporating INPs into the dissolved cellulose matrix and then regenerating, nanocomposites based on regenerated cellulose (RC) are available [10]. Based on porous cellulose fibers, new applicable and facile techniques can be designed for preparing functional materials, however, good dispersion and chemical stability of the INPs in the corresponding cellulose solvents are required. (iii) Most surprisingly, with an RC gel or wet film and cellulose fabrics as template or support, benefiting from the abundant surface hydroxyl groups and the high microscopic porosity of the cellulose fibers, the uniform dispersion of INPs such as plate-like Fe2O3, silver, and Co3O4 NPs, in the cellulose matrix could be achieved expediently by in-situ synthesis [11,12,13]. However, the synthesis conditions of INPs are limited, and the porous structure of the cellulose substrate greatly affects the size and morphology of the nanoparticles.
As a colorless polysaccharide, cellulose-based materials facilitate the fabrication of transparent products. Cellulosic materials with photo-functionality such as UV absorption, optoelectrical, light-diffusing, photoluminescent, and visible light-induced photocatalytic properties have been prepared by introducing different functional INPs such as metallic NPs and quantum dots [9,14,15,16,17]. Among various photofunctional INPs, cerium dioxide (CeO2) is considered to be a better ultraviolet radiation absorbent. Due to a relatively small band gap (3.1 eV), compared to TiO2 (3.27 eV) and ZnO (3.37 eV), this facilitates the transition of CeO2 valence electrons and makes it widely applicable in the field of UV shielding [18,19]. The main challenge in the incorporation of CeO2 NPs into polymer matrix is that CeO2 NPs are prone to aggregate. Some attempts have been made to prepare CeO2 NPs and polymer composites, mainly focusing on modifying the surface of CeO2 NPs to improve its dispersion stability in the matrix. However, the process for these methods is complex or complicated conditions are required [20]. Moreover, to the best of our knowledge, only a few researches on the application of CeO2 NPs in cellulose-based materials have been reported. By dip-pad-cure or dip-coating processes, cotton fabrics with superhydrophobicity and UV-radiation protection, and silk with UV-shielding ability and antibacterial activity were fabricated respectively [18,21]. Surprisingly, the surface of CeO2 NPs was not modified, but its average particle size dispersed in the matrix was nanometer size. However, the optical properties and corresponding mechanisms of CeO2–cellulose hybrids have not been investigated in detail as other CeO2 hybrids [22]. Moreover, the durability of the performance of the samples prepared by the dip process may be a challenge, requiring a high affinity between CeO2 and the fabrics. Recently, by dispersing oxidized cellulose in the hydrothermal system of the CeO2 synthesis, nanocomposites with good visible light-induced photocatalytic activity on reduction of aqueous Cr (VI) under acid conditions (pH 4–6) were fabricated [23]. Interestingly, CNs grew on the surface of CeO2, accelerating the electron transfer rate of CeO2. In these literature examples, cellulose materials were only used as carriers for CeO2 NPs or as promoters for promoting CeO2 functionality, the characteristics of cellulose-based materials such as transparency and porosity, were not mentioned or utilized.
Herein, with porous RC film as support, transparent nanocomposite films with hydrophobicity and UV-shielding were successfully fabricated by in-situ synthesis of CeO2 NPs according to a reported method [24]. Facilitated through interactions between CeO2 NPs and cellulose molecules, proved by Fourier transform infrared (FTIR) spectroscopy and X-ray diffraction (XRD) analyses, the uniform dispersion of rod-like CeO2 NPs in RC matrix was obtained. Furthermore, the particle size and morphology of in-situ synthesized CeO2 NPs were affected by the precursor concentrations and the porous structures of the RC film. Finally, the effects of the concentrations of aq. Ce(NO3)3·6H2O solution on the properties of nanocomposite films such as optical, thermal, and hydrophilic/hydrophobic properties were analyzed. The resulting films with transparency, UV-radiation protection, and hydrophobicity, can be used alone or in combination with other transparent plastic films by hot pressing or calendaring, showing the potential value of application in the field of UV protection.

2. Experimental

2.1. Materials

Cellulose (cotton linter pulp, α-cellulose >95%) was purchased from Hubei Chemical Fiber Group Ltd. (Xiangfan, China). Cerium nitrate hexahydrate (Ce(NO3)3·6H2O, 99.5%, mass fraction) was provided by the Aladdin reagent company Ltd. (Shanghai, China). Sulfuric acid, urea, and anhydrous sodium sulfate, and other reagents of analytical grade were purchased from Sinopharm Chemical Reagent Co. Ltd. (Shanghai, China) and used without further purification.

2.2. Preparation of RC/CeO2 Nanocomposite Films

Dissolution of cellulose was conducted according to a reported method [25]. An amount of 5 g of cotton linter pulp was added to a LiOH/urea/H2O (8/12/80 in wt%, 100 g) solution and cooled to −20 °C for 24 h. The pre-frozen cellulose solution was vigorously stirred at ambient temperature for 5 min and then subjected to centrifugation at 8000 rpm for 10 min at −4 °C to obtain a transparent cellulose dope. The transparent supernatant fraction was immediately cast on a glass plate, and the resulting gel sheets were immersed into a sulfate aqueous solution to form transparent RC wet films. The wet films were then immersed into aq. Ce(NO3)3·6H2O solution (40 mL) with different concentrations for 10 h at room temperature and atmospheric pressure. The as-obtained films were gently wiped to remove surplus Ce3+ ions on the film surfaces, followed by alkaline treatment with 14 mol/L aqueous NaOH solution (40 mL) for 24 h at room temperature, and then were rinsed several times with deionized water.. Finally, the resulting films were dried in air at ambient humidity and pressure at 24 °C, and then treated at 80 °C for 10 h [24]. The as-prepared nanocomposite films with CeO2 NPs generated from precursor solutions with concentrations of 0.05, 0.1, 0.2, 0.3 and 0.5 mol/L were denoted as samples RC-0.05, RC-0.1, RC-0.2, RC-0.3, and RC-0.5, respectively.
For comparison, a neat RC film coded as RC was also prepared according to the aforementioned process. Furthermore, pure CeO2 NPs were collected outside of the wet film in the aq. Ce(NO3)3·6H2O solution (0.2 mol/L) after in-situ generation of CeO2 NPs.

2.3. Characterization

The XRD patterns of CeO2 powders, RC and RC nanocomposite films were determined on a Bruker D8 Advance Diffractometer (Bruker-AXS, Karlsruhe, Germany) operated in the 2θ range of 8–60° with Cu Kα radiation (λ = 0.15406 nm) at 40 mV and 40 mA. During the recording of the diffractogram, a narrow slit of 0.1 mm was used with a scanning speed of 0.02/s. The crystallinity χc (%) of cellulose II was calculated according to the following Equation (1) [26]:
C r I = ( I h k l I a m ) I h k l × 100 % ,
where Ihkl is the intensity of diffraction maximum of the crystalline regions [200 (21.9°)] in cellulose II; Iam is the intensity value for the amorphous cellulose (around 17.3°).
Moreover, the crystallite diameter (Dc) of CeO2 samples in and outside the RC film were calculated by using the Scherer equation shown in Equation (2) [27]:
D ( hkl ) = k λ / β COS θ ,
where k is a constant (0.94), λ is the wavelength of Cu Kα radiation (λ = 0.15406 nm), β is the full-width half-maximum of respective diffraction peak, and 2θ is the peak angle in radians.
The samples of CeO2 particles, RC, and RC/CeO2 nanocomposite films were chemically characterized by attenuated total reflectance infrared (ATR-IR) spectroscopy (Nicolet 560, Nicolet Co., Ltd., Madison, WI, USA). The spectra were recorded from 4000 to 600 cm−1 with a resolution of 2 cm−1 and a minimum of 16 scans.
The CeO2 particles formed outside of the films and the sample of RC-0.2 as a representative of the RC/CeO2 nanocomposites were observed using a transmission electron microscope (JEM-2100, JEOL Ltd. Tokyo, Japan) at an accelerating voltage of 200 kV. The surface and cross-section morphologies of RC and RC/CeO2 nanocomposite films were measured using a scanning electron microscopy (S-4800, Hitachi Corporation, Tokyo, Japan), with an accelerating voltage of 20 kV, the samples were coated with a thin layer of gold/palladium using a sputter coater (K550X, Emitech Ltd., Kent, UK). The particle size was analyzed by using the software of Nano Measure (Nano Measurer System, version 1.2.5, Fudan University, Shanghai, China). The main constituent elements of sample RC-0.2 were determined by means of energy dispersive spectroscopy (EDS) (attached to the SEM, operating at 20 keV).
Thermal gravimetric analyses of the samples (ca.10 mg) of CeO2 particles, RC and RC/CeO2 nanocomposite films were carried out by a thermogravimetric analyzer (TGA/SDTA851e, Mettler Toledo instrument Co., Ltd, Zürich, Switzerland) in the temperature range of 30–600 °C under a stream of nitrogen of 50 mL min−1 at a heating rate of 10 °C min−1.
The ultraviolet absorption properties of CeO2 powders, RC, and RC/CeO2 nanocomposite films were measured with a UV–Vis near-infrared spectrophotometer (UV-3600 plus, Shimadzu, Kyoto, Japan). The RC nanocomposite films were flattened on the sample plate and the measurement wavelength was 200–800 nm with a barium sulfate coated template selected as a reference. The visible light transmittance of the nanocomposite membranes was measured by a UV–Vis photometer (TU-1901, General Analysis Instrument Co., Ltd., Beijing, China). The thickness of the film samples was about 40 μm.
The contact angle measurements were performed using an OCA 40 dynamic contact angle meter (Data Physics, Stuttgart, Germany). The water contact angle was determined after a water droplet was placed on the film for 60 s. Each static contact angle presented was the average value of those measured at five different locations of each film specimen.
The porosities of the RC and RC/CeO2 nanocomposite films were calculated using a reported method [28], the porosity (P) was calculated as follows:
P = ( M 1 M 2 ) / q 1 ( M 1 M 2 ) / q 1 + M 2 / q 2 × 100 % .
The wet films were weighed as M1 and then freeze dried overnight and weighed as M2. The water content was calculated as M1M2; q1 is the water density and q2 is the RC or RC/CeO2 composite density (The densities of the samples were calculated by measuring the weight and volume of the samples).

3. Results and Discussion

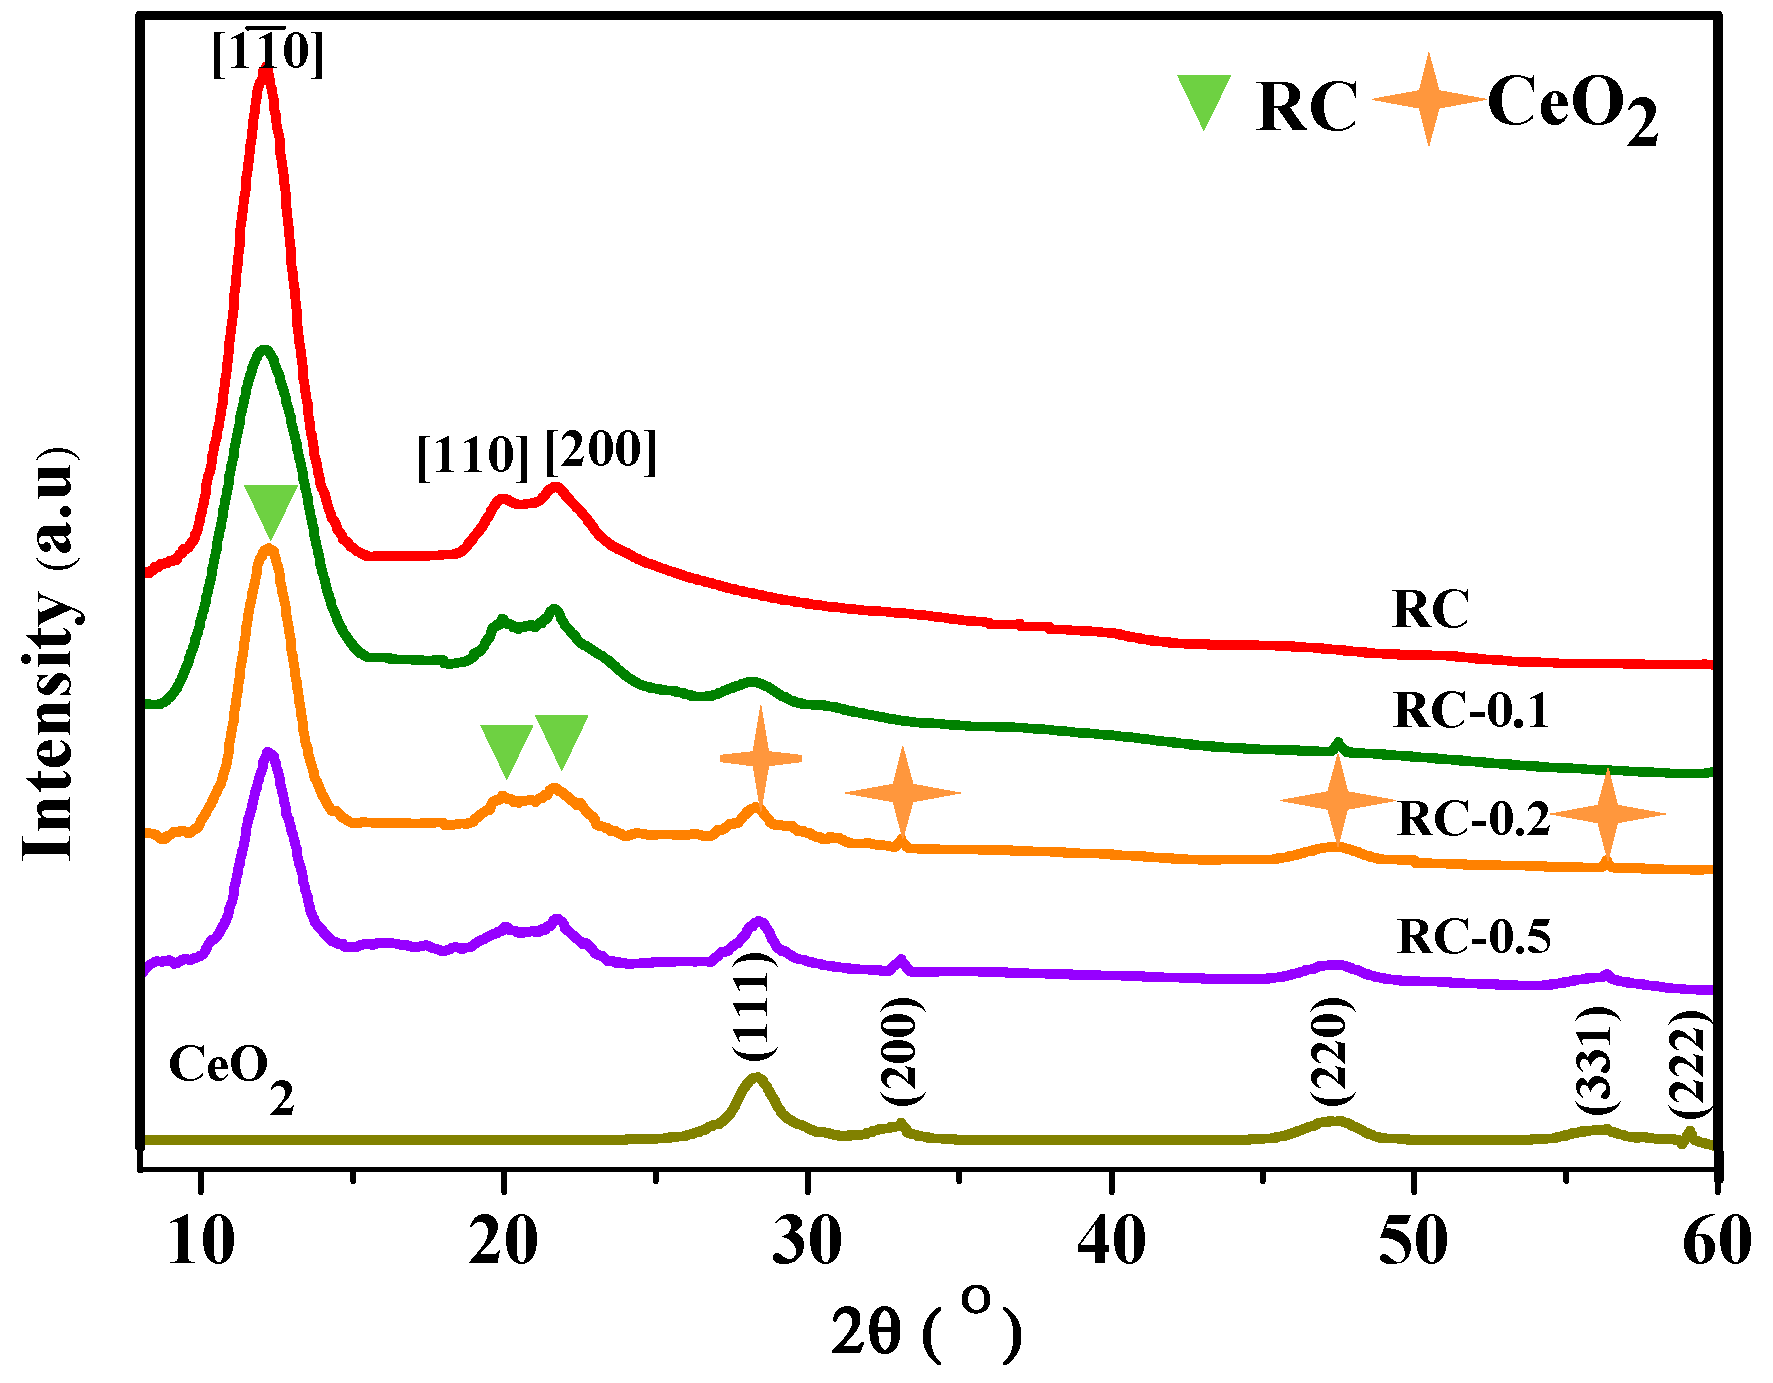
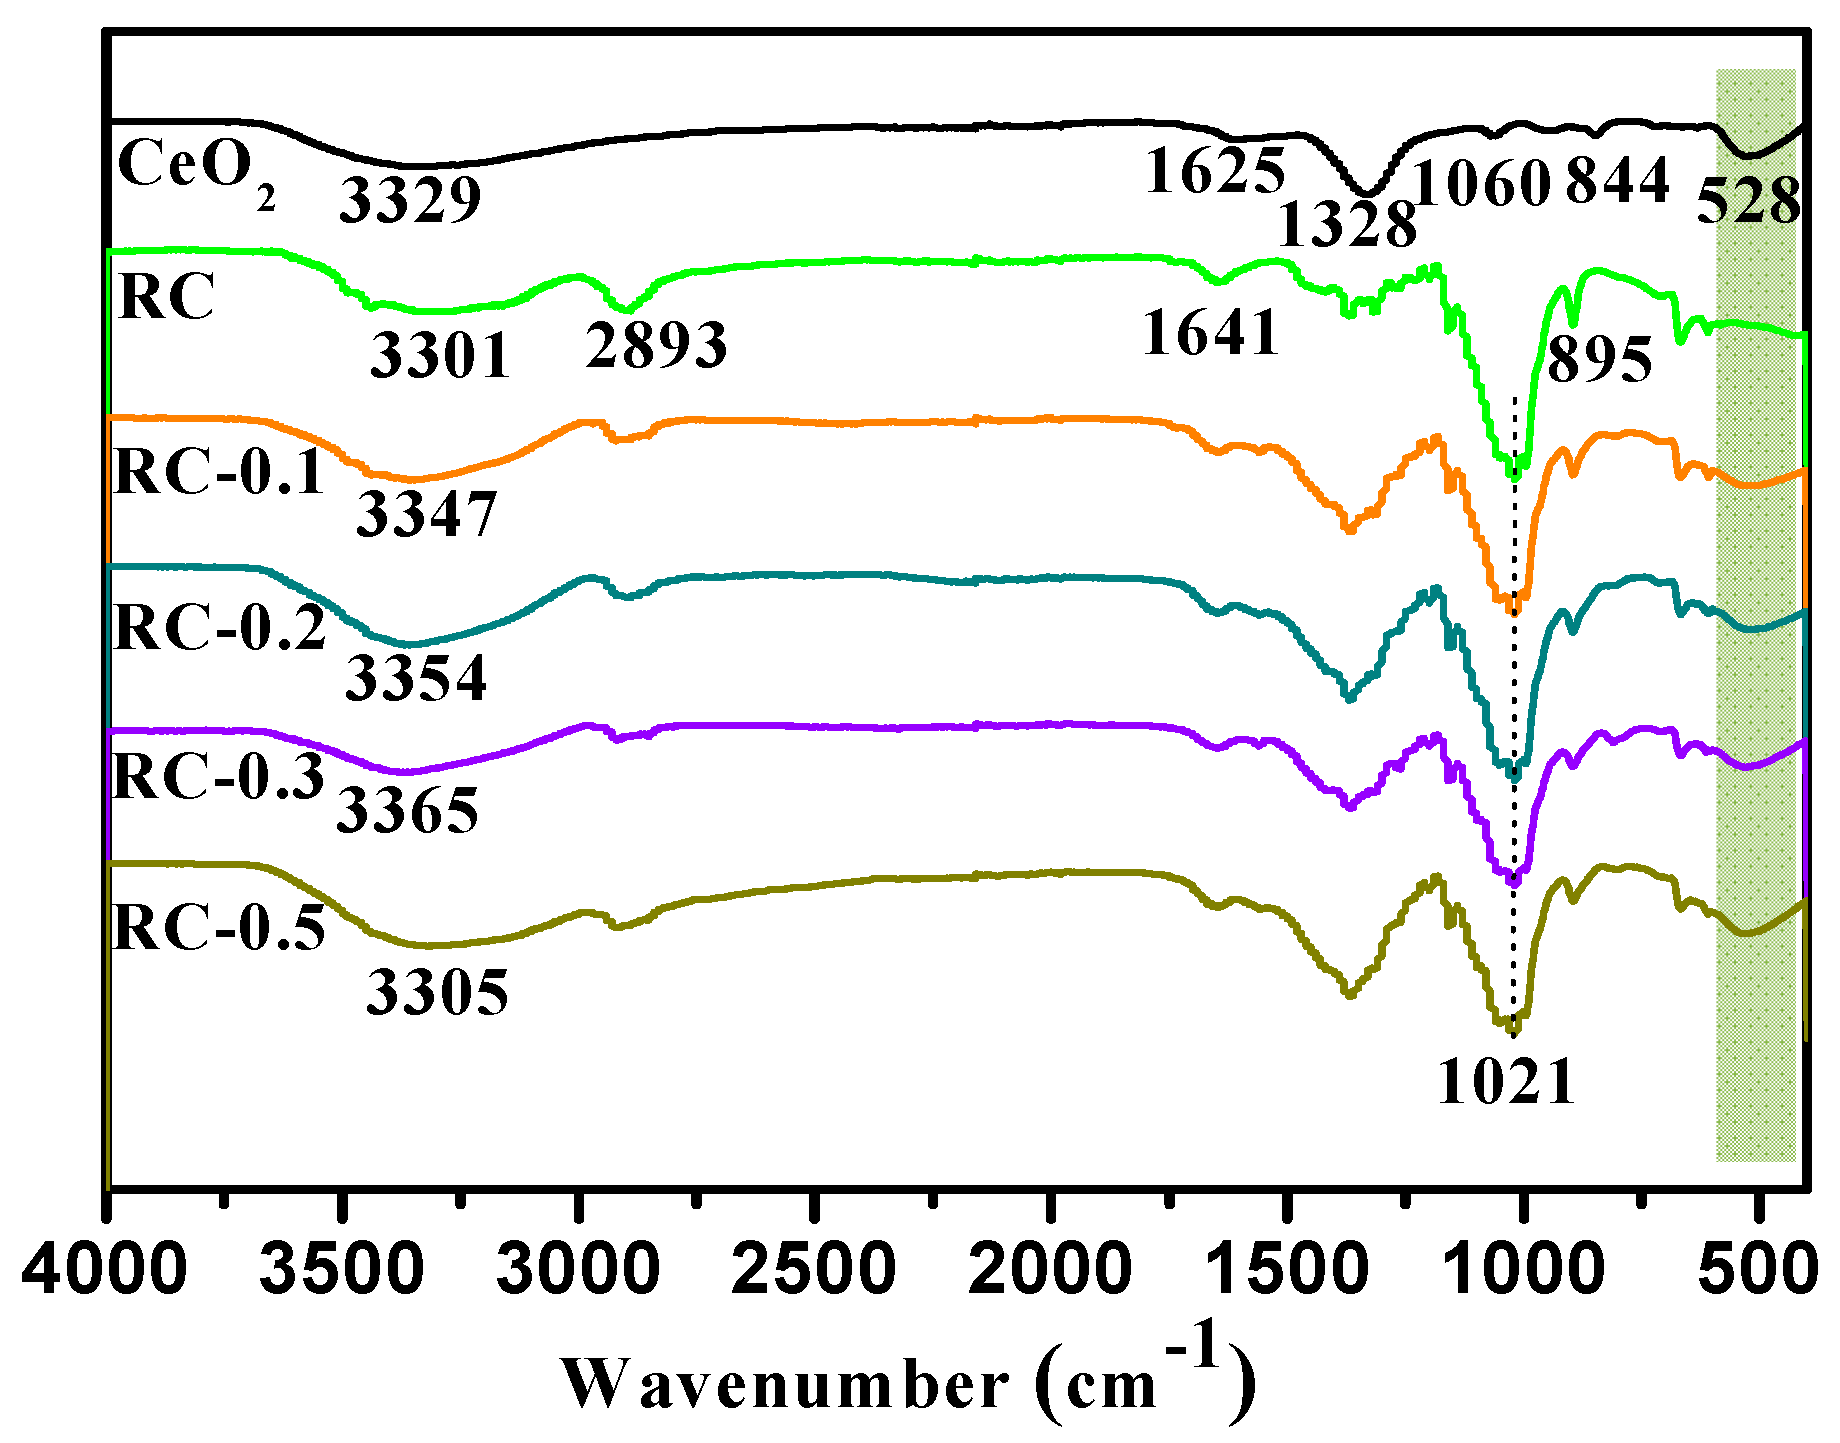
3.1. XRD and FTIR Results

The crystal structures of CeO2 NPs, RC, and cellulose/CeO2 nanocomposite films were characterized by X-ray diffraction. As shown in Figure 1, the XRD patterns of RC and RC/CeO2 nanocomposite films gave peaks at 12.2°, 20.1°, and 21.2°, corresponding to (1 1 ¯ 0), (110), and (200) diffractions of cellulose II, respectively [11]. Moreover, it was evident that the peak intensity of the cellulose II was reduced in the nanocomposite films with increasing concentrations of precursor solution, while the calculated results revealing the crystallinity of RC, RC-0.1, RC-0.2, and RC-0.5 samples were 49.9%, 45.9%, 43.8%, and 42.3%, respectively, showing a decrease in RC crystallinity with the generation of CeO2 NPs. Similar results were obtained by other researchers [12]. It can be inferred that the formation and incorporation of CeO2 NPs leads to the destruction of the crystallinity of the cellulose matrix to some extent.
In the pattern of CeO2 NPs (generated outside of the film in the aq. Ce(NO3)3·6H2O solution with 0.2 mol/L), five diffraction peaks were exhibited at 2θ = 28.54°, 33.08°, 47.48°, 56.33°, 59.08°, corresponding to the characteristic (111), (200), (220), (311), and (222) reflections of fluorite phase CeO2, respectively (JCPDS No. 34-0394) [29]. No obvious characteristic peaks of the other impurities such as Ce2O3 or Ce(OH)3 were detected. The nanocomposite films also displayed some characteristic peaks of CeO2, and the peak intensity of CeO2 intensified with increasing precursor concentrations, suggesting an increase in CeO2 content in the nanocomposite films. The average crystal sizes of CeO2 NPs for CeO2, RC-0.1, RC-0.2, and RC-0.5 sample were 19.2, 13.0, 12.4, and 19.8 nm respectively. Obviously, with porous RC film as supporting medium, at the same precursor concentration (CeO2 NPs vs. RC-0.2), the interactions between porous cellulose films and CeO2 NPs prevented the growth of larger crystals. Moreover, the calculated results revealed that with porous RC film as support, the precursor concentration had little influence on the crystalline size of in-situ synthesized CeO2 NPs except at high Ce3+ concentrations. At low Ce3+ ions concentrations, due to the electron-rich oxygen atoms of polar hydroxyl and ether groups of the cellulose macromolecule, predictable interaction between the porous RC film and electropositive Ce3+ ions would prevent the growth of larger crystals [30]. However, when the concentration of Ce3+ ions was so high that the porous cellulose had difficulty to exert effective electrostatic action on excessive metal ions, its control effect on the crystal size was weakened.
From Figure 2, it is clearly evident that as-received RC and RC/CeO2 film samples showed absorption peaks of cellulose II at around 3350, 2893, 1641, 1021, and 895 cm−1, attributed to the OH, CH2, crystallization water, C–O, and stretching vibration of C1 respectively, indicating the complete conversion of cellulose I to cellulose II after alkaline treatment [31]. As shown in Figure 2, in the spectrum of CeO2 NPs, the absorption bands at 3329, 1625, 1328, 1060, and 844 cm−1, were attributed to the stretching mode of water and hydroxyl groups and the vibrations associated with the incoordination of the adsorbed NO3−1 ions respectively [32,33]. In addition, the peak at 528 cm−1, corresponding to Ce–O stretching [20], could be observed in the spectra of the CeO2, and nanocomposite films, indicating the successful in-situ synthesis of CeO2. Furthermore the stretching vibration bands of the hydroxyl groups of cellulose at 3300–3650 cm−1 was shifted to a higher wavenumber with increasing Ce3+ concentration form 0 to 0.3 mol/L, suggesting a reduction in hydrogen bonding between cellulose molecules and an increased interaction between the hydroxyl group of cellulose and CeO2 NPs [30]. However, as the Ce3+ concentration reached 0.5 mol/L, the OH peak shifted to a lower wavenumber, indicating a reduction of the interaction between CeO2 NPs and RC, due to aggregation of CeO2 NPs, as shown in SEM (Figure 4).

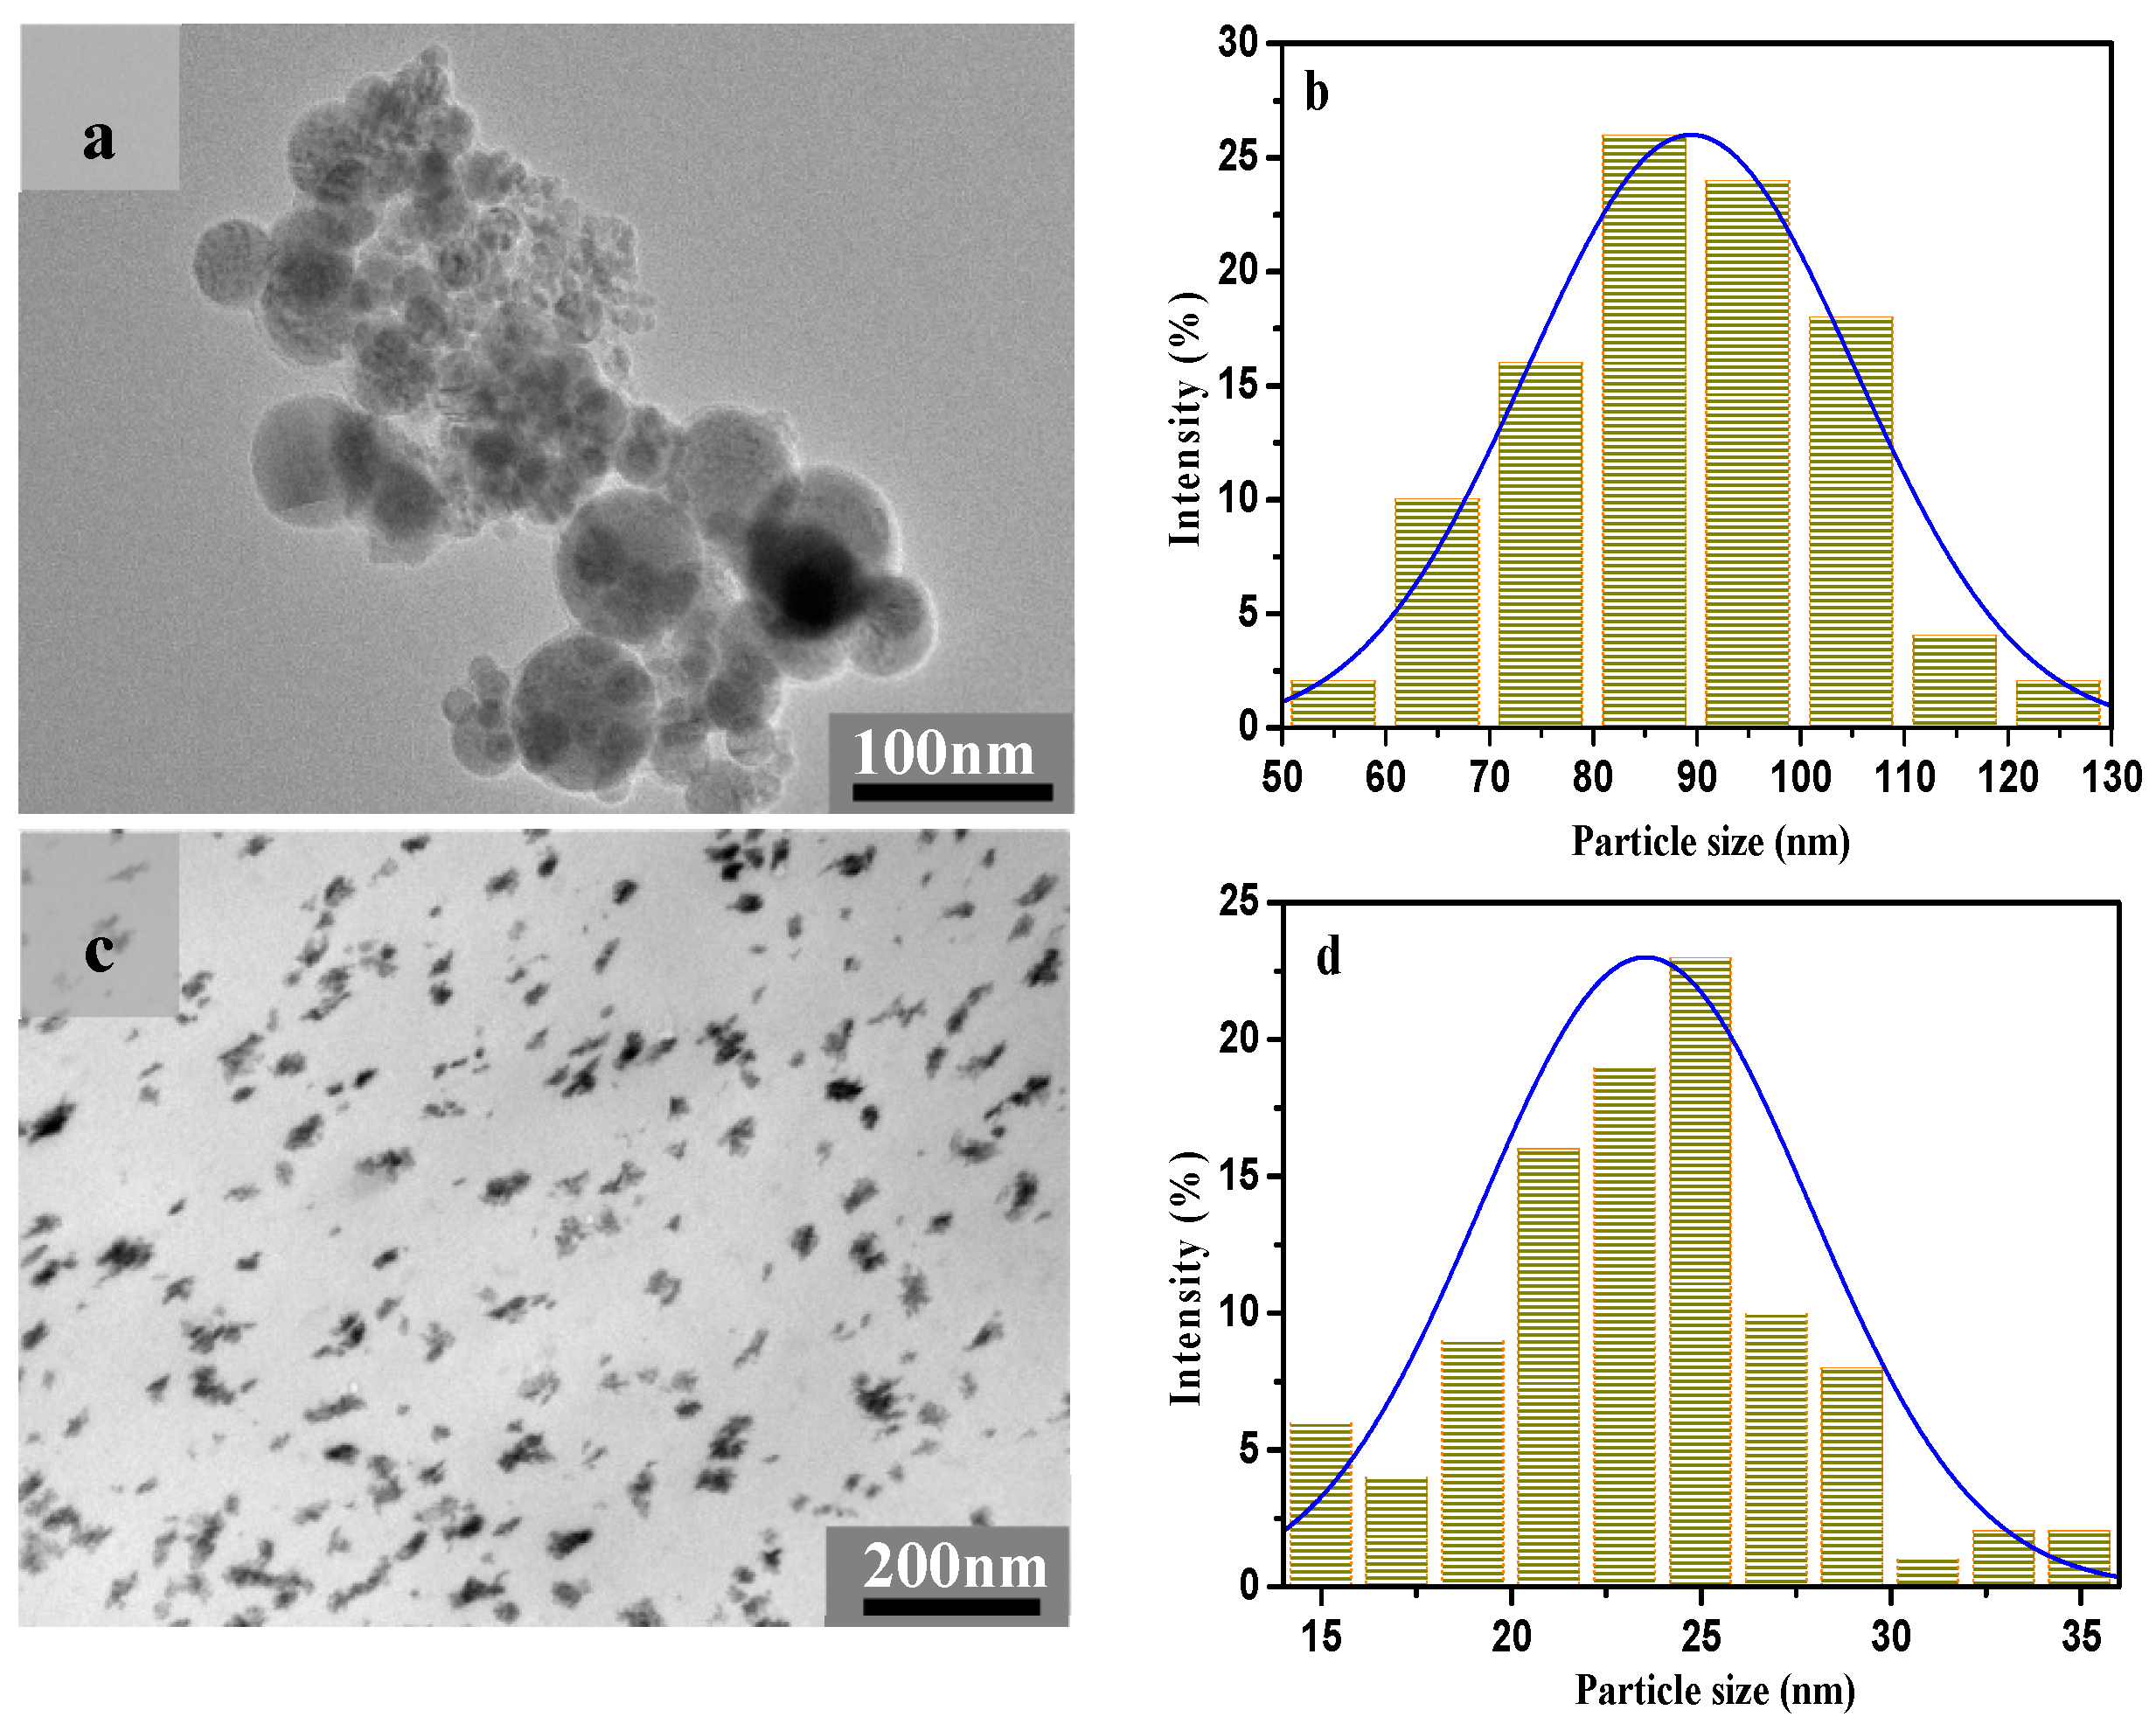
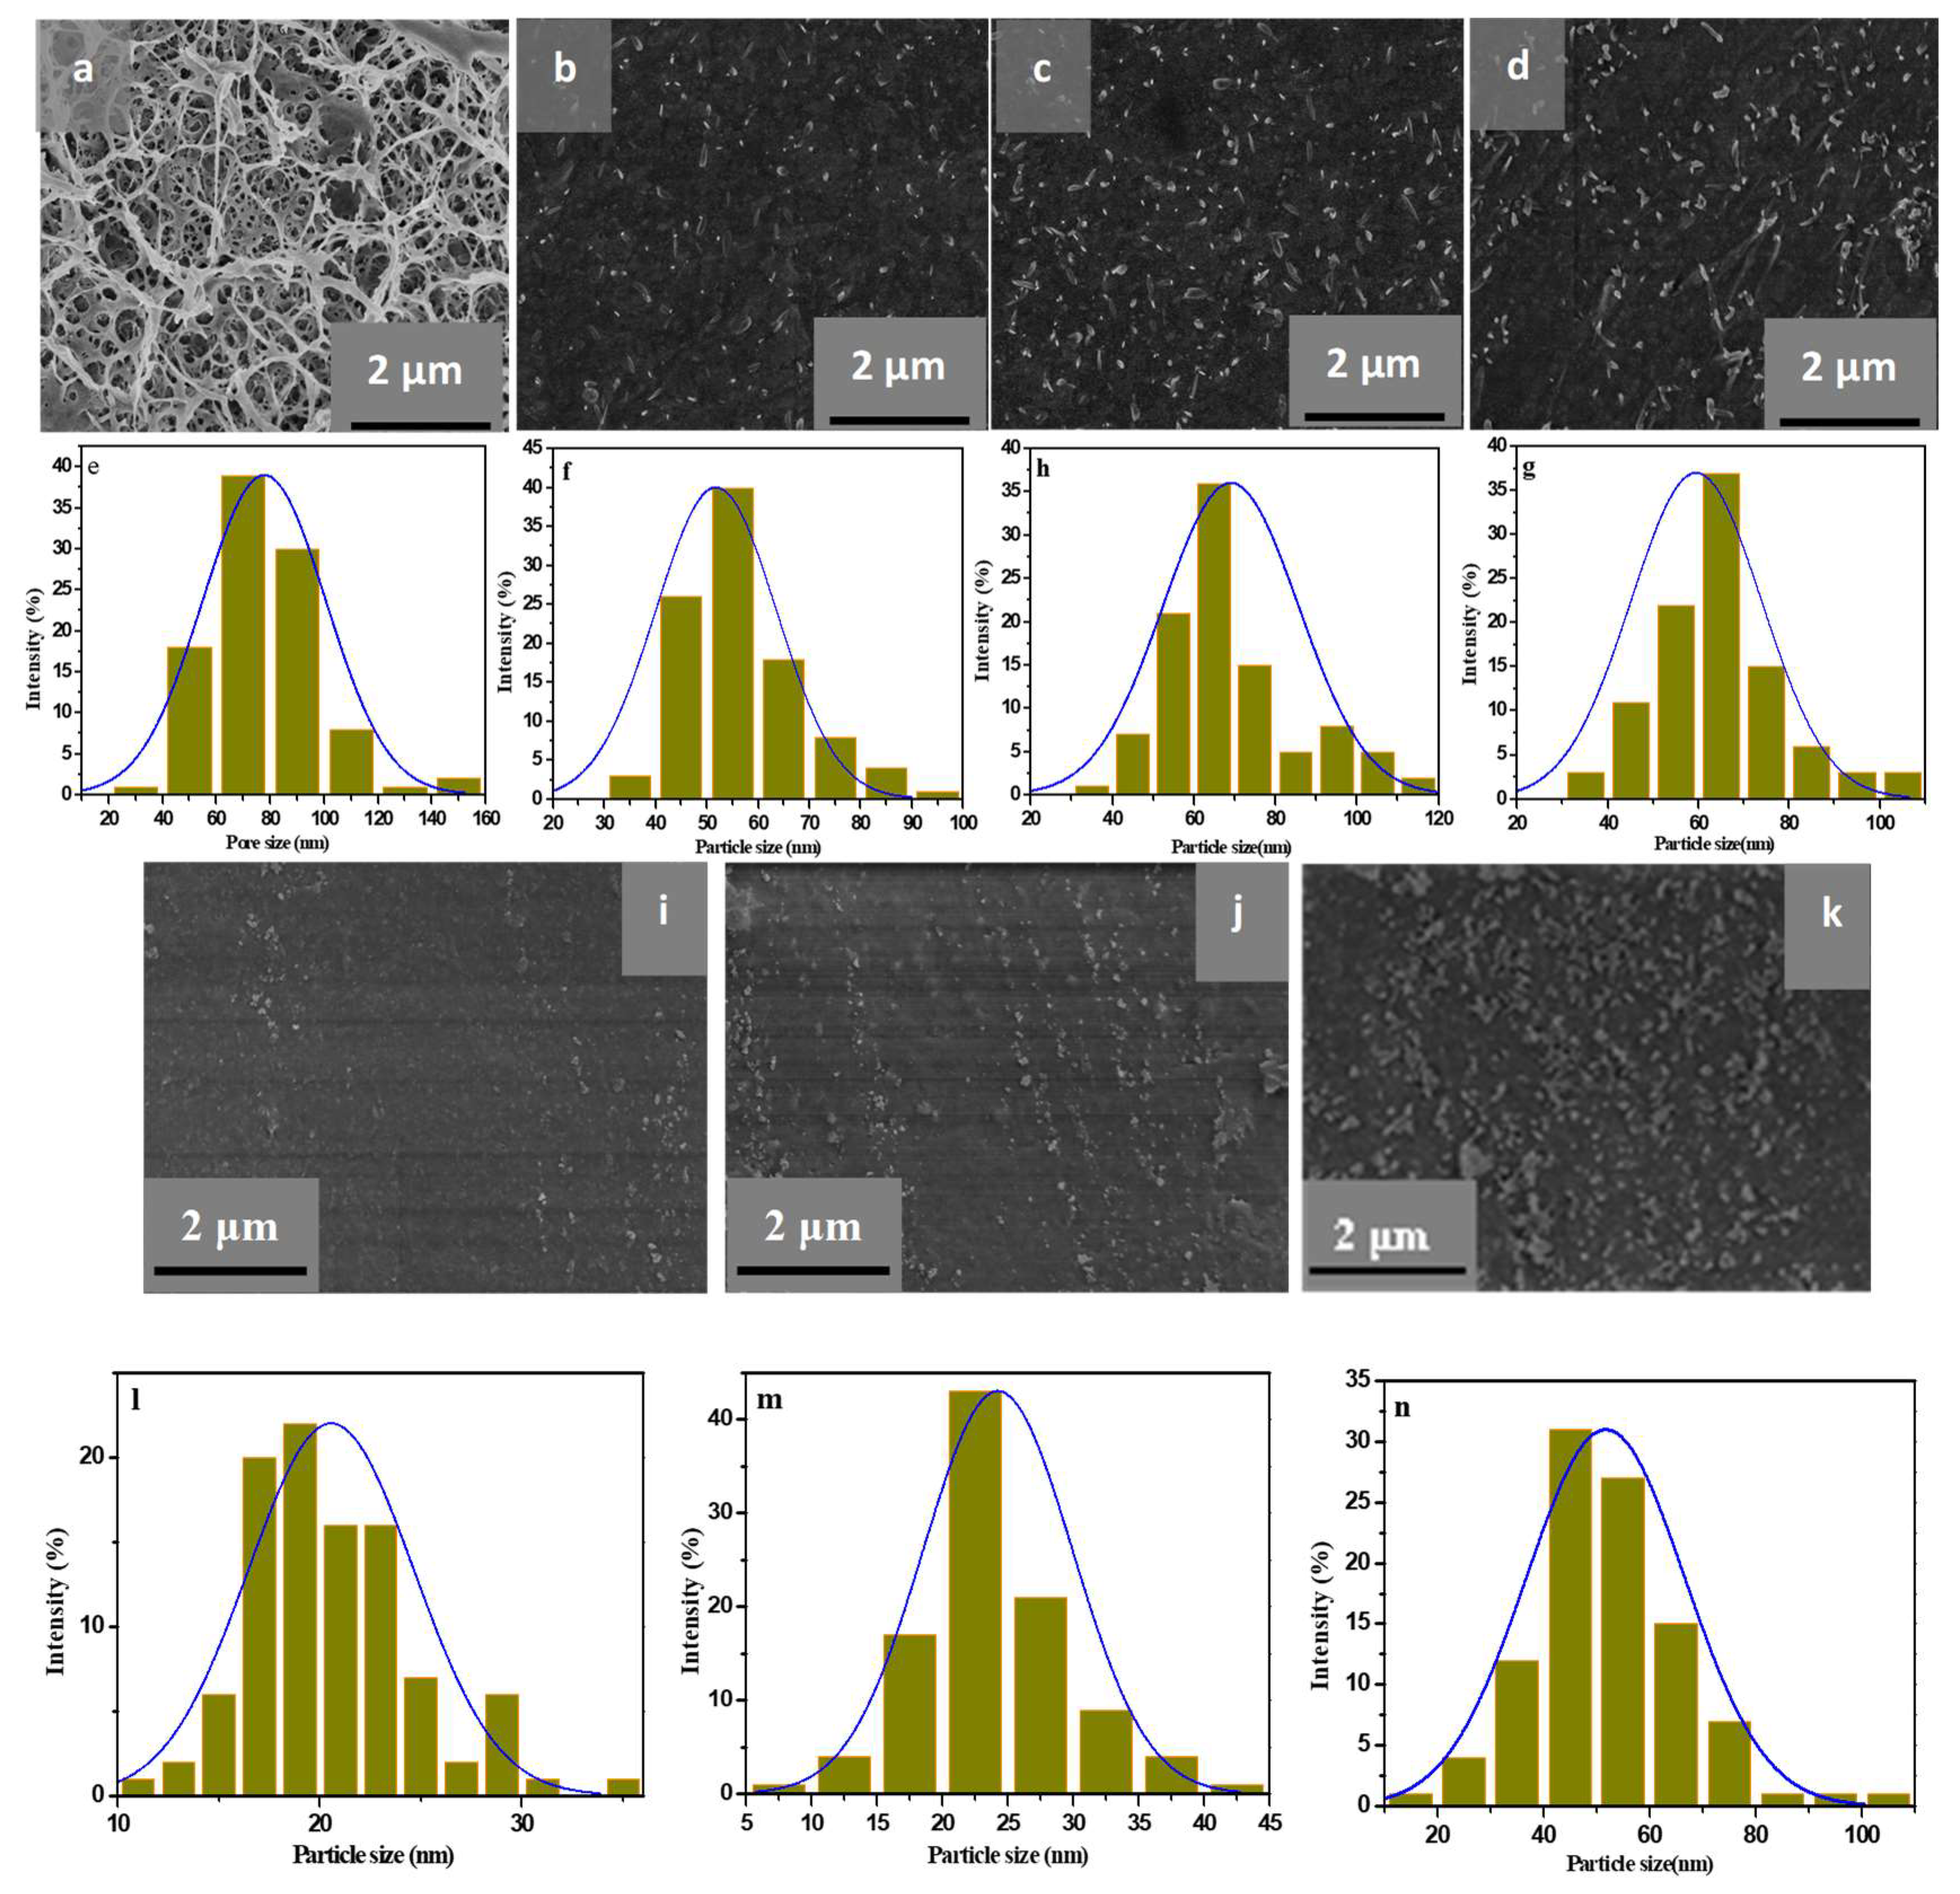
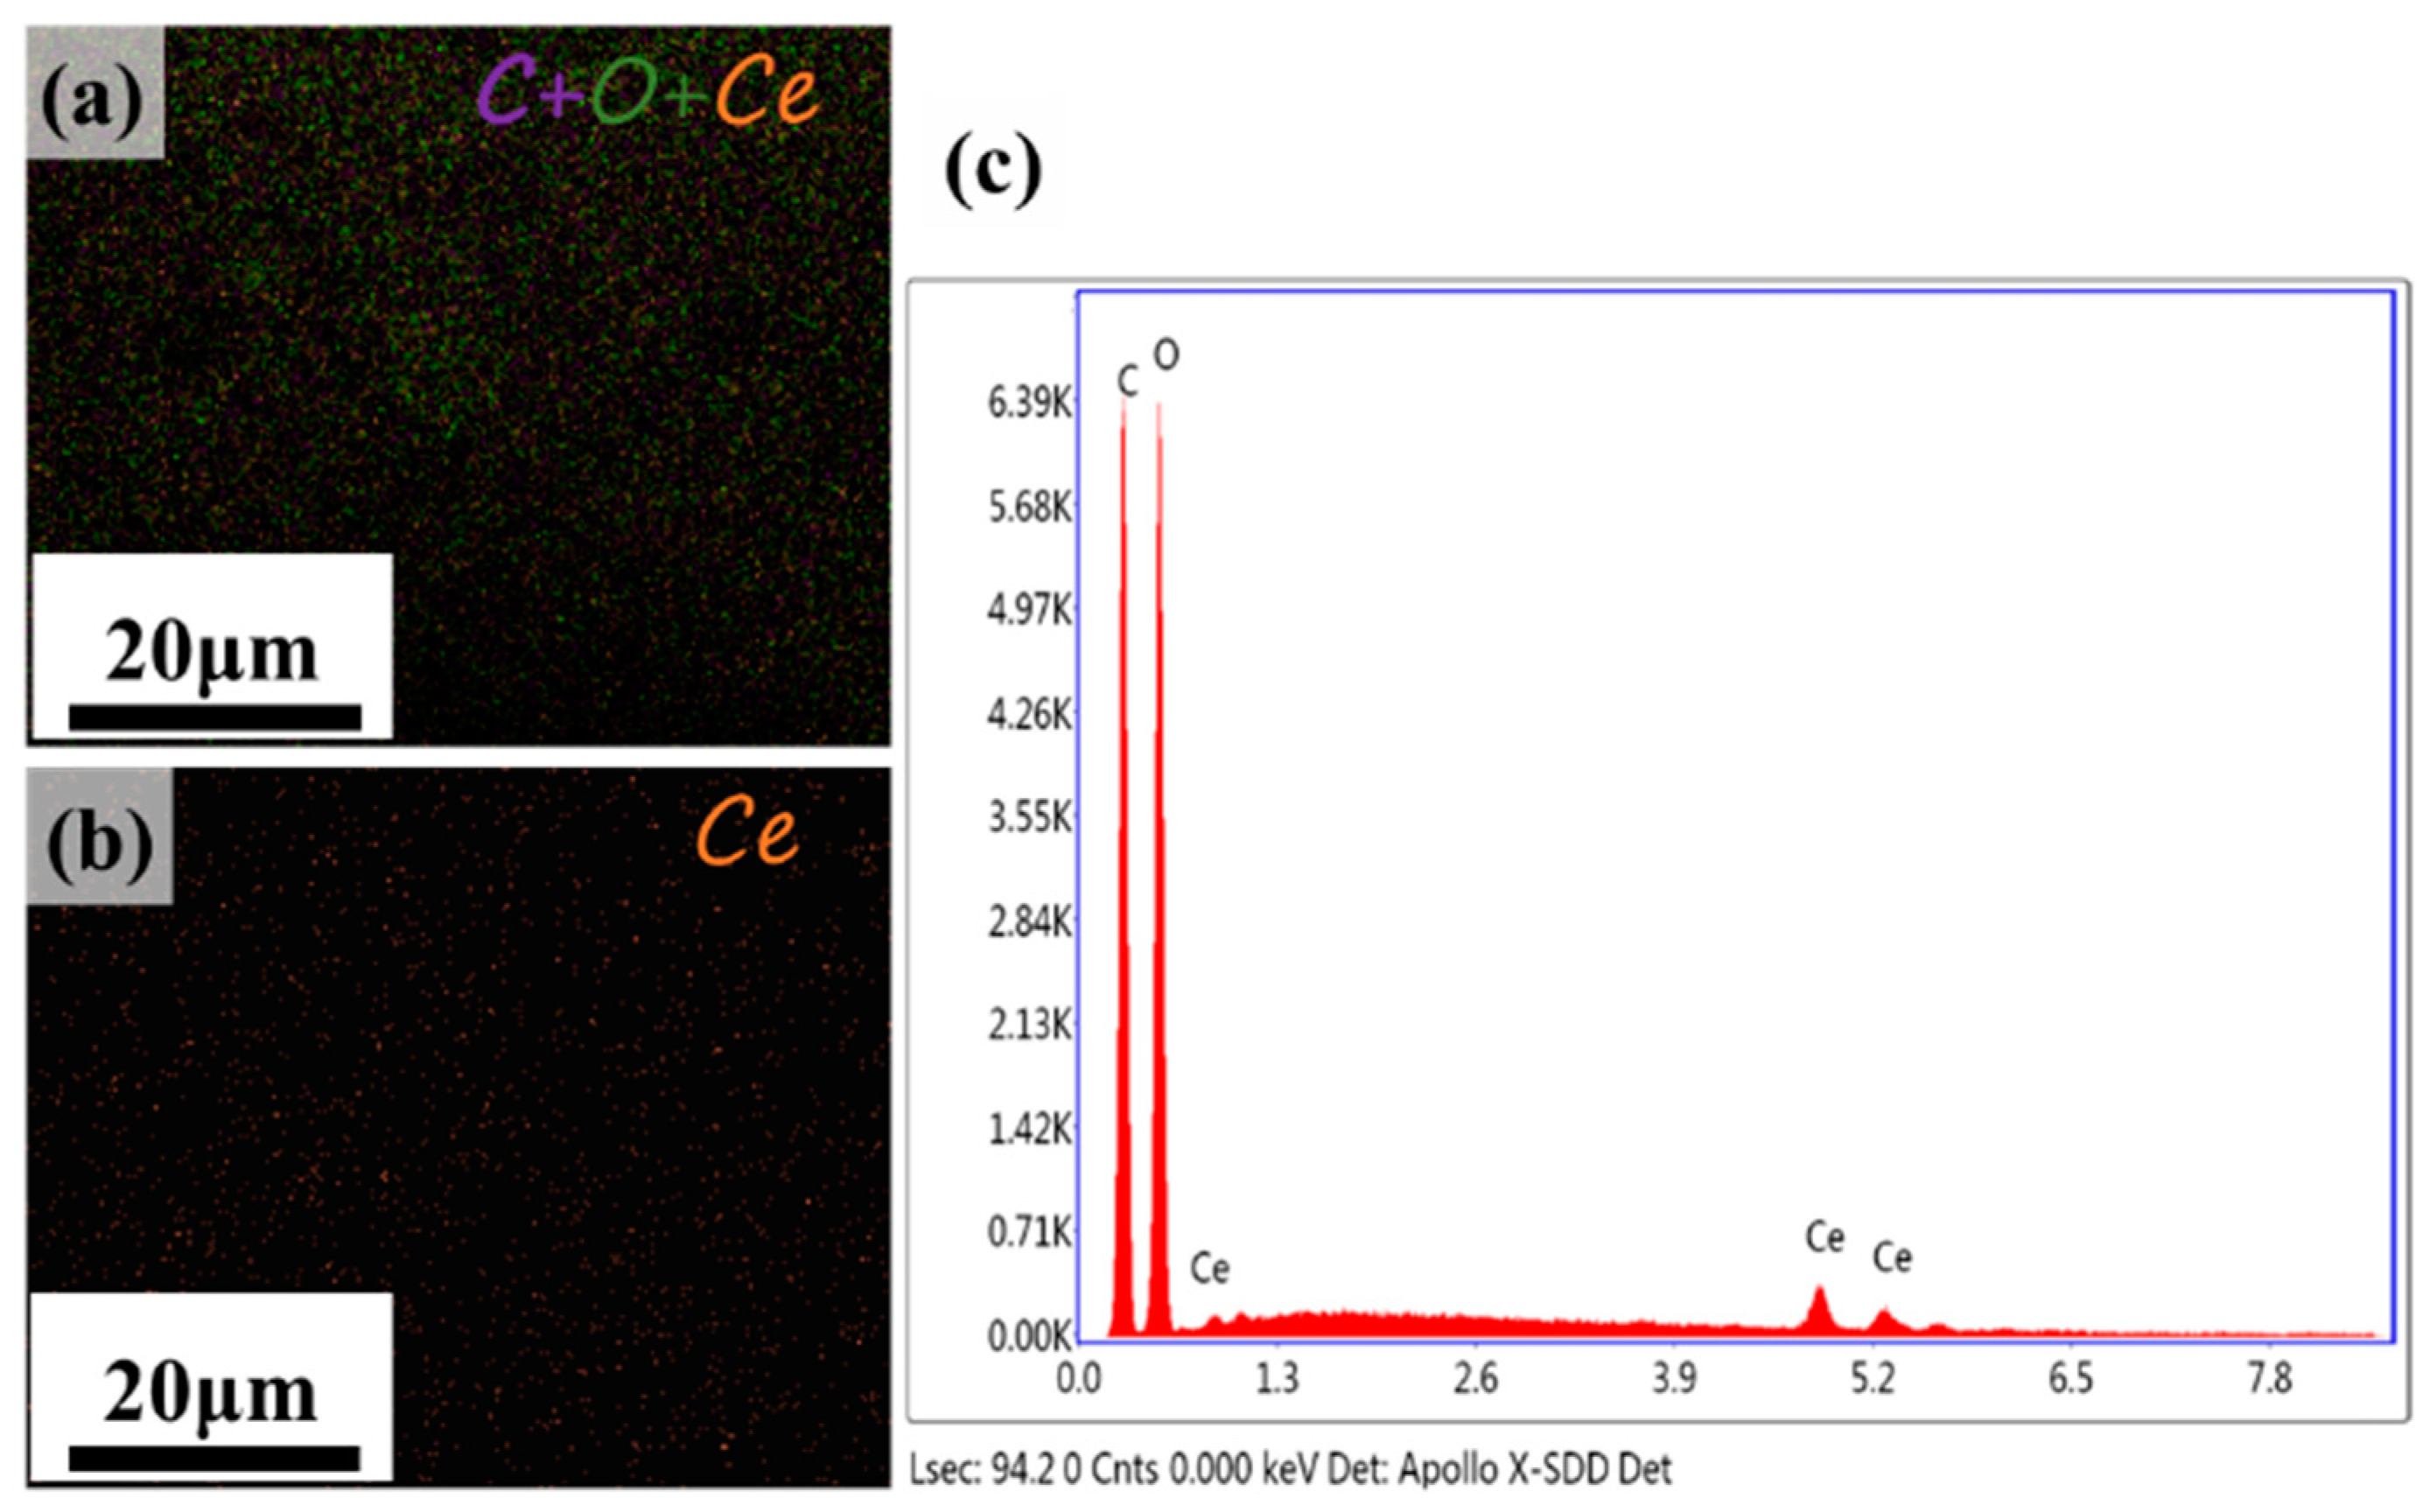
3.2. Morphology and Structure of Nanocomposite Films

It is obvious that the CeO2 NPs formed outside of the film using 0.2 mol/L aq. Ce(NO3)3·6H2O solution were spherical in shape (Figure 3a). Figure 3b represents the corresponding particle size distribution of CeO2 NPs. It is evident that the diameter of the CeO2 NPs varied from 50 to 130 nm with an average value of 75 ± 8 nm. For comparison, the TEM image of the cross-section of the nanocomposite film with CeO2 NPs generated using the same concentration of aq. Ce(NO3)3·6H2O is presented (Figure 3c). Obviously, CeO2 NPs exhibited flake-like morphology with irregular shapes and with average particle size of 24 ± 3 nm. Moreover, CeO2 NPs were dispersed uniformly in the cellulose matrix. These results meant that the micro and nanoporous structure of RC films supplied not only nanoreacting sites for the formation of the CeO2 NPs, but also a shell to protect their nanostructure. The irregular shape of CeO2 NPs implied CeO2 NPs could freely rotate, and randomly align within the pores of the RC film [11].
To investigate the effects of precursor concentrations and porous structures of RC film on the morphologies of CeO2 NPs, Figure 4 shows the SEM images of surface (a–d) and cross-section (i–k) of the RC and RC/CeO2 nanocomposite films with CeO2 NPs generated using 0.1, 0.2, and 0.5 mol/L aq. Ce(NO3)3·6H2O solutions, respectively. Correspondingly, the pore size of the RC film ((surface, e) and particle size histograms of CeO2 NPs (surface, f–h; cross-section, l–n) were also presented (Figure 4). It was evident that the RC film (Figure 4a) represented a homogeneous porous structure (average pore size, 80 ± 19 nm), as a result of the phase separation of the cellulose solution during the regenerating process. Thus, as the RC films were immersed into Ce(NO3)3·6H2O solutions, Ce3+ could be readily impregnated into the cellulose films through the pores, and then the Ce3+ ions could bind to cellulose fibers via electrostatic interaction, facilitated through the negative charge on the surface of the cellulosic material due to ionization of hydroxyl groups when immersed in water [34]. Then, the RC film would provide nanoreacting sites for in situ synthesis of CeO2 NPs. Correspondingly, a significant change in pore structure of RC films with generated CeO2 NPs would occur. The calculated porosity of RC, RC-0.1, RC-0.2, and RC-0.5 film were 91%, 50%, 43%, and 30%, respectively, as a result of filling the porous structure of the cellulose film with CeO2 NPs.
From Figure 4, it is clearly evident that the CeO2 NPs formed with RC film as support were fairly uniformly distributed in the nanocomposites. However with increasing precursor concentrations the agglomeration of CeO2 NPs in the nanocomposite films became obvious, due to increased CeO2 NPs content. This was consistent with reduced transparency of the nanocomposite films and gradual yellowing of the nanocomposite films as the precursor concentrations increased (Figure 6c). Furthermore, the surface roughness of the nanocomposite films increased with increasing precursor concentrations. In the case of the size distribution of CeO2 NPs, the average widths of the nanoparticles observed in the slice parallel to the surface of the films, were 51 ± 4 nm for RC-0.1, 60 ± 6 nm for RC-0.2, and 71 ± 12 nm for RC-0.5, respectively. While the slice was perpendicular to the plane of nanocomposite films, the average diameters of nanoparticles were 21 ± 5 nm for RC-0.1, 25 ± 6 nm for RC-0.2, and 51 ± 10 nm for RC-0.5, respectively. It could be concluded that the CeO2 NPs were rod-like shape comparing the size of CeO2 particles parallel to the surface of the film and the vertical direction in the SEM images. Though in situ generation of CeO2 NPs with RC film as supporting medium could avoid agglomeration as proved by TEM analyses, it could be found that the size of the CeO2 NPs increased with increasing precursor concentrations in the SEM images. Especially, when 0.5 mol/L aq. Ce(NO3)3·6H2O was used, agglomeration could not be avoided. Within a certain range of precursor concentration, due to the electrostatic action, at higher Ce3+ ions concentrations, larger amounts of Ce3+ ions were adsorbed on the cellulose fibers, leading to a higher number of CeO2 NPs generated which in turn increased the particle size. However, with a further increase of Ce3+ ion concentrations, agglomeration would occur due to the interaction between cellulose and CeO2 NPs, which results in difficulty in overcoming the aggregation effect of the INPs in order to reduce the surface energy.
Moreover, energy dispersive spectrum (EDS) (Figure 5) from SEM indicated that there were only C, O and Ce elements in the nanocomposite film, which further confirmed the CeO2 NPs were effectively synthesized in the RC films.

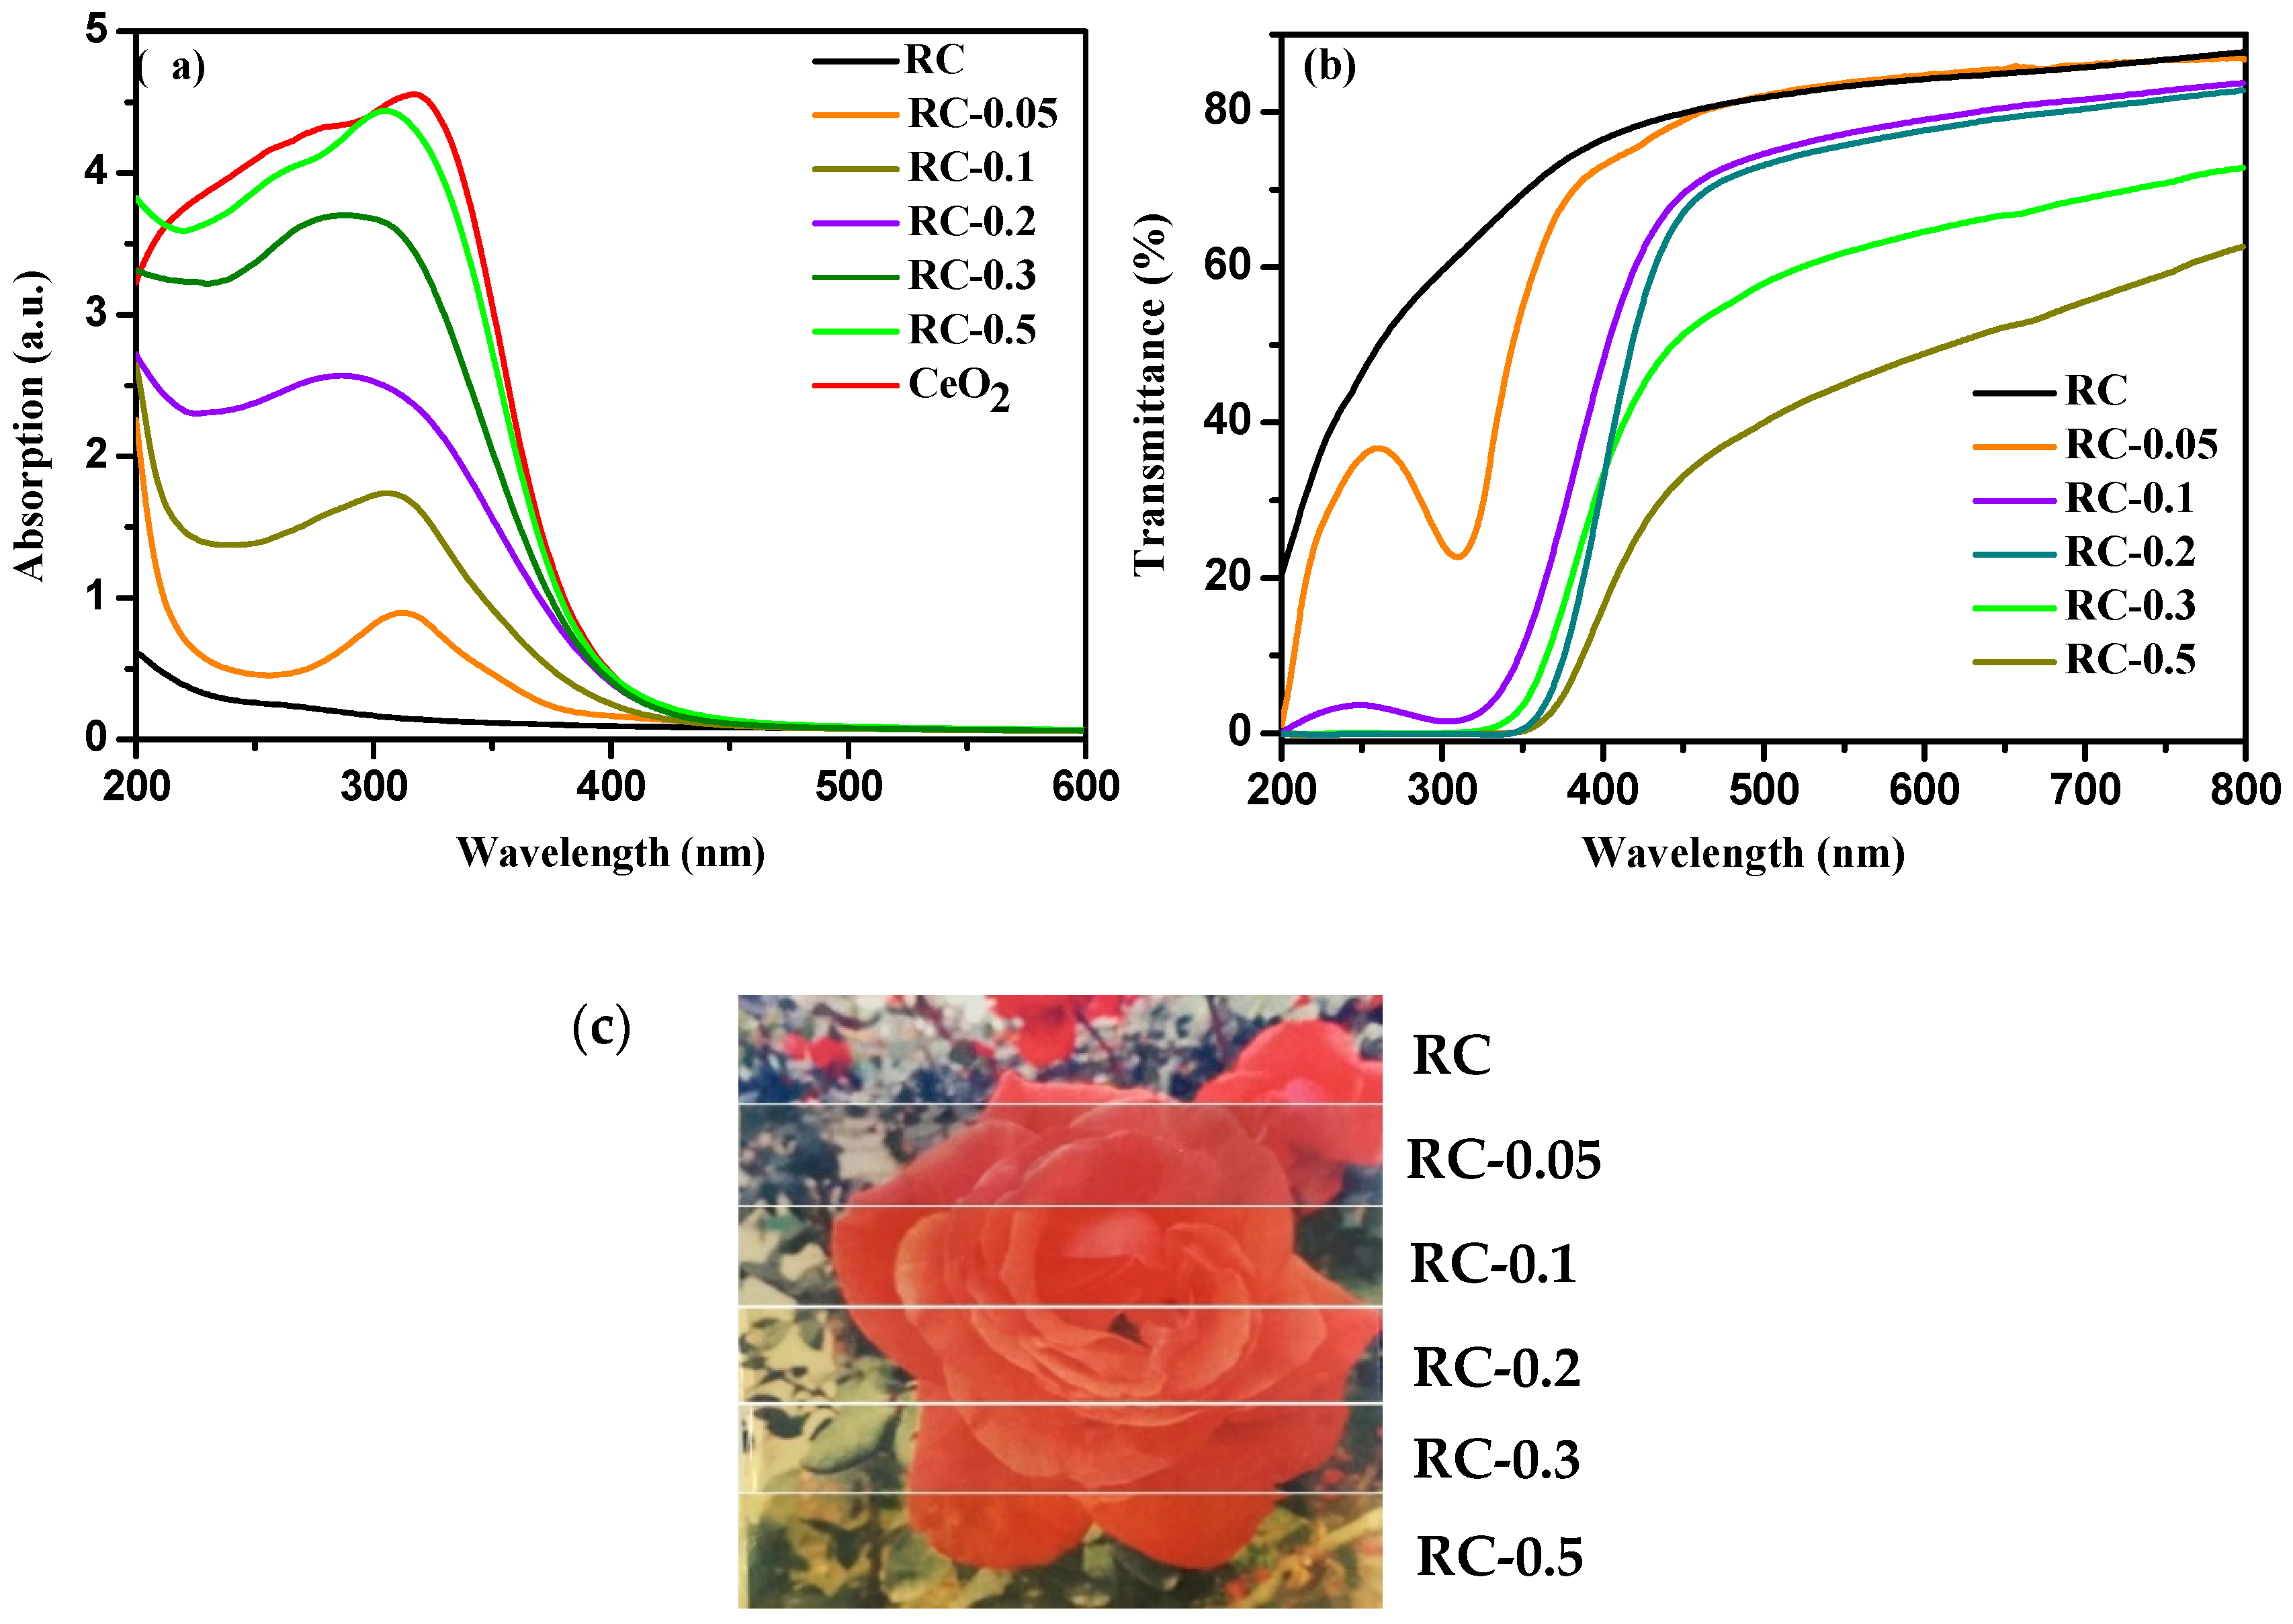
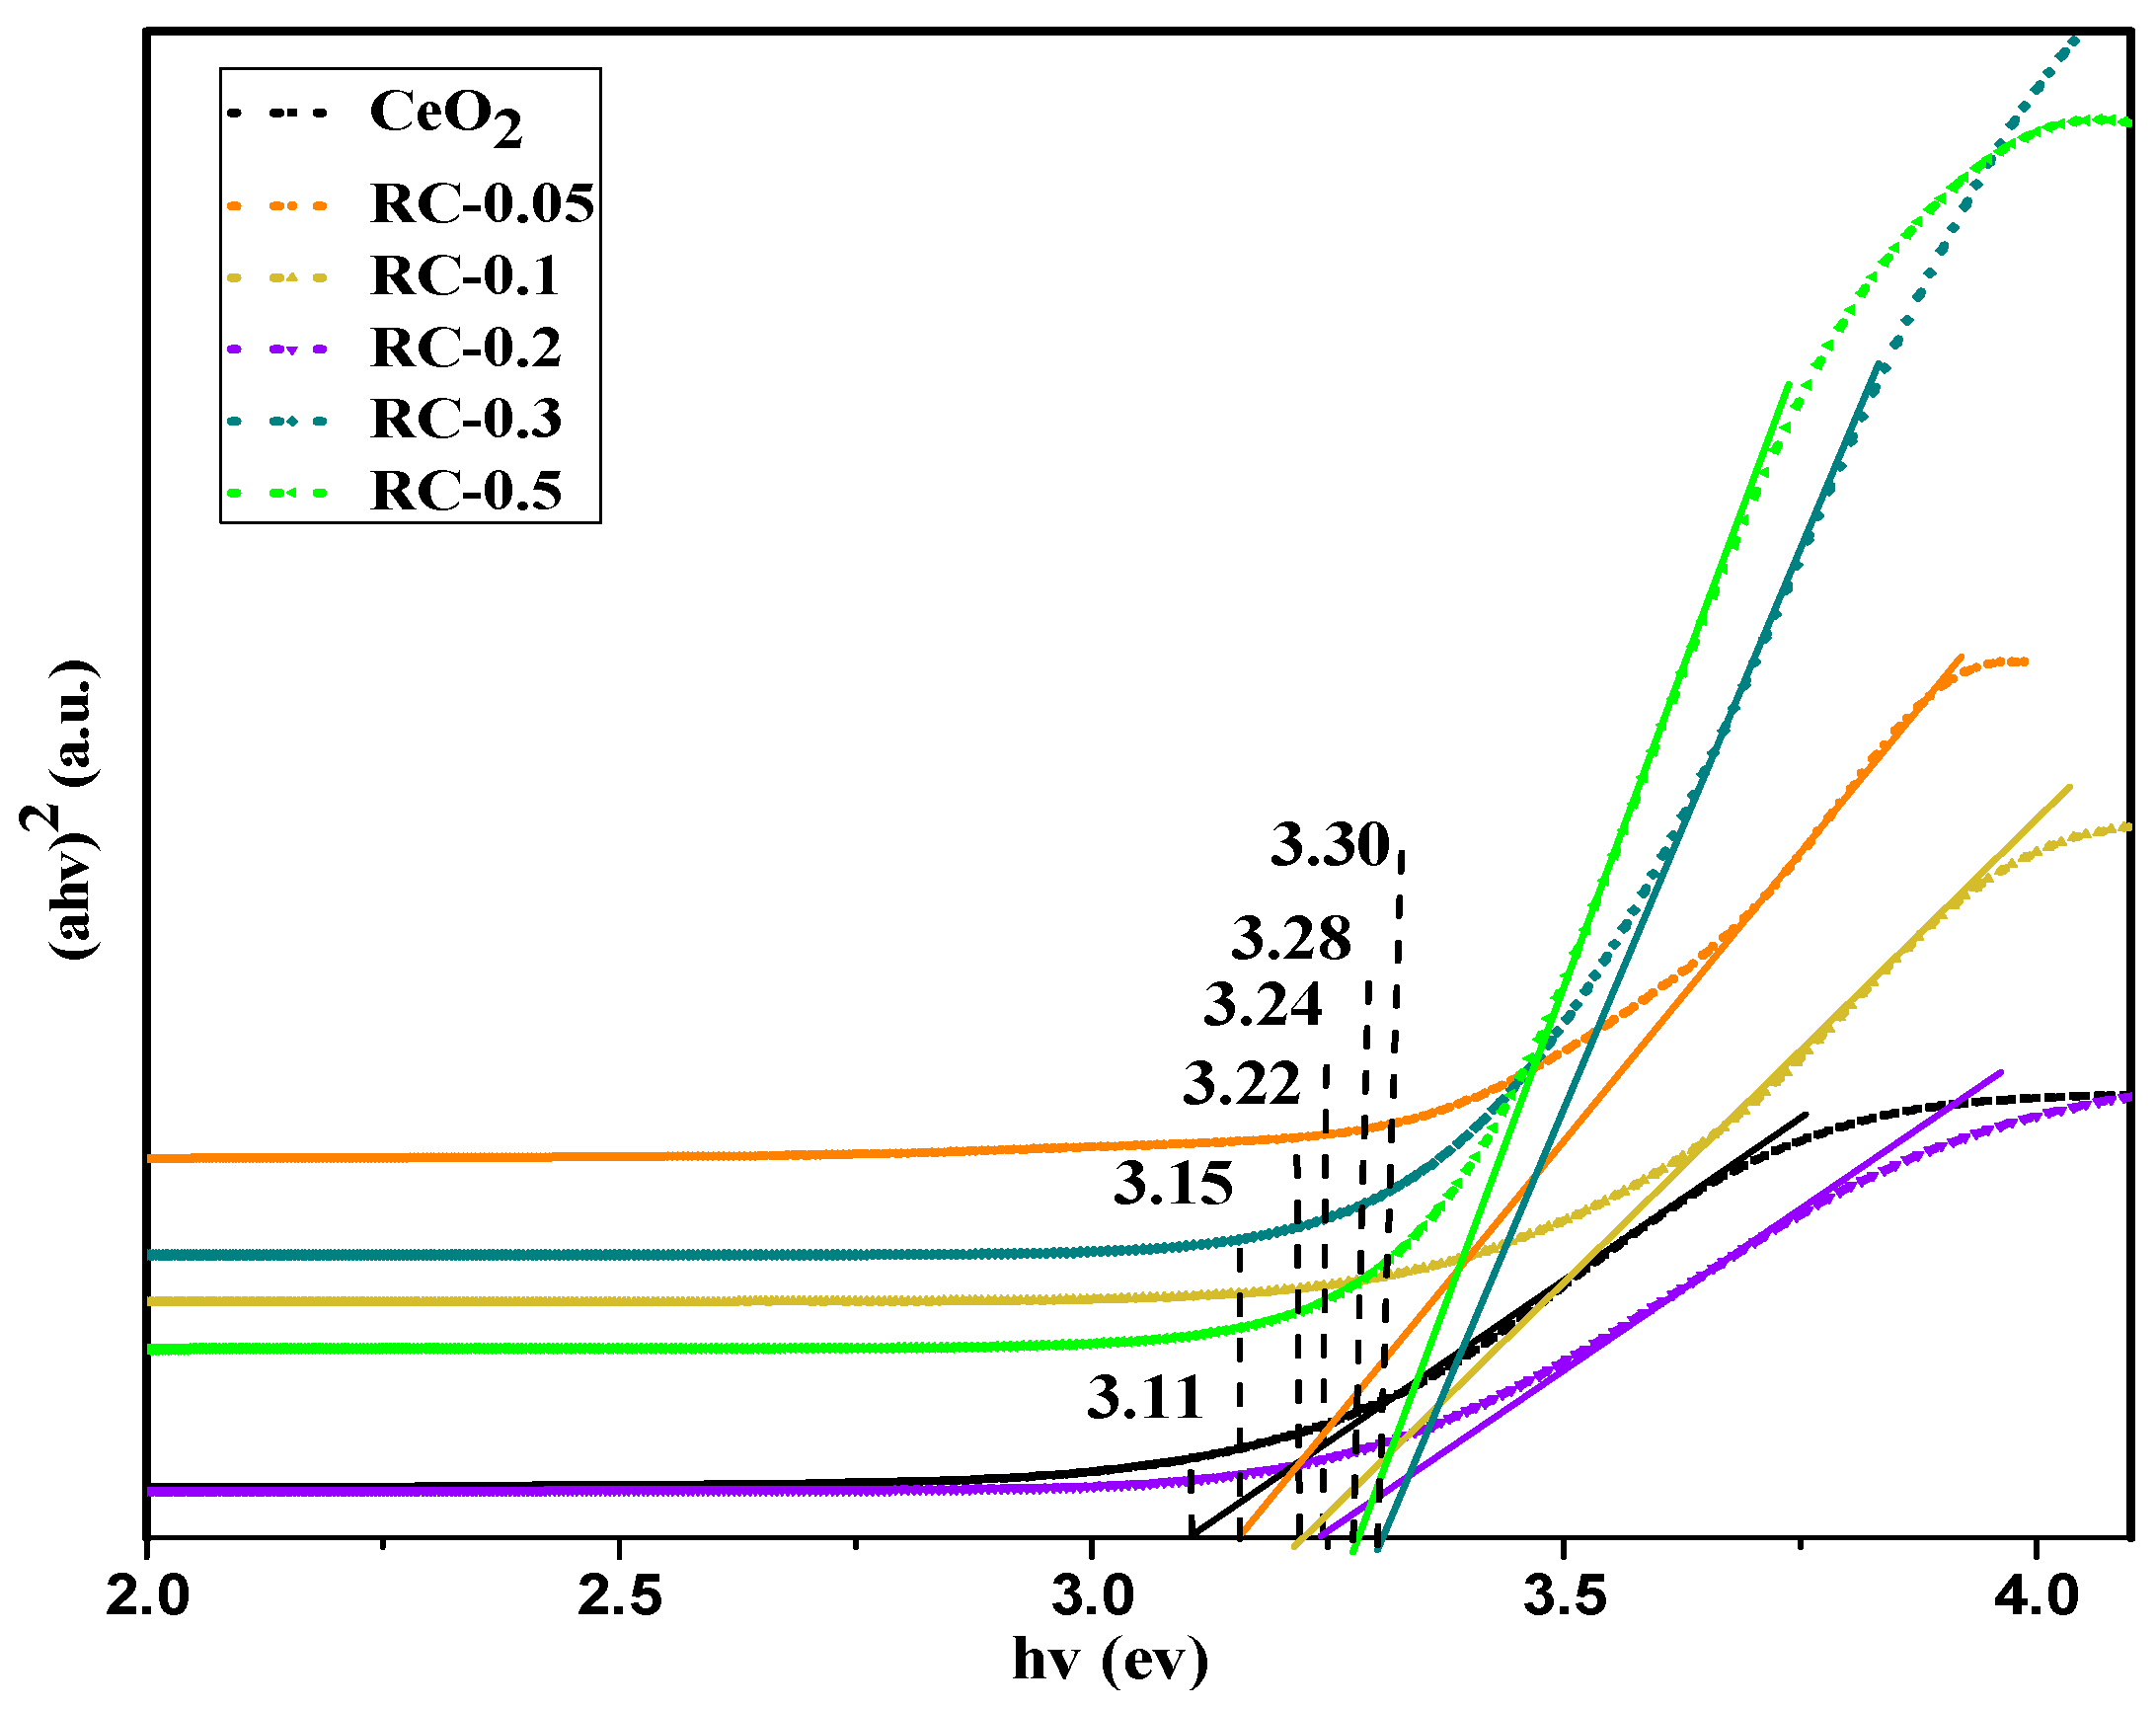
3.3. Optical Properties of Nanocomposite Films

Figure 6a shows the UV–Vis absorption spectra of RC and RC/CeO2 nanocomposite films, and CeO2 powders. It was evident that the RC film exhibited poor absorption at a wavelength ranging from 200 to 800 nm, while CeO2 showed a strong absorption peak in the UV range and had no absorption band above 500 nm, resulting from the wide band gap and the strong scattering effect of the CeO2 NPs. Interestingly, the RC/CeO2 nanocomposite films possessed intense absorption in the UV range, especially and presented good absorption in the UV-A (320–400 nm) and UV-B (280–320 nm) region, indicating that the organic–inorganic nanocomposites retained the inherent optical properties of the CeO2 NPs and could be used as efficient UV absorber materials in some fields. Furthermore, the absorption edge was beyond 400 nm, indicating the light yellow of the nanocomposite films [35], and with increasing precursor concentrations, this trend became obvious (Figure 6c). Meanwhile, an increase in the intensity and width of the band corresponding to the UV absorption peak was observed, suggesting more CeO2 NPs were generated in situ.
The transmittance of the RC/CeO2 nanocomposite films in the visible light region (400–800 nm) decreased with increasing precursor concentrations (Figure 6b), mainly attributed to larger CeO2 NPs generated and some agglomeration of CeO2 NPs, as revealed by XRD and SEM analyses. Moreover, the immobilization of CeO2 NPs into RC nanocomposite films led to the decrease in transparency of the nanocomposite films in the UV region (200–400 nm), due to the high UV absorption of CeO2 NPs. This is particularly true at high precursor concentrations. From Figure 6c, it can be seen that, obviously, all the RC nanocomposite films showed good transparency. However, as the precursor concentrations increased, the yellowing of the film became obvious, attributable to the yellowing of CeO2 particles.
The band gap energy Eg for the CeO2 NPs could be determined using the following equation [35]:
( α h ν ) 2 = k ( h ν E g ) ,
where α is the absorption coefficient, and can be calculated according to the following equation: α = 2.303 × 10 3 A ρ L C , where A is the absorbance of the sample, ρ is the real density of CeO2 (7.172 g cm−3), L is the path length of the nanocomposite film, and C is the loading of the nanoparticles in the nanocomposite, k is the parameter, hυ is the absorption energy, and Eg is the band gap energy [36]. The optical band gap was estimated by extrapolating the straight-line region in the plot of (αhυ)2 versus photon energy (Figure 7).
According to previous researches, as a result of the quantum confinement effect, the value of blue-shifting resulting from the reduction of particle size, is inversely proportional to the square of the particle size [37]. Wherefore as shown in the spectra, corresponding to the change in the size of CeO2 NPs, in comparison to pure CeO2 NPs, the absorption for all the nanocomposite samples was blue shifted. However, on increasing the precursor concentrations, a clear blue-shift of the absorption could be observed, and then a red-shift. It was evident that the CeO2 NPs generated with RC film as support led to an increase in the Eg values, compared to pure CeO2 (3.11 eV). This was attributed to the control of the particle size and the morphology of CeO2 NPs by the porous RC film.
Furthermore, the Eg value of CeO2 hybrids increased with the increase of the precursor concentration from 0.05 to 0.3 mol/L. Theoretically, the absorption of ceria in the UV region originates from the charge–transfer transition between the O 2p and Ce 4f states in O2− and Ce4+, and this absorption is much stronger than the 4f1–5d1 transition from the Ce3+ species [38]. Usually, with the increasing amount of CeO2, the Ce3+ concentrations of total Ce decrease [39]. As a result, the reduction of Ce3+ concentration of total Ce leads to an increase in Eg [40]. However, the Eg values decreased slightly with further increase of the precursor concentrations, due to the agglomeration of nanoparticles, attributed to the surface effect originating from the indirect quantum size [41].

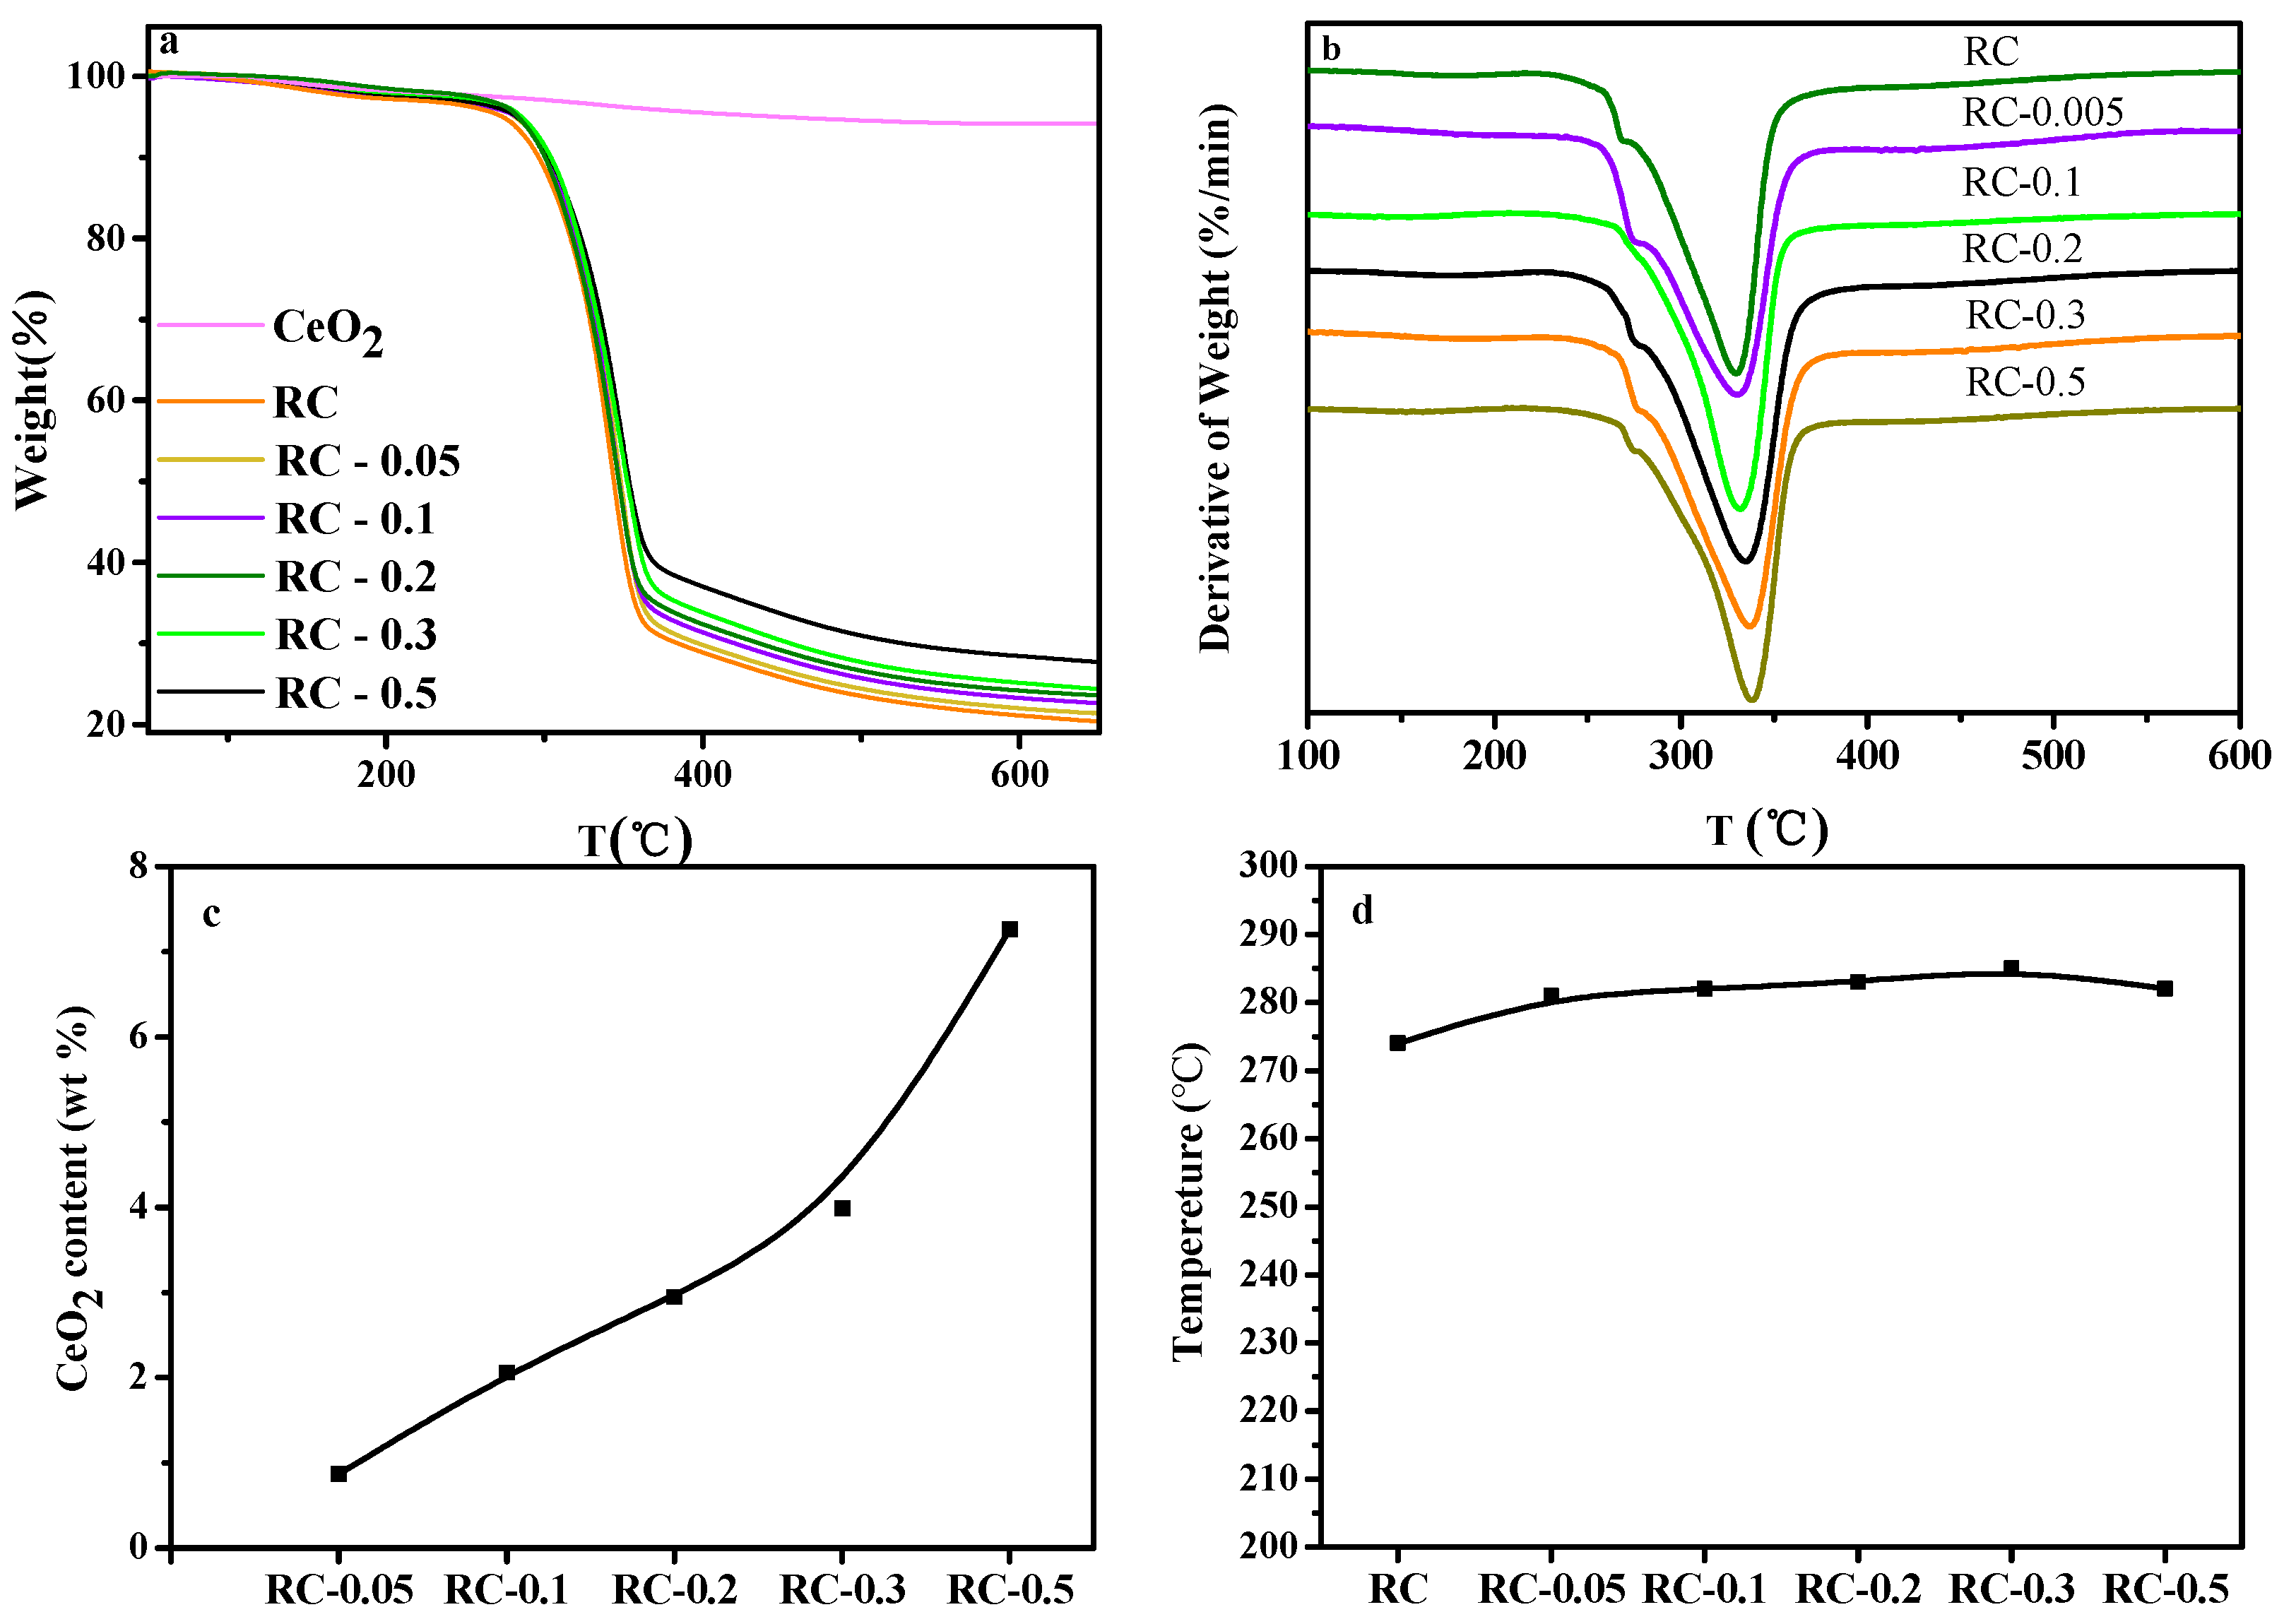
3.4. Thermal Stability Properties of the RC and Nanocomposite Films

Figure 8a,b shows the TG and DTG curves of the RC and RC/CeO2 nanocomposite films. Obviously, RC/CeO2 composite films had slightly better thermal stability at the initial stage of material degradation (Figure 8d). Because the initial thermal weight loss of cellulose-based materials mainly resulted from evaporation of moisture [11], this phenomenon could thus be attributed to the interactions between CeO2 NPs and cellulose molecules that reduce the amount of free hydroxyl groups and the hydrophobic properties of the CeO2 NPs [42]. The temperature at 5 wt% decomposition of the RC-0.5 sample was lower than that of the other composite membranes, mainly due to the agglomeration of CeO2 NPs, resulting in a reduction in the interaction between CeO2 NPs and cellulose, as revealed by FTIR. In general, all the sample films had thermal degradation at 230–370 °C, irrespective of the CeO2 NPs content, indicating that the presence of CeO2 NPs had almost no effect on the thermal degradation behavior of RC. However, the introduction of CeO2 NPs resulted in a slight increase in the maximum thermal decomposition temperature of the nanocomposite films (Figure 8b), resulting from the interaction between CeO2 NPs and cellulose molecules. Moreover, higher concentrations of aq. Ce(NO3)3·6H2O led to higher content of CeO2 NPs in as-prepared RC nanocomposite films (Figure 8c), as evidenced by the relevant SEM and XRD analyses.

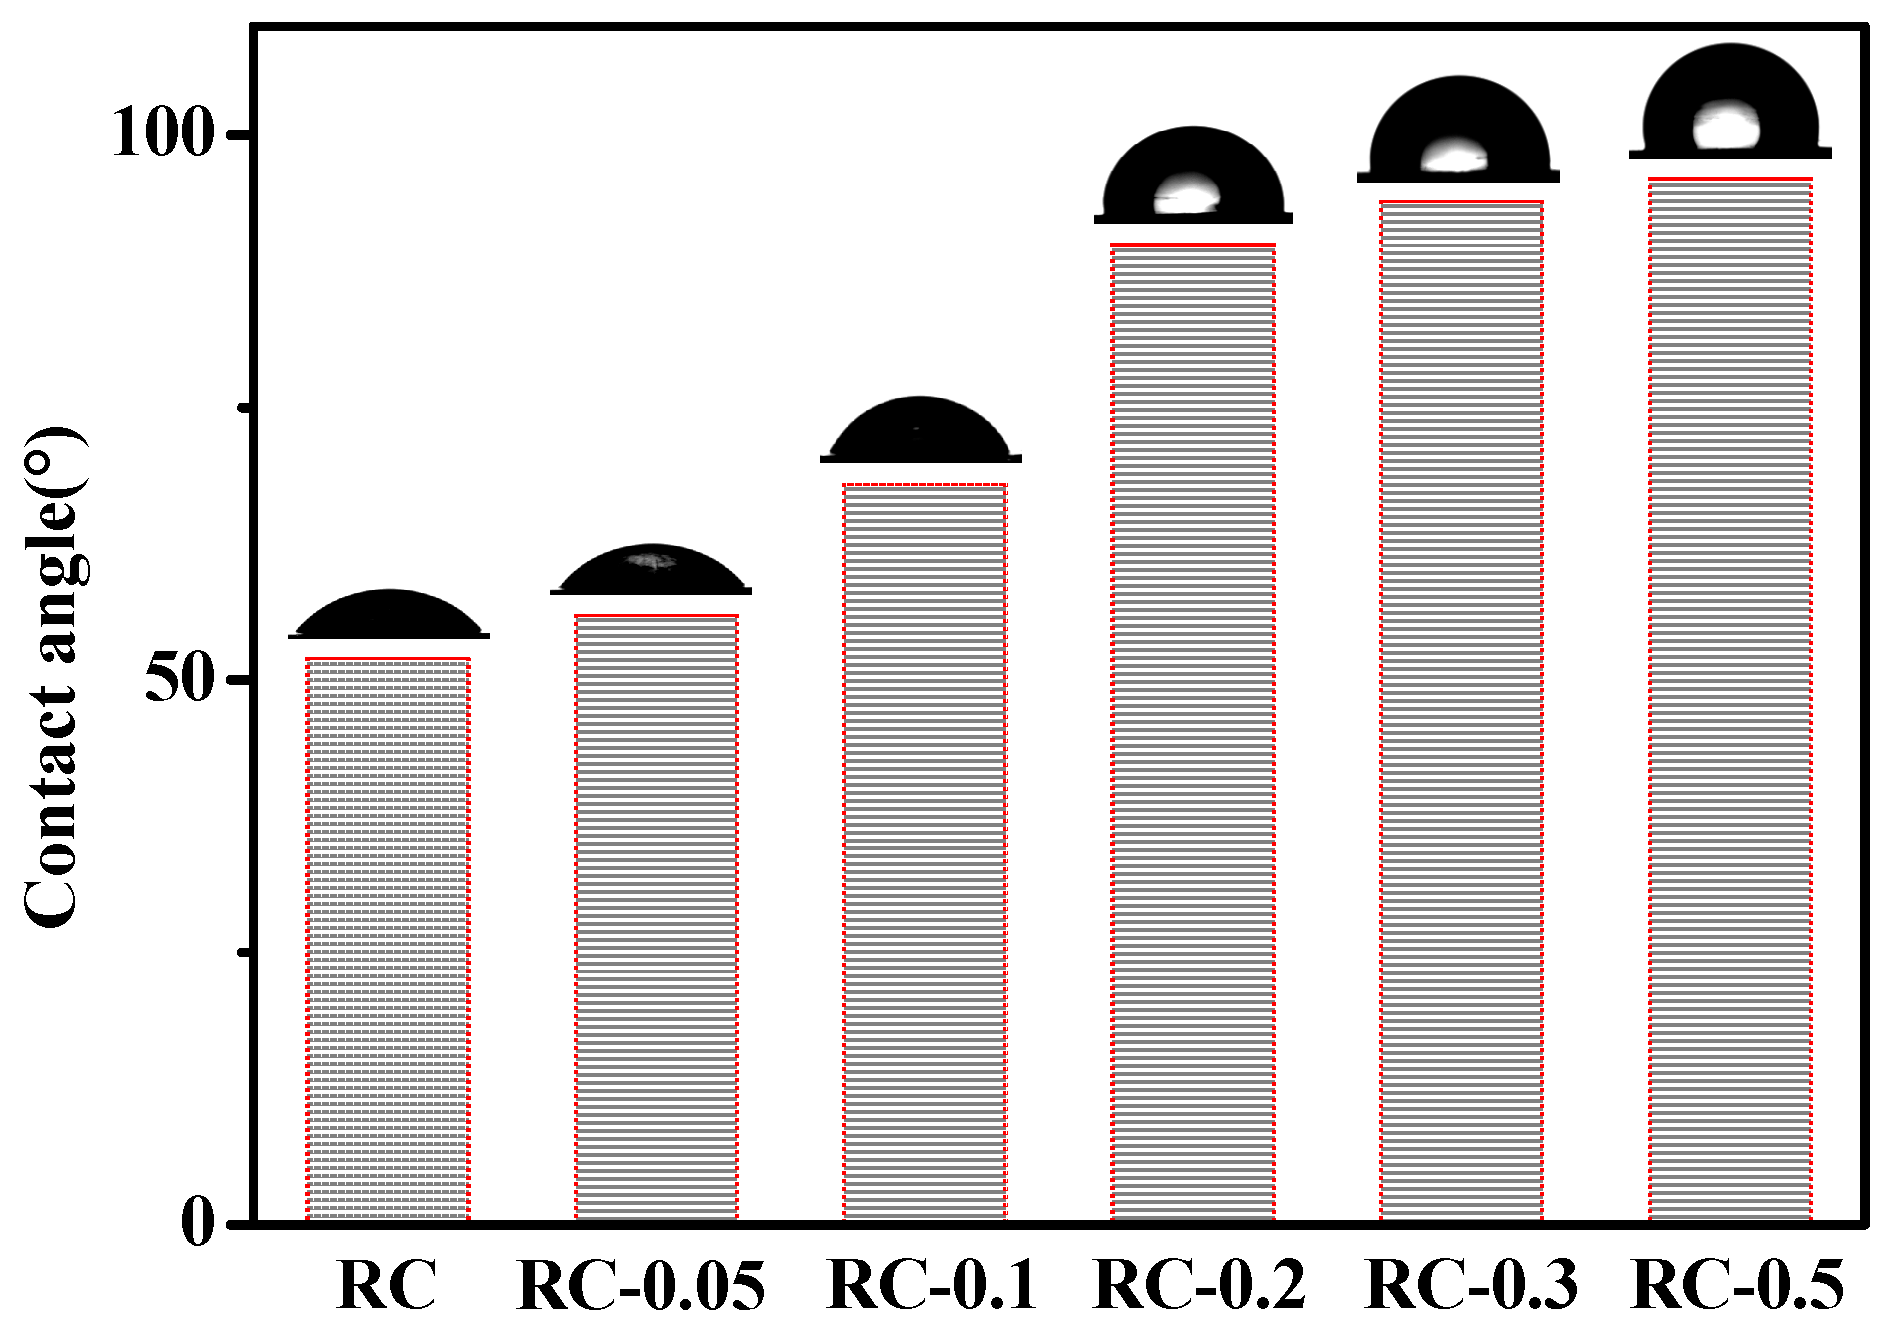
3.5. Surface Hydrophilic and Hydrophobic Properties of RC Nanocomposite Films

The water contact angles on RC and nanocomposite film surfaces were recorded (Figure 9). The hydrophilic nature of the RC films was well demonstrated by a low water contact angle of 52°. Interestingly, as CeO2 NPs were introduced into the RC films, the contact angle values increased to 90°, 94°, and 96° for the RC-0.2, RC-0.3, and RC-0.5 films, respectively. This was mainly due to the increase in surface roughness of the composite film as the CeO2 NPs content increased from 0 wt% to 7.3 wt%, as revealed by SEM images. Similar conclusions were obtained in the study of ZnO/TEMPO oxidized cellulose nanofibril composite films. In their study, when the content of ZnO reached 10 wt%, the contact angle (95°) and the surface roughness of the composite film reached the maximum at the same time [42]. Furthermore, the hydrogen bond interaction between CeO2 NPs and cellulose proved by FTIR, reduces the free hydroxyl in the system and this promotes the hydrophobicity of the composite films. When the CeO2 NPs content increased to a certain value, the water contact angle of the composite film increased slowly, indicating that the interaction between CeO2 NPs and cellulose decreased due to the agglomeration of CeO2 NPs. The hydrophobicity of the CeO2 NPs themselves may be another reason for the increased hydrophobicity of the composite membrane. Azimi et al. attributed this hydrophobicity of rare-earth oxides to their unique electronic structure, where the unfilled 4f orbitals are shielded from interactions with the surrounding environment by the full octet of electrons in the 5s2p6 outer shell. Consequently, these metal atoms would have a lower tendency to exchange electrons and form a hydrogen bond with interfacial water molecules [43].

4. Conclusions

In summary, a direct and facile synthetic strategy was provided to successfully incorporate nanodispersed CeO2 particles in RC films, thereby affording UV-shielding nanocomposite films. The porous RC film with a lot of hydroxyl groups can interact with electropositive transition-metal cations and act as effective nanoreactors for in situ synthesis of metal nanoparticles and thereby the function of RC film can be realized. With porous RC film as supporting medium, the morphology and particle size of the CeO2 NPs and accordingly the properties of as-prepared nanocomposite films were affected by the concentrations of the precursor and the porous structure of RC film. As-prepared RC/CeO2 nanocomposite films by in situ synthesis with the appropriate precursor concentration, exhibited moderate thermal stability, a certain degree of hydrophobicity, high transmittance and the desired UV shielding properties. These end products show potential applications in areas such as optical functional materials.

Author Contributions

Conceptualization, W.W., H.B. and S.Z.; Data curation, B.Z. and S.J.; Funding acquisition, W.W.; Methodology, W.W.; Writing—original draft, W.W.

Acknowledgments

Financial support from MOE&SAFEA for the 111 Project (B13025) is gratefully acknowledged.

Conflicts of Interest

The authors declare no conflict of interest.

References

  1. Al-Asbahi, B.A. Influence of SiO2/TiO2 Nanocomposite on the Optoelectronic Properties of PFO/MEH-PPV-Based OLED Devices. Polymers 2018, 10, 800. [Google Scholar] [CrossRef]
  2. Wu, S.; Peng, S.; Wang, C.H. Multifunctional Polymer Nanocomposites Reinforced by Aligned Carbon Nanomaterials. Polymers 2018, 10, 542. [Google Scholar] [CrossRef]
  3. Garnier, B.; Boudenne, A. Use of hollow metallic particles for the thermal conductivity enhancement and lightening of filled polymer. Polym. Degrad. Stabil. 2016, 127, 113–118. [Google Scholar] [CrossRef]
  4. Kumar, S.; Sarita; Nehra, M.; Tankeshwar, K.; Kim, K.H. Recent advances and remaining challenges for polymeric nanocomposites in healthcare applications. Prog. Polym. Sci. 2018, 80, 1–38. [Google Scholar] [CrossRef]
  5. Reddy, M.M.; Vivekanandhan, S.; Misra, M.; Bhatia, S.K.; Mohanty, A.K. Biobased plastics and bionanocomposites: Current status and future opportunities. Prog. Polym. Sci. 2013, 38, 1653–1689. [Google Scholar] [CrossRef]
  6. Cai, J.; Kimura, S.; Wada, M.; Kuga, S. Nanoporous Cellulose as Metal Nanoparticles Support. Biomacromolecules 2009, 10, 87–94. [Google Scholar] [CrossRef] [PubMed]
  7. Opdenbosch, D.V.; Maisch, P.; Fritz-Popovski, G.; Paris, O.; Zollfrank, C. Transparent cellulose sheets as synthesis matrices for inorganic functional particles. Carbohyd. Polym. 2012, 87, 257–264. [Google Scholar] [CrossRef]
  8. Wang, S.; Lu, A.; Zhang, L. Recent advances in regenerated cellulose materials. Prog. Polym. Sci. 2016, 53, 169–206. [Google Scholar] [CrossRef]
  9. Feng, X.; Zhao, Y.; Jiang, Y.; Miao, M.; Cao, S.; Fang, J. Use of carbon dots to enhance UV-blocking of transparent nanocellulose films. Carbohydr. Polym. 2017, 161, 253–260. [Google Scholar] [CrossRef] [PubMed]
  10. Maniruzzaman, M.; Jang, S.D.; Kim, J. Titanium dioxide–cellulose hybrid nanocomposite and its glucose biosensor application. Mat. Sci. Eng. B 2012, 177, 844–848. [Google Scholar] [CrossRef]
  11. Liu, S.; Zhou, J.; Zhang, L. In situ synthesis of plate-like Fe2O3, nanoparticles in porous cellulose films with obvious magnetic anisotropy. Cellulose 2011, 18, 663–673. [Google Scholar] [CrossRef]
  12. Muthulakshmi, L.; Rajini, N.; Varada, R.A.; Siengchin, S.; Kathiresan, T.; Jawaid, M.; Rajulu, A.V. Synthesis and characterization of cellulose/silver nanocomposites from bioflocculant reducing agent. Int. J. Biol. Macromol. 2017, 103, 1113–1120. [Google Scholar] [CrossRef] [PubMed]
  13. Yadav, M.; Mun, S.; Hyun, J.; Kim, J. Synthesis and characterization of iron oxide/cellulose nanocomposite film. Int. J. Biol. Macromol. 2015, 74, 142–149. [Google Scholar] [CrossRef] [PubMed]
  14. Tang, A.; Liu, Y.; Wang, Q.; Chen, R.; Liu, W.; Fang, Z.; Wang, L. A new photoelectric ink based on nanocellulose/CdS quantum dots for screen-printing. Carbohydr. Polym. 2016, 148, 29–35. [Google Scholar] [CrossRef] [PubMed]
  15. Hu, J.; Zhou, Y.; He, M.; Yang, X. Novel multifunctional microspheres of polysiloxane@CeO2–PMMA: Optical properties and their application in optical diffusers. Opt. Mater. 2013, 36, 271–277. [Google Scholar] [CrossRef]
  16. Tu, K.; Wang, Q.; Lu, A.; Zhang, L. Portable Visible-Light Photocatalysts Constructed from Cu2O Nanoparticles and Graphene Oxide in Cellulose Matrix. J. Phys. Chem. C 2014, 118, 7202–7210. [Google Scholar] [CrossRef]
  17. Chang, C.; Peng, J.; Zhang, L.; Pang, D.W. Strongly fluorescent hydrogels with quantum dots embedded in cellulose matrices. J. Mater. Chem. 2009, 19, 7771–7776. [Google Scholar] [CrossRef]
  18. Duan, W.; Xie, A.; Shen, Y.; Wang, X.; Wang, F.; Zhang, Y.; Li, J. Fabrication of Superhydrophobic Cotton Fabrics with UV Protection Based on CeO2 Particles. Ind. Eng. Chem. Res. 2011, 50, 4441–4445. [Google Scholar] [CrossRef]
  19. Aklalouch, M.; Calleja, A.; Granados, X.; Ricart, S.; Boffa, V.; Ricci, F.; Puig, T.; Obradors, X. Hybrid sol–gel layers containing CeO2 nanoparticles as uv-protection of plastic lenses for concentrated photovoltaics. Sol. Energ. Mat. Sol. C 2014, 120, 175–182. [Google Scholar] [CrossRef]
  20. Ye, H.; Zhu, L.; Li, W.; Jiang, G.; Liu, H.; Chen, H. Anchoring CeO2, nanoparticles on monodispersed SiO2, spheres to construct hydrophobic polymer coating with enhanced uv absorption ability. Chem. Eng. J. 2017, 321, 268–276. [Google Scholar] [CrossRef]
  21. Lu, Z.; Mao, C.; Meng, M.; Liu, S.; Tian, Y.; Yu, L.; Sun, B.; Li, C.M. Fabrication of CeO2 nanoparticle-modified silk for UV protection and antibacterial applications. J. Colloid Interface Sci. 2014, 435, 8–14. [Google Scholar] [CrossRef] [PubMed]
  22. Kim, S.K.; Chang, H.; Jang, H.D. Synthesis of micron-sized porous CeO2-SiO2 composite particles for ultraviolet absorption. Adv. Powder Technol. 2017, 28, 406–410. [Google Scholar] [CrossRef]
  23. Zhang, Y.; Zhou, Z.; Yuan, K.; Wen, F.; Tan, J.; Hu, C.; Wang, H. Fabrication of a modified straw cellulose and cerium oxide nanocomposite and its visible-light photocatalytic reduction activity. J. Environ. Eng. 2017, 5, 3734–3740. [Google Scholar] [CrossRef]
  24. Pan, C.; Zhang, D.; Shi, L.; Fang, J. Template-Free Synthesis, Controlled Conversion, and CO Oxidation Properties of CeO2, Nanorods, Nanotubes, Nanowires, and Nanocubes. Eur. J. Inorg. Chem. 2008, 15, 2429–2436. [Google Scholar] [CrossRef]
  25. Cai, J.; Zhang, L. Rapid dissolution of cellulose in LiOH/urea and NaOH/urea aqueous solutions. Macromol. Biosci. 2005, 5, 539–548. [Google Scholar] [CrossRef] [PubMed]
  26. Sèbe, G.; Hampichavant, F.; Ibarboure, E.; Koffi, A.L.; Tingaut, P. Supramolecular structure characterization of cellulose II nanowhiskers produced by acid hydrolysis of cellulose I substrates. Biomacromolecules 2012, 13, 570–578. [Google Scholar] [CrossRef] [PubMed]
  27. Wang, Q.; Wang, Y.; Chen, L.; Cai, J.; Zhang, L. Facile construction of cellulose nanocomposite aerogel containing TiO2 nanoparticles with high content and small size and their applications. Cellulose 2017, 24, 2229–2240. [Google Scholar] [CrossRef]
  28. Wang, W.; Bai, Q.; Liang, T. Two-sided surface oxidized cellulose membranes modified with PEI: Preparation, characterization and application for dyes removal. Polymers 2017, 9, 455. [Google Scholar] [CrossRef]
  29. Zhong, X.; Zhou, Y.; He, M.; Tong, Y.; Fan, L.; Cai, Z. Synthesis of organosiloxane-coated SiO2/CeO2 with multilayered hierarchical structure and its application in optical diffusers. J. Mater. Sci. 2017, 52, 12806–12817. [Google Scholar] [CrossRef]
  30. Gong, C.H.; Wang, X.X.; Liu, H.J.; Zhao, C.; Zhang, Y.D.; Jia, Y.S.; Meng, H.J.; Zhang, J.W.; Zhang, Z.J. Facile in situ synthesis of nickel/cellulose nanocomposites: Mechanisms, properties and perspectives. Cellulose 2014, 21, 4359–4368. [Google Scholar] [CrossRef]
  31. Duchemin, B.; Corre, D.L.; Leray, N.; Dufresne, A.; Staiger, M.P. All-cellulose composites based on microfibrillated cellulose and filter paper via a NaOH-urea solvent system. Cellulose 2016, 23, 593–609. [Google Scholar] [CrossRef]
  32. Zhang, Y.W.; Si, R.; Liao, A.C.; Yan, C.H.; Xiao, C.X.; Kou, Y. Facile Alcohothermal Synthesis, Size-Dependent Ultraviolet Absorption, and Enhanced CO Conversion Activity of Ceria Nanocrystals. J. Phys. Chem. B 2003, 107, 10159–10167. [Google Scholar] [CrossRef]
  33. Mousavi-Kamazani, M.; Rahmatolahzadeh, R.; Beshkar, F. Facile Solvothermal Synthesis of CeO2–CuO Nanocomposite Photocatalyst Using Novel Precursors with Enhanced Photocatalytic Performance in Dye Degradation. J. Inorg. Organomet. Polym. 2017, 27, 1342–1350. [Google Scholar] [CrossRef]
  34. Aladpoosh, R.; Montazer, M. The role of cellulosic chains of cotton in biosynthesis of ZnO nanorods producing multifunctional properties: Mechanism, characterizations and features. Carbohydr. Polym. 2015, 126, 122–129. [Google Scholar] [CrossRef] [PubMed]
  35. Liu, K.Q.; Kuang, C.X.; Zhong, M.Q.; Shi, Y.Q.; Chen, F. Synthesis, characterization and UV-shielding property of polystyrene-embedded CeO2 nanoparticles. Opt. Mater. 2013, 35, 2710–2715. [Google Scholar] [CrossRef]
  36. Ho, C.; Yu, J.C.; Kwong, T.; Mak, A.C.; Lai, S. Morphology-controllable synthesis of mesoporous CeO2 nano- and microstructures. Chem. Mater. 2005, 17, 4514–4522. [Google Scholar] [CrossRef]
  37. Hezam, A.; Namratha, K.; Drmosh, Q.A.; Yamani, Z.H.; Byrappa, K. Synthesis of heterostructured Bi2O3 –CeO2 –ZnO photocatalyst with enhanced sunlight photocatalytic activity. Ceram. Int. 2017, 43, 5292–5301. [Google Scholar] [CrossRef]
  38. Phoka, S.; Laokul, P.; Swatsitang, E.; Promarak, V.; Seraphin, S.; Maensiri, S. Synthesis, structural and optical properties of CeO2 nanoparticles synthesized by a simple polyvinyl pyrrolidone (PVP) solution route. Mater. Chem. Phys. 2009, 115, 423. [Google Scholar] [CrossRef]
  39. Liu, H.; Wang, M.; Wang, Y.; Liang, Y.; Cao, W.; Su, Y. Ionic liquid-templated synthesis of mesoporous CeO2–TiO2 nanoparticles and their enhanced photocatalytic activities under UV or visible light. J. Photochem. Photobiol. A 2011, 223, 157–164. [Google Scholar] [CrossRef]
  40. Ramasamy, V.; Vijayalakshmi, G. Effect of Zn doping on structural, optical and thermal properties of CeO2 nanoparticles. Superlattices Microstruct. 2015, 85, 510–521. [Google Scholar] [CrossRef]
  41. Yan, B.; Zhao, W. Wet chemical synthesis of nanometer CeO2 with strong ultraviolet absorption property by in situ assembly of hybrid precursors. Mater. Sci. Eng. B 2004, 110, 23–26. [Google Scholar] [CrossRef]
  42. Ning, R.; Wu, C.N.; Takeuchi, M.; Saito, T.; Isogai, A. Preparation and characterization of zinc oxide/tempo-oxidized cellulose nanofibril composite films. Cellulose 2017, 24, 4861–4870. [Google Scholar] [CrossRef]
  43. Azimi, G.; Dhiman, R.; Kwon, H.M.; Paxson, A.T.; Varanasi, K.K. Hydrophobicity of Rare-Earth Oxice Ceramics. Nat. Mater. 2013, 12, 315–320. [Google Scholar] [CrossRef] [PubMed]
Figure 1. XRD patterns of pure regenerated cellulose (RC) film, CeO2 nanoparticles (NPs) as well as cellulose/CeO2 nanocomposite films with CeO2 NPs generated from Ce(NO3)3·6H2O solutions.
Polymers 11 00458 g001
Figure 2. FTIR spectra of CeO2 particles, RC and RC/CeO2 nanocomposite films.
Polymers 11 00458 g002
Figure 3. (a) TEM image of CeO2 NPs formed outside the film; (b) particle size histograms of CeO2 NPs corresponding to (a); (c) TEM image of the cross-section of cellulose/CeO2 nanocomposite films; (d) particle size histogram of CeO2 NPs estimated from (c). (Two samples were generated form 0.2 mol/L aq. Ce(NO3)3·6H2O solution).
Polymers 11 00458 g003
Figure 4. SEM image (a) and particle size histogram (e) of the surface of RC; SEM images and particle size histograms of the surface of RC-0.1 (b,f); RC-0.2 (c,g); RC-0.5 (d,h) and the cross-section of RC-0.1 (i,l); RC-0.2 (j,m); RC-0.5 (k,n).
Polymers 11 00458 g004
Figure 5. (a) C + O + Ce; (b) Ce EDS mapping images and (c) EDS analysis of the surface of the RC-0.2 film.
Polymers 11 00458 g005
Figure 6. (a) Ultraviolet absorption property of CeO2 powders, RC, and RC/CeO2 nanocomposite films (b) UV–Vis transmittance of RC and RC/CeO2 nanocomposite films; (c) digital pictures of RC and RC/CeO2 nanocomposite films (tested film with a thickness of approximately 40 μm).
Polymers 11 00458 g006
Figure 7. Plot of (αhv)2 versus photon energy for the CeO2 NPs and CeO2 NPs dispersed in the RC matrix.
Polymers 11 00458 g007
Figure 8. TGA (a) and DTG (b) curves for RC and RC/CeO2 nanocomposite films under nitrogen atmosphere; (c) the influences of Ce(NO3)3·6H2O concentrations on the content of the incorporated CeO2 NPs (wt%) in the nanocomposite films; (d) the temperature at 5 wt% decomposition of RC and RC/CeO2 nanocomposite films.
Polymers 11 00458 g008
Figure 9. Static contact angle of the RC and RC/CeO2 nanocomposite films.
Polymers 11 00458 g009

