Flexural Fatigue Properties of Ultra-High Performance Engineered Cementitious Composites (UHP-ECC) Reinforced by Polymer Fibers


Abstract
:
1. Introduction
2. Experimental Program
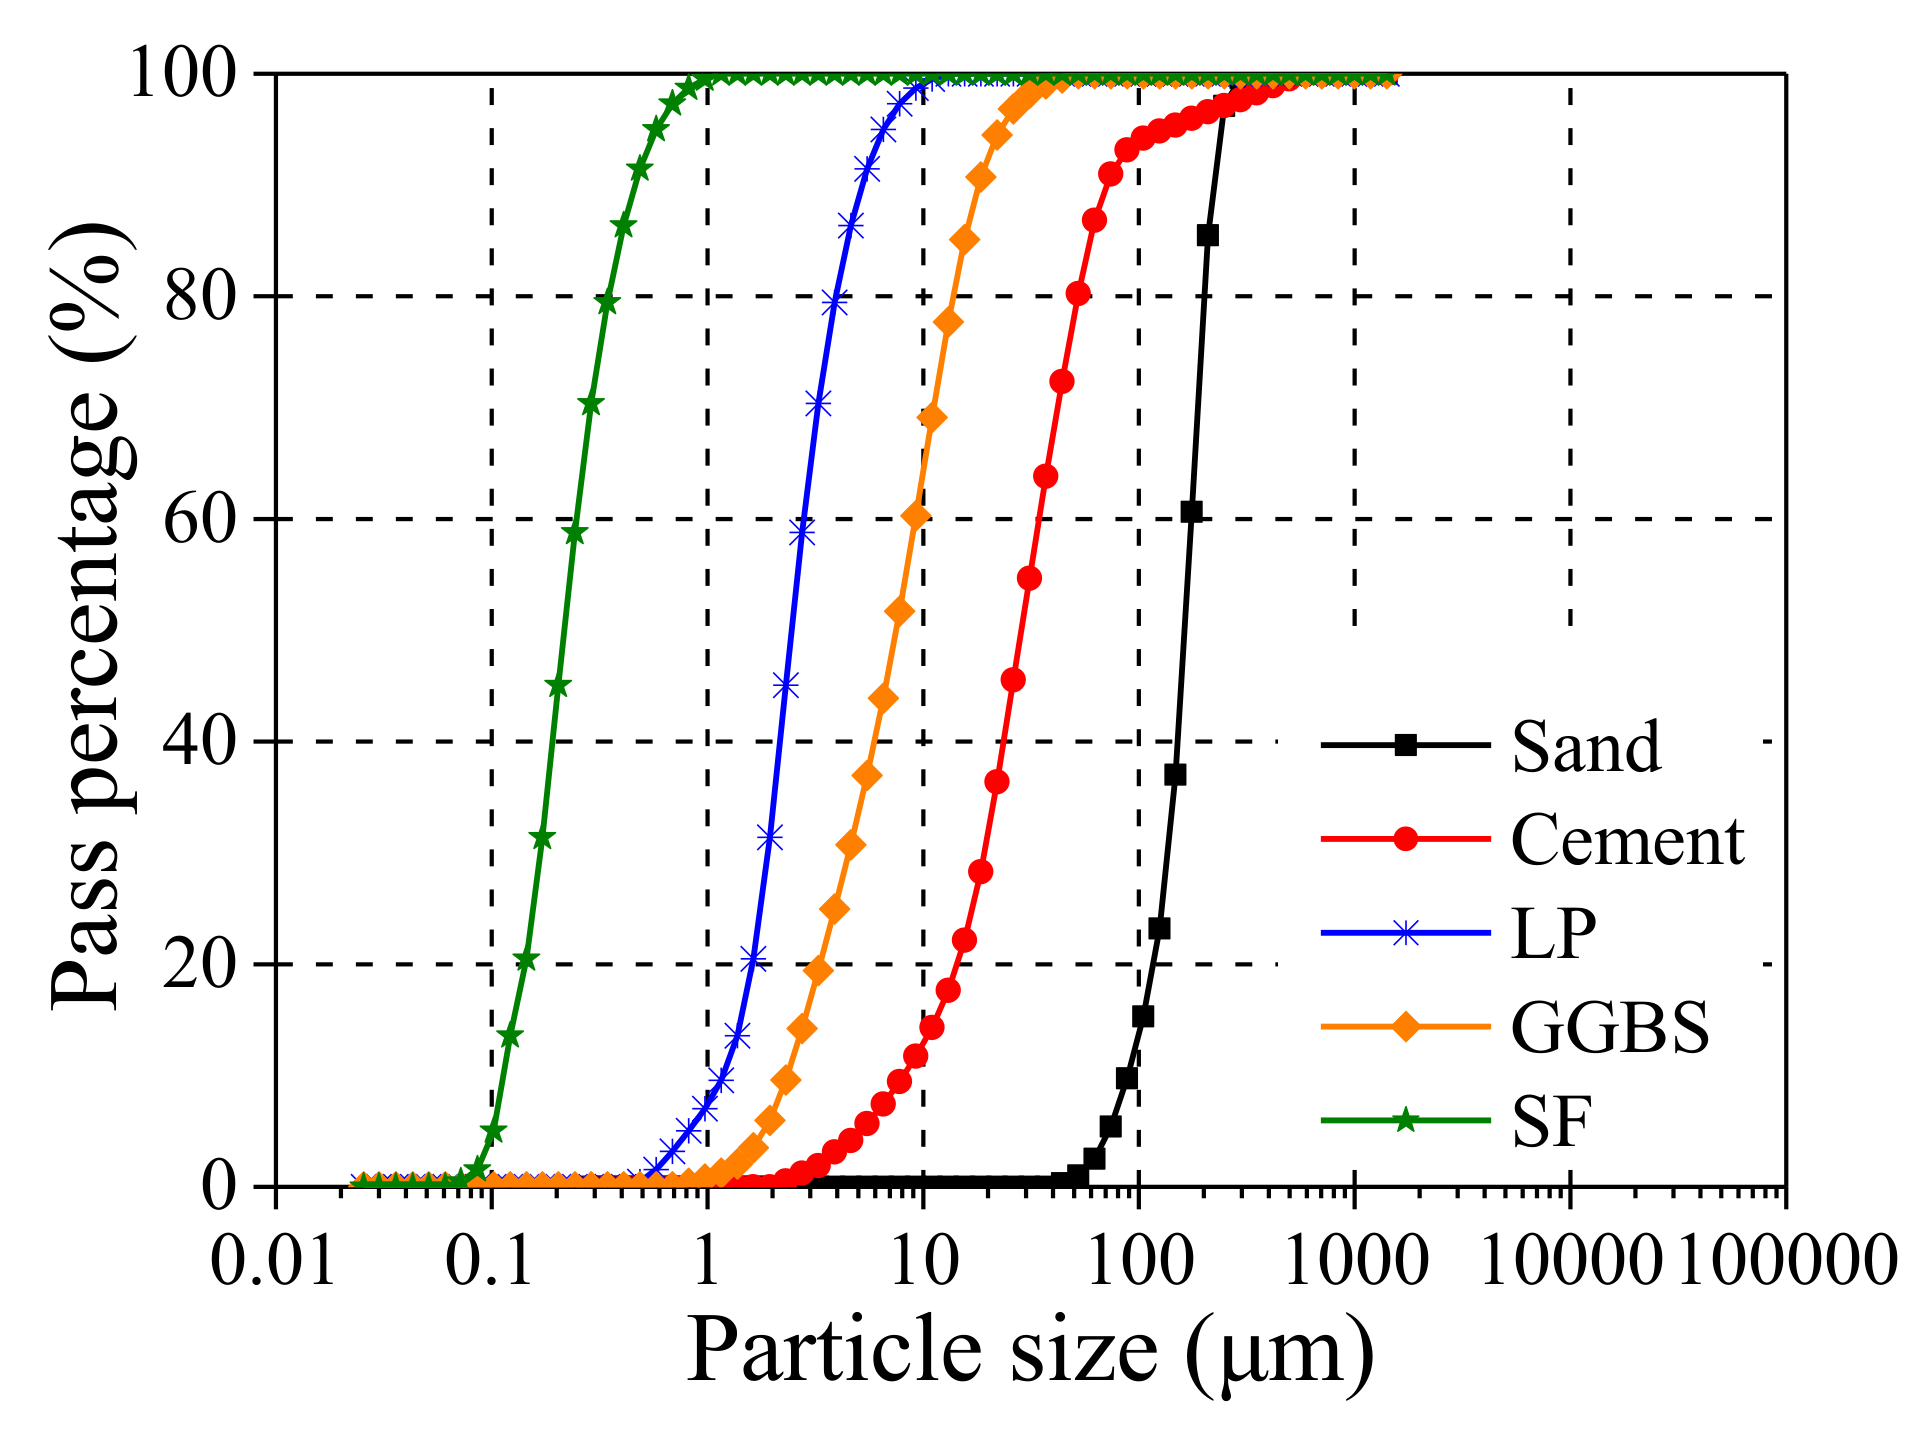
2.1. Raw Materials and Composition
2.2. Specimen Design
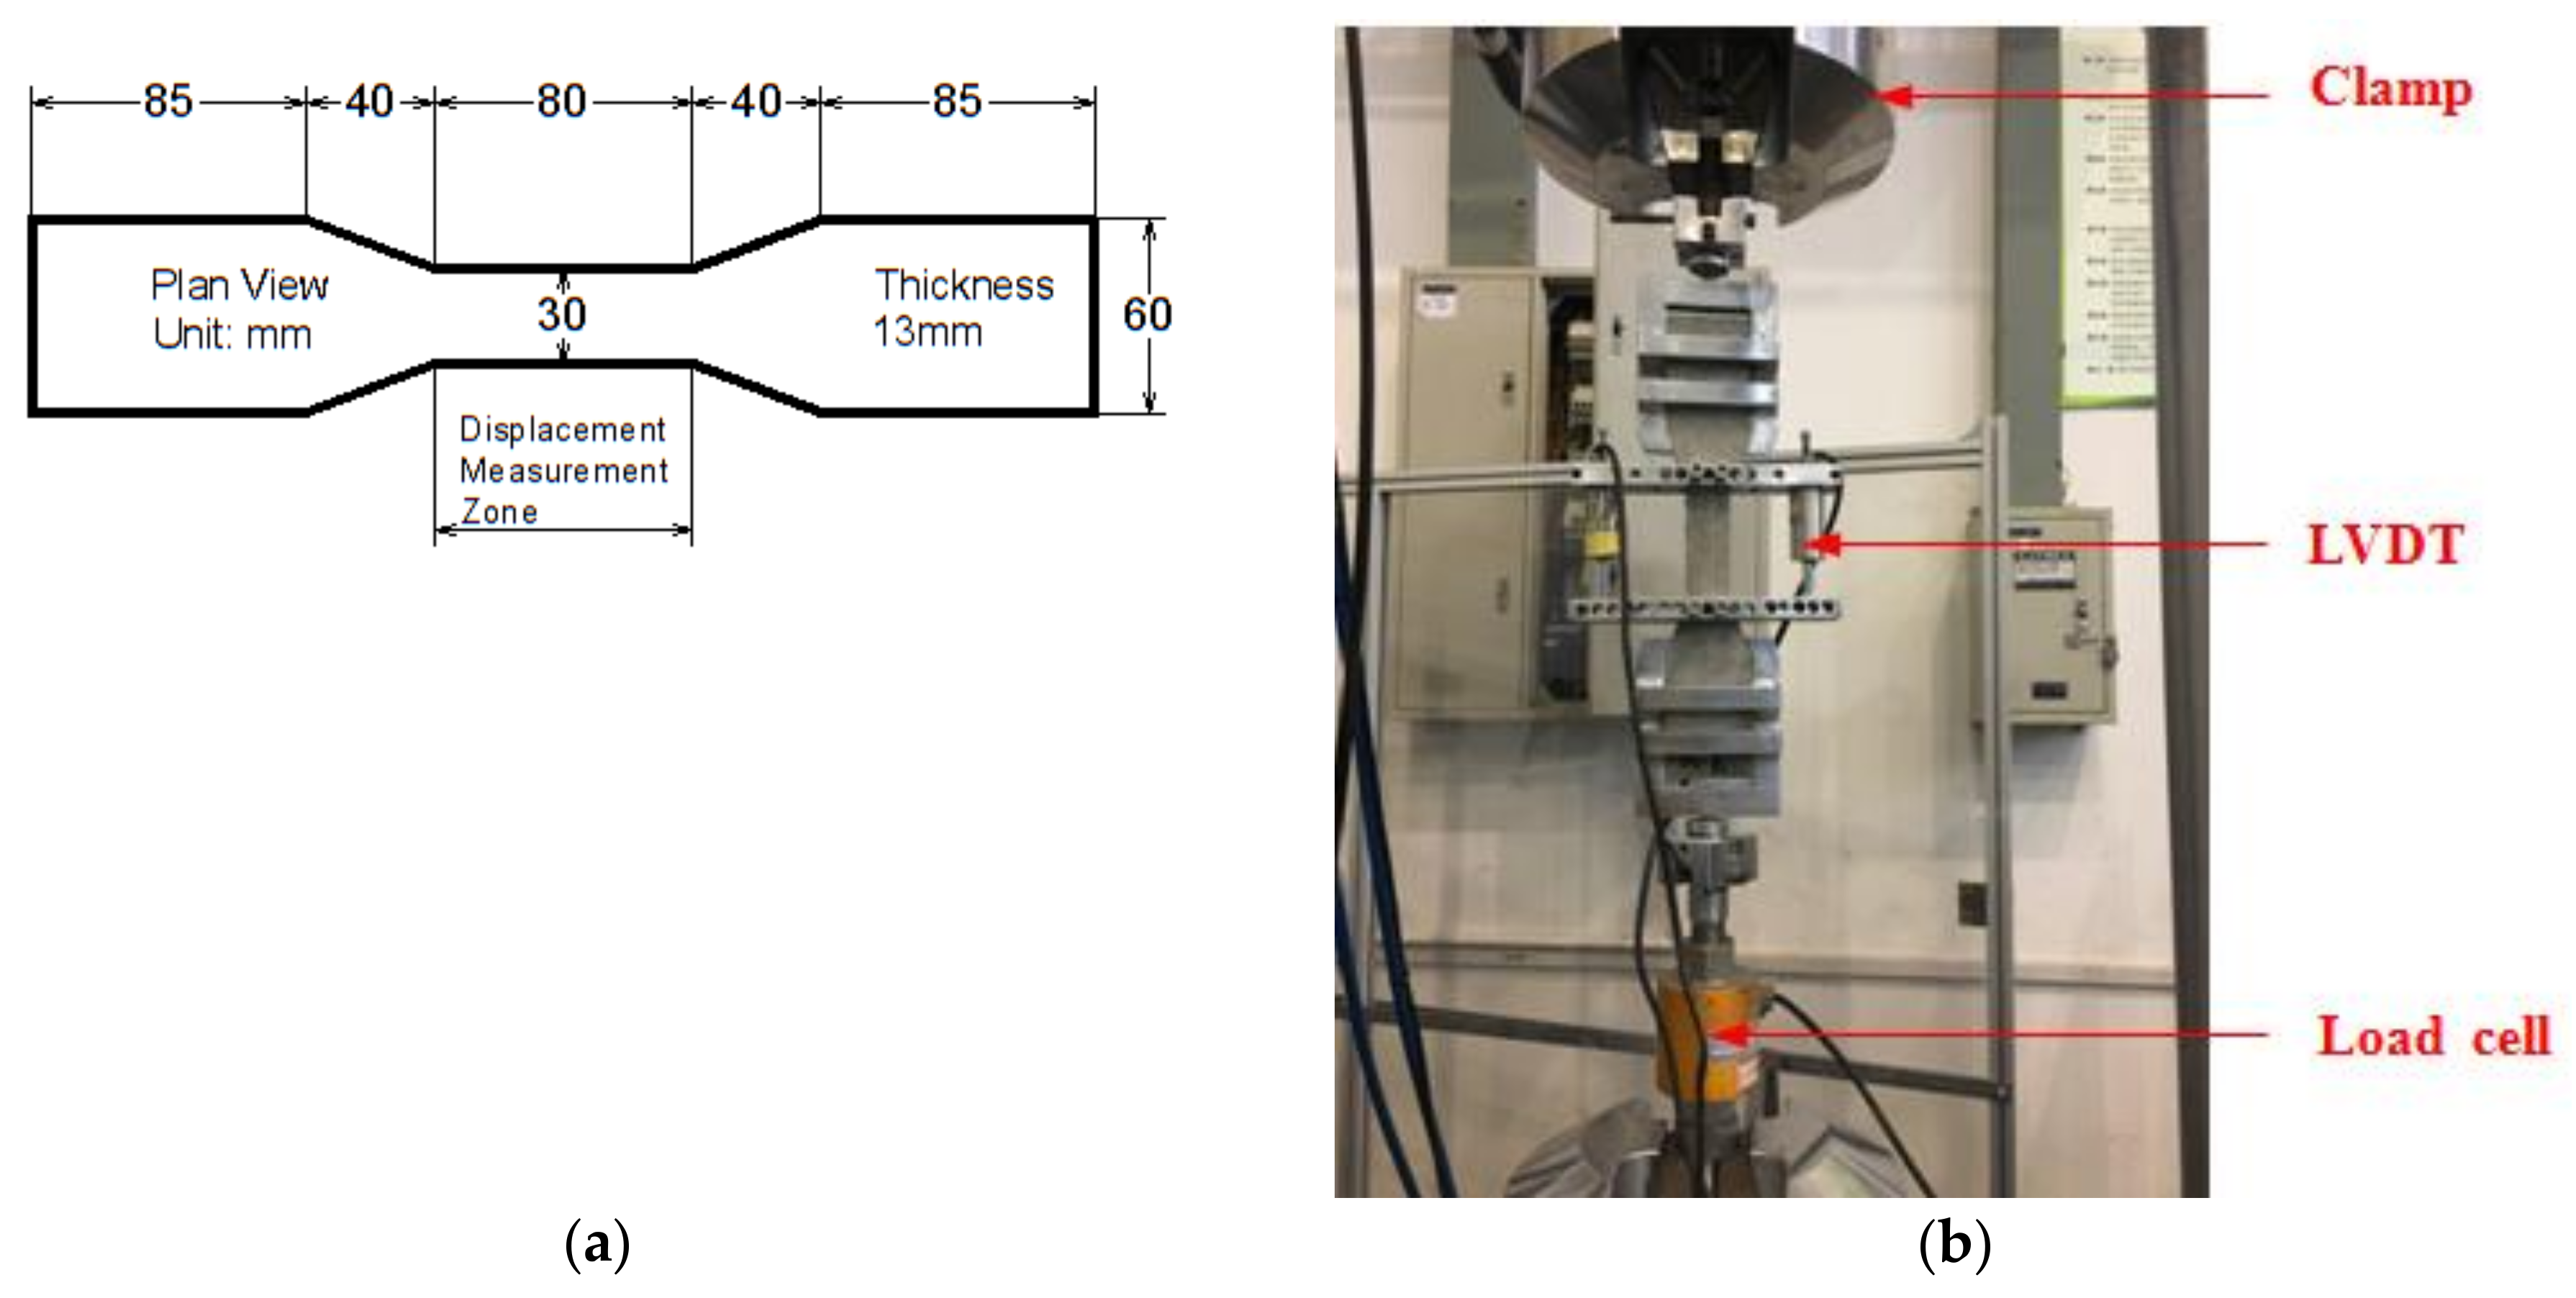
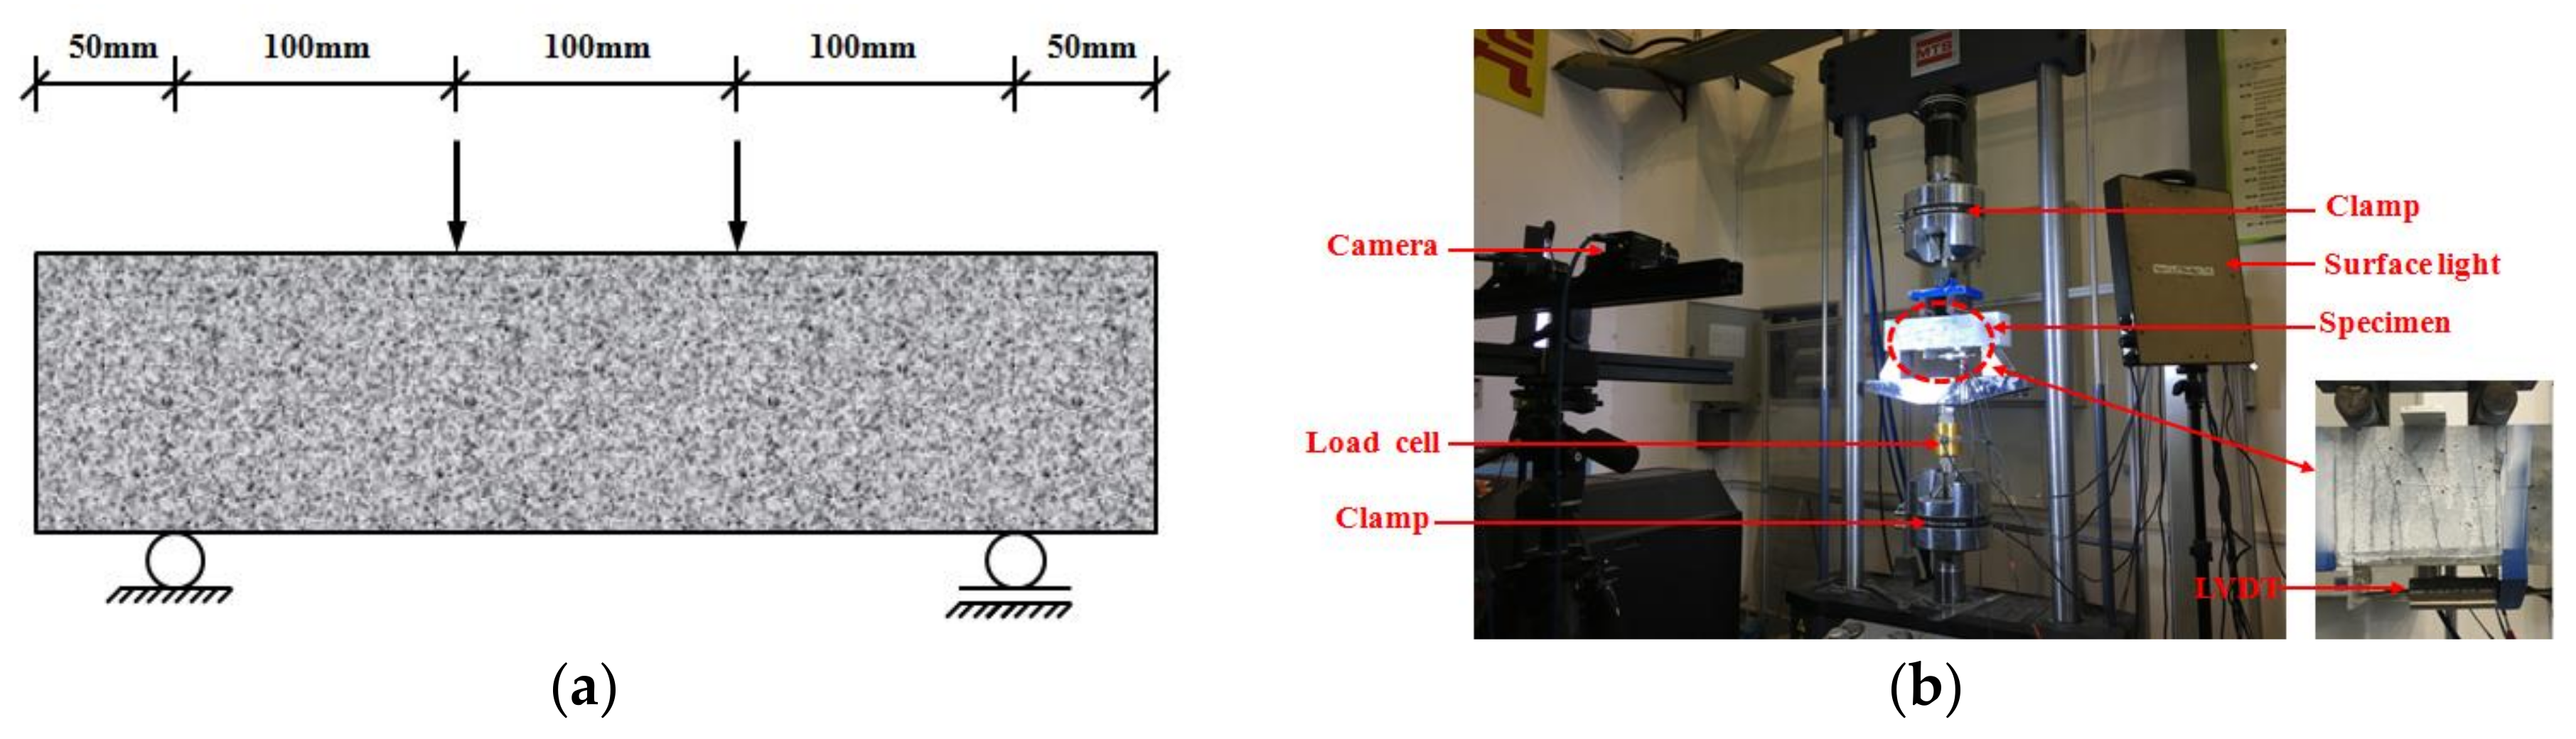
2.3. Load Setup and Measurement
2.4. Fatigue Loading Scheme
3. Results and Discussion
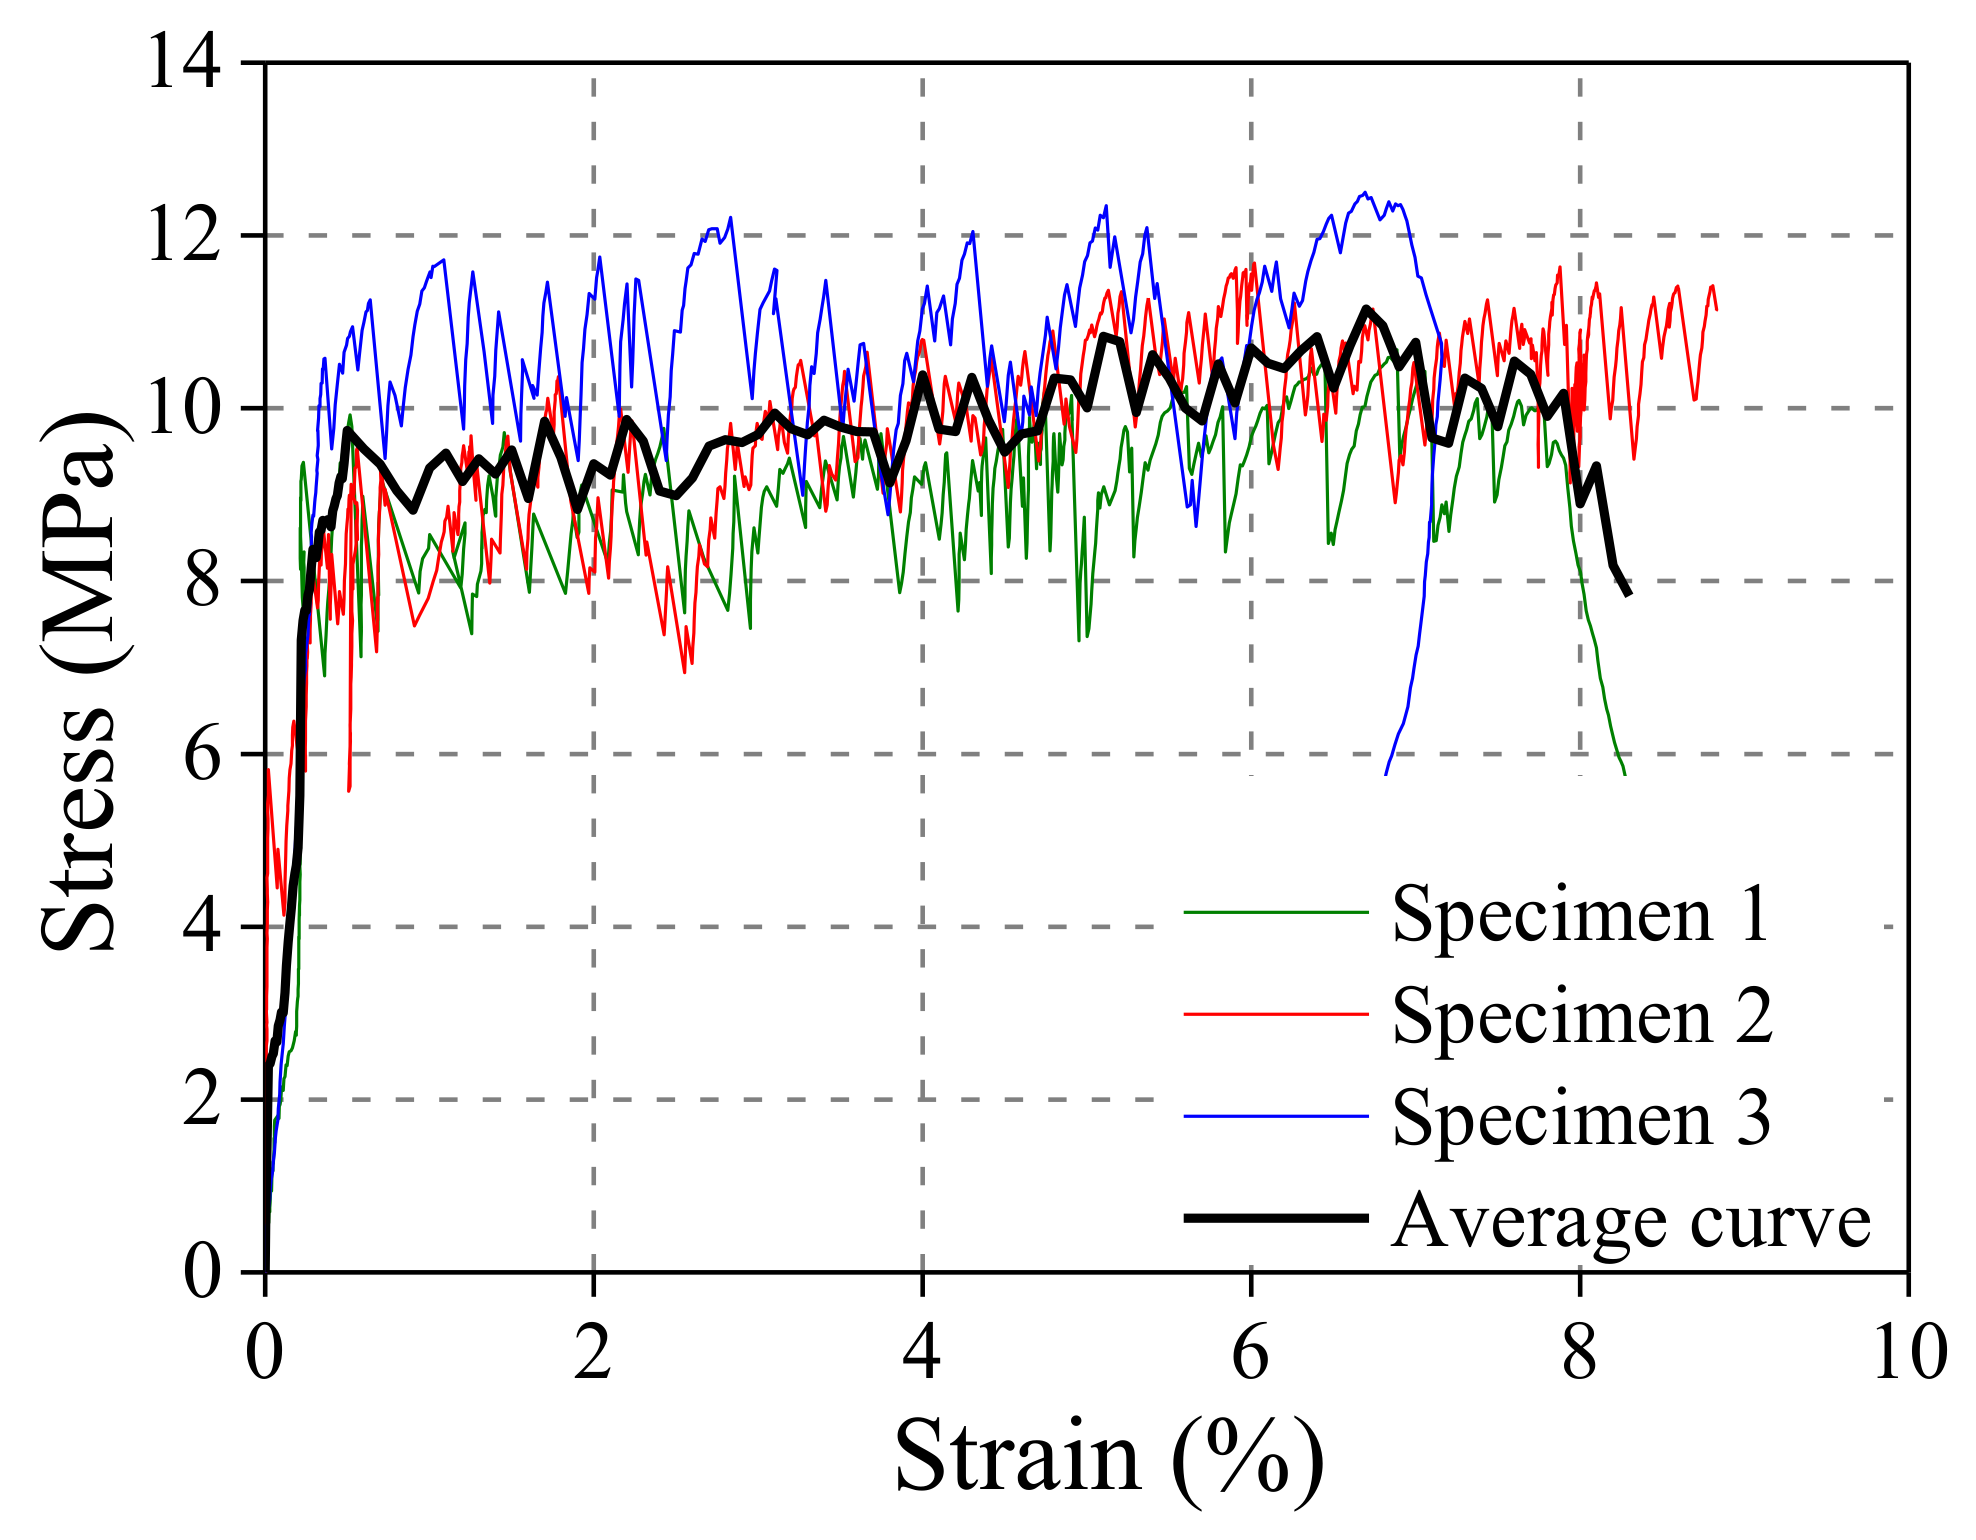
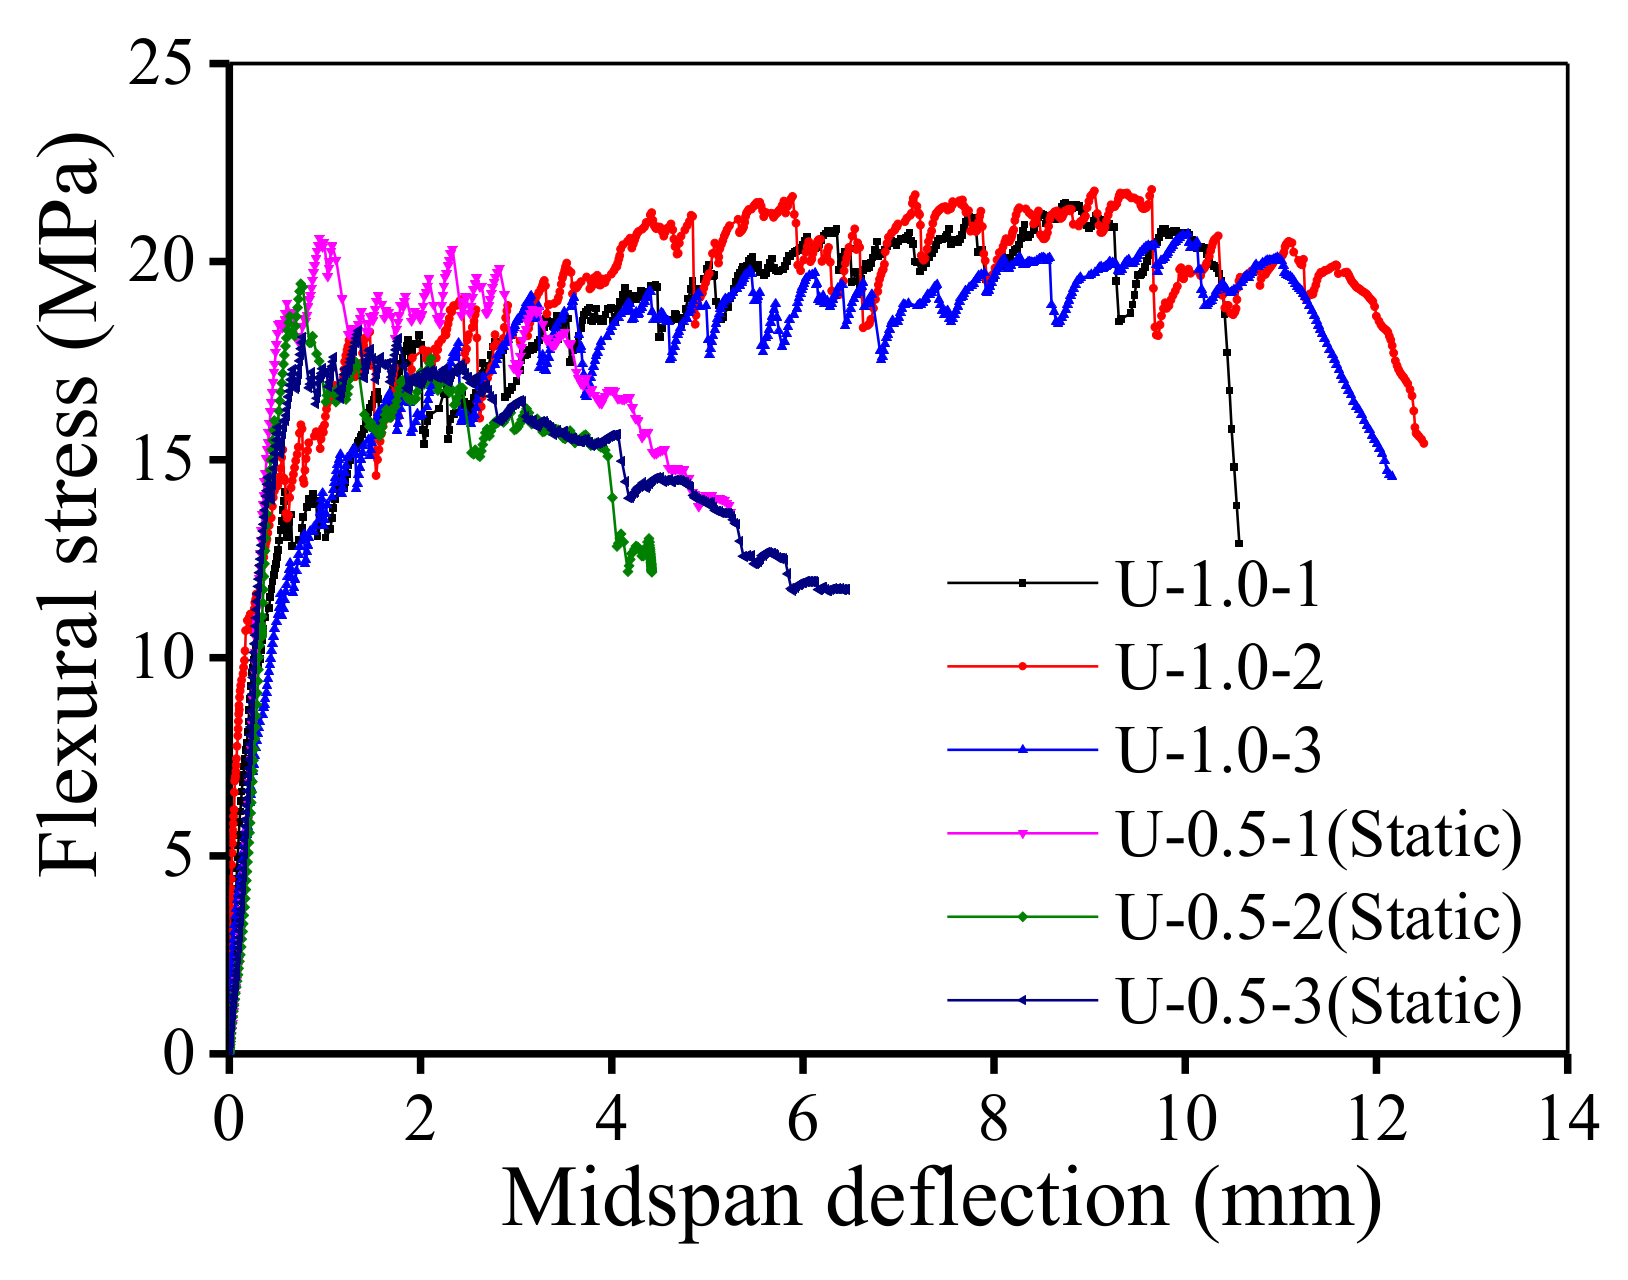
3.1. Static Loading Test
3.2. Fatigue Testing
3.2.1. Failure Modes
3.2.2. Deformation Characteristics
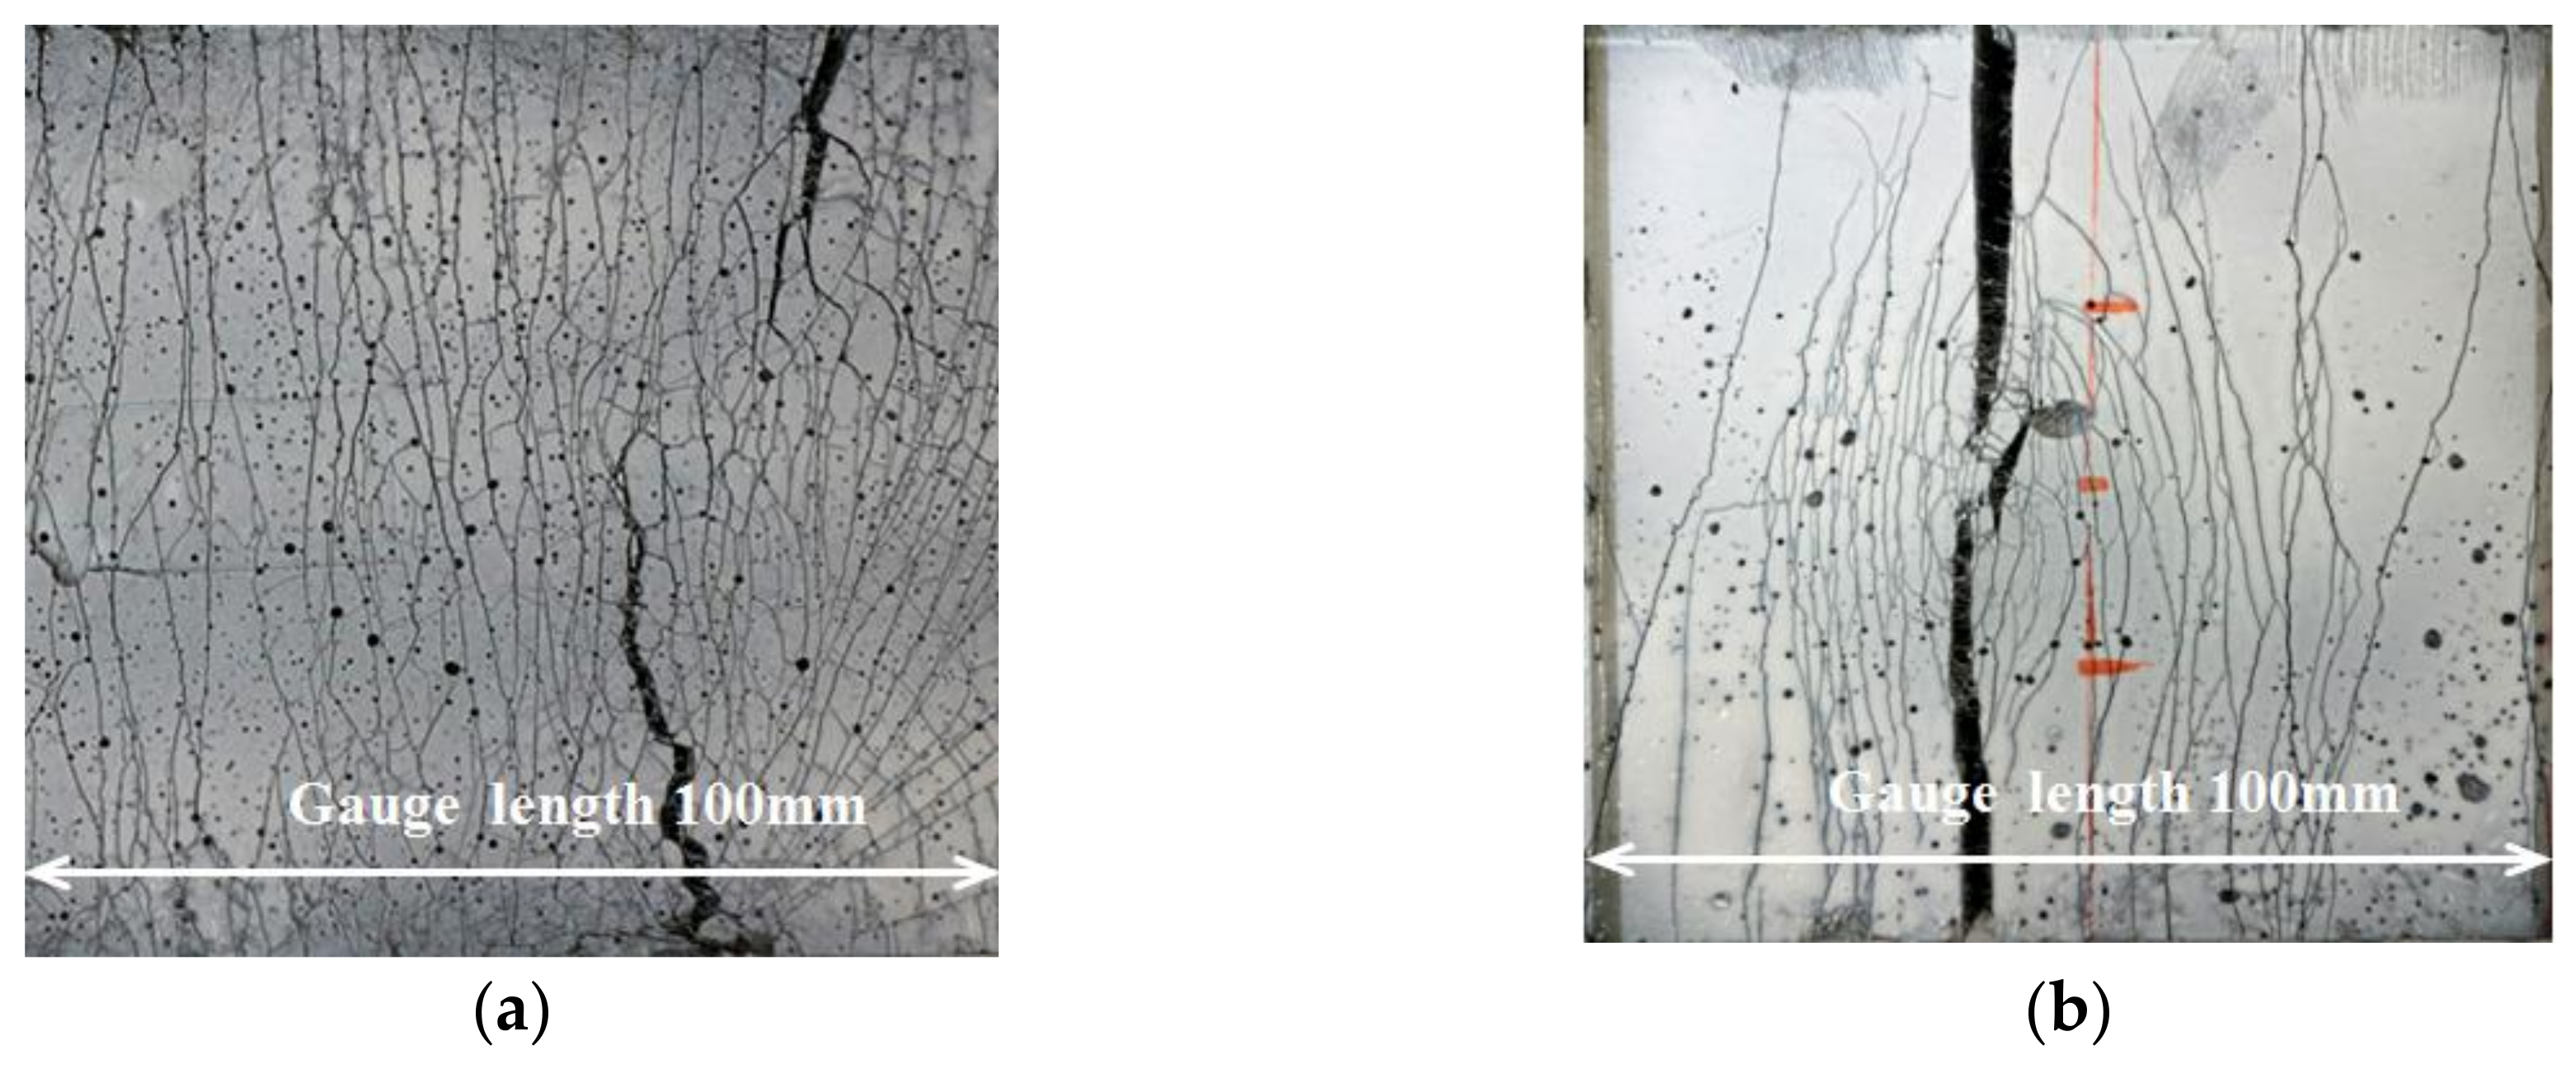
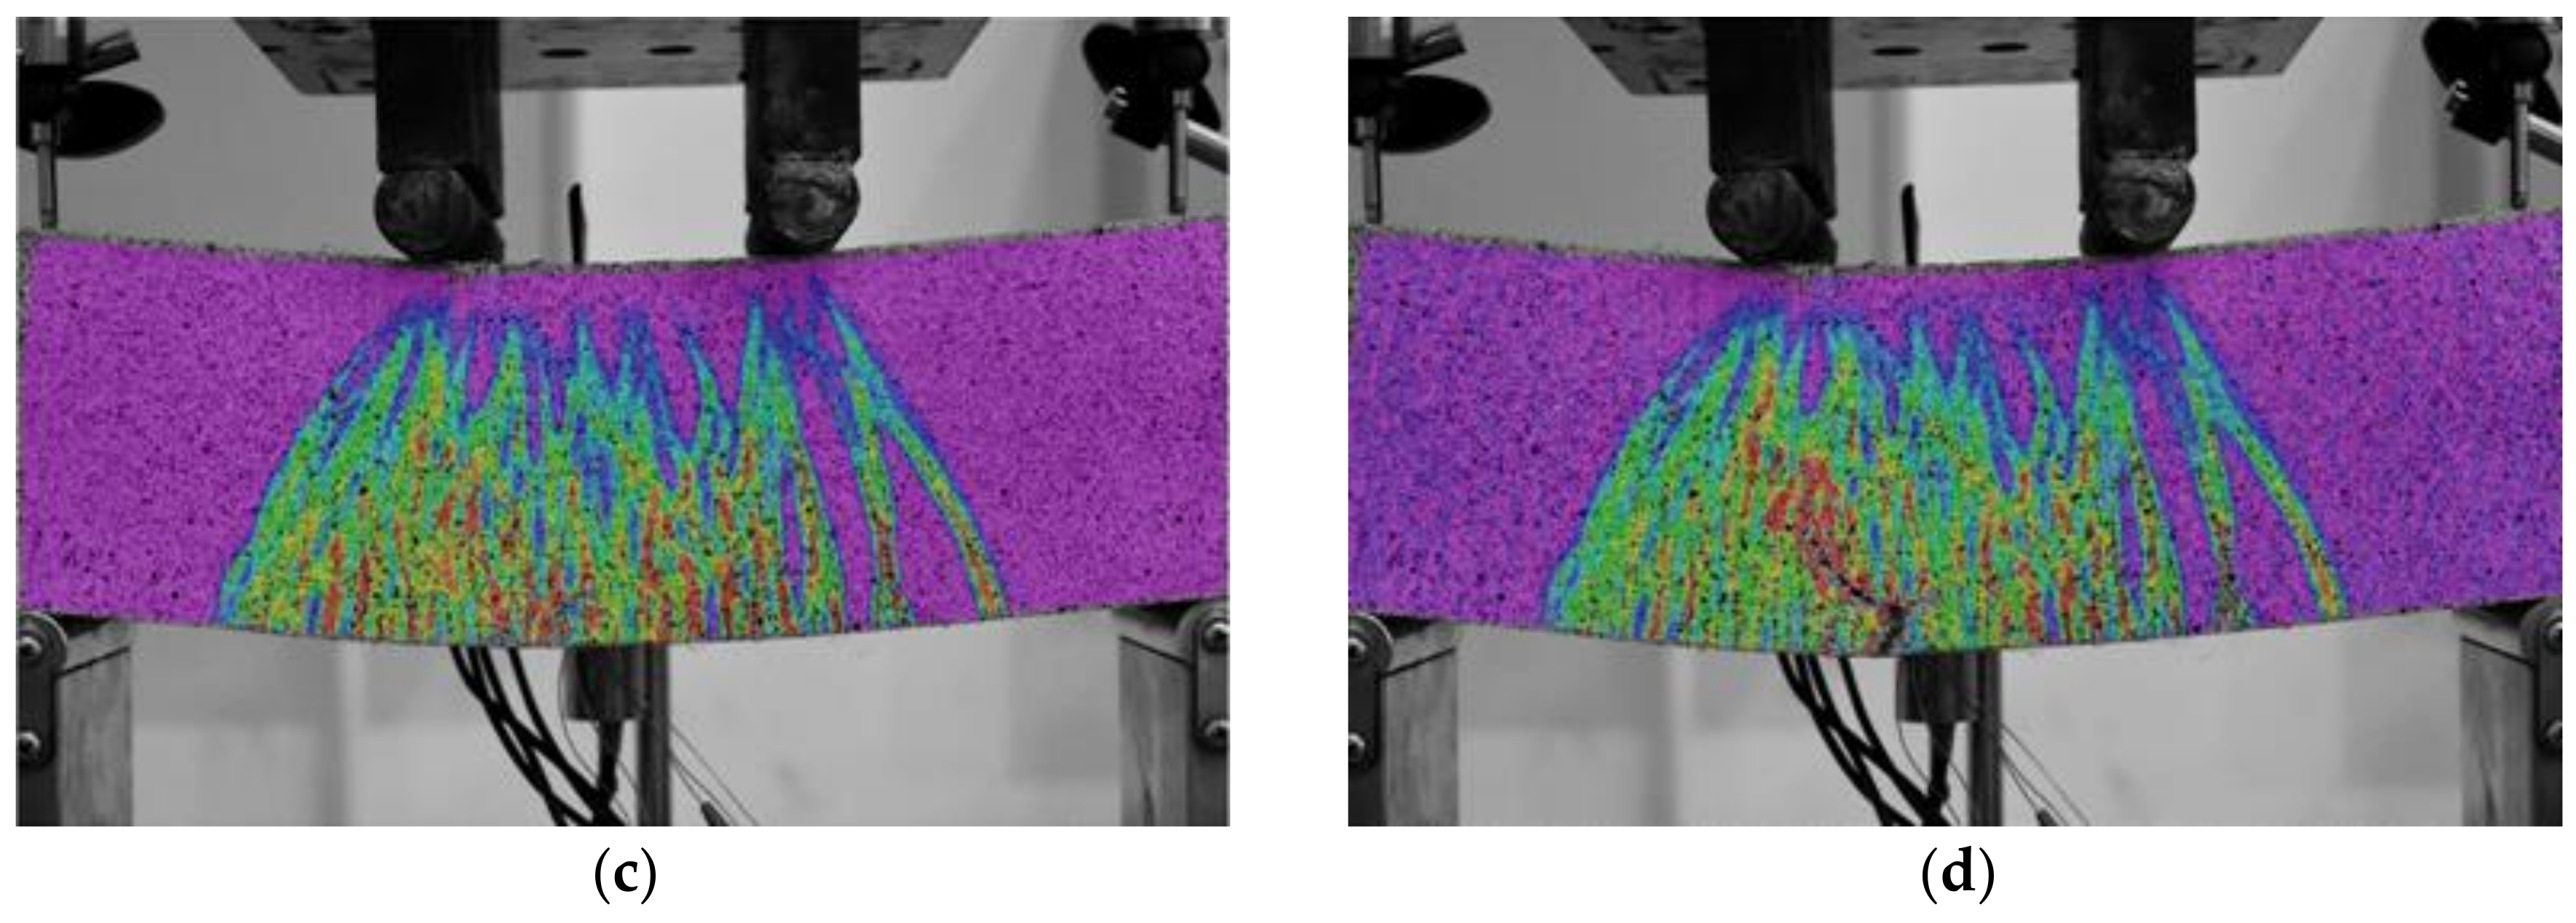
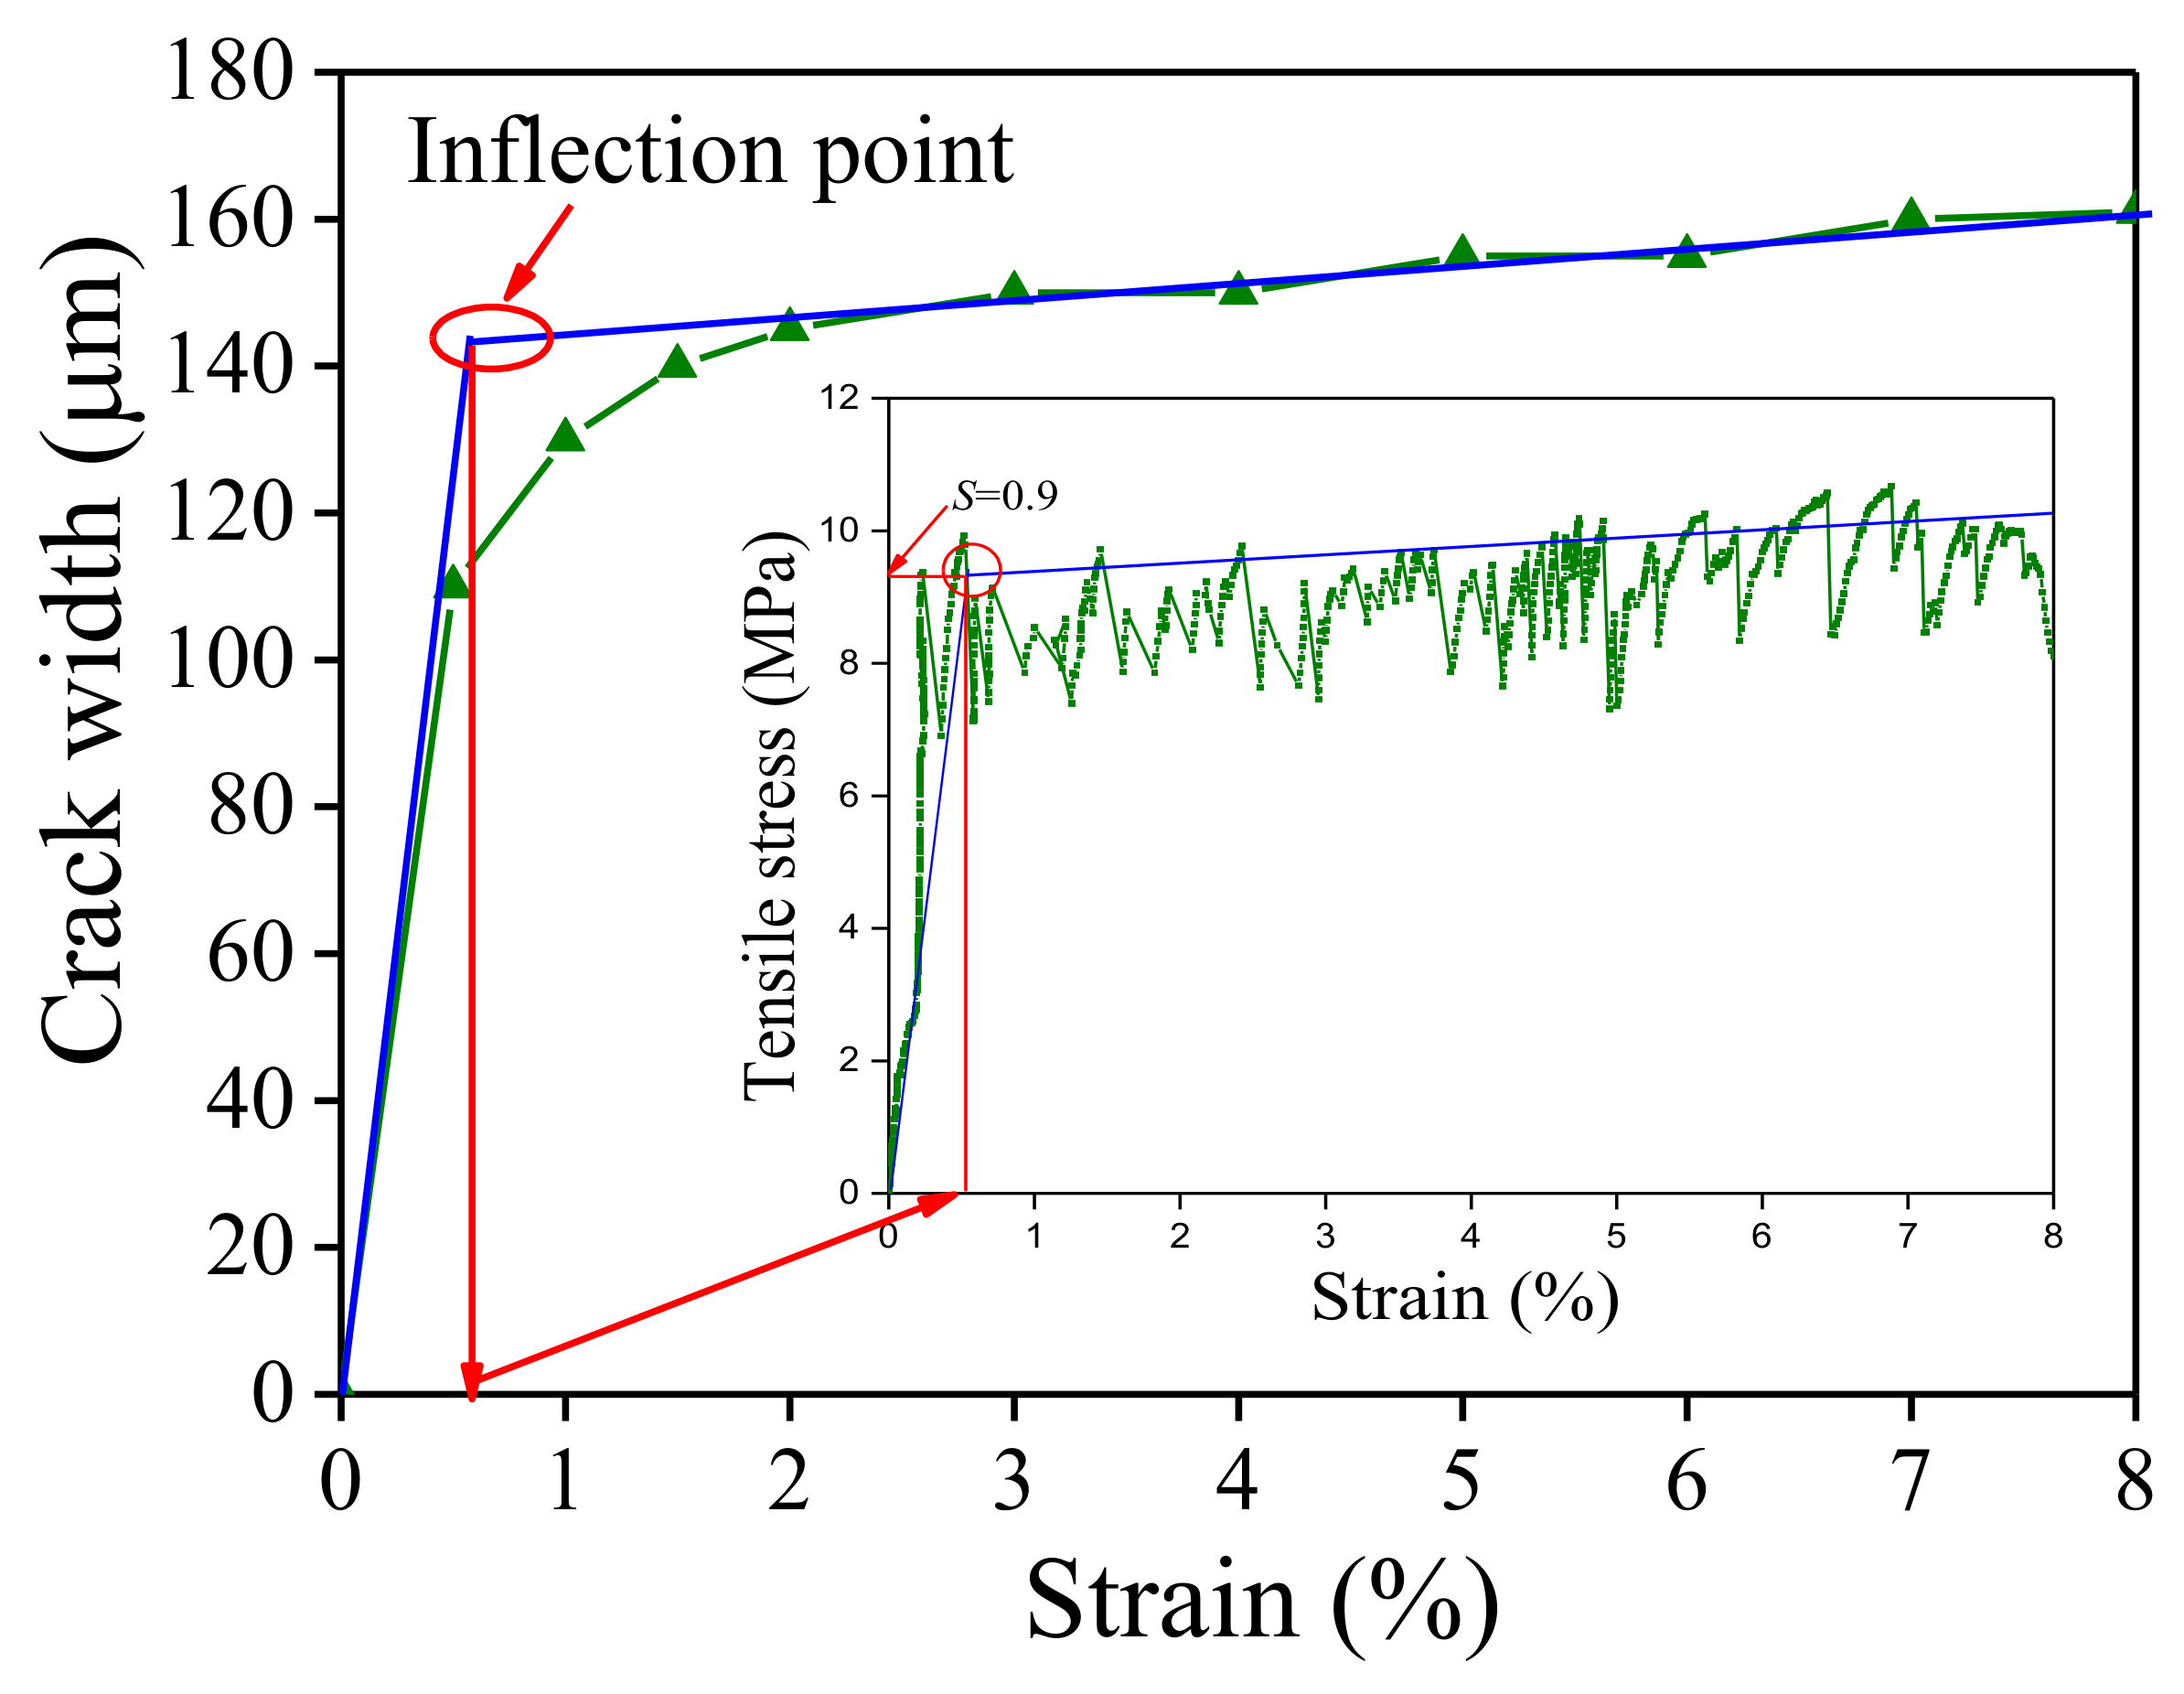
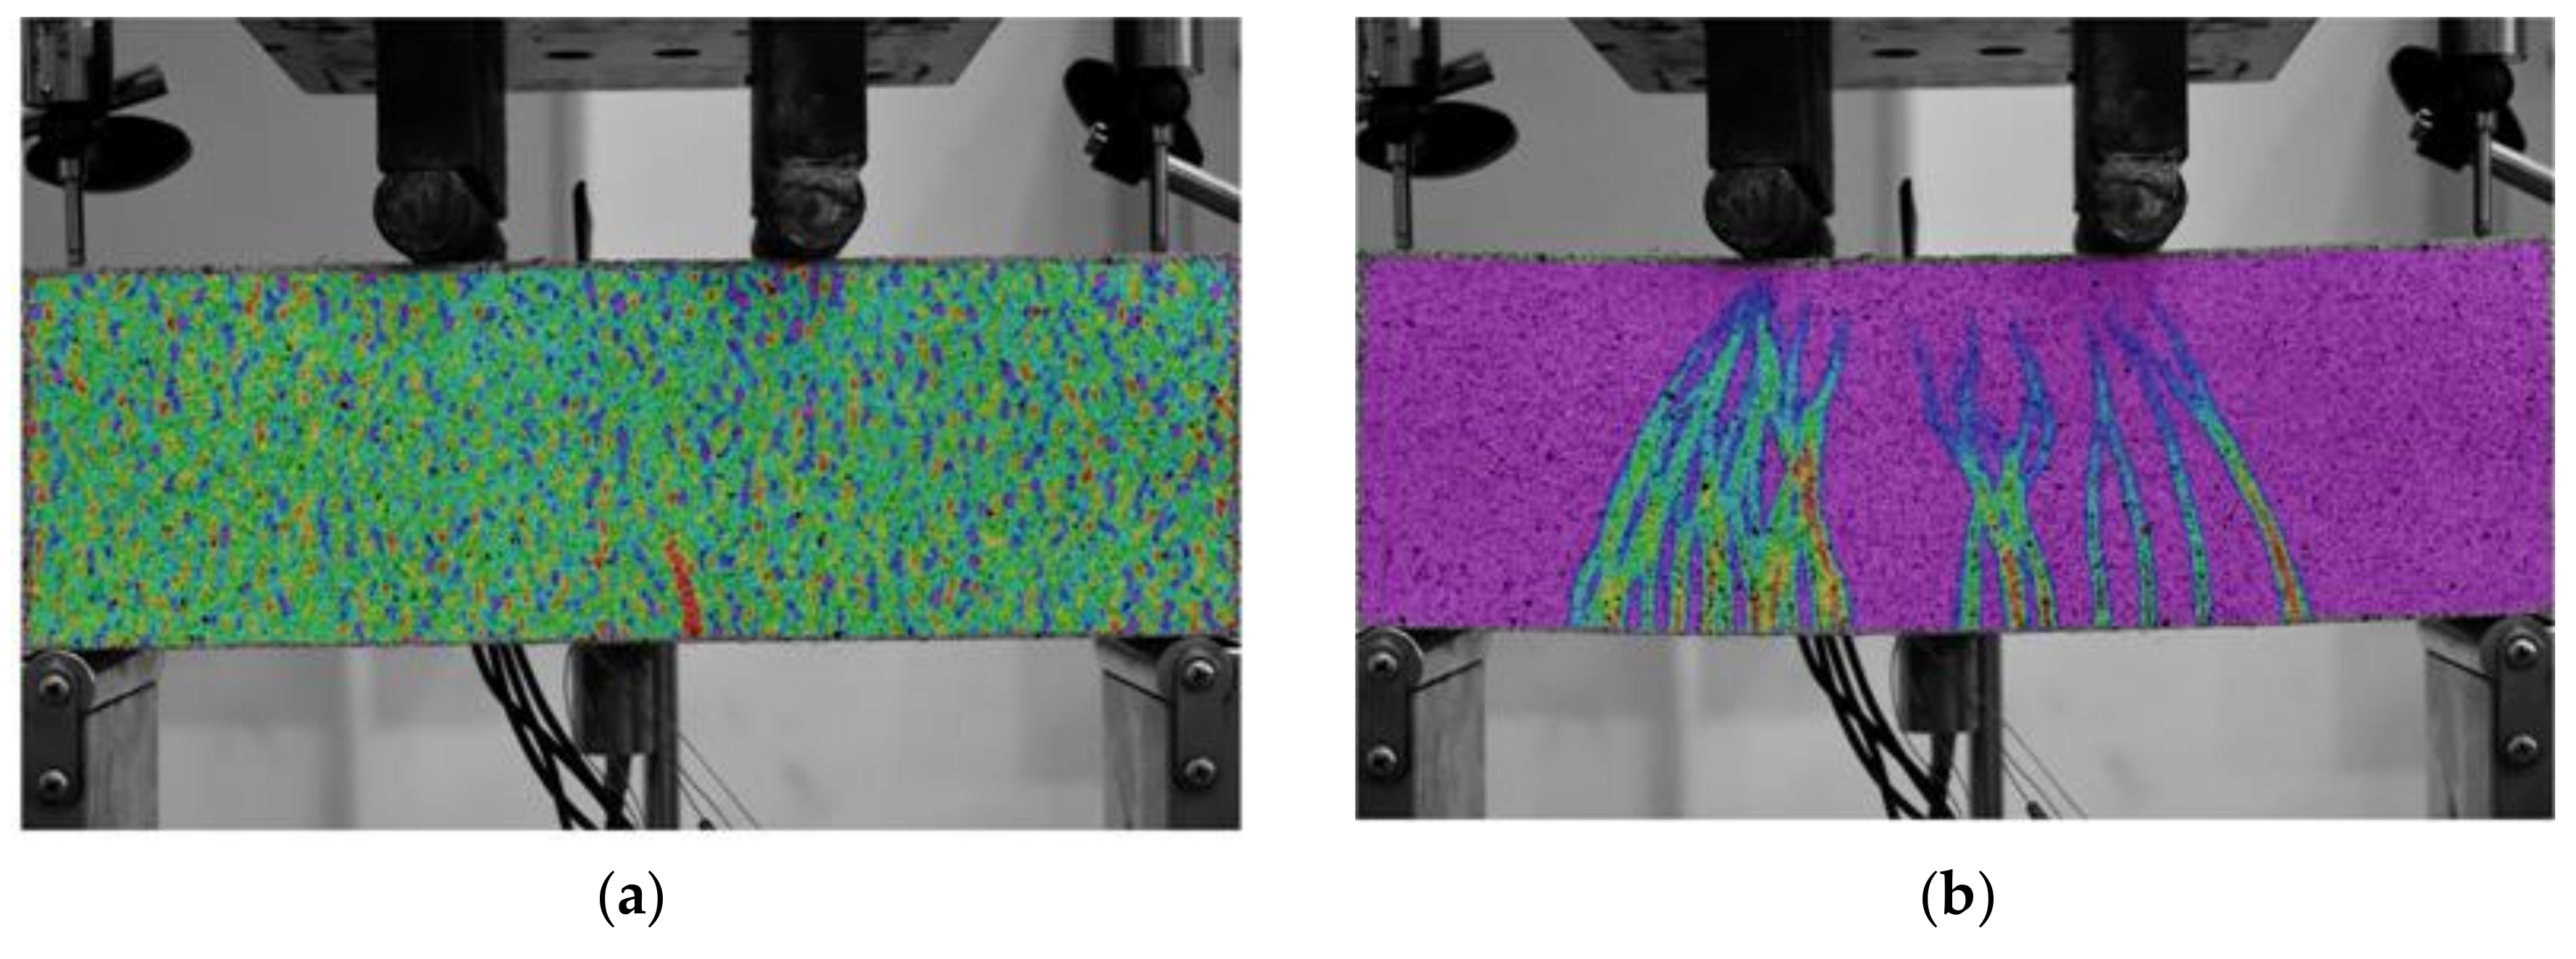
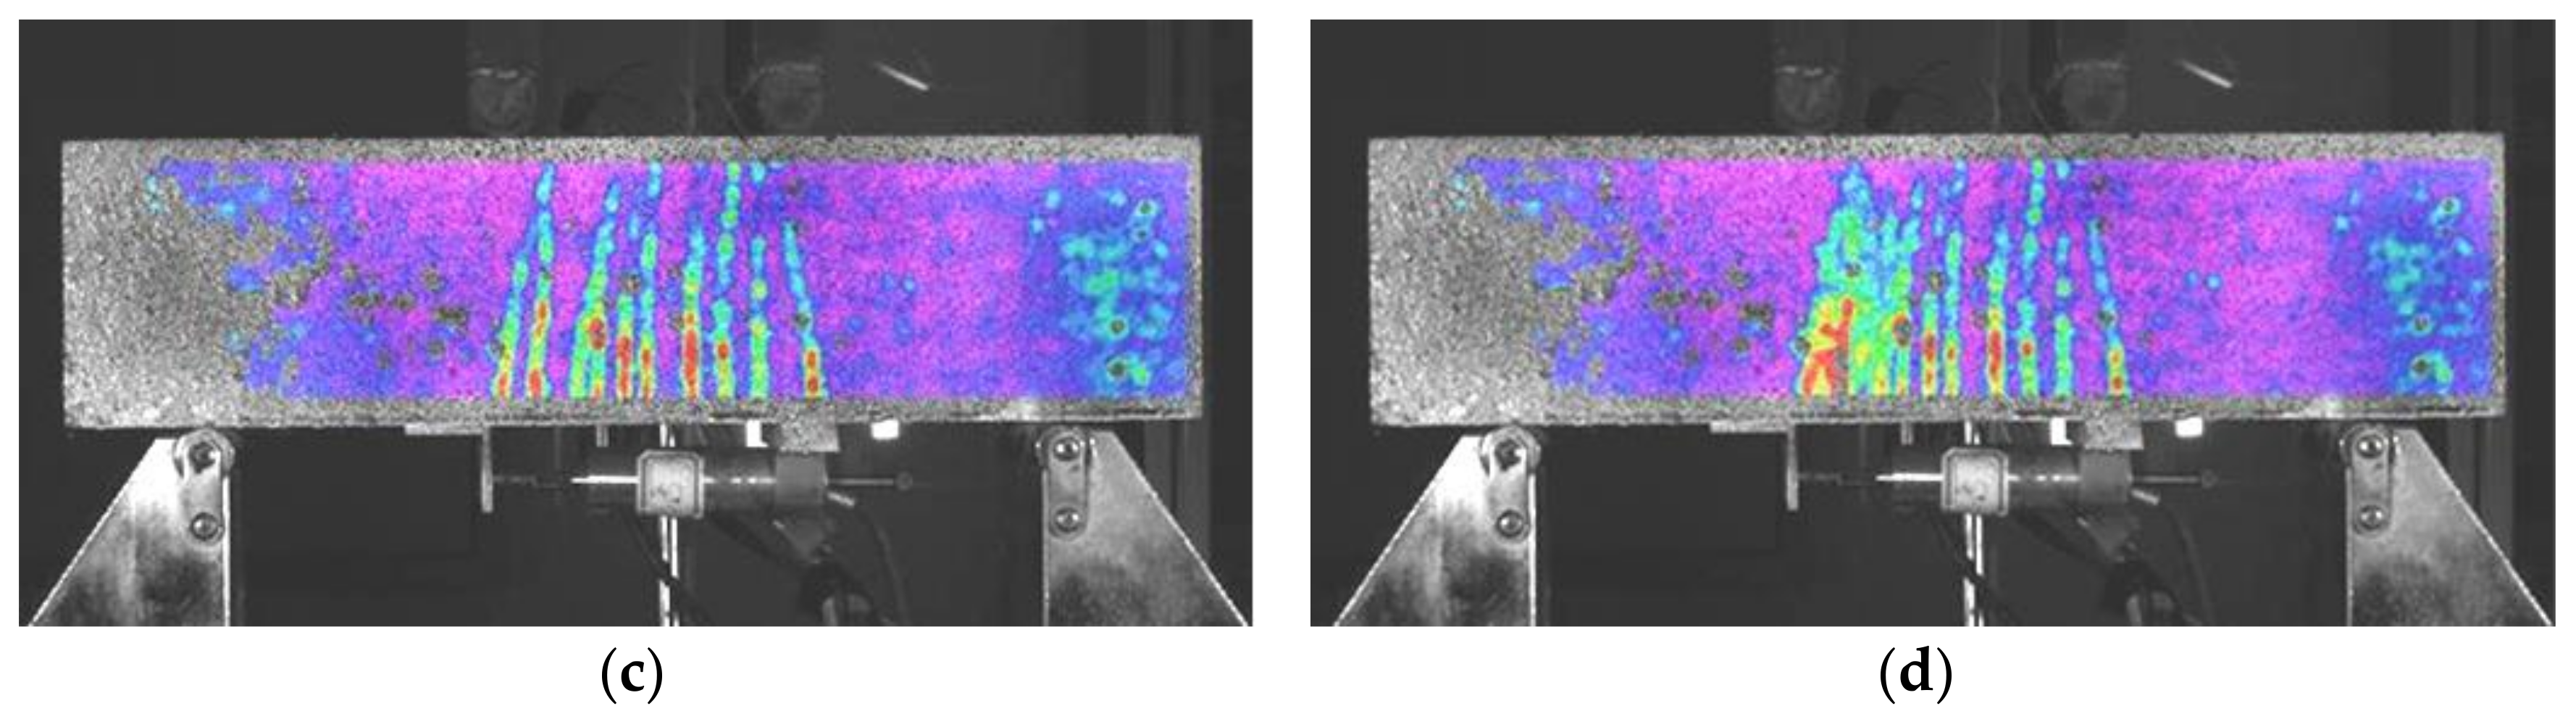
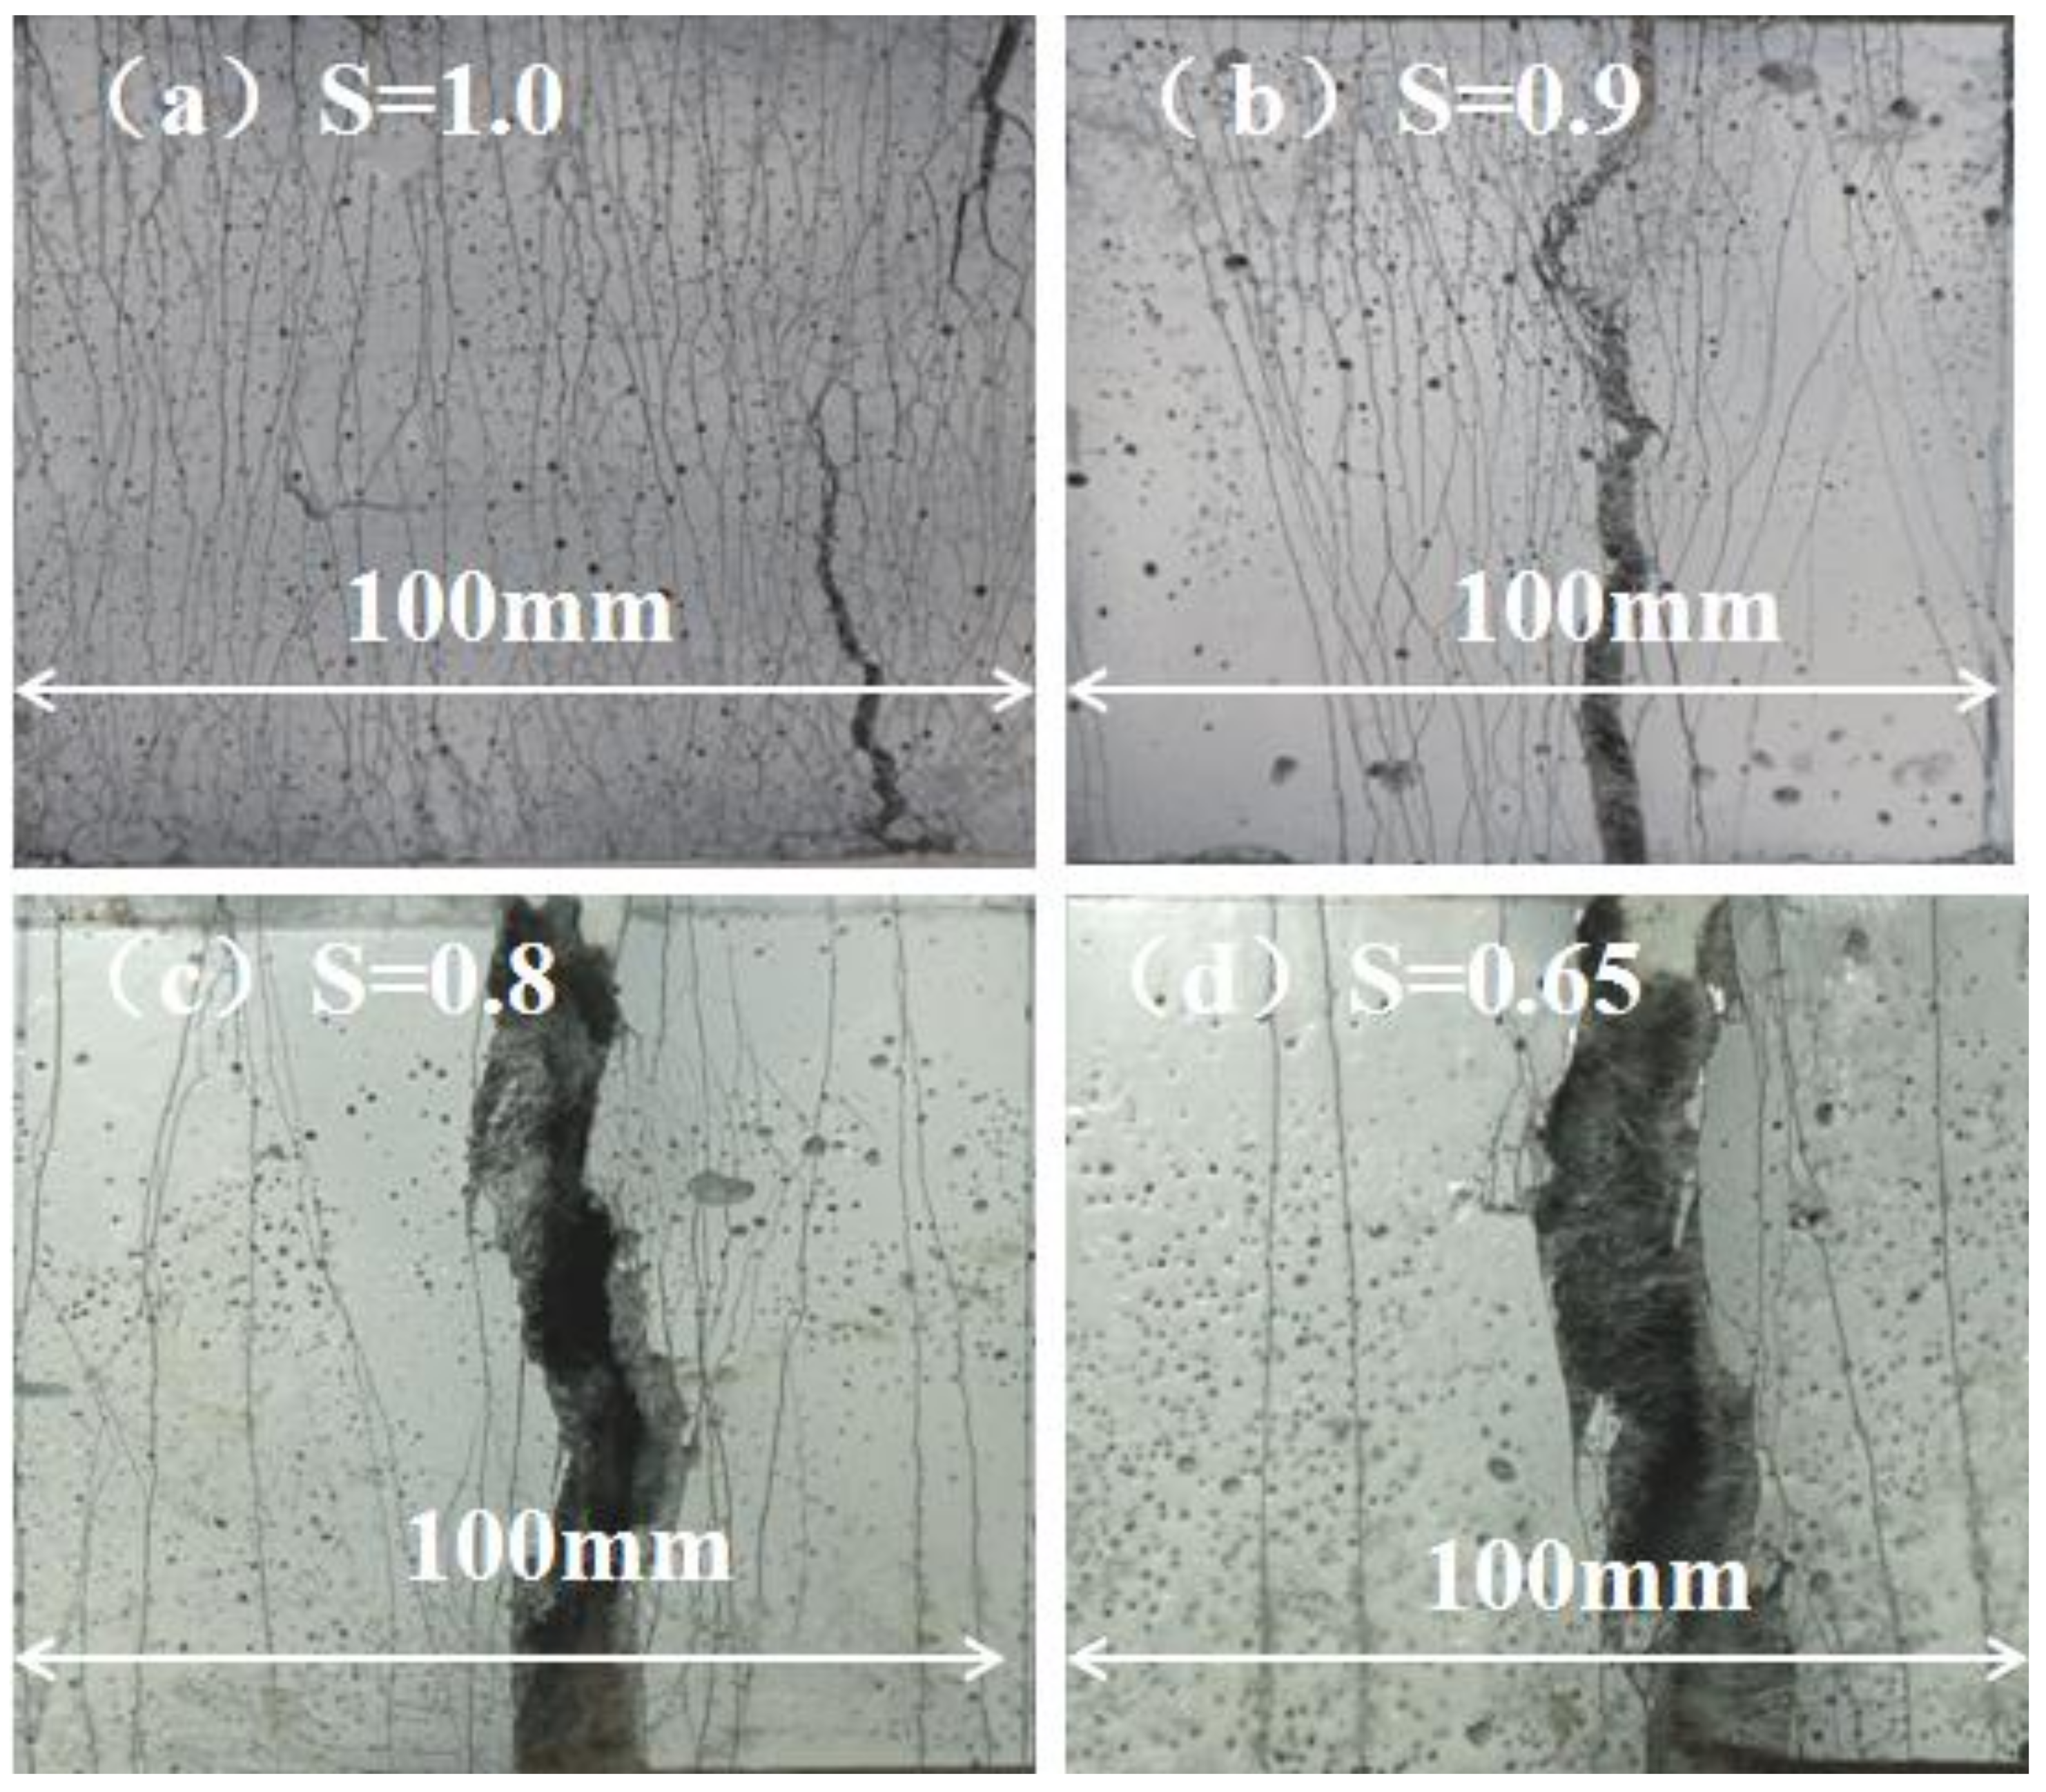
3.2.3. Crack Observation
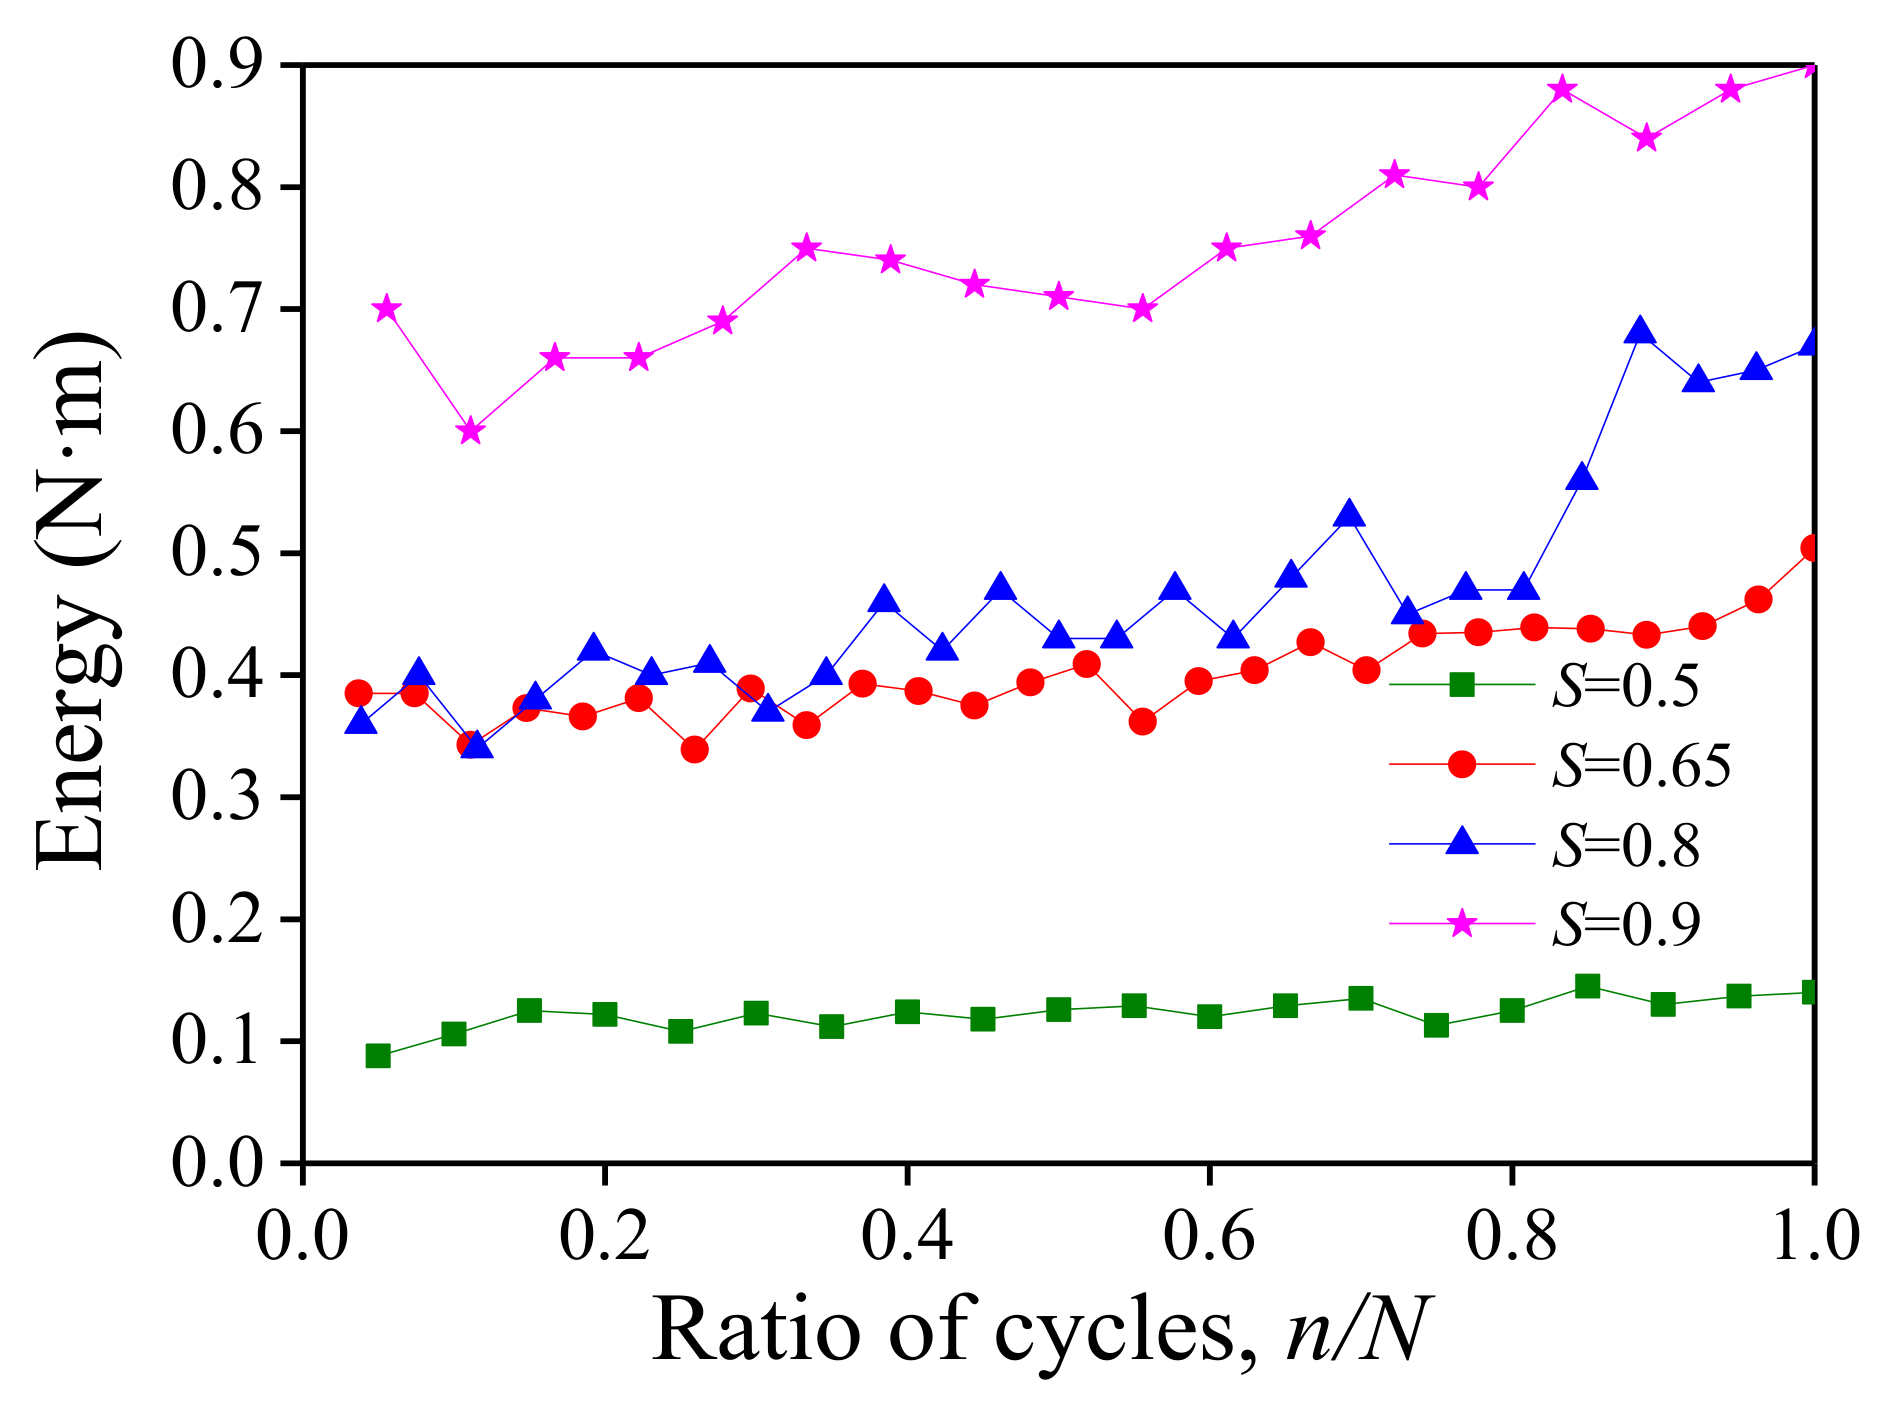
3.2.4. Energy Dissipation
4. Fatigue Life Models
5. Conclusions
- (1)
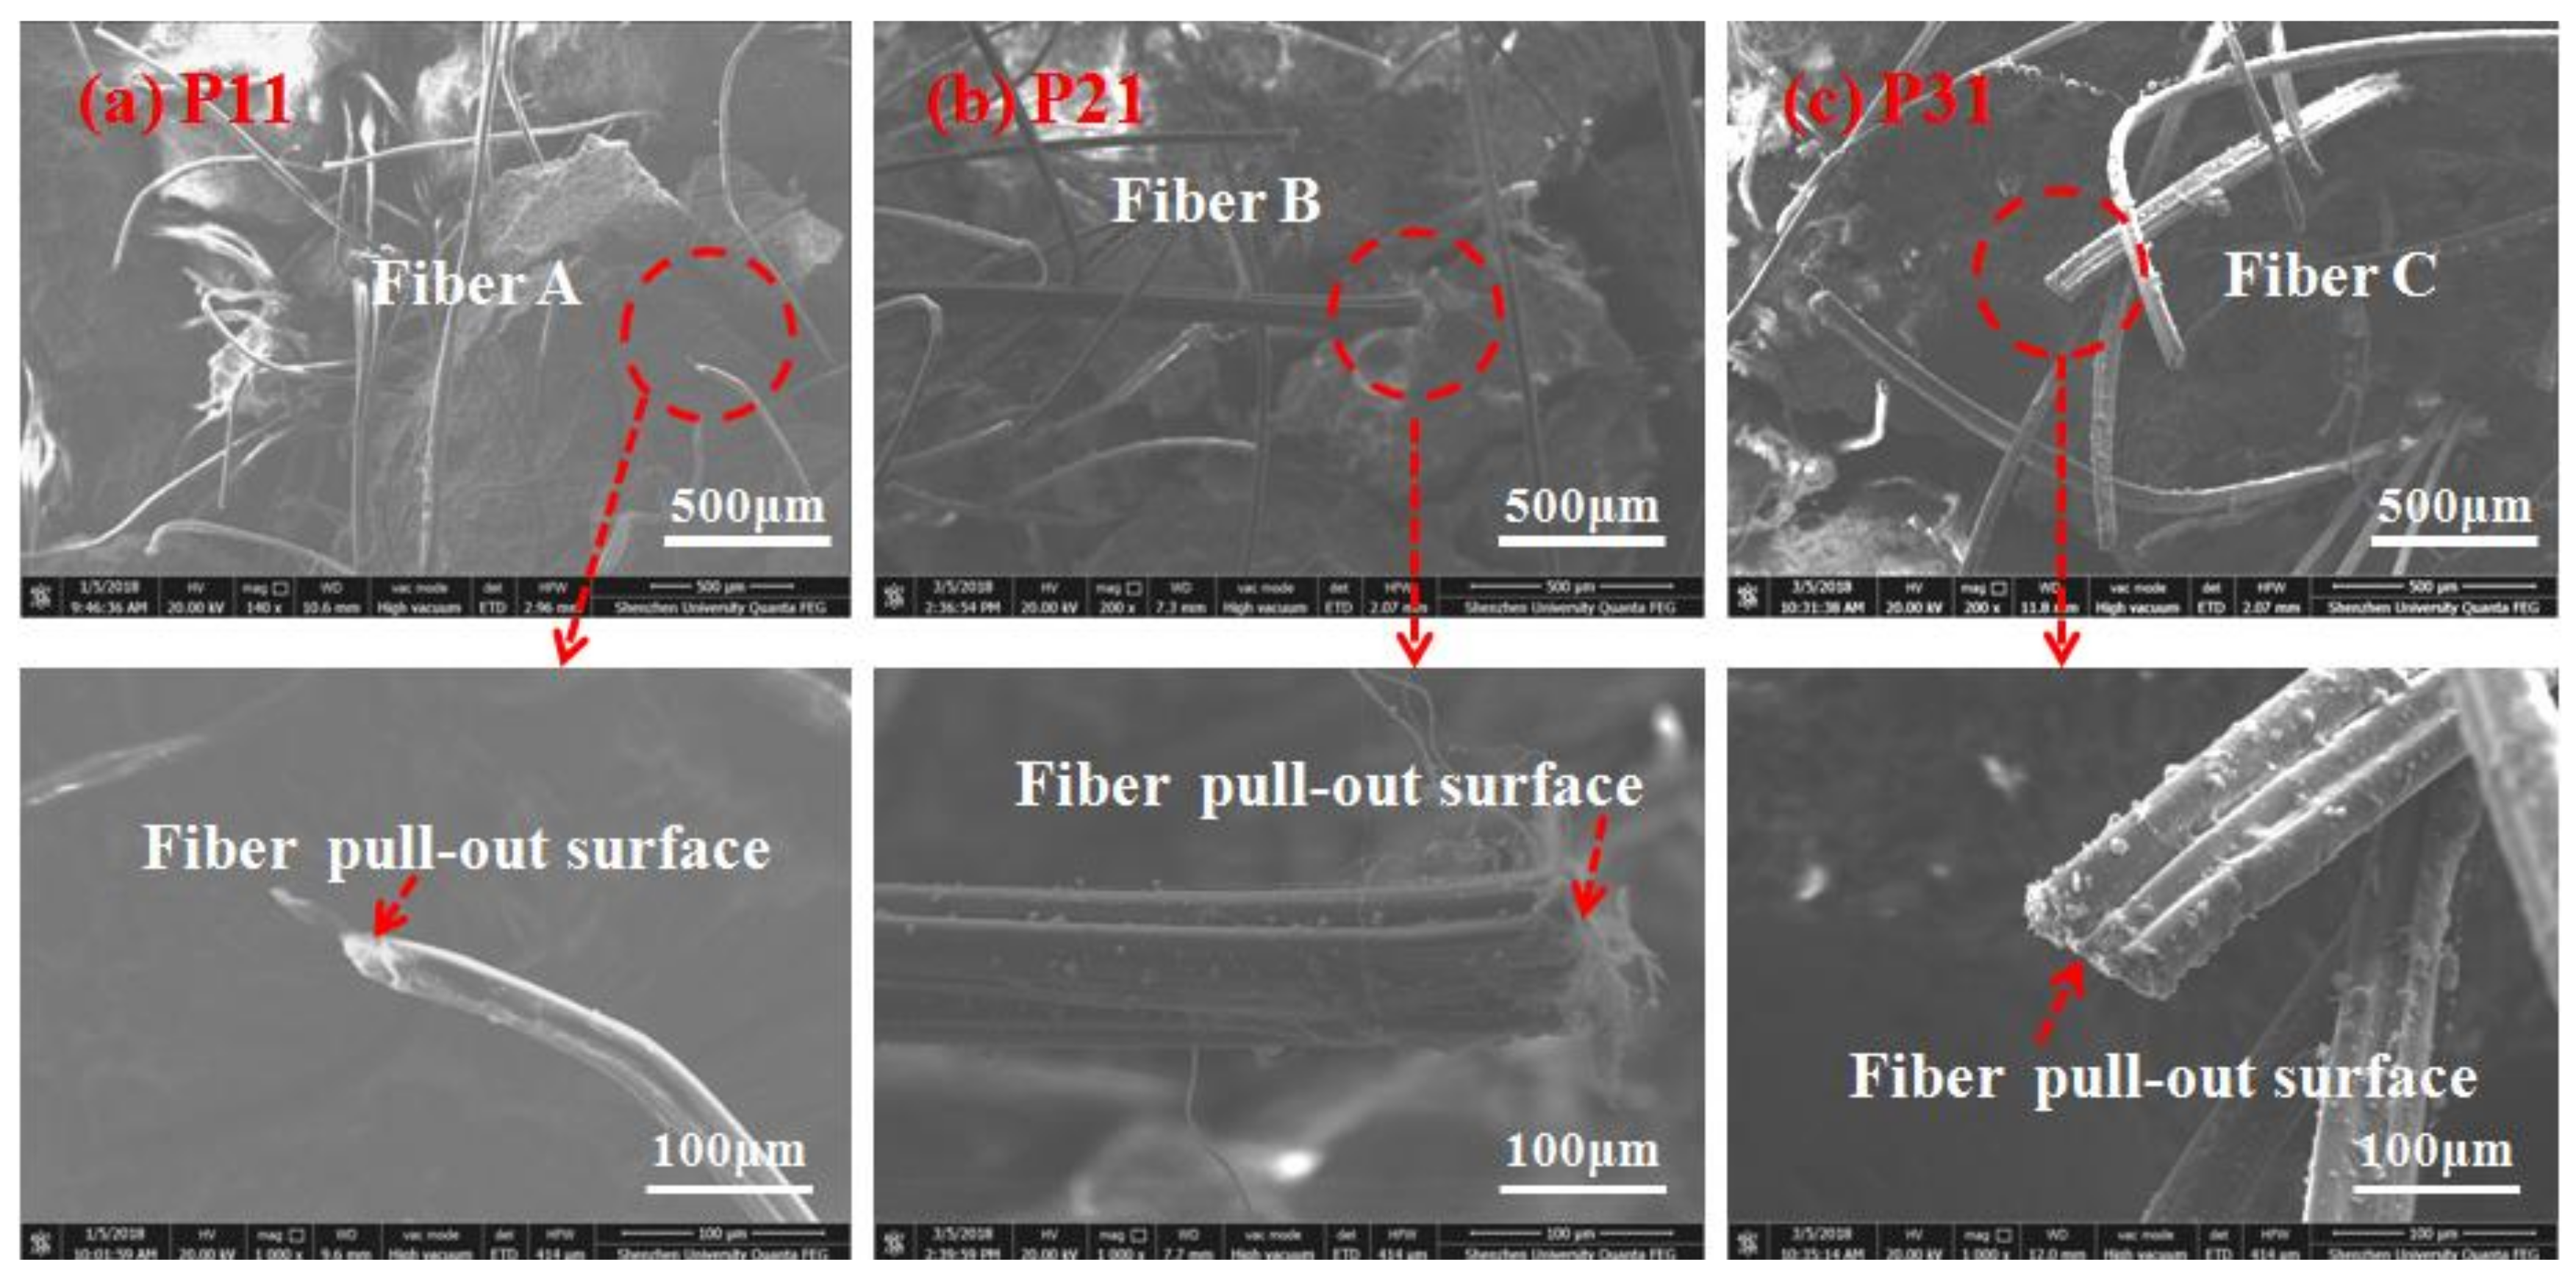
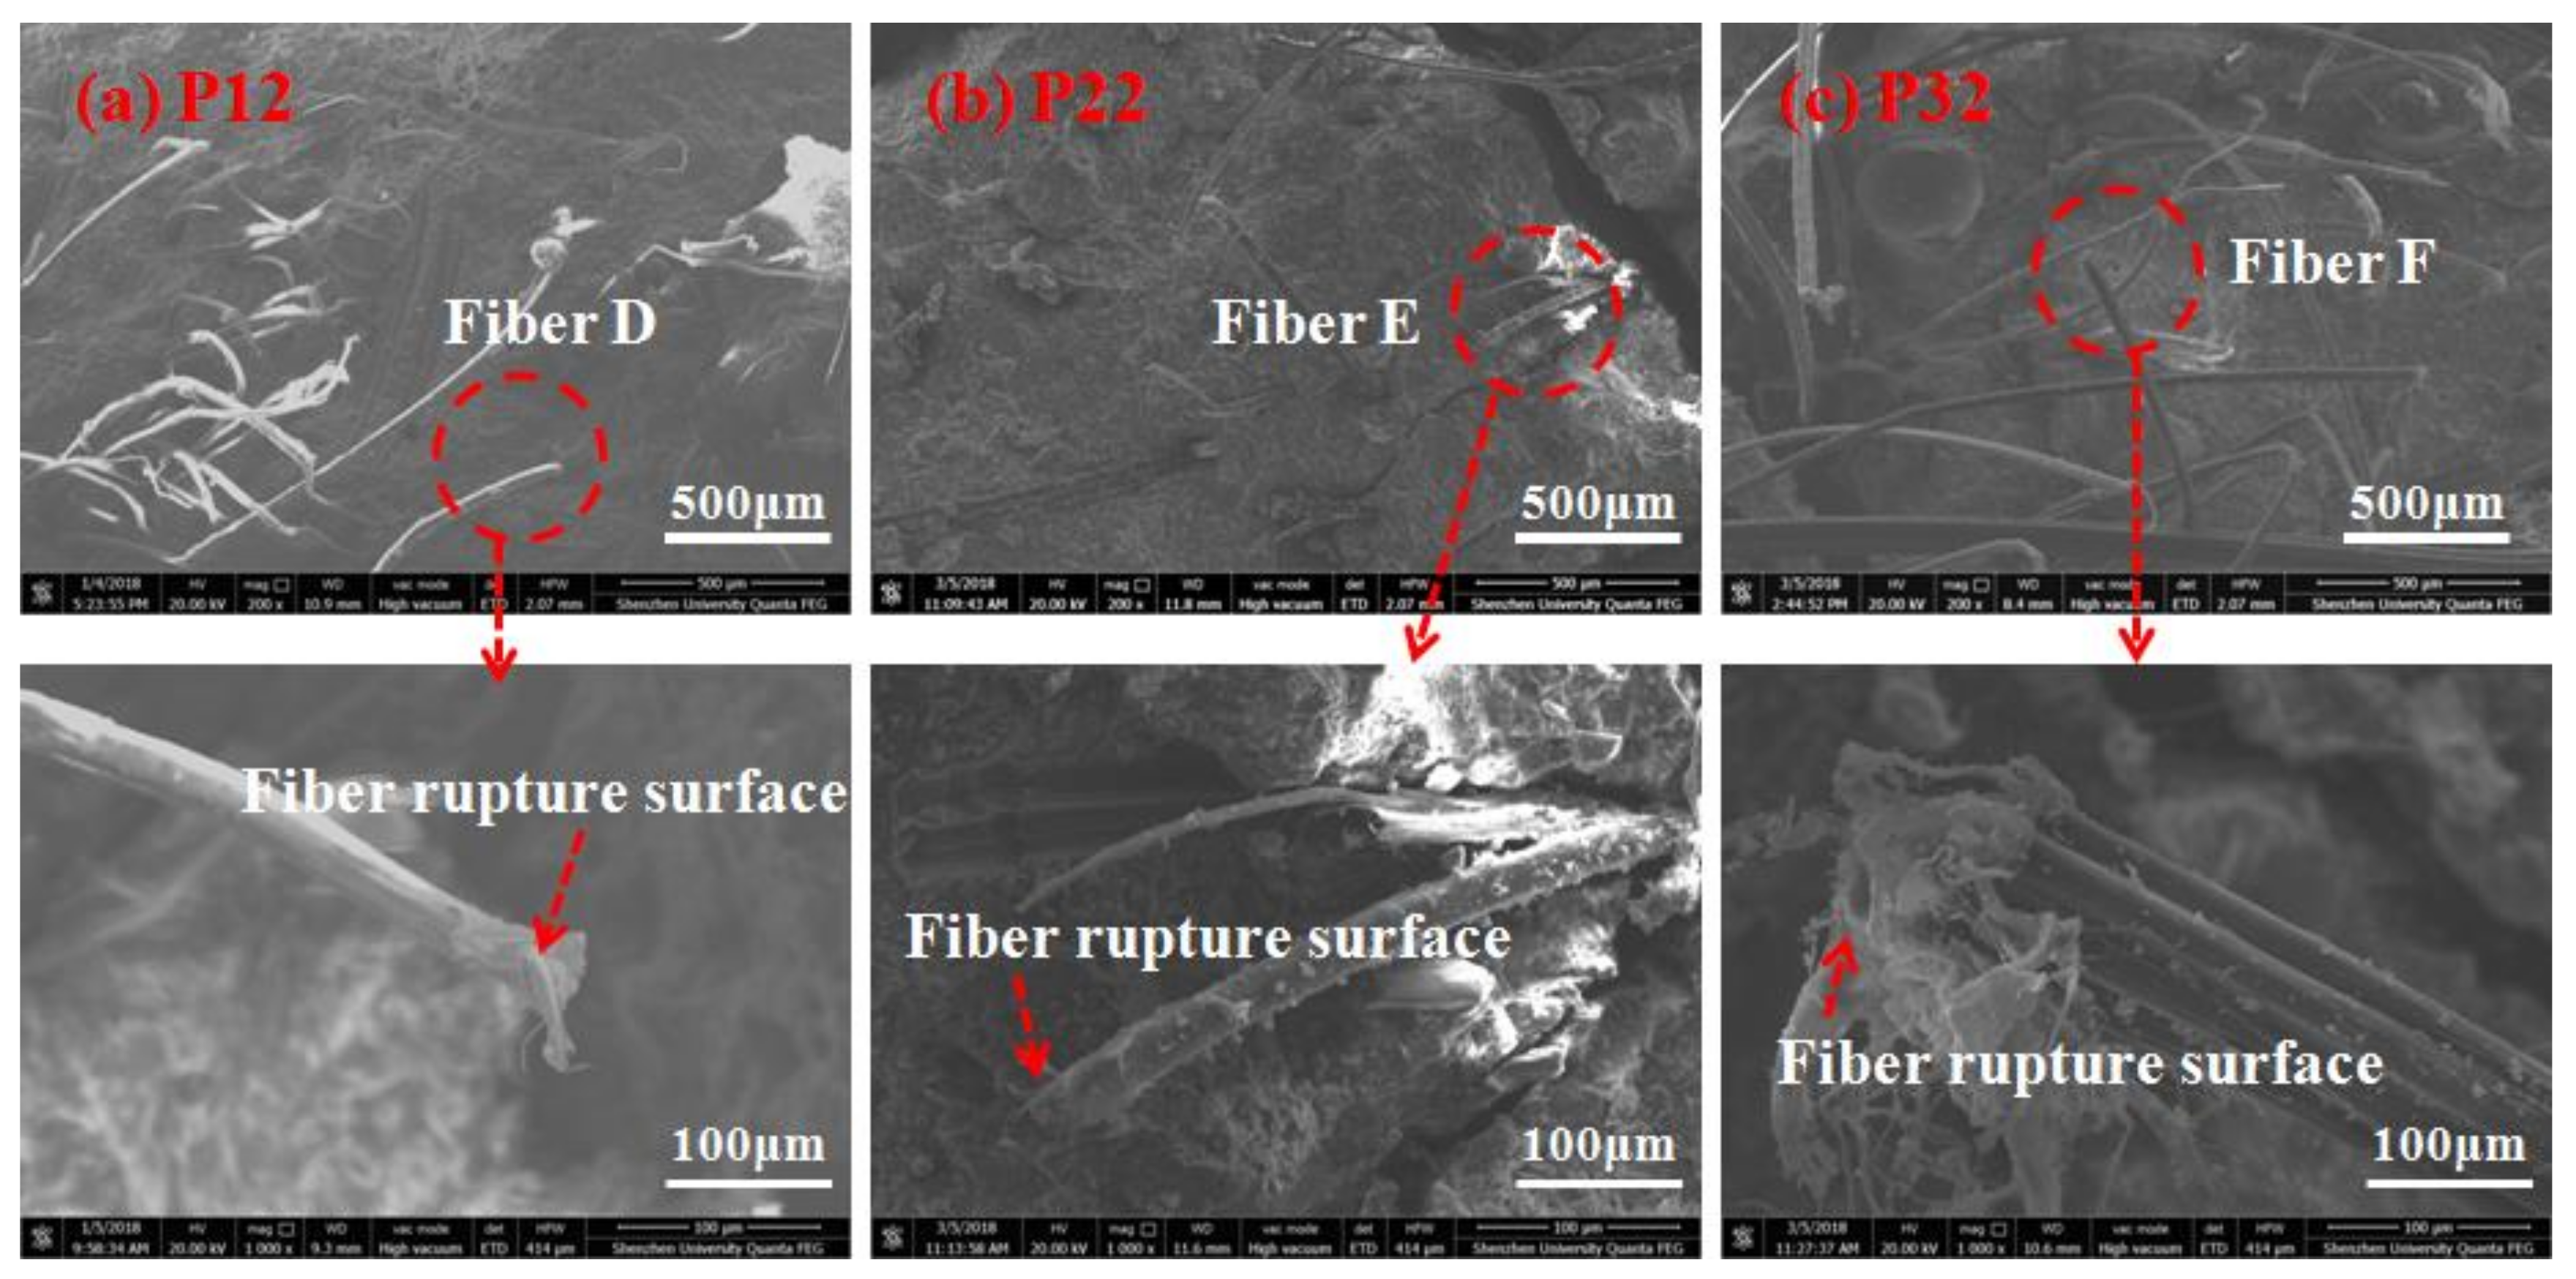
- The UHP-ECC specimens exhibited a ductile failure after fatigue loading and the high strength matrix of the UHP-ECC specimen did not affect its fatigue life. The final fatigue failure is mainly due to the accumulated damage of the fiber and its bond performance between the cement matrices. The fractured surface of the UHP-ECC composites were filled with pulled-out fiber failure and fiber rupture failure. With the increase of the fatigue stress, the ratio of the fiber pulled-out area to the fiber ruptured area on the fractured surface increases significantly. The fibers with pull-out failure had a severely scratched surface and were gradually changed from a round shape to a flat shape with the increase of the stress level; and the fibers with rupture failure had a round shape and were severely damaged and torn with a noticeable wire drawing phenomenon.
- (2)
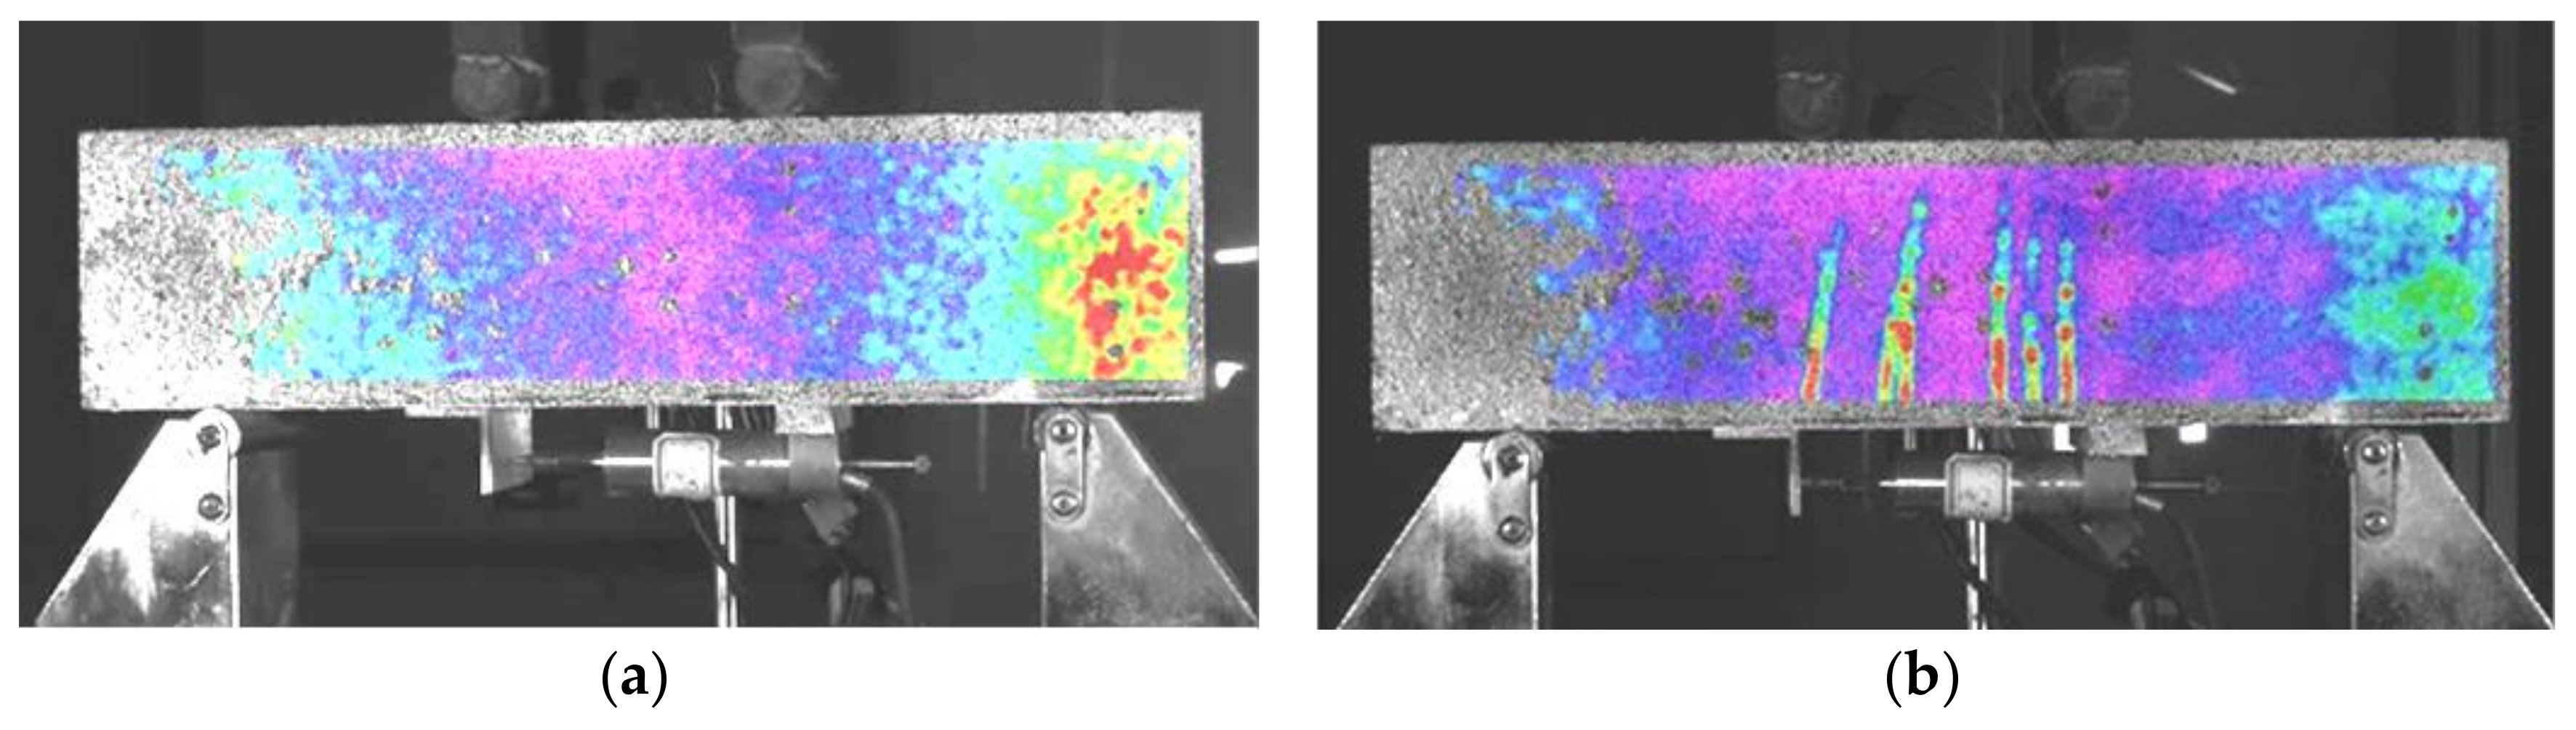
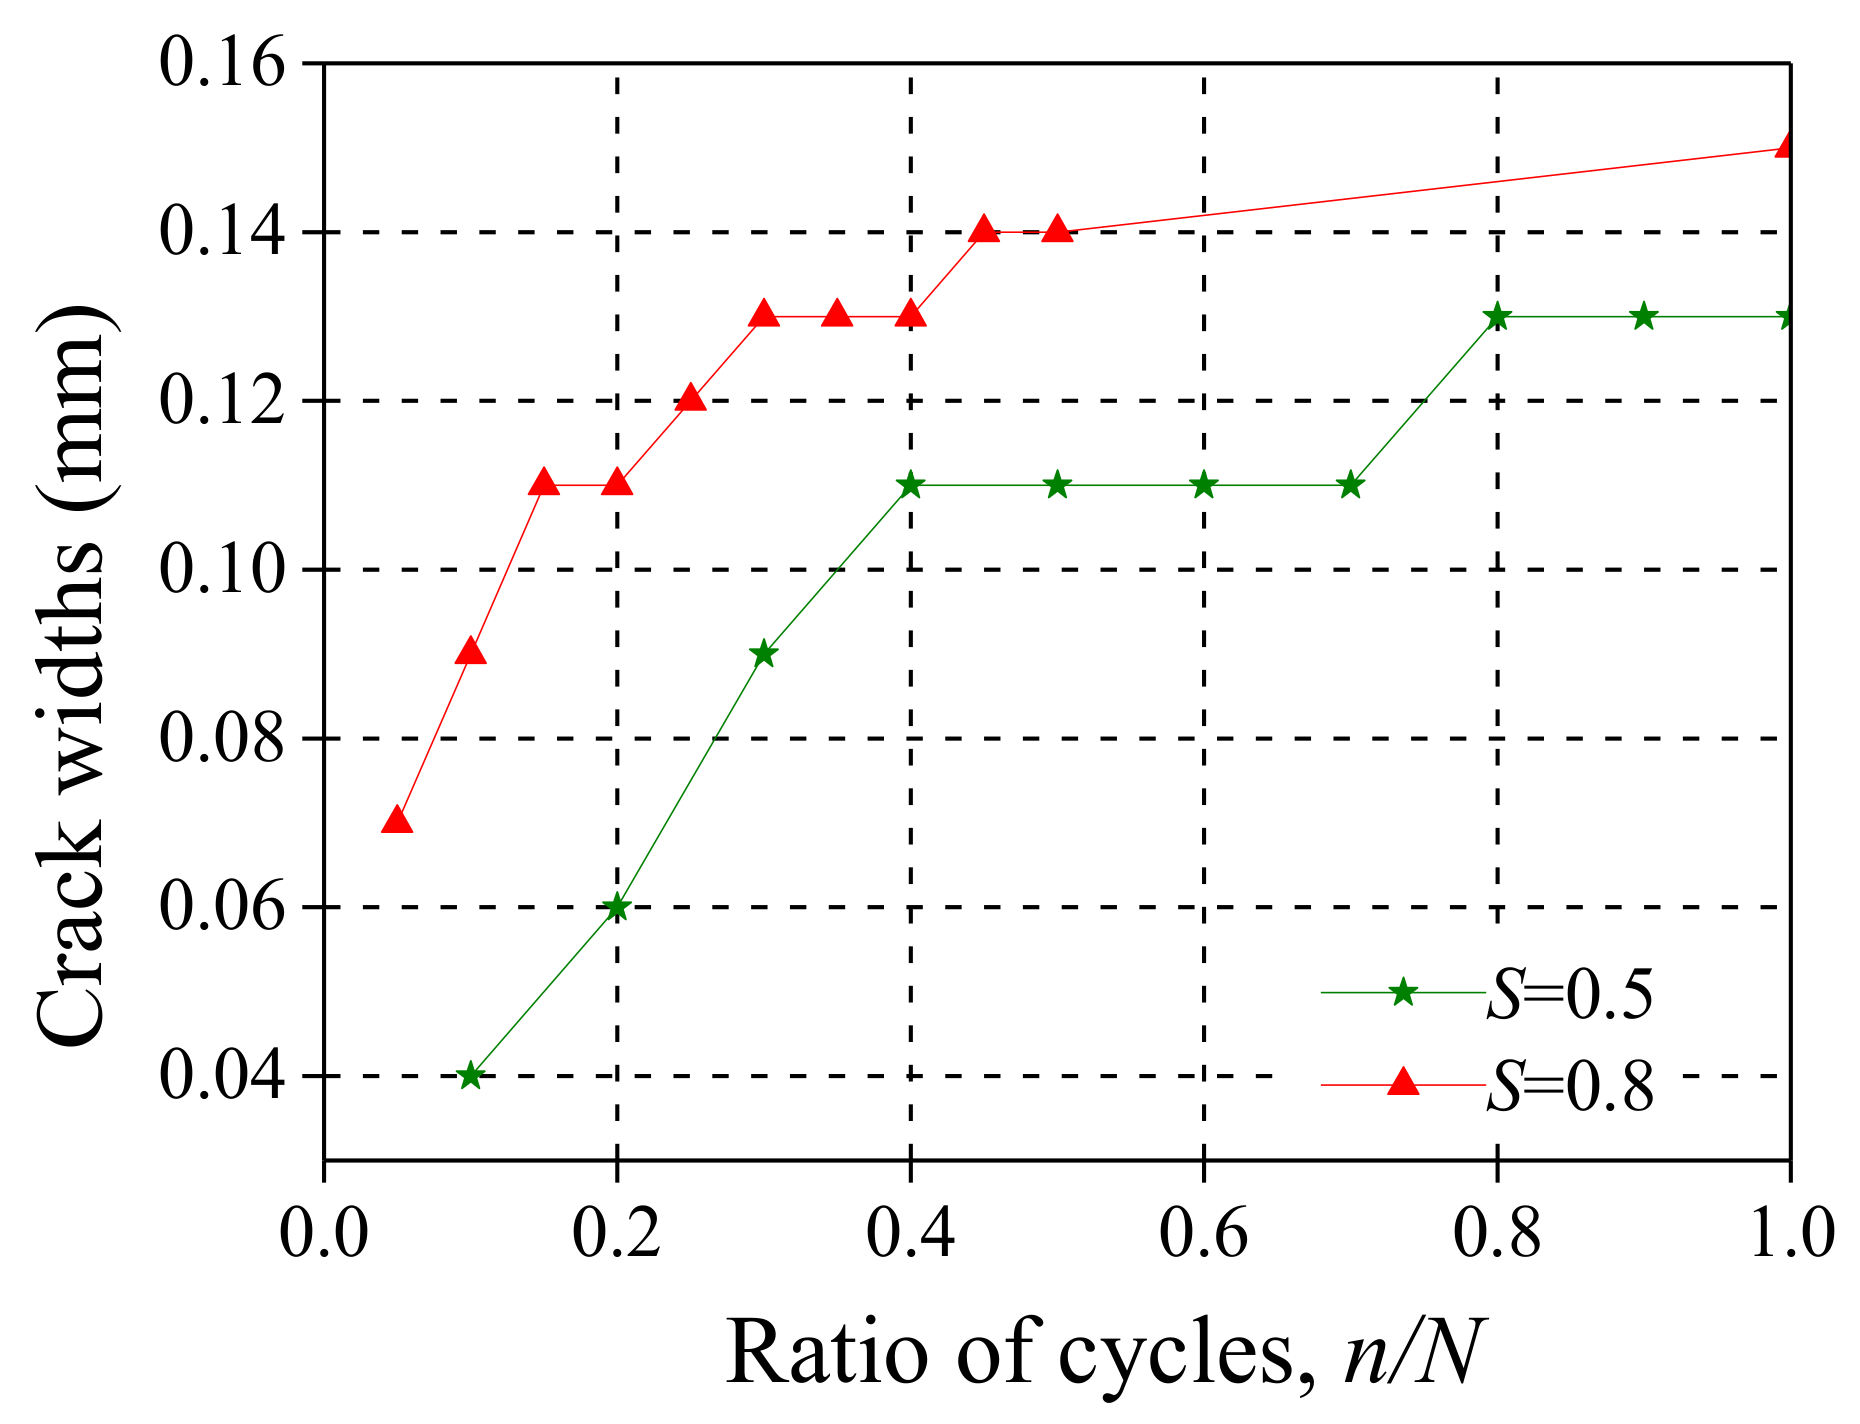
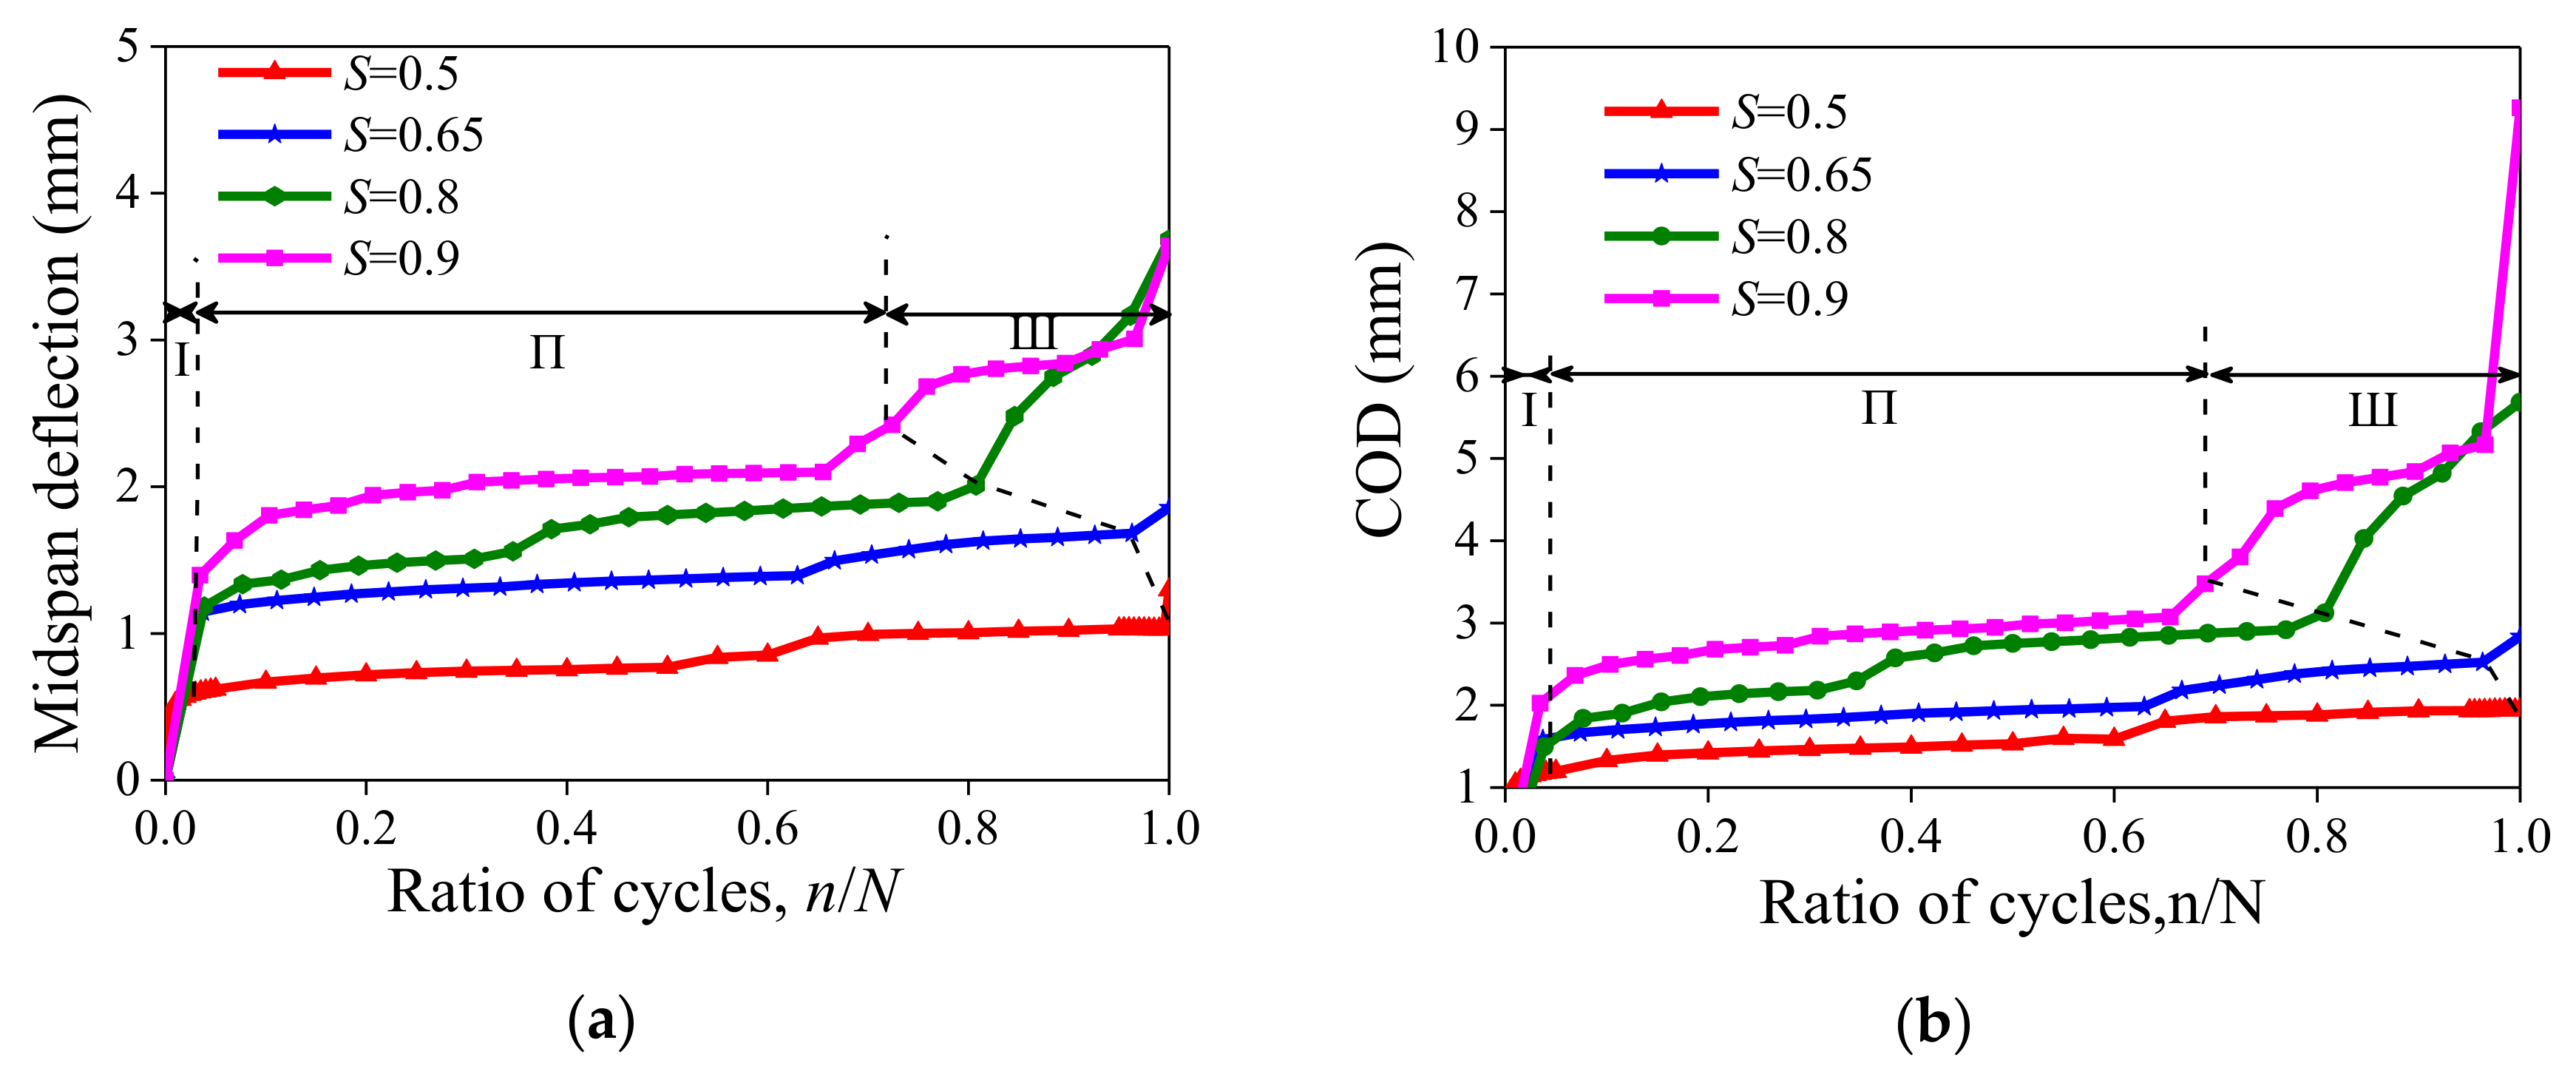
- The midspan deflection of the UHP-ECC increased with the increase of the fatigue stress level and its development underwent two or three stages, namely rapid deformation growth (Stage I), deformation stabilization (Stage II), and instability and failure (Stage III), depending on the fatigue stress. The deformation of Stage II was mainly caused by the propagation of the original cracks and the generation of new cracks. The fatigue life mainly depended on the length of Stage II and the magnitude of deformation, which were closely related to the number and density of the cracks.
- (3)
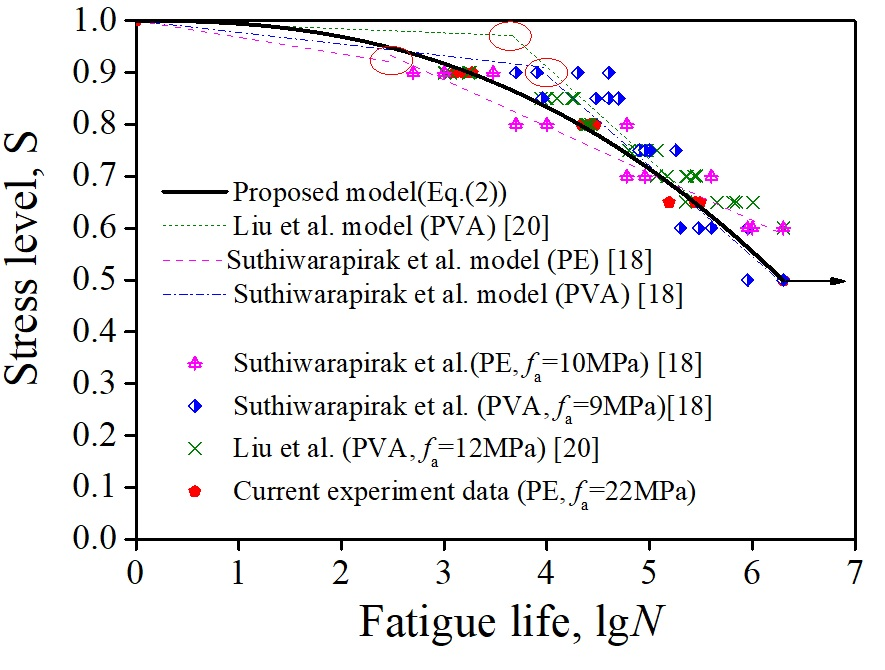
- Due to the higher bond strength but lower fatigue performance of PVA fibers when compared with PE fibers, PVA-ECC exhibited a higher fatigue life than PE-ECC under high stress levels, but had a slightly poorer fatigue performance than PE-ECC under low stress levels.
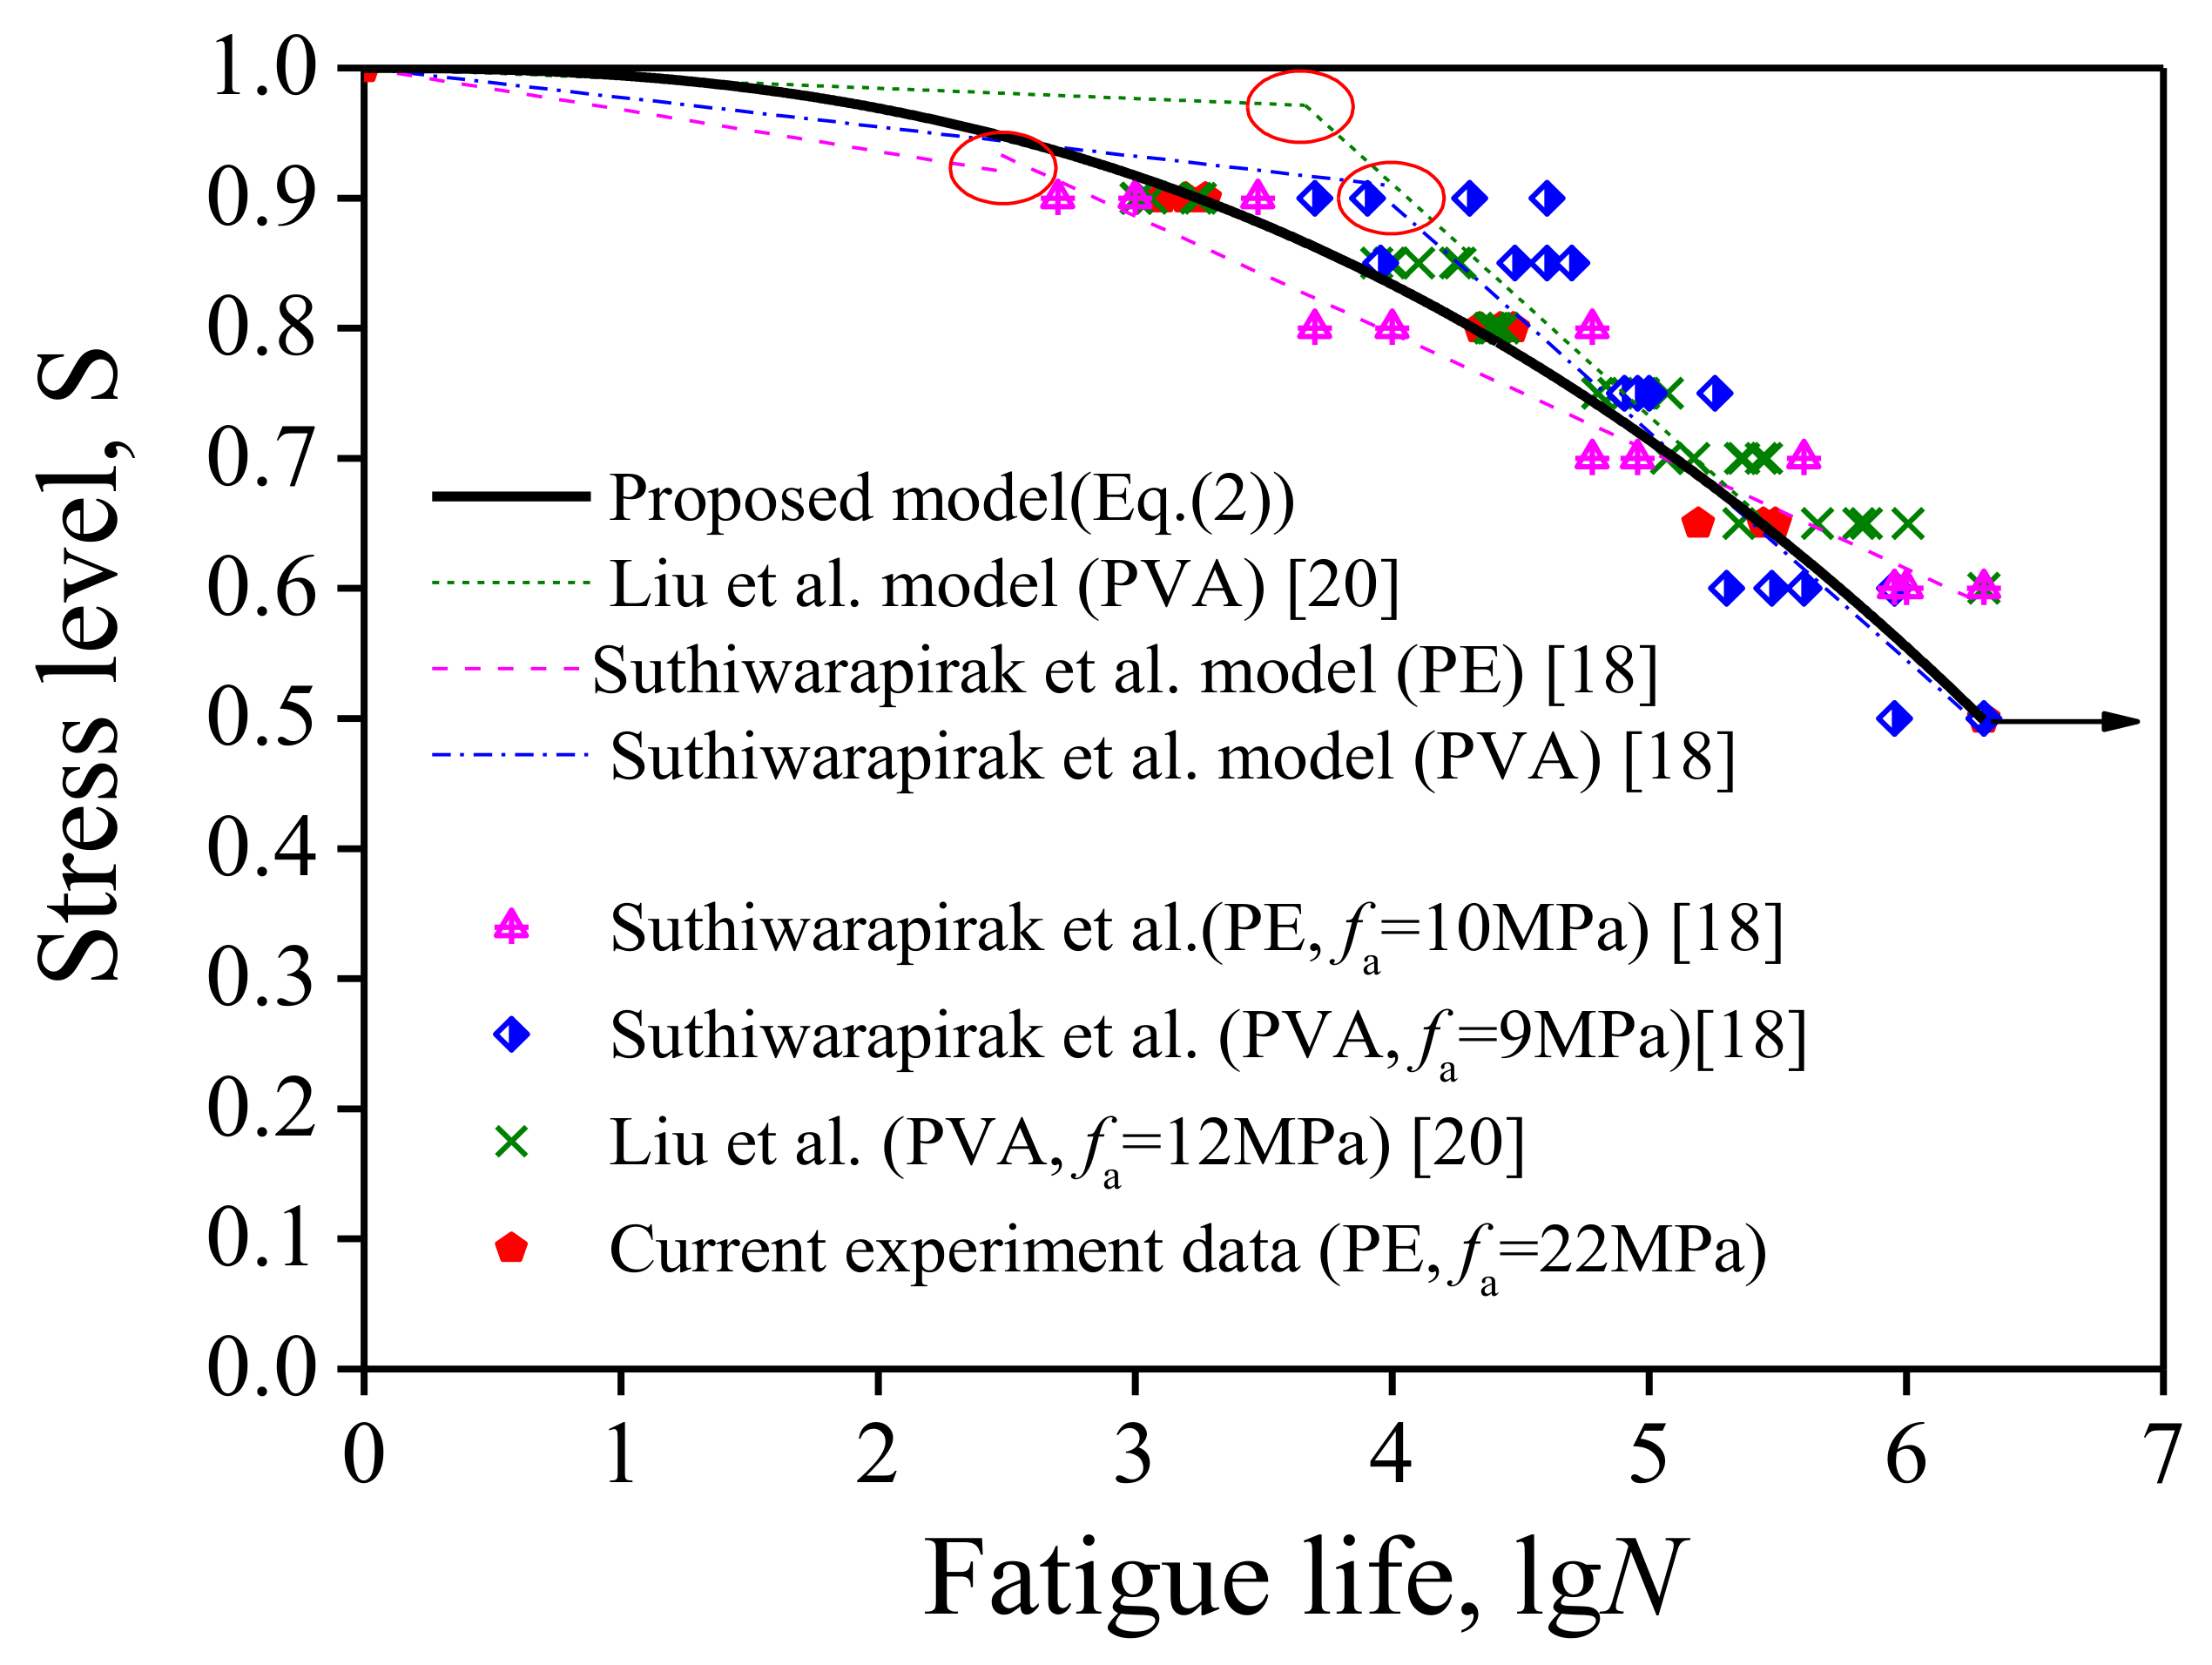
- (4)
- Existing studies widely use a developmental stage model with an inflection point to predict fatigue the fatigue life of ECC, i.e., the relationship between the stress level (S) and fatigue cycle (N), also referred to as the, S-N curve. However, very limited data has been available to accurately quantify the inflection point and all of the existing developmental stage models are not continuous at their inflection point. Thus, a continuous nonlinear equation is proposed to characterize the S-N curve of the UHP-ECC. The results indicate the proposed fatigue life model can produce a reliable prediction.
Author Contributions
Funding
Conflicts of Interest
References
- Li, V.C.; Leung, C.K.Y. Steady-state and multiple cracking of short random fiber composites. J. Eng. Mech. 1992, 118, 2246–2264. [Google Scholar] [CrossRef]
- Li, V.C.; Wang, S.; Wu, C. Tensile strain-hardening behavior of polyvinylalcohol engineered cementitious composite (PVA-ECC). ACI Mater. J. 2001, 98, 483–492. [Google Scholar]
- Şahmaran, M.; Li, V.C. De-icing salt scaling resistance of mechanically loaded engineered cementitious composites. Cem. Concr. Res. 2007, 37, 1035–1046. [Google Scholar] [CrossRef]
- Ferdous, W.; Manalo, A. Failures of mainline railway sleepers and suggested remedies–Review of current practice. Eng. Fail. Anal. 2014, 44, 17–35. [Google Scholar] [CrossRef]
- Sui, L.L.; Luo, M.S.; Yu, K.Q.; Xing, F.; Li, P.D.; Zhou, Y.W.; Chen, C. Effect of engineered cementitious composite on the bond behavior between fiber-reinforced polymer and concrete. Compos. Struct. 2018, 184, 775–788. [Google Scholar] [CrossRef]
- Cheng, L. Flexural fatigue analysis of a CFRP form reinforced concrete bridge deck. Compos. Struct. 2018, 93, 2895–2902. [Google Scholar] [CrossRef]
- Ohno, M.; Li, V.C. A feasibility study of strain hardening fiber reinforced fly ash-based geopolymer composites. Constr. Build Mater. 2014, 57, 163–168. [Google Scholar] [CrossRef]
- Wang, S.; Li, V.C. Engineered cementitious composites with highvolume fly ash. ACI Mater. J. 2007, 104, 233–241. [Google Scholar]
- Choi, J.I.; Lee, B.Y.; Ranade, R.; Li, V.C.; Lee, Y. Ultra-high-ductile behavior of a polyethylene fiber-reinforced alkali-activated slag-based composite. Cem. Concr. Comp. 2016, 70, 153–158. [Google Scholar] [CrossRef]
- Ranade, R.; Li, V.C.; Stults, M.D.; Heard, W.F.; Rushing, T.S. Composite properties of high-strength, high-ductility concrete. ACI Mater. J. 2013, 110, 413–422. [Google Scholar]
- He, S.; Qiu, J.S.; Li, J.X.; Yang, E.H. Strain hardening ultra-high performance concrete (SHUHPC) incorporating CNF-coated polyethylene fibers. Cem. Concr. Res. 2017, 98, 50–60. [Google Scholar] [CrossRef]
- Chen, Y.X.; Yu, J.; Leung, C.K.Y. Use of high strength strain-hardening cementitious composites for flexural repair of concrete structures with significant steel corrosion. Constr. Build Mater. 2018, 167, 325–337. [Google Scholar] [CrossRef]
- Curosu, I.; Liebscher, M.; Mechtcherine, V.; Bellmann, C.; Michel, S. Tensile behavior of high-strength strain-hardening cement-based composites (HS-SHCC) made with high-performance polyethylene, aramid and PBO fibers. Cem. Concr. Res. 2017, 98, 71–81. [Google Scholar] [CrossRef]
- Kamal, A.; Kunieda, M.; Ueda, N.; Nakamura, H. Evaluation of crack opening performance of a repair material with strain hardening behavior. Cem. Concr. Comp. 2008, 30, 863–871. [Google Scholar] [CrossRef]
- Yu, K.Q.; Li, L.; Yu, J.; Xiao, J.; Ye, J.; Wang, Y. Feasibility of using ultra-high ductility cementitious composites for concrete structures without steel rebar. Eng. Struc. 2018, 170, 11–20. [Google Scholar] [CrossRef]
- Matsumoto, T.; Suthiwarapirak, P.; Kanda, T. Mechanisms of multiple cracking and fracture of DFRCC under fatigue flexure. J. Adv. Concr. Technol. 2003, 1, 299–306. [Google Scholar] [CrossRef]
- Suthiwarapirak, P.; Matsumoto, T.; Kanda, T. Flexural fatigue failure characteristics of an engineered cementitious composite and polymer cement mortars. J. Mater. Conc. Struct. Pavement 2002, 718, 121–134. [Google Scholar] [CrossRef]
- Suthiwarapirak, P.; Matsumoto, T.; Kanda, T. Multiple cracking and fiber bridging characteristics of engineered cementitious composites under fatigue flexure. J. Mater. Civ. Eng. 2004, 16, 433–443. [Google Scholar] [CrossRef]
- Liu, W.; Xu, S.L.; Li, H.D. Flexural fatigue damage model of ultra-high toughness cementitious composites on base of continuum damage mechanics. Int. J. Damage Mech. 2014, 23, 949–963. [Google Scholar] [CrossRef]
- Liu, W.; Xu, S.L.; Feng, P. Fatigue damage propagation models for ductile fracture of ultrahigh toughness cementitious composites. Int. J. Damage Mech. 2016, 26, 919–932. [Google Scholar] [CrossRef]
- Mohamed, A.A.; Sherir Khandaker, M.A. Hossain and mohamed lachemi. structural performance of polymer fiber reinforced engineered cementitious composites subjected to static and fatigue flexural loading. Polymers 2015, 7, 1299–1330. [Google Scholar]
- Qiu, J.S.; Yang, E.H. Micromechanics-based investigation of fatigue deterioration of engineered cementitious composite (ECC). Cem. Concr. Res. 2017, 95, 65–74. [Google Scholar] [CrossRef]
- Jun, P.; Mechtcherine, V. Behaviour of strain-hardening cement-based composites (SHCC) under monotonic and cyclic tensile loading part 1–experimental investigations. Cem. Concr. Comp. 2010, 32, 801–809. [Google Scholar] [CrossRef]
- Jun, P.; Mechtcherine, V. Behaviour of strain-hardening cement-based composites (SHCC) under monotonic and cyclic tensile loading part 2-modelling. Cem. Concr. Comp. 2010, 32, 810–818. [Google Scholar] [CrossRef]
- Müller, S.; Mechtcherine, V. Fatigue behaviour of strain-hardening cement-based composites (SHCC). Cem. Concr. Res. 2017, 92, 75–83. [Google Scholar] [CrossRef]
- Qiu, J.; Yang, E.H. A micromechanics-based fatigue dependent fiber-bridging constitutive model. Cem. Concr. Res. 2016, 90, 117–126. [Google Scholar] [CrossRef]
- Qiu, J.; Lim, X.N.; Yang, E.-H. Fatigue-induced deterioration of the interface between micro-polyvinyl alcohol (PVA) fiber and cement matrix. Cem. Concr. Res. 2016, 90, 127–136. [Google Scholar] [CrossRef]
- Qiu, J.; Lim, X.N.; Yang, E.H. Fatigue-induced in-situ strength deterioration of micro-polyvinyl alcohol (PVA) fiber in cement matrix. Cem. Concr. Comp. 2017, 82, 128–136. [Google Scholar] [CrossRef]
- Yu, K.Q.; Yu, J.T.; Dai, J.G.; Lu, Z.D.; Shah, S.P. Development of ultra-high performance engineered cementitious composites using polyethylene (PE) fibers. Constr. Build Mater. 2018, 158, 217–227. [Google Scholar] [CrossRef]
- Yu, K.Q.; Li, L.; Yu, J.; Wang, Y.; Ye, J.; Xu, Q. Direct tensile properties of engineered cementitious composites: A review. Constr. Build Mater. 2018, 165, 346–362. [Google Scholar] [CrossRef]
- Yu, K.Q.; Wang, Y.C.; Yu, J.T.; Xu, S.L. A strain-hardening cementitious composites with the tensile capacity up to 8%. Constr. Build Mater. 2017, 137, 410–419. [Google Scholar] [CrossRef]
- Ding, Y.; Yu, J.T.; Yu, K.Q.; Xu, S.L. Basic mechanical properties of ultra-high ductility cementitious composites: From 40 MPa to 120 MPa. Compos. Struct. 2018, 185, 634–645. [Google Scholar] [CrossRef]
- Berodier, E.; Scrivener, K.; Scherer, G. Understanding the filler effect on the nucleation and growth of C-S-H. J. Am. Ceram. Soc. 2014, 97, 3764–3773. [Google Scholar] [CrossRef]
- Suraneni, P.; Fu, T.F.; Azad, V.J.; Isgorc, O.B.; Weissc, J. Pozzolanicity of finely ground lightweight aggregates. Cem. Concr. Comp. 2018, 88, 115–120. [Google Scholar] [CrossRef]
- GB175-2007; General Purpose Portland Cement, China. 2007. Available online: http://lrl.myvtc.edu.cn/ueditor/net/upload/file/20160623/6360227628360096711392762.pdf (accessed on 2 August 2018). (In Chinese).


| OPC 1 | LP 2 | GGBS 3 | SF 4 | QS 5 | HRWR 6 | PE | Water |
|---|---|---|---|---|---|---|---|
| 700 | 100 | 750 | 150 | 500 | 30 | 20 | 230 |
| Components | Chemical Composition (%) | Properties of Cement | ||||
|---|---|---|---|---|---|---|
| OPC | SF | GGBS | LP | |||
| SiO2 | 20.10 | 92.26 | 39.66 | 0.07 | Specific gravity (g/cm3) | 3.13 |
| CaO | 62.92 | 0.49 | 34.20 | 56.90 | Blaine fineness (m2/kg) | 380 |
| Al2O3 | 5.62 | 0.89 | 12.94 | 0.00 | Initial setting times (min) | 130 |
| Fe2O3 | 2.17 | 1.97 | 1.58 | 0.02 | Final setting times (min) | 210 |
| MgO | 1.14 | 0.96 | 6.94 | 0.13 | Volume expansion (mm) | 1.00 |
| Na2O | 0.30 | 0.42 | 0.20 | 0.07 | Compressive strength | 53.2 7-day |
| K2O | 0.85 | 1.31 | 1.44 | 0.00 | (MPa) | 61.9 28-day |
| SO3 | 2.92 | 0.33 | 0.72 | 0.05 | ||
| L.O.I. | 3.84 | <6.00 | 1.20 | 42.73 | ||
| Diameter Ratio (μm) | Fiber Aspect Ratio | Volume Percentage (%) | Strength (GPa) | Elastic Modulus (GPa) | Rupture Elongation (%) | Density (kg/m3) |
|---|---|---|---|---|---|---|
| 25 | 480 | 2 | 2.9 | 116 | 2.42 | 970 |
| Specimen * | 40% Ultimate Flexural Load (kN) | Related Midspan Deflection (mm) | Initial Stiffness B0 (kN/mm) | Average Initial Stiffness (kN/mm) |
|---|---|---|---|---|
| U-1.0-1 | 27.21 | 0.21 | 129.57 | 130.01 |
| U-1.0-2 | 29.09 | 0.20 | 145.45 | |
| U-1.0-3 | 27.60 | 0.24 | 115.00 | |
| U-0.5-1 (static) | 26.00 | 0.24 | 108.33 | 108.12 |
| U-0.5-2 (static) | 26.53 | 0.27 | 98.26 | |
| U-0.5-3 (static) | 24.73 | 0.21 | 117.76 |
| Stress Level (S) | 1 (Static) | 0.9 | 0.8 | 0.65 | 0.5 (before Static) | 0.5 (after Static) |
|---|---|---|---|---|---|---|
| crack number | 45 | 30 | 20 | 6 | 5 | 25 |
| Stress Level (S) | Specimen | Fatigue Life (N) | Max Midspan Deflection (mm) | Max Deflection of Bottom (mm) |
|---|---|---|---|---|
| 0.5 | U-0.5-1 | (2,000,000) 1 | 0.99 | 1.61 |
| U-0.5-2 | (2,000,000) 1 | 1.03 | 1.94 | |
| U-0.5-3 | (2,000,000) 1 | 0.98 | 1.96 | |
| 0.65 | U-0.65-1 | 308,691 | 1.76 | 2.64 |
| U-0.65-1 | 155,075 | 1.41 | 2.76 | |
| U-0.65-1 | 277,386 | 1.86 | 2.83 | |
| 0.8 | U-0.8-1 | 29,565 | 3.64 | 3.97 |
| U-0.8-2 | 26,291 | 3.68 | 3.13 | |
| U-0.8-3 | 21,852 | 3.02 | 3.77 | |
| 0.9 | U-0.9-1 | 1569 | 4.81 | 5.21 |
| U-0.9-2 | 1876 | 4.85 | 4.92 | |
| U-0.9-3 | 1271 | 4.94 | 4.37 |
© 2018 by the authors. Licensee MDPI, Basel, Switzerland. This article is an open access article distributed under the terms and conditions of the Creative Commons Attribution (CC BY) license (http://creativecommons.org/licenses/by/4.0/).
Share and Cite
Sui, L.; Zhong, Q.; Yu, K.; Xing, F.; Li, P.; Zhou, Y. Flexural Fatigue Properties of Ultra-High Performance Engineered Cementitious Composites (UHP-ECC) Reinforced by Polymer Fibers. Polymers 2018, 10, 892. https://doi.org/10.3390/polym10080892
Sui L, Zhong Q, Yu K, Xing F, Li P, Zhou Y. Flexural Fatigue Properties of Ultra-High Performance Engineered Cementitious Composites (UHP-ECC) Reinforced by Polymer Fibers. Polymers. 2018; 10(8):892. https://doi.org/10.3390/polym10080892
Chicago/Turabian StyleSui, Lili, Qianli Zhong, Kequan Yu, Feng Xing, Pengda Li, and Yingwu Zhou. 2018. "Flexural Fatigue Properties of Ultra-High Performance Engineered Cementitious Composites (UHP-ECC) Reinforced by Polymer Fibers" Polymers 10, no. 8: 892. https://doi.org/10.3390/polym10080892