A Study of the Pressure-Induced Solidification of Polymers


Abstract
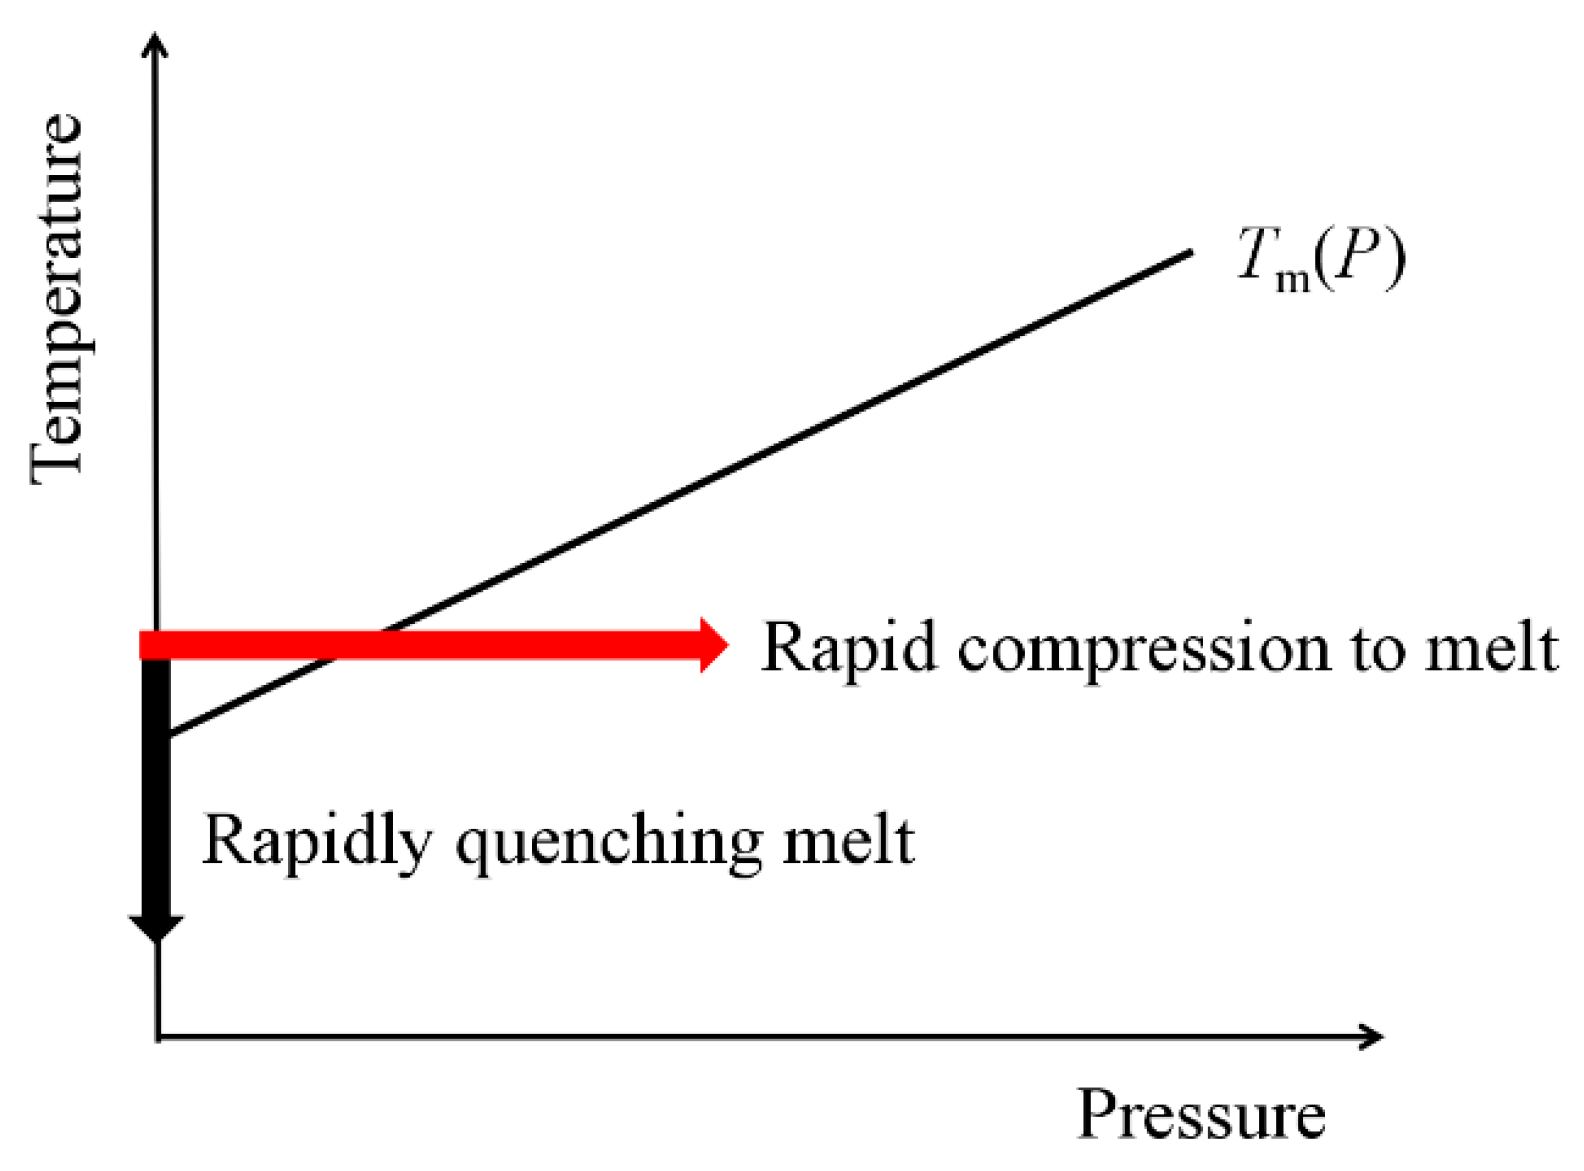
1. Introduction
2. Experimental Apparatus and Details
3. Results and Discussion
3.1. Solidification of Full Amorphous Phase in PET, PEEK, and Sulfur
3.1.1. PET
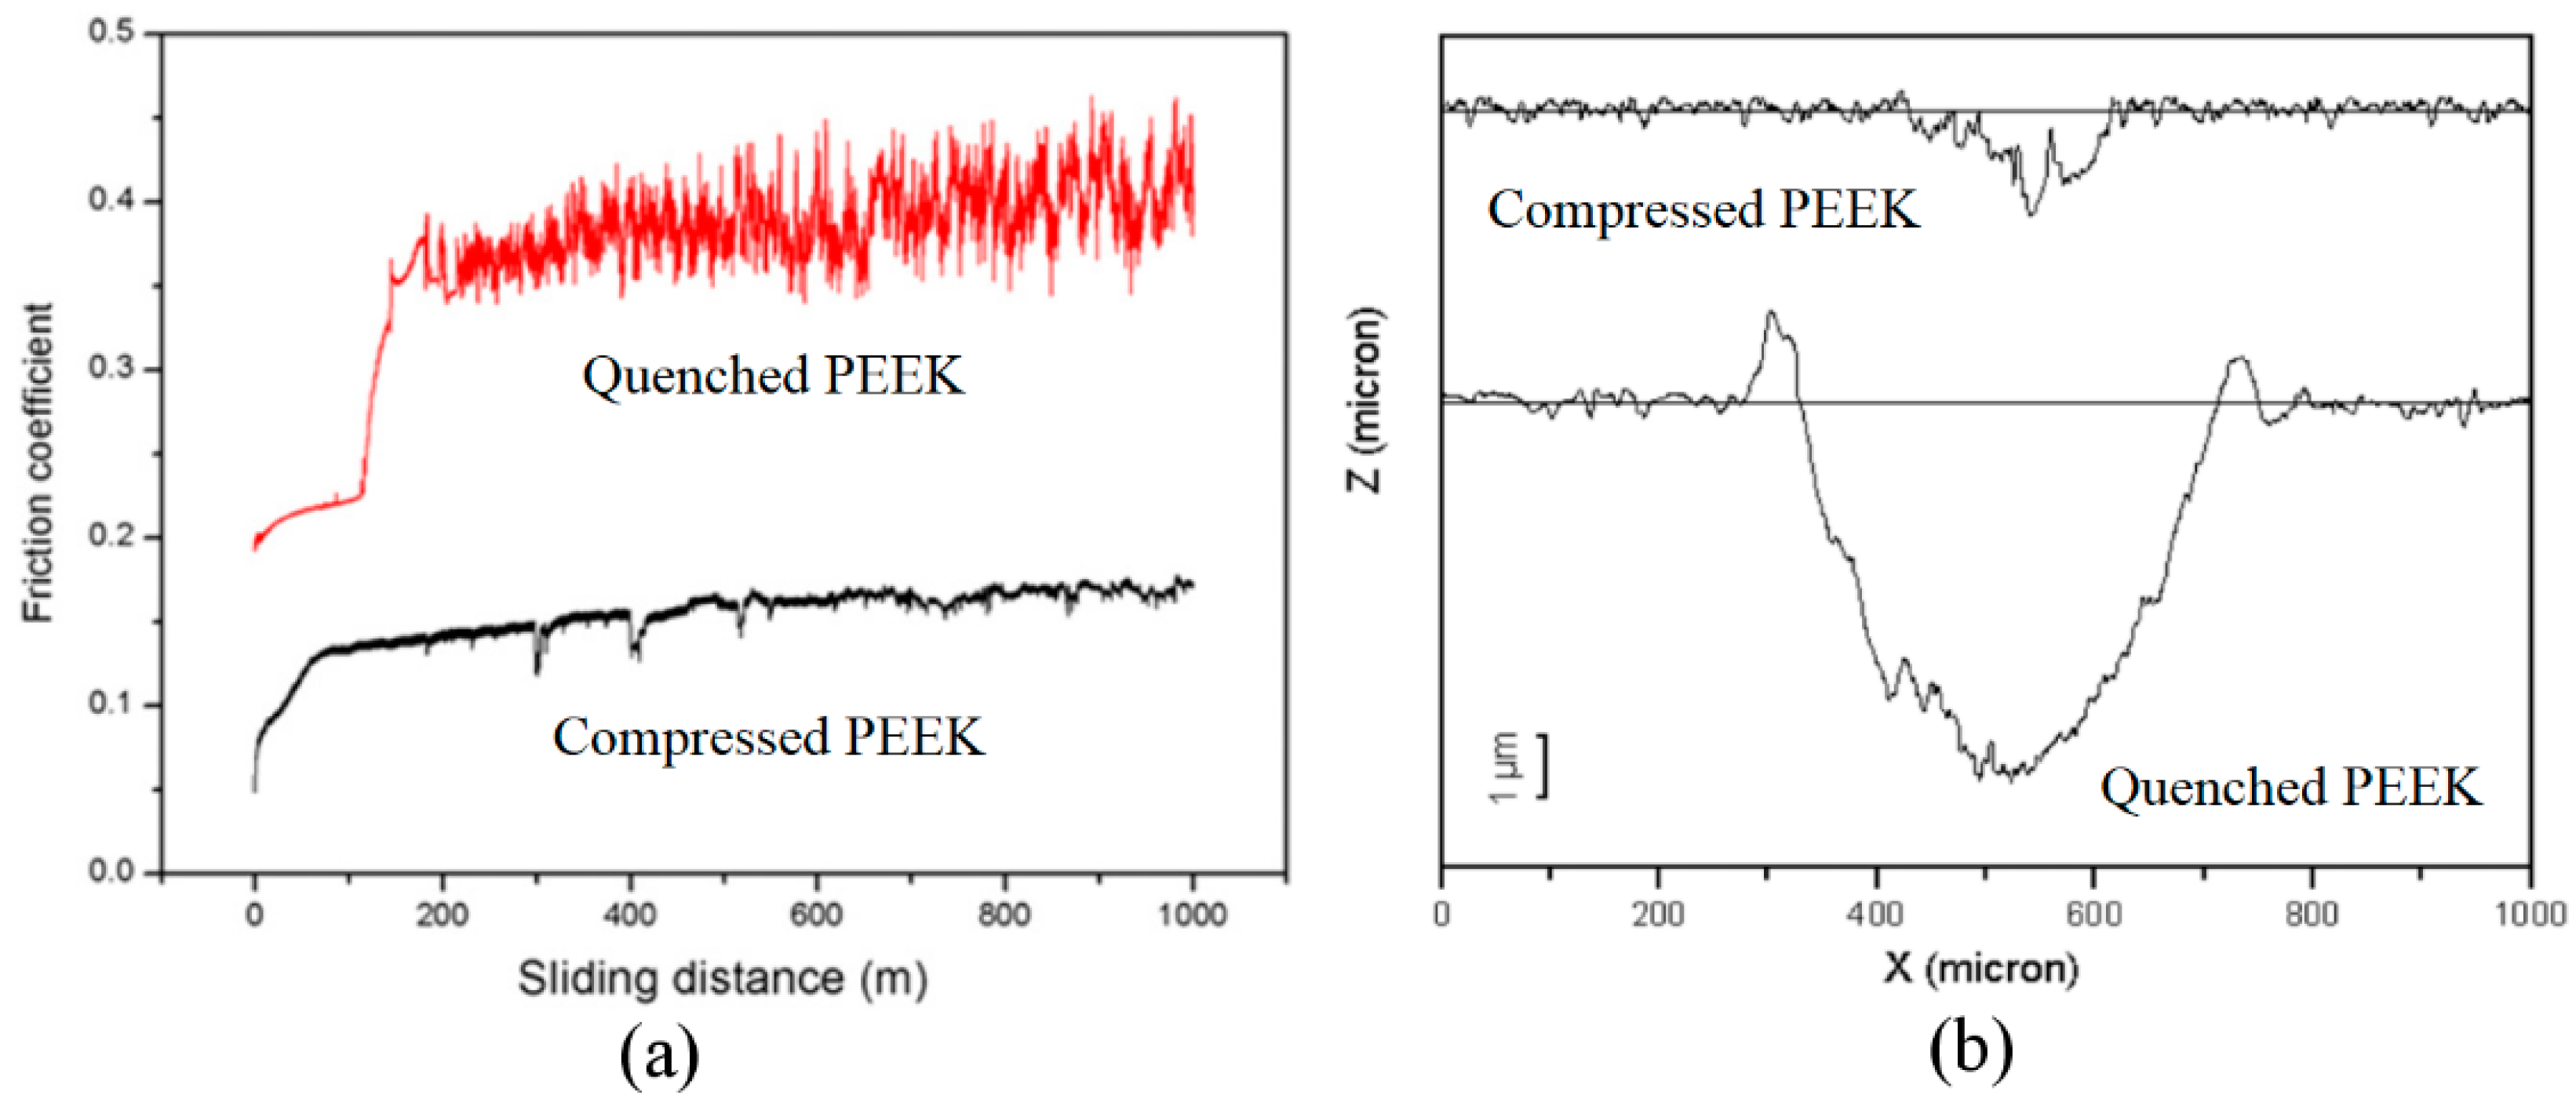
3.1.2. PEEK
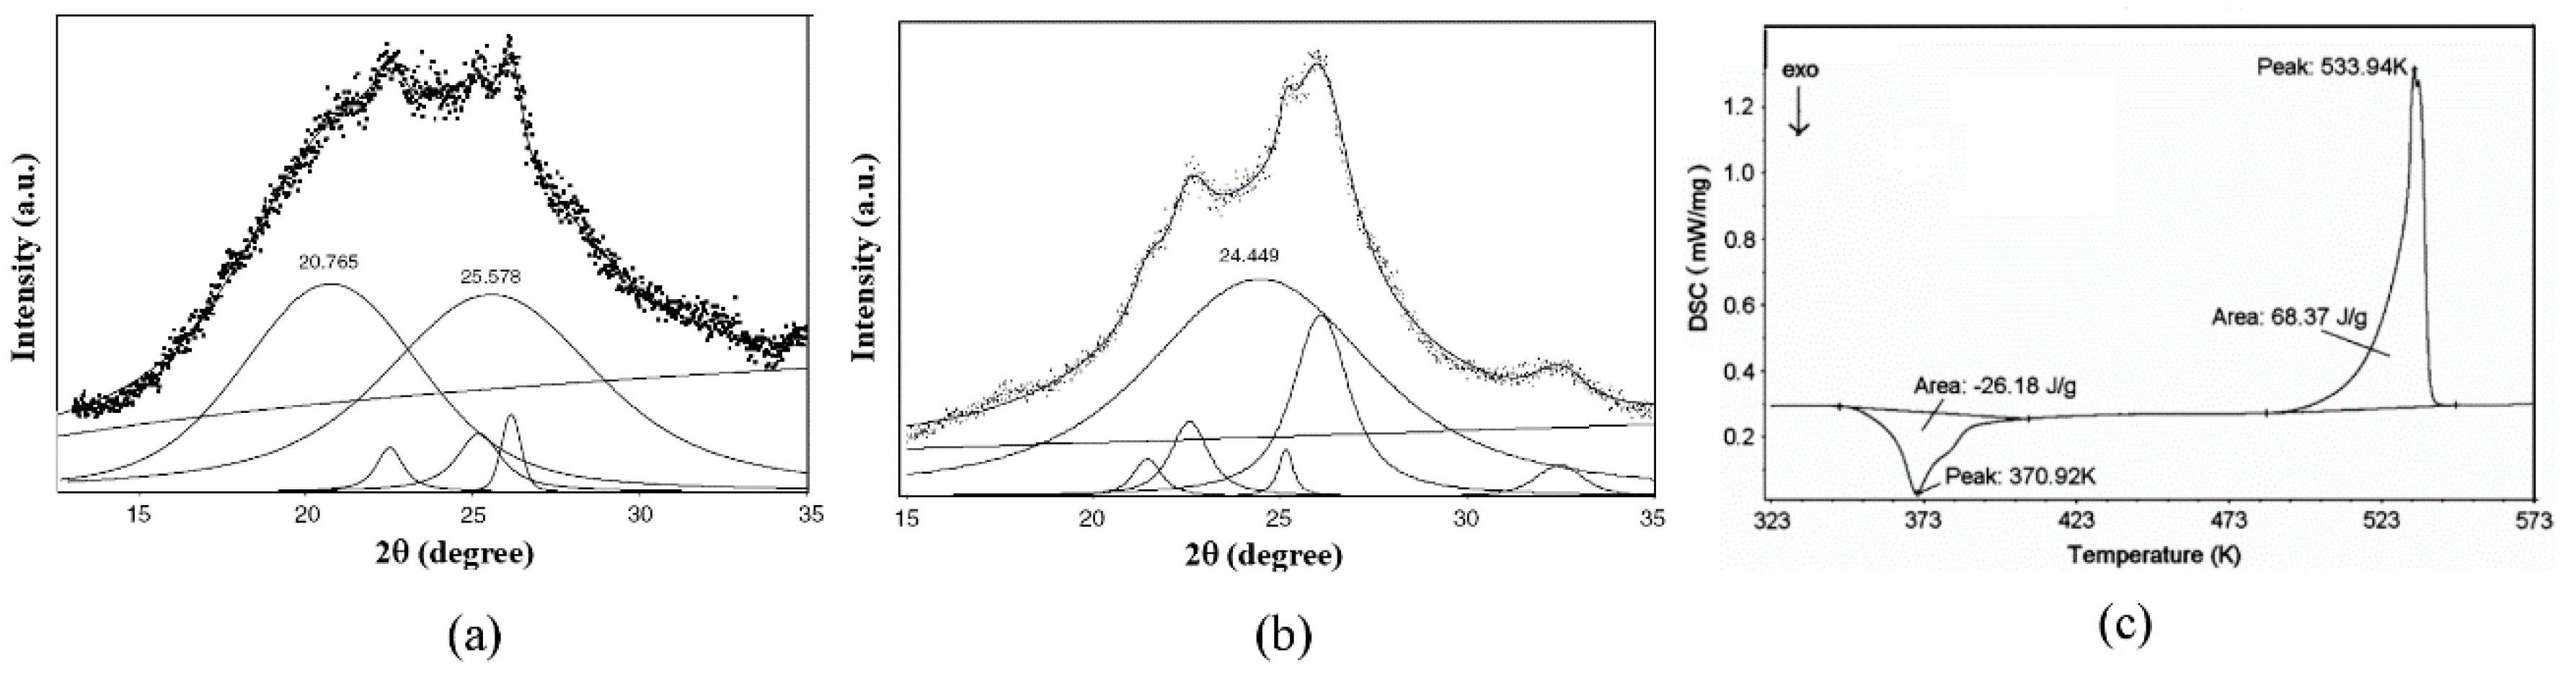
3.1.3. Sulfur
3.2. Solidification of Other Polymer Melts
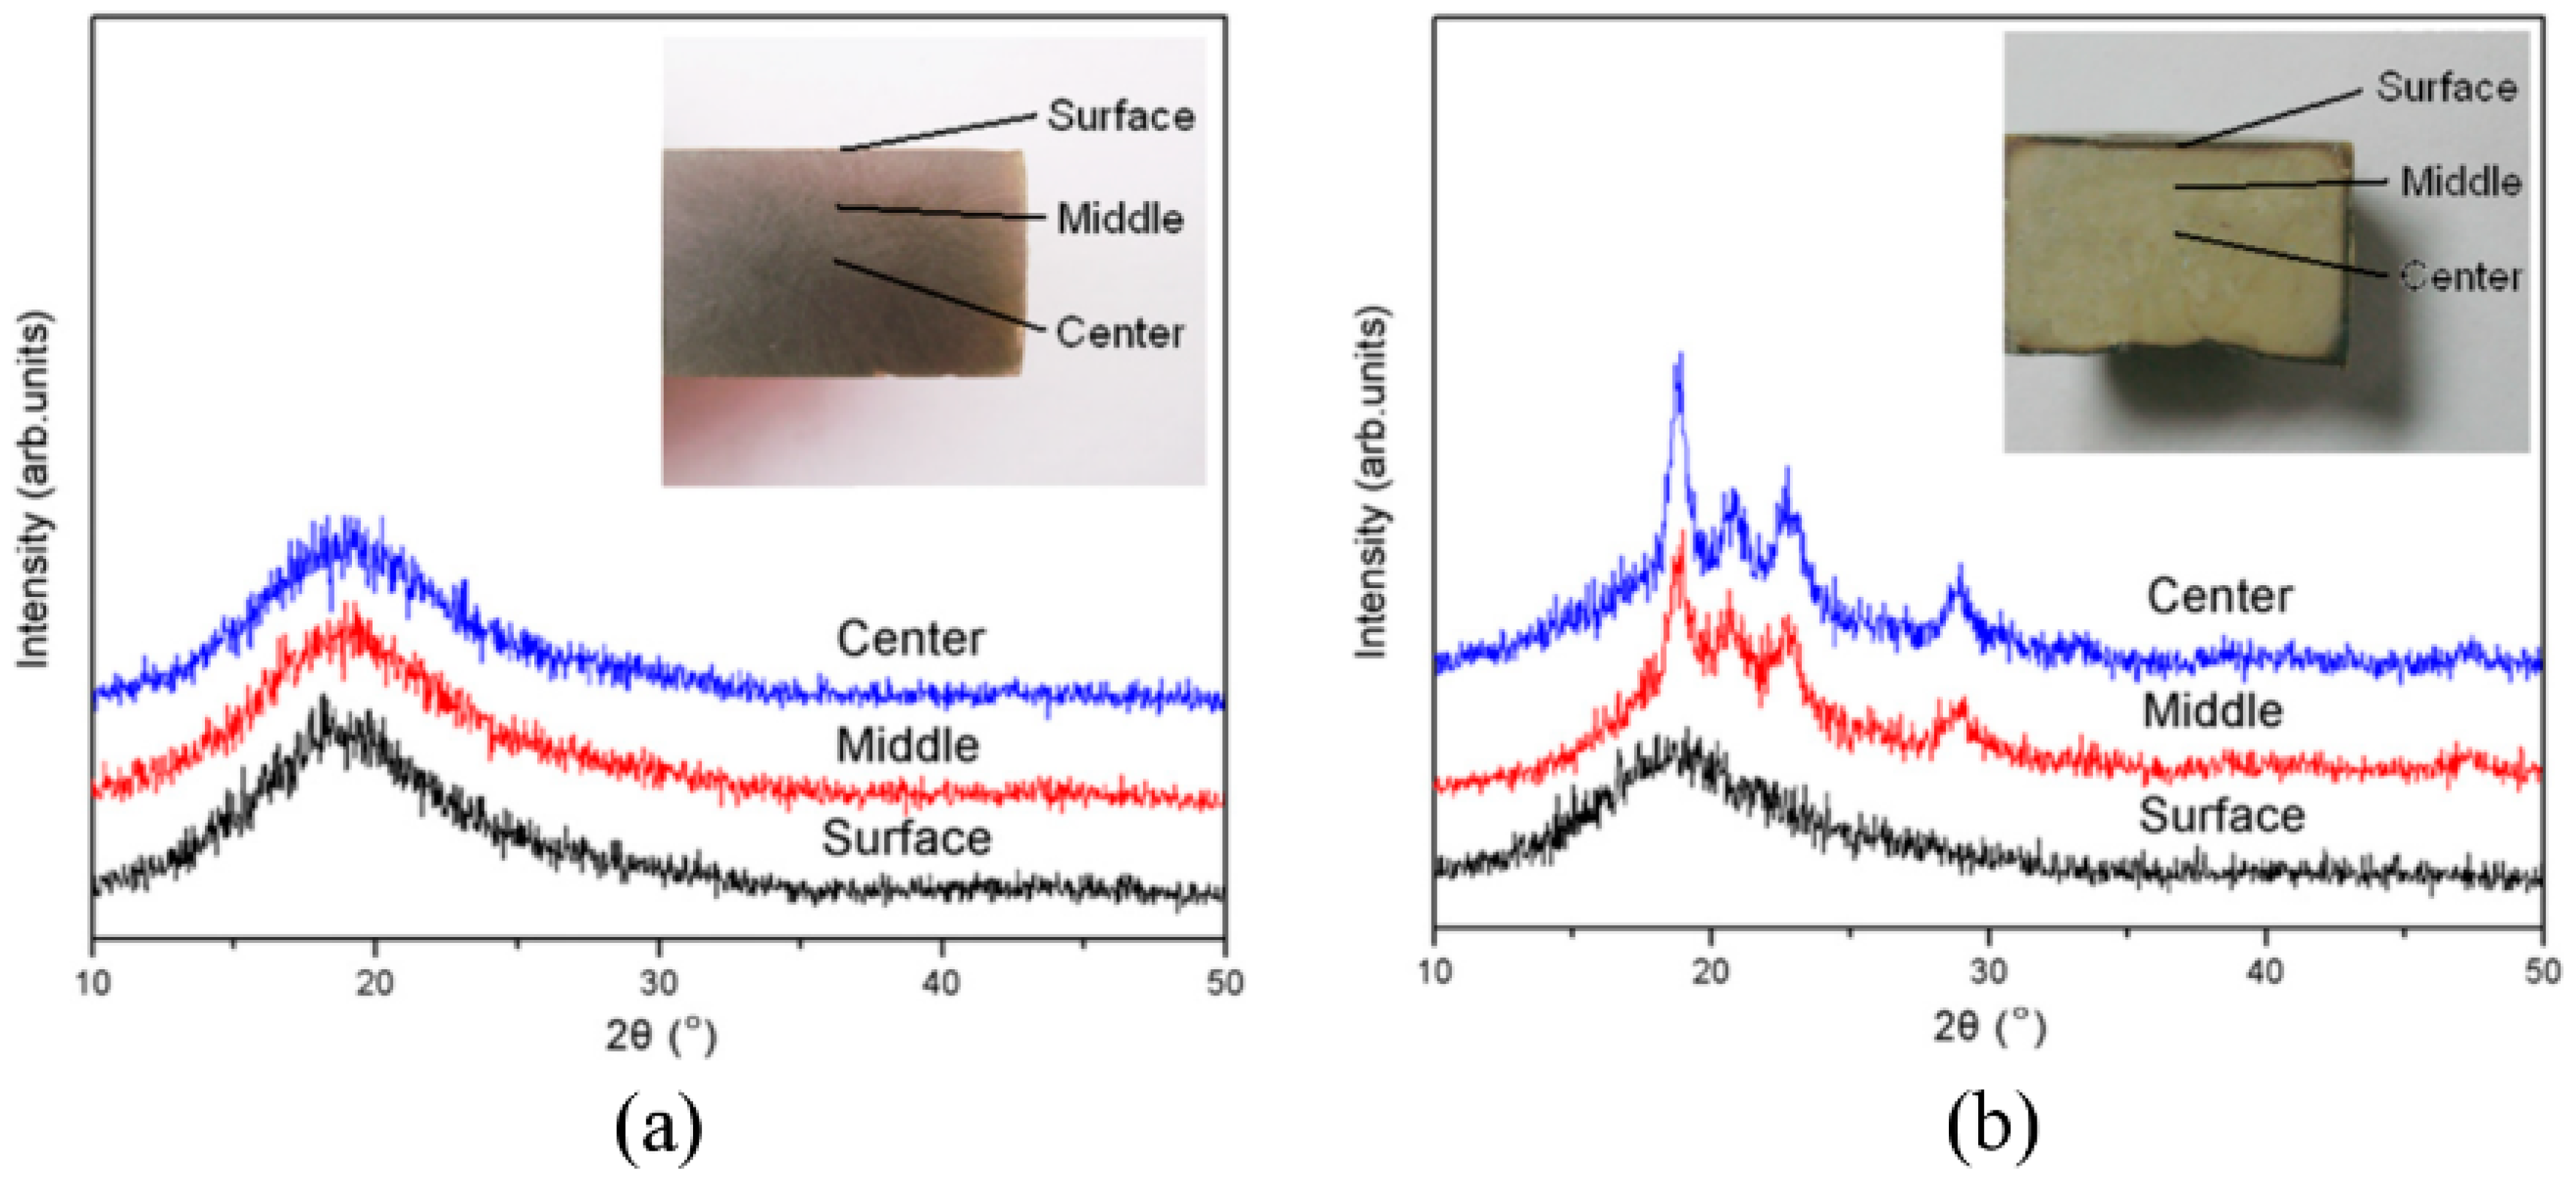
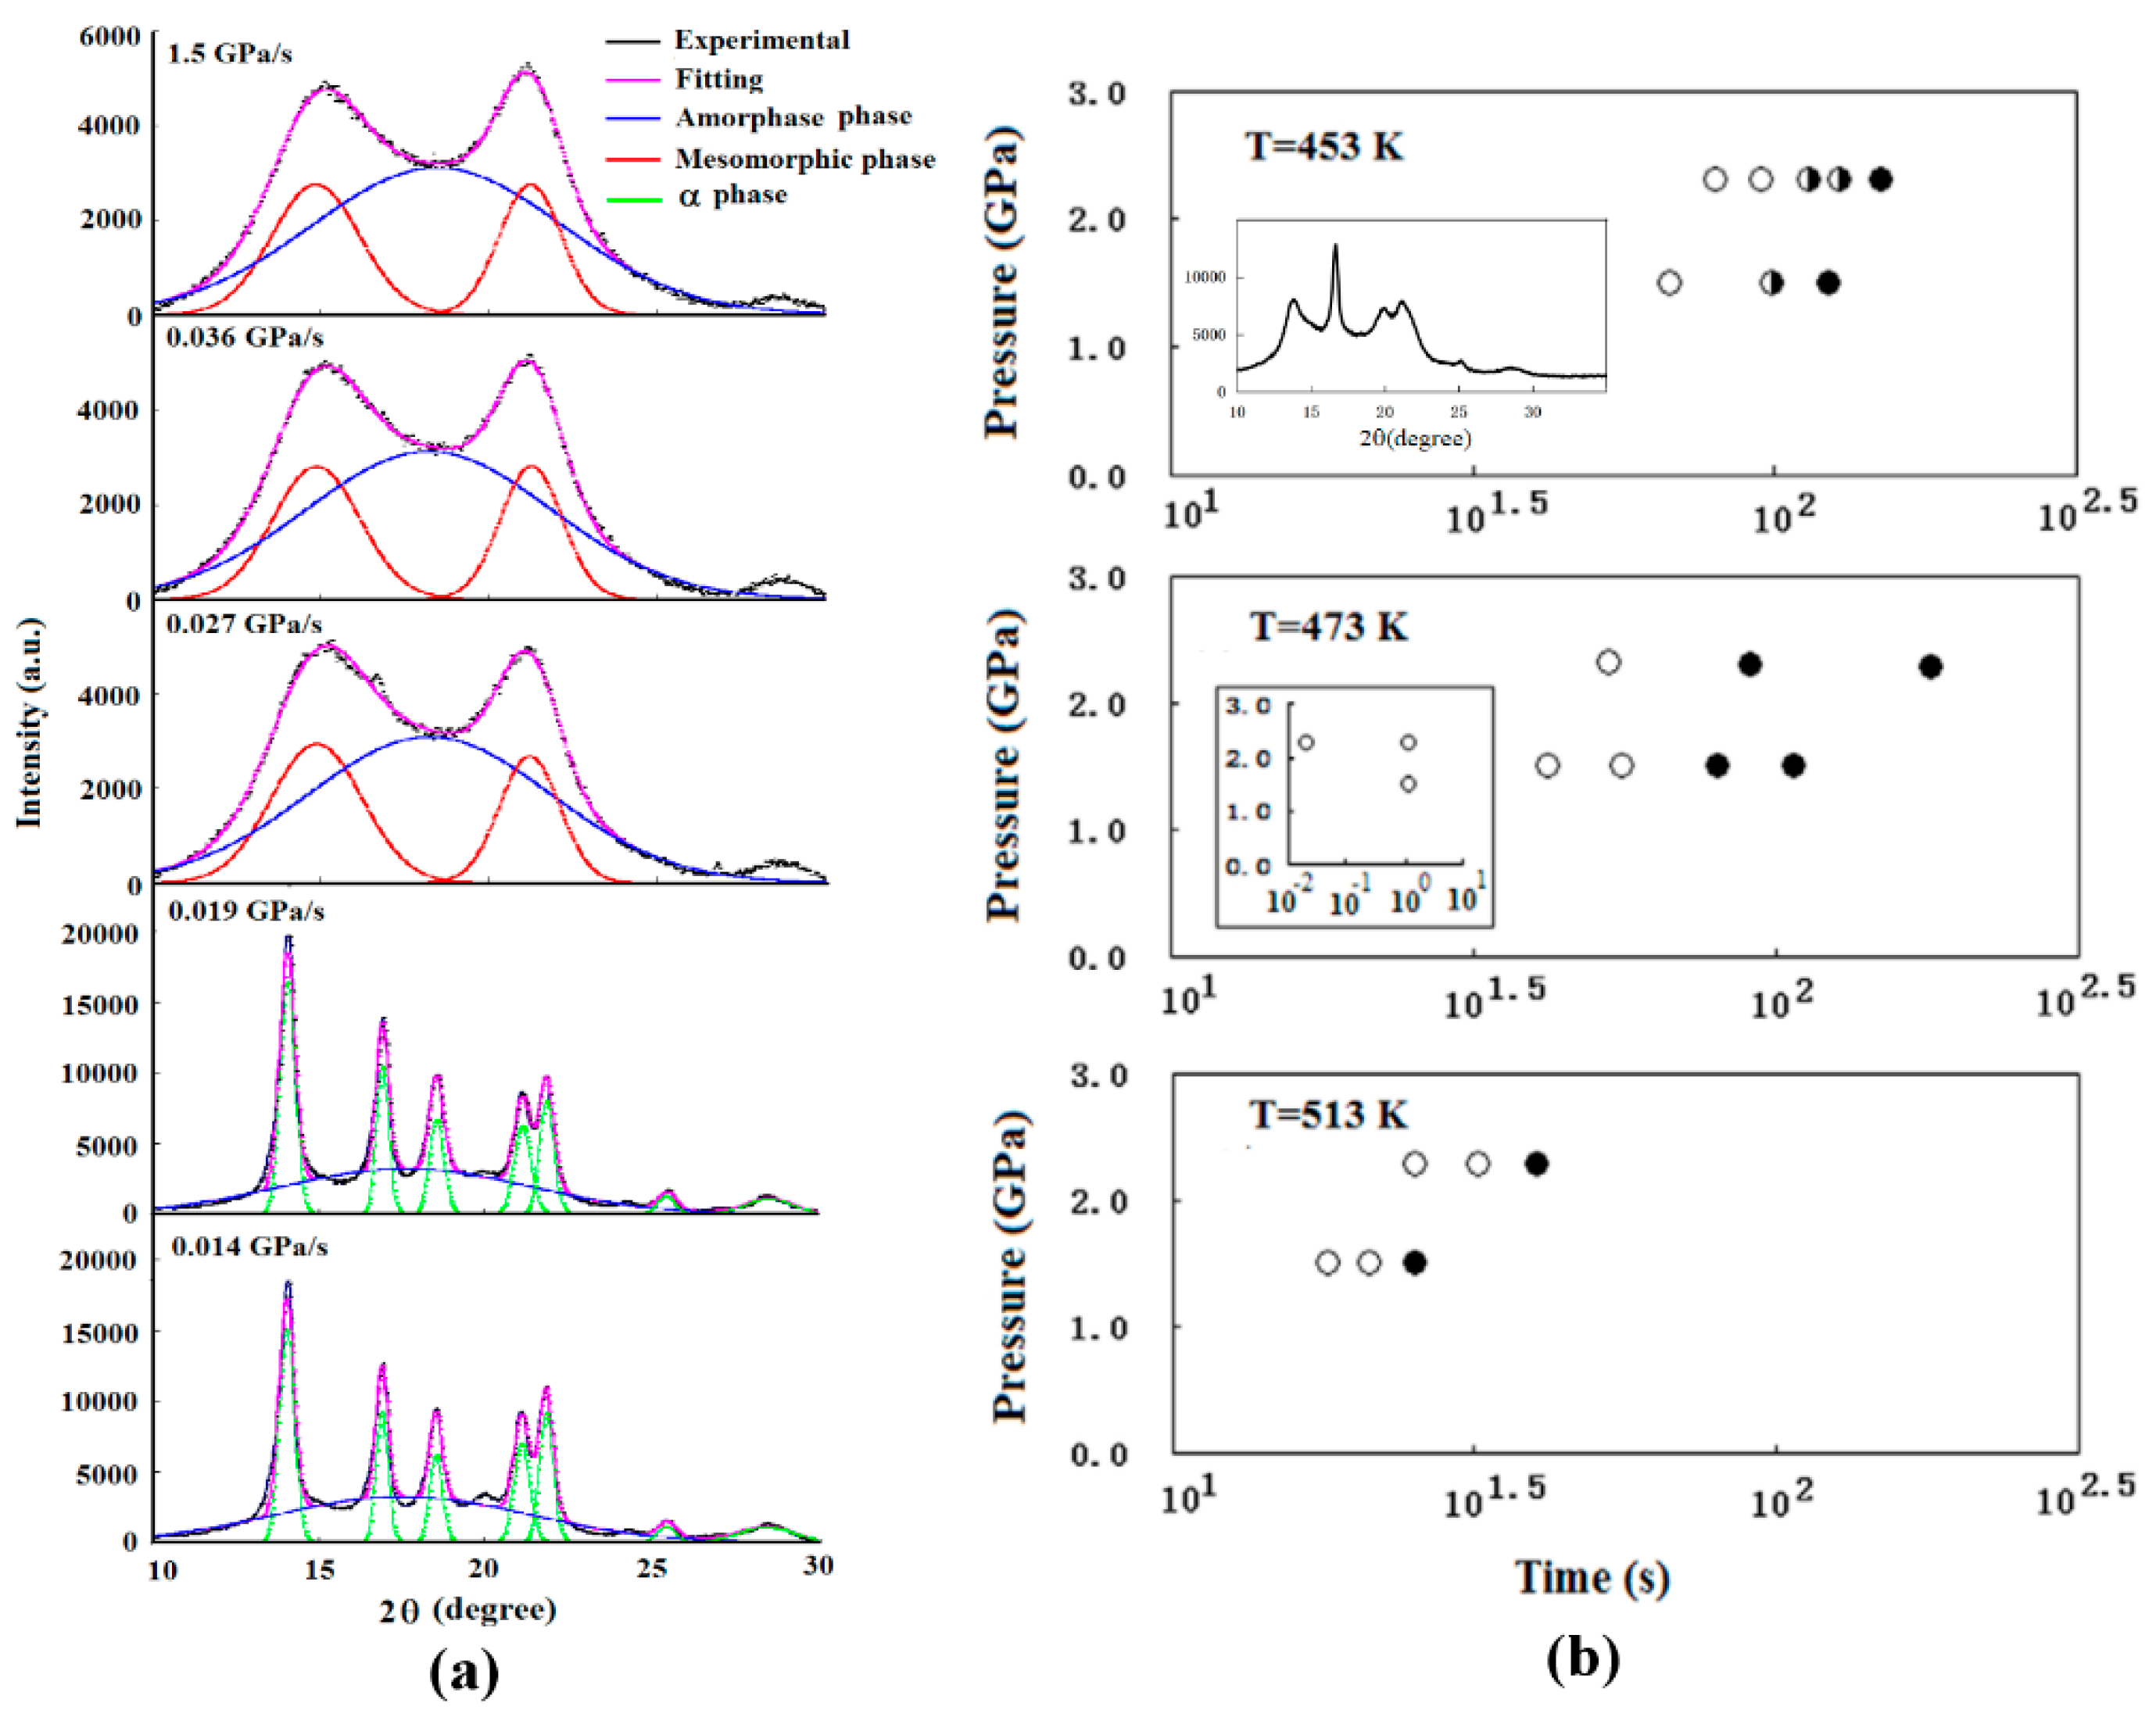
3.2.1. iPP
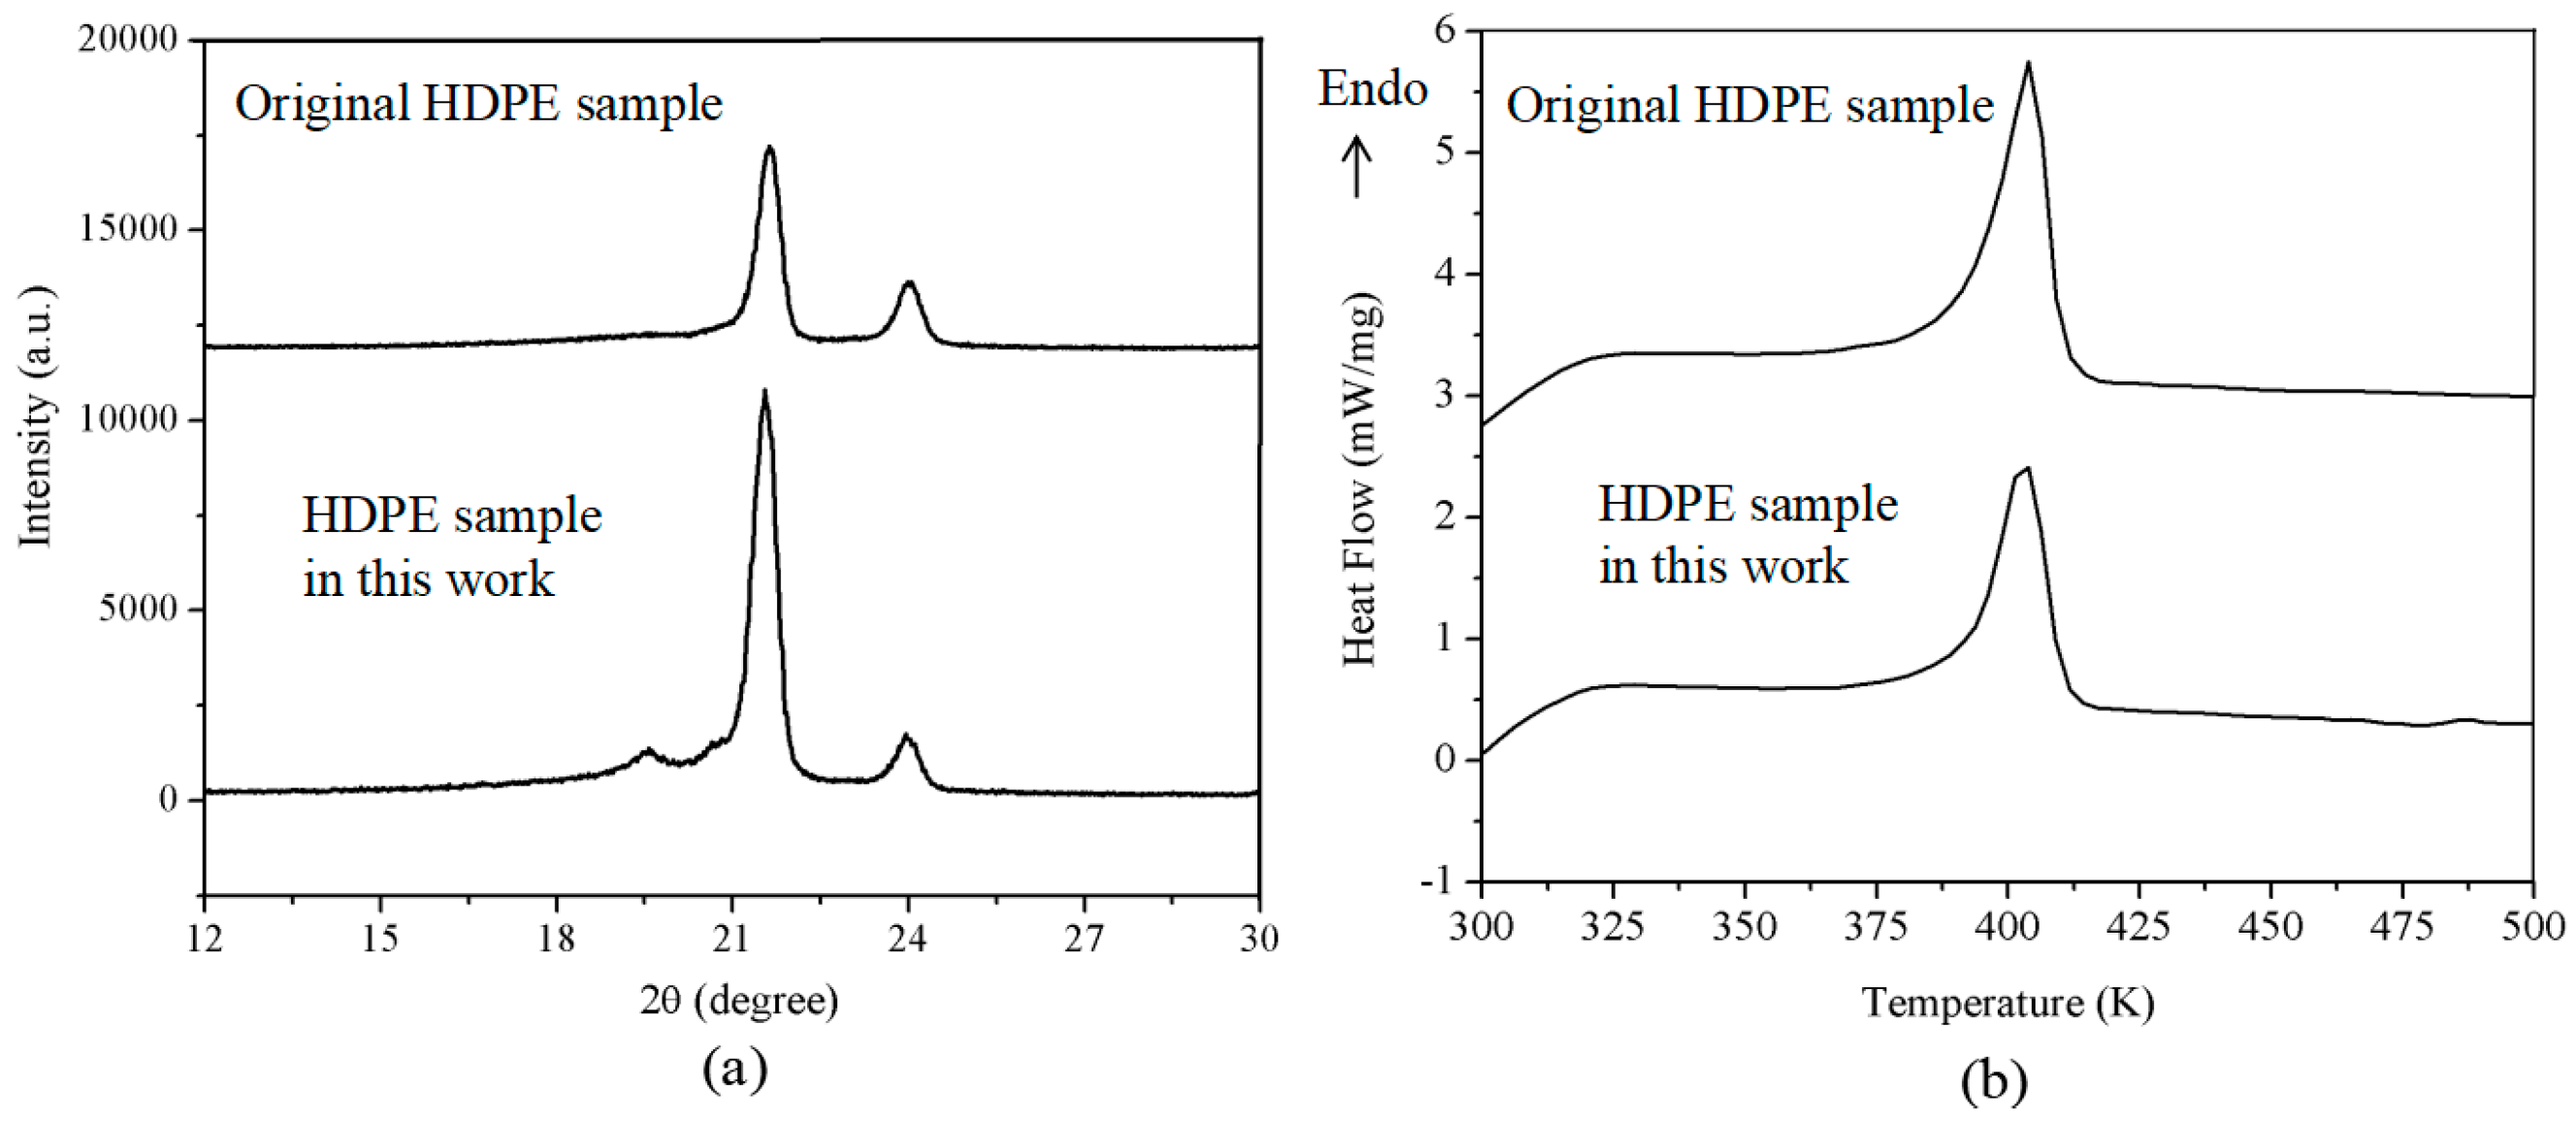
3.2.2. HDPE
3.3. Properties of Amorphous PEEK and Amorphous Sulfur
3.3.1. Mechanical Properties of Amorphous PEEK
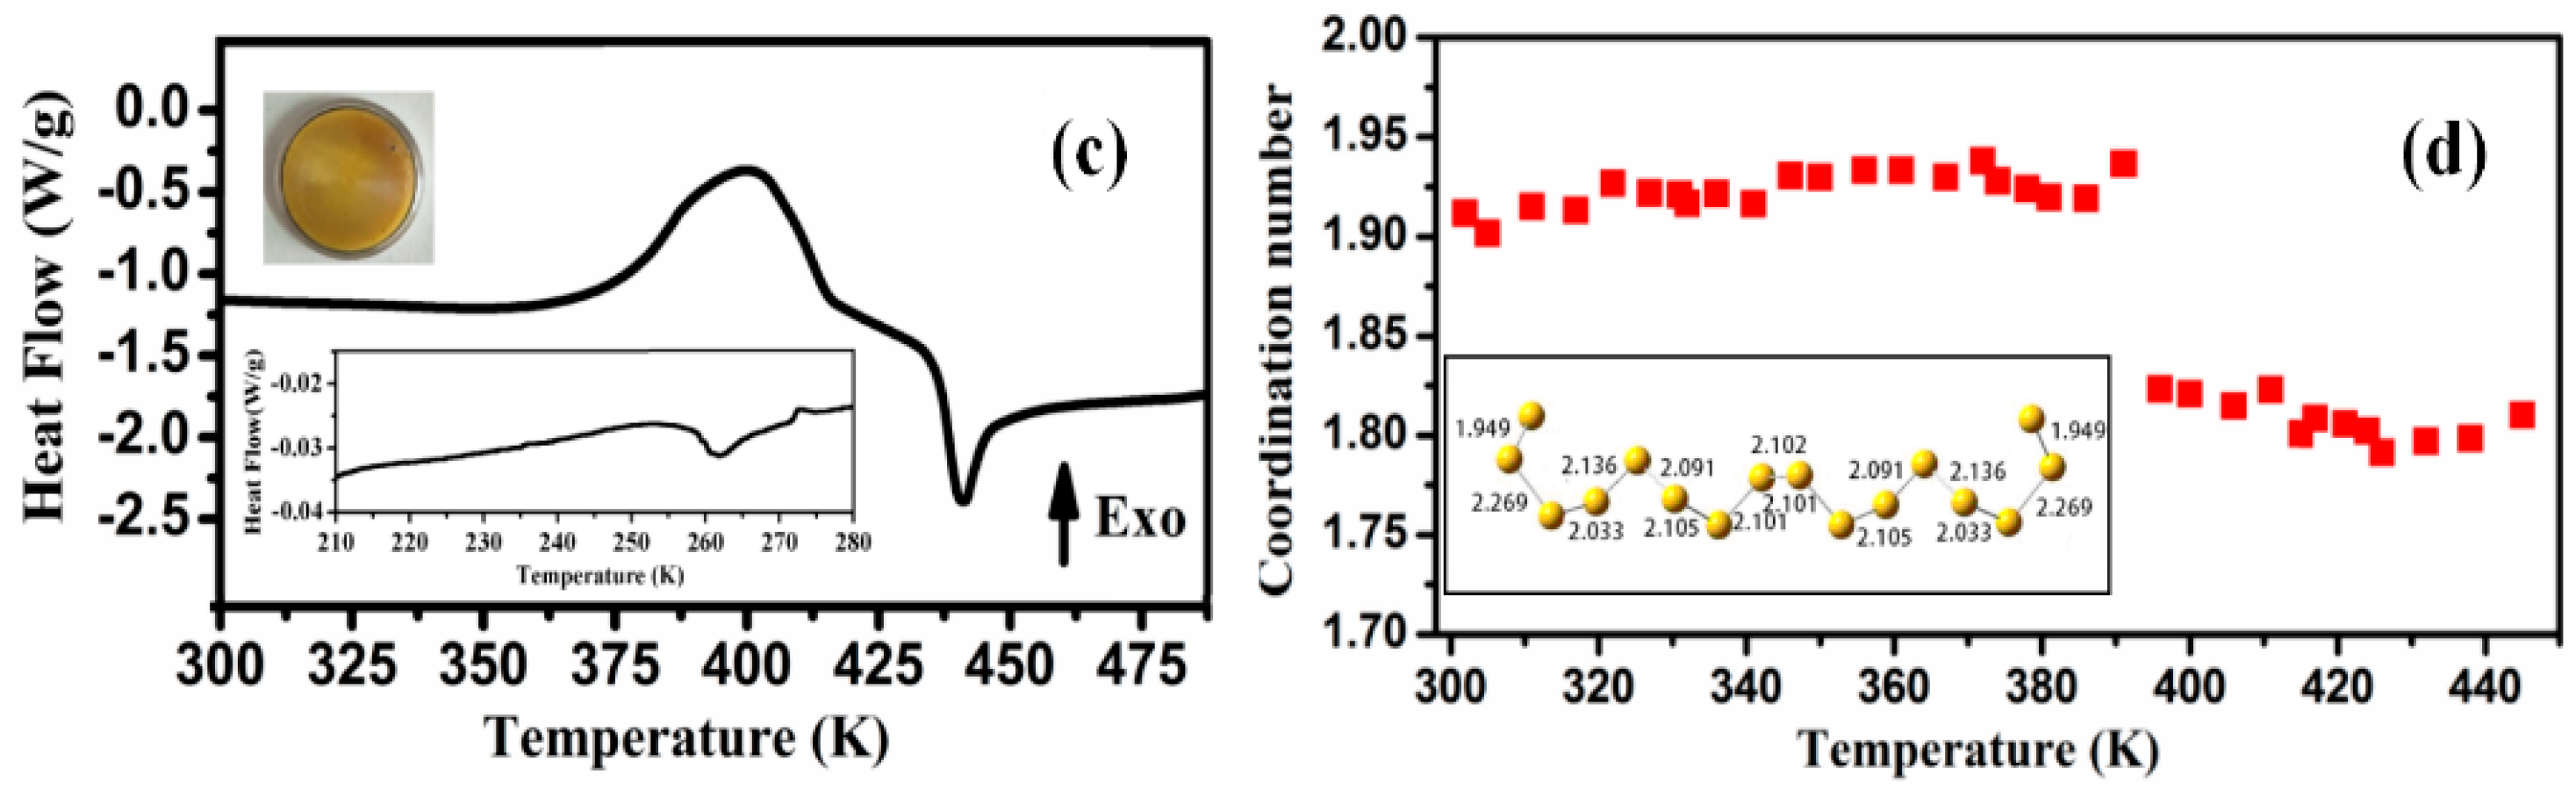
3.3.2. Thermal Stability of Amorphous Sulfur
4. Conclusions
Author Contributions
Acknowledgments
Conflicts of Interest
References
- Mao, H.K.; Hemley, R.J. The high-pressure dimension in earth and planetary science. Proc. Acad. Natl. Sci. USA 2007, 104, 9114–9115. [Google Scholar] [CrossRef] [PubMed]
- Ward, I.M. Mechanical Properties of Solid Polymer; John Wiley: New York, NY, USA, 1983. [Google Scholar]
- Kazmierczak, T.; Galeski, A.; Argon, A.S. Plastic deformation of polyethylene crystals as a function of crystal thickness and compression rate. Polymer 2005, 46, 8926–8936. [Google Scholar] [CrossRef]
- Li, L.B.; Huang, R.; Zhang, L.; Hong, S.M. A new mechanism in the formation of PET extended-chain crystal. Polymer 2001, 42, 2085–2089. [Google Scholar]
- Tonpheng, B.; Yu, J.; Anderson, B.M.; Anderson, O. Tensile Strength and Young’s Modulus of Polyisoprene/Single-Wall Carbon Nanotube Composites Increased by High Pressure Cross-linking. Macromolecules 2010, 43, 7680–7688. [Google Scholar] [CrossRef]
- Jund, P.; Caprion, D.; Jullien, R. Is There an Ideal Quenching Rate for an Ideal Glass. Phys. Rev. Lett. 1997, 79, 91–94. [Google Scholar] [CrossRef]
- Wang, W.H. The nature and properties of amorphous matter. Prog. Phys. 2013, 33, 177–351. [Google Scholar]
- Hong, S.M.; Chen, L.Y.; Liu, X.R. High Pressure Jump Apparatus for Measuring Grüneisen Parameter of NaCl and Studying Metastable Amorphous Phase of Poly(ethylene terephthalate). Rev. Sci. Instrum. 2005, 76, 053905. [Google Scholar] [CrossRef]
- Jia, R.; Shao, C.G.; Su, L.; Huang, D.H.; Liu, X.R.; Hong, S.M. Rapid Compression Induced Solidification of Bulk Amorphous Sulfur. J. Phys. D Appl. Phys. 2007, 40, 3763–3766. [Google Scholar] [CrossRef]
- Hong, S.M.; Liu, X.R.; Su, L.; Huang, D.H.; Li, L.B. Rapid Compression induced solidification of two amorphous phases of poly(ethylene terephthalate). J. Phys. D Appl. Phys. 2006, 39, 3684–3688. [Google Scholar] [CrossRef]
- Yuan, C.S.; Hong, S.M.; Li, X.X.; Shen, R.; He, Z.; Lv, S.J.; Liu, X.R.; Lv, J.; Xi, D.K. Rapid compression preparation and characterization of oversized bulk amorphous polyether-ether-ketone (PEEK). J. Phys. D Appl. Phys. 2011, 44, 165405. [Google Scholar] [CrossRef]
- Yu, P.; Wang, W.H.; Wang, R.J.; Lin, S.X.; Liu, X.R.; Hong, S.M.; Bai, H.Y. Understanding exceptional thermodynamic and kinetic stability of amorphous sulfur obtained by rapid compression. Appl. Phys. Lett. 2009, 94, 011910. [Google Scholar] [CrossRef]
- Wang, M.Y.; Liu, X.R.; Zhang, C.R.; Zhang, D.D.; He, Z.; Yang, G.; Shen, R.; Hong, S.M. Compression-rate dependence of solidified structure from melt in isotactic polypropylene. J. Phys. D Appl. Phys. 2013, 46, 145307. [Google Scholar] [CrossRef]
- Phillips, P.J.; Tseng, H.T. Influence of pressure on crystallization in Poly(ethylene terephthalate). Macromolecules 1989, 22, 1649–1655. [Google Scholar] [CrossRef]
- Knocke, U.; Zachmann, H.G.; Baltá-Calleja, F.J. New Aspects Concerning the Structure and Degree of Crystallinity in High-Pressure-Crystallized Poly(ethylene terephthalate). Macromolecules 1996, 29, 6019–6022. [Google Scholar]
- He, J.; Zoller, P. Crystallization of polypropylene, nylon-66 and Poly(ethylene terephthalate) at pressures to 200 MPa: Kinetics and characterization of products. Polym. J. Sci. Polym. Phys. 1994, 32, 1049–1067. [Google Scholar] [CrossRef]
- Steudel, R. Liquid Sulfur; Springer: Berlin/Heidelberg, Germany, 2003; Volume 230, pp. 81–116. [Google Scholar]
- Andrikopoulos, K.S.; Kalampounias, A.G.; Falagara, O.; Yannopoulos, S.N. The glassy and supercooled state of elemental sulfur: Vibrational modes, structure metastability, and polymer content. J. Chem. Phys. 2013, 139, 124501. [Google Scholar] [CrossRef] [PubMed]
- Tang, F.; Zhang, L.J.; Liu, F.L.; Sun, F.; Yang, W.G.; Wang, J.L.; Liu, X.R.; Shen, R. Pressure-induced solidification of liquid sulfur below and above λ-transition. Chin. Phys. B 2016, 25, 046102. [Google Scholar] [CrossRef]
- Zhang, L.J.; Ren, Y.; Liu, X.R.; Han, F.; Evans-Lutterodt, K.; Wang, H.Y.; He, Y.L.; Wang, J.L.; Zhao, Y.; Yang, W.G. Chain breakage in the supercooled liquid–liquid transition and re-entry of the λ-transition in sulfu. Sci. Rep. 2018, 8, 4558. [Google Scholar] [CrossRef] [PubMed]
- Shao, C.G.; An, H.N.; Wang, X.; Li, L.B.; Hong, S.M. Deformation-Induced Linear Chain-Ring Transition and Crystallization of Living Polymer Sulfur. Macromolecules 2007, 40, 9475–9481. [Google Scholar] [CrossRef]
- Turnbull, D.; Cohen, M.H. On the Free-Volume Model of the Liquid-Glass Transition. J. Chem. Phys. 1970, 52, 3038–3041. [Google Scholar] [CrossRef]
- Piccarolo, S.; Saiu, M.; Brucato, V.; Titomanlio, G. Crystallization of polymer melts under fast cooling. II. High-purity iPP. J. Appl. Polym. Sci. 1992, 46, 625–634. [Google Scholar] [CrossRef]
- Lin, X.H.; Johnson, W.L. Formation of Ti–Zr–Cu–Ni bulk metallic glasses. J. Appl. Phys. 1995, 78, 6514–6519. [Google Scholar] [CrossRef]
- Coccorullo, I.; Pantani, R.; Titomanlio, G. Crystallization kinetics and solidified structure in iPP under high cooling rates. Polymer 2003, 44, 307–318. [Google Scholar] [CrossRef]
- Gradys, A.; Sajkiewicz, P.; Minakov, A.A.; Adamovsky, S.; Schick, C.; Hashimoto, T.; Saijo, K. Crystallization of polypropylene at various cooling rates. Mater. Sci. Eng. A 2005, 413–414, 442–446. [Google Scholar] [CrossRef]


| Sample Size (Diameter, Height) | Temperature of Melt | Terminal Pressure of Pressure-Jump | Compression Rate | Tg/K | Tx/K | |
|---|---|---|---|---|---|---|
| PET [12] | 22 mm, 4 mm | 563 K | 2 GPa | 100 GPa/s | - | 371 |
| PEEK [13] | 24 mm, 12 mm | 633 K | 2 GPa | 100 GPa/s | 413.6 | 449.1 |
| Sulfur [11] | 20 mm, 3 mm | 423 K | 2 GPa | 100 GPa/s | 262 [14] | - |
| iPP [15] | 18 mm, 3 mm | 473 K | 2.3 GPa | 115 GPa/s | - | - |
| HDPE | 20 mm 1.8 mm | 457 K | 2 GPa | 100 GPa/s | - | - |
© 2018 by the authors. Licensee MDPI, Basel, Switzerland. This article is an open access article distributed under the terms and conditions of the Creative Commons Attribution (CC BY) license (http://creativecommons.org/licenses/by/4.0/).
Share and Cite
Liu, X.; Zhang, L.; Yuan, C.; Jia, R.; Shao, C.; Wang, M.; Hong, S. A Study of the Pressure-Induced Solidification of Polymers. Polymers 2018, 10, 847. https://doi.org/10.3390/polym10080847
Liu X, Zhang L, Yuan C, Jia R, Shao C, Wang M, Hong S. A Study of the Pressure-Induced Solidification of Polymers. Polymers. 2018; 10(8):847. https://doi.org/10.3390/polym10080847
Chicago/Turabian StyleLiu, Xiuru, Linji Zhang, Chaosheng Yuan, Ru Jia, Chunguang Shao, Mingyou Wang, and Shiming Hong. 2018. "A Study of the Pressure-Induced Solidification of Polymers" Polymers 10, no. 8: 847. https://doi.org/10.3390/polym10080847
APA StyleLiu, X., Zhang, L., Yuan, C., Jia, R., Shao, C., Wang, M., & Hong, S. (2018). A Study of the Pressure-Induced Solidification of Polymers. Polymers, 10(8), 847. https://doi.org/10.3390/polym10080847