Synthesis and Characterization of Wooden Magnetic Activated Carbon Fibers with Hierarchical Pore Structures

1
Ministry of Agriculture Key Laboratory of Biology and Genetic Resource Utilization of Rubber Tree/State Key Laboratory Breeding Base of Cultivation & Physiology for Tropical Crops, Rubber Research Institute, Chinese Academy of Tropical Agricultural Sciences, Danzhou 571737, China
2
College of Packaging & Printing Engineering, Tianjin University of Science & Technology, Tianjin 300222, China
*
Author to whom correspondence should be addressed.
Polymers 2018, 10(4), 435; https://doi.org/10.3390/polym10040435
Submission received: 16 March 2018
/
Revised: 7 April 2018
/
Accepted: 11 April 2018
/
Published: 13 April 2018
(This article belongs to the Special Issue Bio-Based Resins and Crosslinked Polymers from Renewable Resources)
Abstract
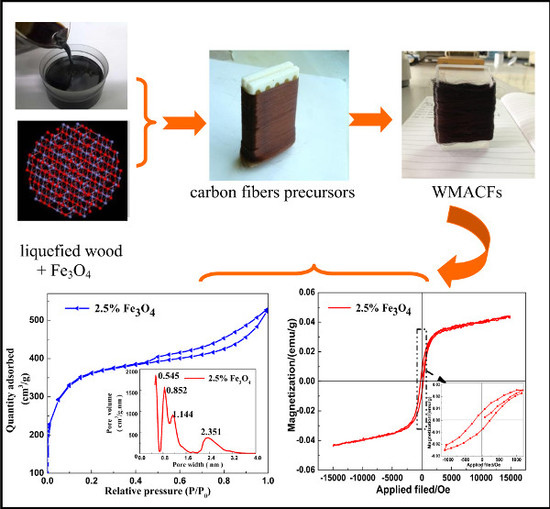
:Wooden magnetic activated carbon fibers (WMACFs) with hierarchical pore structures were obtained by adding magnetic iron oxide (Fe3O4) nanoparticles into the liquefied wood. The structures and properties of WMACFs were analyzed by scanning electronmicroscopy (SEM), X-ray diffraction (XRD), Fourier transform infrared spectroscopy (FTIR), N2 adsorption, and vibrating sample magnetometer (VSM). The results showed that WMACFs had high Brunauer-Emmett-Teller (BET) surface area (1578 m2/g) and total pore volume (0.929 cm3/g), of which 45% was the contribution of small mesopores of 2–3 nm. It is believed that Fe3O4 nanoparticles play an important role in the formation of hierarchical pores. With the Fe3O4 content increasing, the yield rate of WMACFs decreased, and the Fe3O4 crystal plane diffraction peaks and characteristic adsorption peaks were obviously observed. At the same time, it was also found that WMACFs had favorable magnetic properties when the Fe3O4 content was above 1.5%. As a result, WMACFs could be a promising candidate for high efficiency, low cost, and convenient separation for the magnetic field.
1. Introduction
Activated carbon fibers (ACFs), which have uniform slit-shaped micropores and great surface area, have played a major role in adsorption technology over the last few years [1]. However, ACFs are microporous with pore diameter ranging from 0.3 to 0.5 nm [2], resulting in challenges for applying ACFs in some areas, especially those that require adsorption of bulky molecules from solutions and macromolecular reactions with catalyst supports evolved. Recently, ACFs with hierarchical pore structures have attracted much attention because of their excellent adsorptive properties based on highly developed multi-porous structures [3,4,5]. Various methods have been carried out to prepare ACFs with hierarchical pore structures. For example, previous research has shown that wooden activated carbon fibers (WACFs) with highly developed mesopores have been successfully prepared by steam activation with the addition of wood charcoal, resulting in the specific Brunauer-Emmett-Teller surface area (SBET) and the ratio of the mesopore volume to the total pore volume (MP-ratio) of ACFs increasing significantly [6,7].
Moreover, the used ACFs often suffer from serious problems of separation in liquid-solid phase processes and cause secondary pollution to the environment [8]. Magnetic technology makes it possible to effectively separate and recover the spent ACFs through a simple magnetic process and exhibits excellent ability to separate nanosized materials with many advantages, including easy operation and low cost [9]. Fe3O4 nanoparticles are the most popular and commonly used magnetic source in magnetic separation due to its superior magnetic performance, low toxicity, and easy preparation [10]. Li et al. [11] designed and prepared a unique, multifunctional Fe3O4-activated carbon-sodium alginate composite absorbent (MSA-AC) that extracted dye from aqueous solutions. The results revealed that the MSA-AC has a potential application in wastewater treatment and in the development of composite absorbent that is simple and fast to prepare, cost-effective, and environmentally friendly. Shi et al. [12] prepared carbon–iron composites from waste cation exchange resin through NaOH activation. The composite, synthesized at 800 °C, could effectively remove diethyl phthalate, bisphenol A, and malachite green from aqueous solutions. Yang et al. [13] synthesized magnetic Fe3O4-activated carbon nanocomposite from rice husk based activated carbon. The system demonstrated perfect magnetic separation performance and a high adsorption capacity of 321 mg/g for methylene blue (MB) from aqueous solutions. It is expected that the obtained magnetic materials can be used as potential sorbents for the removal of various toxic pollutants from wastewater. In recent years, scholars have explored the introduction of magnetic nanoparticles into ACFs and have become more focused on physically mixing ACFs with metallic oxide before carbonization and activation to obtain ACFs with hierarchical pore structures through the catalytic activation method [14,15]. It is expected that Fe3O4 nanoparticles as additives will play an important role in the multi-pore formation of ACFs. Currently, most methods synthesize Fe3O4 in a carbon matrix using activated carbon materials as the carbon source, such as using the impregnating method in Fe3+ solution [16]. This, however, only loads the magnetic nanoparticles on the surface of the ACFs, and the supported nanoparticles easily fall off, resulting in the decrease of the adsorption capacity and reuse times after adsorption saturation. Very few studies have been done that combine Fe3O4 nanoparticles with WACFs.
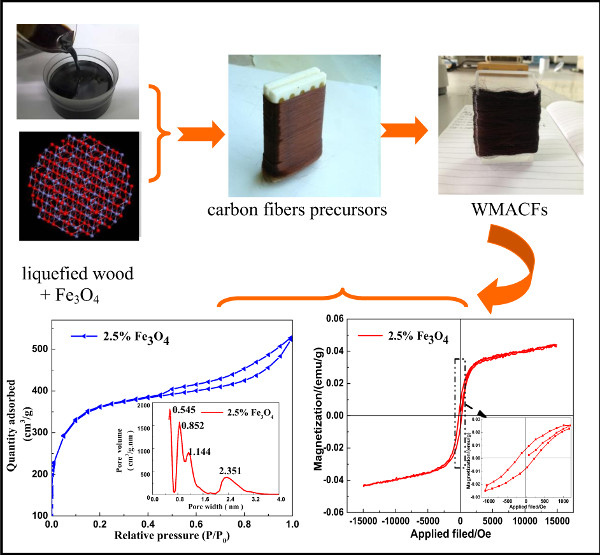
Based on our previous work [17,18], using Fe3O4 nanoparticles as an additive, wooden magnetic activated carbon fibers (WMACFs) from Chinese fir (Cunninghamia lanceolata) were prepared by phenol liquefaction, melt spinning, curing, and activation using steam. The morphological, chemical, and microcrystalline structures of the synthesized WMACFs were characterized using a wide array of analytical methods. In addition, in order to understand the relationship between Fe3O4 contents, pore size distribution, and magnetic properties, the WMACFs were studied. The effects of different Fe3O4 contents on the specific surface area and magnetic properties were investigated in detail by N2 adsorption and vibrating sample magnetometer (VSM). This study effectively solves the disadvantages of the impregnating method and can obviously increase reuse times. It also provides reference value for further research.
2. Materials and Methods
2.1. Samples
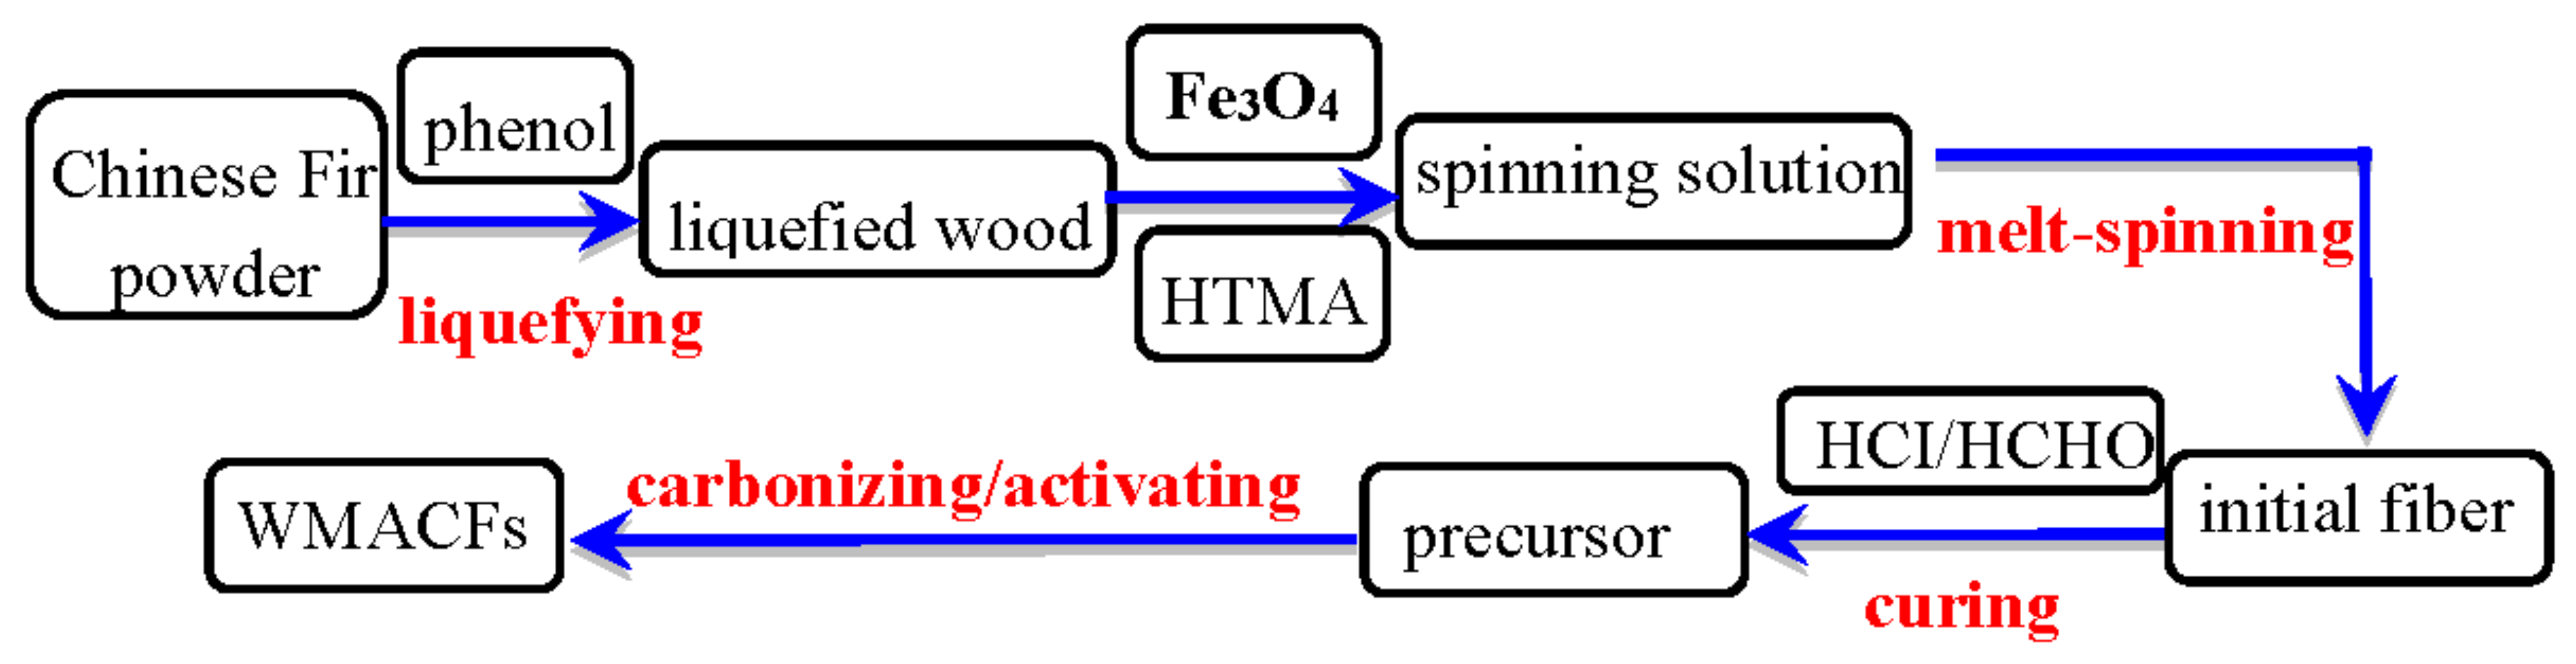
Chinese fir (Cunninghamia lanceolata) was firstly ground and screened to a particle size of 60–80 meshes to prepare the precursor fibers through a series of processes, including liquefaction, adding nano-Fe3O4 (Fe content ≥95%, relative density was 5.18 g/cm3, melting point was 1594 °C), melt-spinning, and curing in accordance with previous studies [19,20]. The precursors were put in a tube furnace, and the activation process was conducted with a temperature program from room temperature to the final activation temperature (800 °C) using a heating rate of 5 °C/min under N2 (200 cm3/min). The precursors were held isothermally for 40 min under a steam flow of 8 g/min and then cooled to room temperature to obtain the WMACFs [21]. Various contents (0–2.5 wt %) of Fe3O4 were used to investigate its influence on the WMACFs. The schematic of the production process is shown in Figure 1.
2.2. Characterizations
The surface morphologies of the WMACFs were examined using a SEM (NOVA Nano SEM430, FEI, Hillsboro, OR, USA) with an acceleration voltage of 10 keV.
The X-ray diffraction (XRD) analyses of the WMACFs were carried out at room temperature on a power X-ray diffractometer (D/max-2500, Rigaku, Tokyo, Japan) using Cu Kα radiation (wavelength was 0.154 nm, powdered samples). The XRD analysis conditions were as follows: scanning range of 5°–60°, scanning rate of 2°/min at 40 kV and 100 mA.
In order to examine the differences between the microcrystalline structures of the WMACFs at various Fe3O4 contents, the apparent value of the planar size (La(110)), the bulk thickness (Lc(002)) of the graphite sheet layer, the average crystallite size (D), and the layer spacing d002 were calculated using the Scherrer and Bragg formulas [22,23]. The formulas were as follows:
where λ is the wavelength of the X-ray (0.154 nm); θ is the Bragg angle of (002), (100), and (311) peaks (°); and β is the half-height width of (002), (100), and (311) peaks (rad).
Lc(002), D = 0.89λ/βcosθ
La(110) = 1.84λ/βcosθ
d002 = λ/2sinθ
The graphitization degree of the WMACFs can be calculated by the layer spacing d002 [24]. The simplified formula is
where g is the graphitization degree (%); 0.3440 is the layer spacing of not completely graphited carbon material (nm); 0.3354 is the layer spacing of the ideal graphite crystal (nm); and d002 is the layer spacing (nm).
g = (0.3440 − d002)/(0.3440 − 0.3554)
The chemical characterization of the functional groups was detected using pressed potassium bromide (KBr) pellets containing 5% of the sample by Fourier-transform infrared spectrometry (Nicolet-6700, Thermo electron, Waltham, MA, USA) in the scanning range of 4000–500 cm−1.
The specific surface area and the porosity of the samples were determined by N2 adsorption-desorption isotherm measured at 77 K in a Micromeritics ASAP-2020 apparatus (Micromeritics, Norcross, GA, USA. Before analysis, the samples were degassed at 350 °C for 2 h. The SBET was calculated by the Brunauer-Emmett-Teller (BET) method using the N2 adsorption isotherm data. The total pore volume (Vtot) was evaluated by converting the amount of N2 adsorbed at a relative pressure of 0.995 to the volume of the liquid adsorbate. The micropore area (Smicro) and micropore volume (Vmicro) were obtained by t-plot method [25]. The mesopore area (Smeso) and mesopore volume (Vmeso) were calculated by Barrett-Joyner-Halenda (BJH) method [26]. Pore size distributions were calculated using the density functional theory (DFT) Plus software (provided by Micromeritics Instrument Corporation (Georgia, USA), which was based on calculated adsorption isotherms for pores of different sizes [27]. This program performs an inversion of the integral equation for the overall adsorption isotherm with respect to pore size distributions.
The yield rate η of the WMACFs can be expressed as:
where m0 and m are the masses of the specimen before and after activation, respectively.
η = m/m0 × 100%
The magnetic properties of the WMACFs were measured with a Lake Shore 7304 VSM (Lakeshore, Columbus, MS, USA) at room temperature.
3. Results and Discussion
3.1. Morphological Characteristics of the WMACFs
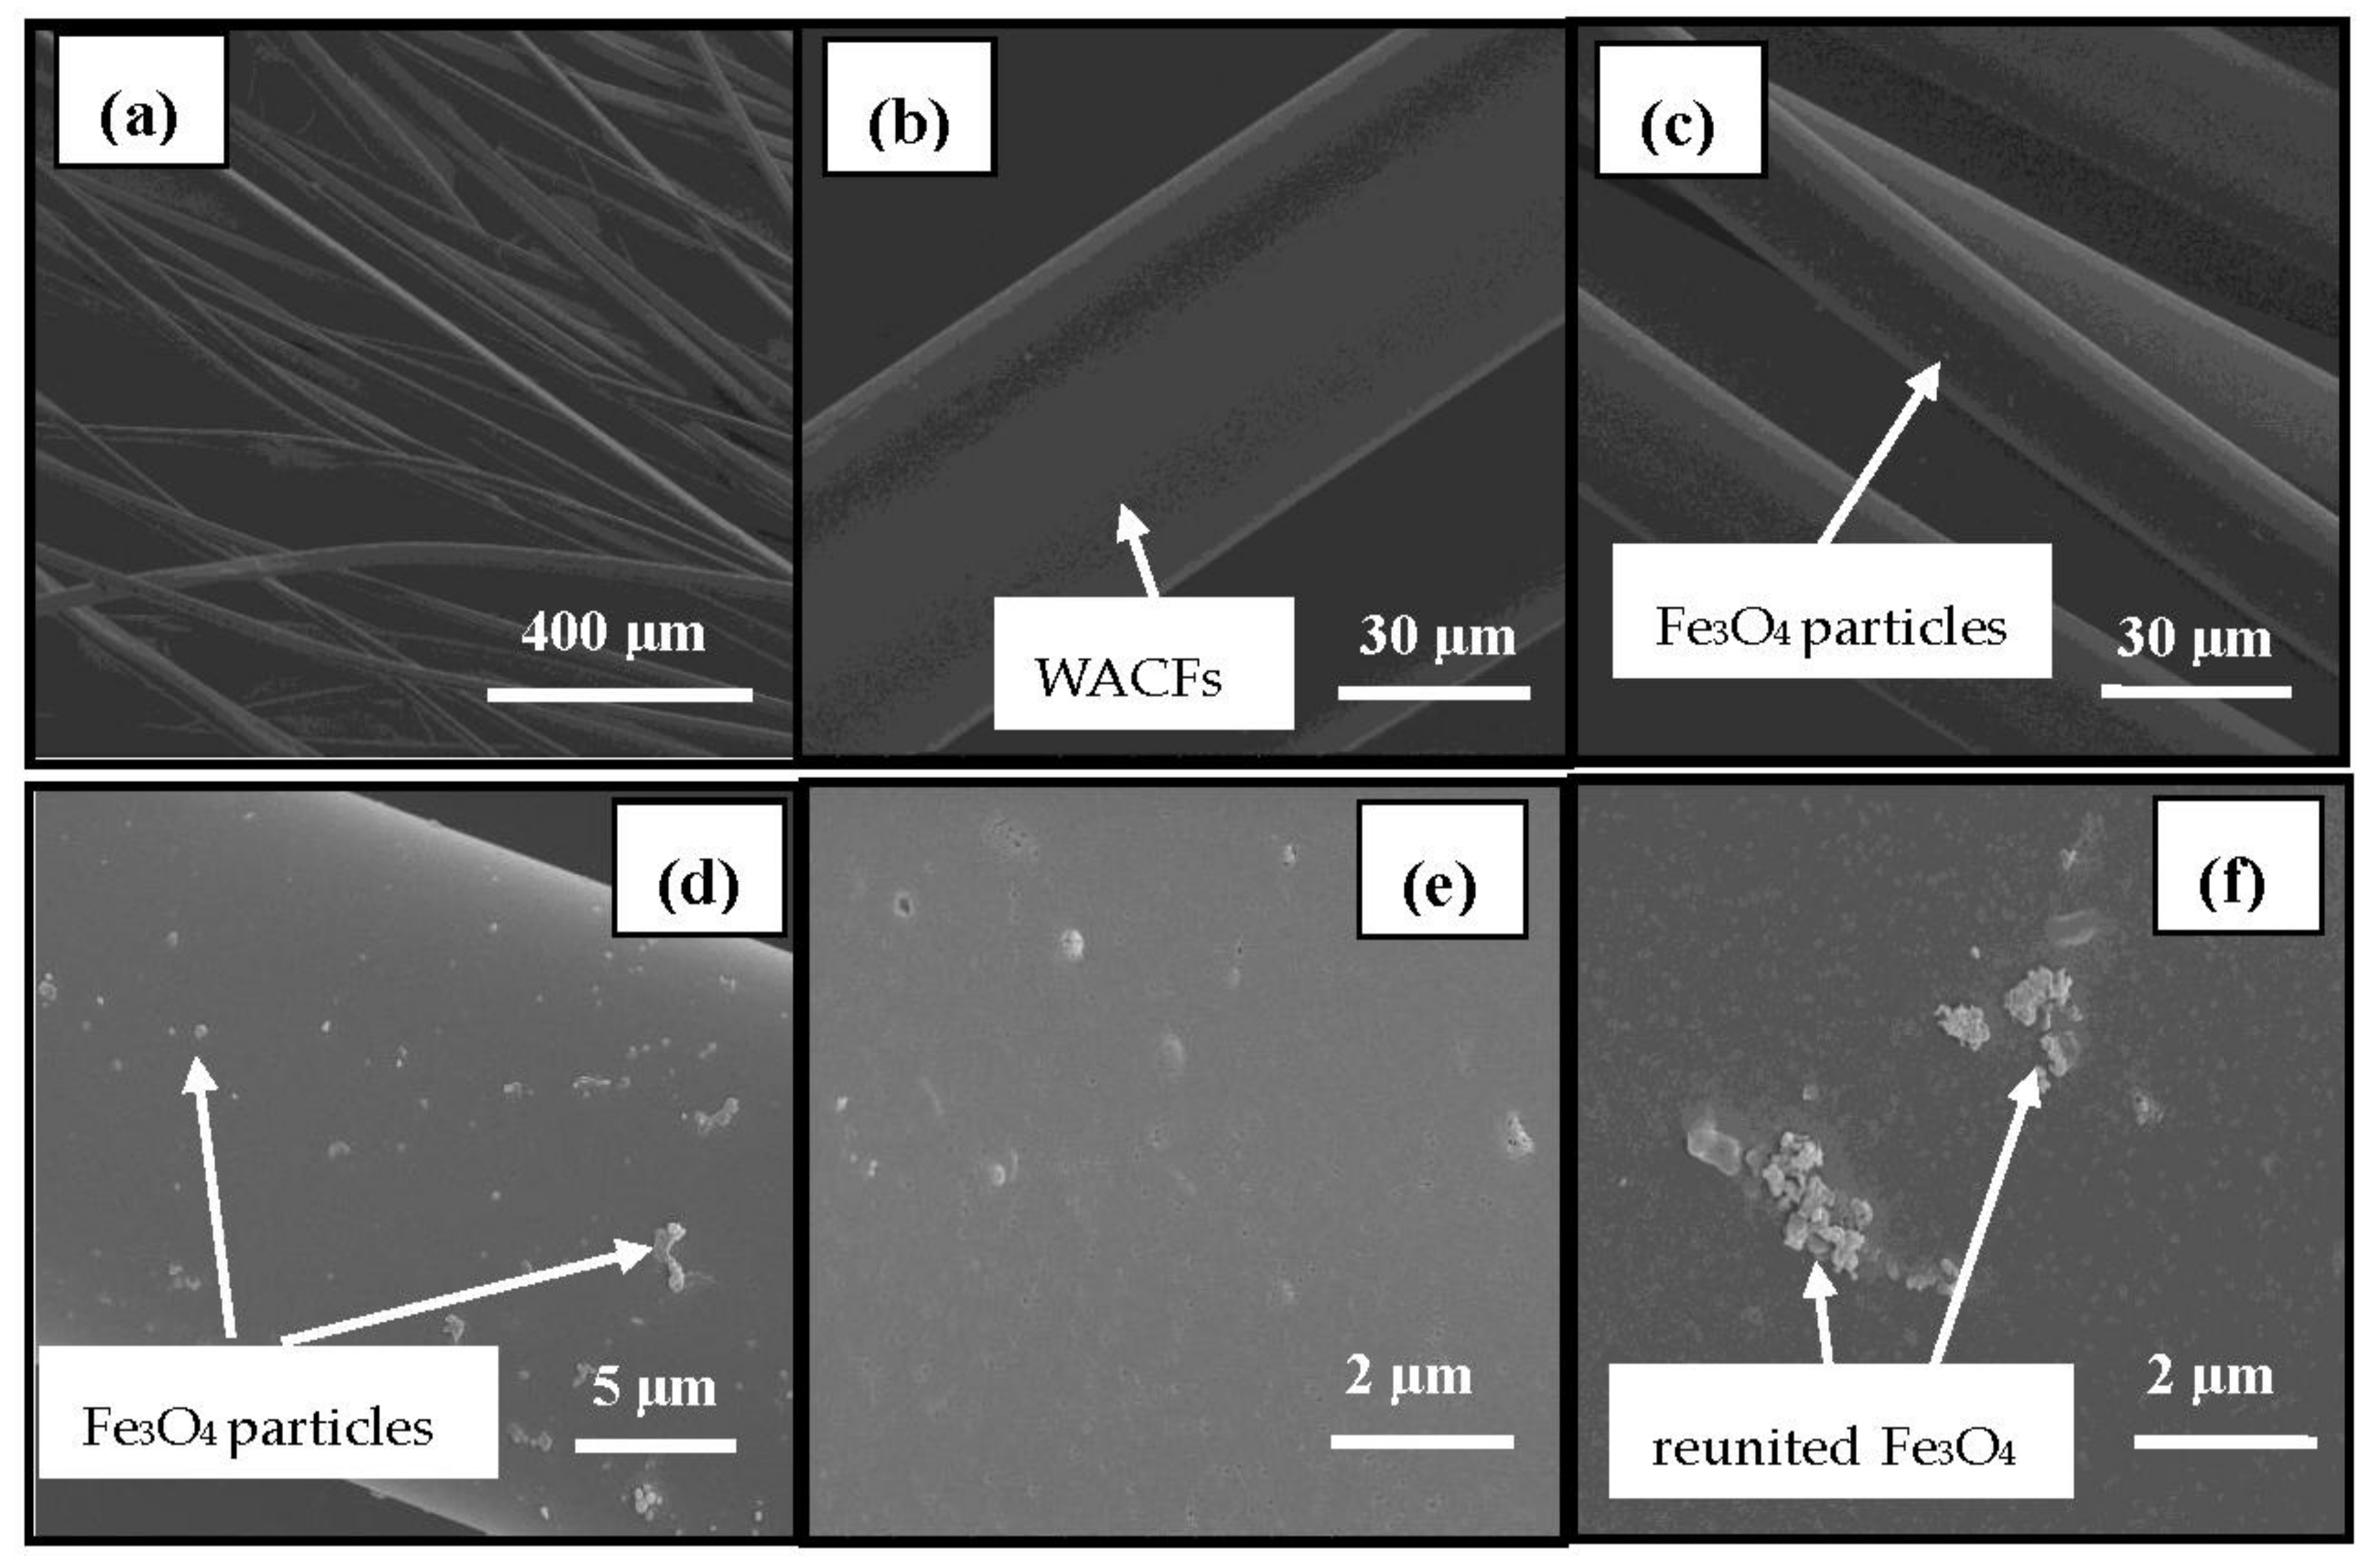
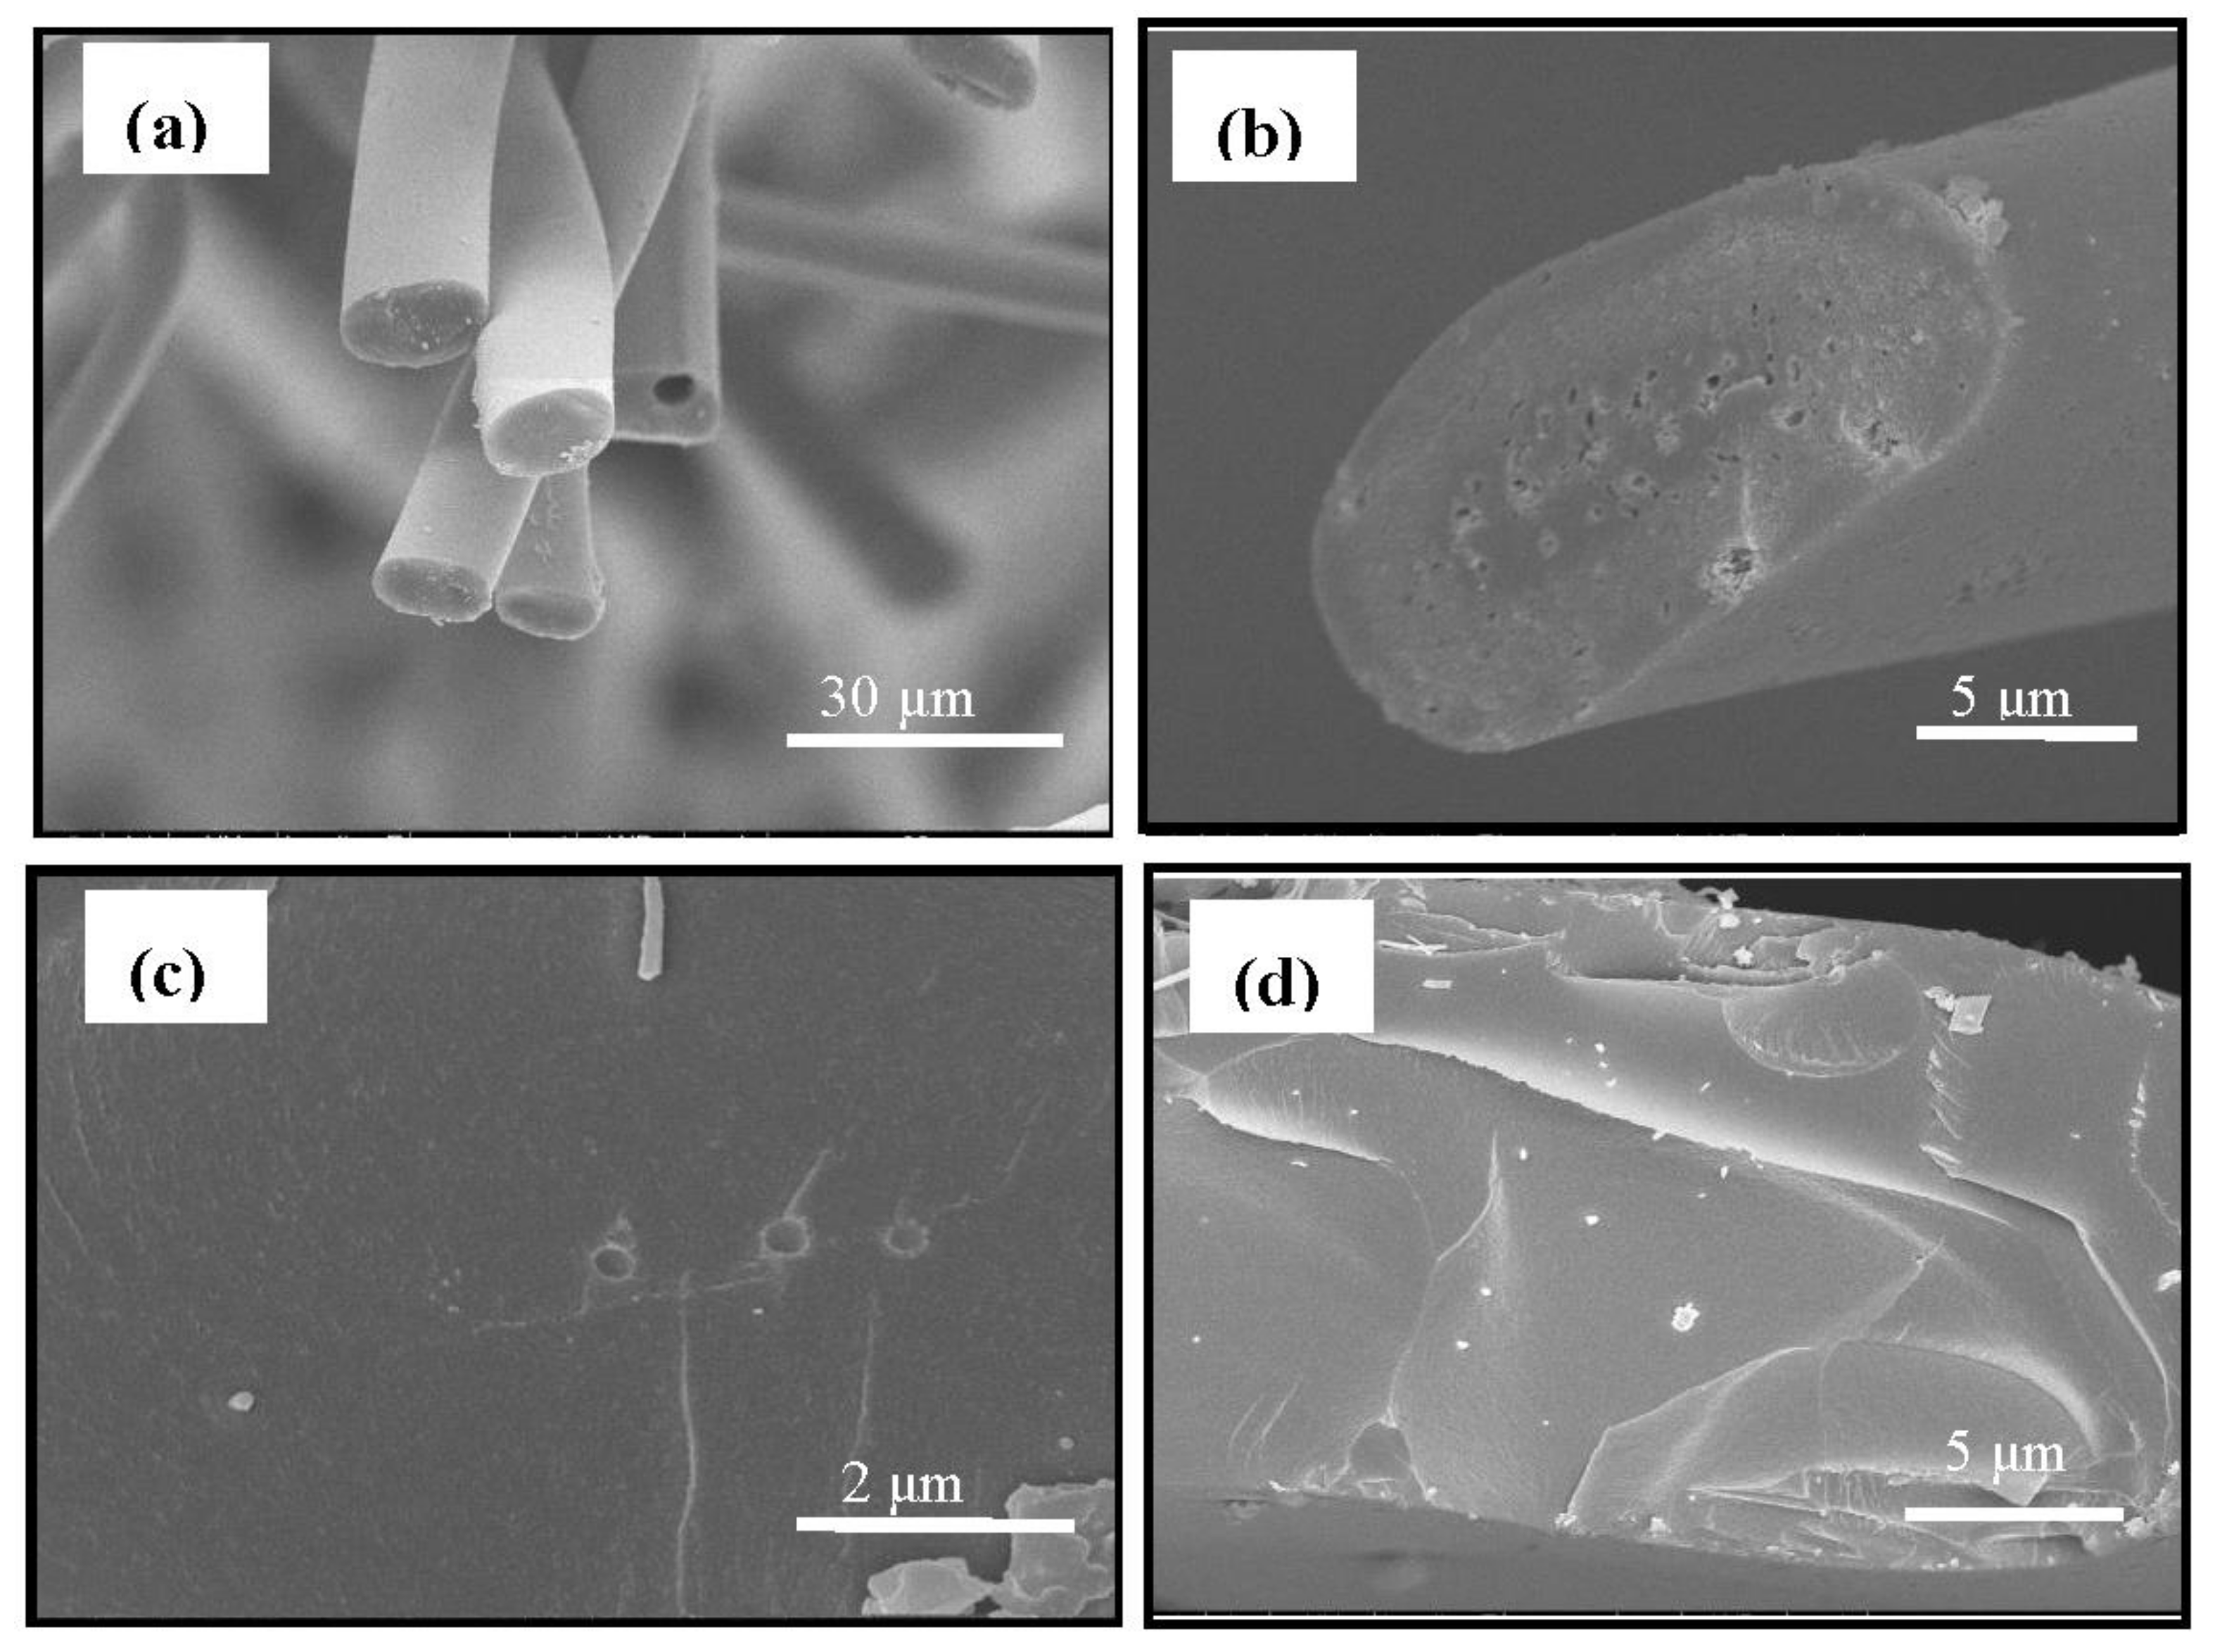
The SEM images of the surfaces of the WACFs and the WMACFs are shown in Figure 2a–f. It is obvious that the WACFs (Figure 2a,b) have a smooth surface and uniform thickness without surface deposits, and that they maintain porous structures on the inner and outer surface. Figure 2c–f shows that Fe3O4 nanoparticles were deposited on almost every WMCAF with non-uniform distribution, and the Fe3O4particles’ agglomeration and pores can be clearly observed.
Figure 3 shows a SEM image of a cross-section of the WACFs (Figure 3a,b) and WMACFs (Figure 3c,d). Figure 3a,b shows that the cross-section of the WACFs was round or elliptical, and some unevenly distributed pores were possibly caused by the number of escaping non-carbon atoms, which increased during the carbonization and activation process. Figure 3c,d shows that some Fe3O4 particles were present. It was found that the granular Fe3O4 was also deposited onto the cross-section of the WMACFs during the reaction.
3.2. XRD Analysis of the WMACFs
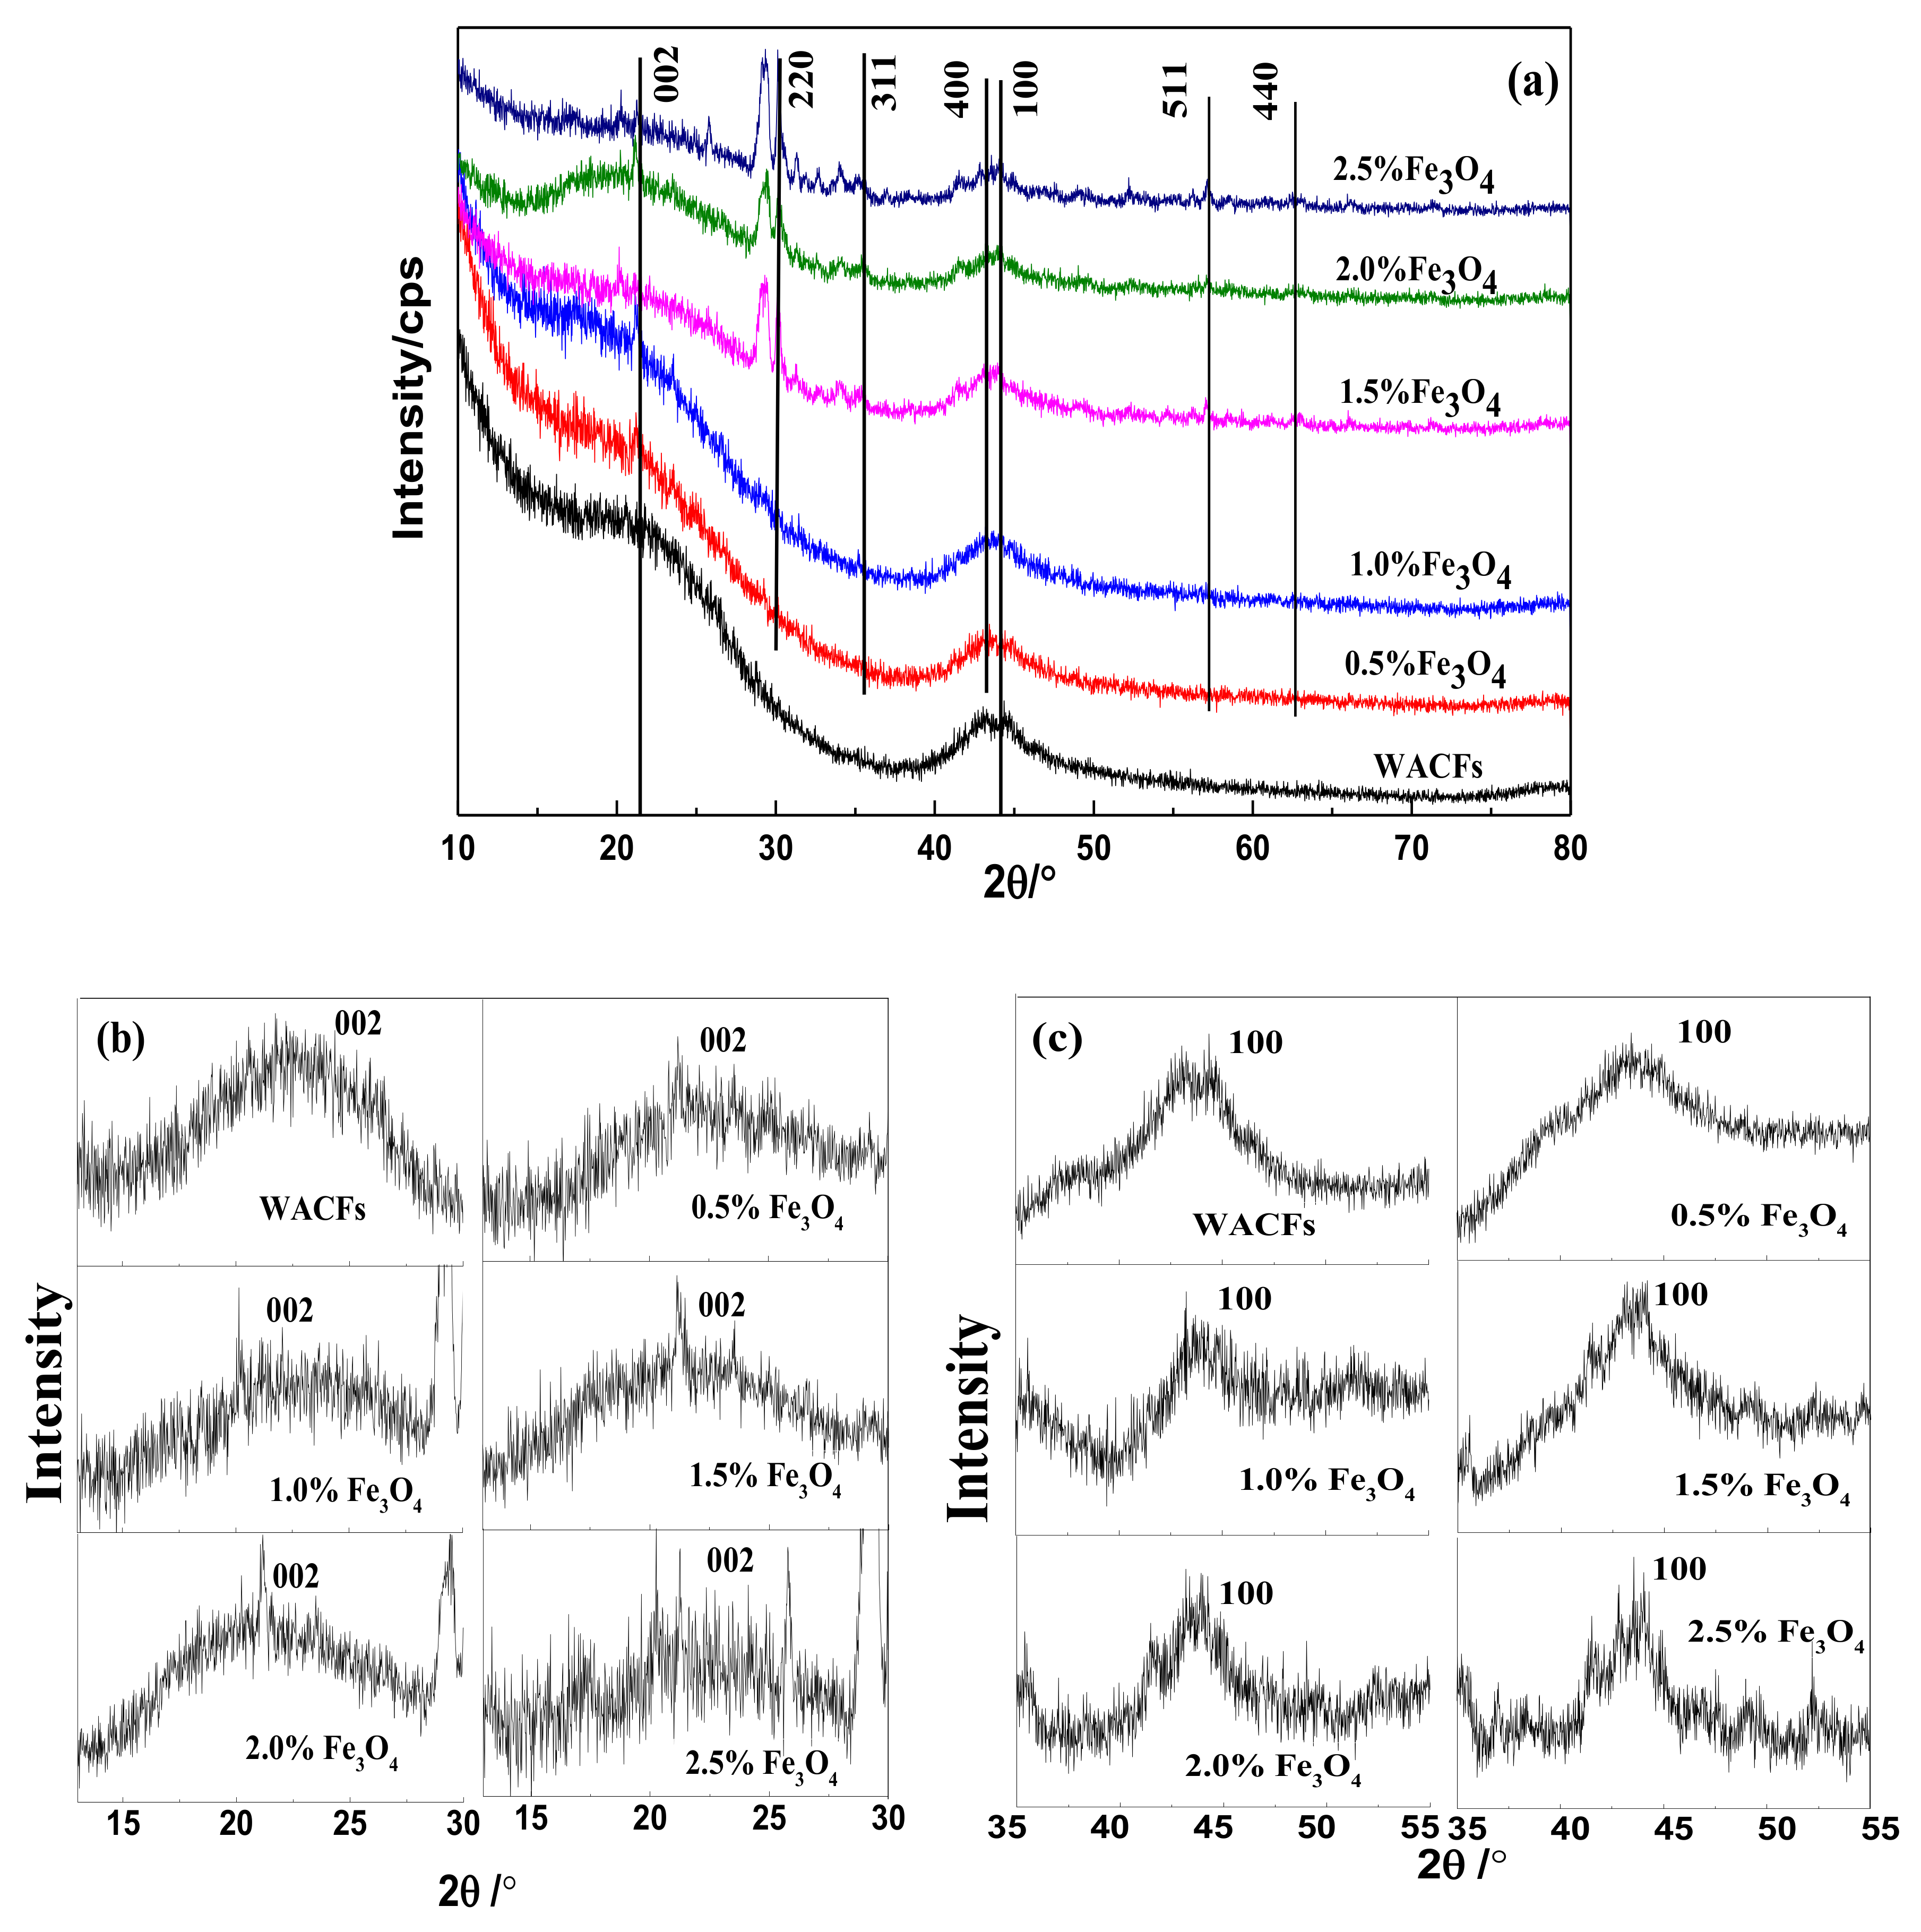
Figure 4a showed the XRD patterns of the WACFs and WMACFs at various Fe3O4 contents. The observed peaks at 2θ = 21.3° and 43.9° were (002) and (100) peaks of disordered graphite microcrystals in the WACFs, respectively [28]. The occurrence of the dominant peaks at 2θ = 30.3°, 35.3°, 43.5°, 57°, and 62.7° could correspond to (220), (311), (400), (511), and (440) crystal planes of a pure Fe3O4 with a spinal structure (JCPDS file (PDF No. 65-3107)) [29]. All of the above were the characteristic diffraction peaks of Fe3O4 [30,31], indicating that Fe3O4 had been introduced into the WACFs. As the nano-Fe3O4 content was low, its peaks’ intensities were relatively weak, especially when the content was 0.5% and 1%. With increased Fe3O4 content, the diffraction peaks were narrowed and became more prominent. It was significant that the changes of (220) and (400) peaks, which indicated the crystallization degree of Fe3O4, were enhanced. In addition, for the samples of 1.5–2.5% Fe3O4 content, the diffraction peak at 2θ = 28°–30.3° had a great change compared with other samples, displaying the double peaks phenomenon. This was probably because under the high-temperature activation process, with the increase of the Fe3O4 content, the structure of the samples had undergone a phase transformation from single-phase to two-phase, maintaining a two-phase coexistence state.
As shown from the XRD structure parameters (Table 1), d002, Lc(002), La(100), and g were calculated by Formulas (1)–(4), respectively. β of (002) and (100) peaks was clearly seen in Figure 4b,c. From the calculation results, the increase of the Fe3O4 content from 0% to 2.5% led to an obvious decrease in d002 from 0.4931 to 0.3237 nm. It can be concluded that the Fe3O4 content had a significant influence on the d002. In addition, the bulk thickness (Lc(002)) and the apparent layer-plane length parallel to the fibers axis (La(100)) increased from 0.9561 to 1.064 nm and from 3.232 to 4.303 nm, respectively. The Lc/d002 and g value corresponding to the change degree of graphitization structure also increased. The overall increase of Lc(002) was due to the fact that a large number of substances of aromatic structure that formed during the carbonization and activation process gradually changed into graphite-like microcrystalite structures of multilayer stacks. Correspondingly, the increase of La(100) indicated that a more regular and ordered carbon structure had been formed with the increased Fe3O4 content.
Table 2 shows the nanoparticle size of Fe3O4 as calculated by Formula (1). It can be observed that the average crystallite size of Fe3O4 was rather small, in the range of 10–19 nm. The reasons for the smaller particle size might be that the Fe3O4 particles were evenly and firmly dispersed on the surface of the WMACFs, without aggregation, providing a superior condition for the adsorption and separation.
3.3. FTIR Analysis of the WMACFs
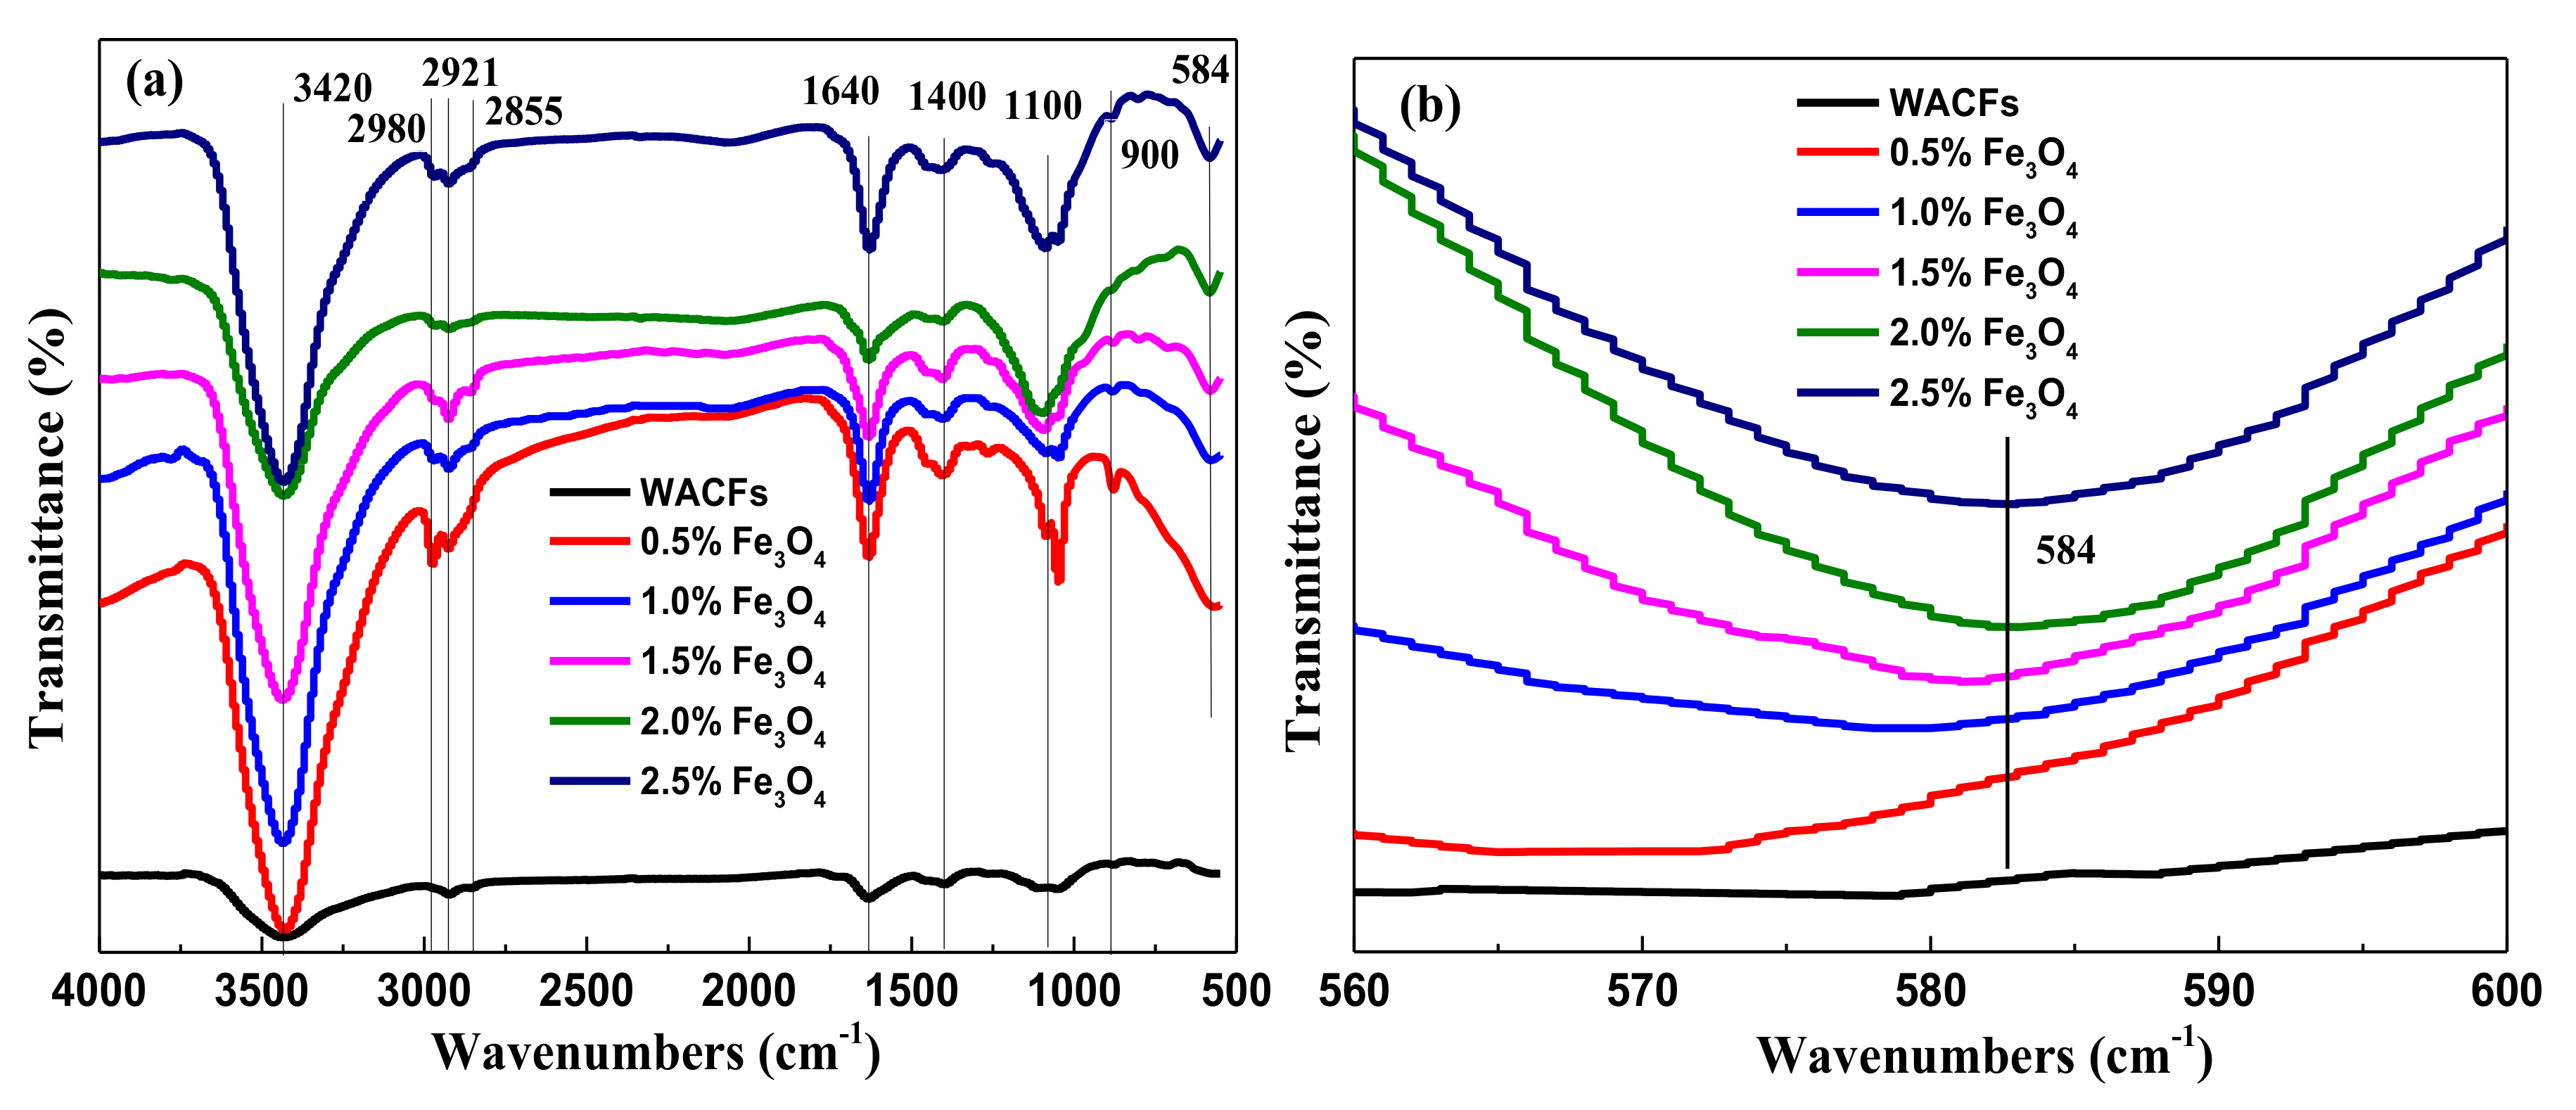
Figure 5a shows the FTIR spectra of the WACFs and WMACFs at various Fe3O4 contents, respectively. The position and shape of the band at 3420 cm−1 (–OH) were compatible with the involvement of hydrogen-bonded hydroxyl groups. The band at 3420 cm−1 was slightly broader towards the lower wavelengths, suggesting that some OH-ether hydrogen bonds were present. Weak bands at 1400 cm−1 were the stretching vibration of non-associated –OH. The 1640 cm−1 band indicated that a variety of C=C bonds existed besides those in aromatic rings. Both the WACFs and WMACFs showed weak adsorption peaks at 2980, 2921, and 2855 cm−1, which were due to the stretching vibration of C–H [5,32]. The broad band at 1100 cm−1 was the stretching vibration of C–O–C and C–O–H, whose vibrations became flat. The adsorption peaks at 900 cm−1 (C–C) decreased. The new band at 584 cm−1 (Figure 5b) could be attributed to the stretching vibrations of Fe–O [10]. It proved that Fe3O4 was well-deposited on the WMACFs. As the nano-Fe3O4 content was low, its adsorption peak was relatively weak.
3.4. Adsorption Characteristics, Specific Surface Area, and Pore Distribution of the WMACFs
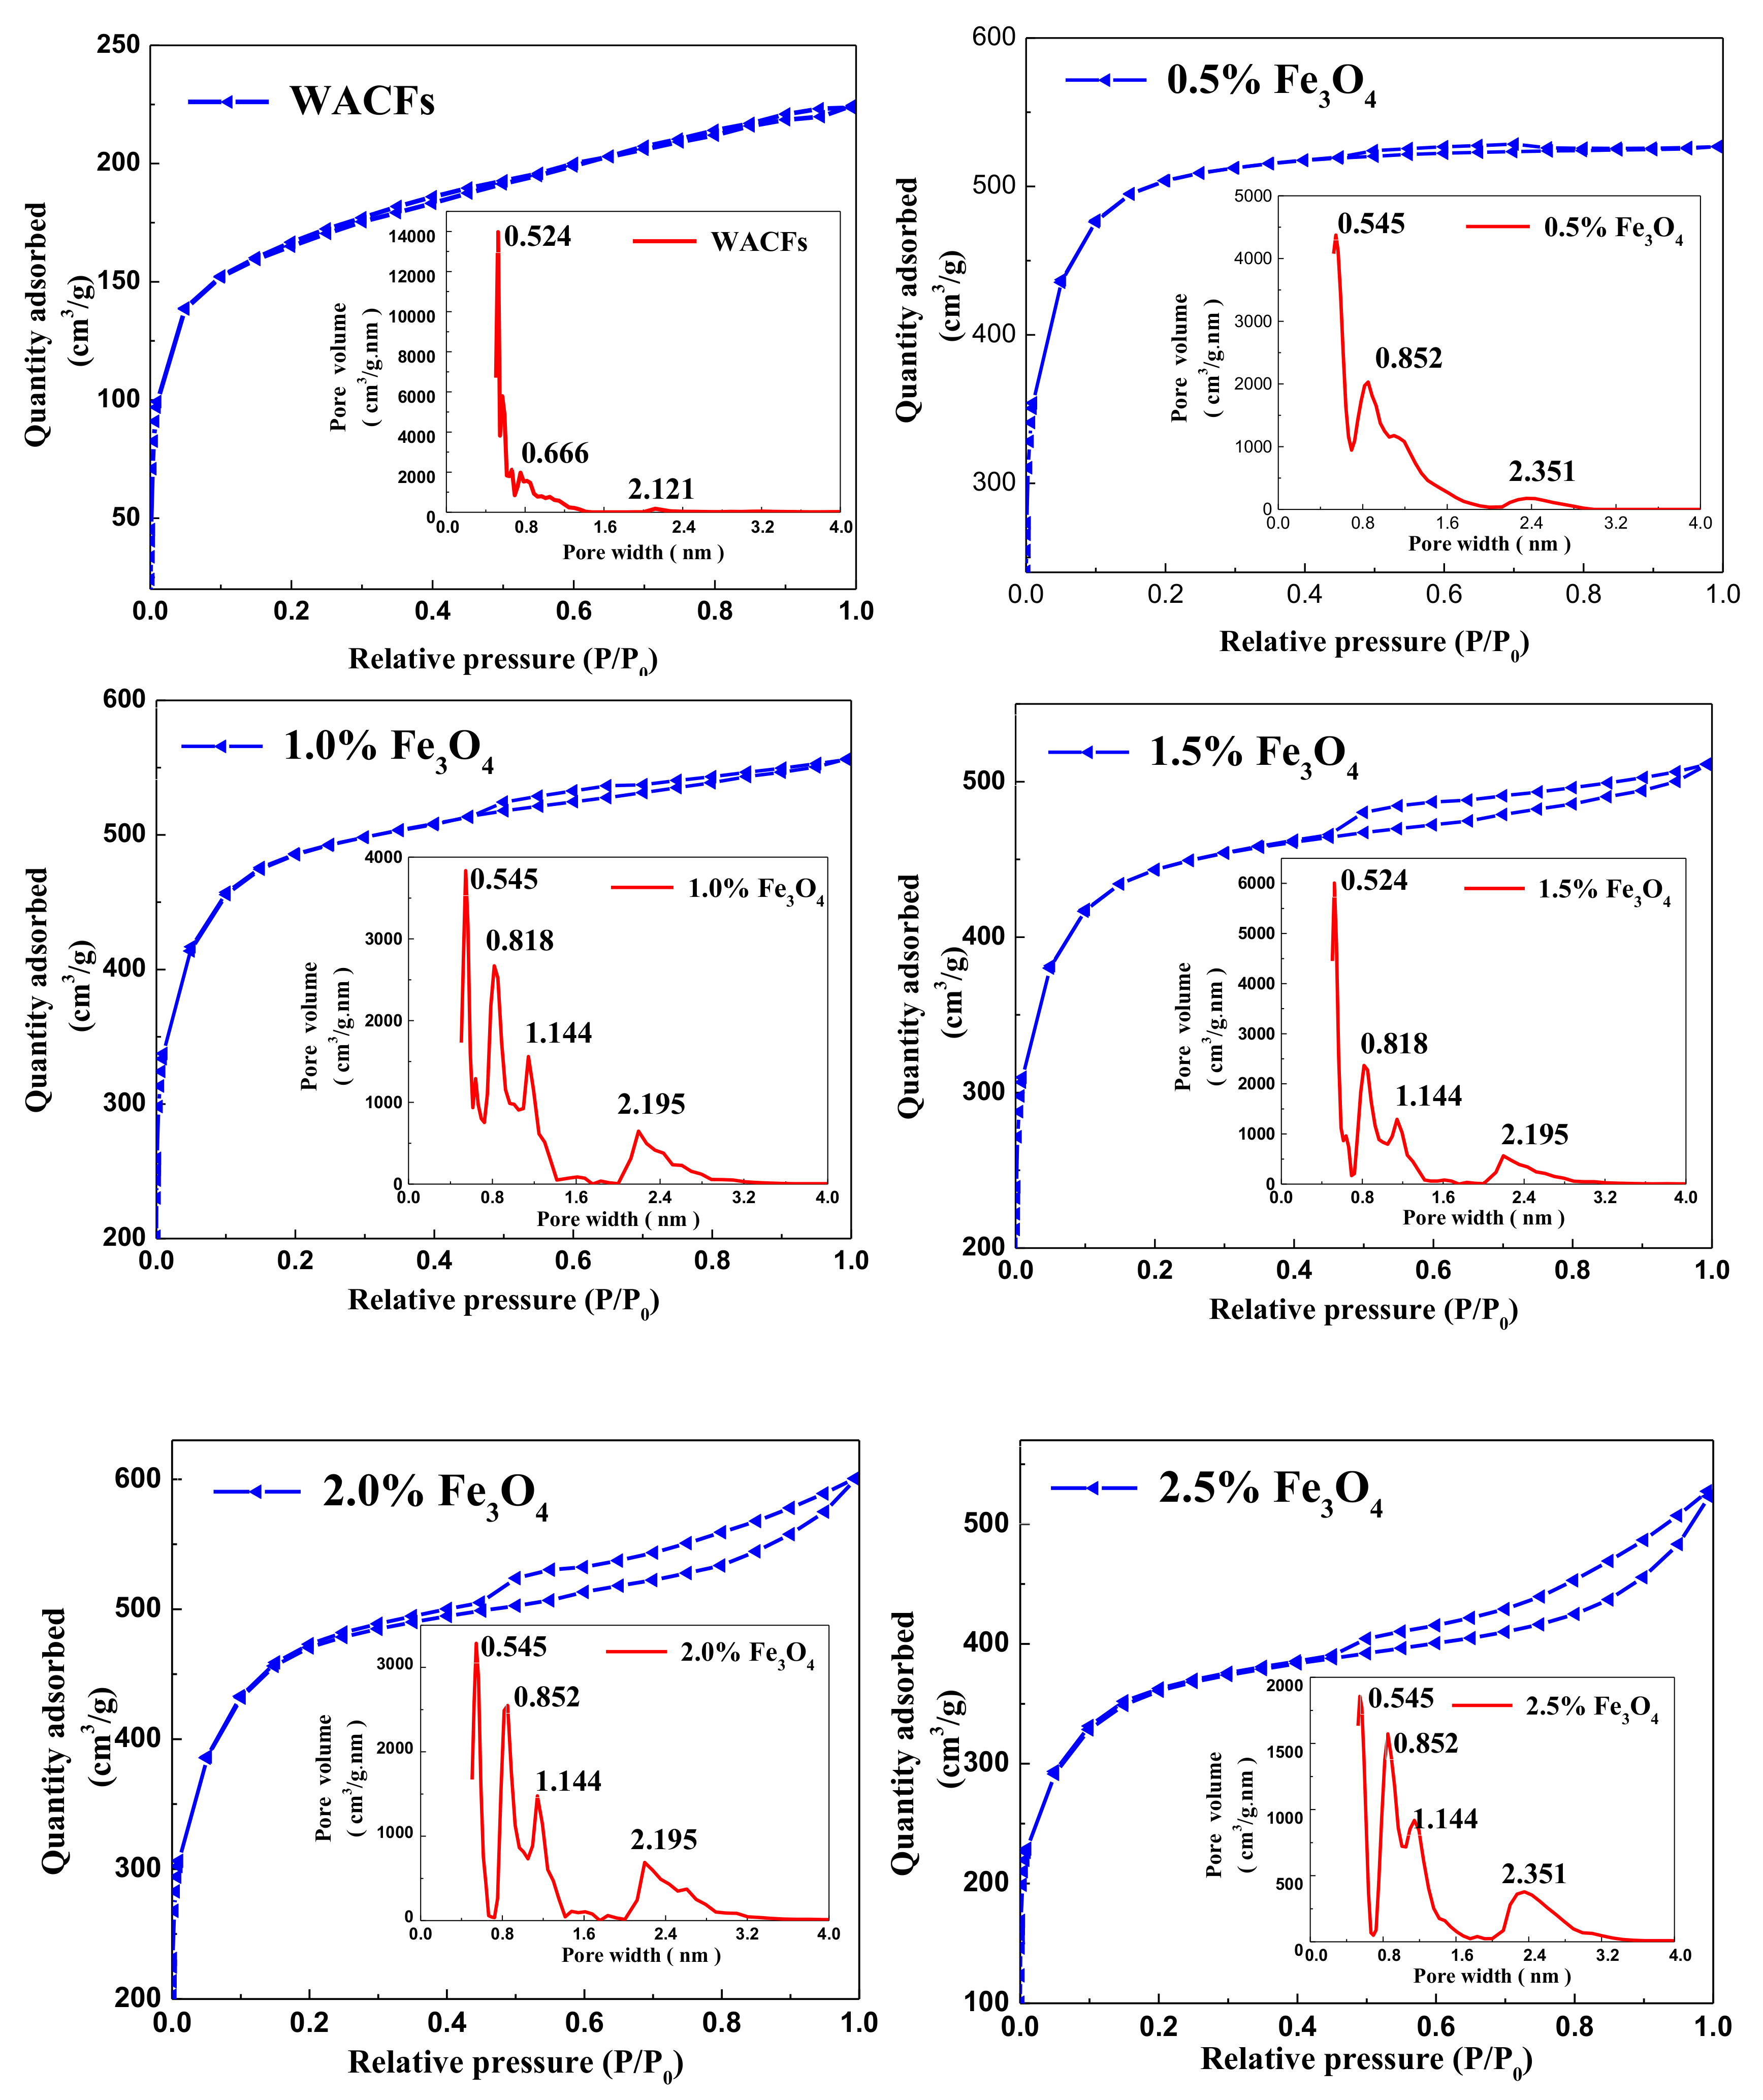
Figure 6 showed the N2 adsorption–desorption isotherms and pores size distribution of the WACFs and WMACFs, respectively. The adsorption isotherm of the WACFs and WMACFs of 0.5% Fe3O4 content was typical type I, based on the International Union of Pure and Applied Chemistry (IUPAC) classification where microporous adsorption was dominating, also called the Langmuir isother [33,34]. The isotherm profiles of the WMACFs (except for 0.5% Fe3O4 content) belonged to typical type IV in which an adsorption/desorption hysteresis loop was visible, which can be ascribed to a defining characteristic of mesoporosity [35,36]. This meant that the Fe3O4 content had a great effect on the development of mesoporosity.
As shown in Figure 6, the pore size distribution of the WMACFs can be divided into two prominent parts. The first part demonstrated a few peaks that were sharp and occurred at ca. 0.5 and 1.2 nm. The second part was in the range between 2.0 and 3.0 nm. This demonstrated that the WMACFs were a combination of micropores and mesopores with hierarchical pore structures. However, the microporous structure was still dominant.
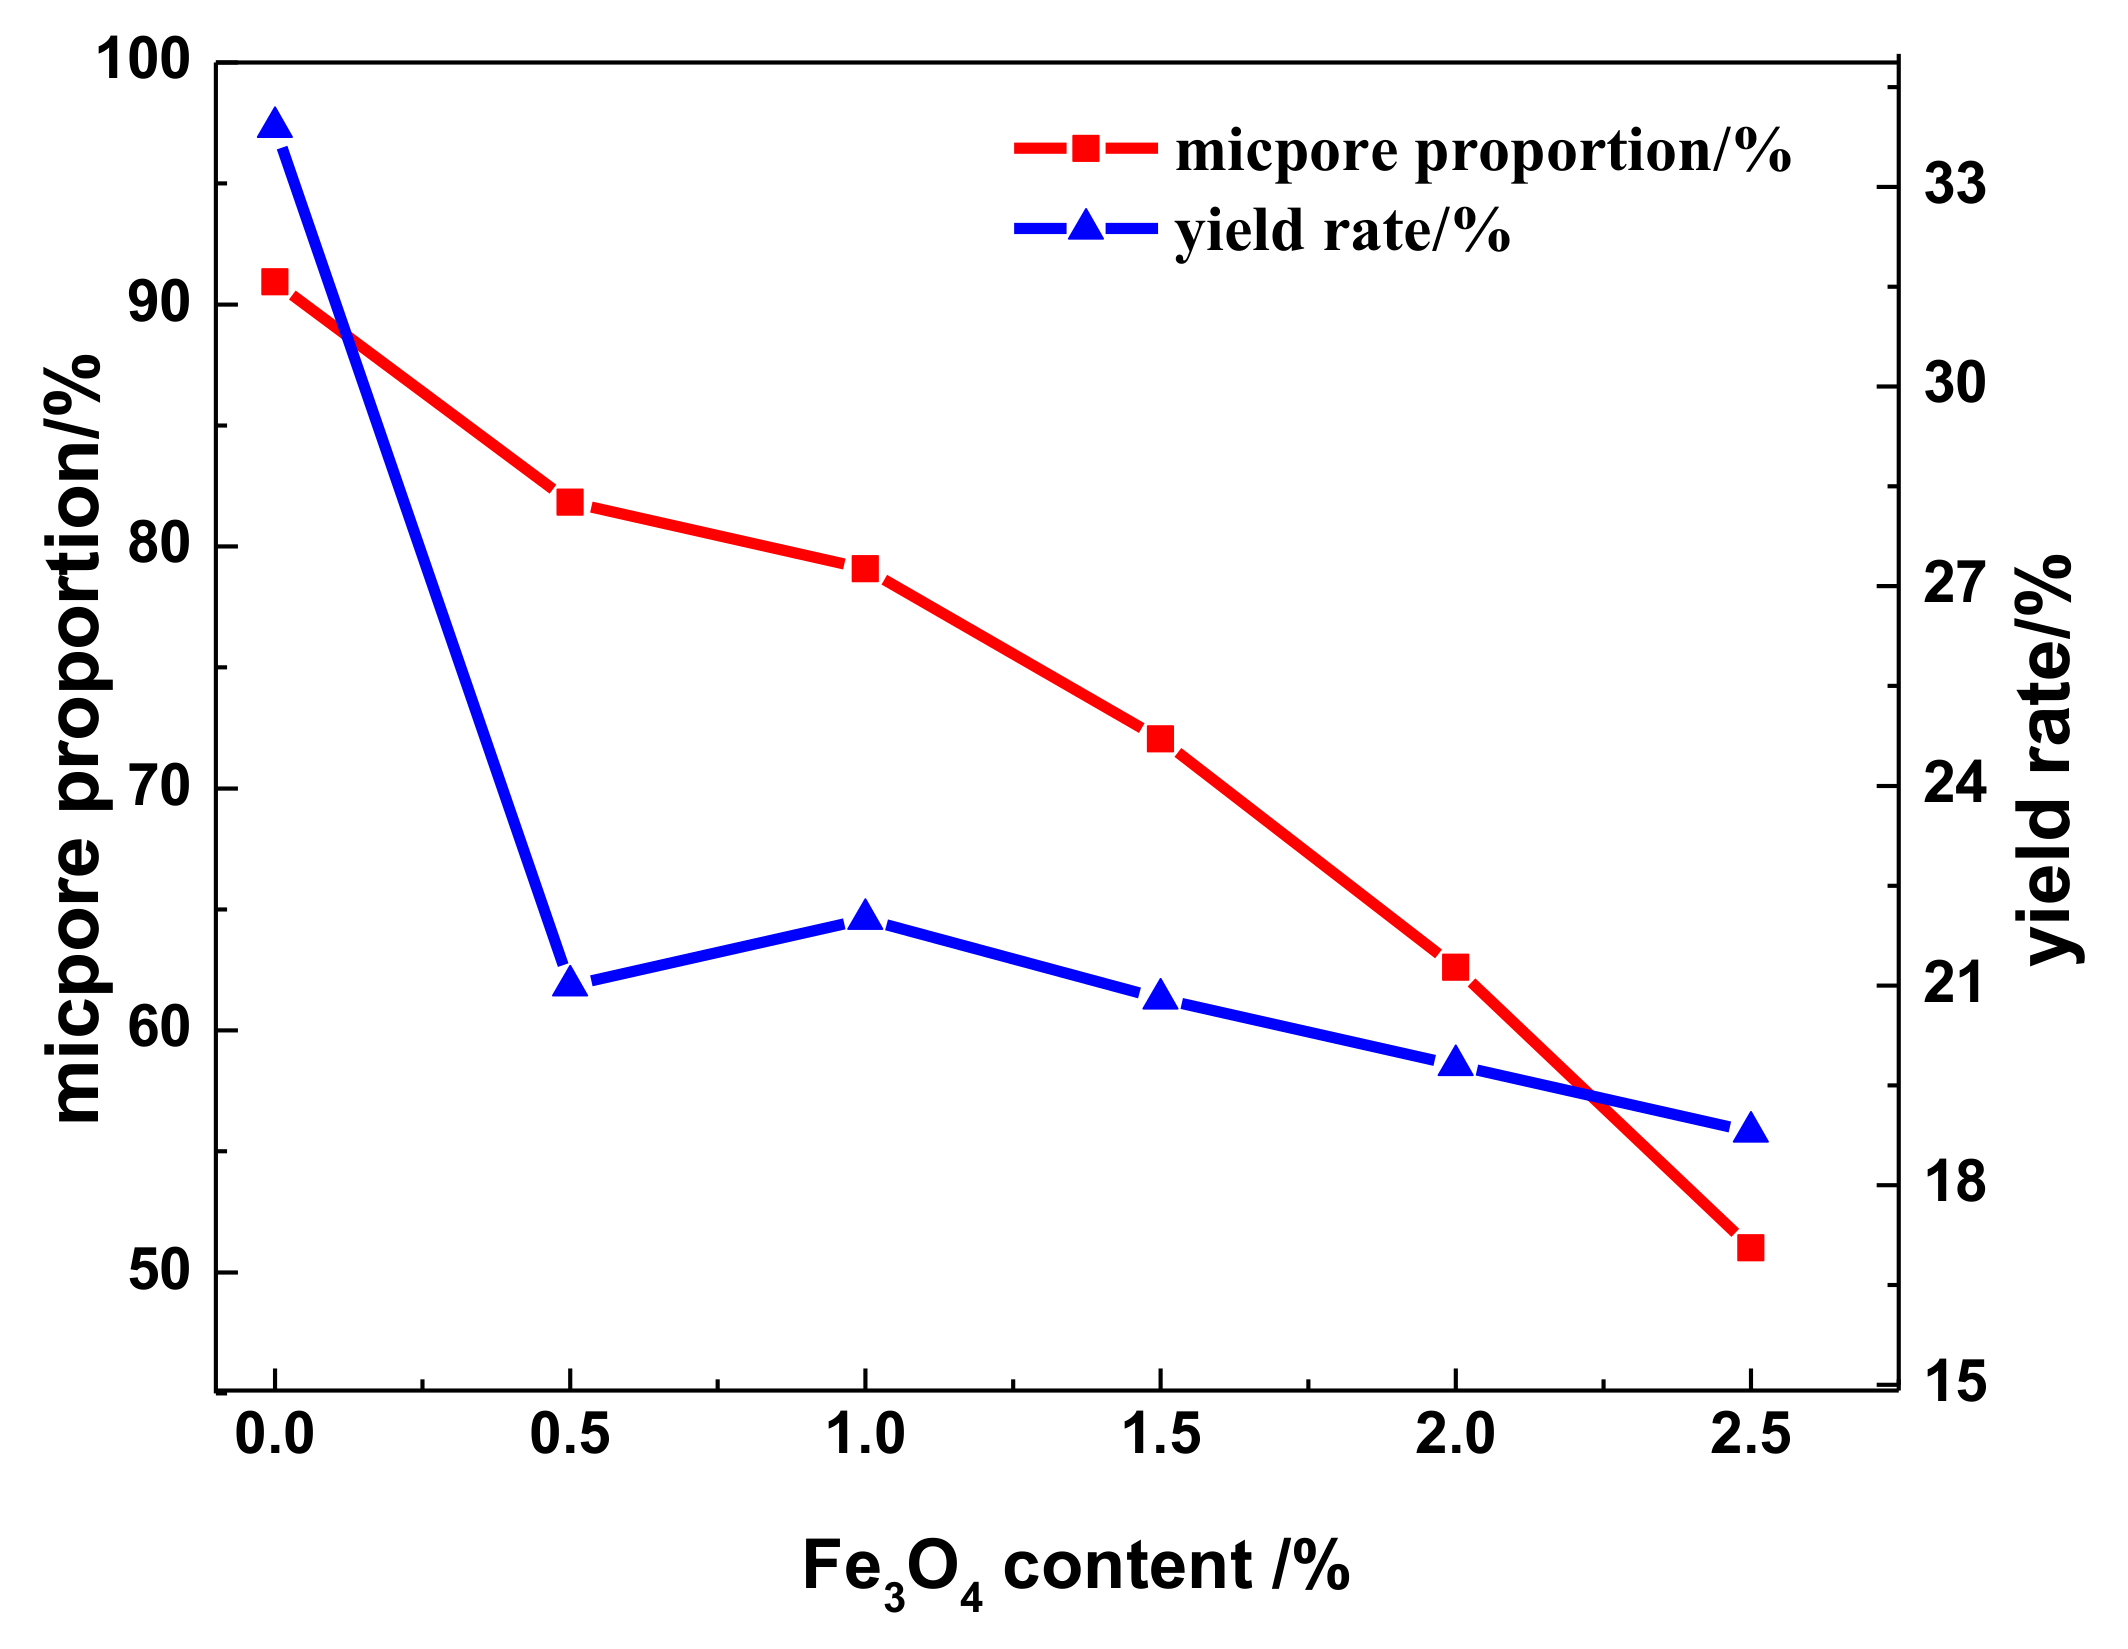
The textural parameters of the WMACFs are listed in Table 3. As the Fe3O4 content was increased from 0% to 2.5%, the SBET, Smicro, and Vmicro all showed decreasing trends; the Vtot gradually decreased and then increased. However, the Smeso, Vmeso, and MP-ratio were increased. Especially when the Fe3O4 content was increased from 0% to 0.5%, both the Smeso and Vmeso increased by 68.47% and 71.83%, respectively. This indicated that after adding Fe3O4, the ultra-micropores were enlarged, and most of them were further developed to mesopores, especially at a Fe3O4 content of 0.5%. However, when the Fe3O4 content was too high, the decrease of SBET suggested the formation of mesopores with hierarchical pore structures. As shown in Figure 7, the micropore proportion in the total pore volume and yield rate decreased from 90.93% and 33.9% to 51.02% and 18.8%, respectively. The yield rate of the WMACFs via activation had an obvious decrease due to the fact that more carbon was eroded to develop the porosity. This was also related to the pore-forming and pore-expanding function of Fe3O4.
3.5. VSM Analysis of the WMACFs
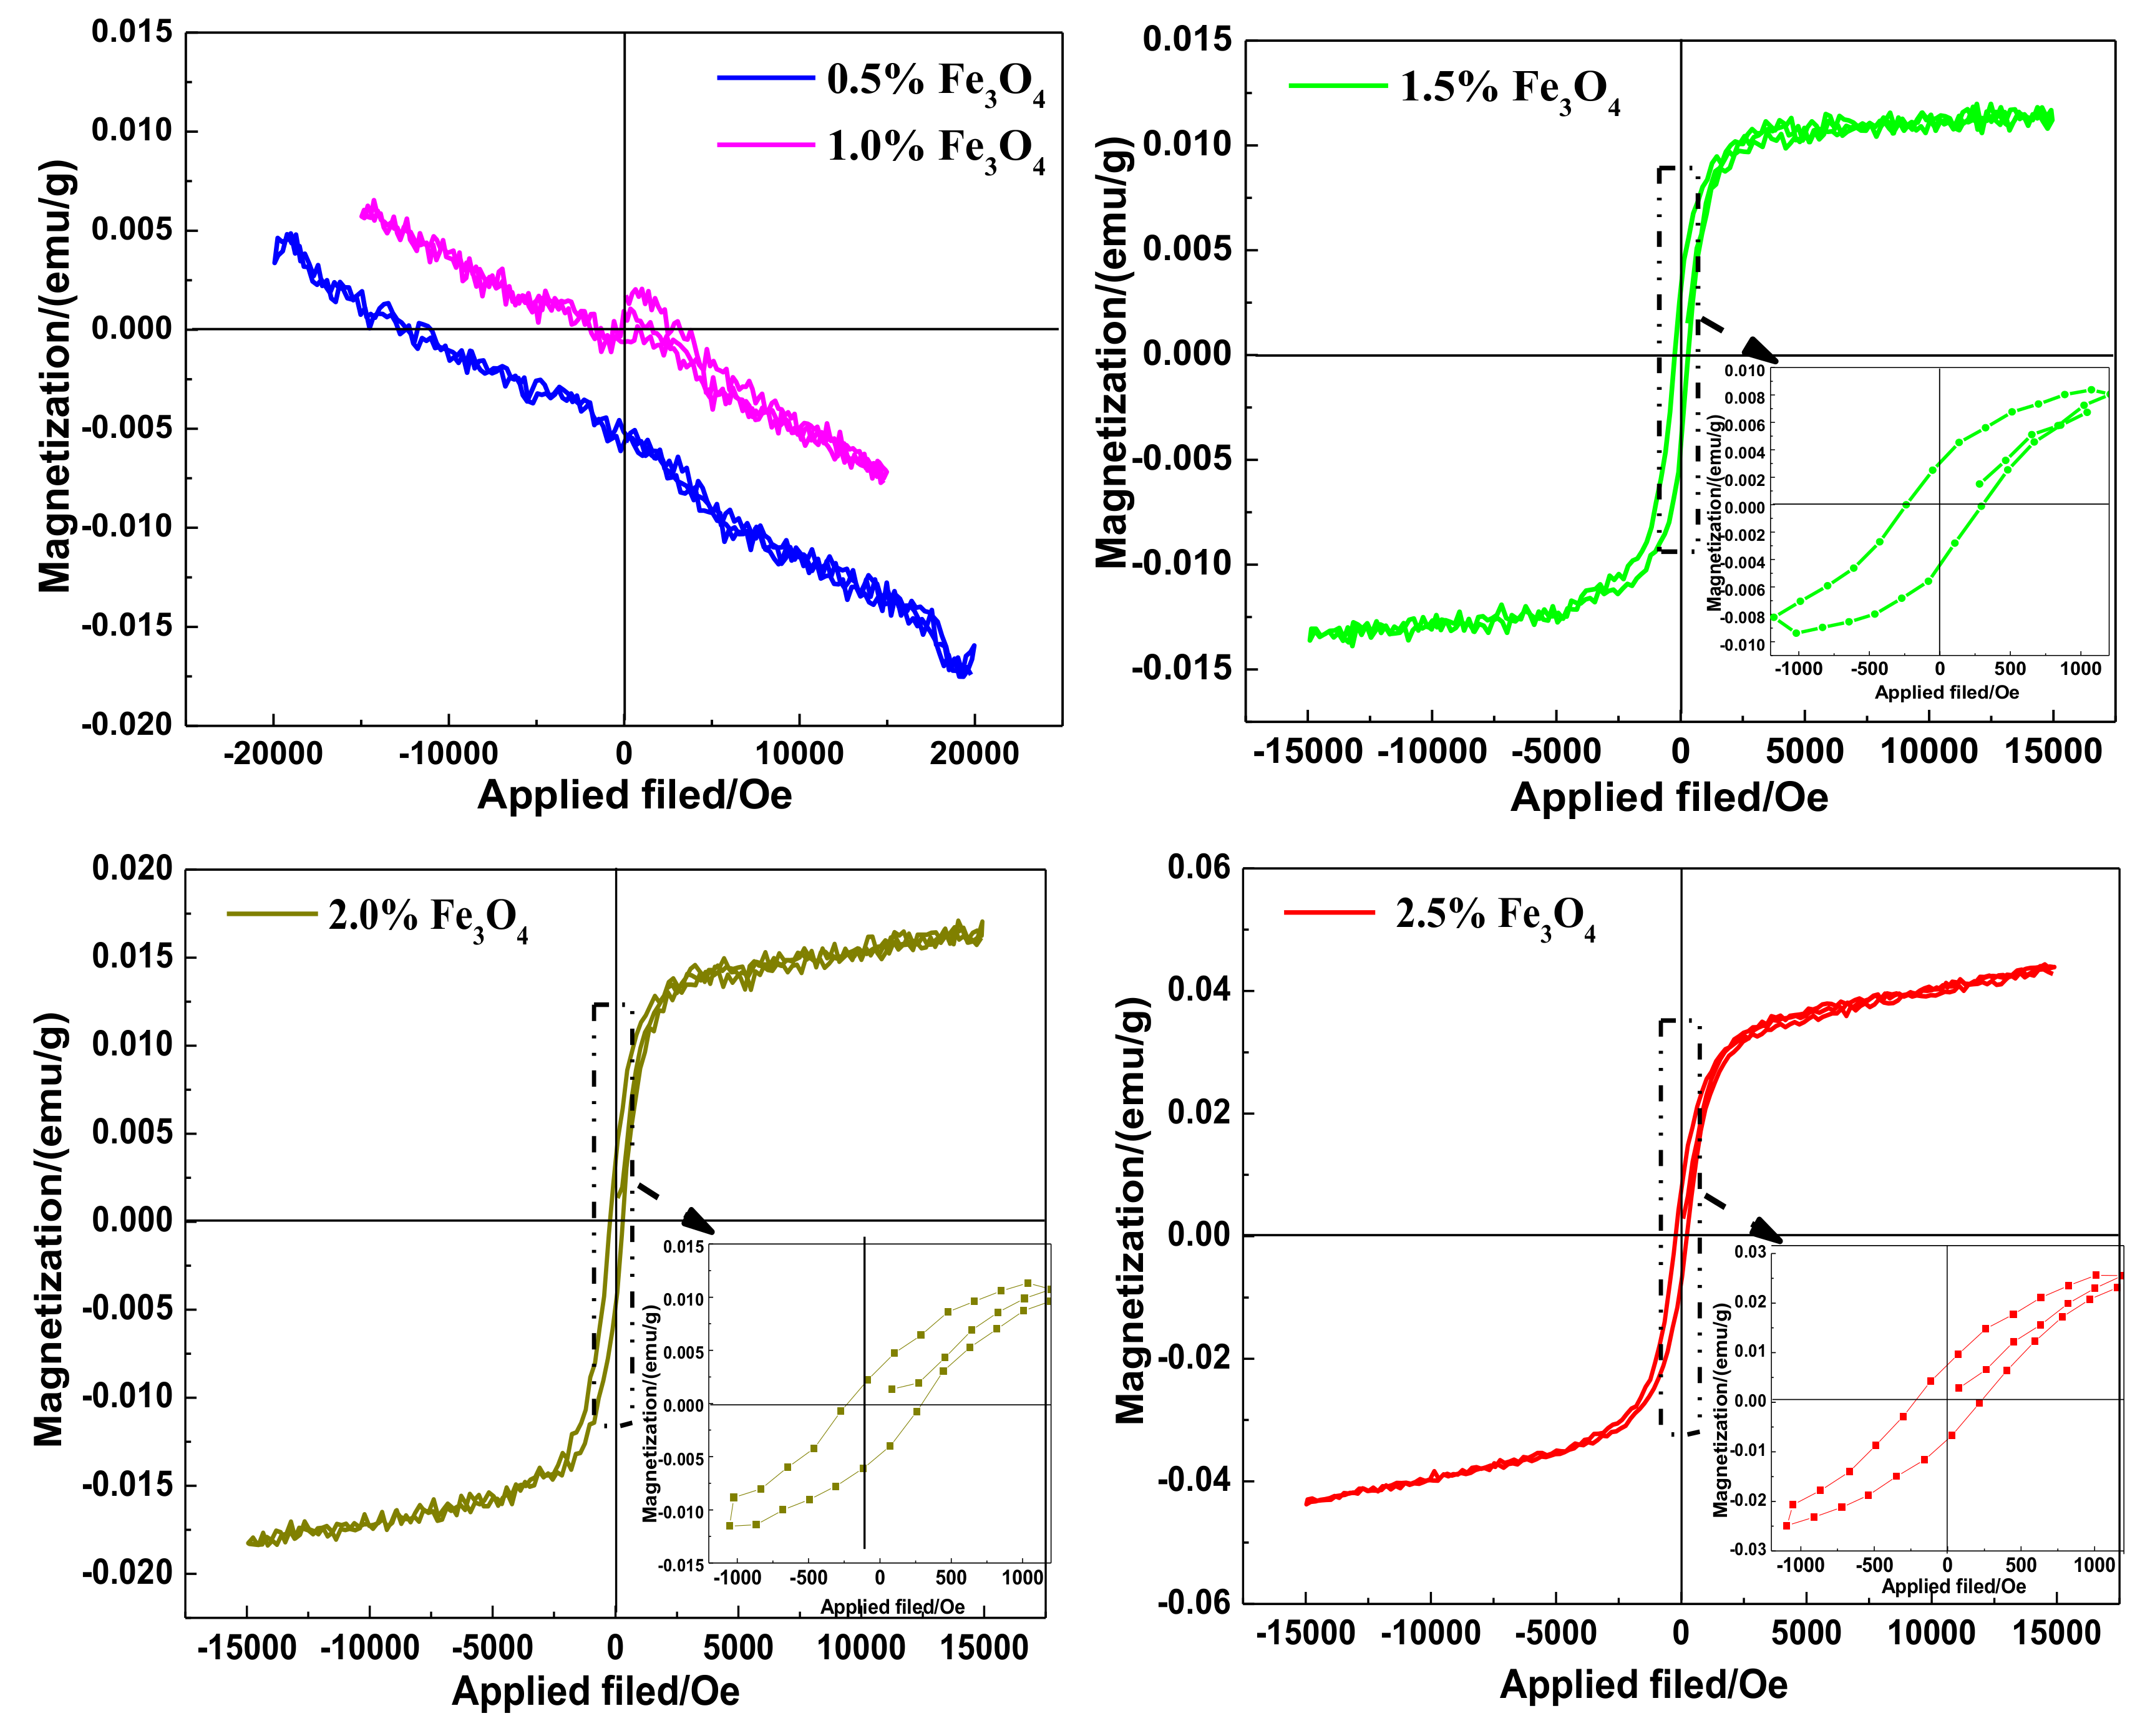
Figure 8 shows the magnetic hysteresis loop of the WMACFs. When the Fe3O4 content increased from 0.5% to 1.5%, the WMACFs responded weakly to an external magnetic field. This is probably because the lower Fe3O4 content was not enough to make the WMACFs possess magnetic properties. Whereas when the Fe3O4 content was increased from 1.5% to 2.5%, the very weak hysteresis revealed the resultant magnetic nanoparticles were nearly of magnetic properties with a saturation magnetization from 0.0129 to 0.0440 emu/g. This meant that the Fe3O4 content was a key factor influencing the magnetic properties of the WMACFs. Because of the low nano-Fe3O4 content and small nanoparticle size, the saturation magnetization was relatively small. However, the samples still had adequate magnetization to be easily and quickly separated from the complex sample.
Table 4 shows the residual magnetization, saturation magnetization, and coercive force of the WMACFs. With increased Fe3O4 content, the saturation magnetization increased, which was probably due to the fact that the greater the Fe3O4 content, the more obvious the magnetism. The residual magnetization increased from 0.0037 to 0.0075 emu/g. When the Fe3O4 content was 1.5%, the coercive force reached its maximum, which was 270.4 Oe. The samples with Fe3O4 contents of 1.5% to 2.5% had certain residual magnetization and coercive force, which was due to the partial agglomeration of the Fe3O4 nanoparticles during the carbonization and activation process.
4. Conclusions
In this study, WMACFs were successfully synthesized by phenol liquefaction, adding nano-Fe3O4, and melt-spinning, as well as curing and activation. Nano-Fe3O4 existed on the surface and cross-sections of almost every WMACF. With increased Fe3O4content, the yield rate of the WMACFs decreased, and the Fe3O4crystal plane diffraction peaks were obviously heightened. The characteristic adsorption peaks of Fe–O emerged at 594 cm−1 on the infrared spectrum. The WMACFs had a narrow distribution of micropore diameters (0.5–1.2 nm) and mesopore diameters (2.0–3.0 nm). Due to the pore-forming and pore-expanding function of Fe3O4, higher SBET and more developed pore structures were achieved. When the Fe3O4content was more than 1.5%, it had favorable magnetic properties, which provided a reference value for the recovery of the WMACFs after adsorption saturation. The practical application of the WMACFs was limited because of the low Fe3O4 content, but this provides a new direction to explore wooden activated carbon fiber materials with highly developed multi-porous structures and magnetic properties for adsorption separation. It is expected to be used in supercapacitor electronic materials, wastewater treatment, and air purification, such as the adsorption of formaldehyde, as well as in carrier materials of photocatalyst due to its hierarchical pore structures, magnetic properties, and characteristics of doping metal oxide.
Acknowledgments
This research has been financially supported by Opening Project Fund of Key Laboratory of Rubber Biology and Genetic Resource Utilization, Ministry of Agriculture/State Key Laboratory Breeding Base of Cultivation & Physiology for Tropical Crops/Danzhou Investigation & Experiment Station of Tropical Crops, Ministry of Agriculture (RRI-KLOF201801), and the National Natural Science Foundation of China (No. 31270607).
Author Contributions
Xiaojun Ma and Jianing Li conceived of and designed the experiments; Dongna Li, Biyun Ren, and Tongtong Li performed the experiments; all the authors analyzed the data; and Dongna Li, Biyun Ren, and Xiaojun Ma wrote the paper.
Conflicts of Interest
The authors declare no conflict of interest.
References
- Li, D.N.; Ma, X.J. Preparation and characterization of activated carbon fibers from liquefied wood. Cellulose 2013, 20, 1649–1656. [Google Scholar] [CrossRef]
- Huang, Y.X.; Zhao, G.J. A novel method for the production of mesoporous activated carbon fibers from liquefied wood. Mater. Lett. 2016, 178, 190–192. [Google Scholar] [CrossRef]
- Kwiatkowski, M. Analysis of the microporous structure of the low-cost activated carbon fibres obtained from flax and jute cloth. J. Math. Chem. 2017, 55, 1893–1902. [Google Scholar] [CrossRef]
- Yue, Z.R.; Vakili, A. Activated carbon–carbon composites made of pitch-based carbon fibers and phenolic resin for use of adsorbents. J. Mater. Sci. 2017, 52, 12913–12921. [Google Scholar] [CrossRef]
- Huang, Y.; Ma, E.; Zhao, G. Thermal and structure analysis on reaction mechanisms during the preparation of activated carbon fibers by KOH activation from liquefied wood-based fibers. Ind. Crop. Prod. 2015, 69, 447–455. [Google Scholar] [CrossRef]
- Ma, X.J.; Zhang, F.; Wei, L.Q. Effect of wood charcoal contents on the adsorption property, structure, and morphology of mesoporous activated carbon fibers derived from wood liquefaction process. J. Mater. Sci. 2015, 50, 1908–1914. [Google Scholar] [CrossRef]
- Ma, X.J.; Yang, H.; Yu, L.; Chen, Y.; Li, Y. Preparation, surface and pore structure of high surface area activated carbon fibers from bamboo by steam activation. Materials 2014, 7, 4431–4441. [Google Scholar] [CrossRef] [PubMed]
- McEvoy, J.G.; Zhang, Z.S. Synthesis and characterization of magnetically separable Ag/AgCl-magnetic activated carbon composites for visible light induced photocatalytic detoxification and disinfection. Appl. Catal. B Environ. 2014, 267–278. [Google Scholar] [CrossRef]
- Zhang, S.L.; Tao, L.C.; Jiang, M.; Gou, G.J.; Zhou, Z.W. Single-step synthesis of magnetic activated carbon from peanut shell. Mater. Lett. 2015, 157, 281–284. [Google Scholar] [CrossRef]
- Bai, X.; Qin, C.D.; Huang, X. Voltammetric determination of chloramphenicol using a carbon fiber microelectrode modified with Fe3O4 nanoparticles. Microchim. Acta 2016, 183, 2973–2981. [Google Scholar] [CrossRef]
- Li, C.D.; Lu, J.J.; Li, S.M.; Tong, Y.B.; Ye, B.C. Synthesis of Magnetic Microspheres with Sodium Alginate and Activated Carbon for Removal of Methylene Blue. Materials 2017, 10, 84. [Google Scholar] [CrossRef] [PubMed]
- Shi, Q.Q.; Li, A.M.; Zhou, Q.; Shuang, C.D.; Li, Y.; Ma, Y. Utilization of waste cation exchange resin to prepare carbon/iron composites for the adsorption of contaminants in water. J. Ind. Eng. Chem. 2014, 20, 4256–4260. [Google Scholar] [CrossRef]
- Yang, N.; Zhu, S.M.; Zhang, D.; Xu, S. Synthesis and properties of magnetic Fe3O4-activated carbon nanocomposite particles for dye removal. Mater. Lett. 2008, 62, 645–647. [Google Scholar] [CrossRef]
- Majeed, M.I.; Guo, J.; Yan, W.; Tan, B. Preparation of magnetic iron oxide nanoparticles (MIONs) with improved saturation magnetization using multifunctional polymer ligand. Polymers 2016, 8, 392. [Google Scholar] [CrossRef]
- Hai, H.; Grinblat, J.; Sougrati, M.T.; Stievano, L.; Margel, S. Engineering of Iron-Based Magnetic Activated Carbon Fabrics for Environmental Remediation. Materials 2015, 8, 4593. [Google Scholar]
- Chen, H.Y.; Du, Y.; Lu, Q. Microwave-assisted rapid synthesis of Fe2O3/ACF hybrid for high efficient As(V) removal. J. Alloy. Compd. 2016, 674, 399–405. [Google Scholar] [CrossRef]
- Ma, X.J.; Zhao, G.J. Preparation of carbon fibers from liquefied wood. Wood Sci. Technol. 2010, 44, 3–11. [Google Scholar]
- Ma, X.J.; Zhao, G.J. Variations in the microstructure of carbon fibers prepared from liquefied wood during carbonization. J. Appl. Polym. Sci. 2011, 121, 3525–3530. [Google Scholar] [CrossRef]
- Ma, X.J.; Zhang, F.; Zhu, J.Y.; Yu, L.L.; Liu, X.Y. Preparation of highly developed mesoporous activated carbon fiber from liquefied wood using wood charcoal as additive and its adsorption of methylene blue from solution. Bioresour. Technol. 2014, 164, 1–6. [Google Scholar] [CrossRef] [PubMed]
- Ma, X.J.; Chen, Y. Preparation and characterization of Mn/N co-doped TiO2 loaded on wood-based activated carbon fiber and its visible light photodegradation. Polymers 2015, 7, 1660–1673. [Google Scholar] [CrossRef]
- Foo, K.Y.; Hameed, B.H. Mesoporous activated carbon from wood sawdust by K2CO3 activation using microwave heating. Bioresour. Technol. 2012, 111, 425–432. [Google Scholar] [CrossRef] [PubMed]
- Johnson, D.J.; Frank, C. Recent Advances in Studies of Carbon Fiber Structure. Philos. Trans. 1980, 294, 443–449. [Google Scholar] [CrossRef]
- Cuesta, A.; Dhamelincout, P.; Laureyns, J.; Martinezalonso, A.; Tascon, J.M.D. Comparative performance of X-ray diffraction and Raman microprobe techniques for the study of carbon materials. J. Mater. Chem. 1998, 8, 2875–2879. [Google Scholar] [CrossRef]
- Zou, D.Y.; Zhang, B.H.; Liao, B.G.; Chen, C.G.; Zhang, Q. Study of determining the degree of graphitizing of coke with X-ray diffraction method. J. Chongqing Univ. 1988, 6, 83–93. [Google Scholar]
- Anirudhan, T.S.; Sreekumari, S.S. Adsorptive removal of heavy metal ions from industrial effluents using activated carbon derived from waste coconut buttons. J. Environ. Sci. 2011, 23, 1989–1998. [Google Scholar] [CrossRef]
- Groen, J.C.; Peffer, L.A.; Javier, P.R. Pore size determination in modified micro-and mesoporous materials. Pitfalls and limitations in gas adsorption data analysis. Microporous Mesoporous Mater. 2003, 60, 1–17. [Google Scholar] [CrossRef]
- Elmerraoui, M.; Aoshima, A.M.; Kaneko, K. Micropore Size Distribution of Activated Carbon Fiber Using the Density Functional Theory and Other Methods. Langmuir 2000, 16, 4300–4304. [Google Scholar] [CrossRef]
- Kubo, S.; Yoshida, T.; Kadia, J.F. Surface porosity of lignin/PP blend carbon fibers. J. Wood Chem. Technol. 2007, 27, 257–271. [Google Scholar] [CrossRef]
- Li, G.L.; Jiang, Y.R.; Huang, K.L.; Ding, P.; Yao, L.L. Kinetics of adsorption of Saccharomycescerevisiae mandelated dehydrogenase on magnetic Fe3O4–chitosannanoparticles. Colloids Surf. A 2008, 320, 11–18. [Google Scholar] [CrossRef]
- Dai, C.C.; Wan, J.F.; Shao, J.Q.; Ma, F.W. Hollow activated carbon with unique through-pore structure derived from reed straw for high-performance supercapacitors. Mater. Lett. 2017, 193, 279–282. [Google Scholar] [CrossRef]
- Qiang, C.W.; Xu, J.C.; Zhang, Z.Q.; Tian, L.L.; Xiao, S.T.; Liu, Y.; Xu, P. Magnetic properties and microwave absorption properties of carbon fibers coated by Fe3O4 nanoparticles. J. Alloys Compd. 2010, 506, 93–97. [Google Scholar] [CrossRef]
- Ramesh, T.; Rajalakshmi, N.; Dhathathreyan, K.S. Synthesis and characterization of activated carbon from jutefibers for hydrogen storage. Renew. Energy Environ. Sustain. 2017, 2, 27–36. [Google Scholar] [CrossRef]
- Ge, X.Y.; Wu, Z.S.; Wu, Z.L.; Yan, Y.J.; Cravotto, G.C.; Ye, B.C. Microwave-assisted modification of activated carbon with ammonia for efficient pyrene adsorption. J. Ind. Eng. Chem. 2016, 39, 27–36. [Google Scholar] [CrossRef]
- Jin, G.; Eom, Y.J.; Lee, T.G. Removal of Hg(II) from aquatic invironments using activated carbon impregnated with humic acid. J. Ind. Eng. Chem. 2016, 42, 46–52. [Google Scholar] [CrossRef]
- Lee, Y.S.; Basova, Y.V.; Edie, D.D.; Reid, L.K.; Newcombe, S.R.; Ryu, S.K. Preparation and characterization of trilobal activated carbon fibers. Carbon 2003, 41, 2573–2584. [Google Scholar] [CrossRef]
- Zhang, S.J.; Feng, H.M.; Wang, J.P.; Yu, H.Q. Structure evolution and optimization in the fabrication of PVA-based activated carbon fibers. J. Colloid Interface Sci. 2008, 321, 96–102. [Google Scholar] [CrossRef] [PubMed]
Figure 1.
Schematic of the production process of the wooden magnetic activated carbon fibers (WMACFs). HTMA: hexamethylenetetramine; HCI: hydrochloric acid; and HCHO: formaldehyde.
Figure 1.
Schematic of the production process of the wooden magnetic activated carbon fibers (WMACFs). HTMA: hexamethylenetetramine; HCI: hydrochloric acid; and HCHO: formaldehyde.
Figure 2.
Surface SEM photographs of wooden activated carbon fibers (WACFs) (a,b) and WMACFs (2.5% Fe3O4 content) (c–f).
Figure 2.
Surface SEM photographs of wooden activated carbon fibers (WACFs) (a,b) and WMACFs (2.5% Fe3O4 content) (c–f).
Figure 3.
Cross-sectional SEM photographs of the WACFs (a,b) and WMACFs (2.5% Fe3O4 content) (c,d).
Figure 4.
(a) XRD pattern of the WACFs and WMACFs at various Fe3O4 contents; (b,c) Local magnification curve of (002) and (100) peaks at various Fe3O4 contents.
Figure 4.
(a) XRD pattern of the WACFs and WMACFs at various Fe3O4 contents; (b,c) Local magnification curve of (002) and (100) peaks at various Fe3O4 contents.
Figure 5.
(a) FTIR of the WACFs and WMACFs at various Fe3O4 contents; (b) Local magnification curve of 584 cm−1 vibrationsat various Fe3O4 contents.
Figure 5.
(a) FTIR of the WACFs and WMACFs at various Fe3O4 contents; (b) Local magnification curve of 584 cm−1 vibrationsat various Fe3O4 contents.
Figure 6.
Nitrogen adsorption-desorption isotherms and pores size distribution of the WACFs and WMACFs.
Figure 6.
Nitrogen adsorption-desorption isotherms and pores size distribution of the WACFs and WMACFs.
Figure 7.
Micropore proportion and yield rate of the WMACFs.
Figure 8.
The magnetic hysteresis loop of the WMACFs.

Table 1.
XRD structure parameters for the WMACFs.
| Fe3O4 Content | d(002)/nm | Lc(002)/nm | La(100)/nm | Lc/d(002) | g/% |
|---|---|---|---|---|---|
| 0% | 0.4931 | 0.9561 | 3.232 | 1.939 | −17.34 |
| 0.5% | 0.5657 | 0.9350 | 3.027 | 1.653 | −25.78 |
| 1.0% | 0.5491 | 0.9554 | 3.625 | 1.739 | −23.86 |
| 1.5% | 0.4635 | 0.9748 | 3.809 | 2.103 | −13.89 |
| 2.0% | 0.4553 | 1.003 | 4.239 | 2.203 | −12.94 |
| 2.5% | 0.3237 | 1.064 | 4.303 | 3.287 | 2.36 |
Table 2.
Relationship between the Fe3O4 content and the average crystallite size of Fe3O4.
| Fe3O4 Content | 0.5% | 1% | 1.5% | 2% | 2.5% |
| Average Crystallite Size | 18.73 nm | 14.22 nm | 11.13 nm | 11.45 nm | 10.58 nm |
Table 3.
The textural parameters of the WMACFs from the adsorption isotherms of nitrogen 1.
| Fe3O4 Content | SBET (m2/g) | Smicro (m2/g) | Smeso (m2/g) | Vtot (m2/g) | Vmicro (m2/g) | Vmeso (m2/g) | MP-Ratio (%) |
|---|---|---|---|---|---|---|---|
| 0% | 1173 | 1090 | 64 | 0.551 | 0.501 | 0.040 | 7 |
| 0.5% | 1894 | 1667 | 203 | 0.858 | 0.702 | 0.142 | 17 |
| 1.0% | 1816 | 1550 | 203 | 0.836 | 0.661 | 0.154 | 18 |
| 1.5% | 1657 | 1380 | 241 | 0.737 | 0.531 | 0.181 | 25 |
| 2.0% | 1716 | 1377 | 299 | 0.896 | 0.561 | 0.300 | 33 |
| 2.5% | 1578 | 1206 | 322 | 0.929 | 0.474 | 0.415 | 45 |
1 SBET, Brunauer-Emmett-Teller surface area; Smicro, micropore surface area; Smeso, mesopore surface area; Vtot, total pore volume; Vmicro, micropore volume; Vmeso, mesopore volume; and MP-ratio = (Vmeso/Vtot) × 100%.
Table 4.
Residual magnetization, saturation magnetization, and coercive force of the WMACFs.
| Fe3O4 Content | 0.5% | 1.0% | 1.5% | 2.0% | 2.5% |
|---|---|---|---|---|---|
| Residual Magnetization (emu/g) | - | - | 0.0037 | 0.0041 | 0.0075 |
| Saturation Magnetization (emu/g) | - | - | 0.0129 | 0.0177 | 0.0440 |
| Coercive Force (Oe) | - | - | 270.4 | 261.3 | 224.1 |
© 2018 by the authors. Licensee MDPI, Basel, Switzerland. This article is an open access article distributed under the terms and conditions of the Creative Commons Attribution (CC BY) license (http://creativecommons.org/licenses/by/4.0/).
Share and Cite
MDPI and ACS Style
Li, D.; Li, J.; Ren, B.; Li, T.; Ma, X. Synthesis and Characterization of Wooden Magnetic Activated Carbon Fibers with Hierarchical Pore Structures. Polymers 2018, 10, 435. https://doi.org/10.3390/polym10040435
AMA Style
Li D, Li J, Ren B, Li T, Ma X. Synthesis and Characterization of Wooden Magnetic Activated Carbon Fibers with Hierarchical Pore Structures. Polymers. 2018; 10(4):435. https://doi.org/10.3390/polym10040435
Chicago/Turabian StyleLi, Dongna, Jianing Li, Biyun Ren, Tongtong Li, and Xiaojun Ma. 2018. "Synthesis and Characterization of Wooden Magnetic Activated Carbon Fibers with Hierarchical Pore Structures" Polymers 10, no. 4: 435. https://doi.org/10.3390/polym10040435
Note that from the first issue of 2016, this journal uses article numbers instead of page numbers. See further details here.