Development and Characterization of Defect-Free Matrimid® Mixed-Matrix Membranes Containing Activated Carbon Particles for Gas Separation


 , ,
, ,
Abstract
:
1. Introduction
2. Materials and Methods
2.1. Materials
2.2. Preparation of Membranes
2.3. Characterization Methods
2.3.1. Thermal Analysis
2.3.2. Morphological Characterization
2.3.3. Gas Sorption Measurements
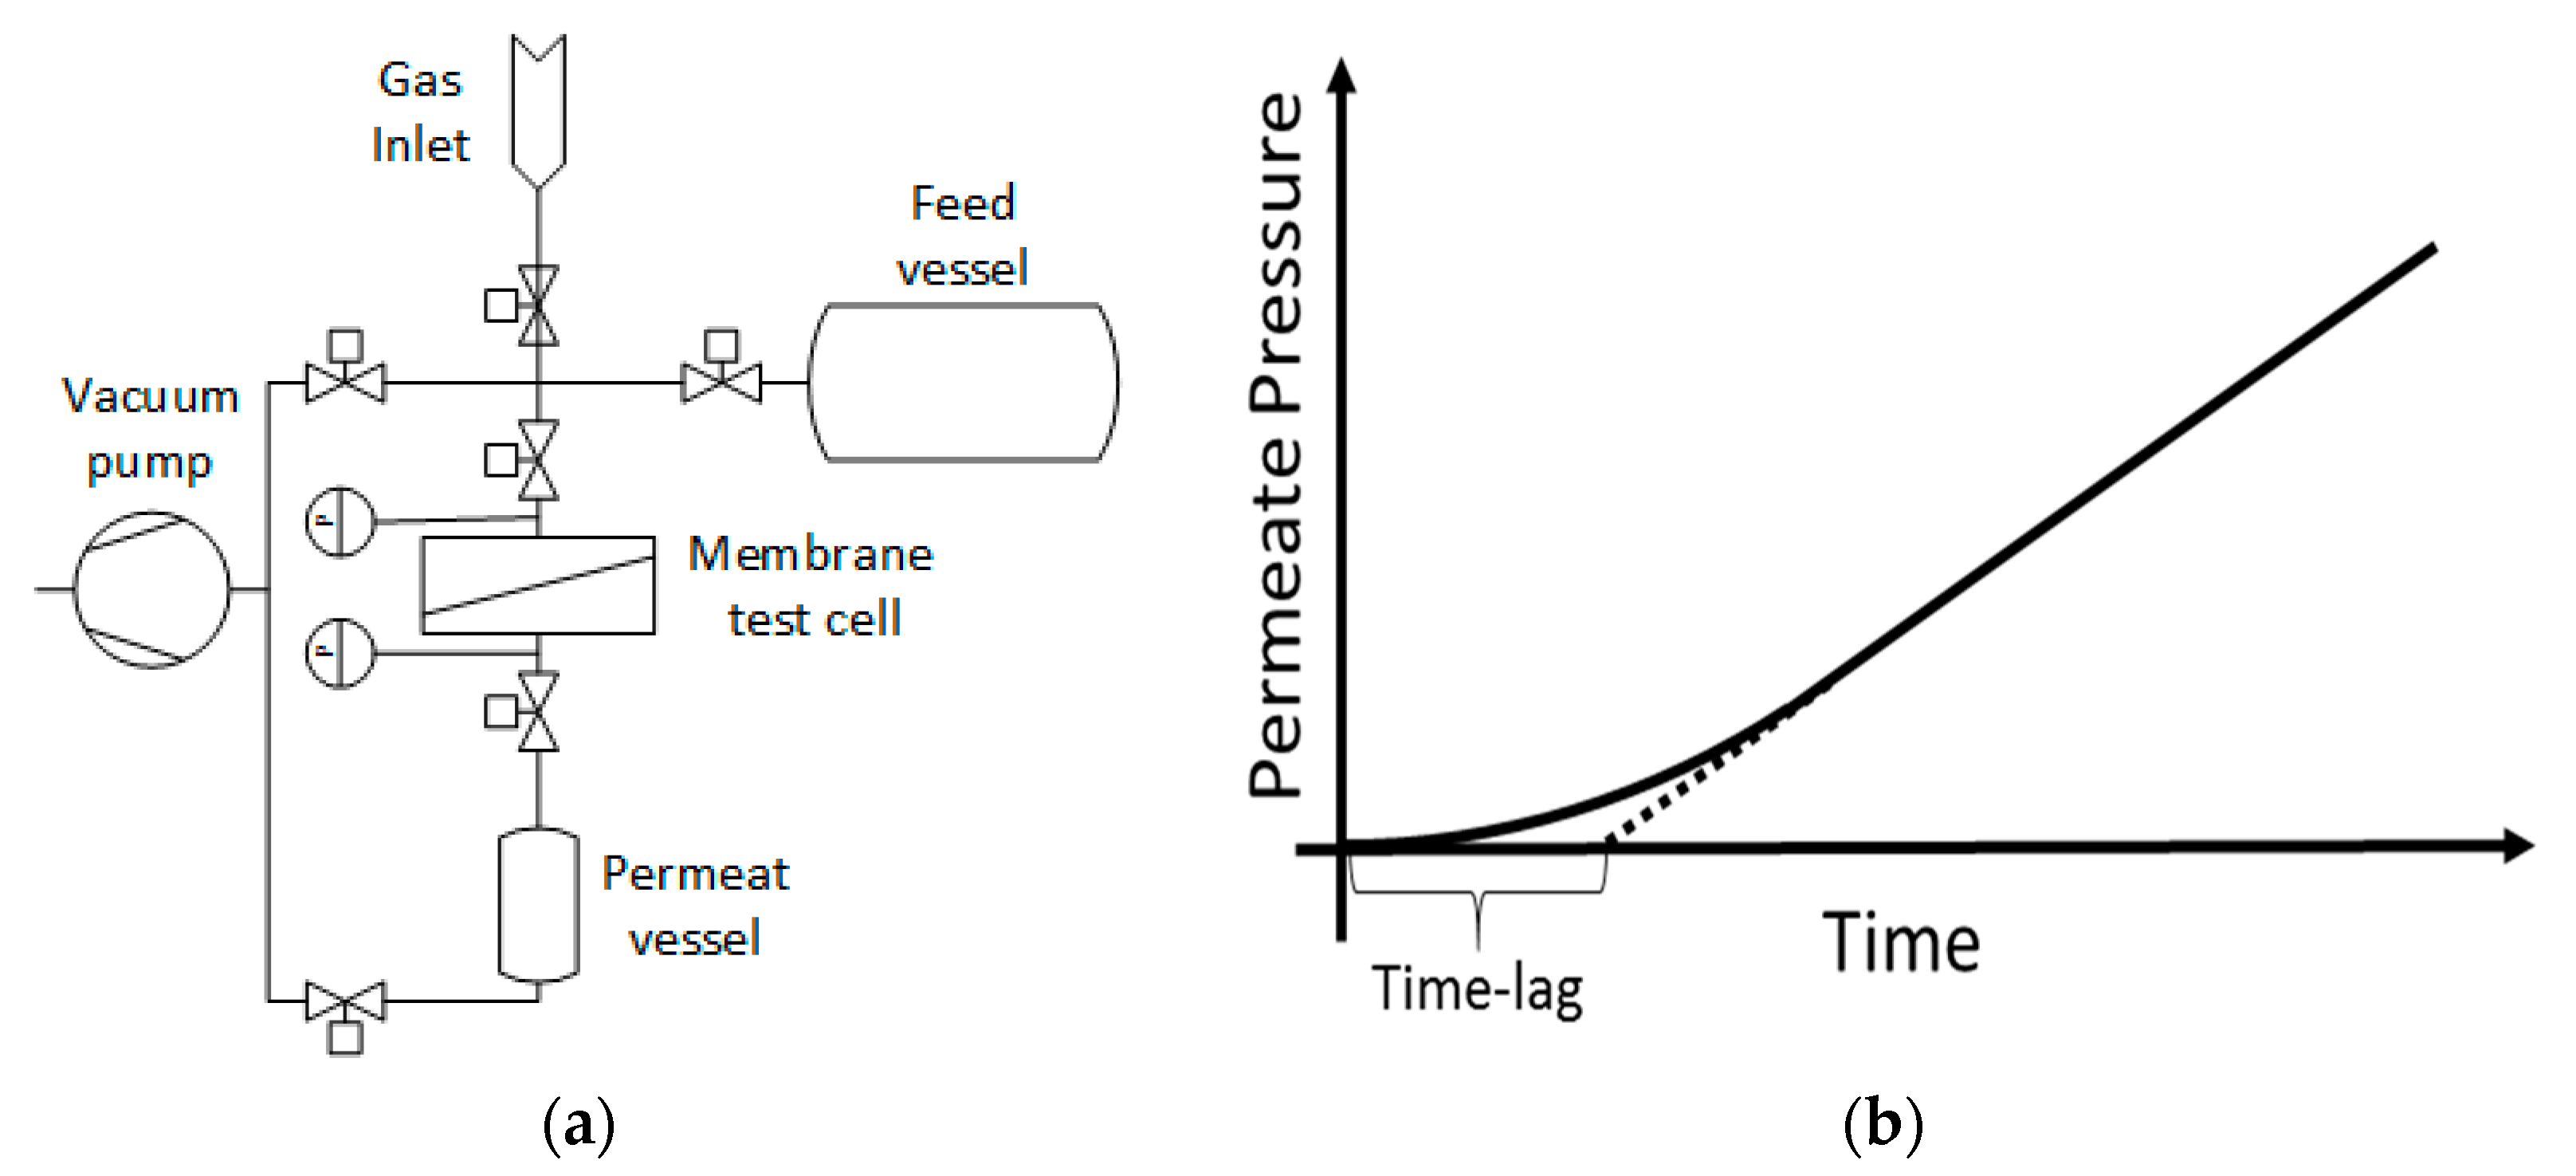
2.3.4. Gas Transport Characteristics Determination
3. Results and Discussion
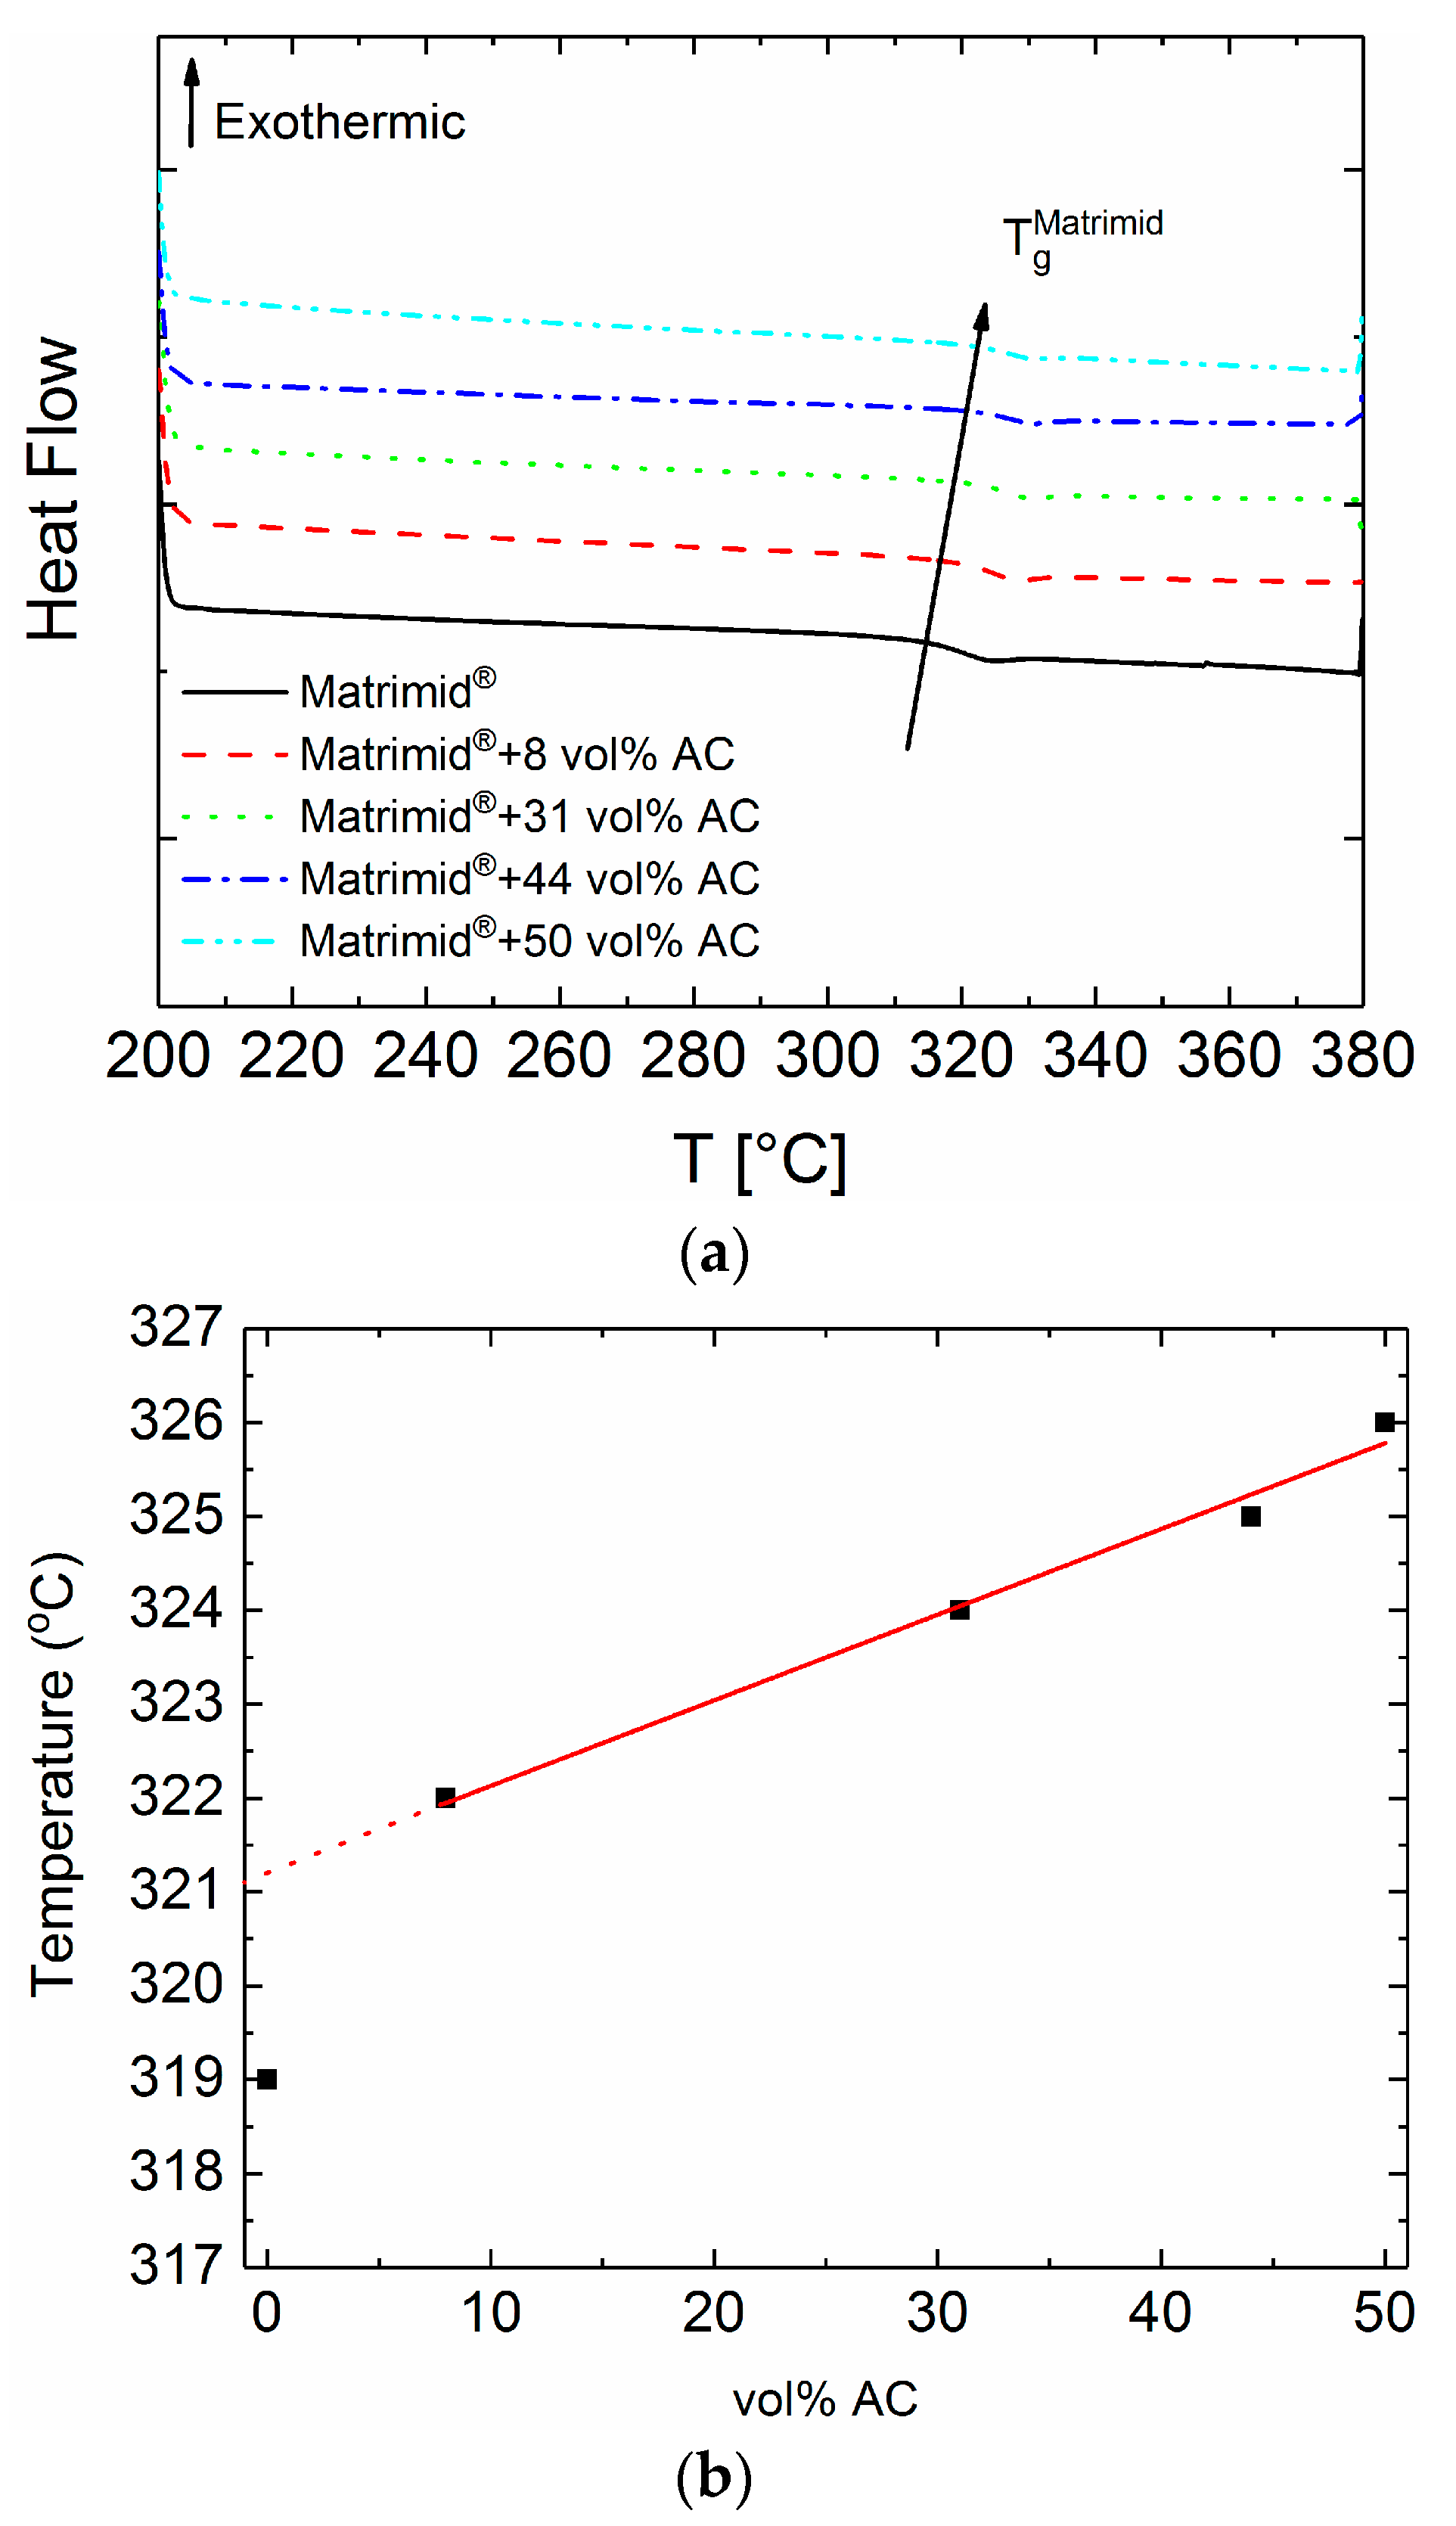
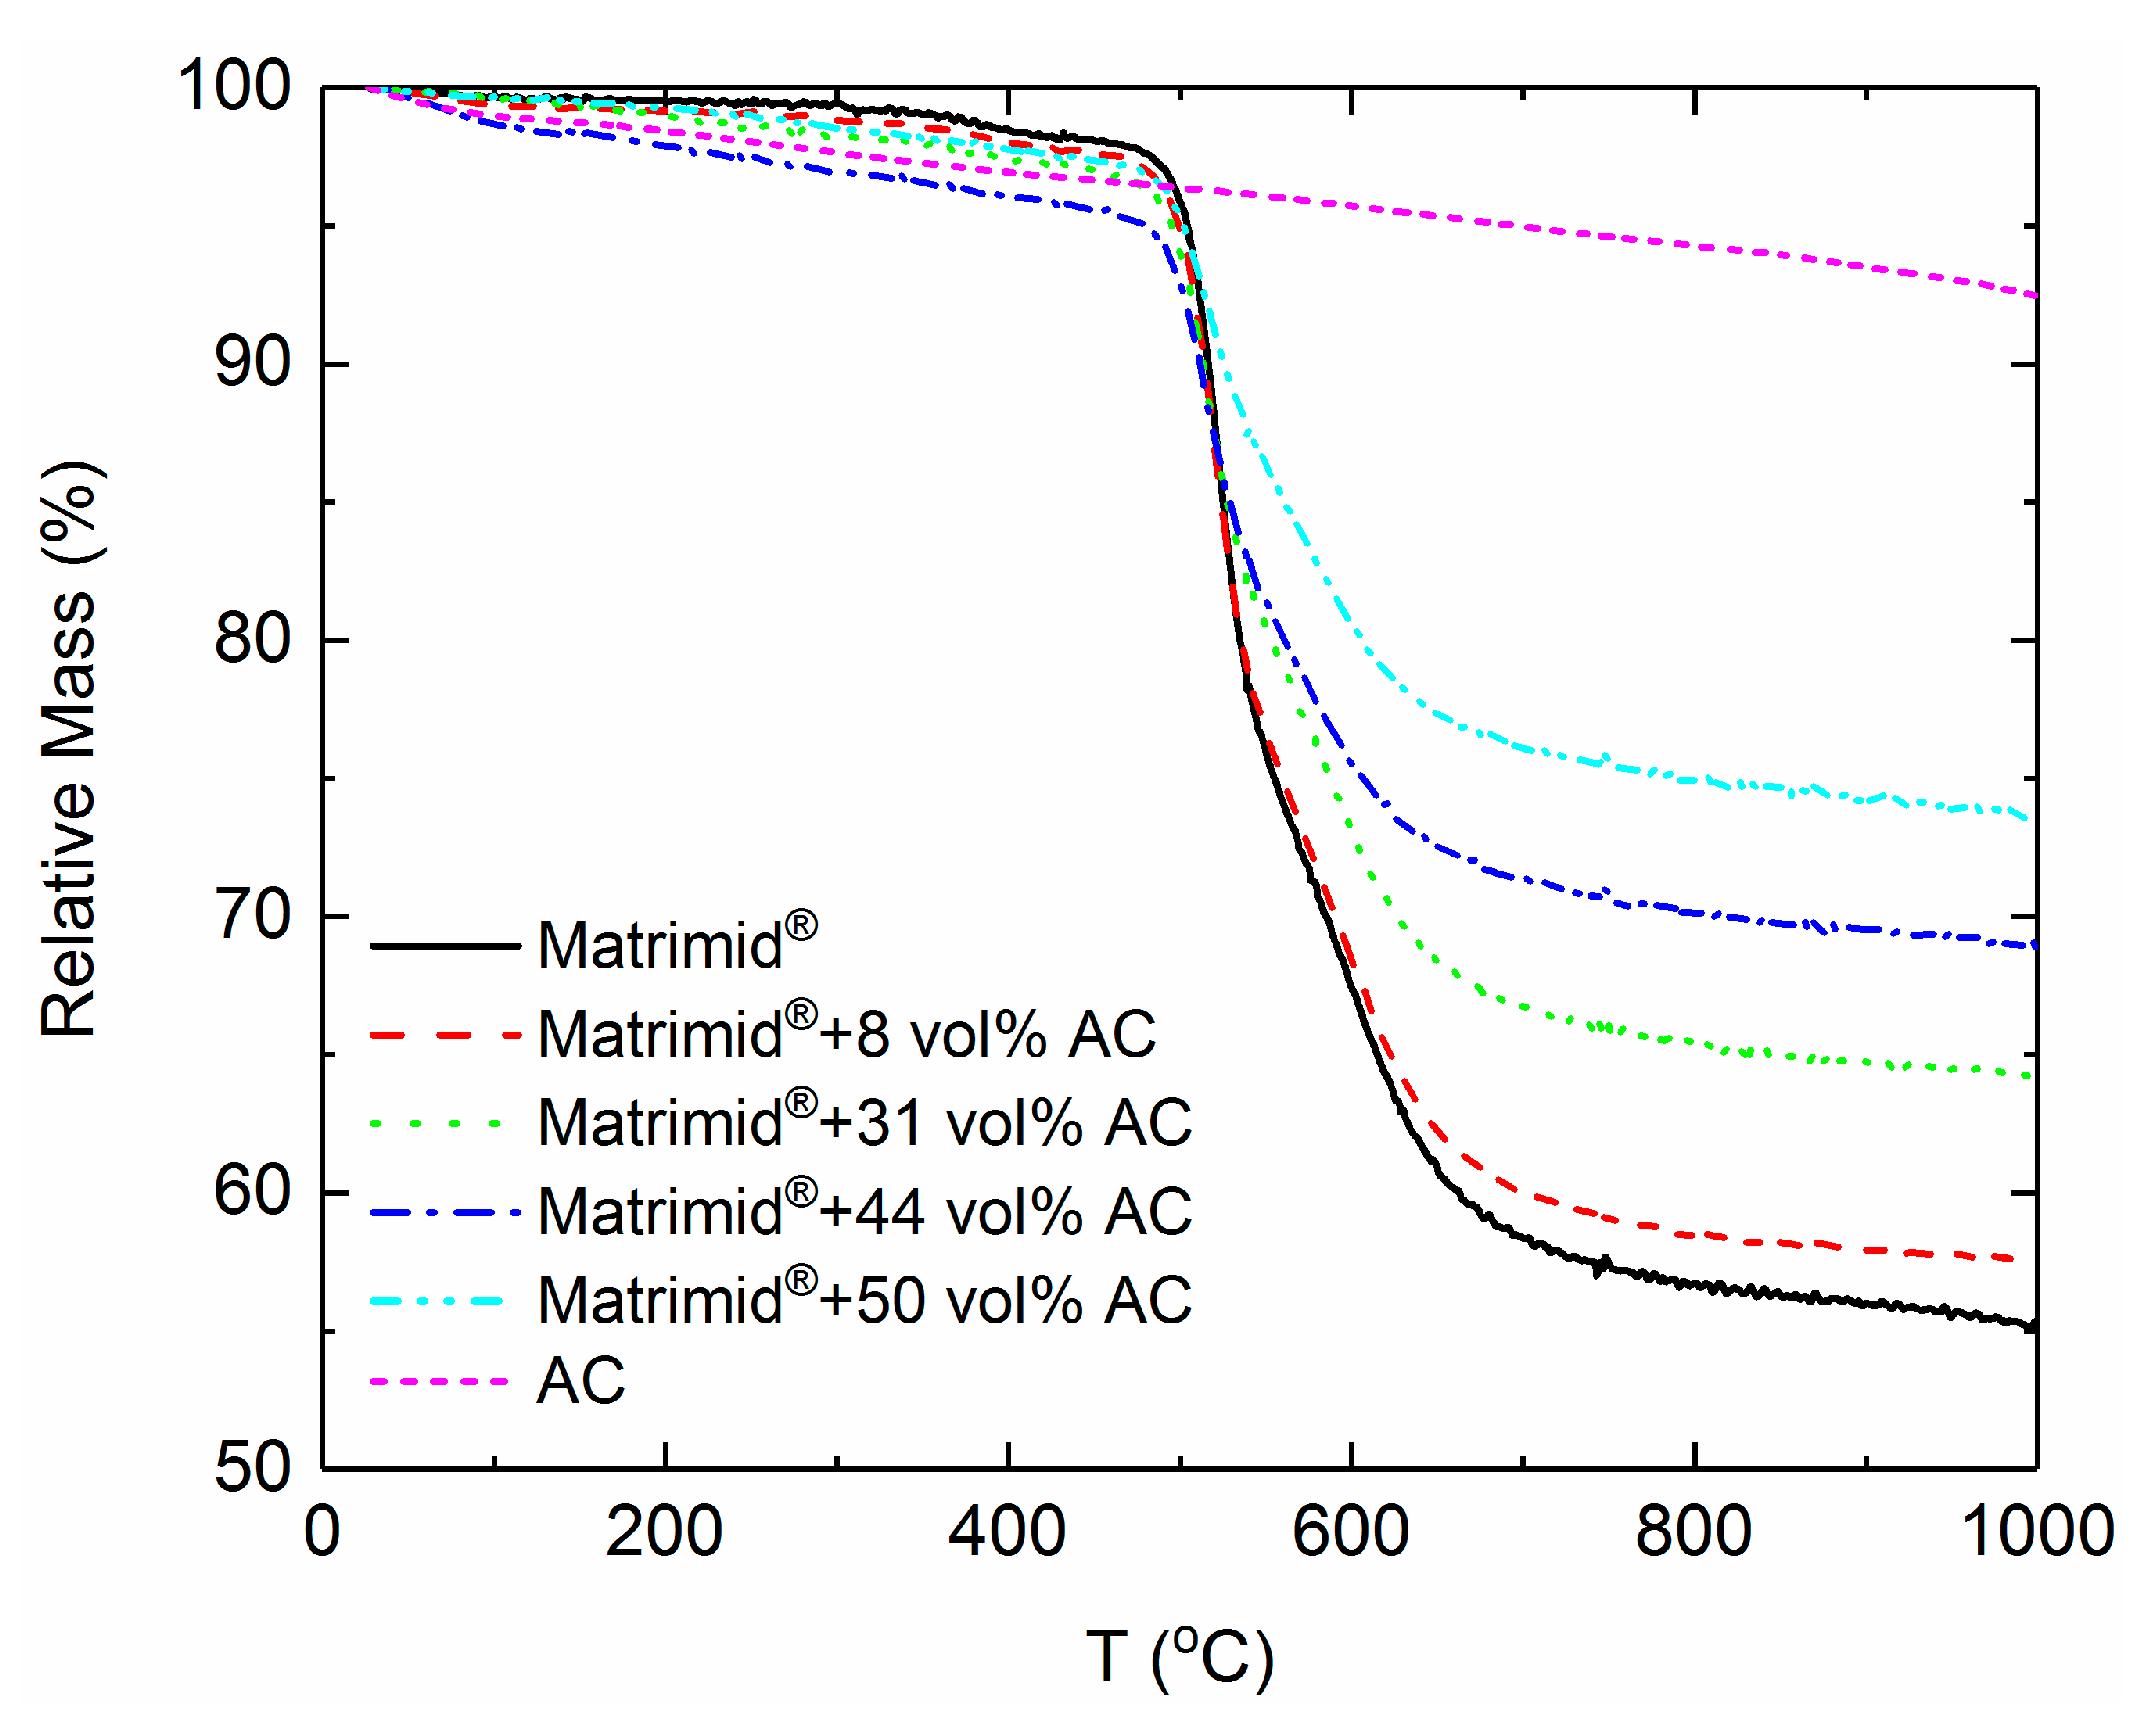
3.1. Thermal Analysis
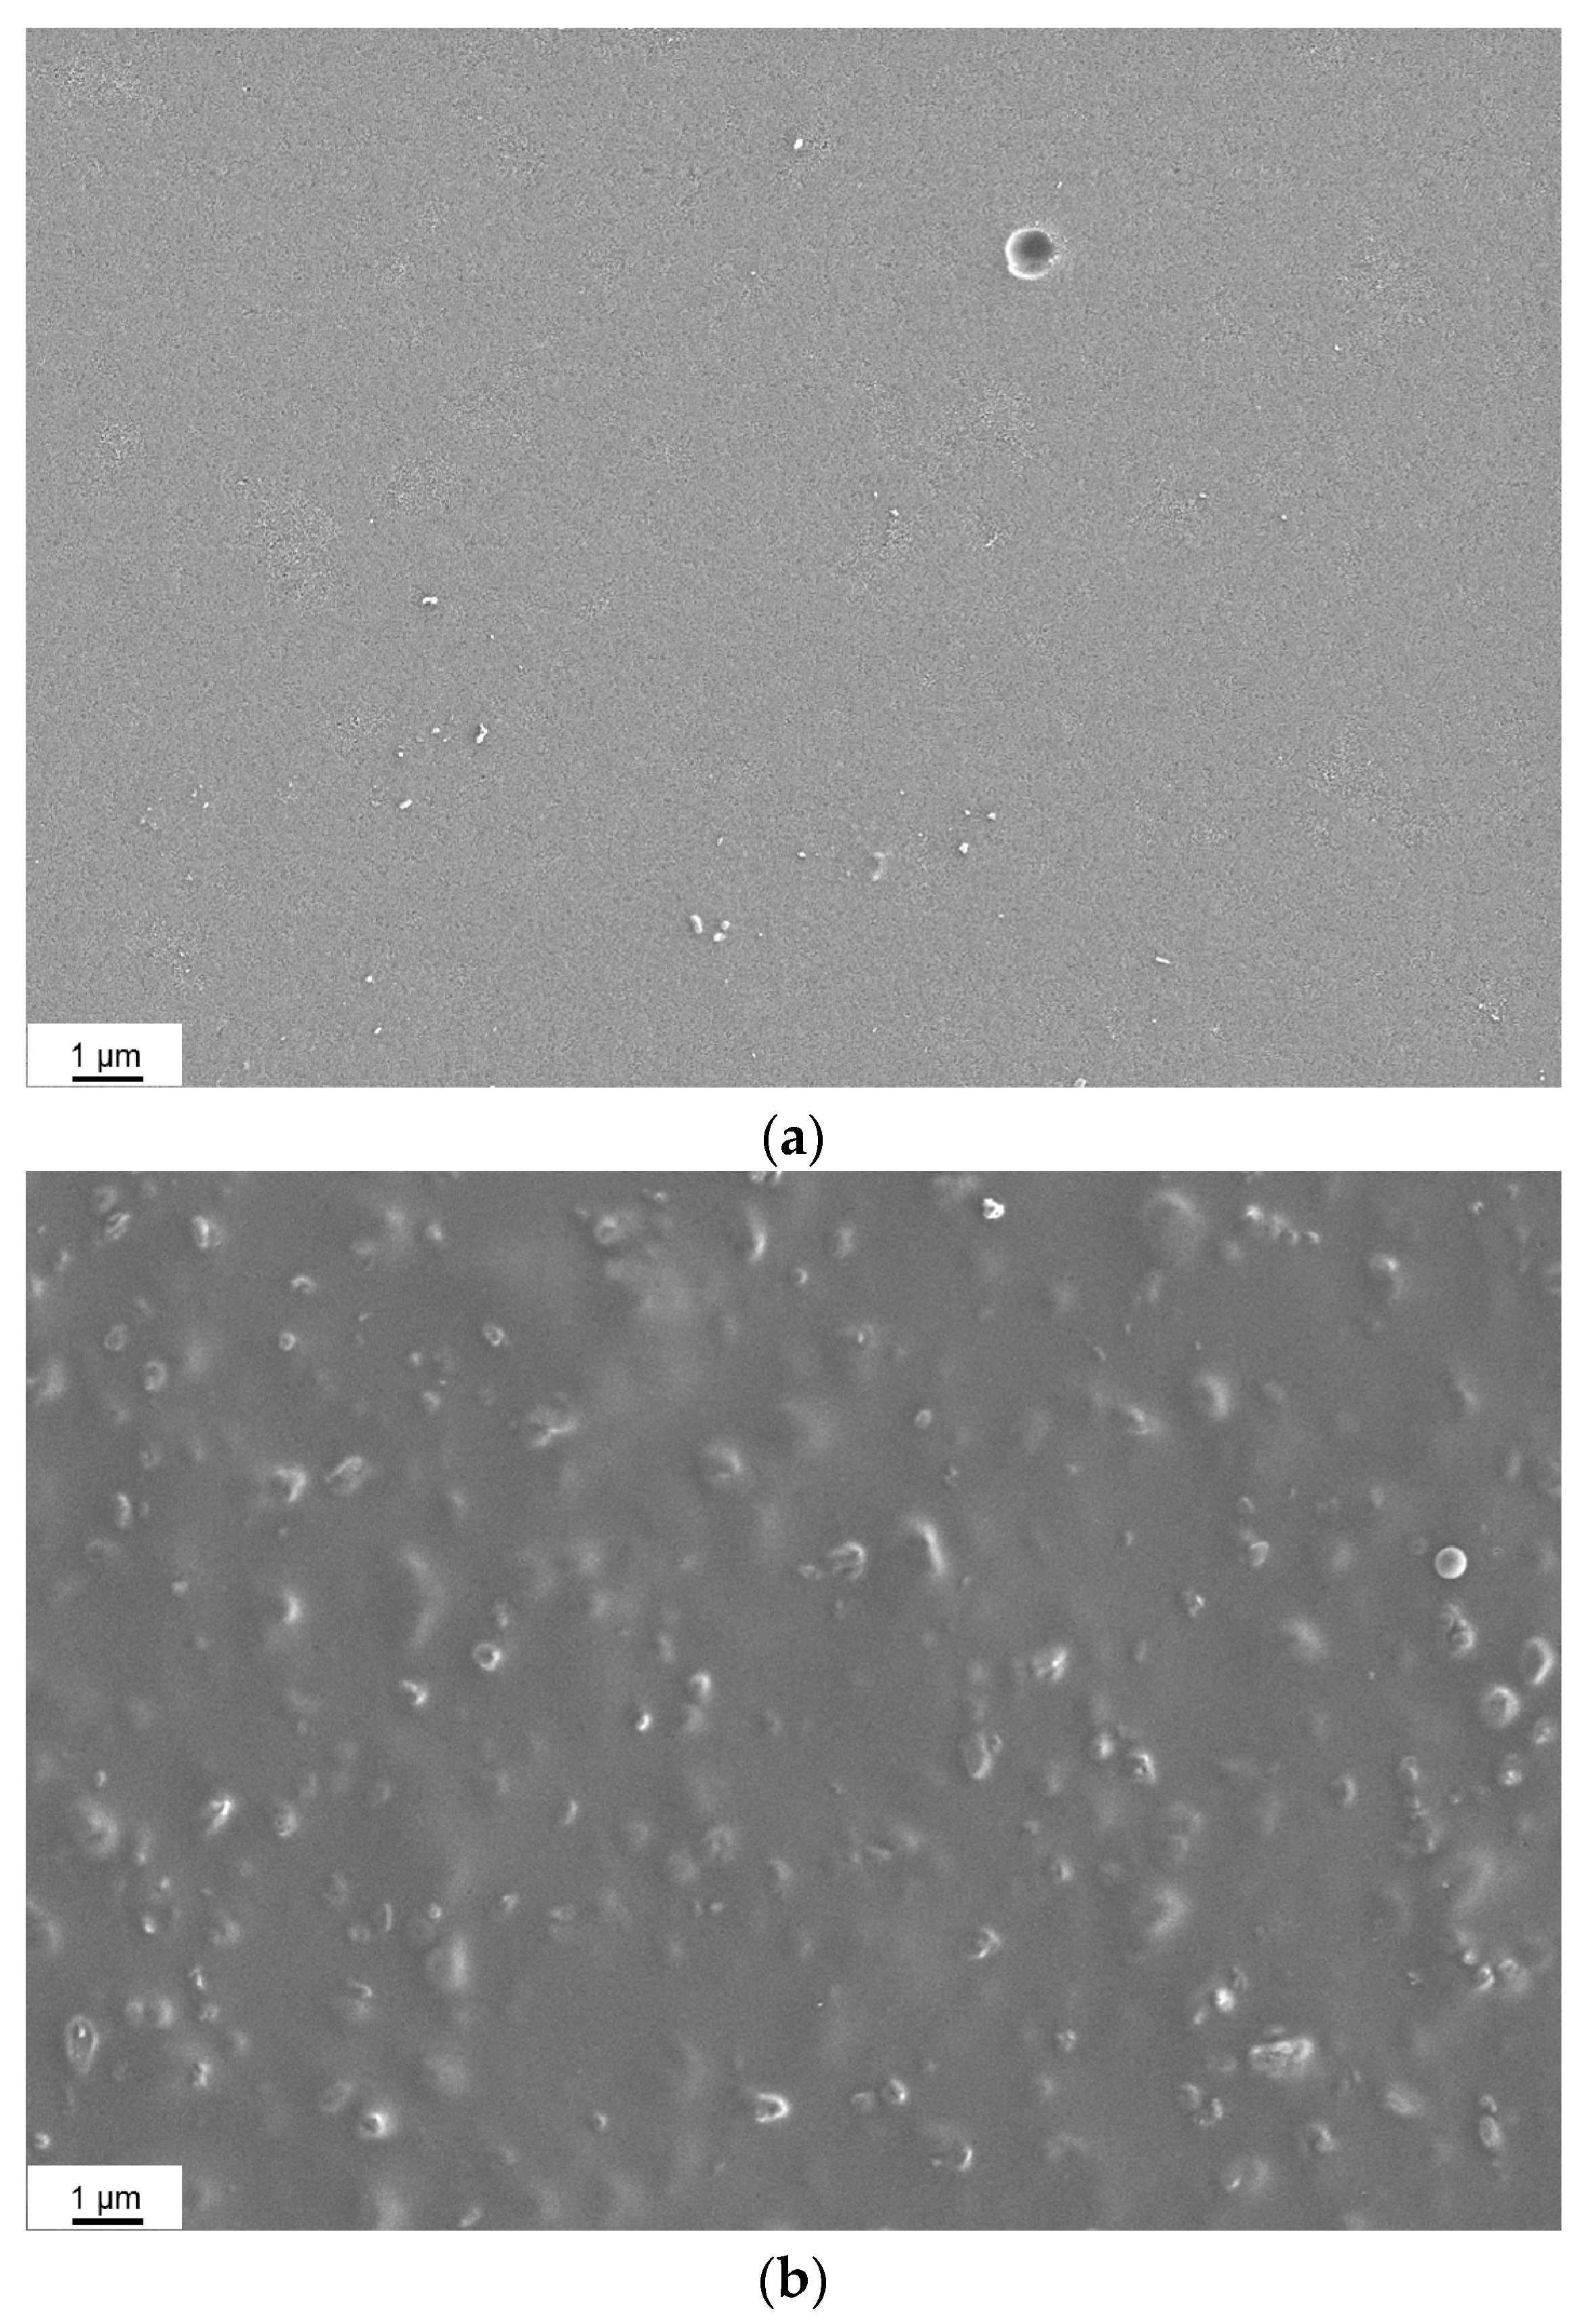
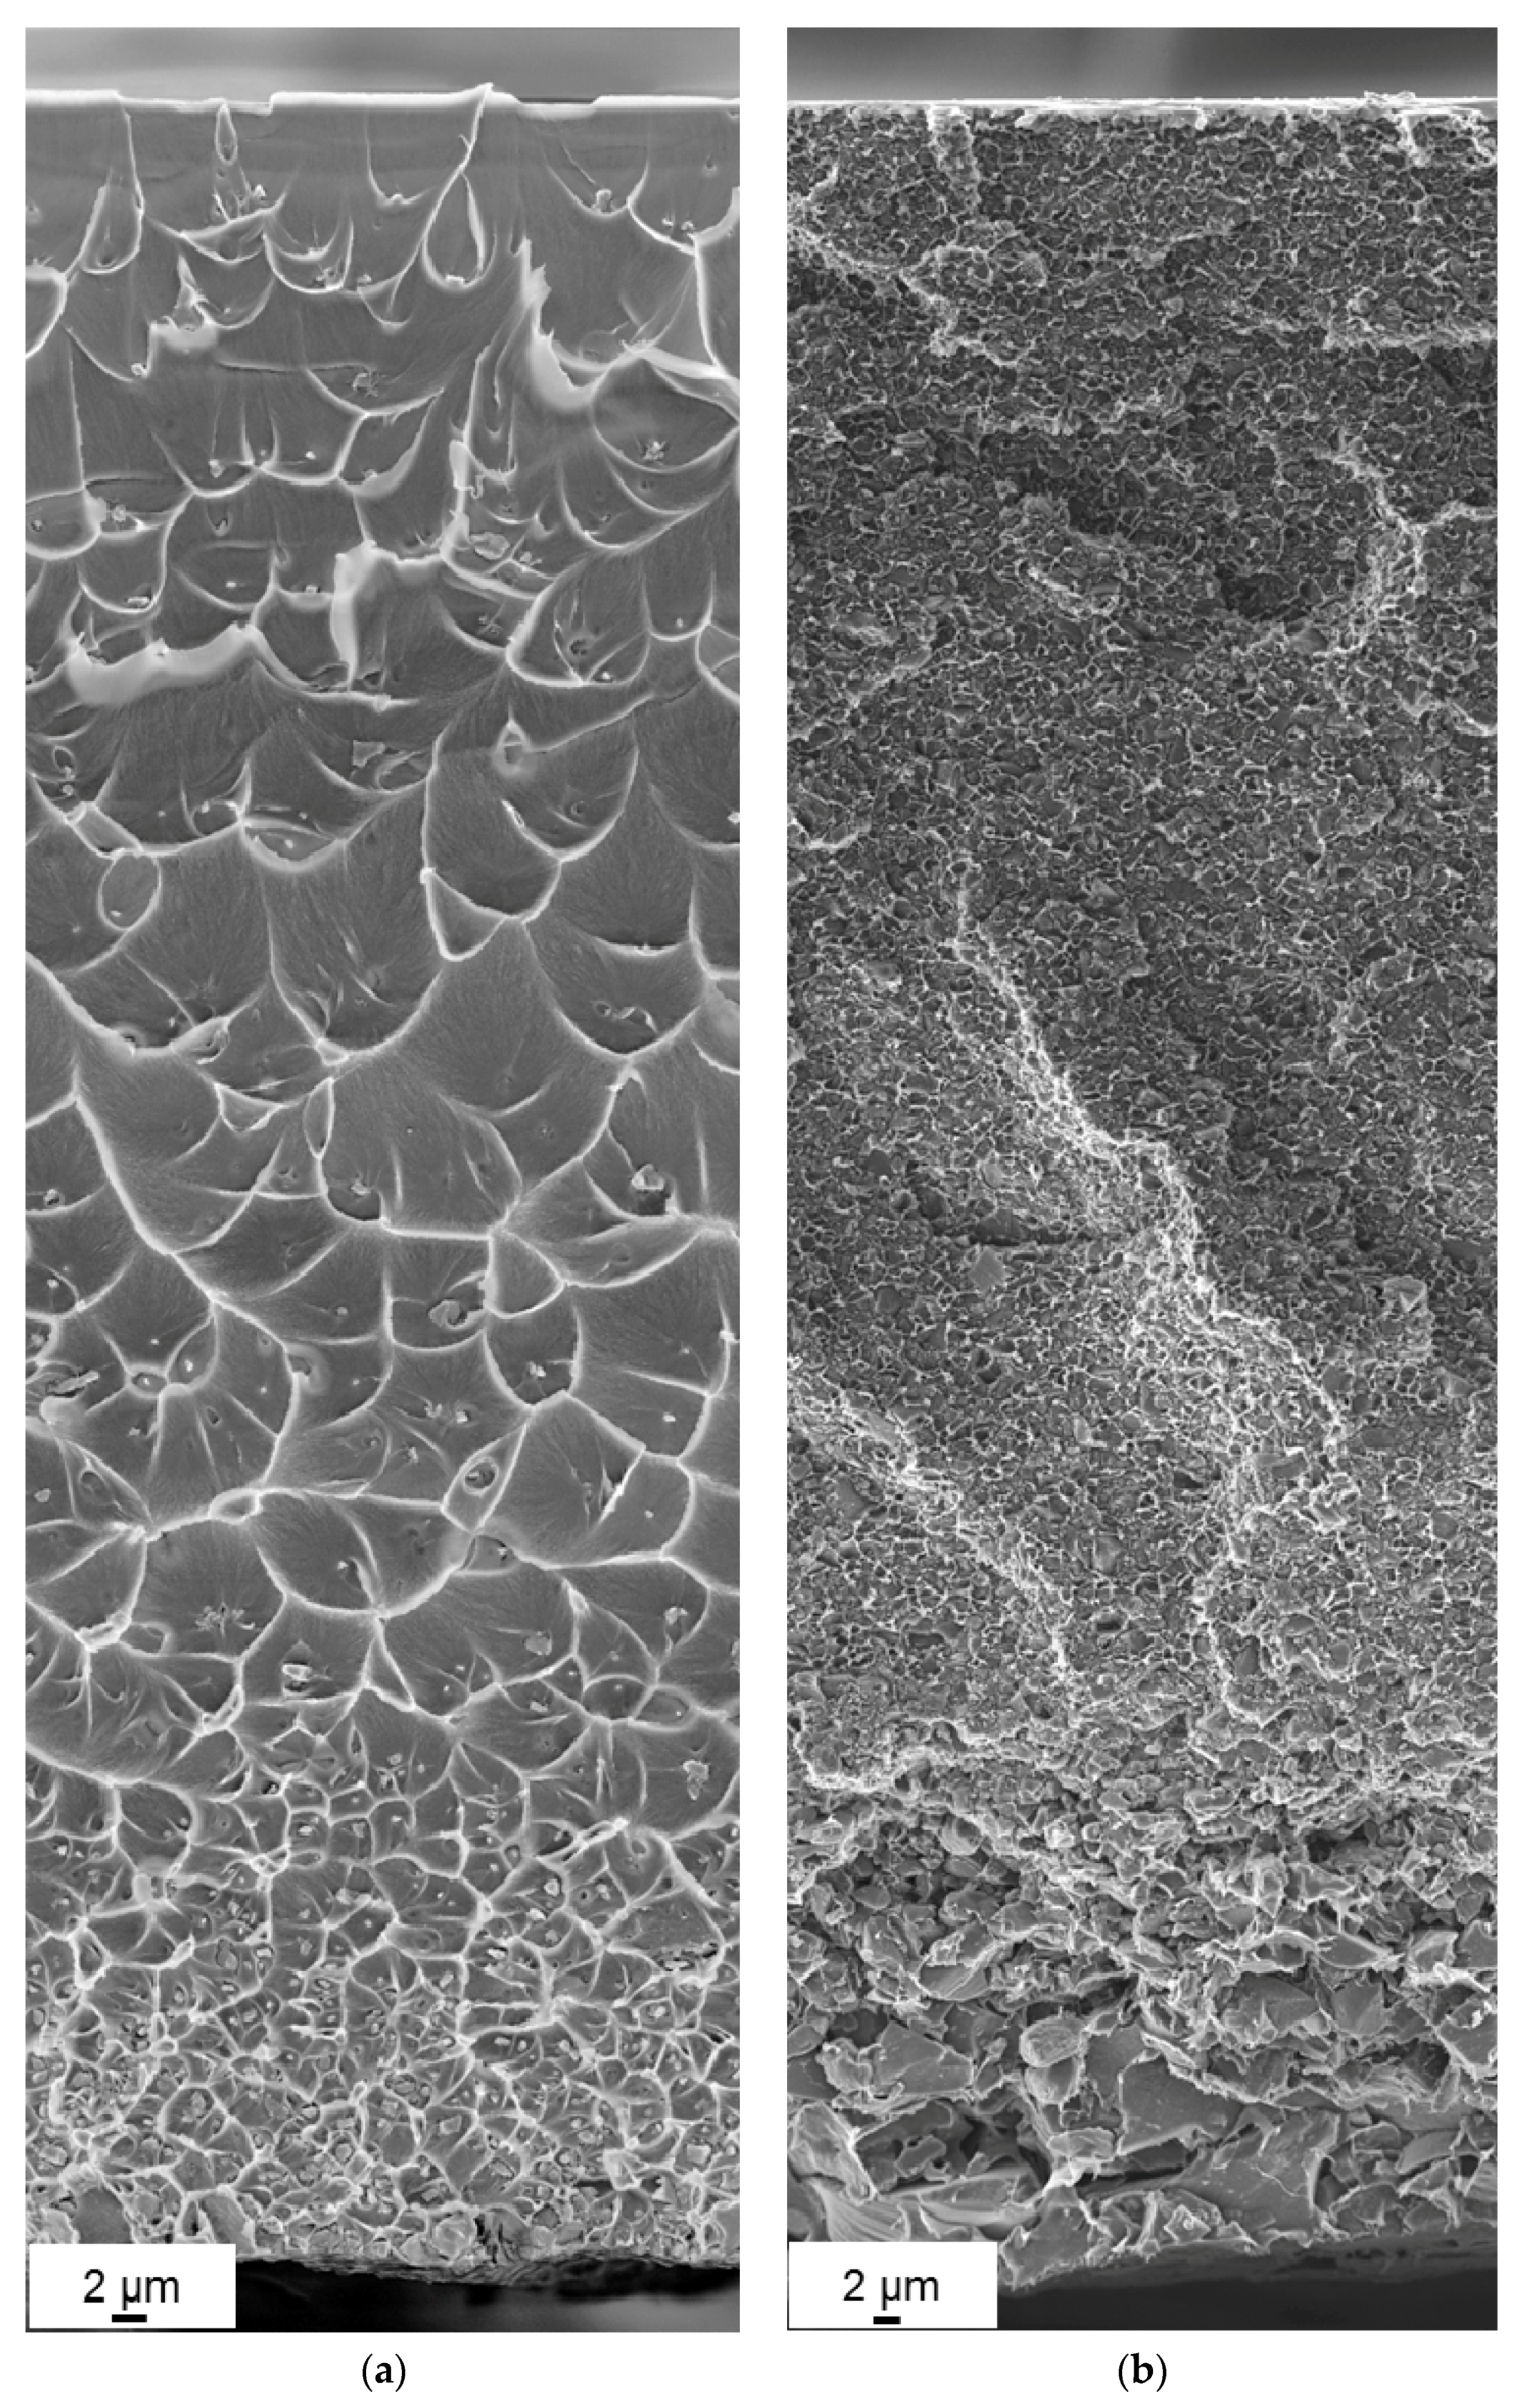
3.2. Morphology of the Membranes
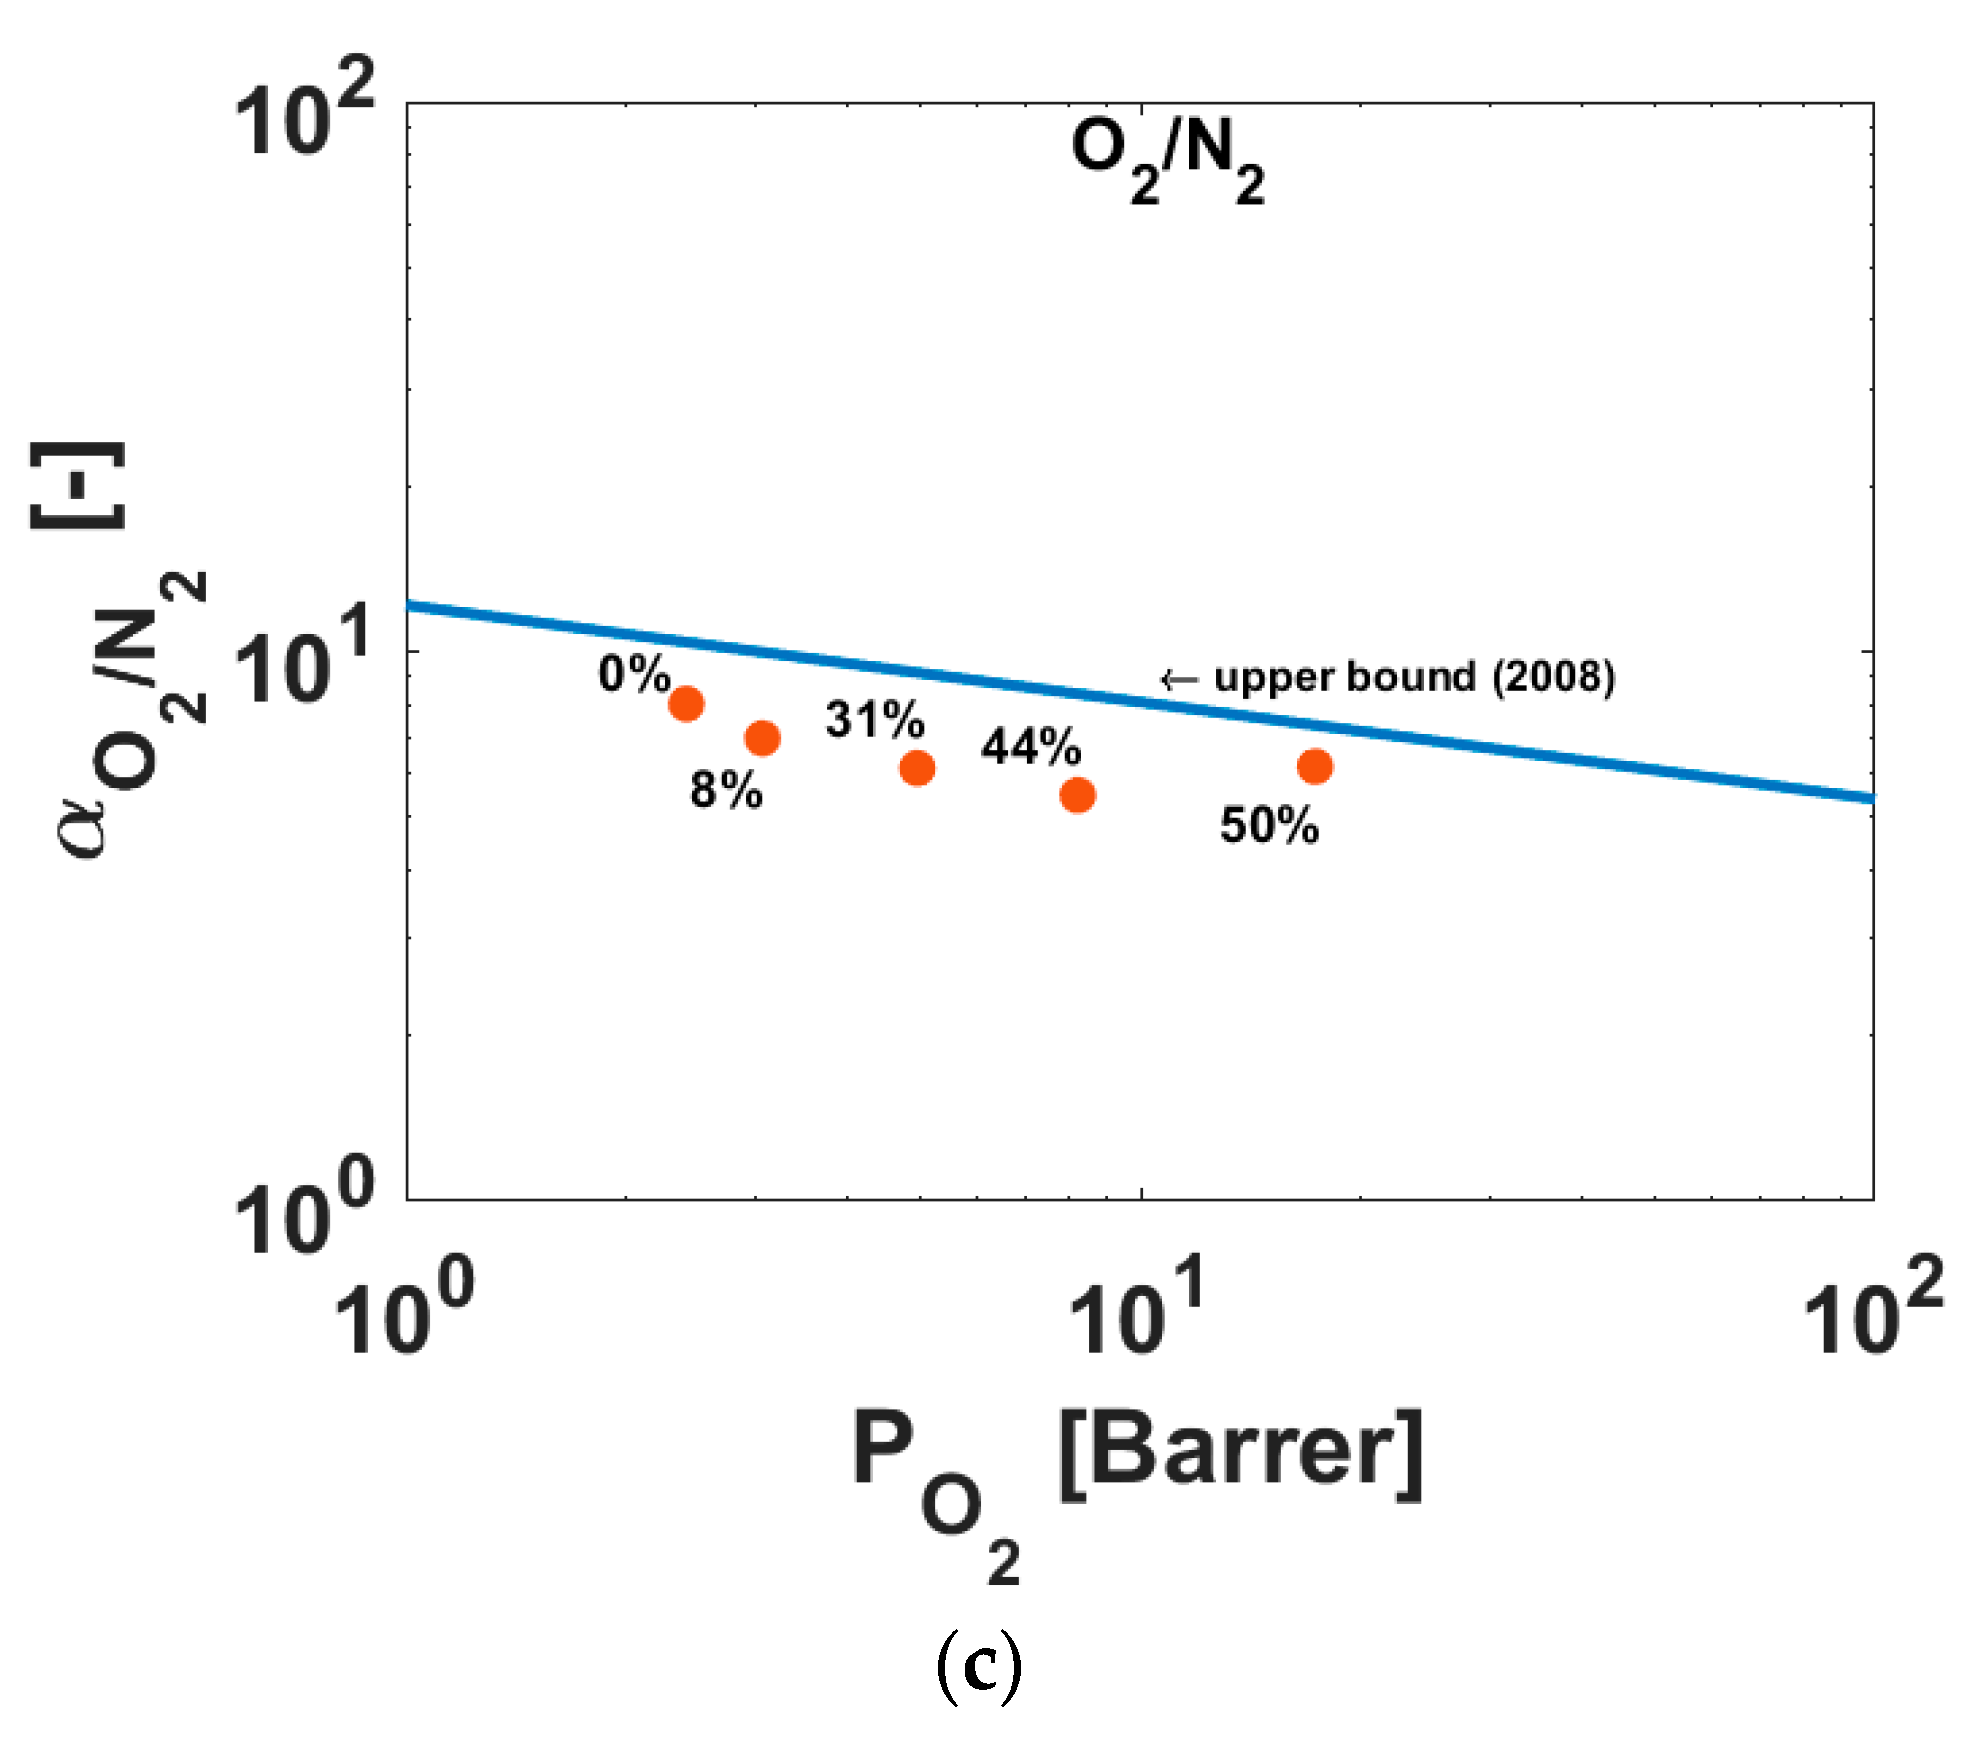
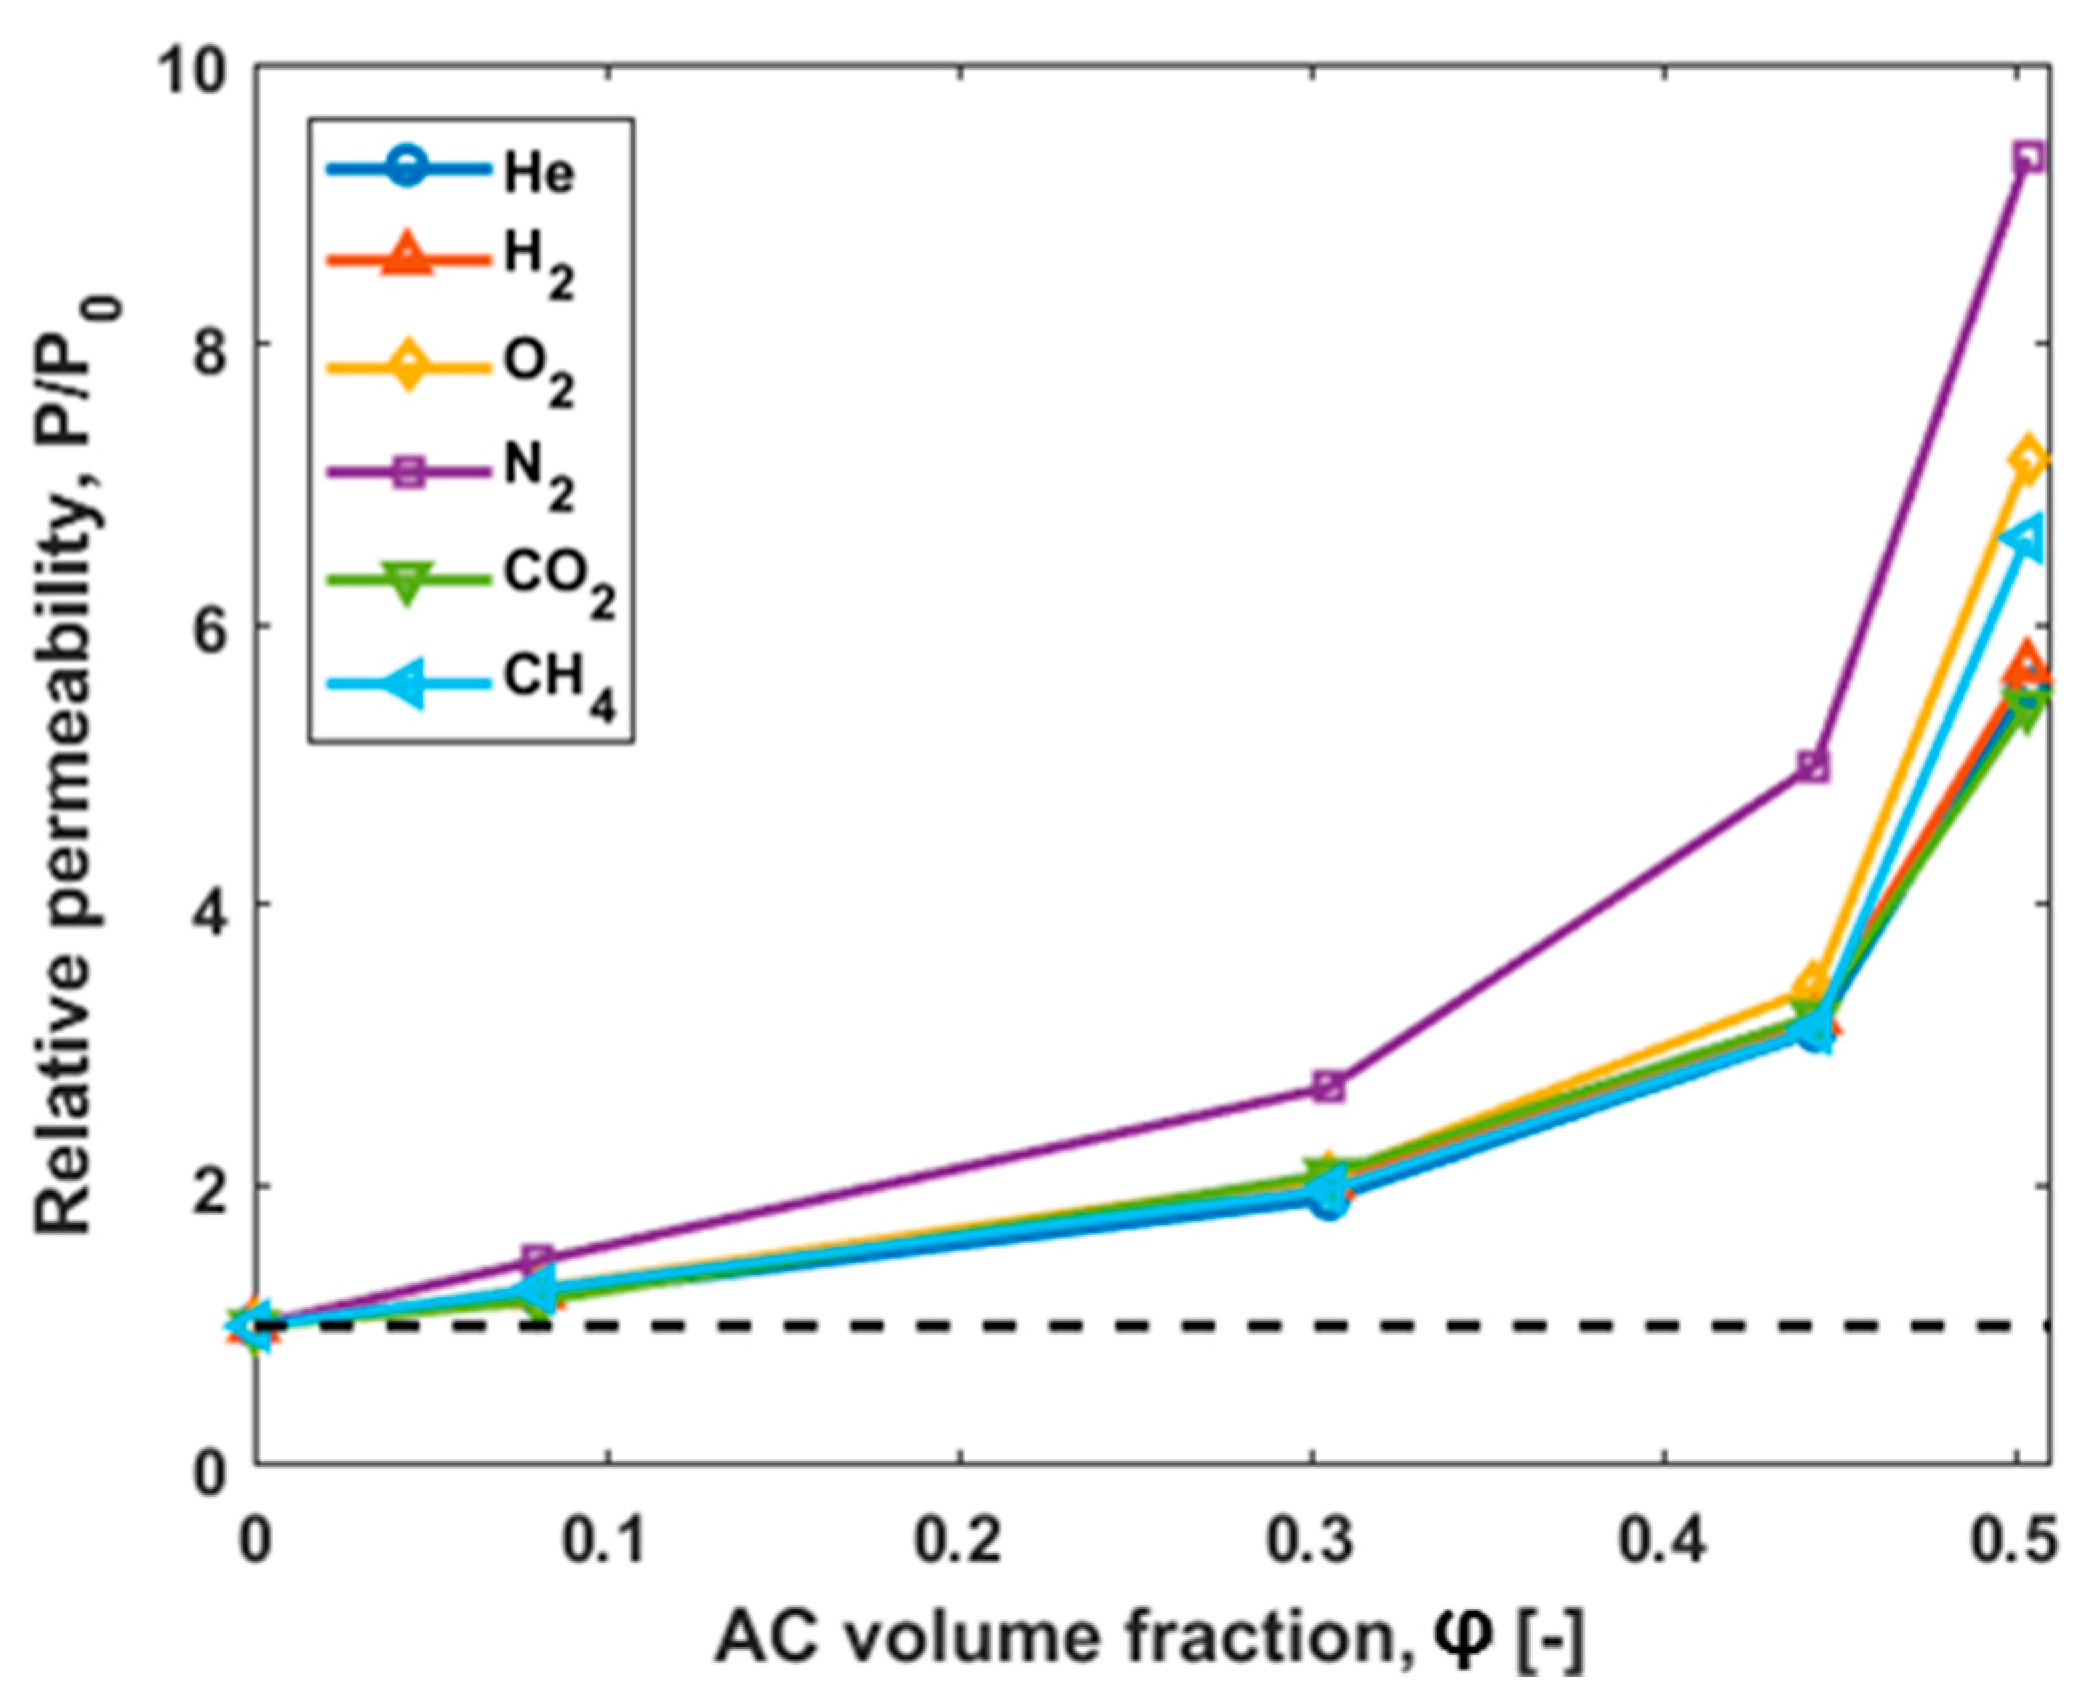
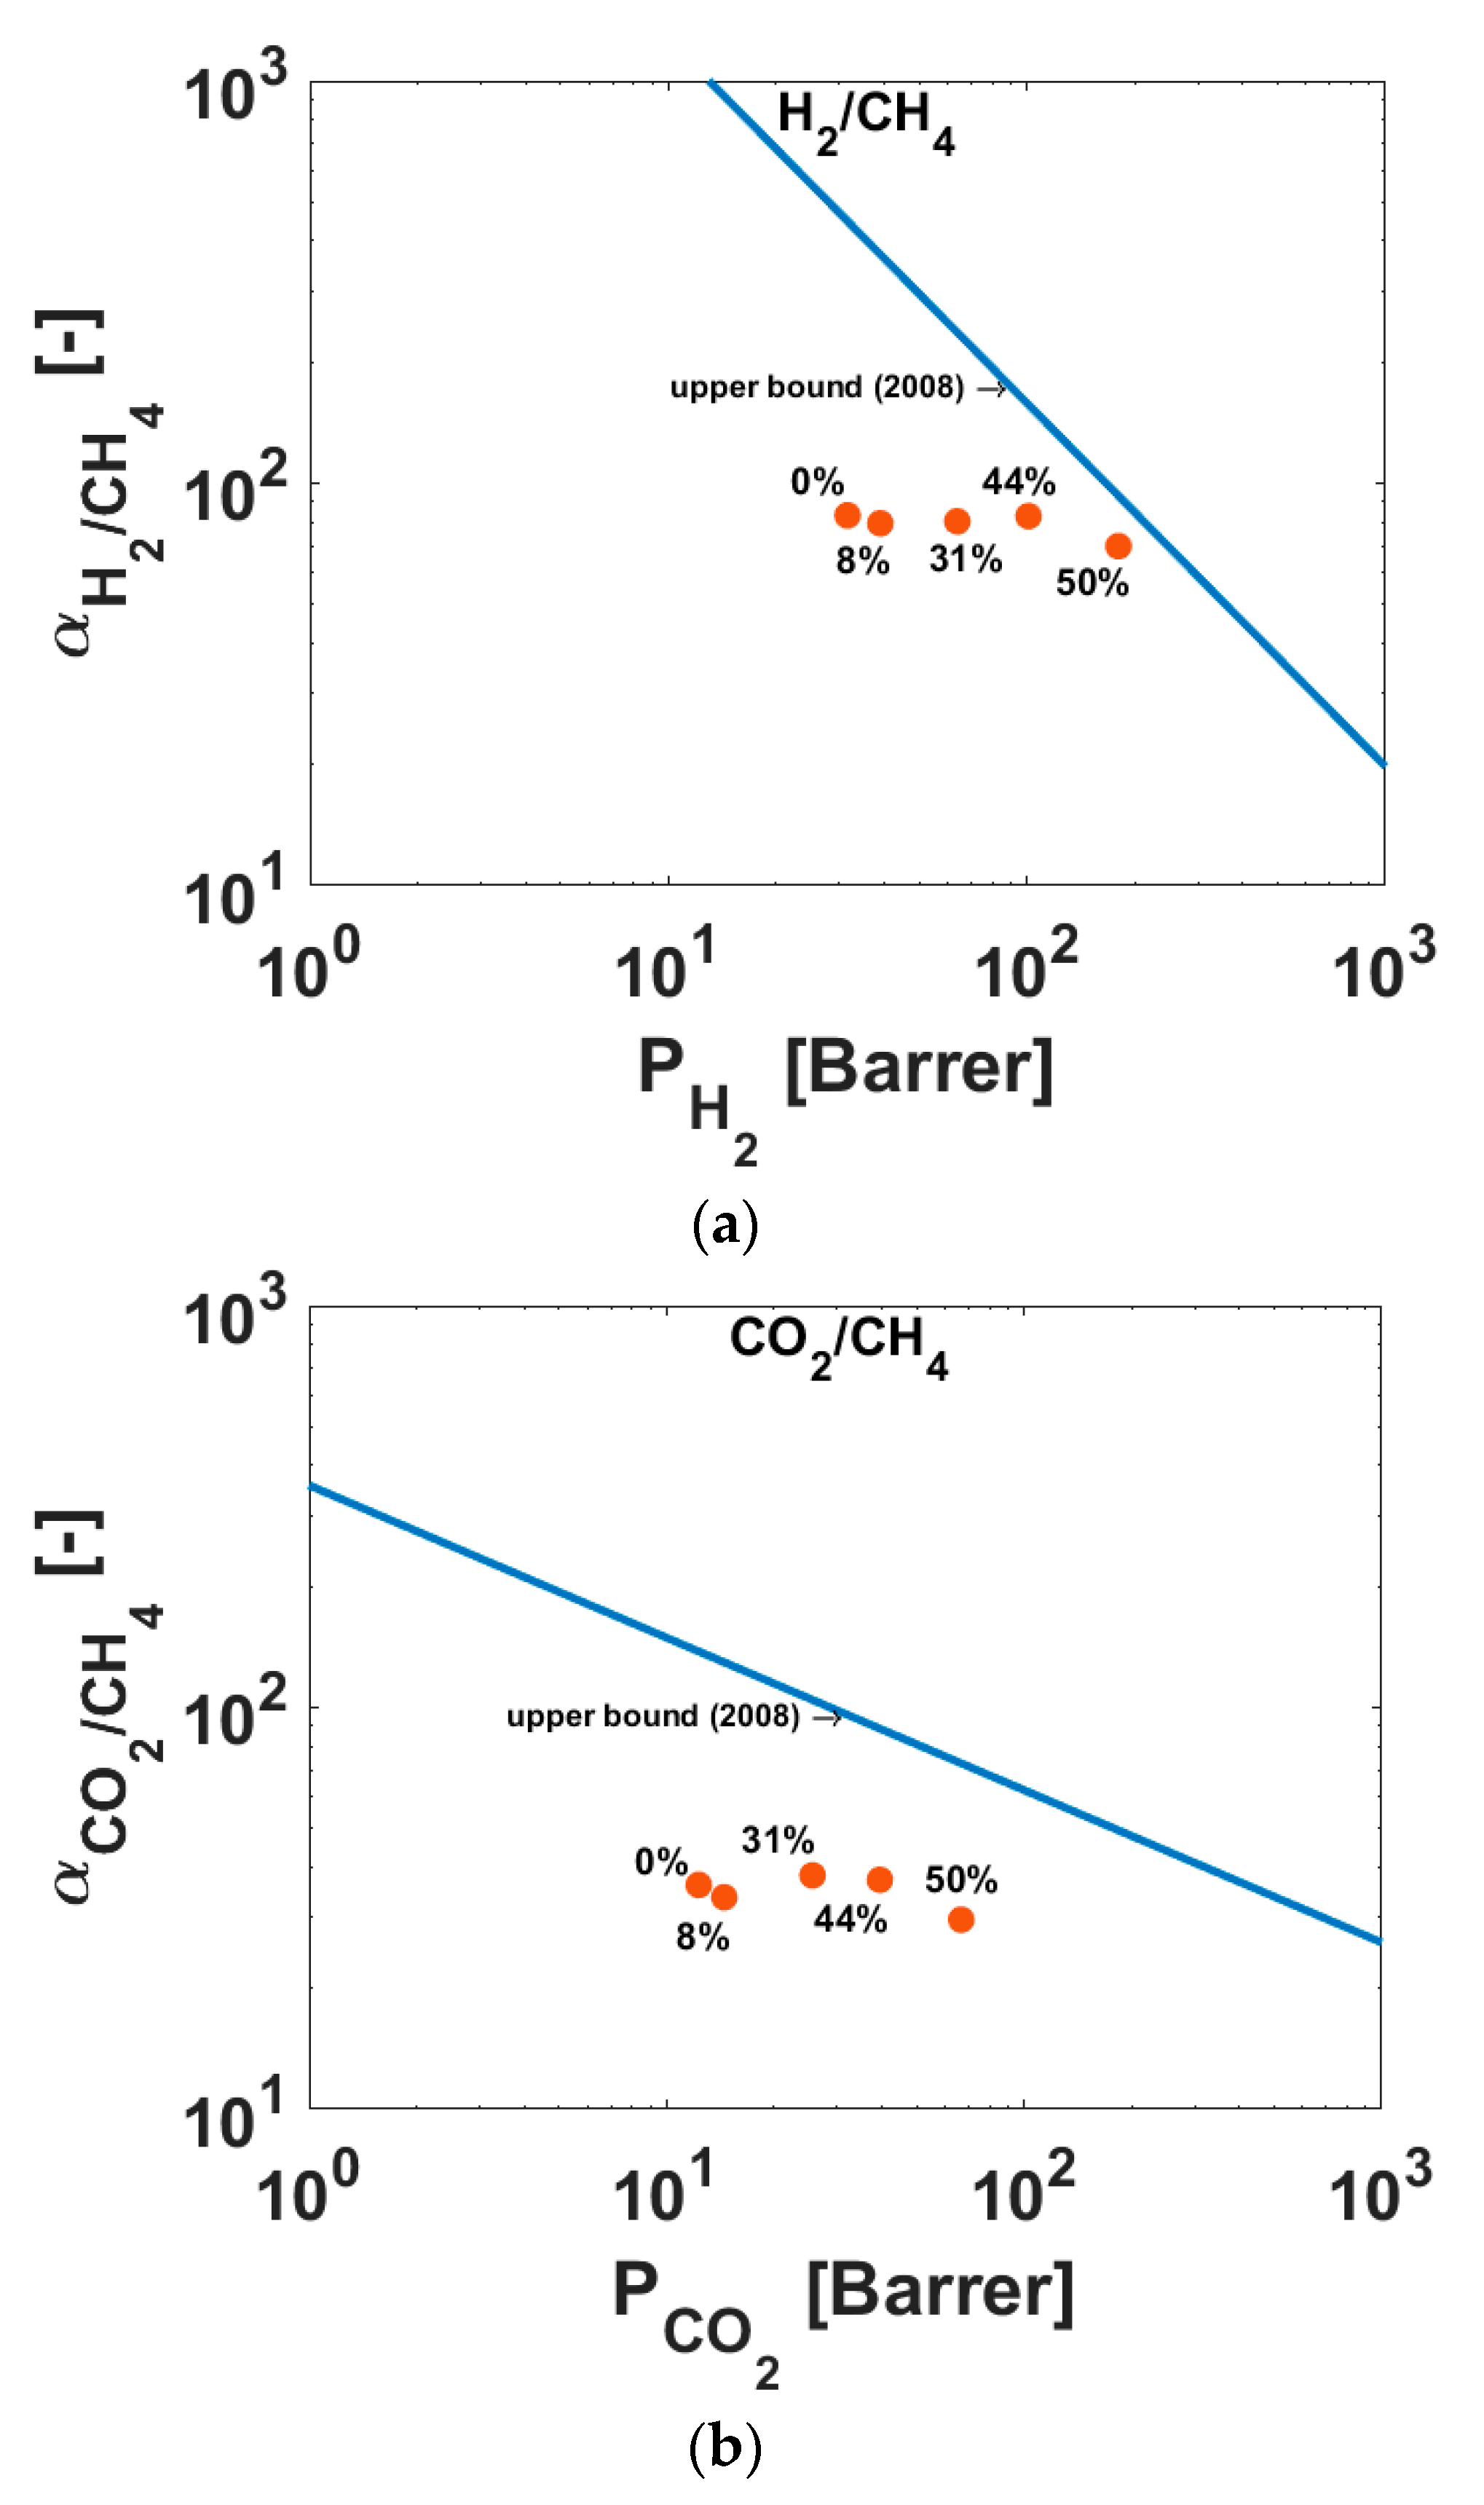
3.3. Gas Transport Characterization Results
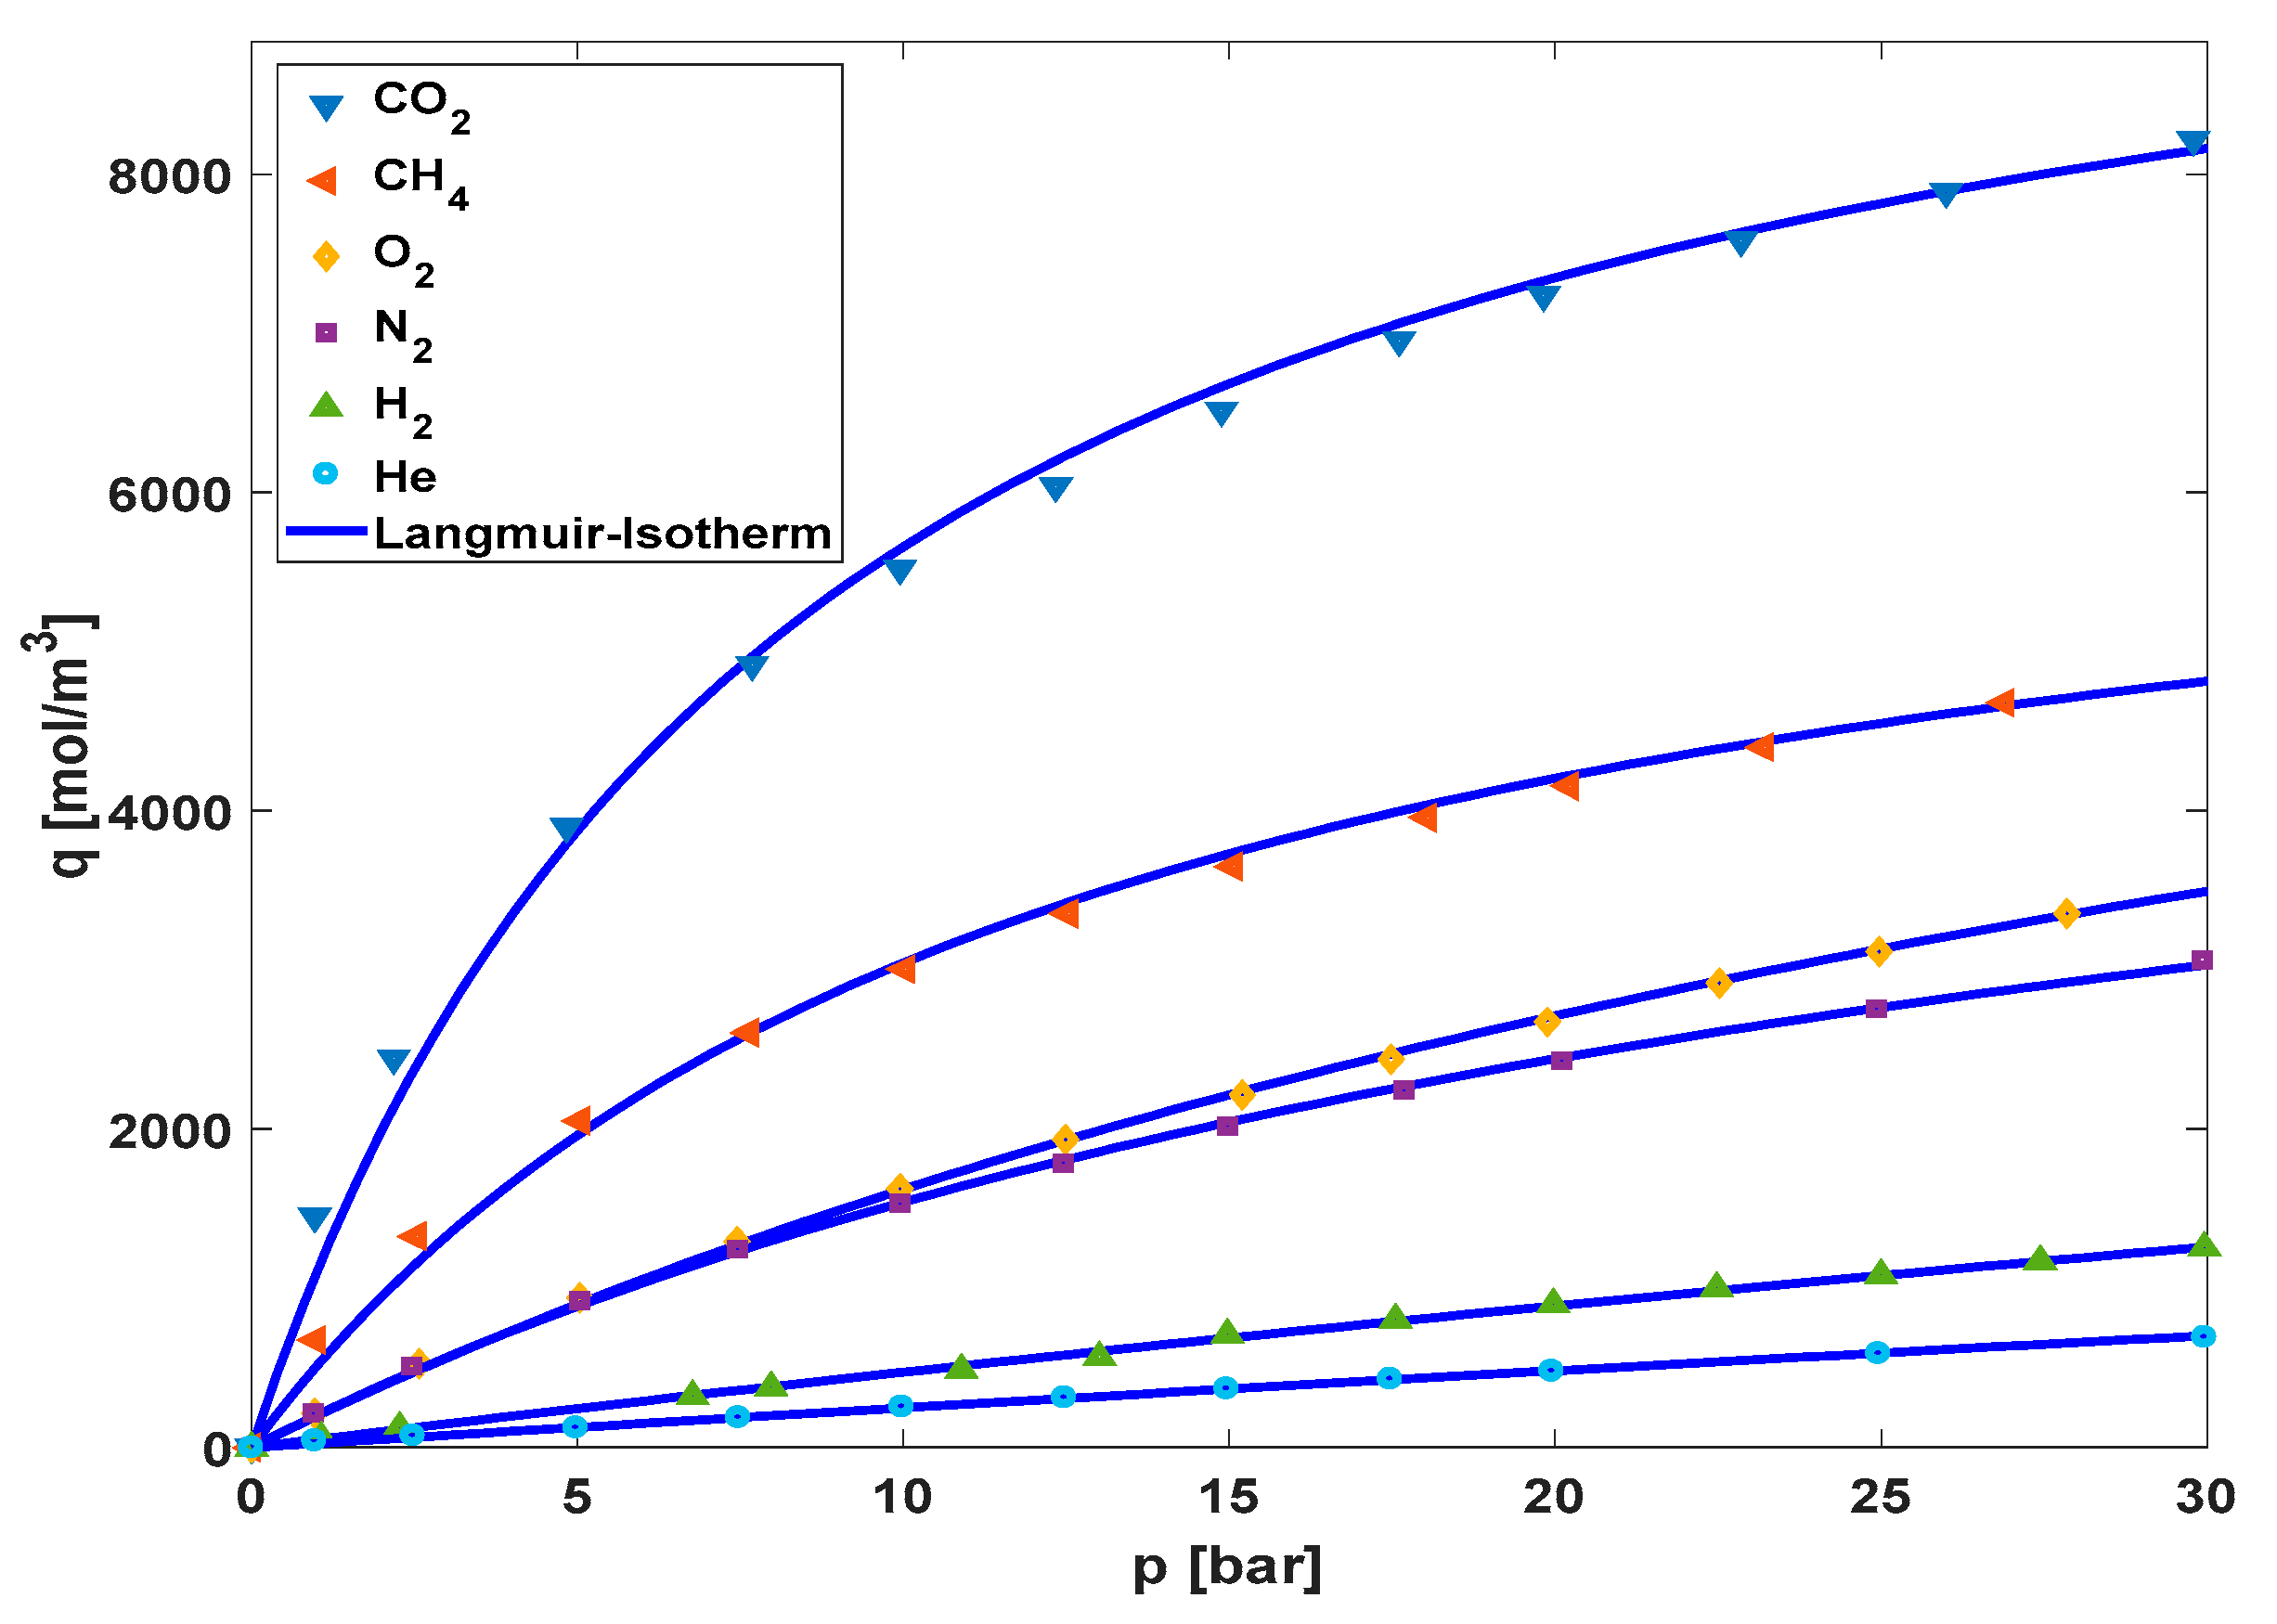
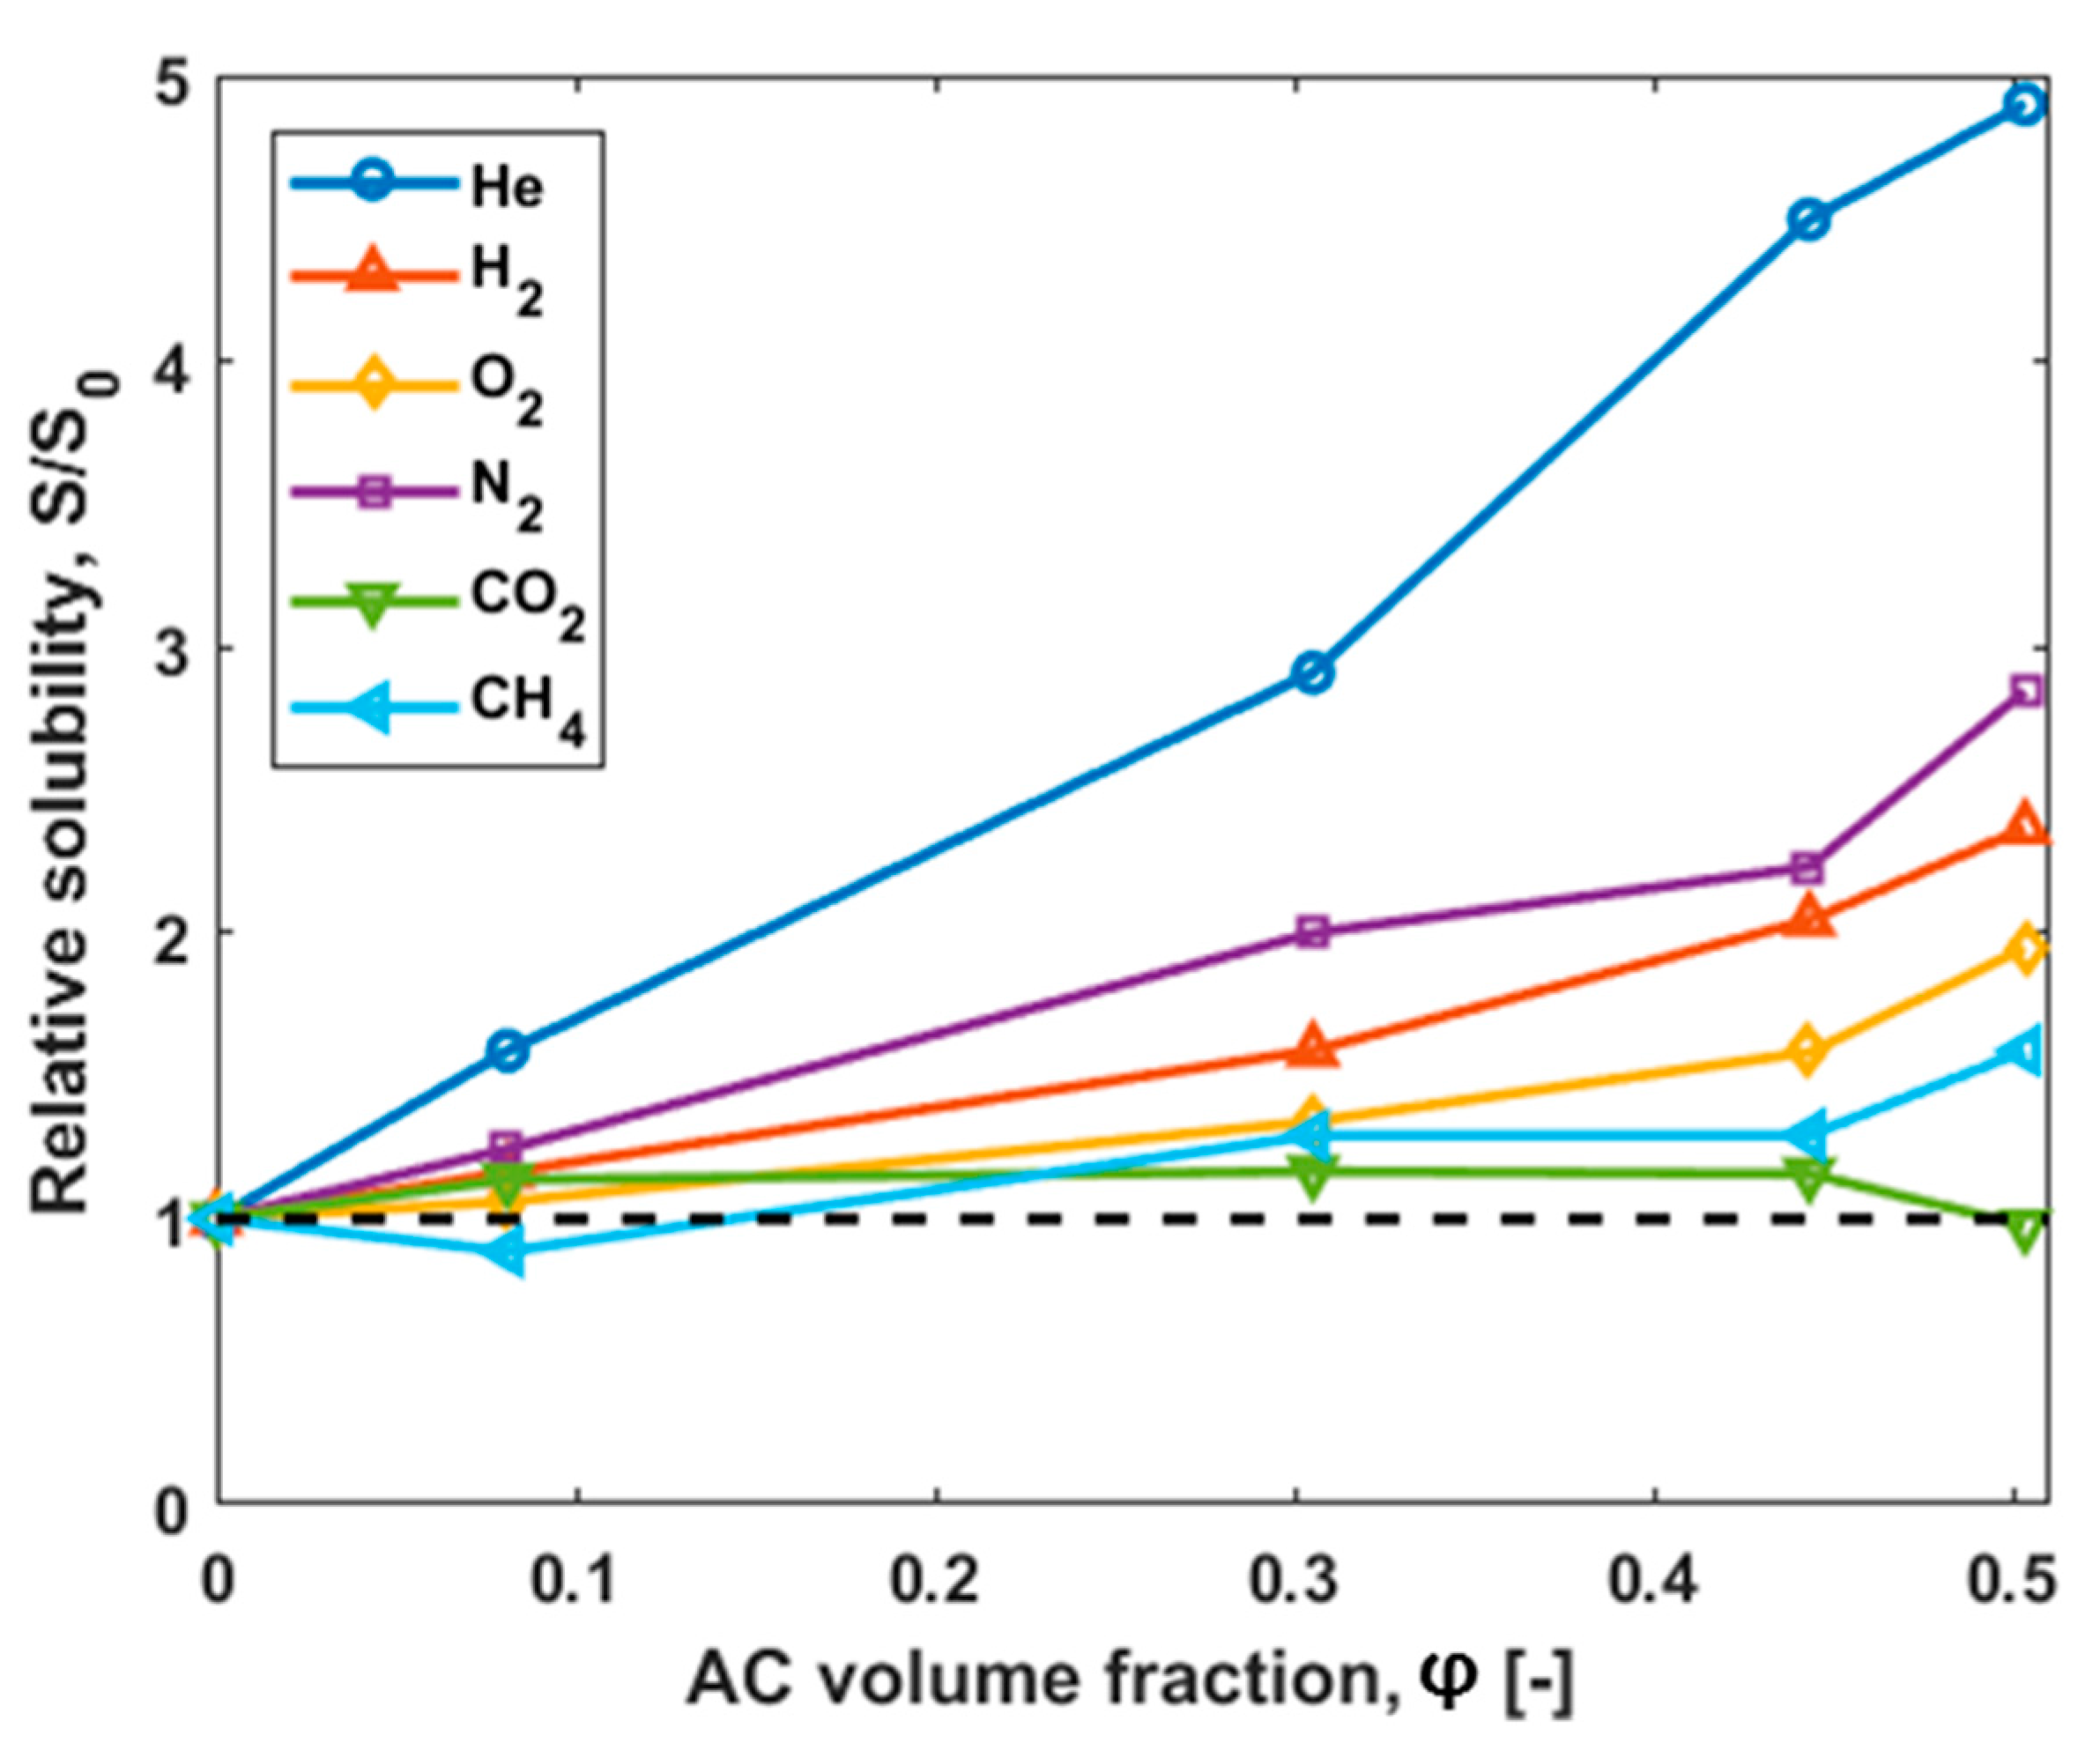
3.4. Sorption Results
3.5. Diffusion Coefficient
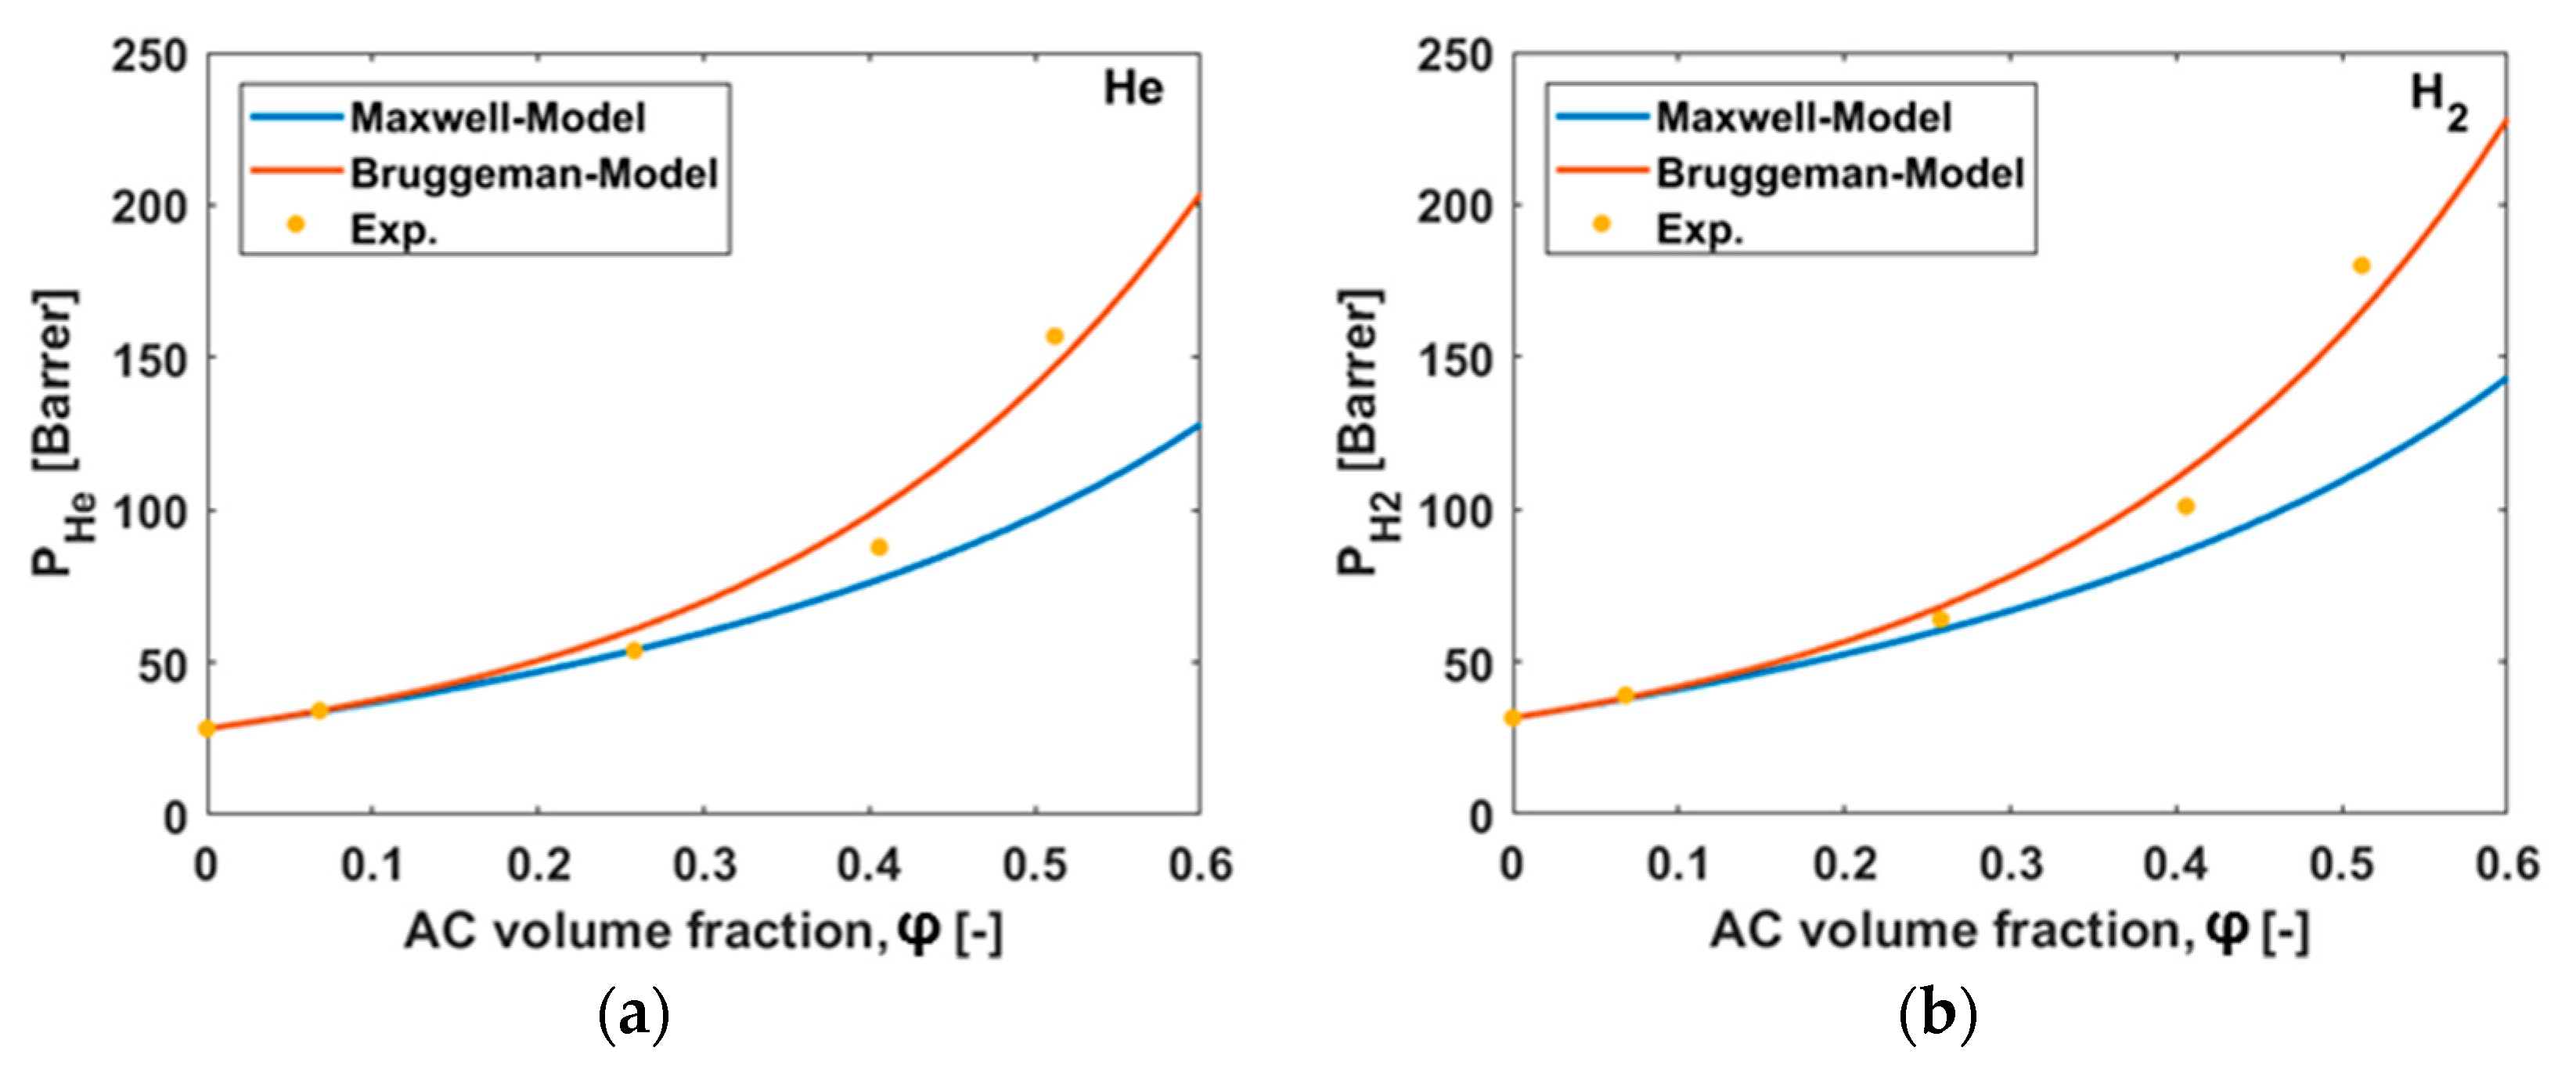
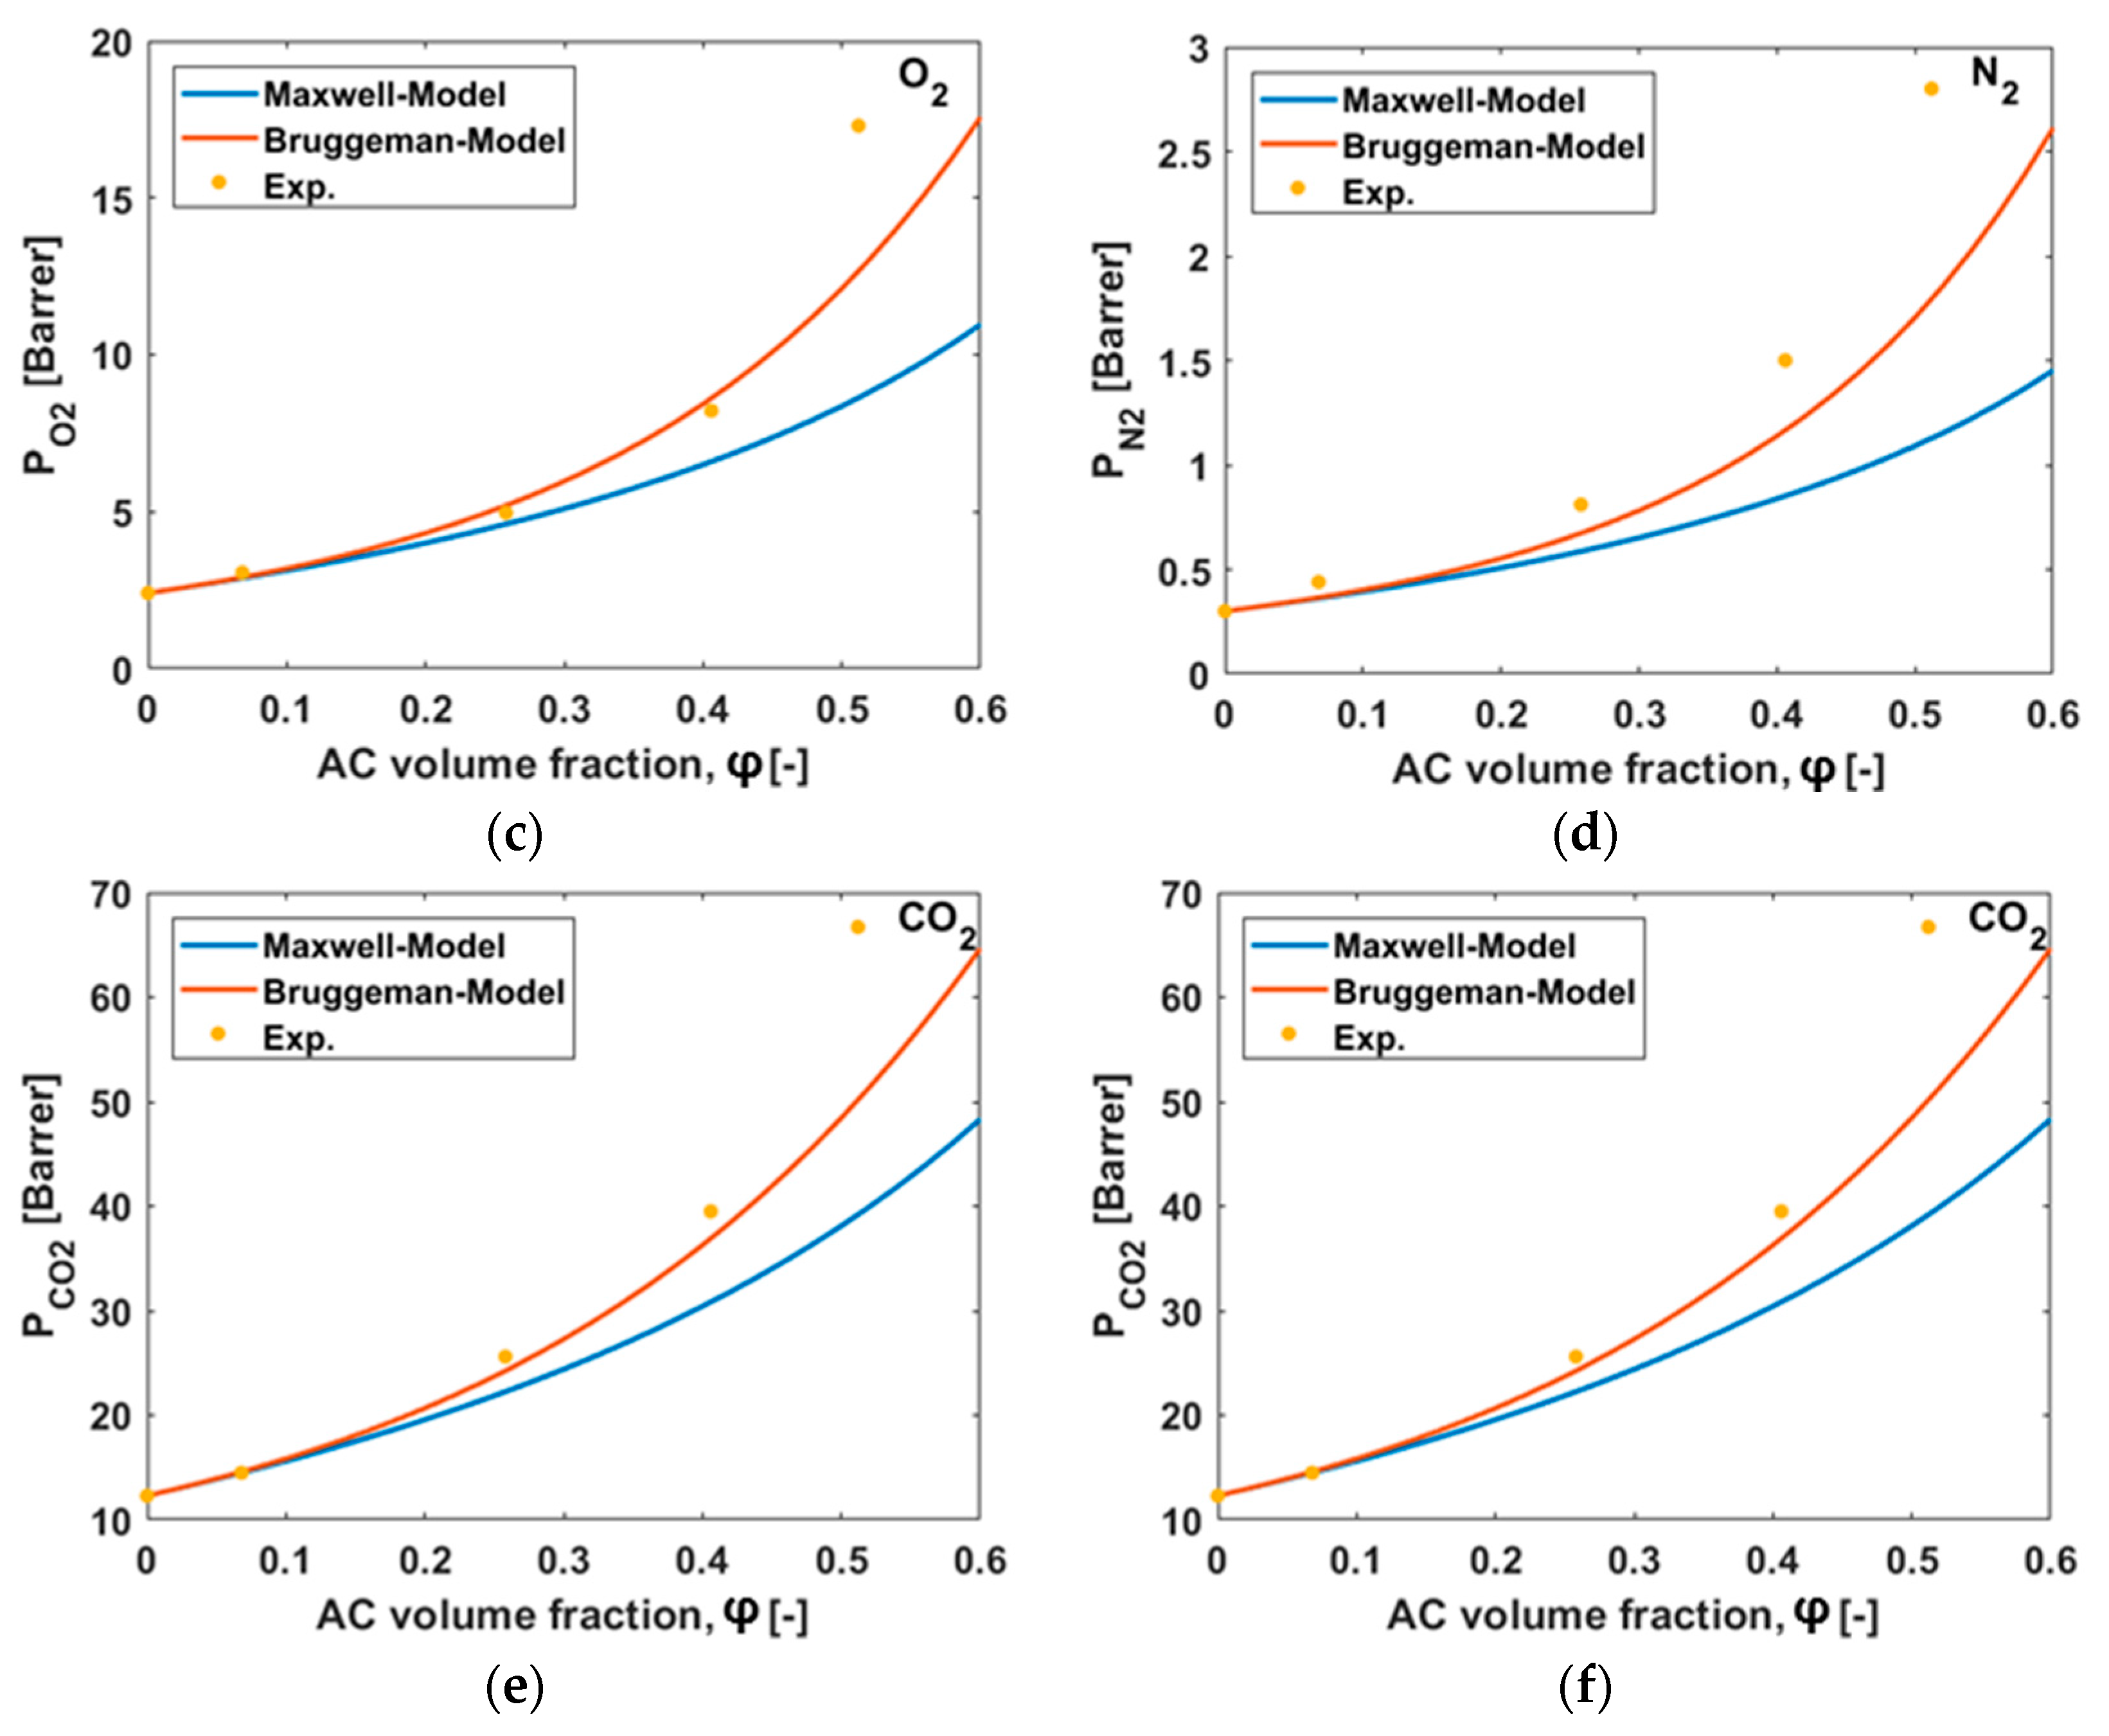
3.6. Permeability Predictions
4. Conclusions
Acknowledgments
Author Contributions
Conflicts of Interest
Nomenclature
| θ | time-lag, [s] |
| l | membrane film thickness, [m] |
| Deff,i | effective diffusion coefficient of component i, [cm2/s] |
| Peff,i | effective permeability of component i, [Barrer] |
| Ni | volumetric flowrate of component i, [Nm3/h] |
| Am | membrane area, [m2] |
| Δpi | partial pressure difference between feed an permeate side of component i, [bar] |
| Seff,i | effective solubility coefficient of component i, [cm3STP/(cm3 cmHg)]; [mol/(m3 bar)] |
| αij | selectivity of component i and j, [-] |
| Tg | glass transition temperature, [°C] |
| T | temperature, [°C] |
| wAC | weight content of AC in MMM, [%] |
| mr,i | remaining relative mass of AC, MMM or Matrimid®, [%] |
| φAC | volume content of AC in MMM, [%] |
| ρi | density of component i, [kg/m3] |
| Mi | molecular mass of the component i, [kg/mol] |
| q | adsorption concentration, [mol/m3] |
| qmax | the maximum adsorbed concentration possible for a monolayer coverage, [mol/m3] |
| p | pressure, [bar] |
| b | parameter for an adsorbate-adsorbent pair, [1/bar] |
| H | Henry coefficient, [mol/(m3 bar)] |
| c | concentration, [mol/m3] |
| Pc | permeability continuous phase, [Barrer] |
| Pd | permeability dispersed phase, [Barrer] |
| φd | volume fraction dispersed phase, [-] |
Subscripts
| eff | effective |
| AC | activated carbon |
| MMM | mixed-matrix membrane |
| g | glass transition |
| i,j | gas component i or j (He, H2, O2, N2, CO2 or CH4) |
| c | continuous phase |
| d | dispersed phase |
| Kn | Knudsen |
| r | remaining relative mass |
References
- Baker, R.W. Membrane Technology and Applications; John Wiley & Sons: Hoboken, NJ, USA, 2000. [Google Scholar]
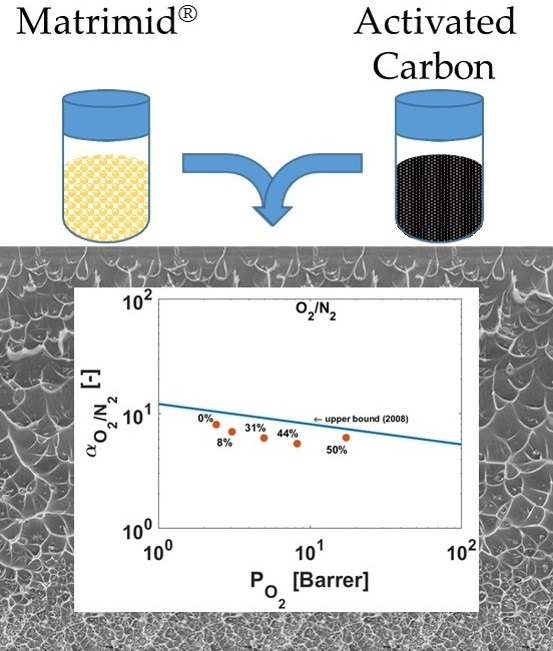
- Robeson, L.M. Correlation of separation factor versus permeability for polymeric membranes. J. Membr. Sci. 1991, 62, 165–185. [Google Scholar] [CrossRef]
- Robeson, L.M. The upper bound revisited. J. Membr. Sci. 2008, 320, 390–400. [Google Scholar] [CrossRef]
- Freeman, B.; Yampolskii, Y.; Pinnau, I. Materials Science of Membranes for Gas and Vapor Separation; John Wiley & Sons: Hoboken, NJ, USA, 2006. [Google Scholar]
- Gascon, J.; Kapteijn, F.; Zornoza, B.; Sebastián, V.; Casado, C.; Coronas, J. Practical approach to zeolitic membranes and coatings: State of the art, opportunities, barriers, and future perspectives. Chem. Mater. 2012, 24, 2829–2844. [Google Scholar] [CrossRef]
- Aroon, M.; Ismail, A.; Matsuura, T.; Montazer-Rahmati, M. Performance studies of mixed matrix membranes for gas separation: A review. Sep. Purif. Technol. 2010, 75, 229–242. [Google Scholar] [CrossRef]
- Chung, T.-S.; Jiang, L.Y.; Li, Y.; Kulprathipanja, S. Mixed matrix membranes (MMMS) comprising organic polymers with dispersed inorganic fillers for gas separation. Prog. Polym. Sci. 2007, 32, 483–507. [Google Scholar] [CrossRef]
- Rezakazemi, M.; Amooghin, A.E.; Montazer-Rahmati, M.M.; Ismail, A.F.; Matsuura, T. State-of-the-art membrane based CO2 separation using mixed matrix membranes (MMMS): An overview on current status and future directions. Prog. Polym. Sci. 2014, 39, 817–861. [Google Scholar] [CrossRef]
- Vinoba, M.; Bhagiyalakshmi, M.; Alqaheem, Y.; Alomair, A.A.; Pérez, A.; Rana, M.S. Recent progress of fillers in mixed matrix membranes for CO2 separation: A review. Sep. Purif. Technol. 2017, 188, 431–450. [Google Scholar] [CrossRef]
- Wang, M.; Wang, Z.; Zhao, S.; Wang, J.; Wang, S. Recent advances on mixed matrix membranes for CO2 separation. Chin. J. Chem. Eng. 2017, 25, 1581–1597. [Google Scholar] [CrossRef]
- Galizia, M.; Chi, W.S.; Smith, Z.P.; Merkel, T.C.; Baker, R.W.; Freeman, B.D. 50th anniversary perspective: Polymers and mixed matrix membranes for gas and vapor separation: A review and prospective opportunities. Macromolecules 2017, 50, 7809–7843. [Google Scholar] [CrossRef]
- Tena, A.; Fernández, L.; Sánchez, M.; Palacio, L.; Lozano, A.; Hernández, A.; Prádanos, P. Mixed matrix membranes of 6FDA-6FpDA with surface functionalized γ-alumina particles. An analysis of the improvement of permselectivity for several gas pairs. Chem. Eng. Sci. 2010, 65, 2227–2235. [Google Scholar] [CrossRef]
- Rahman, M.M.; Filiz, V.; Shishatskiy, S.; Abetz, C.; Georgopanos, P.; Khan, M.M.; Neumann, S.; Abetz, V. Influence of poly (ethylene glycol) segment length on CO2 permeation and stability of polyactive membranes and their nanocomposites with peg poss. ACS Appl. Mater. Interfaces 2015, 7, 12289–12298. [Google Scholar] [CrossRef] [PubMed]
- Rahman, M.M.; Shishatskiy, S.; Abetz, C.; Georgopanos, P.; Neumann, S.; Khan, M.M.; Filiz, V.; Abetz, V. Influence of temperature upon properties of tailor-made PEBAX® Mh 1657 nanocomposite membranes for post-combustion CO2 capture. J. Membr. Sci. 2014, 469, 344–354. [Google Scholar] [CrossRef]
- Khan, M.M.; Filiz, V.; Bengtson, G.; Rahman, M.M.; Shishatskiy, S.; Abetz, V. Functionalized carbon nanotube mixed matrix membranes of polymers of intrinsic microporosity (PIMs) for gas separation. Procedia Eng. 2012, 44, 1899–1901. [Google Scholar] [CrossRef]
- Moghadam, F.; Omidkhah, M.; Vasheghani-Farahani, E.; Pedram, M.; Dorosti, F. The effect of tio2 nanoparticles on gas transport properties of matrimid5218-based mixed matrix membranes. Sep. Purif. Technol. 2011, 77, 128–136. [Google Scholar] [CrossRef]
- Bengtson, G.; Oehring, M.; Fritsch, D. Improved dense catalytically active polymer membranes of different configuration to separate and react organics simultaneously by pervaporation. Chem. Eng. Process. Process Intensif. 2004, 43, 1159–1170. [Google Scholar] [CrossRef]
- Kanehashi, S.; Chen, G.Q.; Scholes, C.A.; Ozcelik, B.; Hua, C.; Ciddor, L.; Southon, P.D.; D’Alessandro, D.M.; Kentish, S.E. Enhancing gas permeability in mixed matrix membranes through tuning the nanoparticle properties. J. Membr. Sci. 2015, 482, 49–55. [Google Scholar] [CrossRef]
- Wright, W.W.; Hallden-Abberton, M. Polyimides. In Ullmann’s Encyclopedia of Industrial Chemistry; John Wiley & Sons: Hoboken, NJ, USA, 2002. [Google Scholar]
- David, O.C.; Gorri, D.; Urtiaga, A.; Ortiz, I. Mixed gas separation study for the hydrogen recovery from H2/CO/N2/CO2 post combustion mixtures using a matrimid membrane. J. Membr. Sci. 2011, 378, 359–368. [Google Scholar] [CrossRef]
- Khan, A.L.; Sree, S.P.; Martens, J.A.; Raza, M.T.; Vankelecom, I.F. Mixed matrix membranes comprising of matrimid and mesoporous COK-12: Preparation and gas separation properties. J. Membr. Sci. 2015, 495, 471–478. [Google Scholar] [CrossRef]
- Naseri, M.; Mousavi, S.F.; Mohammadi, T.; Bakhtiari, O. Synthesis and gas transport performance of mil-101/matrimid mixed matrix membranes. J. Ind. Eng. Chem. 2015, 29, 249–256. [Google Scholar] [CrossRef]
- Dong, X.; Liu, Q.; Huang, A. Highly permselective MIL-68 (Al)/matrimid mixed matrix membranes for CO2/CH4 separation. J. Appl. Polym. Sci. 2016, 133. [Google Scholar] [CrossRef]
- Zhang, Y.; Balkus, K.J.; Musselman, I.H.; Ferraris, J.P. Mixed-matrix membranes composed of Matrimid® and mesoporous ZSM-5 nanoparticles. J. Membr. Sci. 2008, 325, 28–39. [Google Scholar] [CrossRef]
- Mushardt, H.; Kramer, V.; Hülagü, D.; Brinkmann, T.; Kraume, M. Development of solubility selective mixed matrix membranes for gas separation. Chem. Ing. Tech. 2014, 86, 83–91. [Google Scholar] [CrossRef]
- Mushardt, H.; Müller, M.; Shishatskiy, S.; Wind, J.; Brinkmann, T. Detailed investigation of separation performance of a MMM for removal of higher hydrocarbons under varying operating conditions. Membranes 2016, 6, 16. [Google Scholar] [CrossRef] [PubMed]
- Ghanem, B.S.; McKeown, N.B.; Budd, P.M.; Al-Harbi, N.M.; Fritsch, D.; Heinrich, K.; Starannikova, L.; Tokarev, A.; Yampolskii, Y. Synthesis, characterization, and gas permeation properties of a novel group of polymers with intrinsic microporosity: PIM-polyimides. Macromolecules 2009, 42, 7881–7888. [Google Scholar] [CrossRef]
- Soave, G. Equilibrium constants from a modified Redlich-Kwong equation of state. Chem. Eng. Sci. 1972, 27, 1197–1203. [Google Scholar] [CrossRef]
- Pye, D.; Hoehn, H.; Panar, M. Measurement of gas permeability of polymers. I. Permeabilities in constant volume/variable pressure apparatus. J. Appl. Polym. Sci. 1976, 20, 1921–1931. [Google Scholar] [CrossRef]
- Shishatskiy, S.; Nistor, C.; Popa, M.; Nunes, S.P.; Peinemann, K.V. Polyimide asymmetric membranes for hydrogen separation: Influence of formation conditions on gas transport properties. Adv. Eng. Mater. 2006, 8, 390–397. [Google Scholar] [CrossRef]
- Blume, I.; Smit, E.; Wessling, M.; Smolders, C. Diffusion through Rubbery and Glassy Polymer Membranes. In Macromolecular Symposia; Wiley Online Library: Hoboken, NJ, USA, 1991; pp. 237–257. [Google Scholar]
- Frisch, H.L. The time lag in diffusion. J. Phys. Chem. 1957, 61, 93–95. [Google Scholar] [CrossRef]
- Bansal, A.; Yang, H.; Li, C.; Cho, K.; Benicewicz, B.C.; Kumar, S.K.; Schadler, L.S. Quantitative equivalence between polymer nanocomposites and thin polymer films. Nat. Mater. 2005, 4, 693–698. [Google Scholar] [CrossRef] [PubMed]
- Schadler, L.S.; Kumar, S.K.; Benicewicz, B.C.; Lewis, S.L.; Harton, S.E. Designed interfaces in polymer nanocomposites: A fundamental viewpoint. MRS Bull. 2007, 32, 335–340. [Google Scholar] [CrossRef]
- Perez, E.V.; Balkus, K.J.; Ferraris, J.P.; Musselman, I.H. Mixed-matrix membranes containing MOF-5 for gas separations. J. Membr. Sci. 2009, 328, 165–173. [Google Scholar] [CrossRef]
- Ordonez, M.J.C.; Balkus, K.J.; Ferraris, J.P.; Musselman, I.H. Molecular sieving realized with ZIF-8/Matrimid® mixed-matrix membranes. J. Membr. Sci. 2010, 361, 28–37. [Google Scholar] [CrossRef]
- Mahdi, E.M.; Tan, J.-C. Mixed-matrix membranes of zeolitic imidazolate framework (ZIF-8)/Matrimid nanocomposite: Thermo-mechanical stability and viscoelasticity underpinning membrane separation performance. J. Membr. Sci. 2016, 498, 276–290. [Google Scholar] [CrossRef]
- Fernández-Barquín, A.; Casado-Coterillo, C.; Palomino, M.; Valencia, S.; Irabien, A. Lta/poly (1-trimethylsilyl-1-propyne) mixed-matrix membranes for high-temperature CO2/N2 separation. Chem. Eng. Technol. 2015, 38, 658–666. [Google Scholar] [CrossRef]
- Do, D.D. Adsorption Analysis: Equilibria and Kinetics; World Scientific: Singapore, 1998; Volume 2. [Google Scholar]
- Choi, J.-G.; Do, D.; Do, H. Surface diffusion of adsorbed molecules in porous media: Monolayer, multilayer, and capillary condensation regimes. Ind. Eng. Chem. Res. 2001, 40, 4005–4031. [Google Scholar] [CrossRef]
- Shimekit, B.; Mukhtar, H.; Murugesan, T. Prediction of the relative permeability of gases in mixed matrix membranes. J. Membr. Sci. 2011, 373, 152–159. [Google Scholar] [CrossRef]
- Vinh-Thang, H.; Kaliaguine, S. Predictive models for mixed-matrix membrane performance: A review. Chem. Rev. 2013, 113, 4980–5028. [Google Scholar] [CrossRef] [PubMed]
- Maxwell, J.C. A Treatise on Electricity and Magnetism; Clarendon Press: Wotton-under-Edge, UK, 1881; Volume 1. [Google Scholar]
- Bouma, R.; Checchetti, A.; Chidichimo, G.; Drioli, E. Permeation through a heterogeneous membrane: The effect of the dispersed phase. J. Membr. Sci. 1997, 128, 141–149. [Google Scholar] [CrossRef]
- Banhegyi, G. Comparison of electrical mixture rules for composites. Colloid Polym. Sci. 1986, 264, 1030–1050. [Google Scholar] [CrossRef]
- Moore, T.T.; Mahajan, R.; Vu, D.Q.; Koros, W.J. Hybrid membrane materials comprising organic polymers with rigid dispersed phases. AIChE J. 2004, 50, 311–321. [Google Scholar] [CrossRef]
- Li, Y.; Guan, H.-M.; Chung, T.-S.; Kulprathipanja, S. Effects of novel silane modification of zeolite surface on polymer chain rigidification and partial pore blockage in polyethersulfone (PES)–zeolite a mixed matrix membranes. J. Membr. Sci. 2006, 275, 17–28. [Google Scholar] [CrossRef]
- Casado-Coterillo, C.; Soto, J.; Jimaré, M.T.; Valencia, S.; Corma, A.; Téllez, C.; Coronas, J. Preparation and characterization of ITQ-29/polysulfone mixed-matrix membranes for gas separation: Effect of zeolite composition and crystal size. Chem. Eng. Sci. 2012, 73, 116–122. [Google Scholar] [CrossRef]
- Casado-Coterillo, C.; Fernández-Barquín, A.; Zornoza, B.; Téllez, C.; Coronas, J.; Irabien, Á. Synthesis and characterisation of MOF/ionic liquid/chitosan mixed matrix membranes for CO2/N2 separation. RSC Adv. 2015, 5, 102350–102361. [Google Scholar] [CrossRef]
- Lewis, T.; Nielsen, L. Dynamic mechanical properties of particulate-filled composites. J. Appl. Polym. Sci. 1970, 14, 1449–1471. [Google Scholar] [CrossRef]
- Shen, Y.; Lua, A.C. Theoretical and experimental studies on the gas transport properties of mixed matrix membranes based on polyvinylidene fluoride. AIChE J. 2013, 59, 4715–4726. [Google Scholar] [CrossRef]


| Membrane—Activated Carbon Content | Tg [°C] |
|---|---|
| Matrimid® | 319 |
| Matrimid® + 8 vol % AC | 322 |
| Matrimid® + 31 vol % AC | 324 |
| Matrimid® + 44 vol % AC | 325 |
| Matrimid® + 50 vol % AC | 326 |
| wACTheoretical [%] | wACTGA [%] | [%] |
|---|---|---|
| 4.70 | 6.00 | 8.20 |
| 20.00 | 23.94 | 30.50 |
| 33.33 | 36.32 | 44.20 |
| 42.85 | 42.11 | 50.30 |
| [%] | P [Barrer] * | |||||
|---|---|---|---|---|---|---|
| He | H2 | O2 | N2 | CO2 | CH4 | |
| 0 | 28.3 | 31.6 | 2.41 | 0.30 | 12.3 | 0.34 |
| 8 | 34.2 | 39.0 | 3.06 | 0.44 | 14.5 | 0.43 |
| 31 | 53.8 | 63.8 | 4.97 | 0.81 | 25.6 | 0.67 |
| 44 | 87.8 | 101 | 8.22 | 1.50 | 39.5 | 1.06 |
| 50 | 157 | 180 | 17.3 | 2.80 | 66.7 | 2.25 |
| [%] | Permselectivity [-] | ||
|---|---|---|---|
| H2/CH4 | CO2/CH4 | O2/N2 | |
| 0 | 94.4 | 36.8 | 8.11 |
| 8 | 90.2 | 33.4 | 7.04 |
| 31 | 95.7 | 38.3 | 6.16 |
| 44 | 95.8 | 37.4 | 5.48 |
| 50 | 80.2 | 29.7 | 6.19 |
| Knudsen selectivity | 2.82 | 0.60 | 0.94 |
| [%] | Seff [10−3 cm3STP/(cm3 cm Hg)] | |||||
|---|---|---|---|---|---|---|
| He | H2 | O2 | N2 | CO2 | CH4 | |
| 0 | 0.35 | 2.02 | 13.2 | 7.80 | 248 | 46.6 |
| 8 | 0.55 | 2.35 | 14.0 | 9.71 | 282 | 41.3 |
| 31 | 1.01 | 3.21 | 17.7 | 15.6 | 289 | 60.2 |
| 44 | 1.56 | 4.13 | 20.9 | 17.4 | 287 | 60.2 |
| 50 | 1.70 | 4.78 | 25.7 | 22.2 | 242 | 74.0 |
| Gases | qmax [mol/m3] | b [1/bar] |
|---|---|---|
| He | 8069 | 0.0032 |
| H2 | 7500 | 0.0067 |
| O2 | 8270 | 0.0244 |
| N2 | 5864 | 0.0357 |
| CO2 | 10,479 | 0.1174 |
| CH4 | 6788 | 0.0813 |
| Gases | H [mol/(m3·bar)] | S [mol/(m3·bar)] | H/S [-] |
|---|---|---|---|
| He | 25.7 | 1.16 | 22.3 |
| H2 | 50.3 | 6.76 | 7.43 |
| O2 | 202 | 44.4 | 4.54 |
| N2 | 209 | 26.2 | 7.99 |
| CO2 | 1230 | 831 | 1.48 |
| CH4 | 552 | 156 | 3.54 |
| [%] | Deff [10−7 cm2/s] | |||||
|---|---|---|---|---|---|---|
| He | H2 | O2 | N2 | CO2 | CH4 | |
| 0 | 81.5 | 15.7 | 0.182 | 0.0381 | 0.0497 | 0.00719 |
| 8 | 62.0 | 16.6 | 0.219 | 0.0448 | 0.0512 | 0.0105 |
| 31 | 54.6 | 19.9 | 0.282 | 0.0518 | 0.0885 | 0.0111 |
| 44 | 56.4 | 24.5 | 0.393 | 0.0864 | 0.138 | 0.0176 |
| 50 | 92.9 | 37.7 | 0.673 | 0.126 | 0.275 | 0.0304 |
| Coefficients | He | H2 | O2 | N2 | CO2 | CH4 |
|---|---|---|---|---|---|---|
| DAC [cm2/s] | 1.0 × 10⁻⁵ | 6.0 × 10⁻⁶ | 1.2 × 10⁻⁷ | 2.1 × 10⁻⁸ | 5.0 × 10⁻⁸ | 5.4 × 10⁻⁹ |
| PAC [Barrer] | 800 | 898 | 70.2 | 13.4 | 184 | 8.84 |
© 2018 by the authors. Licensee MDPI, Basel, Switzerland. This article is an open access article distributed under the terms and conditions of the Creative Commons Attribution (CC BY) license (http://creativecommons.org/licenses/by/4.0/).
Share and Cite
Weigelt, F.; Georgopanos, P.; Shishatskiy, S.; Filiz, V.; Brinkmann, T.; Abetz, V. Development and Characterization of Defect-Free Matrimid® Mixed-Matrix Membranes Containing Activated Carbon Particles for Gas Separation. Polymers 2018, 10, 51. https://doi.org/10.3390/polym10010051
Weigelt F, Georgopanos P, Shishatskiy S, Filiz V, Brinkmann T, Abetz V. Development and Characterization of Defect-Free Matrimid® Mixed-Matrix Membranes Containing Activated Carbon Particles for Gas Separation. Polymers. 2018; 10(1):51. https://doi.org/10.3390/polym10010051
Chicago/Turabian StyleWeigelt, Fynn, Prokopios Georgopanos, Sergey Shishatskiy, Volkan Filiz, Torsten Brinkmann, and Volker Abetz. 2018. "Development and Characterization of Defect-Free Matrimid® Mixed-Matrix Membranes Containing Activated Carbon Particles for Gas Separation" Polymers 10, no. 1: 51. https://doi.org/10.3390/polym10010051