Our objective is to relate the composition of SF in proteins and HA with its rheological behaviour. It is known that even at high concentration proteins contribute minimally to solution viscosity (due to their low intrinsic viscosity around 3 mL/g). As commonly seen in the literature, the rheological behaviour of SF is claimed to be related to HA characteristics (concentration and molecular weight). Nevertheless, as was previously shown, HA-protein complex (even if only small amount of polymers is engaged) exists in SF which causes a particular non-Newtonian behaviour [
3,
25]. We have recently studied the influence of fibrinogen as a model of protein on the rheology of HA, and demonstrated the physical interaction at neutral pH which should be based on electrostatic interactions [
1]. The viscometric characterization of such systems does not allow the direct determination of the role of HA molecular weight and/or concentration on the SF behaviour if the proteins are not completely separated from HA as previously claimed by Ogston and Sherman [
7]. To avoid artefact, it was discussed by Sundblad [
12] that the intrinsic viscosity of HA obtained by dilution and extrapolation to zero concentration (when the HA concentration is determined separately) is a good information, allowing us to compare SF characteristics corresponding to different diseases. From our research to date, the estimation of the intrinsic viscosity from a Huggins-type relationship at a finite concentration with a Huggins constant around 0.16 [
12] gives a rough value due to the fact that for free HA in salt excess, the Huggins constant equals 0.4 [
23]. Thus, the relation between intrinsic viscosity and MW is needed and it introduces the difficulty of having an absolute determination of the HA molecular weight [
23]. Light scattering is the more powerful and adapted method to get MW values on well purified and calibrated samples, and the values obtained can be used as standard, allowing us to interpret results from volume of elution in SEC or mobility in electrophoresis after pronase treatment [
26,
27]. It is important to have a more direct determination of the composition of synovial fluids. To determine the composition of SF, a relatively new technique was proposed [
28]: steric exclusion chromatography (SEC) which separates the components following their hydrodynamic volume. Different conditions are indicated in the literature: direct injection after dilution [
26,
29,
30] or dilution and incubation with pronase [
26,
31] before the SEC experiment, using a light scattering detector or calibration with standards. The influence of such protease pre-treatment before SEC analysis will be also examined in this paper.
Finally, to study the properties of synovial fluids and particularly their rheological properties, it is important to store the samples after isolation in clearly defined conditions which do not modify their characteristics (composition and viscosity). Given this objective, the influences of storage at 4 °C, freezing at –21 °C and thawing were examined; the same treatments were also tested on pure HA, used as reference.
2.1. Composition of synovial fluid by SEC
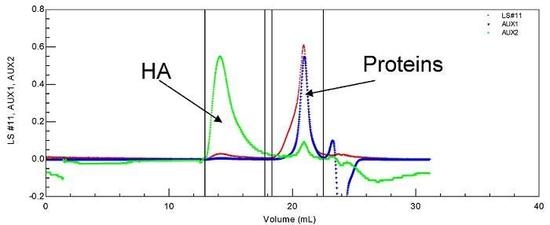
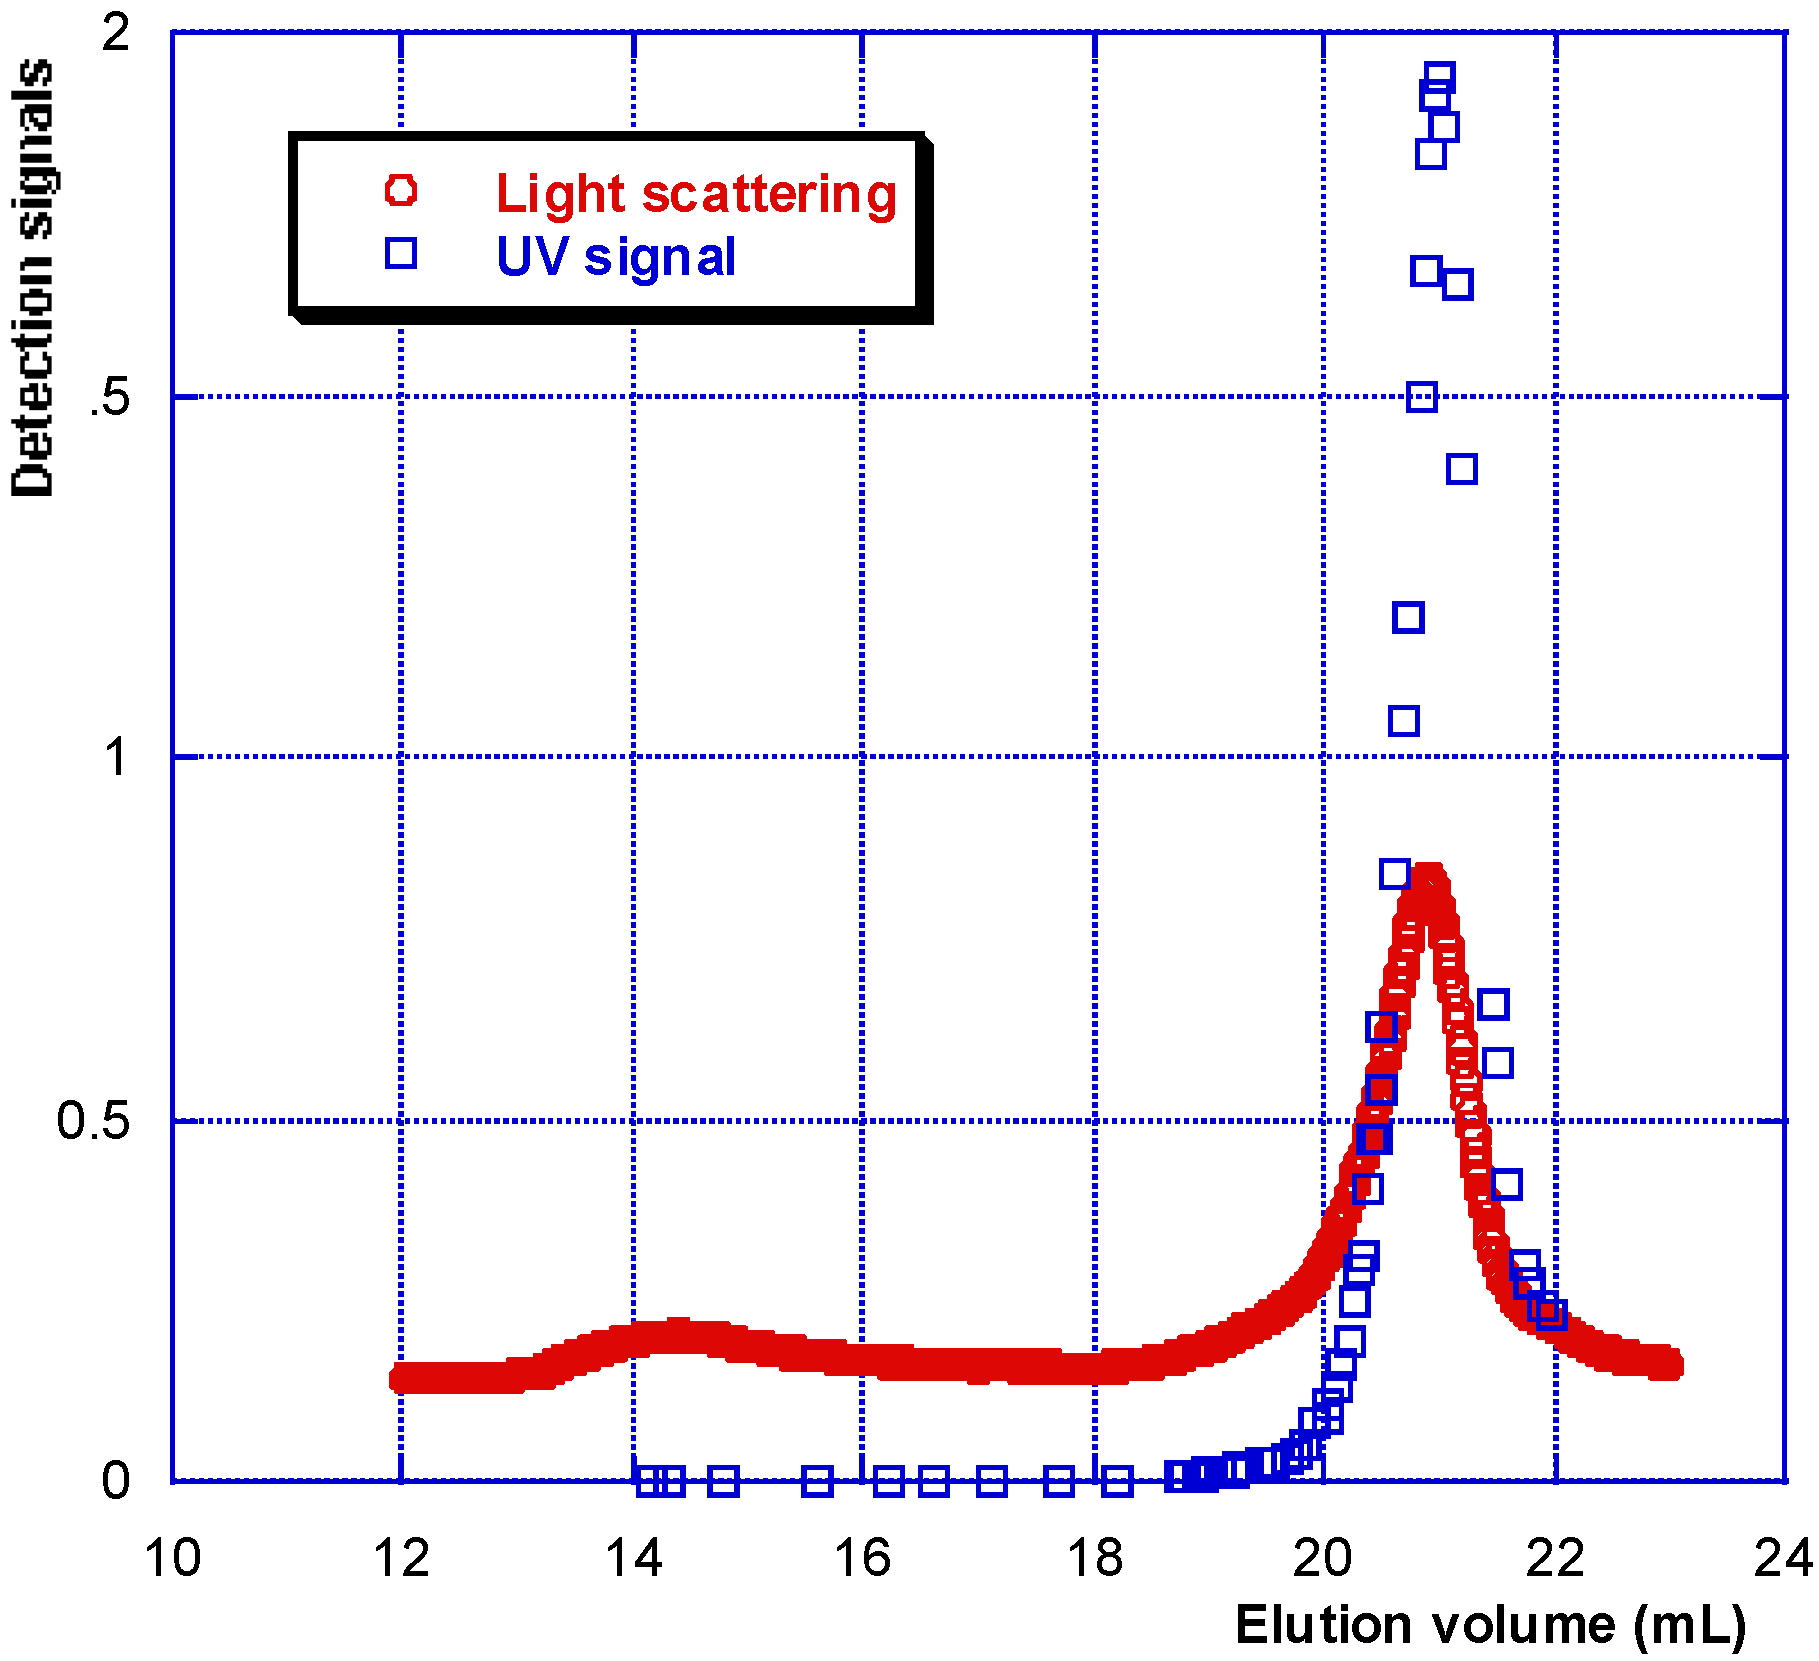
The conditions adopted in this work for SEC experiments allow us to separately determine the characteristics of HA and proteins in a very dilute synovial fluid [
25] (
Figure 1). Identification was completed using a ultra-violet detector (UV) permitting us to conclude that proteins are (in most cases) completely separated from linear HA (
Figure 2). These results confirm the data from literature obtained with only one different column (Superose 6 from Pharmacia [
29] or TSK 6000PW from Toyo Soda [
28,
30]).
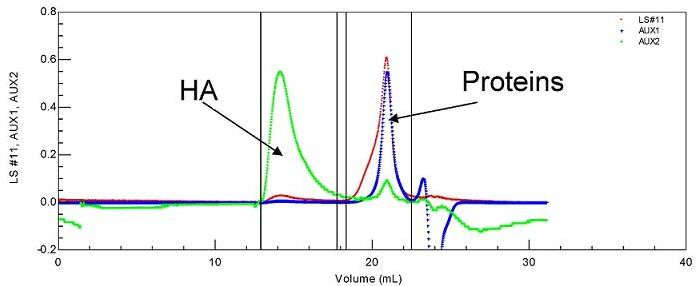
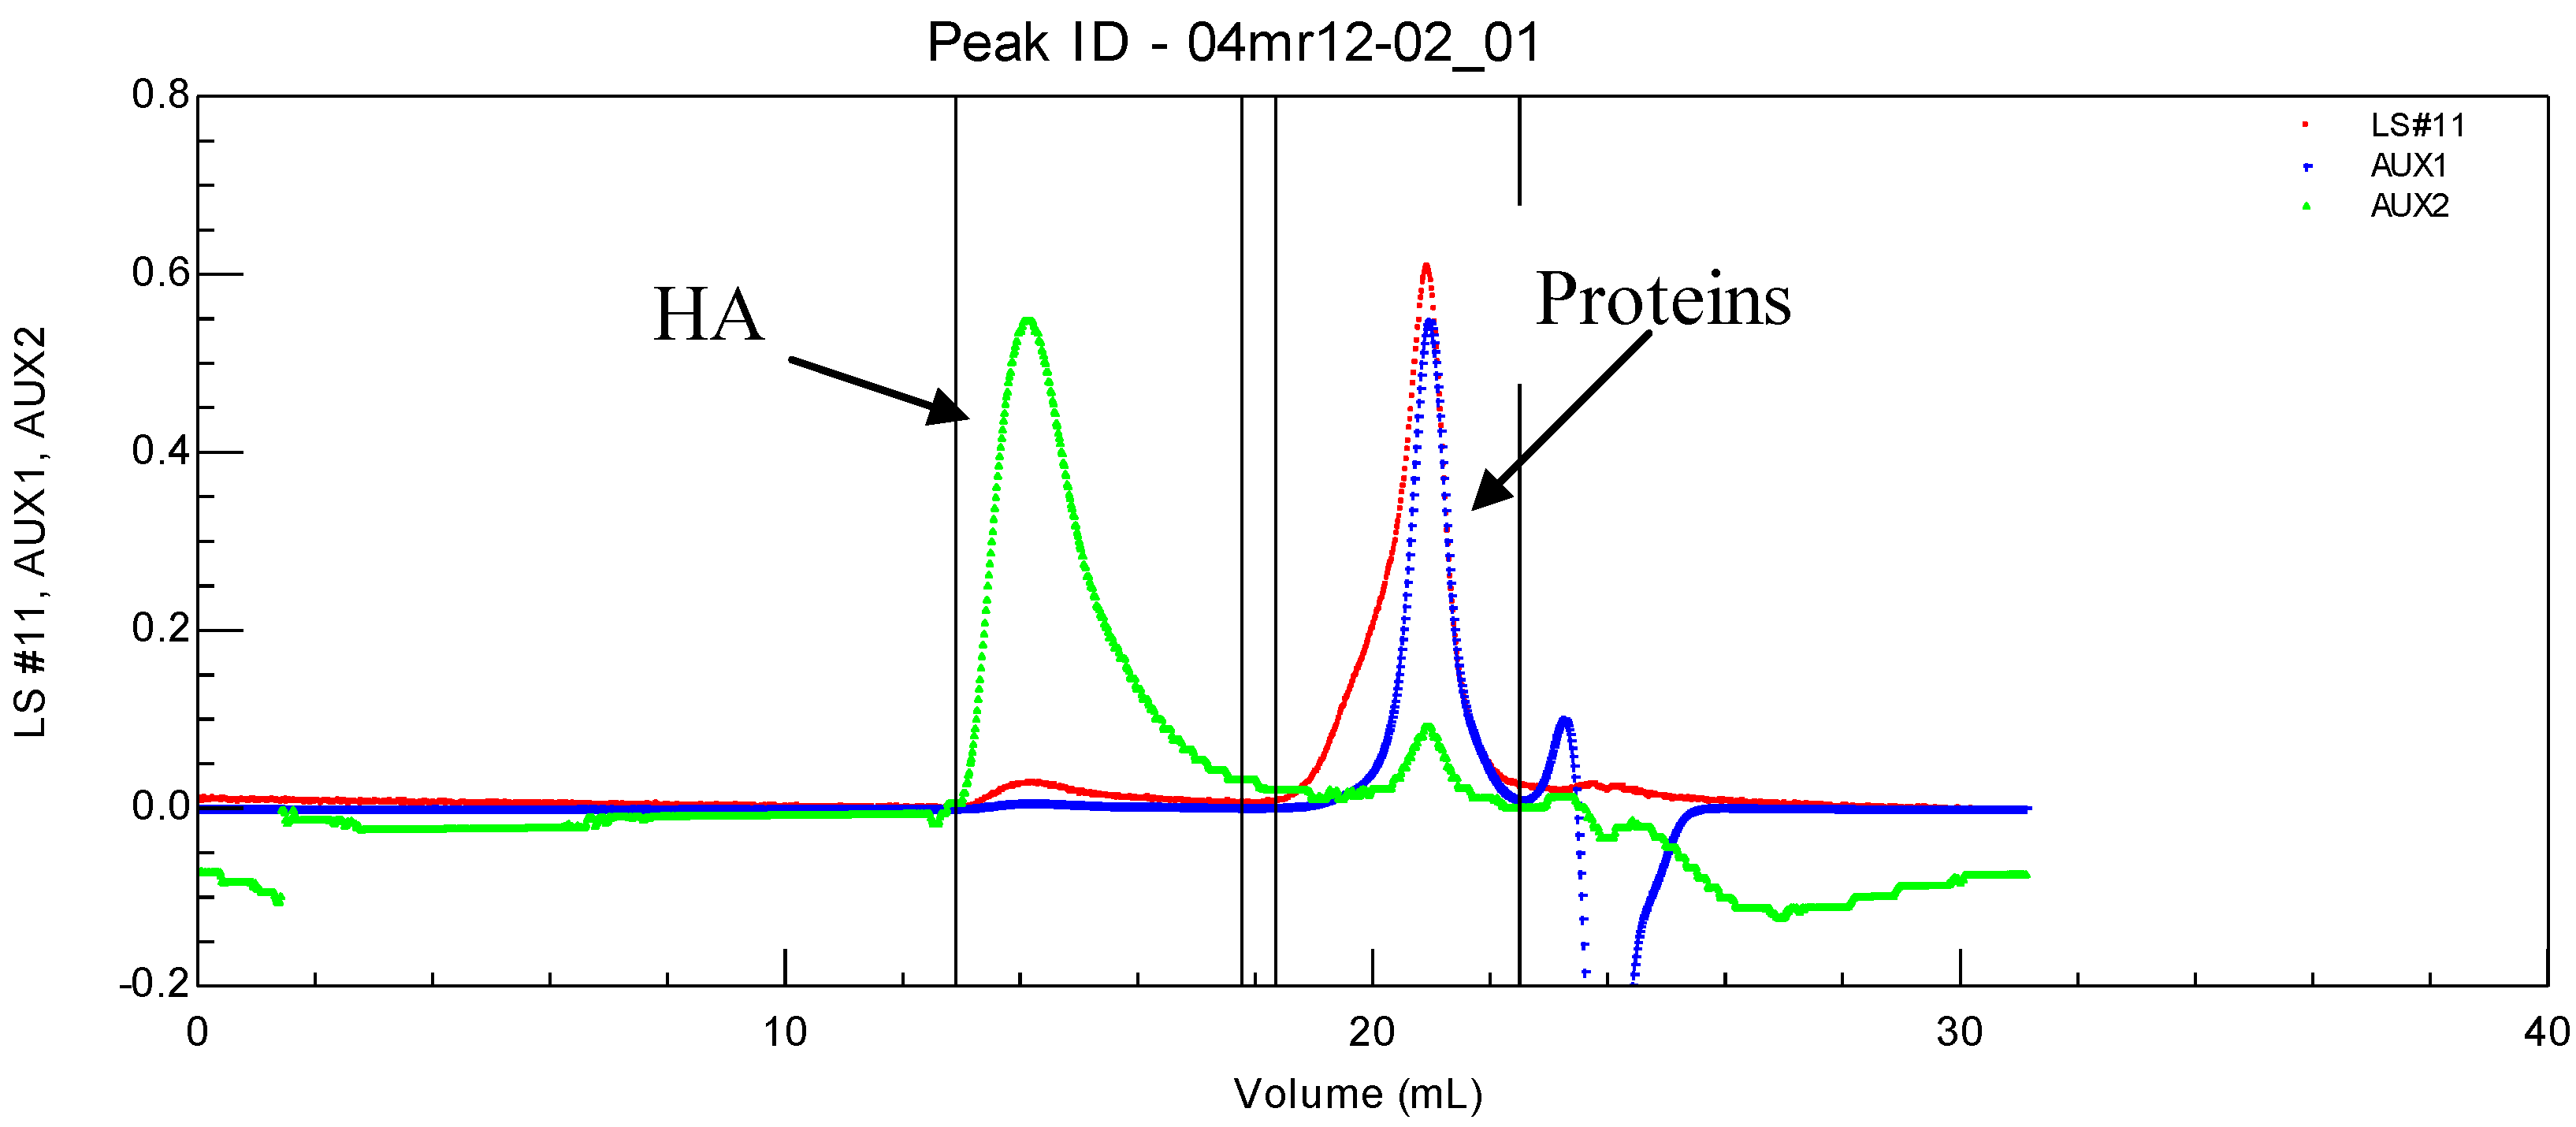
Figure 1.
SEC chromatogram of a synovial fluid allowing the determination of soluble proteins and HA molecular weights and their concentrations. T = 30 °C, eluent 0.1 M NaNO3. LS is the light scattering signal (red); AUX 1 is the refractive index signal (blue); AUX 2 is the viscometric signal (green).
Figure 2.
Specific UV identification of protein elution in SEC experiment on a synovial fluid.
Figure 2.
Specific UV identification of protein elution in SEC experiment on a synovial fluid.
HA is eluted first with a large hydrodynamic volume and a high molecular weight as shown by the large light scattering and viscosity signals under the eluted peak. Secondly, the protein pool is eluted, with a large signal for weight concentration (refractive index signal) and very small signals for viscosity and light scattering. Some of the data obtained for the composition and viscosity of different synovial fluids (named LSn) are given in
Table 1. Values of the molecular weight characterizing HA and proteins at their respective concentration peak are also given in
Table 2. Due to the low concentration of HA in SEC analysis, the integrals of refractive index and light scattering signals for the weight-average molecular weight calculation remain small. Better precision to compare SF is obtained at the concentration peaks of HA and proteins. Nevertheless, a good agreement is found between the different series of data (see
Table 1 and
Table 2).
Table 1.
Characteristics of different synovial fluids obtained by SEC after different pre-treatments.
Table 1.
Characteristics of different synovial fluids obtained by SEC after different pre-treatments.
| | [HA] g/L in SF | Mw HA × 10−6 | *Average C*Mw × 10−6 | [Proteins] g/L in SF | Mw Proteins × 10−5 | Viscosity (Pa.s) at 1 s−1 |
|---|
| LS 1 | | | | | | |
| Initial | 1.57 | 1.6 | 2.35 | 29 | 1.03 | 0.737 |
| Frozen | 1.9 | 1.08 | 2.05 | 30 | 1.18 | 0.978 |
| Filtrated on 0.8 μm | 1.8 | 1.2 | 2.00 | 30.5 | 1.13 | 0.630 |
| Initial after centrifugation | 1.9 | 1.26 | 2.28 | 28.6 | 1.23 | 0.830 |
| LS2 | | | | | | |
| Initial | 1.13 | 1.25 | 1.41 | 29.5 | 1.42 | 0.059 |
| Frozen | 1.18 | 1.2 | 1.21 | 29.3 | 1.23 | 0.061 |
| Filtrated on 0.8 μm | 1.2 | 1.07 | 1.12 | 30.5 | 1.41 | 0.043 |
| LS3 | | | | | | |
| Initial | 0.72 | 0.95 | 0.75 | 28.2 | 1.12 | 1.792 |
| Frozen | 1.25 | 1.12 | 1.51 | 30.1 | 1.33 | 1.677 |
| Filtrated on 3 μm | 0.82 | 1.08 | 0.78 | 21.2 | 1.24 | 0.364 |
| LS4 | | | | | | |
| Initial | 0.68 | 1.12 | 0.78 | 28.3 | 1.12 | 1.601 |
| Frozen | 1.2 | 1.10 | 1.43 | 30.2 | 1.31 | 1.492 |
| Filtrated on 3 μm | 0.71 | 1.20 | 0.77 | 26.0 | 1.30 | 0.458 |
| Initial after centrifugation | 1.5 | 1.06 | 1.78 | 31.1 | 1.39 | 1.342 |
| LS12 | | | | | | |
| Initial | 0.51 | 1.65 | 0.79 | 29.5 | 1.28 | 0.066 |
| Frozen | 0.45 | 1.07 | 0.48 | 28.0 | 1.27 | 0.031 |
In all cases, the intrinsic viscosity of proteins is found equal to 2.9–3.1 mL/g (data not shown) in agreement with a globular conformation and a weight-average molecular weight around 100,000 (
Table 1). M value at peak is around 85,000 (
Table 2). The effective separation on the SEC columns is justified when the product M [η] representing the hydrodynamic volume of the different polymers is estimated: the molecular weight of hyaluronan is in the range of 1 × 10
6 with an intrinsic viscosity in the range of 2,000 mL/g. In conclusion, the product M [η]~2 × 10
9 (mol.mL) is very high compared to that of proteins (M [η]~3 × 10
5 (mol.mL)) allowing the effective separation in SEC.
Table 2.
Molecular weight of HA and proteins at the maximum of concentration peak signal in SEC.
Table 2.
Molecular weight of HA and proteins at the maximum of concentration peak signal in SEC.
| References for SF | M of HA at peak | M of Proteins at peak |
|---|
| LS1 initial | 1,560,000 | 83,000 |
| after freezing | 1,277,000 | 83,400 |
| filtrated | 1,547,000 | |
| after centrifugation | 1,397,000 | |
| LS2 initial | 1,450,000 | 86,750 |
| after freezing | 1,035,000 | 85,800 |
| filtrated | 1,235,000 | |
| LS3 initial | 1,276,000 | 87,100 |
| after freezing | 1,218,000 | 88,500 |
| filtrated | 1,228,000 | |
| LS4 initial | 1,611,000 | 88,300 |
| after freezing | 1,680,000 | 89,600 |
| filtrated | 1,298,000 | |
| after centrifugation | 1,217,000 | |
From
Table 1, it is concluded that there is no significant difference neither between the values of concentration and molecular weight for HA in the different SF tested, nor for proteins characteristics. The molecular weight and concentration of HA in initial OA SF are between 1 to 1.6 × 10
6 (g/mol) and 0.6 to 1.6 g/L respectively. These results are in agreement with those obtained previously on a wide range of SF, showing that the concentration of HA varies from 0.2 to 2.5 g/L and soluble proteins from 20 to 35g/L [
25]. The values of Mw found for the different HA are also in good agreement with the data from the literature (1 to 3 × 10
6 g/mol), especially when the authors use the SEC analysis [
28,
29,
30]. In addition, the products C*Mw obtained for the different SF tested can be related to the viscosity measured at a given shear rate (here 1 s
–1)(
Table 1). It is clear that these values are not following a parallel trend: for example, LS1 and LS2 with higher C*Mw have lower viscosity compared with LS3 and LS4. This indicates that different interactions with proteins exist in the different SF which control rheology, even if the yield and average Mw of these proteins are of the same order of magnitude and are probably engaged in the complex at a low rate. As suggested before, the interaction is based on random electrostatic interaction between positive sites in proteins and anionic sites of HA.
It is interesting to discuss the relation between composition and viscosity of SF: the larger viscosities are obtained with initial LS3 and LS4 which have lower contents in HA compared with LS1 and LS2 (even if the Mw is of the same order of magnitude) as mentioned previously (
Table 1). This confirms that some interactions between HA and proteins may cause the increase of the effective viscosities. Considering the values of Mw and HA concentration given in
Table 1 (from 0.6 to 1.6 g/L and Mw = 1 to 1.6 × 10
6), it is possible to estimate the viscosity of a HA solution (at same concentration and molecular weight) in the absence of proteins, from the relation between viscosity and the product (Mw*C) as given in the literature (but only valid in the Newtonian plateau) [
21,
23]. We note that the calculated values are much lower than the measured ones, confirming the existence of hyaluronan-protein interactions to form a loose physical network. For LS3, the calculated viscosity equals 2 × 10
−3 Pa.s, while the experimental value is 1.79 Pa.s; for LS12, it is found 2.2 × 10
−3 Pa.s when the measured value is 6.6 × 10
−2 Pa.s. Some other values are given in
Table 3, confirming the large difference between calculated and experimental viscosity values. These values also confirm that the product C*Mw is not in direct relation with the viscosity of SF. It is the first time that this type of experiments (SEC associated with rheology) is developed on a large series of synovial fluids allowing us to draw a clear conclusion.
Table 3.
Characteristics of different synovial fluids obtained by SEC analysis and viscometry at 25 °C.Comparison with calculated viscosity values.
Table 3.
Characteristics of different synovial fluids obtained by SEC analysis and viscometry at 25 °C.Comparison with calculated viscosity values.
| | Mw HA × 10-6 | C HA g/L | Mw Proteins× 10-5 | C Proteins g/L | C*Mw × 10-6 for HA | η Pa.s (1 s–1) at 25 °C |
|---|
| LS5 | 3.36 | 2.3 | 0.94 | 18.8 | 7.7 | 2.98 (calc: 0.176) |
| LS6 | 1.53 | 2.1 | 1.23 | 24.7 | 3.2 | 1.66 (calc:0.024) |
| LS7 | 3.44 | 1.4 | 1.35 | 33.5 | 4.8 | 0.49 (calc:0.043) |
| LS8 | 1.14 | 1.9 | 2.20 | 35 | 2.1 | 0.22 (calc:0.003) |
| LS9 | 1.45 | 1.1 | 2.90 | 32 | 1.6 | 0.08 (calc:0.002) |
2.2. Stability of linear HA and SF at 4 and −21 °C.
We were interested in testing the stability of SF stored at 4 °C or frozen (–21 °C) after collection from a patient, so as to be able in the future to investigate large series of SF along viscosupplementation treatments. These two storage techniques are mentioned in the literature [
28,
29,
30]. As a model, a linear HA was tested in the same conditions and the results obtained for molecular weight distribution are given in
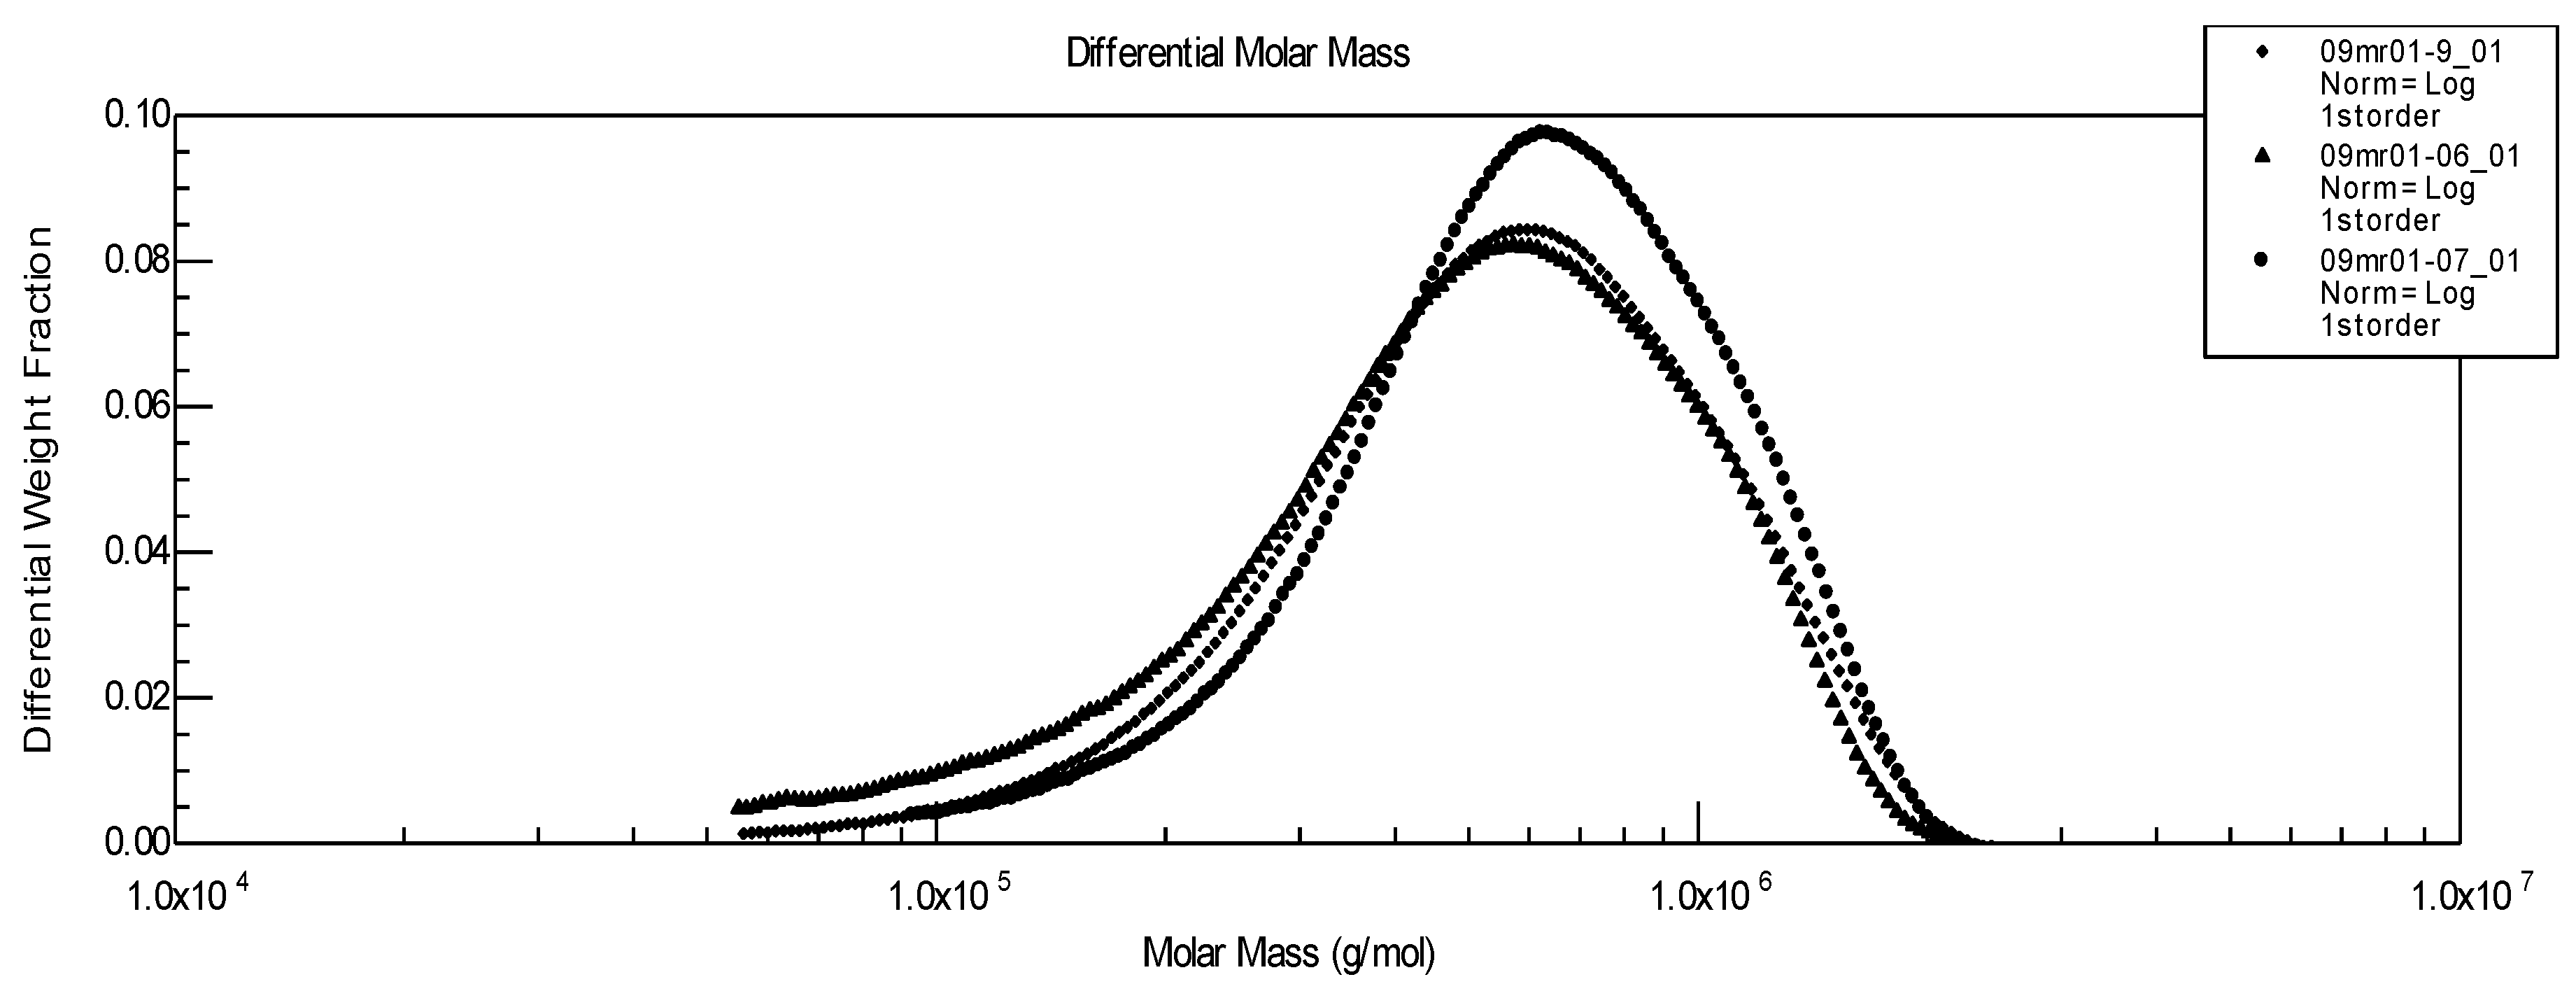
Figure 3.
Figure 3.
Influence of pre-traitement on molecular weight distribution of pure hyaluronan. ▲Initial linear HA;● linear HA stored at 4°C;♦ HA after freezing at –21 °C.
Figure 3.
Influence of pre-traitement on molecular weight distribution of pure hyaluronan. ▲Initial linear HA;● linear HA stored at 4°C;♦ HA after freezing at –21 °C.
There is a near overlapping of the molecular weight distributions as well as of viscosity data: Mw of the initial polysaccharide after direct dissolution equals 644,000, after one month at 4 °C it gives Mw = 633,000, and after freezing and thawing Mw = 600,000. From these results, our conclusion is that for a pure HA, the solution properties and molecular weights are quite independent from the conditions adopted to store the samples. Nevertheless, for longer storage times, it seems advisable to recommend freezing HA solutions.
From our previous results on SF stability [
25], it was shown that SF kept at 4 °C is stable over a long period of time (2 months). This agrees with recommendations from Balazs [
10,
16,
32]. But to preserve samples, it is recommended to freeze them for longer storage time; this technique is adopted by other authors [
28,
29,
30]. It is important to demonstrate that the pre-treatment used has no significant influence on the properties and composition of SF. For that purpose, the rheological behaviour of different SF tested before and after freezing is shown in
Figure 4, and some viscometric experimental values are given at 1 s
–1 in
Table 1.
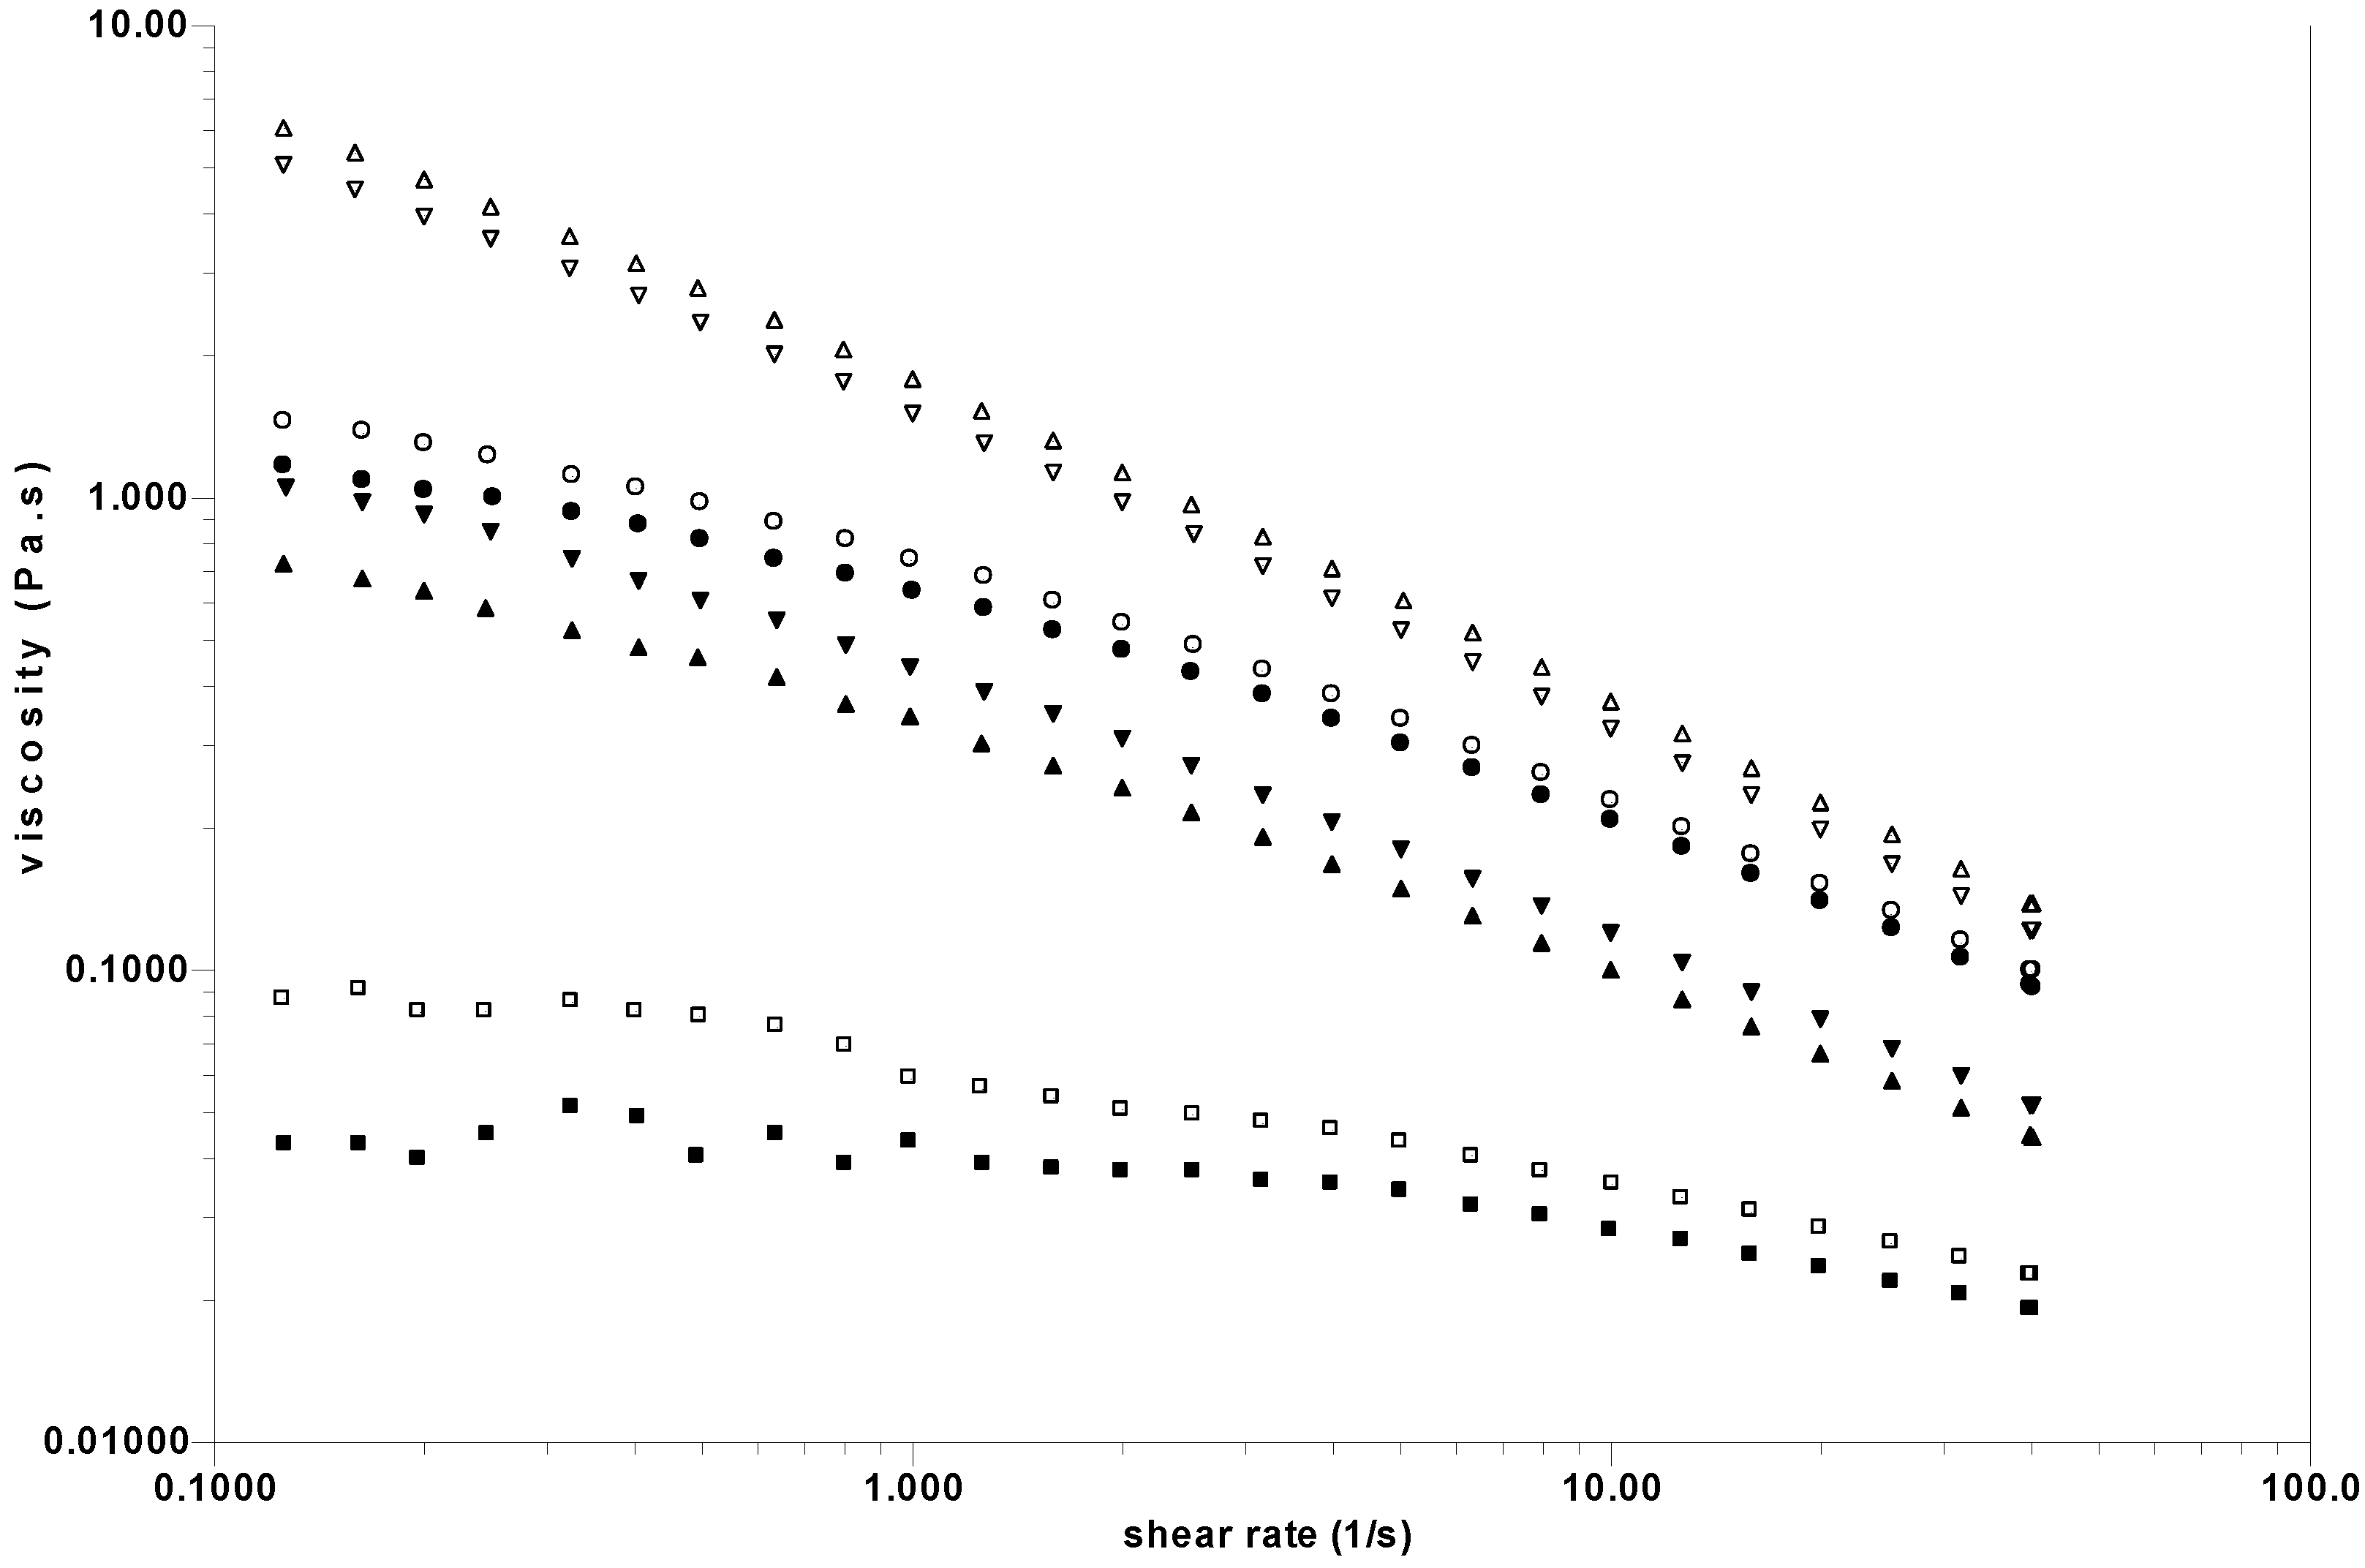
The steady state viscosities of the initial SF studied at low shear rate vary in a ratio of around 100 and are always non-Newtonian even at lower shear rates than represented in
Figure 4. The influence of freezing on the viscosity is shown clearly dependant on the nature of the synovial fluid considered. In one case (LS1), the viscosity after freezing increases in relation to a reinforcement of the network junctions, as observed previously in some polysaccharide physical gels. Self association of HA was mentioned in NaCl aqueous solution [
33] but also at low temperatures [
34,
35]. For the SF named LS2, there is no modification whatsoever. For LS3 and LS4, a very small decrease of the viscosity corresponds to a small modification of the physical network.
Figure 4.
Influence of freezing at –21 °C on rheological behaviour of 4 different SF measured at 25 °C. Open signs correspond to the initial SF; the corresponding filled signs are the frozen SF. ○●LS1; □■ LS2;◊ ♦ LS3; △▲LS4.
Figure 4.
Influence of freezing at –21 °C on rheological behaviour of 4 different SF measured at 25 °C. Open signs correspond to the initial SF; the corresponding filled signs are the frozen SF. ○●LS1; □■ LS2;◊ ♦ LS3; △▲LS4.
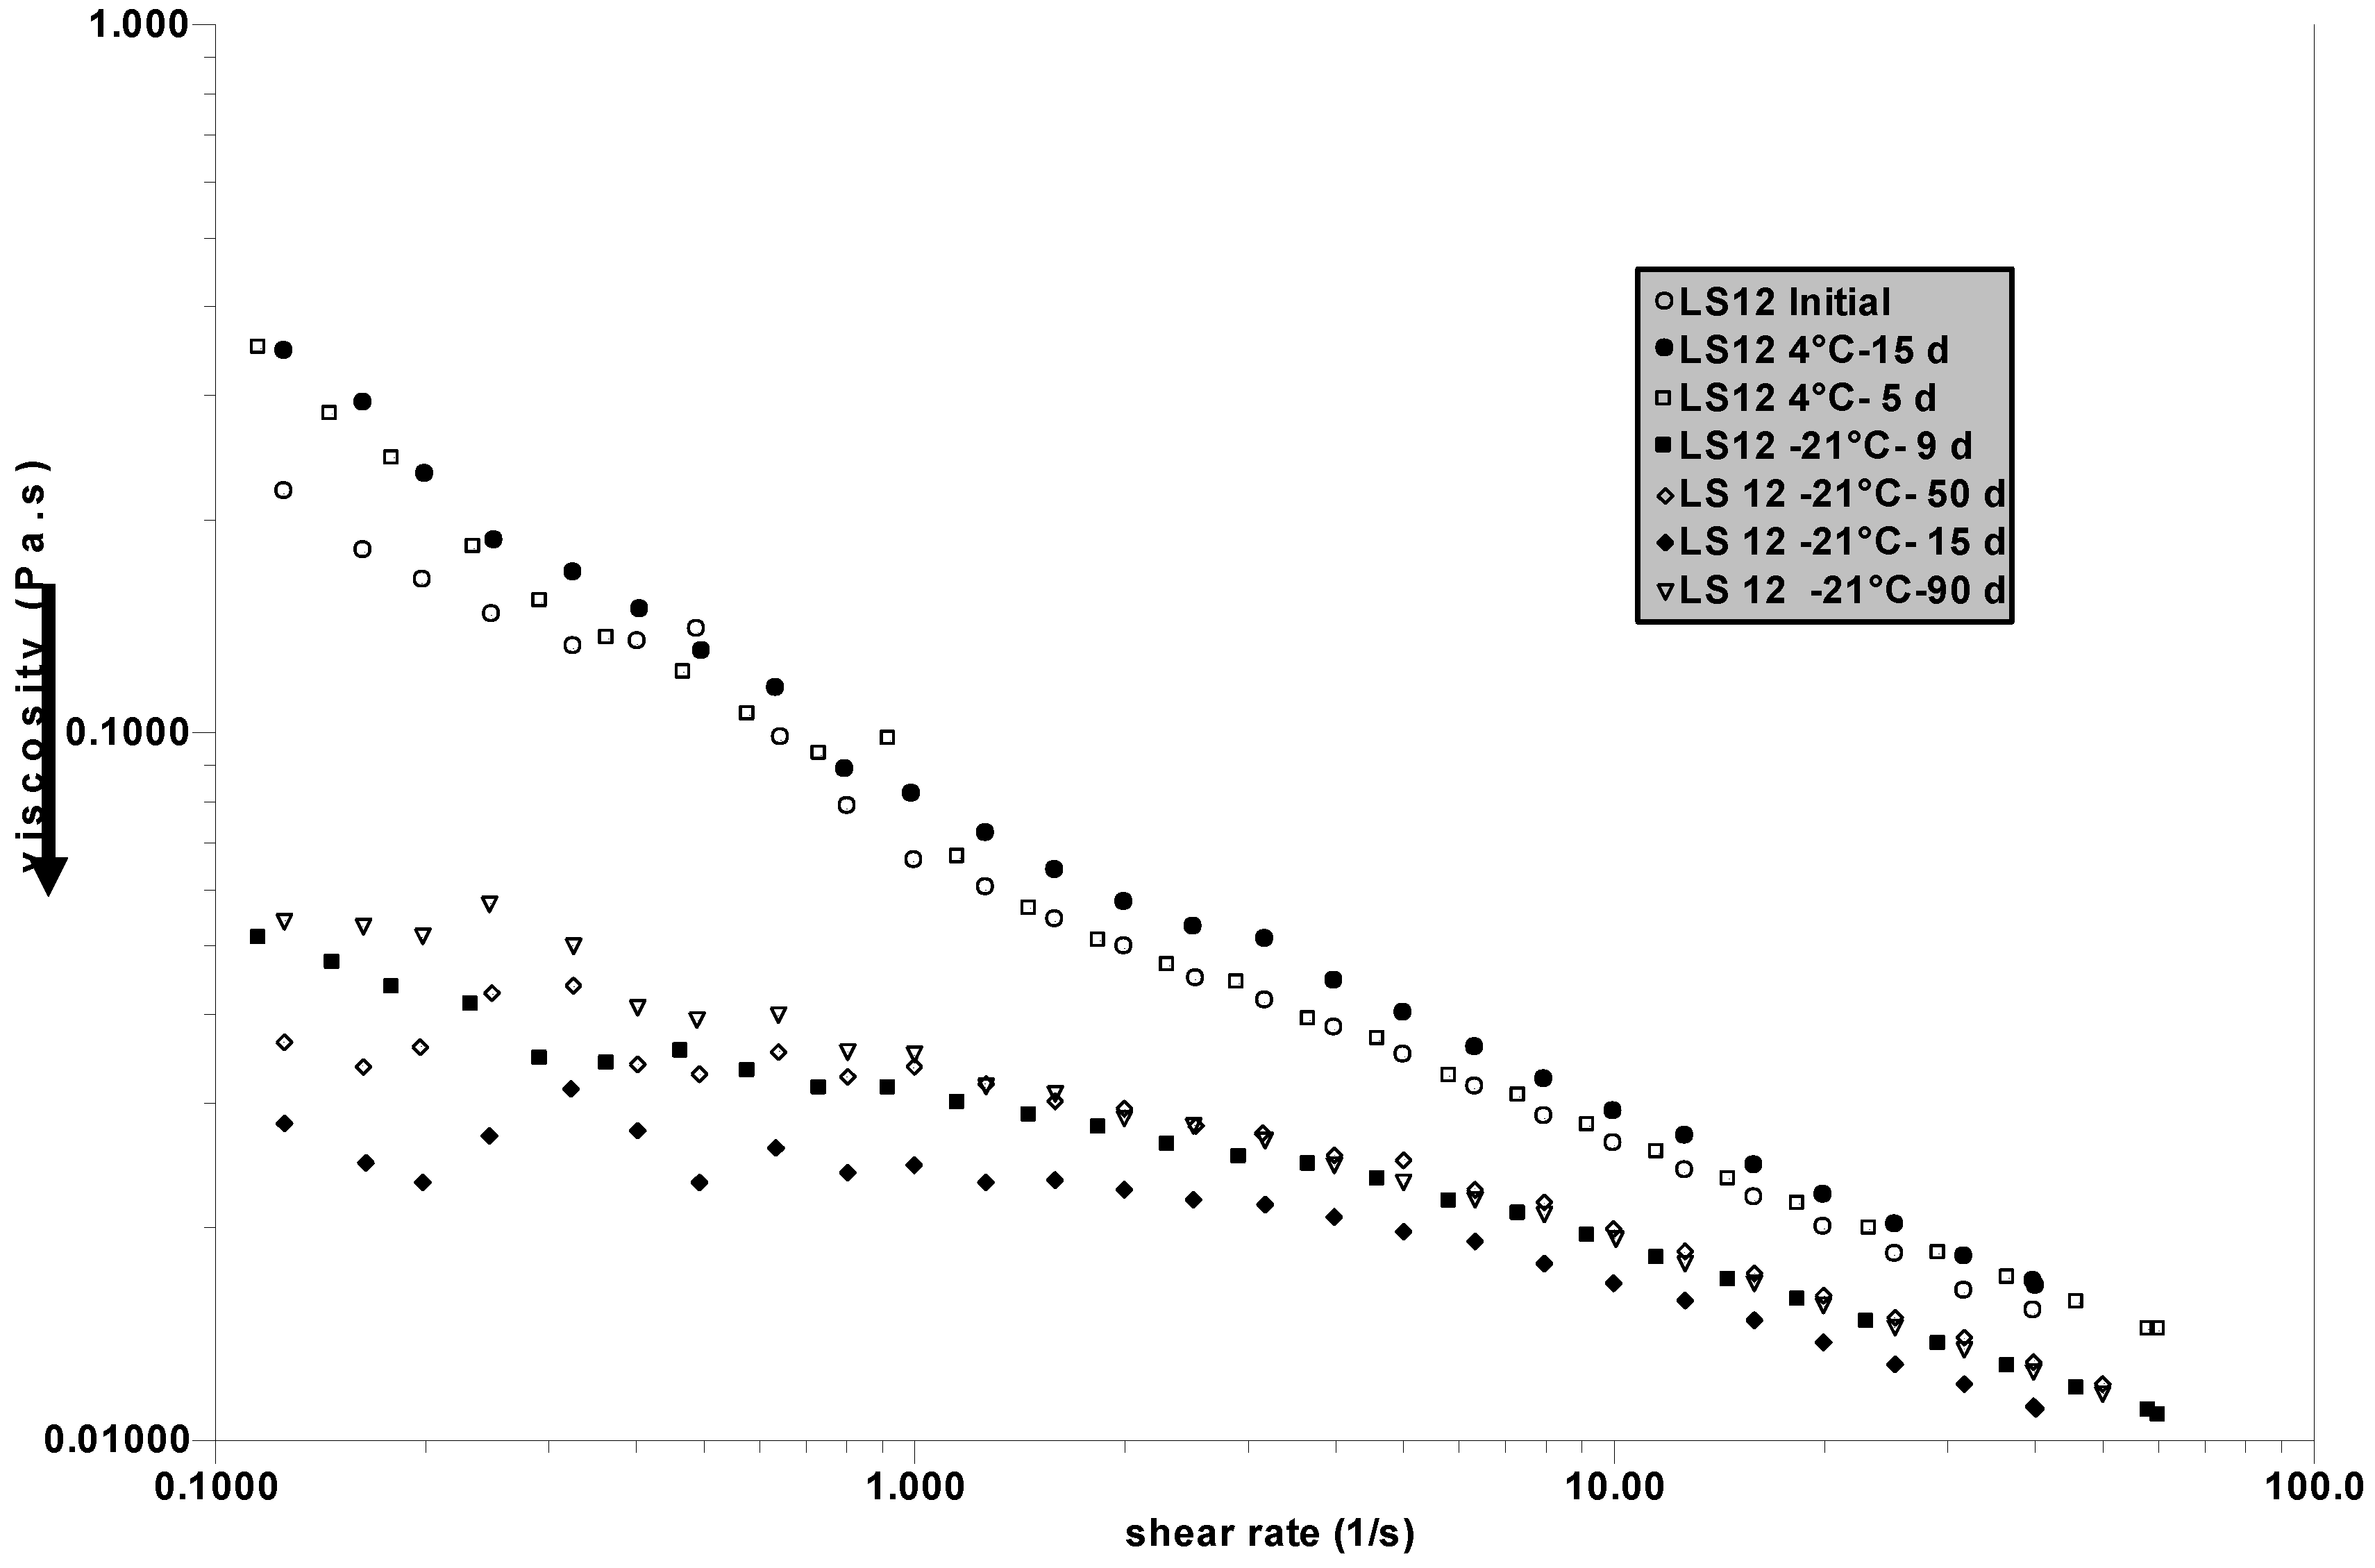
In a separated series of experiments, initial SF is divided in two parts: one is kept at 4 °C and the other is frozen at –21 °C. Measurements are performed after different periods of time to control the stability at 4 °C and to observe the role of successive freezing and thawing. The results are given in
Figure 5. It is confirmed that the stability of SF is good at 4 °C after 15 days but, in this specific case, the first cycle of freezing and thawing causes a large decrease in the viscosity of the SF examined (named LS12).
After this first step, successive freezing does not significantly change the viscosity. The stability of SF at 4 °C is confirmed, but freezing destabilized the network in LS12 which has in fact the lowest initial viscosity (compared to the previous samples tested) and consequently the less stable 3 D-network. If the steady state viscosity as a function of the shear rate for LS2 (
Figure 4) and LS12 (
Figure 5) are compared, it is clear that they are quite different: LS12 has a large non-Newtonian behaviour, whereas for LS2 there is nearly no shear rate influence at low shear rate. This behaviour indicates more efficient protein-HA interaction (or a larger amount of complex formed) in LS12 forming a loose network which is destabilized by freezing (when LS2 is nearly not perturbed).
Figure 5.
Influence of successive cycles of freezing (at –21 °C) and thawing after different periods of time (in days d) on the SF named LS12. Experiments for storage at 4 °C are joined. Measurements are performed at 25 °C. The arrow indicates the drop in viscosity after the first freezing.
Figure 5.
Influence of successive cycles of freezing (at –21 °C) and thawing after different periods of time (in days d) on the SF named LS12. Experiments for storage at 4 °C are joined. Measurements are performed at 25 °C. The arrow indicates the drop in viscosity after the first freezing.
The compositions of the SF after freezing are not clearly modified (
Table 1). In some cases, molecular weight of HA appears to decrease (LS1 and LS12) and its concentration increases slightly (LS1, LS3, LS4). In these SF, proteins concentration also increases in relation to the disruption of HA- protein association, with only a small influence on the resulting viscosity. An exception is shown regarding LS12, where concentration, molecular weight of HA and viscosity decrease. In the literature, it was also previously found that freezing causes a small decrease in MW, passing from 1.3 to 1 × 10
6 (Table 5 in reference
29).
In conclusion, it is clear that the influence of freezing pre-treatment depends on the synovial fluid to be studied. But in the majority of cases, when the viscosity is not too low, freezing can be applied to store SF without significant modification.
2.3. Role of filtration and centrifugation on the composition and rheology of SF
Synovial fluid is constituted of HA and a small portion of proteins which form a physical network, playing an important role in the global viscosity as previously discussed. For the purpose of characterization, it is important to be able to separate these components to simplify the analysis. Centrifugation to separate cells followed by chemical analysis was proposed by Balazs [
14,
32], but it does not allow us to separate protein contribution. Otherwise, different pre-treatments were adopted to separate HA from proteins, from which an enzymatic hydrolysis allowed us to eliminate proteins [
5,
6,
31,
36]. In our analysis, we intend to compare treatments of filtration and centrifugation used before characterizing the SF especially by SEC. As a first step, SF were filtrated through porous membranes with pore diameters of 0.8 μm for LS2 and LS1, and with 3 μm for LS3 and LS4. Due to their much larger viscosity, meaning also a more cross-linked system, it was not possible to pass LS3 and LS4 through a porous 0.8 μm membrane in absence of dilution. Their viscosity was determined before and after filtration; all the values are given in
Table 1 and
Figure 6.
Figure 6.
Influence of filtration on rheological behaviour. Open signs for the initial SF; corresponding filled signs correspond to the filtrated samples. ○●LS1; □■ LS2; △▲LS3; ▽▼LS4.
Figure 6.
Influence of filtration on rheological behaviour. Open signs for the initial SF; corresponding filled signs correspond to the filtrated samples. ○●LS1; □■ LS2; △▲LS3; ▽▼LS4.
It is clear that filtration of SF directly after aspiration from the knee (in absence of dilution) has a very important role in the rheology of synovial fluid. Nevertheless, it again appears to depend on the nature of the SF tested: the decrease in viscosity is very large for LS3 and LS4, the more viscous samples, even if they were filtrated on larger pores membranes, but their protein content also decreases. On the other hand, much lower variation is obtained for LS1 and LS2 (values are given in
Table 1). For all the samples, the concentration and molecular weight of HA on filtrated samples are in the same range of magnitude as for the initial SF.
Two of these SF were centrifuged at 50,000 g during 20 minutes at 4 °C. The small sediment was then isolated and weighted. The sediments from LS1 and LS4 represent around 3 w%. The rheological behaviour is barely modified compared to the initial state, corresponding to a stable network. It remains larger than that of the filtrated state, especially for LS4 (
Figure7). Our conclusion is that centrifugation does not appear to modify the rheological properties of SF especially on highly viscous fluids in which the 3D- network looks stable.
Figure 7.
Comparison of the influence of filtration and centrifugation on viscosity, as a function of shear rate for two synovial fluids at 25 °C. Respectively: initial, centrifugated and filtrated SF ○● ♦ LS1; □ ■ ▼ LS4.
Figure 7.
Comparison of the influence of filtration and centrifugation on viscosity, as a function of shear rate for two synovial fluids at 25 °C. Respectively: initial, centrifugated and filtrated SF ○● ♦ LS1; □ ■ ▼ LS4.
The composition of SF after centrifugation was analyzed: the molecular weight distribution is not significantly modified but it is more sensitive when compared with the molecular weight at the peak signal of SEC: very small decreases in M are obtained (
Table 2). As a conclusion, it is shown that only small modifications are observed between the content and molecular weight of HA obtained after filtration or after centrifugation, in comparison with their initial characteristics. From these results, it is concluded that there is no separation between proteins and HA isolated and/or engaged in the 3D- network during these pre-treatments. We also conclude that the structure of the SF is not perturbed definitively, which would prevent us from interpreting the viscosity data in terms of HA composition.
Our conclusion is that, as soon as recovered, the synovial fluids may be frozen and then be stored over a long period of time without significant modification in their composition nor in their rheological behaviour. A 3D-network is clearly responsive to the rheological behaviour of SF. It can be at least partially separated (on some SF), by filtration on porous membrane, with no major modification in its composition but exerting a major influence on rheology. Large dilution applied on initial SF before filtration (on 0.2 μm pores membrane able to eliminate, if still stable, the majority of protein-HA complex) and injection in SEC experiment as proposed in our work, permits a good separation between HA and proteins which are then characterized individually.
2.4. Influence of protease pretreatment on composition and rheology of SF
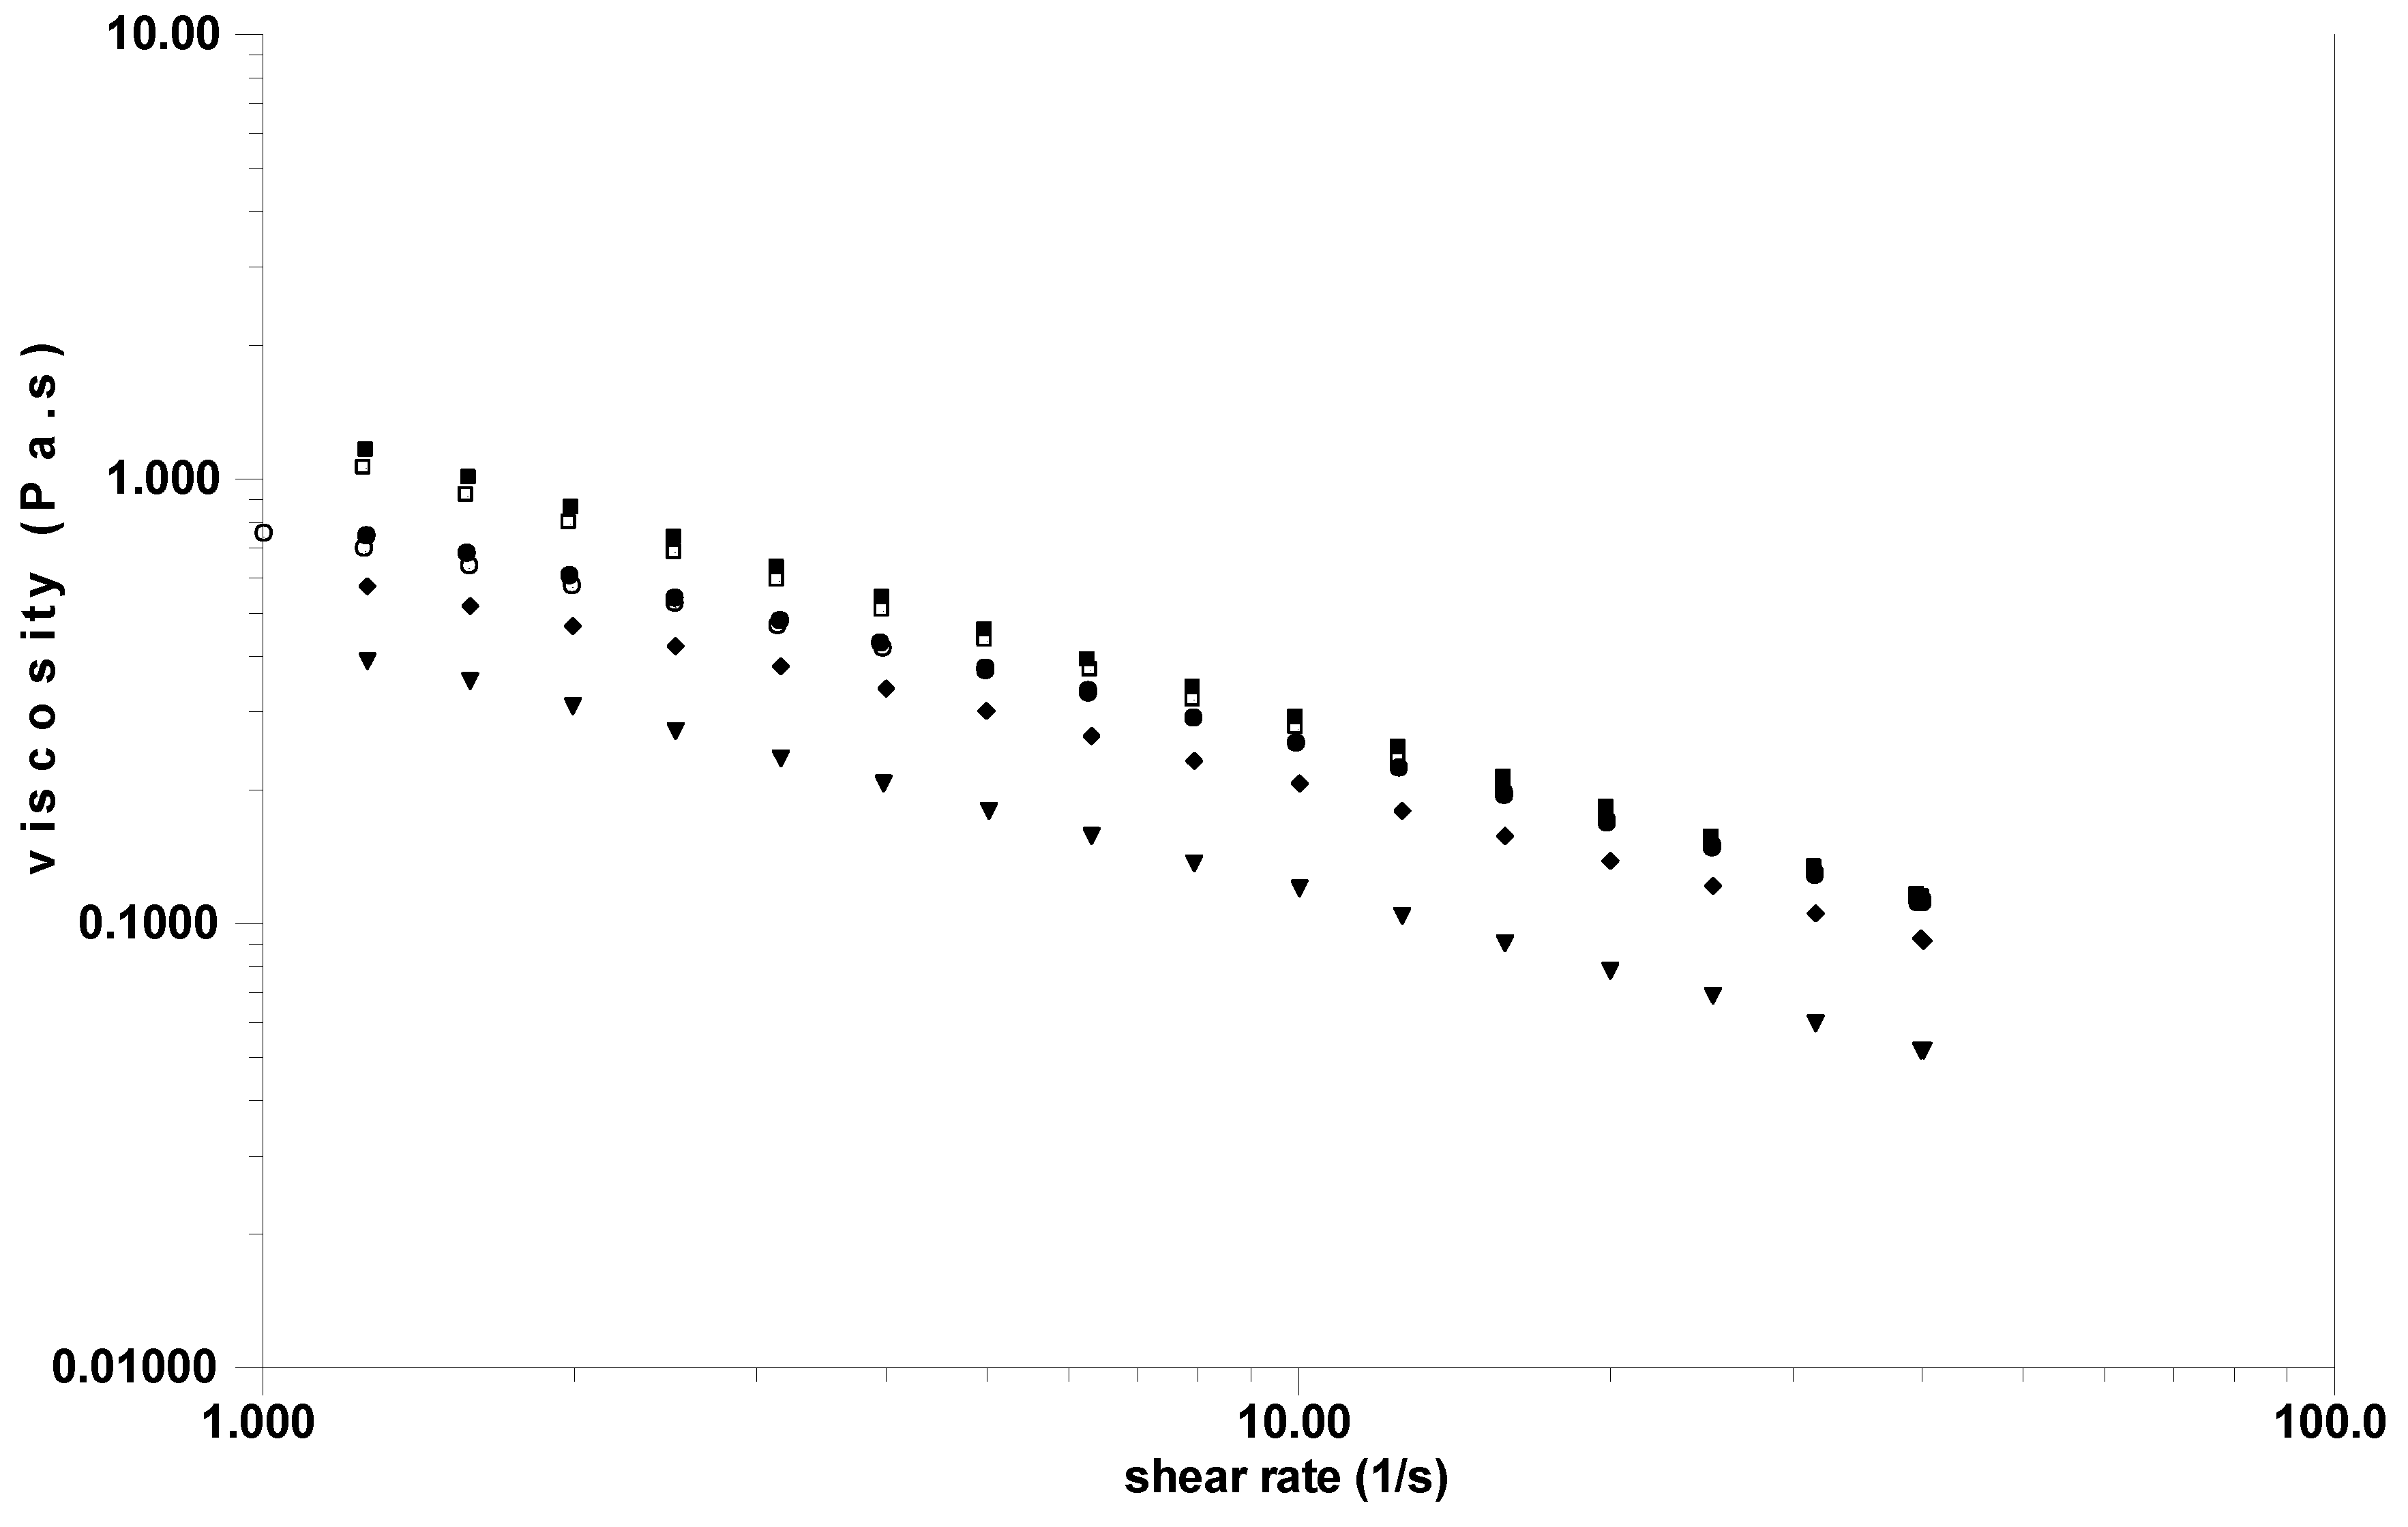
A 30 g/L solution of bacterial HA was tested as reference, and the same addition of protease was performed on HA and on SF at room temperature. It is shown that there is no change in the Newtonian viscosity for pure HA after protease treatment (
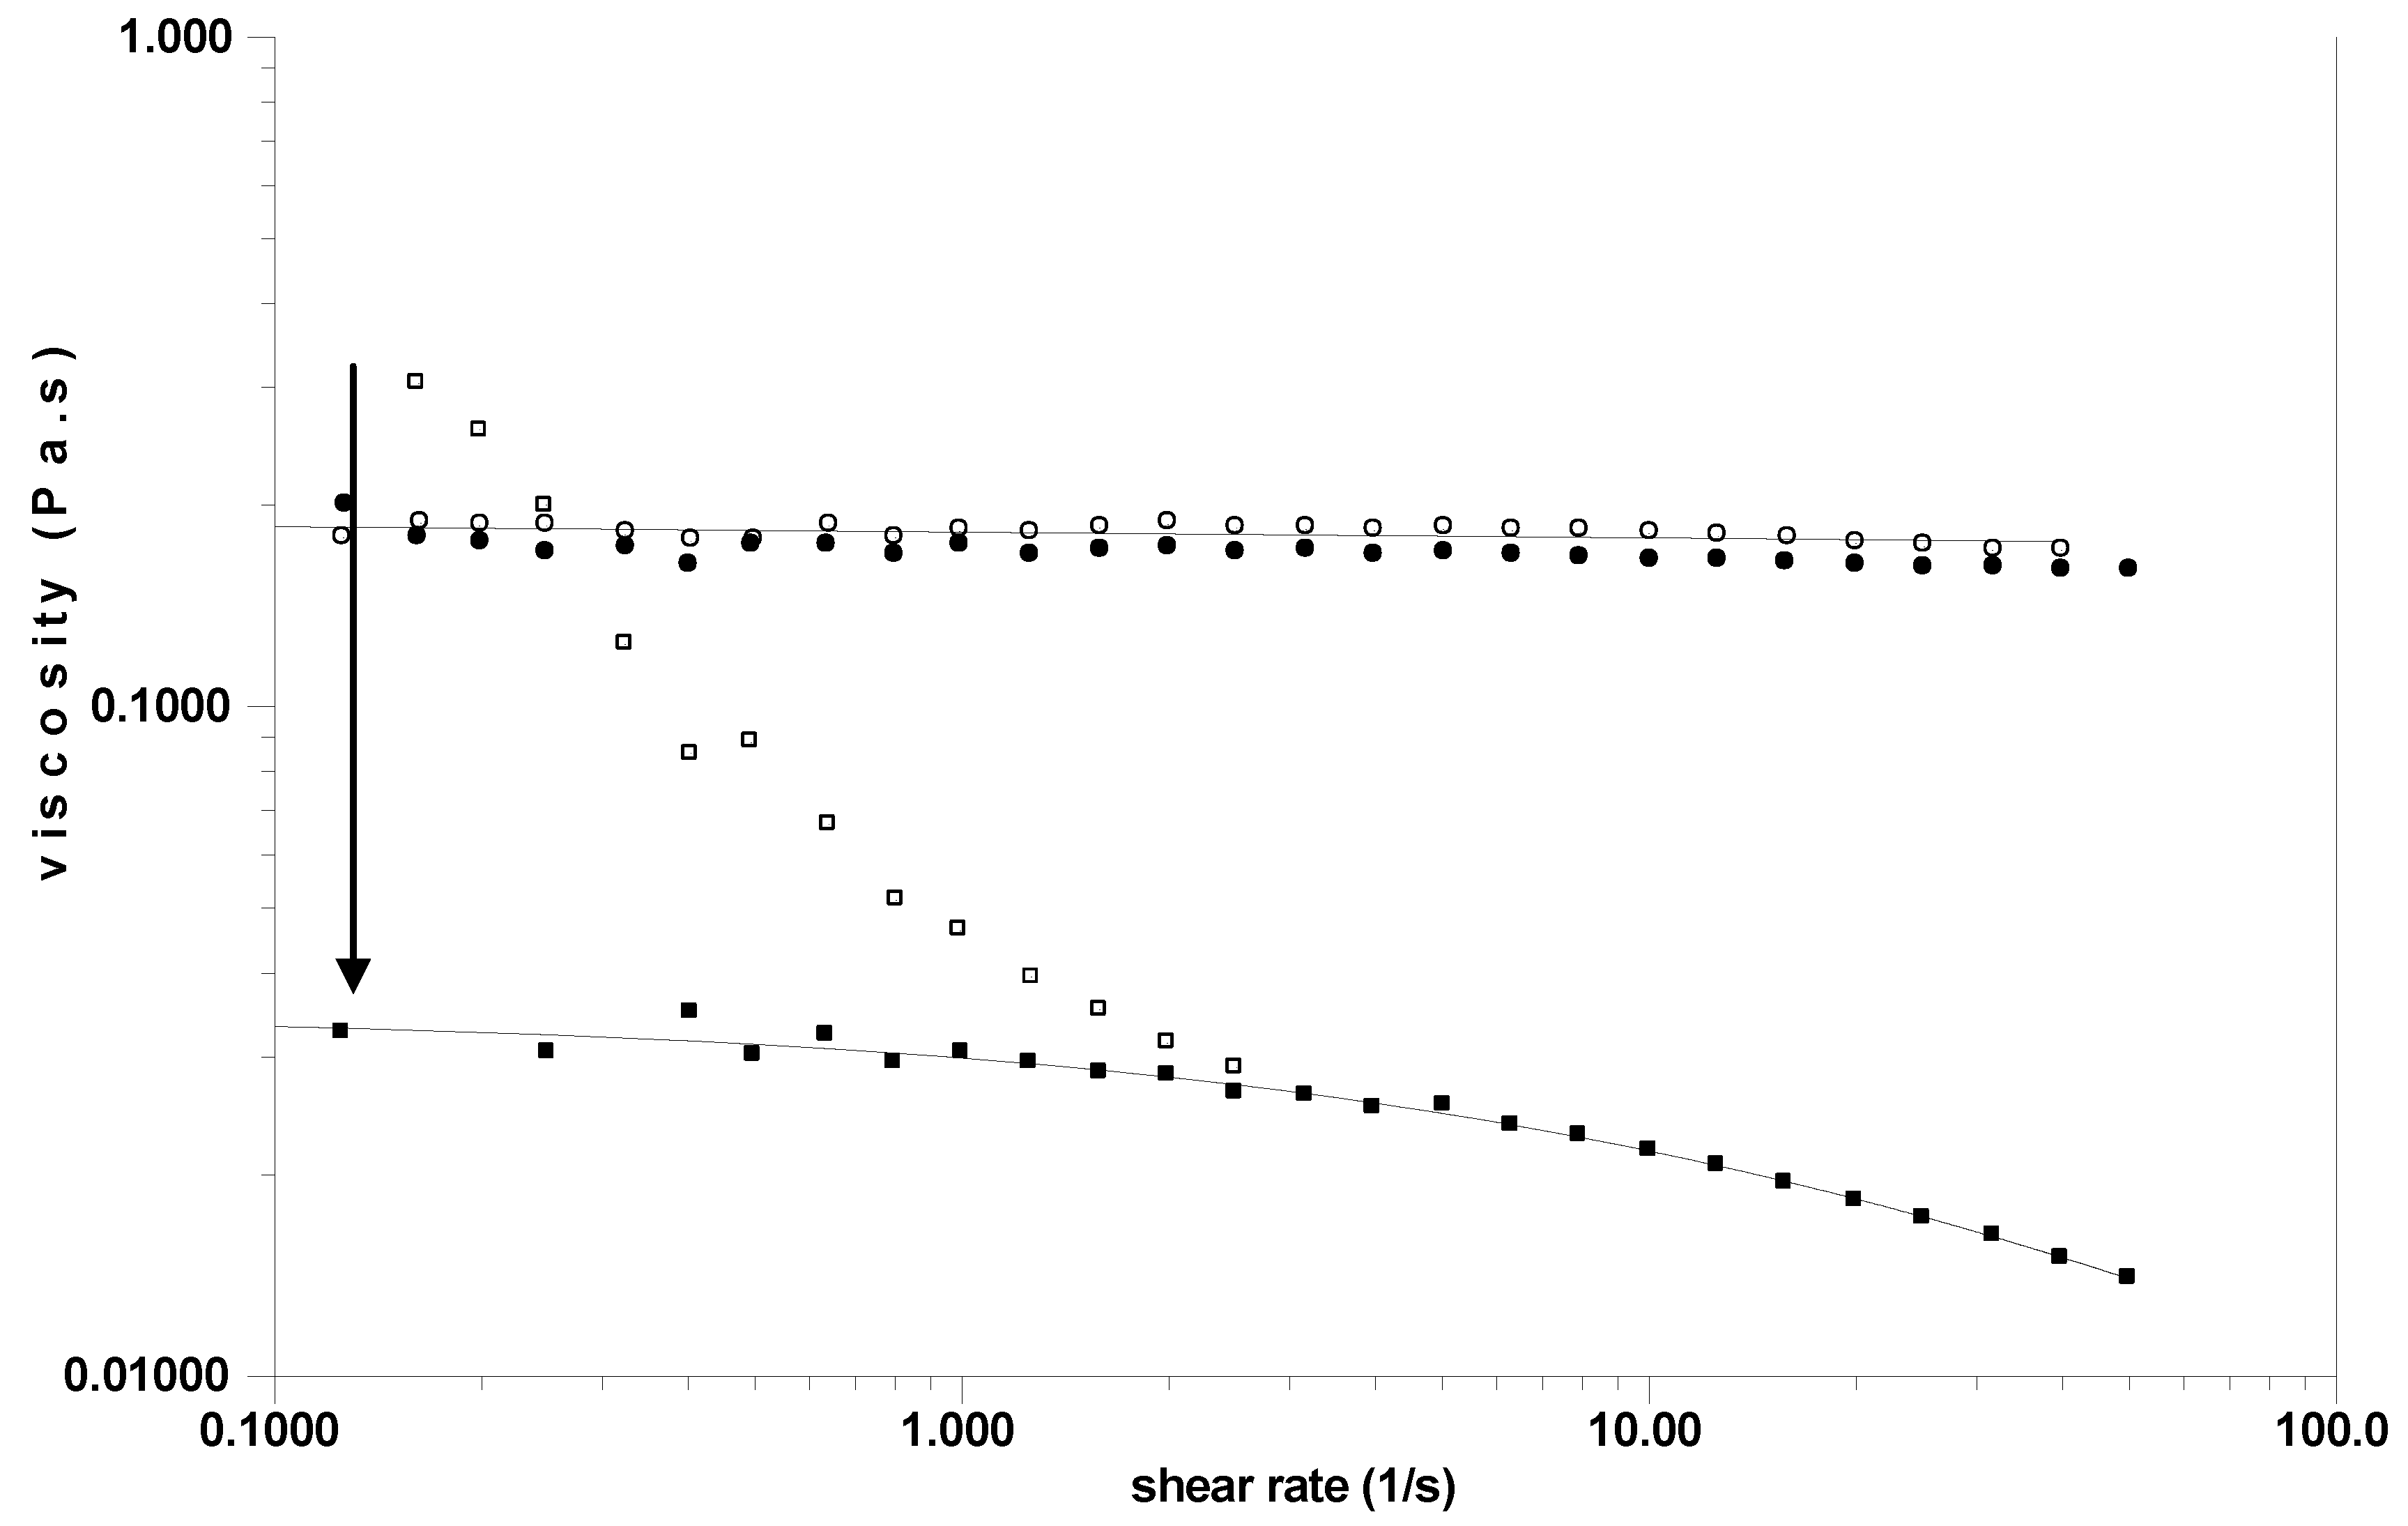
Figure 8). It is shown that the viscosity even at high C*Mw remains Newtonian whereas SF was usually non-Newtonian. With SF, a large change in viscosity, especially at low shear rate, is observed in the presence of protease and the behaviour becomes Newtonian with a viscosity at low shear rate of around 0.03 Pa.s. In the same time, the SF becomes clearer corresponding to the disruption of HA/protein aggregates.
Figure 8.
Steady state viscosity as a function of the shear rate before (open symbols) and after (closed symbols) protease addition. HA at 30 g/L in 0.15 M NaCl (○,●); SF (□,■). Continuous lines are the Williamson fits used to determine the zero shear rate viscosities. The arrow represents the drop in viscosity after enzymatic treatment.
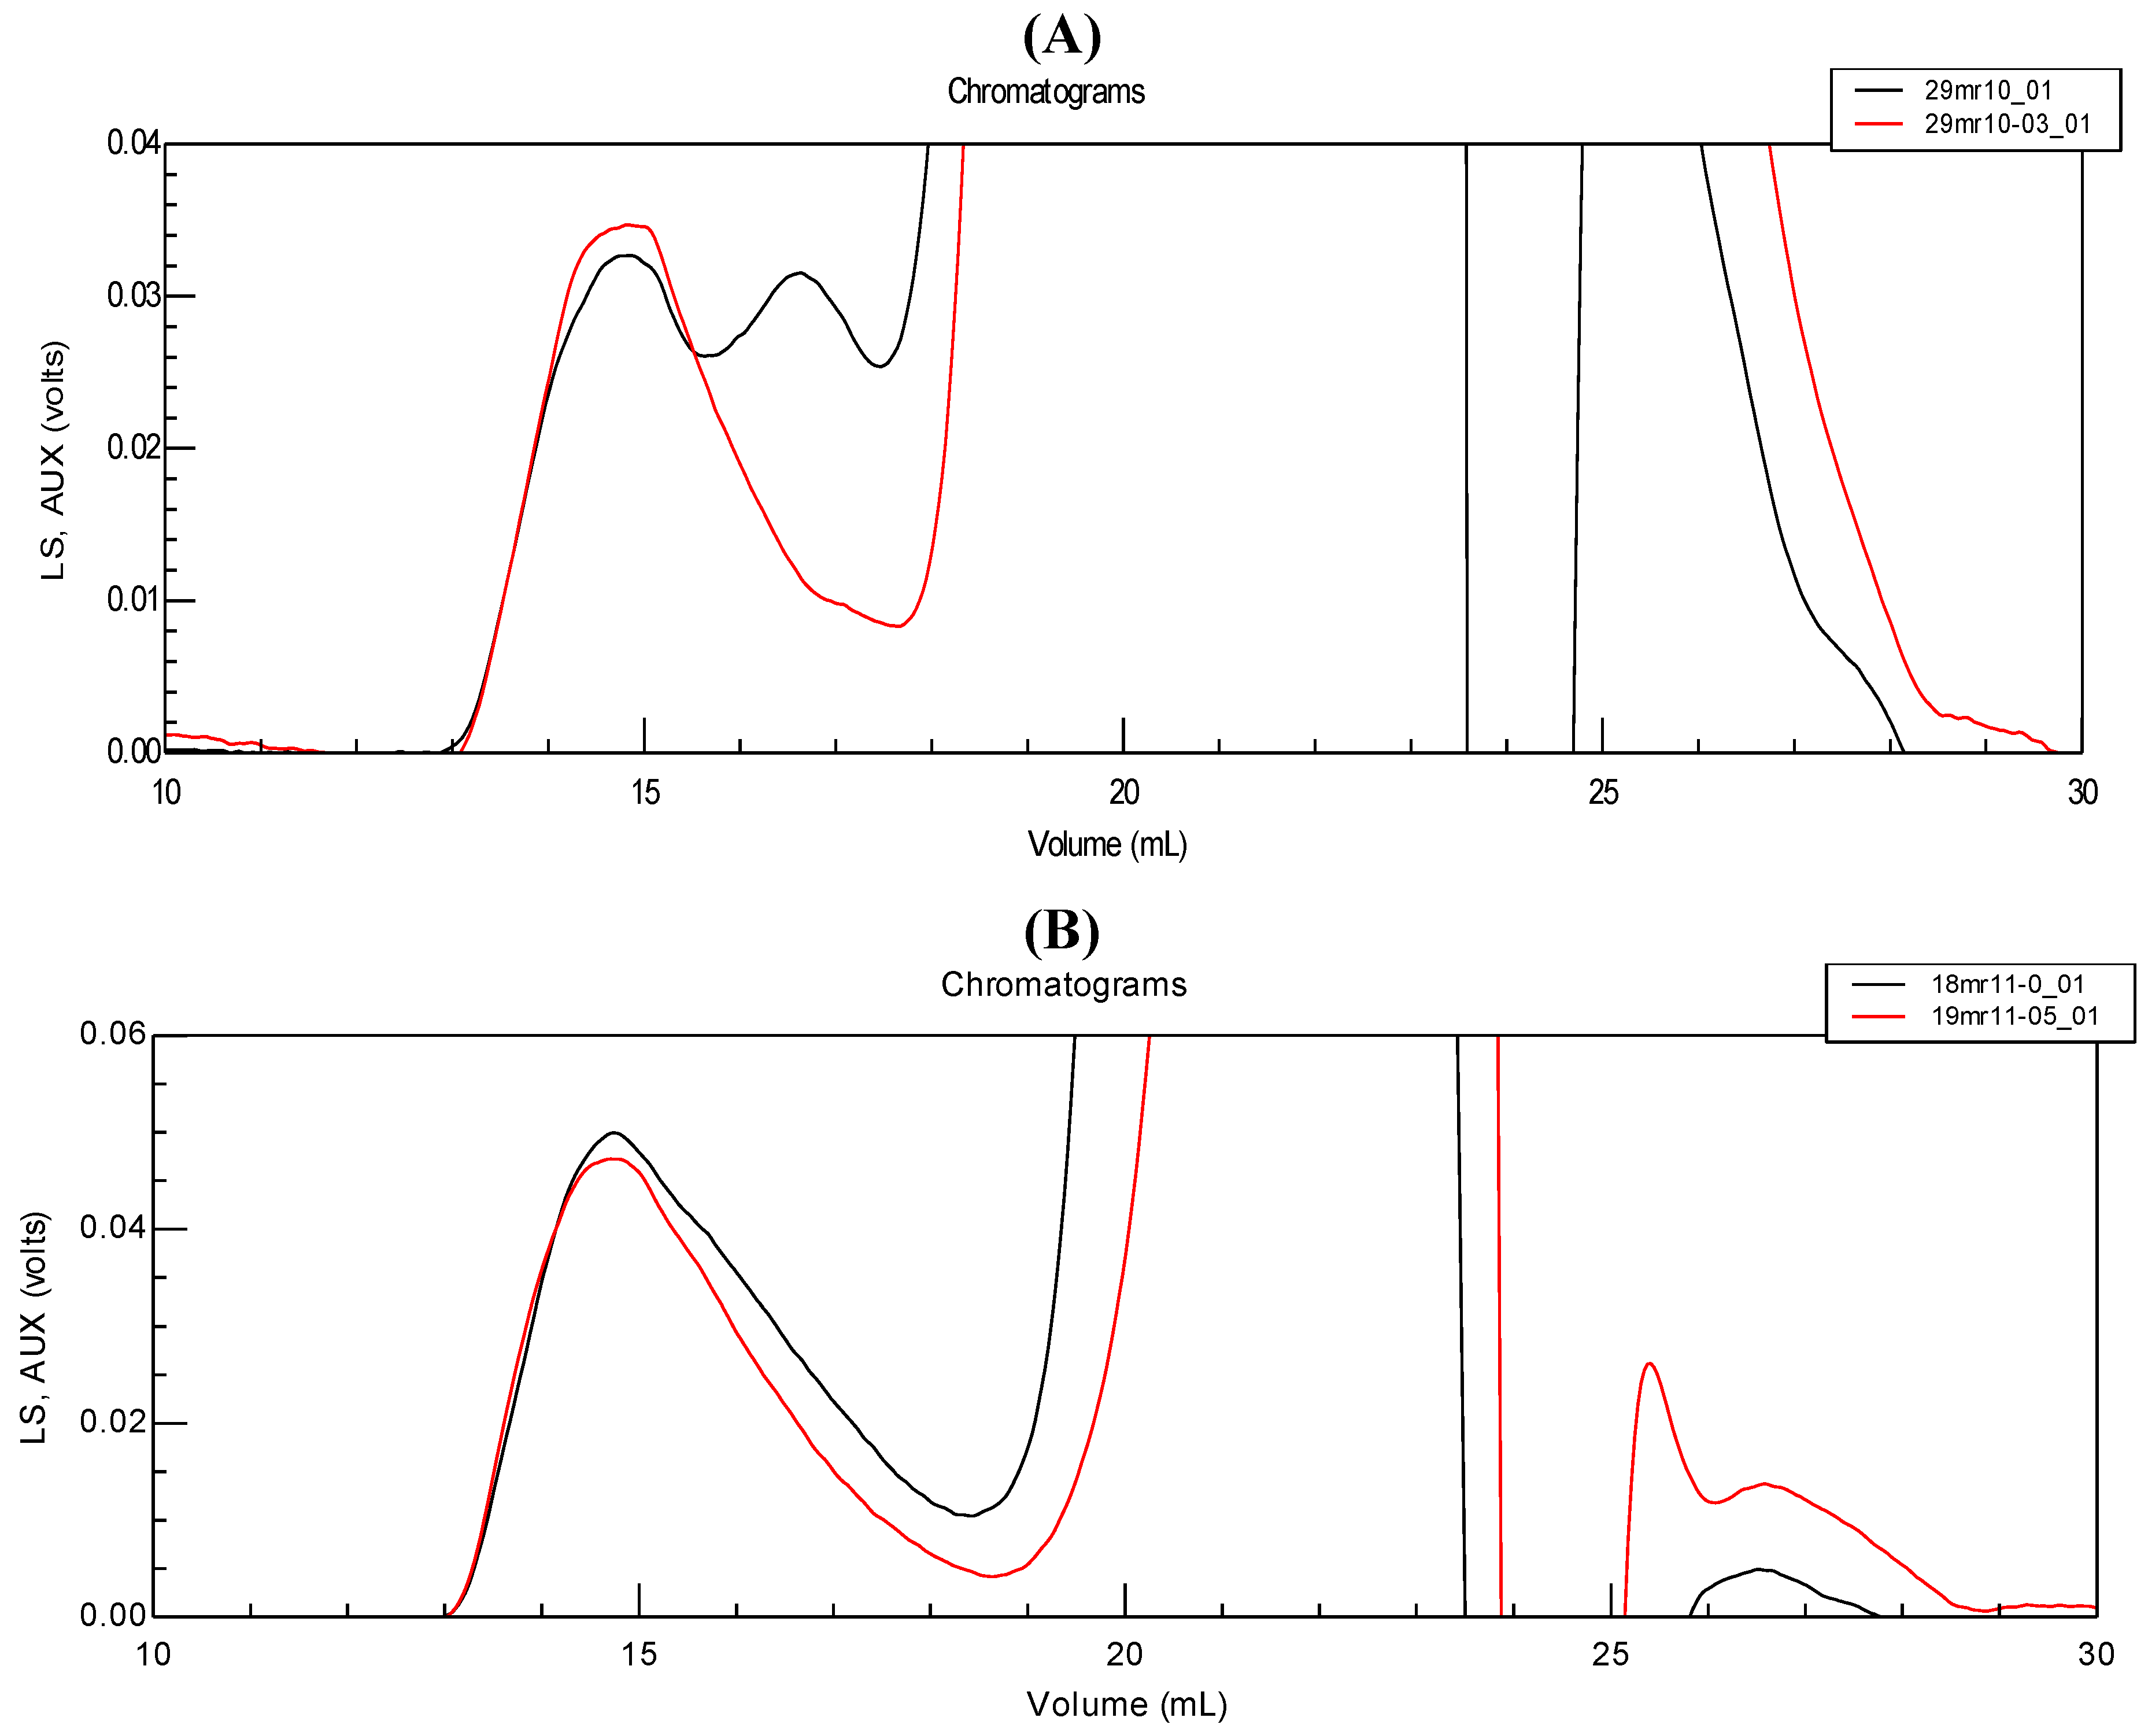
It is thus important to compare SEC results and control the SF composition after protease action. In
Figure 9, the two chromatograms (A and B) of the enlarged part of eluted materials for two types SF are shown before and after protease action. Chromatogram A described SF composition as applied in the rheological test (
Figure 8).
Figure 9.
Chromatograms of two different synovial fluids (A and B) before (black) and after protease treatment (red).The traces are those for the polymer concentration; enlargement of the HA signal is shown at a elution volume of around 15 mL.
Figure 9.
Chromatograms of two different synovial fluids (A and B) before (black) and after protease treatment (red).The traces are those for the polymer concentration; enlargement of the HA signal is shown at a elution volume of around 15 mL.
The analysis of HA molecular weight given at maximum concentration (first peak) shows the same values before and after enzymatic treatment. It is clear that after enzymatic treatment, the first peak (corresponding to HA elution) is better separated from that of proteins in
Figure 9A. Nevertheless, the difference between chromatograms before and after enzyme treatment again depends on the state of proteins (degree of aggregation) or HA-protein association: the second small peak in elution may exist or not, depending on the particular SF tested (compare chromatograms (A) and (B) in
Figure 9). From this data, we conclude that the action of protease may be recommended to make the SEC analysis easier (but preventing protein analysis). Nevertheless, the differences observed in the analyses remain small and do not fundamentally change our previous conclusions. In
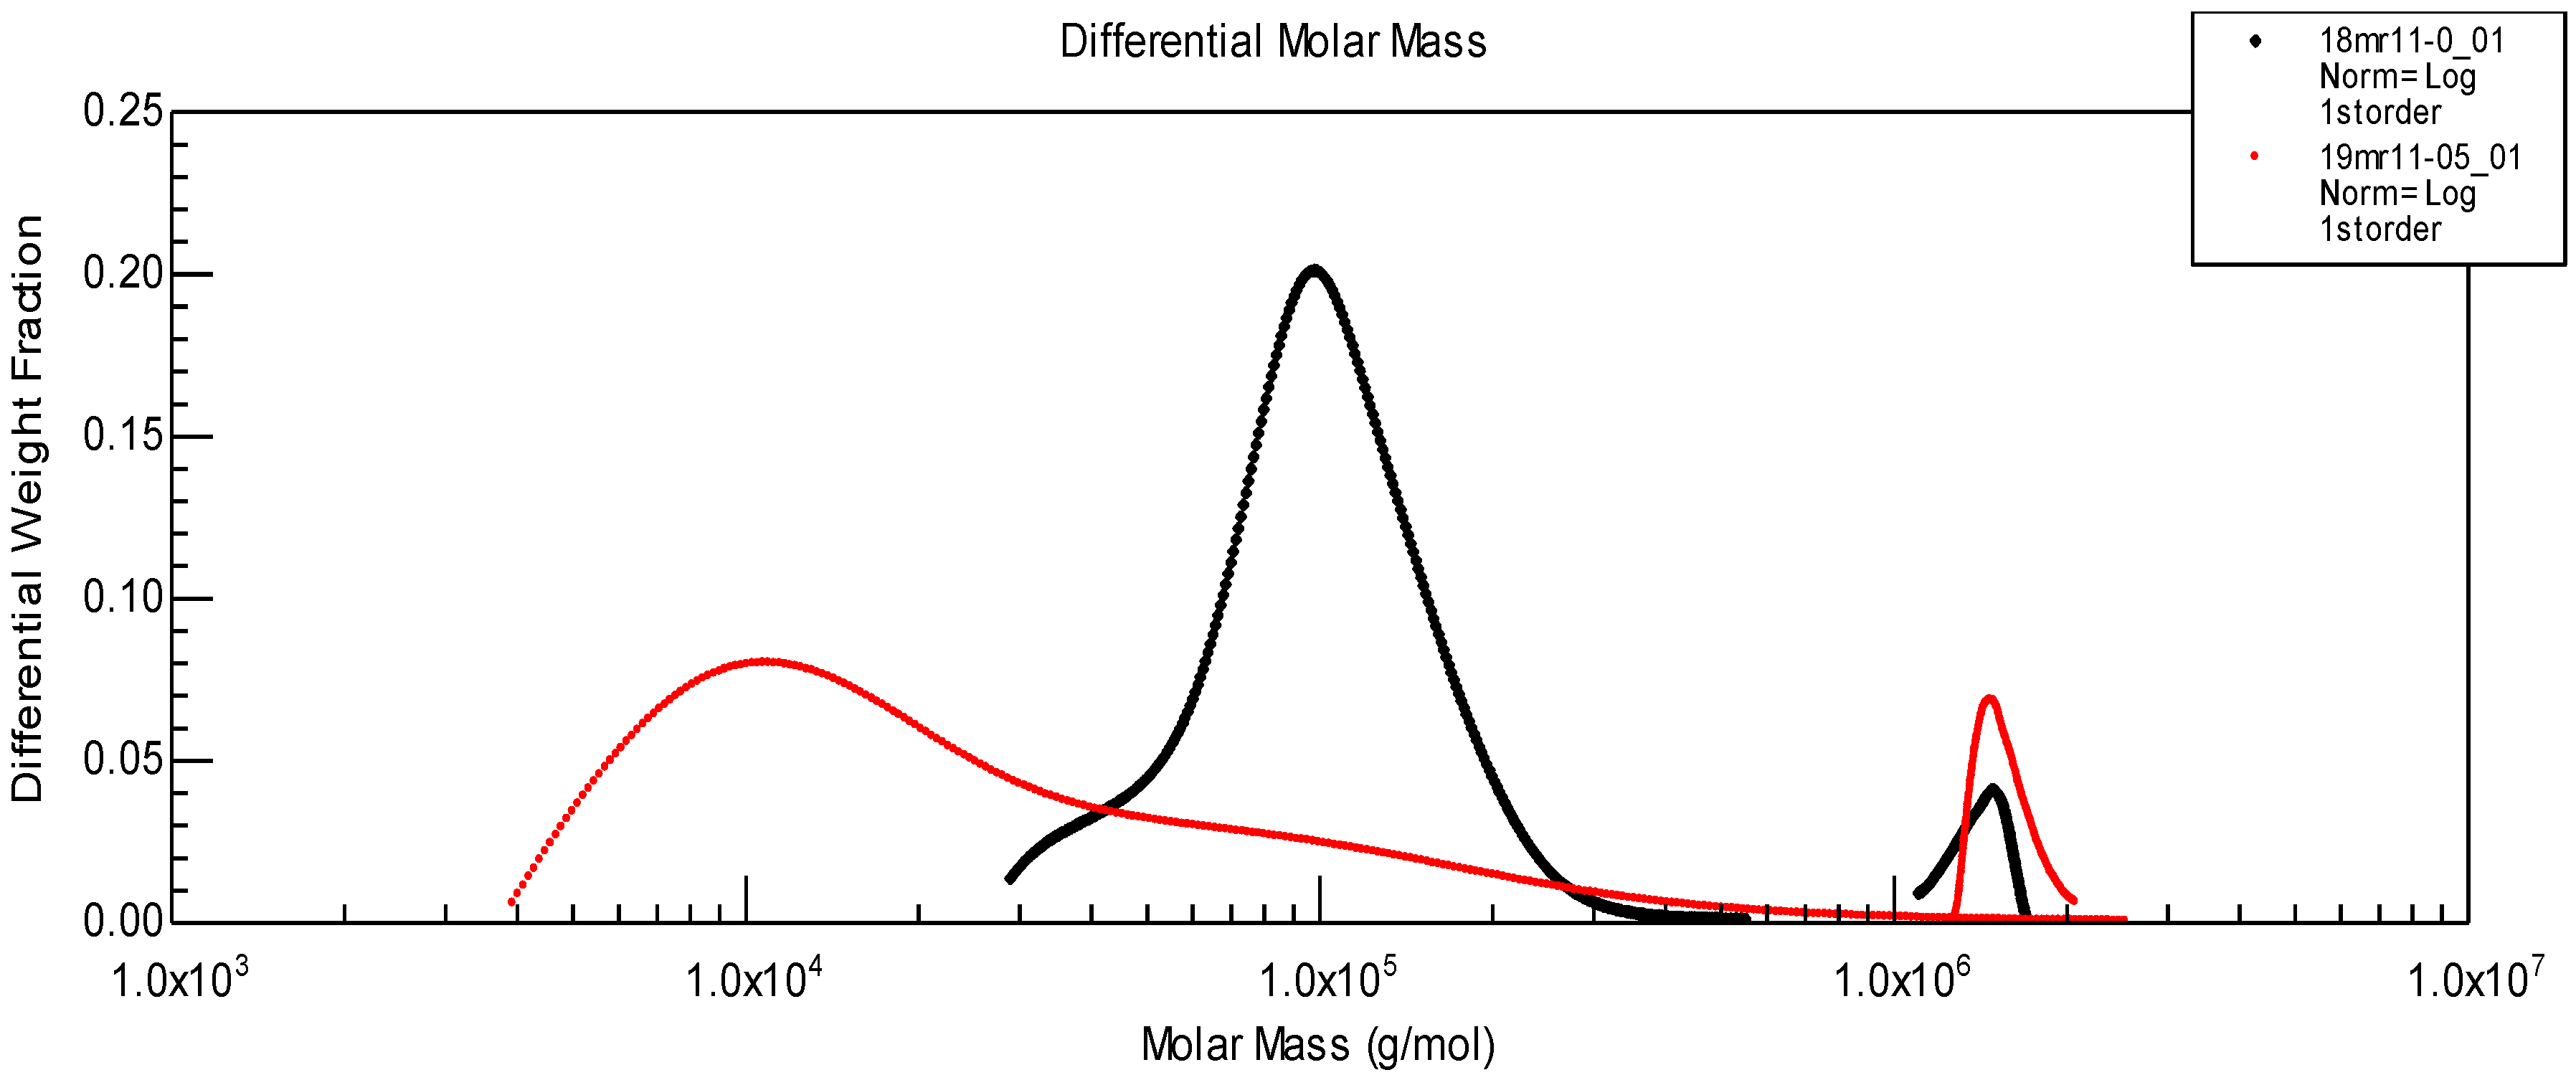
Figure 10, the molecular weight distribution for the two components of SF given in
Figure 9 B is shown. After enzymatic treatment, the initial protein peak (corresponding to Mw~100,000) is shifted to a much lower molecular weight due to partial hydrolysis. However HA molecular weight distribution remains located at the same position.
Figure 10.
Molecular weight distribution of proteins and HA before (black) and after (red) protease treatment, corresponding to chromatograms shown in
Figure 9B.
Figure 10.
Molecular weight distribution of proteins and HA before (black) and after (red) protease treatment, corresponding to chromatograms shown in
Figure 9B.


