pH and Redox Induced Color Changes in Protein Crystals Suffused with Dyes

Molecular Biology and Biochemistry, University of California Irvine, McGaugh Hall, Irvine, CA 92697-3900, USA
Crystals 2019, 9(3), 126; https://doi.org/10.3390/cryst9030126
Submission received: 21 January 2019
/
Revised: 19 February 2019
/
Accepted: 23 February 2019
/
Published: 1 March 2019
(This article belongs to the Special Issue Biological Crystallization)
Abstract
:Protein crystals, otherwise usually colorless, can be stained a variety of hues by saturating them with dyes, by diffusion from the mother liquor or co-crystallization. The colors assumed by dyes are a function of chemical factors, particularly pH and redox potential. Protein crystals saturated with a pH sensitive dye, initially at one pH, can be exposed to the mother liquor at a second pH and the crystal will change color over time as H3O+ ions diffuse through the crystal. This allows diffusion rates of H3O+ through the crystal to be measured. Diffusion fronts are often clearly delineated. Similar experiments can be carried out with redox sensitive dyes by adding reductants, such as ascorbic acid or dithionite, or oxidants such as H2O2, to the crystal’s mother liquor. Presented here are a number of experiments using pH or redox sensitive dye-saturated protein crystals, and some experiments using double dye, sequential redox–pH changes.
1. Introduction
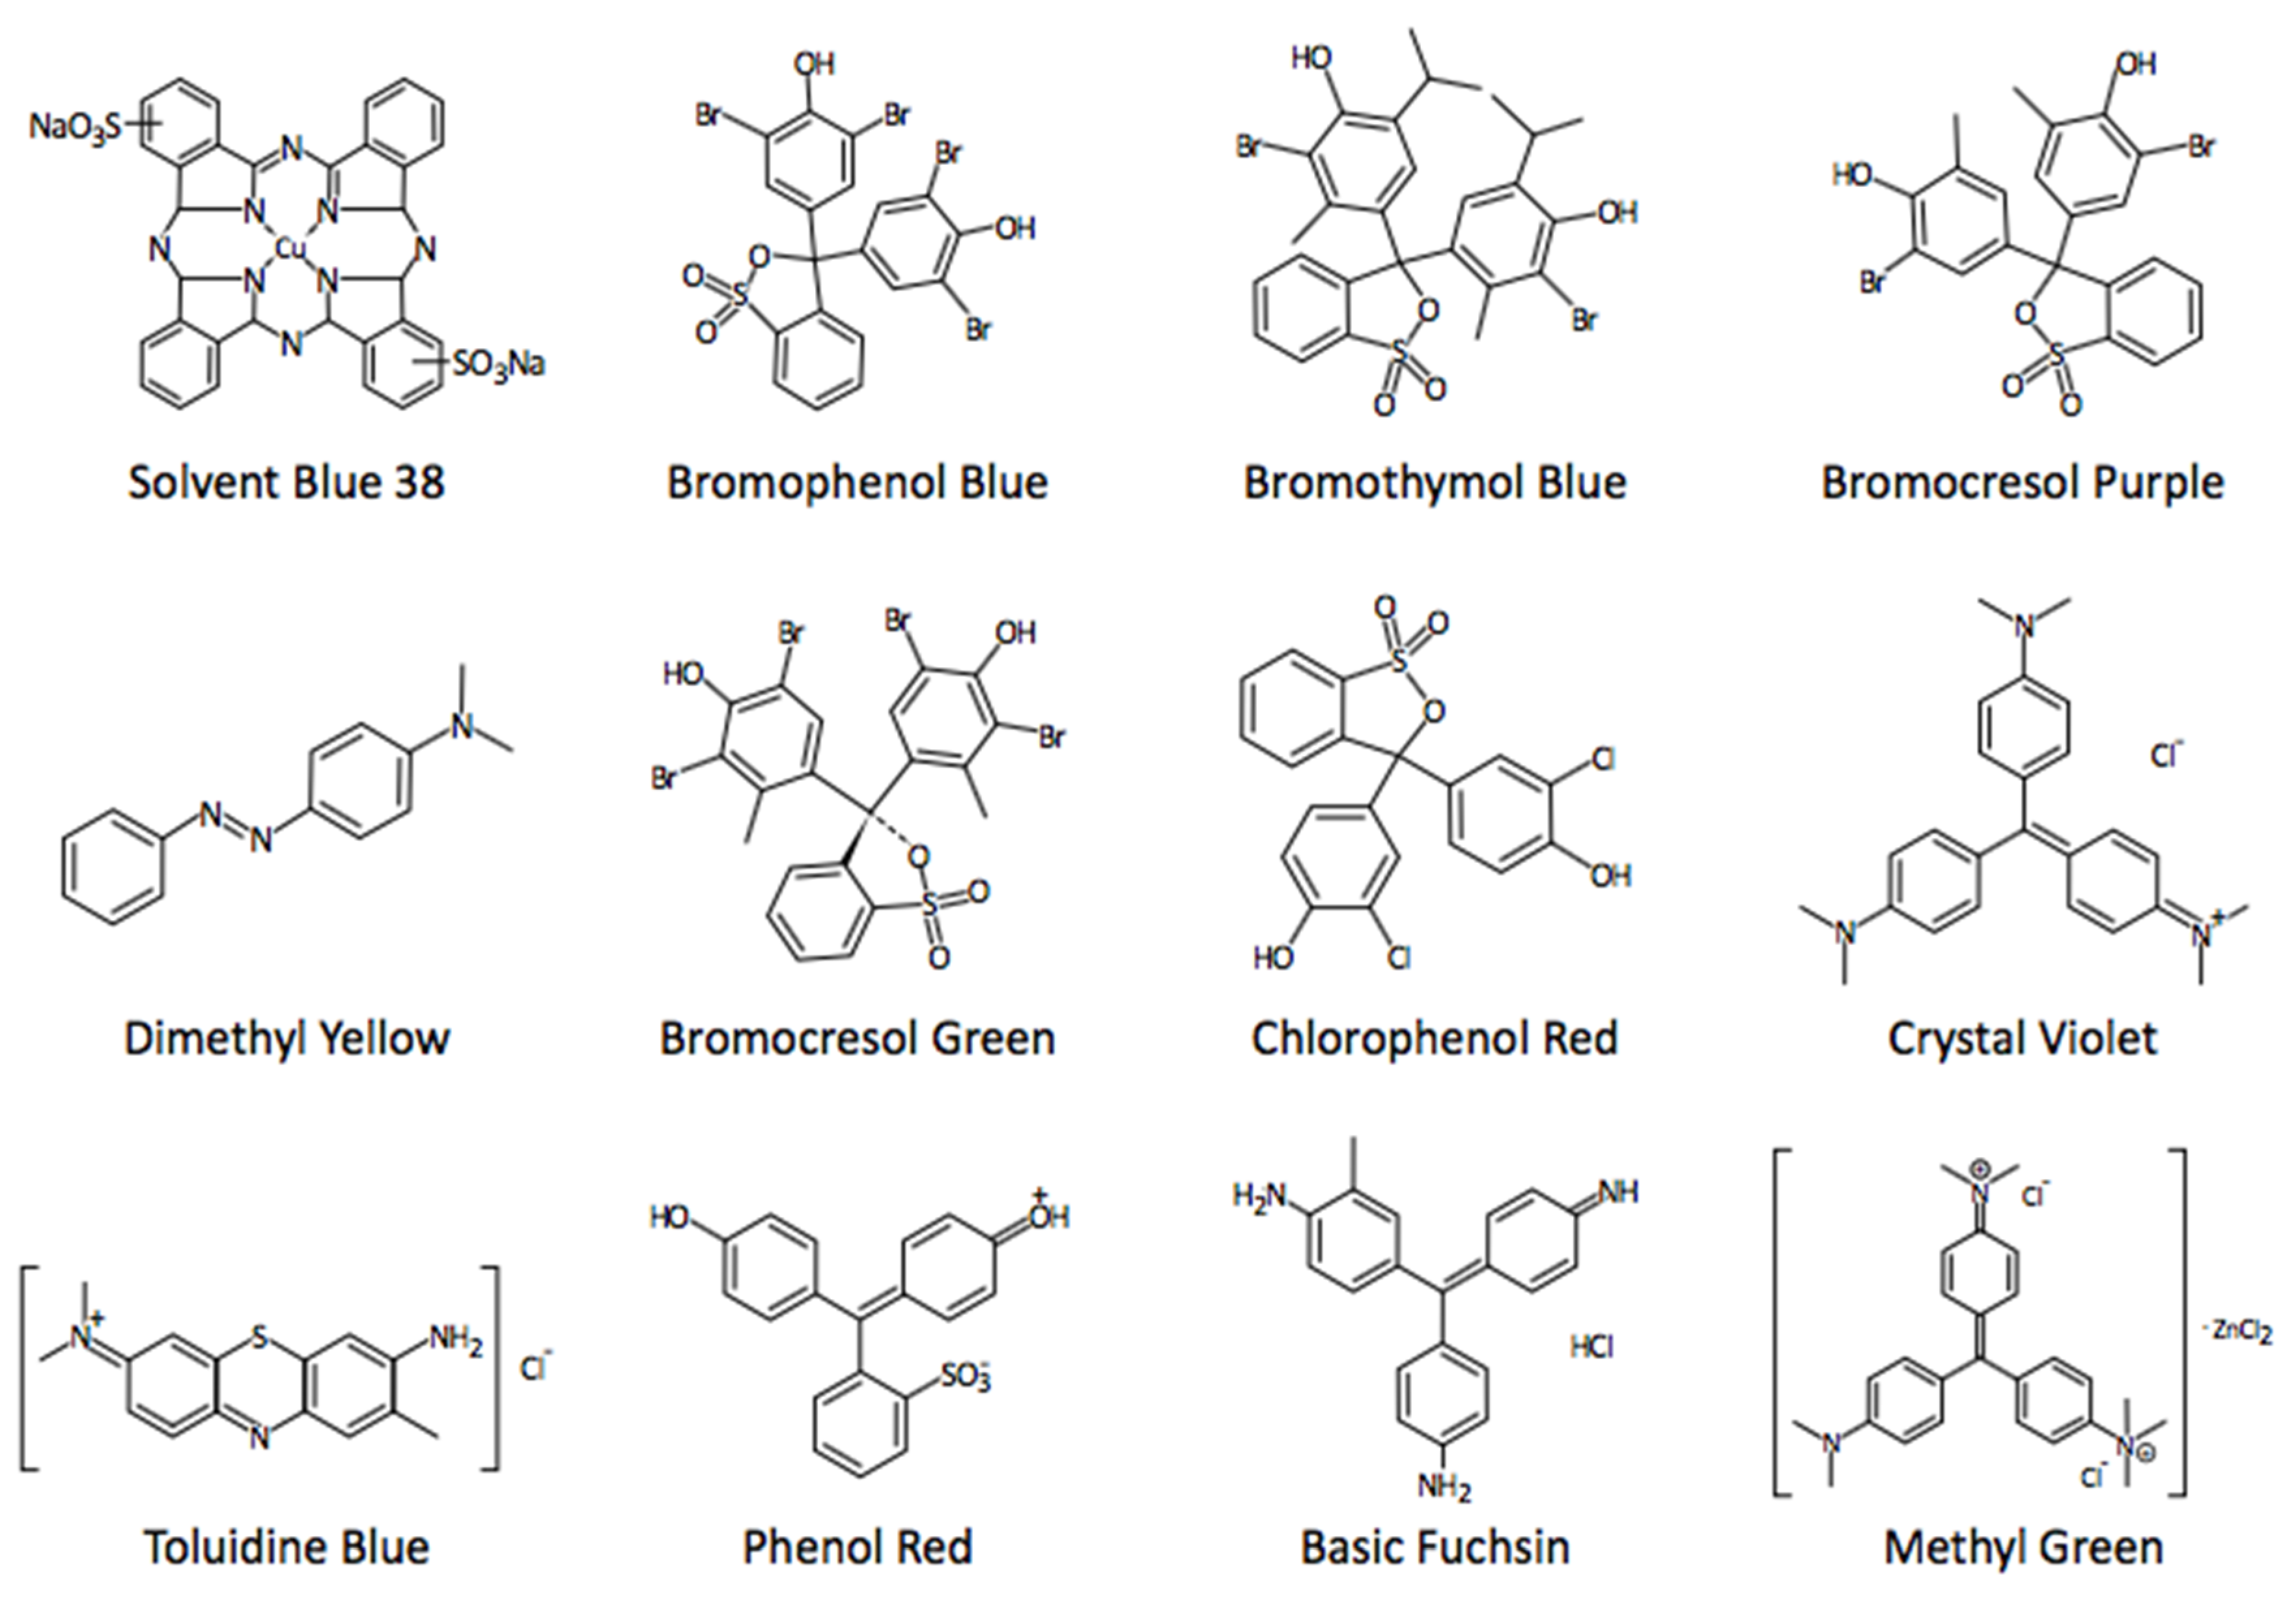
In the course of investigations on the diffusion of dyes and stains into protein crystals, and their subsequent, frequent incorporation [1,2], it was noted that a number of the dyes were sensitive to pH and dramatically changed color as a consequence of proton acquisition or release from their peripheral ionizable groups. These dyes are examples of the pH indicator dyes that have been in use for well over two hundred years by chemists, histologists, and biochemists [3,4,5,6,7,8]. The dyes have an aromatic, conjugated core that serves as a chromophore and attached, solubilizing ionizable groups that are generally amines in the case of basic dyes, or sulfonates in the case of acidic dyes. Some examples are shown in Figure 1.
Other dyes are sensitive to reduction and oxidation [9], and are generally brightly colored when oxidized, but colorless when reduced. In both pH and redox induced color change, the reactions are fully reversible.
Protein crystals can be saturated with a sensitive dye at a specific pH, the pH of its mother liquor, and the mother liquor then replaced with an equivalent at another pH. If the second pH is on the opposite side of a color transition point from the pH of the initial mother liquor, then the crystal changes color. Over time, the entire crystal, from outside to inside, transforms from its initial color to an alternate color. Because the reaction is reversible, replacement of the second mother liquor with that at the original pH causes the color change to proceed in the opposite direction. Multiple cycles of change of a protein crystal between two colors can thereby be realized. The pH sensitive dyes employed in these experiments, their colors, and the pH transition points for their color change are presented in Table 1.
Measuring color transitions of pH sensitive dye-saturated protein crystals as a function of time serves as an indicator of the rates of diffusion of protons (H3O+ ions) into and out of the crystals. Furthermore, because pH is defined as the negative log of the H3O+ concentration, by knowing the pH of the initial and alternate mother liquors, the H3O+ concentrations, inside the crystal and in the surrounding mother liquor are known precisely.
Similar opportunities exist using redox sensitive dyes. A protein crystal can be saturated with such a dye (usually it is green or blue). Addition of an appropriate reductant will cause the dye to lose color and the crystal will become clear. The redox sensitive dyes used in these experiments, along with an appropriate reductant for that dye, are presented in Table 2. Oxygen, present in the environment, including the mother liquor, eventually enters the crystal and re-oxidizes the dye and the original color of the crystal returns. In the experiments described here, the diffusion of a reductant or oxidant into crystals was visualized for various protein crystal/reducing agent combinations.
2. Materials and Methods
Dyes, their pH transition points, and their colors are listed in Table 1, and redox sensitive dyes and the reductants used in conjunction are shown in Table 2. The crystallization conditions for the proteins on which the experiments were based, along with their unit cell parameters and solvent contents are detailed elsewhere [2]. In general, to provide good observation and recording by photography, it was necessary to use large protein crystals [10,11,12,13]. Thus, the crystals studied had dimensions in the range of 0.5 mm to 1.5 mm, or greater edge lengths. Crystals were grown by vapor diffusion [12,13] in sitting drop Cryschem plates with drop sizes of 8 to 12 µL and reservoirs of 0.6 mL. Crystallization was carried out at room temperature, although some crystallization plates were moved to 4 °C to better preserve grown crystals. The mother liquors of canavalin crystals [14,15,16] were made 15% in 2-methyl 2,4 pentanediol (MPD) after crystals were fully grown, as canavalin crystals, both rhombohedral and orthorhombic modifications [14,15,16], will otherwise spontaneously degrade over a week’s time following their appearance.
Lysozyme in the tetragonal form [17] can be reproducibly grown at a pH between 4.0 and 7.5, canavalin between about pH 5.0 and 7.5 [14,15,16], and thaumatin [18] between pH 6.0 and 8.0. Although crystals of trypsin, inhibited with benzamidine [19], are usually grown at pH 8.5, they can be transferred to mother liquors at pH 6.0 and even below, without damage. Satellite tobacco mosaic virus (STMV) crystals [20] are stable between pH 4 and 7.5, and concanavalin A and concanavalin B crystals [21,22] between pH 6 and 8. ß-lactoglobulin [23] was grown at pH 3.2 for which bromophenol blue was the only useful dye. Crystals of RNase S were grown as described by Wyckoff et al. [24]. Other dyes in the low pH range that might have been used (e.g. dimethyl yellow) were almost insoluble in water. Some dyes that might appear useful were not, because they were insoluble in concentrated salt (NaCl, (NH4)2SO4, etc.) solutions that were used in some crystallizations.
Manipulation of mother liquors in droplets was carried out under a zoom lens dissecting microscope using gel loading tips on 10 µL pipetmen. If necessary, residual mother liquor was drawn off using paper wicks (Hampton Research, Aliso Viejo, CA, USA). Manipulation of crystals was carried out using cryo-mounting tips of 100 µm to 600 µm diameter from MitiGen (Ithaca, NY, USA). Observation of diffusion experiments [2] was with an SZX12 Olympus zoom microscope with a camera adaptor (Olympus Co., Tokyo, Japan). The camera was a Canon EOS digital model. Photos were made with the night–no flash setting. Generally, at timed intervals, pairs of photos were recorded at high and low magnification.
Experiments designed to record the rates of color change in crystals generally proceeded in the following way: Protein crystals were saturated with a pH or redox sensitive dye, or both, in situ, by adding a concentrated dye dissolved in the crystal’s mother liquor (minus protein). Diffusion of the dye was allowed to continue for at least 48 h or more, as this was necessary in those cases where the dye interacted strongly and positively with the protein comprising the crystals [1,2]. In experiments where multiple dyes (i.e. both pH sensitive dyes and redox sensitive dyes) were investigated sequentially, the crystals were first saturated with the pH sensitive dye and then with the redox sensitive dye. The crystals, upon saturation, exhibited a color appropriate to the dye at the pH of the mother liquor, which would be on one side or the other of the pH transition point. The crystal was first washed with the mother liquor (generally taken from the sitting drop reservoir) to remove extraneous dye from the surroundings. The mother liquor was then replaced with equivalent mother liquor but at a pH on the opposite side of the pH transition point. This meant that the pH of the solvent and the dye inside the crystal was at the growth pH, but that of the new mother liquor was at a pH on the other side of the dye’s pH transition point.
Depending on the direction of pH change, H3O+ ions either diffused into the crystals (high pH to low pH), or out of the crystals (low pH to high pH). As the pH in a crystal changed, the pH sensitive dye changed color. The progress of H3O+ diffusion, therefore, could be followed by recording the color change within the crystal as a function of time. pH is the negative log of the H3O+ ion concentration, so that by knowing the initial pH and the replacement pH, the H3O+ concentration difference between the inside and outside of a crystal was known.
For experiments with reduction and oxidation, the crystals were saturated with a redox sensitive dye [9] from Table 2 by exposing the crystals to the dye for at least 48 h. Addition of either a reducing compound dissolved in the mother liquor of the crystal (minus protein) to the existing mother liquor, or direct addition of the solid compound to the mother liquor was made. Generally, it was necessary to add a substantial amount of the reducing agent because of competition by oxygen in the system. It was not necessary to remove excess redox sensitive dye from the mother liquor as that was immediately reduced to colorless upon addition of the reducing agent. Fortunately, and perhaps significantly, protein crystals could be exposed to remarkably high concentrations of reducing agents without visible damage.
In experiments where pH and redox dyes were sequentially diffused into crystals to saturation with both, the experiment proceeded by first adding the reducing agent. This caused the color of the redox dye to be lost and as a consequence reveal the color of the pH indicator dye. The pH was then jumped, as described above, and the crystal then observed to transition to the alternate color. In experiments involving reduction of a dye in a crystal, initially the concentration of the reductant in the crystal was zero. Thus, the difference in reductant concentration inside and outside the crystal upon addition of reductant was simply that of the mother liquor after addition.
A caution is advised to others carrying out experiments similar to these. Dyes will occasionally adhere to or accumulate on the surfaces of protein crystals, but not actually penetrate into their interiors. These occurrences are usually apparent on close microscopic inspection, but can nonetheless cause confusion if ignored. Another point to note is that crystals occasionally develop visible cracks and fissures or other significant damage as a consequence of physical manipulation or due to pH or chemical changes to their mother liquors. It might be expected that the faults and defects would provide expedited entry of dyes or ions into crystals. This should be evident by more intense color changes at the defects and cracks. This was not, in general, observed to be the case. Entry through fissures and cracks does not appear to be accelerated beyond the diffusion otherwise prevailing.
3. Results
It is not reasonable to present all of the experiments that were carried out, but a sampling should here be sufficient.
In Figure 2 through 6 are found representative samples of the pH change experiments for a variety of protein crystals. Figure 2 shows thaumatin crystals plus bromophenol blue, Figure 3 is thaumatin crystals plus bromothymol blue, and Figure 4 is lysozyme crystals plus m-cresol purple.
Figure 5 shows lysozyme crystals plus bromothymol green and Figure 6 shows crystals of the virus STMV, plus m-cresol purple.
Upon pH transformation, the change in color due to dye transition, as H3O+ either entered or exited the crystals, appeared immediately at the crystal faces and rapidly proceeded inwards toward the crystal center, generally by isometric approach. The diffusion front was usually clearly evident, particularly when the color contrast was large, as for yellow to blue (or vice versa) transitions. Those between red and blue, for example, were often less evident. Diffusion was initially swift at the edges and faces of the crystals, but slowed appreciably as the diffusion front approached the crystal center. As diffusion proceeded, a core of color, visible at the crystal center, gradually dissipated and disappeared. This was illustrated particularly well by the examples of the tetragonal thaumatin crystals in Figure 2 and Figure 3 stained with bromophenol blue and bromothymol blue, respectively.
The total time required for a crystal to completely transition between the initial and replacement pH colors depended to some extent on the protein crystal, its size, and the magnitude of the pH change. For the large crystals used in these experiments, however, the times were noted to be remarkably similar; between 25 and 35 min for pH jumps of, for example pH 8 to pH 6 (10−8 mol/L [H3O+] to 10−6 mol/L [H3O+]). If the distances from the edges of the crystals to the center were on the order of 0.25 to 0.50 mm, as they were for most of these experiments, then this represents a diffusion rate in the range of 500 to 1000 µm per hour, or about 8 to 16 µm per minute.
As H3O+ is likely the fastest of any ion or molecule diffusing through a protein crystal, then 1000 µm per hour for a two-log difference in concentration inside to outside of the crystal is probably an upper limit for the diffusion of any ion or molecule into a protein crystal. This, it must be emphasized, is for a two-log difference. If, for example, mother liquor is made 10 mM in some compound that is initially absent in a crystal, then the gradient of concentration is appreciably greater. As demonstrated by the redox experiments below, when concentration differences are of that order, diffusion rates substantially exceed those seen for the pH experiments.
Color transitions of dyes are completely reversible when the dye is inside the protein crystal. Using crystals that were particularly stable to dramatic pH change, such as thaumatin and trypsin, it was possible to put a protein crystal-dye complex through multiple cycles of pH and color transition by successive changes of the pH of the mother liquor. This was illustrated in Figure 6 by the satellite tobacco mosaic virus (STMV) crystals. Apparent in many sequences is that the movement of a pH front through a crystal, whether from high to low, or vice versa, is the same in appearance. Absent precise quantitation, it is not, however, certain if the movement of pH fronts, rates of transition from high to low, and low to high pH, are identical.
Table 2 lists a set of dyes that are sensitive to reduction and oxidation, and they include basic fuchsin, methyl green, toluidine blue and methyl blue. Luxol blue, or solvent blue 38, is particularly interesting as it is a soluble porphyrin with a copper atom in the oxidized plus two state that gives the dye its blue color. The dyes are not equally sensitive to the various reducing agents, and in Table 2 are given the appropriate reducing compounds for their transition. Methylene blue, for example, was reduced only by ascorbic acid (vitamin C), while basic fuchsin and methyl green with bisulfite, and crystal violet by dithionite, the latter the most powerful of the reductants.
Experiments with redox sensitive dyes were carried out the same way as for those involving pH change. The protein crystals were first saturated with dye, and reductant was then added to the mother liquor. A noteworthy feature of these experiments was that the reductants, even at quite high concentrations, seemed to inflict no damage on the crystals. This was in contradistinction to jumps in pH that occasionally caused cracking or other damage.
Two, somewhat different kinds of results were recorded in the redox experiments, though they reflect the same chemical process. In the examples shown in Figure 7 and Figure 8 are lysozyme crystals with methyl green and crystal violet, respectively. The color changes as the reductants, bisulfite and dithionite, respectively, diffused into the crystals exhibited a distinct front that progressed from the exterior faces to the center of the crystal, much as the H3O+ diffusion fronts in pH experiments did. In some other experiments, however, basic fuchsin or methylene blue infused crystals for example, there was no sharp diffusion front. The crystals simply changed in a more uniform manner from colored to clear simultaneously throughout their volume. An explanation for this latter result may be that the rate of change in color for some of the dyes is slow and comparable to the diffusion rate, or even slower. In that case, the observed result might be expected.
As with pH changes in crystals, transitions between oxidized and reduced states are reversible. Addition of a low concentration of an oxidizing agent such as H2O2 immediately re-oxidizes the dyes. It was usually not necessary to add any oxidant to reverse the chemical process, however, as this was accomplished by oxygen absorbed into the mother liquor from the air around it. This process of re-oxidation by ambient oxygen was reasonably slow and could be recorded as color returned to crystals.
The rates of change to the redox state of the various dyes were diverse, as the reductants were of different strengths, or chemical activities, and controlling their concentration in mother liquors was technically problematic. Nonetheless, for concentrations of bisulfite in the 10 mM range, reduction of methyl green, for example, was complete throughout a protein crystal in about 10 to 15 min. For crystals saturated with methylene blue, ascorbic acid concentrations of about 40 mM were necessary to achieve the same range of rates. With dyes susceptible to reduction by dithionite, exterior concentrations of the reductant were on the order of 100 mM and complete color conversion was complete in 2 min or less.
In the redox experiments, where a diffusion front was clearly visible and its progress measurable, it was again observed (as in the pH experiments) that the diffusion front initially moved rapidly in from the faces but slowed appreciably as it approached the crystal center. Thus, 80% of a crystal might transition in the first 40% of the total time, while the final 20% of the dye at the center required the last 60%. As already noted, spontaneous reversion to the oxidized state began soon after complete reduction, and in some experiments even before full reduction had completed. Usually, however, re-oxidation by ambient oxygen was graciously slow and required 15 to 20 min. Although no attempt was made to quantitate it, the rates of re-oxidation by ambient oxygen could provide a measure of the rates of diffusion of oxygen through a protein crystal.
Luxol blue, or solvent blue 38, is a sky-blue dye that was of particular interest. It would not enter lysozyme crystals at all, probably due to size or shape, but crystals of thaumatin and STMV were readily infused. The dye is a porphyrin that has two SO3− groups attached for solubility. It is redox sensitive because the Cu2+ ion at the porphyrin center can be reduced to elemental copper. In our experiments we used dithionite as the reductant, as others failed. This is a strong reductant that is difficult to control in the presence of oxygen. In these experiments grains of powdered dithionite were added directly to the mother liquor at the edge of the droplet as far as possible from the crystals. The grains of dithionite dissolved, and the dithionite then diffused rapidly across the drop before reaching the crystals. This is why in most images the crystals change color, not uniformly from all sides, but directionally as though reduction was passing as a wave through the crystal. The time for reduction of the Luxol blue dye in the crystals was about 1 to 3 min.
As shown in Figure 9 and Figure 10 for thaumatin crystals, when dithionite penetrated the Luxol blue-containing crystals and reduced the dye, the color of the crystals changed from sky blue to the color of a new penny. As with the other redox dyes, this reaction was also reversible and re-oxidation by ambient oxygen could be observed to occur over 5 to 10 min as the crystals were restored to their original color. Because of the ready reversibility of these redox reactions, and the stability of protein crystals in the presence of the reagents, multiple cycles, blue-copper-blue, could be generated with a single crystal.
Experiments were carried out with crystals of thaumatin, the most stable of the crystals, to investigate possibilities with double staining using two dyes. In these experiments the crystals were first saturated with a pH sensitive dye at a specific pH, and then exposed to a second redox sensitive dye. Crystals then assumed the color of the dye combination. If a pH dye that was yellow was followed by a blue redox dye, then the crystal would be green. If a blue dye was followed by a green dye, the crystal would be blue-green, etc. In the experiment shown in Figure 11, a thaumatin crystal was saturated with bromothymol blue at pH 6 (yellow), and then washed to remove exogenous stain. It was then suffused with methyl green (which is actually blue in color) to give the aquamarine crystals in Figure 11c top panel. Bisulfite was then added. This reduced the methyl green (blue color) to colorless revealing the bright yellow color of the pH dye, bromothymol blue in Figure 11o top panel. In the second series below, the pH was then raised in the mother liquor to pH 8.5 in Figure 11a bottom panel and the crystals can be seen to transition to the high pH blue color in Figure 11o bottom panel.
Aside from demonstrating the feasibility of multiple, successive chemical reactions within the confines of protein crystals, the experiments involving multiple dyes have a second implication. One dye saturating a protein crystal does not exclude another from entering and sharing the space. The dyes, therefore, are not necessarily competitive for a few select sites, but seem to find for themselves new available space.
4. Conclusions
The experiments described here involving protein crystals, dyes, and changes to chemical states can serve as systems for the precise measurement of the penetration of H3O+, redox effectors, and oxygen into and out of macromolecular crystals. With proper controls and the use of more sophisticated instruments, such as micro-spectrophotometers, rates of penetration could be determined quantitatively as a function of numerous parameters. These might include concentrations of dyes and diffusing species in the mother liquor, crystal solvent content, dye size or charge, and undoubtedly others. The work presented here yields only rough estimates, but they may be sufficient to at least put succeeding investigations in the “experimental ballpark” with regard to initial trials.
The chemical reactions that were here induced inside the channels and cavities of protein crystals represent only a small number of the many that might be carried out. They were chosen because they were readily visualized and recorded using a simple microscope and camera. Presumably, more interesting and challenging experiments could be designed or contrived that yield more information about the physical and chemical properties that characterize the interiors of macromolecular crystals.
Conflicts of Interest
The authors declare no conflict of interest.
References
- Larson, S.B.; McPherson, A. Investigation into the binding of dyes in protein crystals. Acta Crystallogr. F 2018, 74, 593–602. [Google Scholar]
- McPherson, A. Penetration of dyes into protein crystals. Acta Crystallogr. F 2019, 75, 132–140. [Google Scholar] [CrossRef] [PubMed]
- Horobin, R.W.; Kiernan, J.A. (Eds.) Conn’s Biological Stains: A Handbook of Dyes, Stains and Fluorchromes for Use in Biology and Medicine, 10th ed.; BIOS Scientific Publishers: Oxford, UK, 2002. [Google Scholar]
- Gurr, E. Synthetic Dyes; Academic Press: New York, NY, USA, 1971. [Google Scholar]
- Harris, D.C. Quantitative Chemical Analysis, 7th ed.; Freeman and Co.: New York, NY, USA, 2007. [Google Scholar]
- Skoog, D.A.; West, D.M.; Holler, F.J. Analytical Chemistry: An Introduction, 7th ed.; Emily Barrosse: Orlando, FL, USA, 2000; pp. 265–305. [Google Scholar]
- Yusuf, M.; Shabbir, M.; Mohammed, F. Natural Colorants; Historical, Processing and Sustainable Prospects. Nat. Prod. Bioprospects 2017, 7, 123–145. [Google Scholar] [CrossRef] [PubMed]
- Zumdahl, S.S. Chemical Principles, 6th ed.; Houghten-Mifflin Co.: Boston, MA, USA, 2009; pp. 319–324. [Google Scholar]
- Michaelis, L.; Eagle, H. Some Redox Indicators. J. Biol. Chem. 1930, 87, 713–727. [Google Scholar]
- McPherson, A.; Gavira, J.A. Introduction to Protein Crystallization. Acta Crystllogr. F 2014, 70, 2–20. [Google Scholar] [CrossRef] [PubMed]
- McPherson, A.; Cudney, B. Optimization of crystallization conditions for biological macromolecules. Acta Crystallogr. F 2014, 70, 1445–1467. [Google Scholar] [CrossRef] [PubMed] [Green Version]
- McPherson, A. Preparation and Analysis of Protein Crystals; John Wiley Co.: New York, NY, USA, 1982; p. 371. [Google Scholar]
- McPherson, A. Crystallization of Biological Macromolecules; Cold Spring Harbor Laboratory Press: Cold Spring Harbor, NY, USA, 1999; p. 586. [Google Scholar]
- McPherson, A.; Spencer, R. Preliminary structure analysis of canavalin from Jack bean. Arch. Biochem. Biophys. 1975, 169, 650–661. [Google Scholar] [CrossRef]
- Ko, T.-P.; Ng, J.D.; McPherson, A. The three dimensional structure of canavalin from jack bean. Plant Physiol. 1993, 101, 729–744. [Google Scholar] [CrossRef] [PubMed]
- Ko, T.-P.; Ng, J.D.; Day, J.; Greenwood, A.; McPherson, A. X-ray structure determination of three crystal forms of canavalin by molecular replacment. Acta Crystallogr. D 1993, 49, 478–489. [Google Scholar] [CrossRef] [PubMed]
- Alderton, G.; Fevold, H.L. Direct crystallization of lysozyme from egg white and some crystalline salts of lysozyme. J. Biol. Chem. 1946, 164, 1–8. [Google Scholar] [PubMed]
- Ko, T.-P.; Day, J.; Greenwood, A.; McPherson, A. The Structures of Three Crystal Forms of the Sweet Protein Thaumatin. Acta Crystallogr. D 1994, 50, 813–825. [Google Scholar] [CrossRef] [PubMed]
- McPherson, A.; Cudney, B. Searching for Silver Bullets: An Alternative Strategy for Crystallizing Macromolecules. J. Struct. Biol. 2006, 156, 387–406. [Google Scholar] [CrossRef] [PubMed]
- Koszelak, S.; Dodds, J.A.; McPherson, A. Preliminary analysis of crystals of satellite tobacco mosaic virus (STMV). J. Mol. Biol. 1989, 209, 323–326. [Google Scholar] [CrossRef]
- Sumner, J.B. The globulins of the jack bean, Canavalia Ensiformis. J. Biol. Chem. 1919, 37, 137–145. [Google Scholar]
- McPherson, A.; Geller, J.; Rich, A. Crystallographic studies on concanavalin B. Biochem. Biophys. Res. Commun. 1974, 57, 494–499. [Google Scholar] [CrossRef]
- Sawyer, L.; Kontopidis, G. The core lipocalin, bovine β-lactoglobulin. Biochem. Biophys. Acta 2000, 1482, 136–148. [Google Scholar] [CrossRef]
- Wyckoff, H.W.; Tsernoglou, D.; Hanson, A.W.; Knox, J.R.; Lee, B.; Richards, F.M. The three dimensional structure of RNase S: Interpretation of an electron density map at a nominal resolution of 2 A. J. Biol. Chem. 1970, 245, 305–325. [Google Scholar] [PubMed]
Figure 1.
The chemical structures of a selection of the pH and redox sensitive dyes used in the investigation.
Figure 1.
The chemical structures of a selection of the pH and redox sensitive dyes used in the investigation.

Figure 2.
A tetragonal crystal of thaumatin about 1 mm in length was stained to saturation over 48 h with the pH sensitive dye bromophenol blue. The crystal was initially at pH 8.25 so that its color was blue–green. The mother liquor was then removed and replaced with an equivalent mother liquor but at pH 6.5. As H3O+ ions diffused into the crystal, the incorporated bromophenol blue dye transformed chemically and yielded a yellow color. The change of color shows a clear leading edge and the rate of penetration of the yellow color provides a measure of the diffusion of H3O+ ions into the crystal. The total time required for complete color transformation was about 30 to 40 min. The series of images (a–i), taken at appropriate time intervals, shows the progress of the dye.

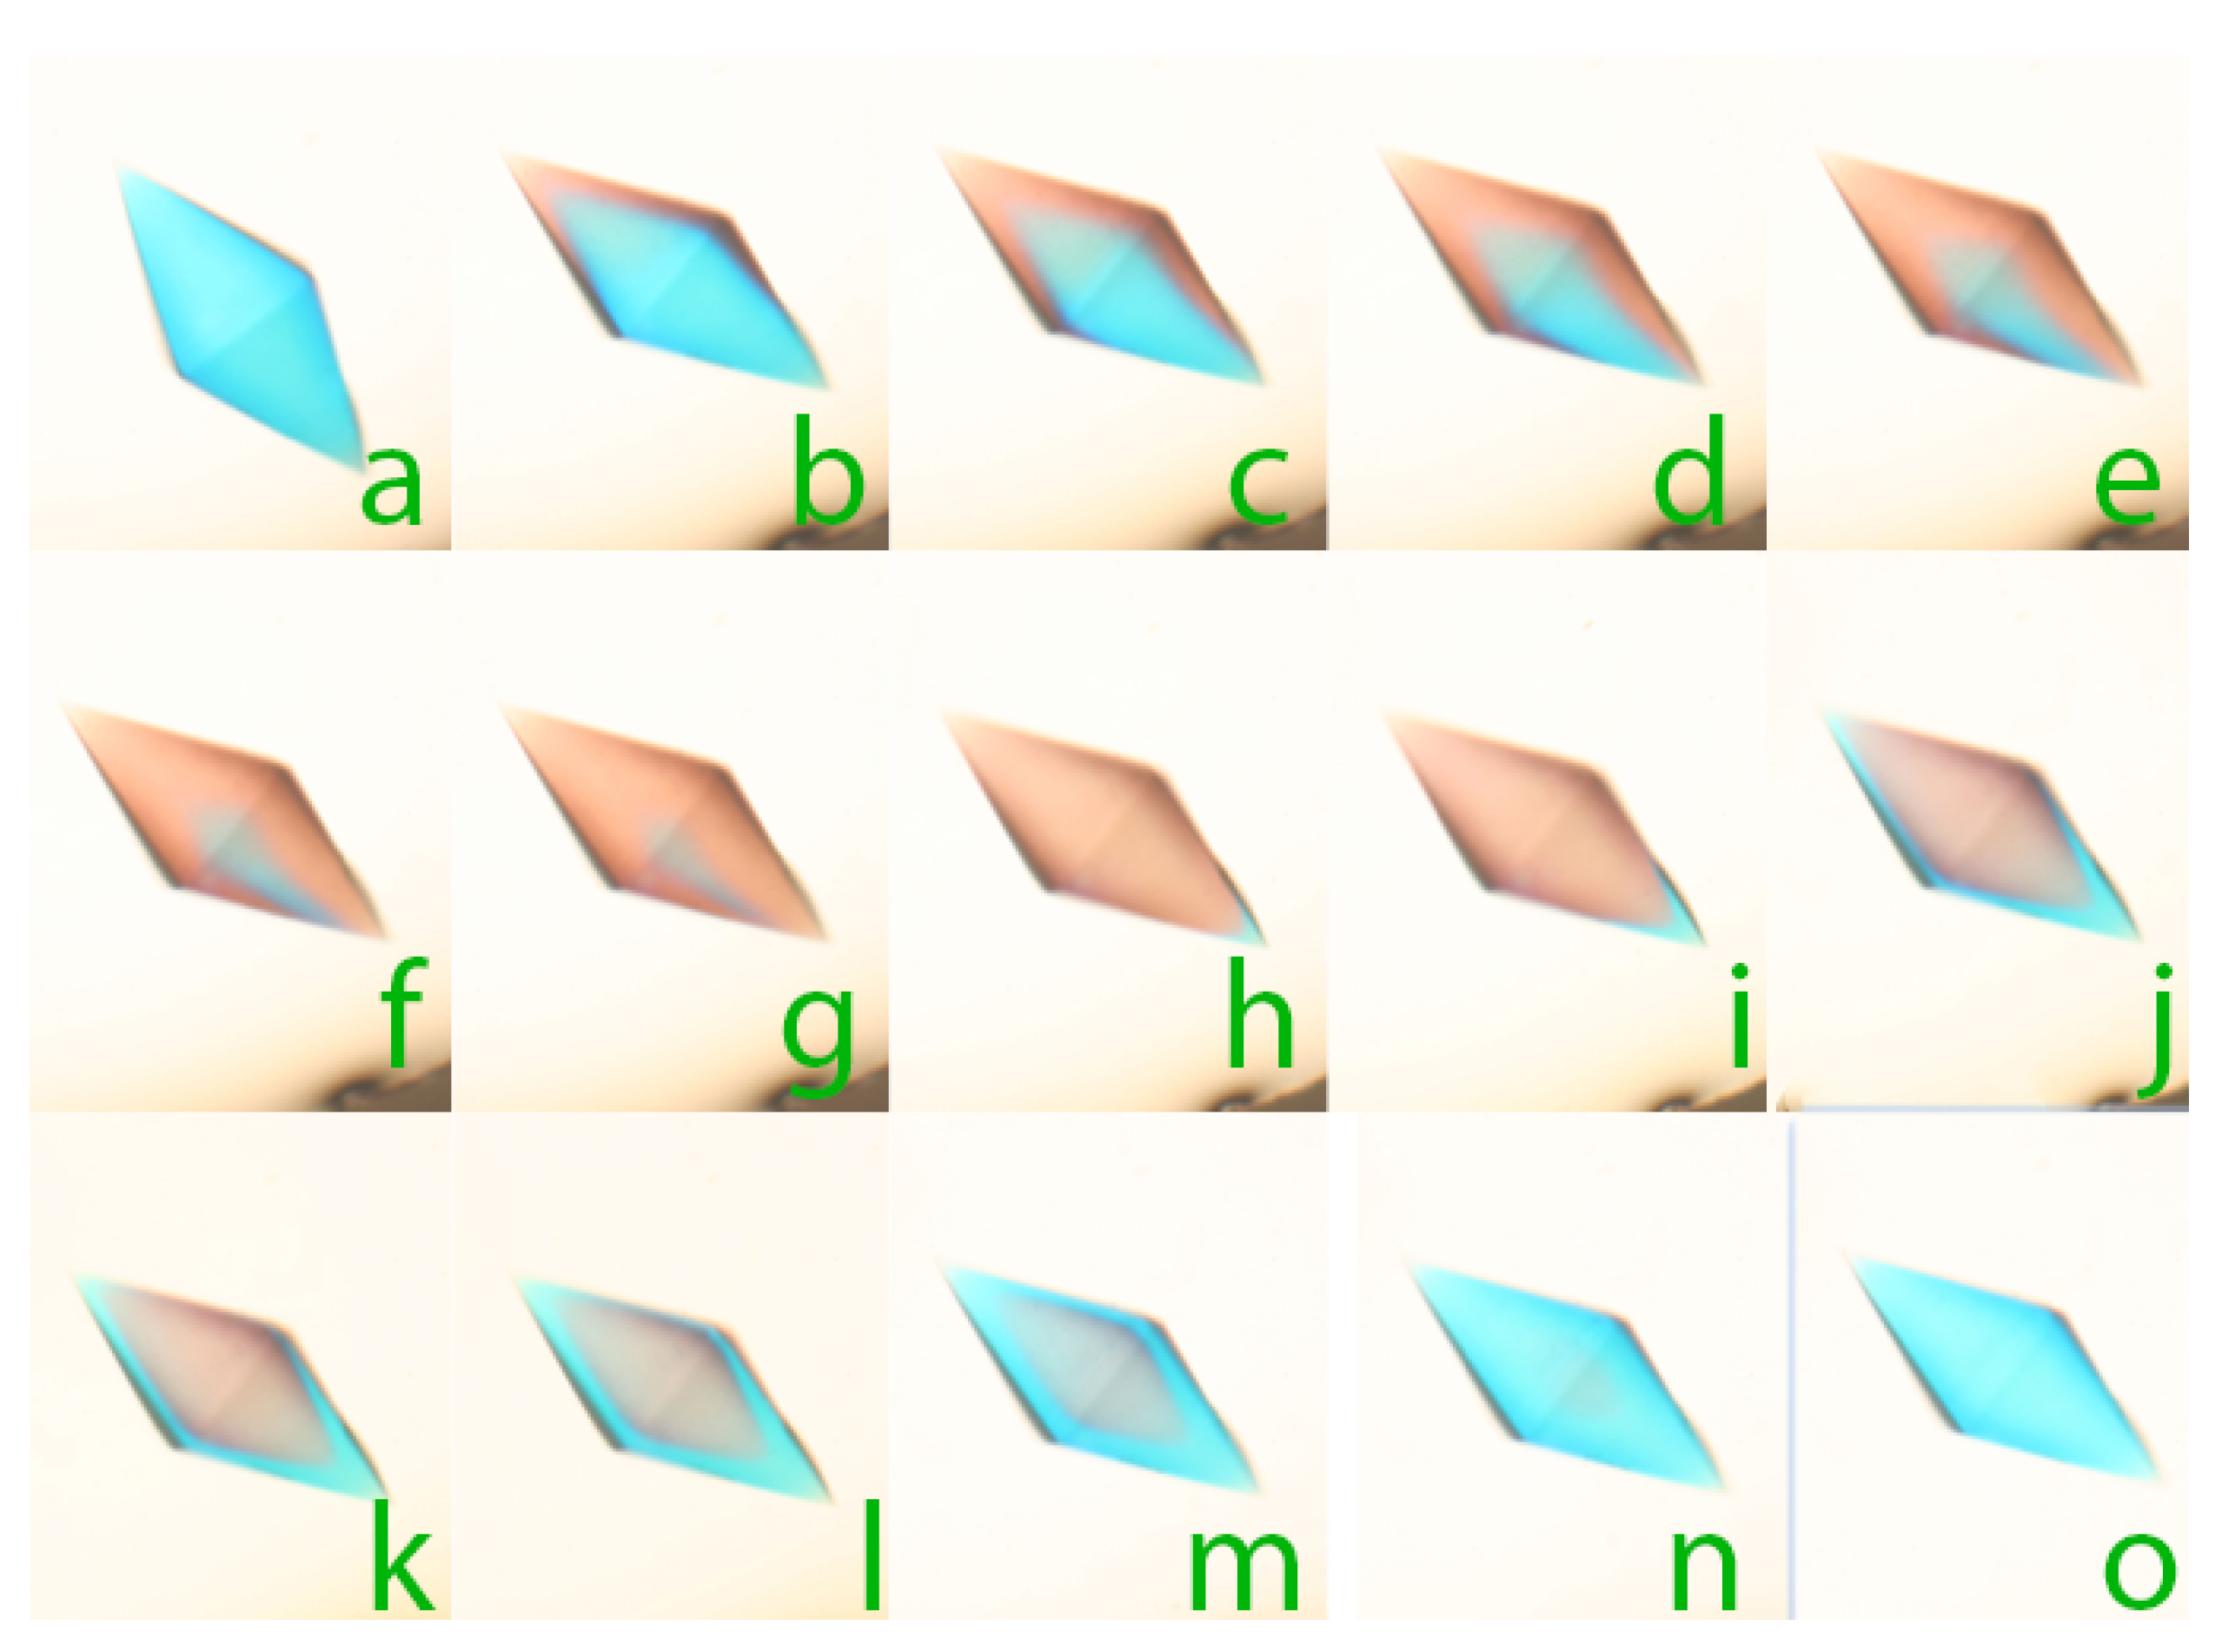
Figure 3.
Tetragonal crystals of thaumatin, the larger about 1 mm in length, were stained to saturation over 48 h with the pH sensitive dye bromothymol blue. The crystal was initially at pH 8.25. The mother liquor was then removed and replaced with equivalent mother liquor but at pH 6.5. As H3O+ ions diffused into the crystal, the incorporated bromothymol blue dye transformed chemically and yielded a yellow color. The change of color again shows a clear leading edge. The total time required for complete color transformation was about 35 min. The series of images (a–o), taken at appropriate time intervals, shows the progress of the dye.

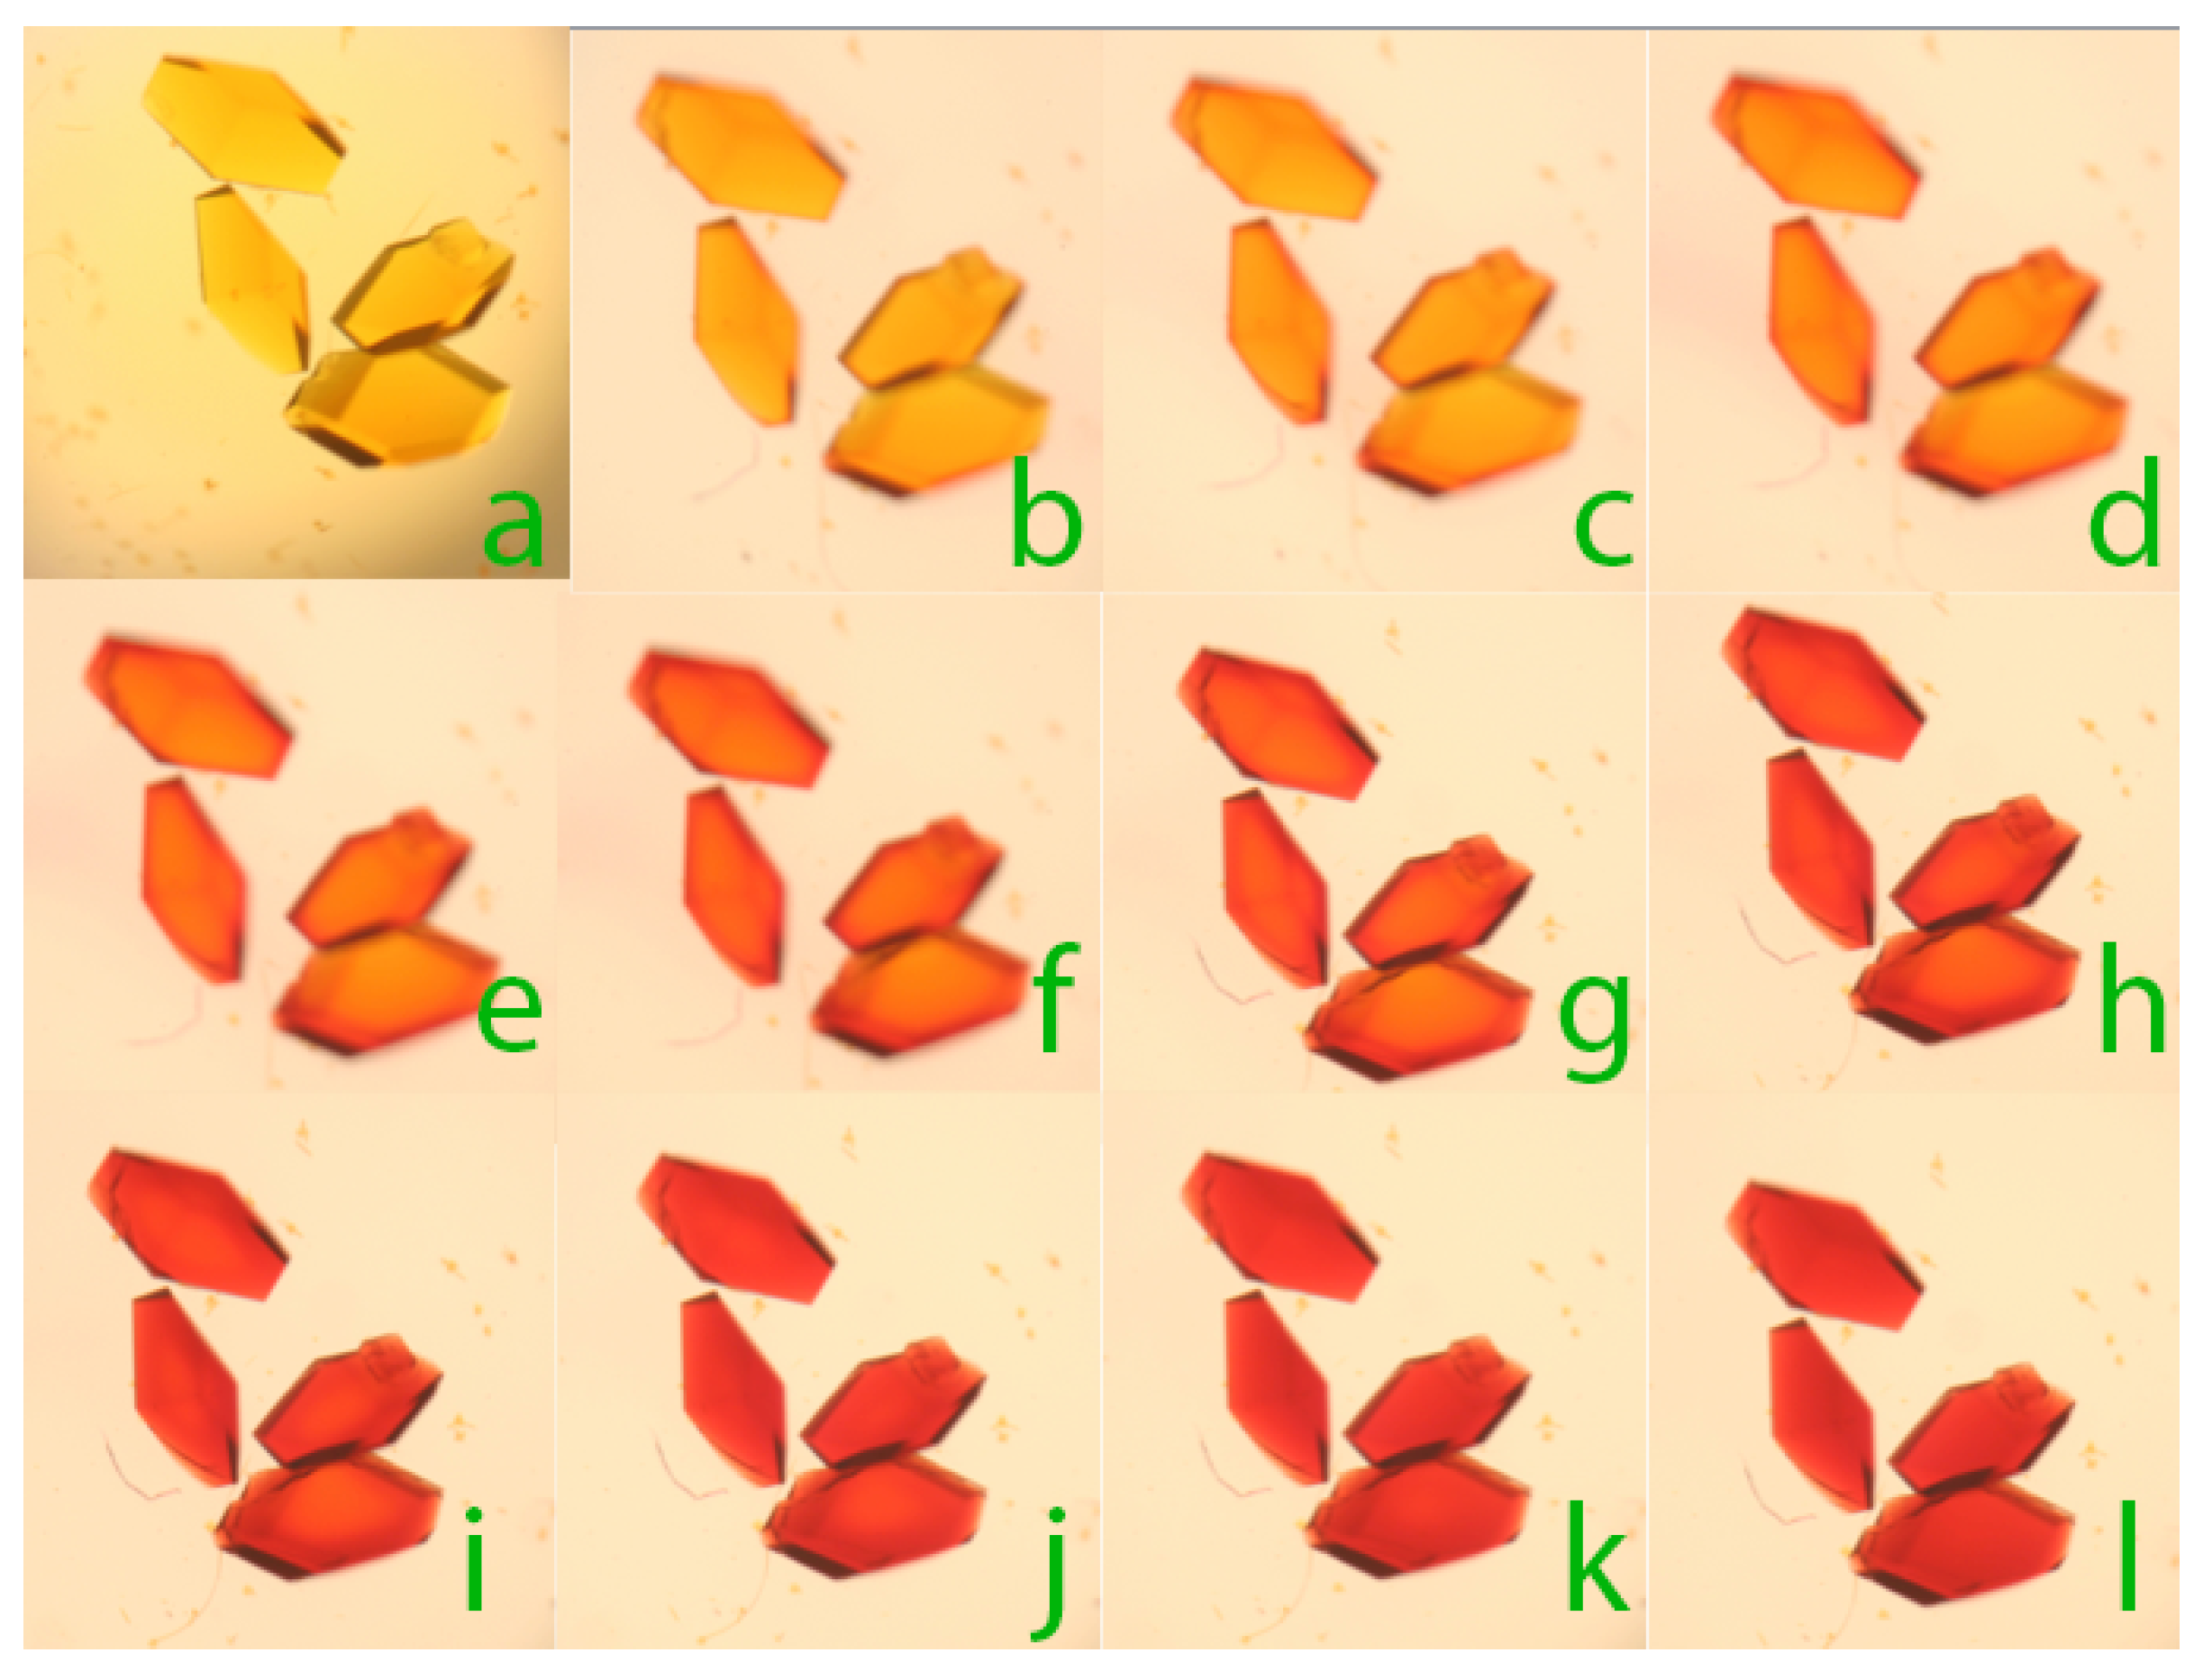
Figure 4.
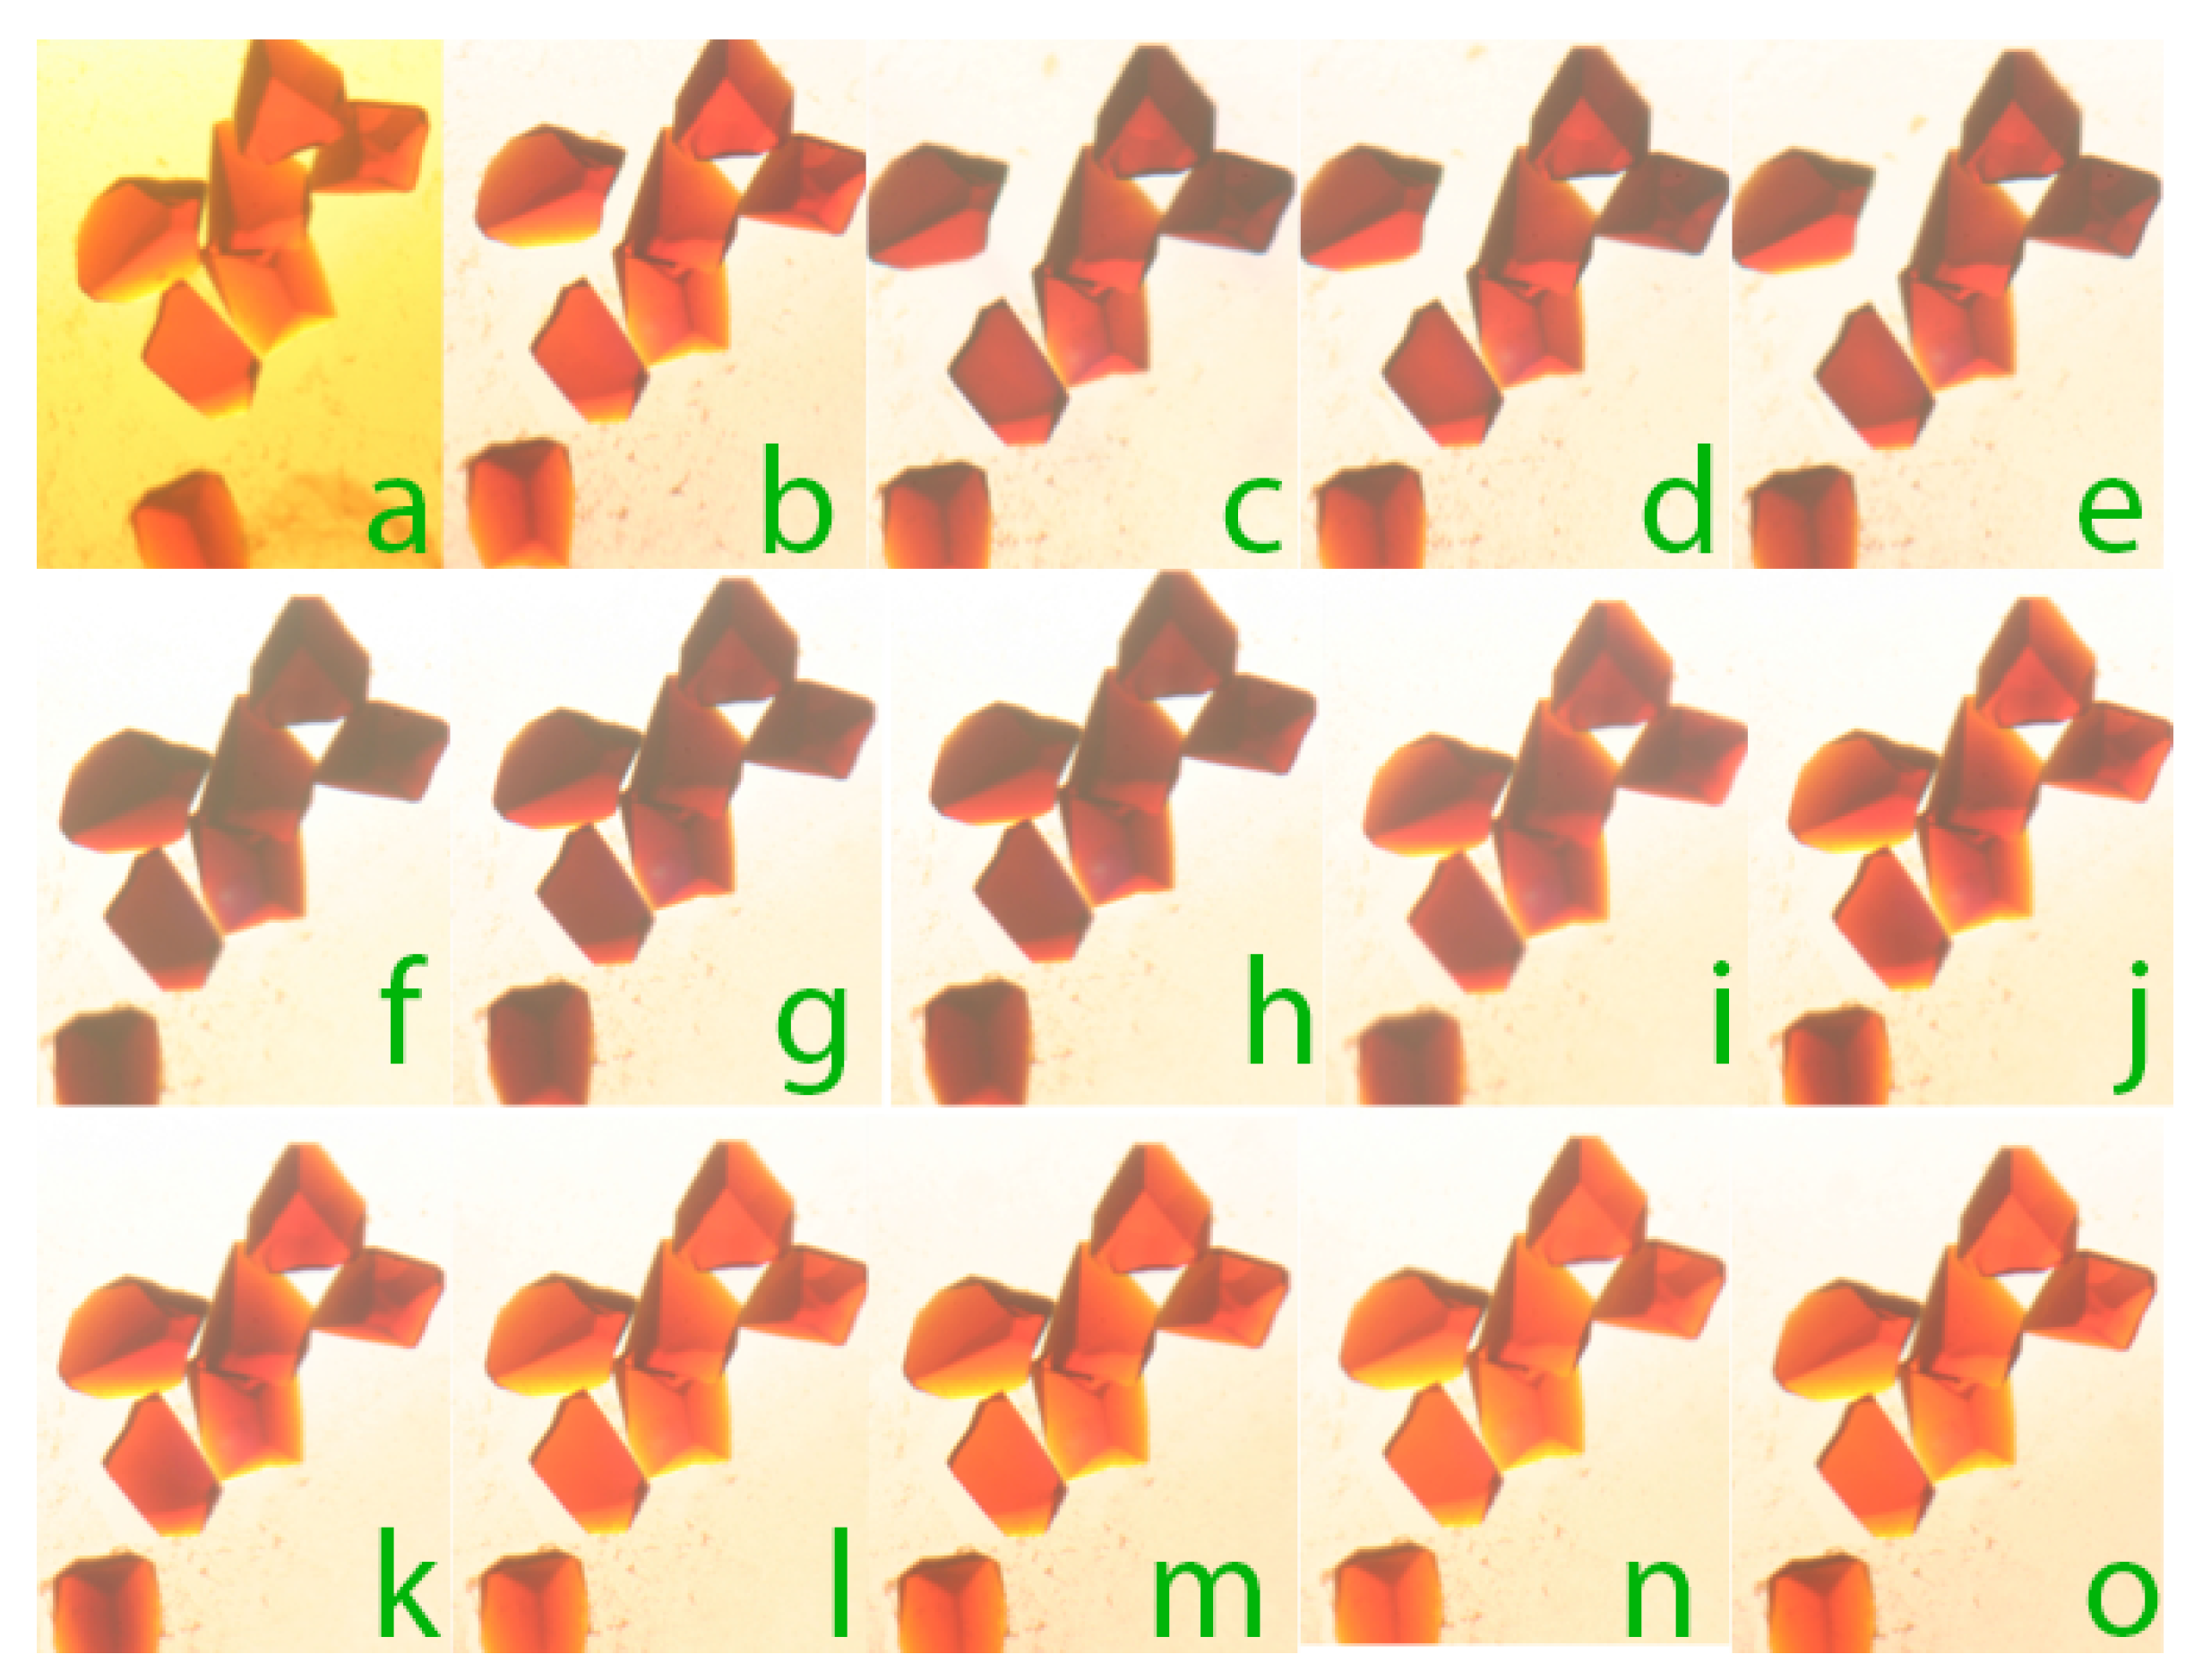
Tetragonal lysozyme crystals were saturated with the dye m-cresol purple at pH 5, which gave the crystals a yellow/orange color. The pH of the mother liquor was changed to pH 7.5 and the conversion of the crystal color to red provided a measure of the diffusion of H3O+ ions out of the crystal into the mother liquor. The total time required for the transition was about 30 min. The series of images (a–l), taken at appropriate time intervals, shows the progress of the dye.
Figure 4.
Tetragonal lysozyme crystals were saturated with the dye m-cresol purple at pH 5, which gave the crystals a yellow/orange color. The pH of the mother liquor was changed to pH 7.5 and the conversion of the crystal color to red provided a measure of the diffusion of H3O+ ions out of the crystal into the mother liquor. The total time required for the transition was about 30 min. The series of images (a–l), taken at appropriate time intervals, shows the progress of the dye.

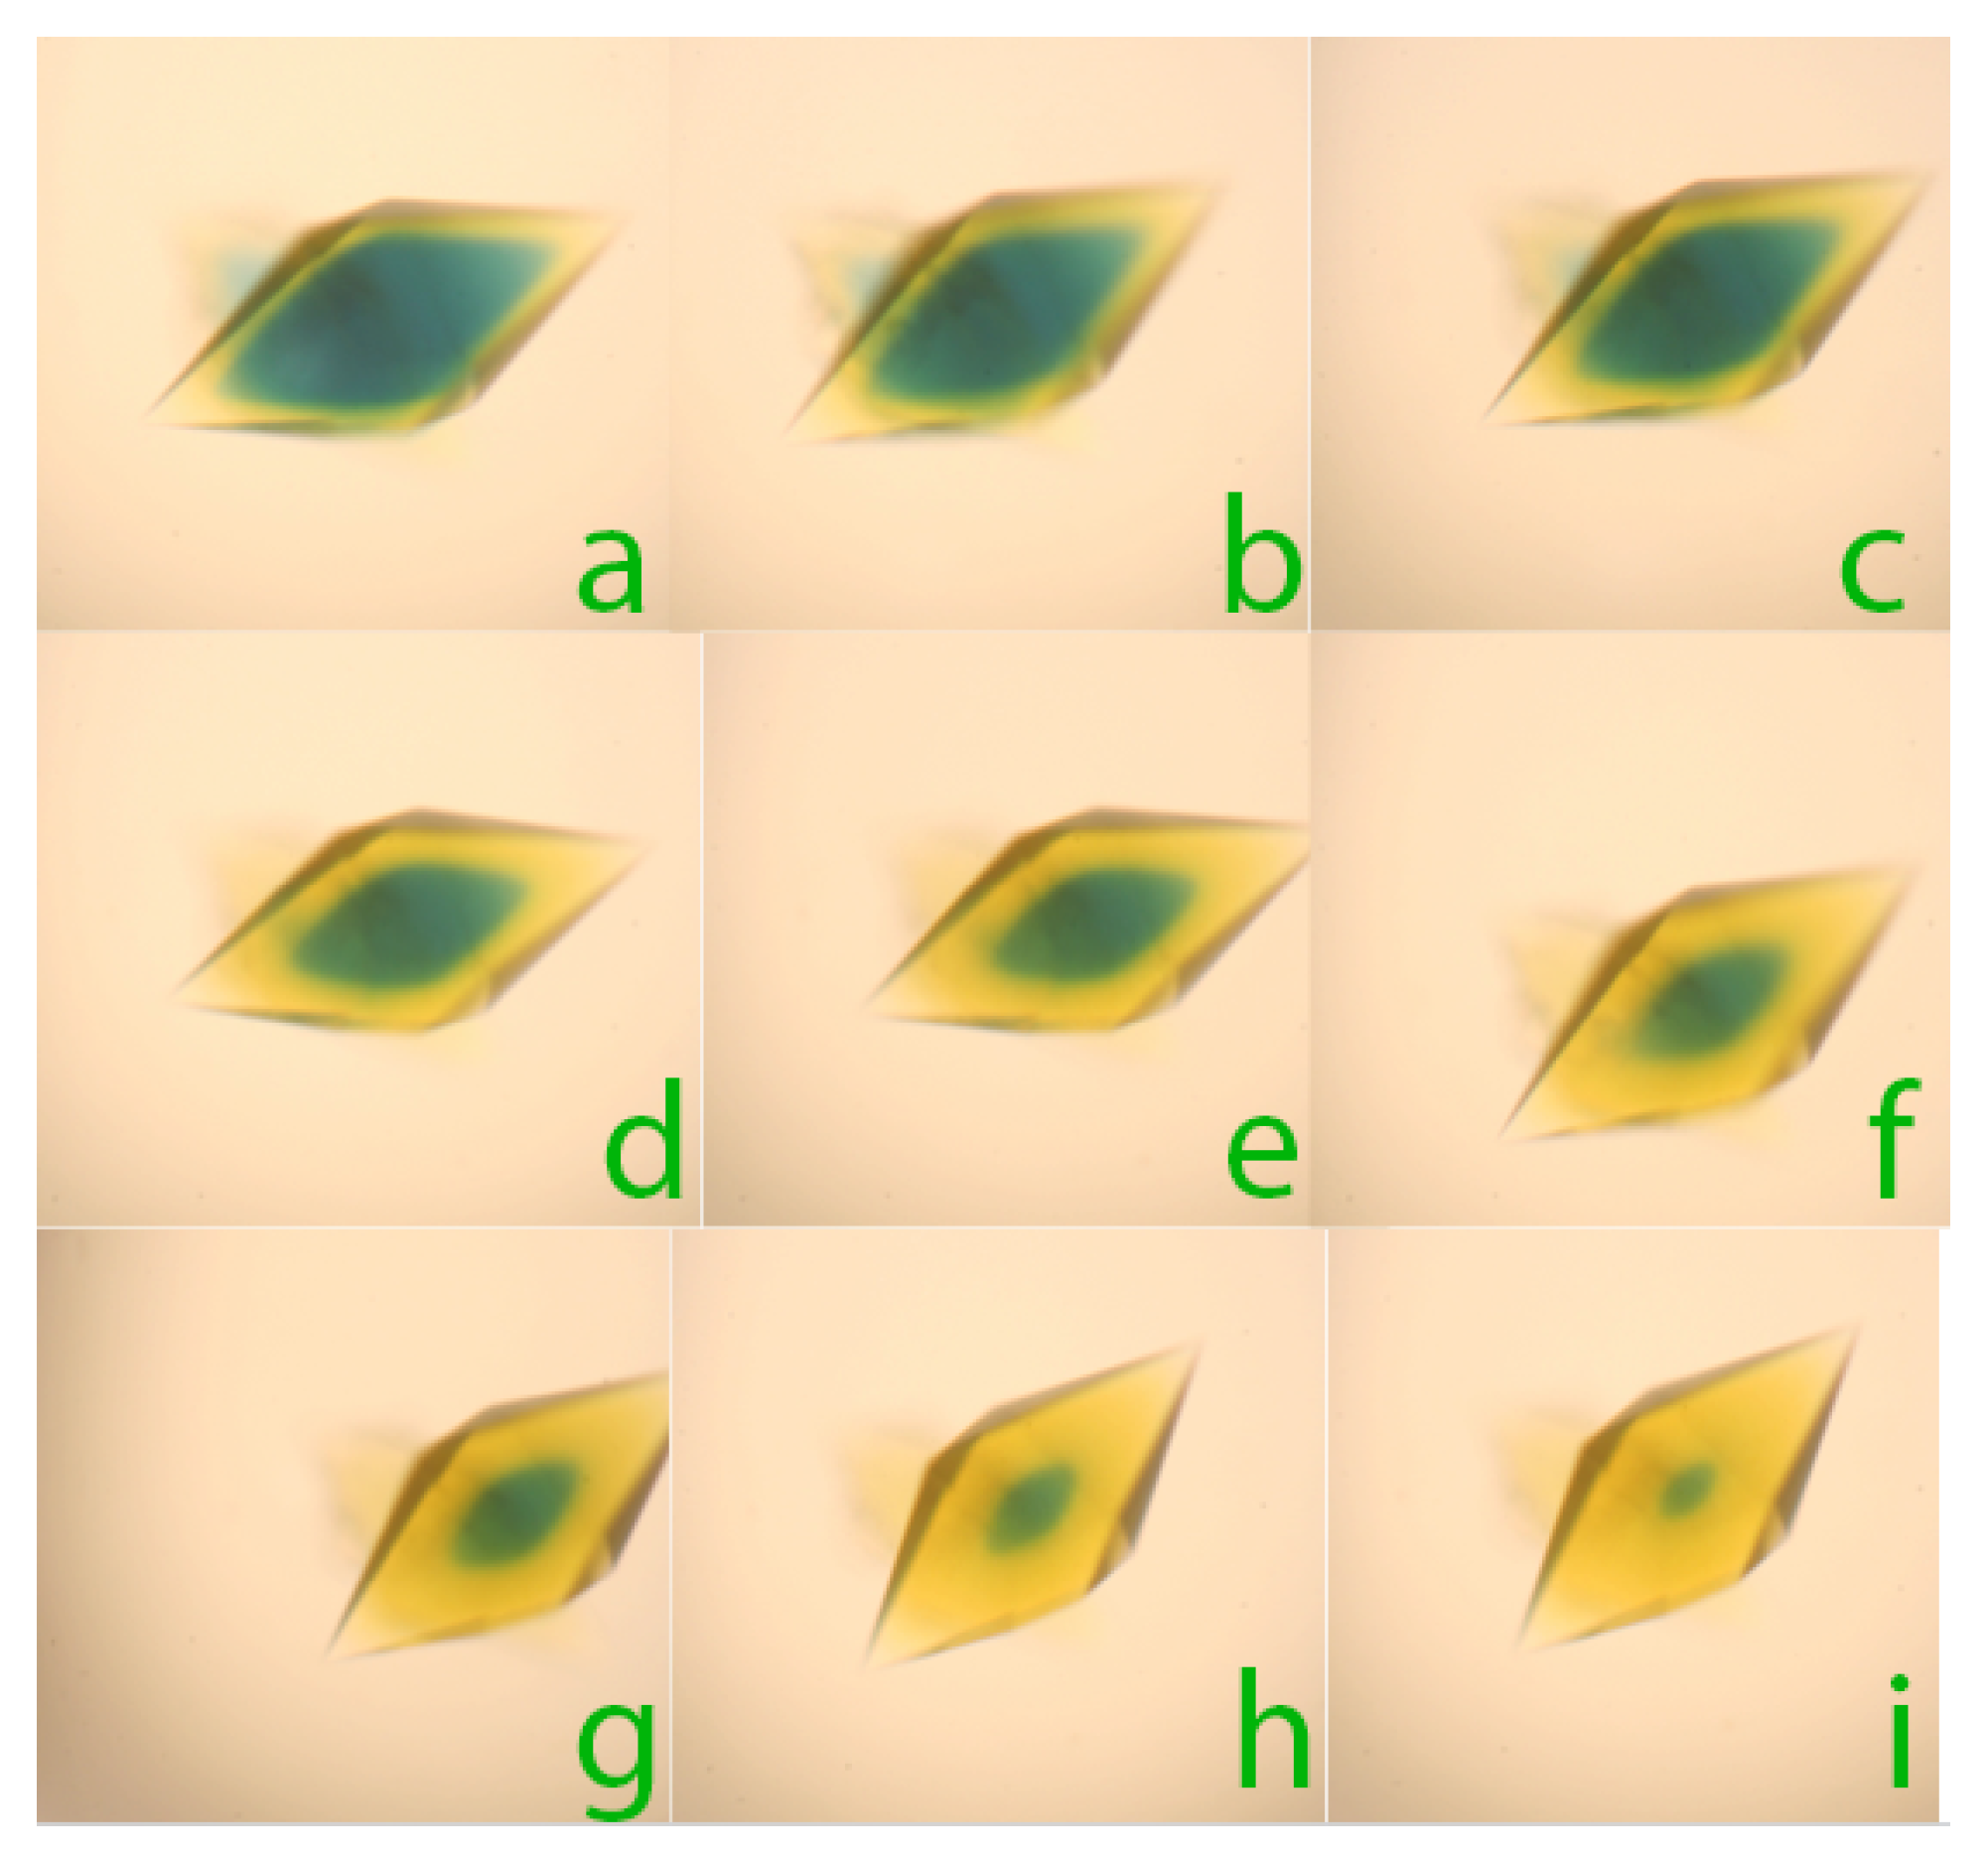
Figure 5.
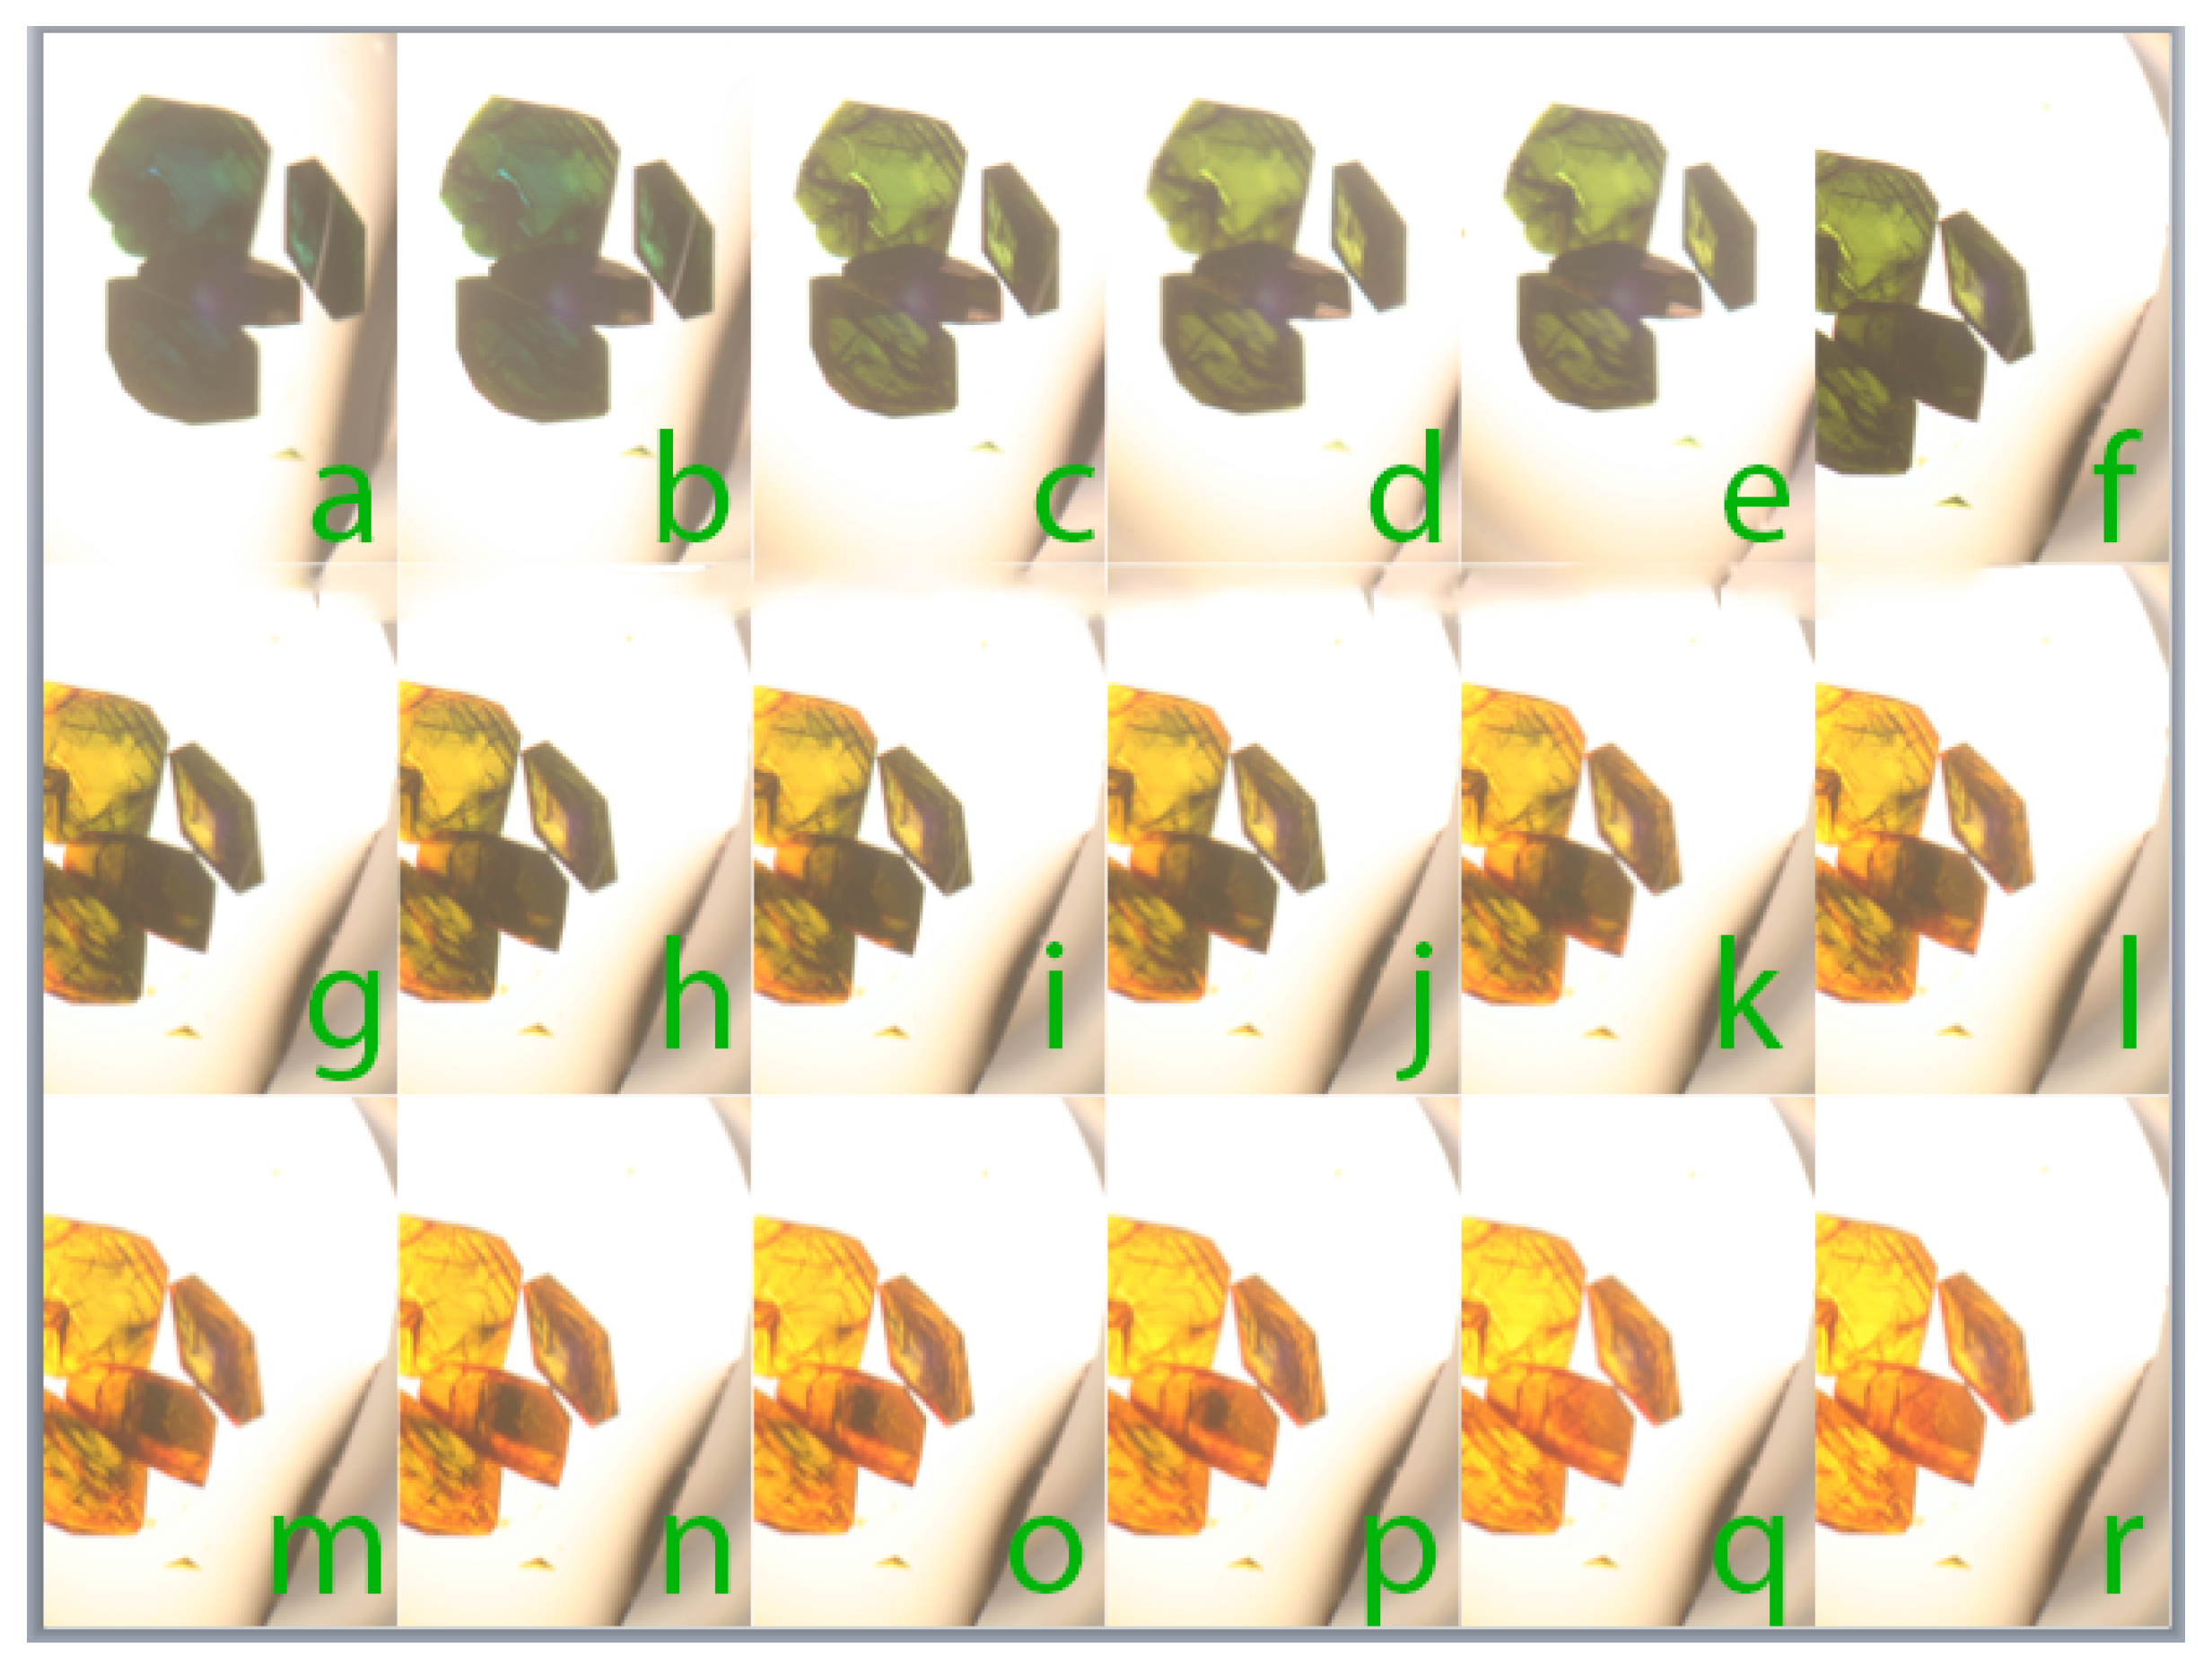
Tetragonal lysozyme crystals saturated with the dye bromocresol green are a dark blue-green color at pH 6.0 in (a). When the pH of the mother liquor was altered to pH 3.8, the crystals were seen in (b) through (r) to change in color to yellow. The series of images (a–r), taken at appropriate time intervals, shows the progress of the dye.
Figure 5.
Tetragonal lysozyme crystals saturated with the dye bromocresol green are a dark blue-green color at pH 6.0 in (a). When the pH of the mother liquor was altered to pH 3.8, the crystals were seen in (b) through (r) to change in color to yellow. The series of images (a–r), taken at appropriate time intervals, shows the progress of the dye.

Figure 6.
Crystals of satellite tobacco mosaic virus (STMV) were saturated with the dye m-cresol purple at pH 5.5 and appear as in (a). The mother liquor was replaced with equivalent mother liquor at pH 8.0 and the crystals changed color to dark red in (b) through (h). When the original pH was restored in the mother liquor, the crystals (i) through (o) reverted to the initial color. This experiment, repeated with numerous other protein crystals demonstrates the reversible nature of the color changes and that crystals can experience multiple cycles of pH induced transitions. The series of images (a–o), taken at appropriate time intervals, shows the progress of the dye.

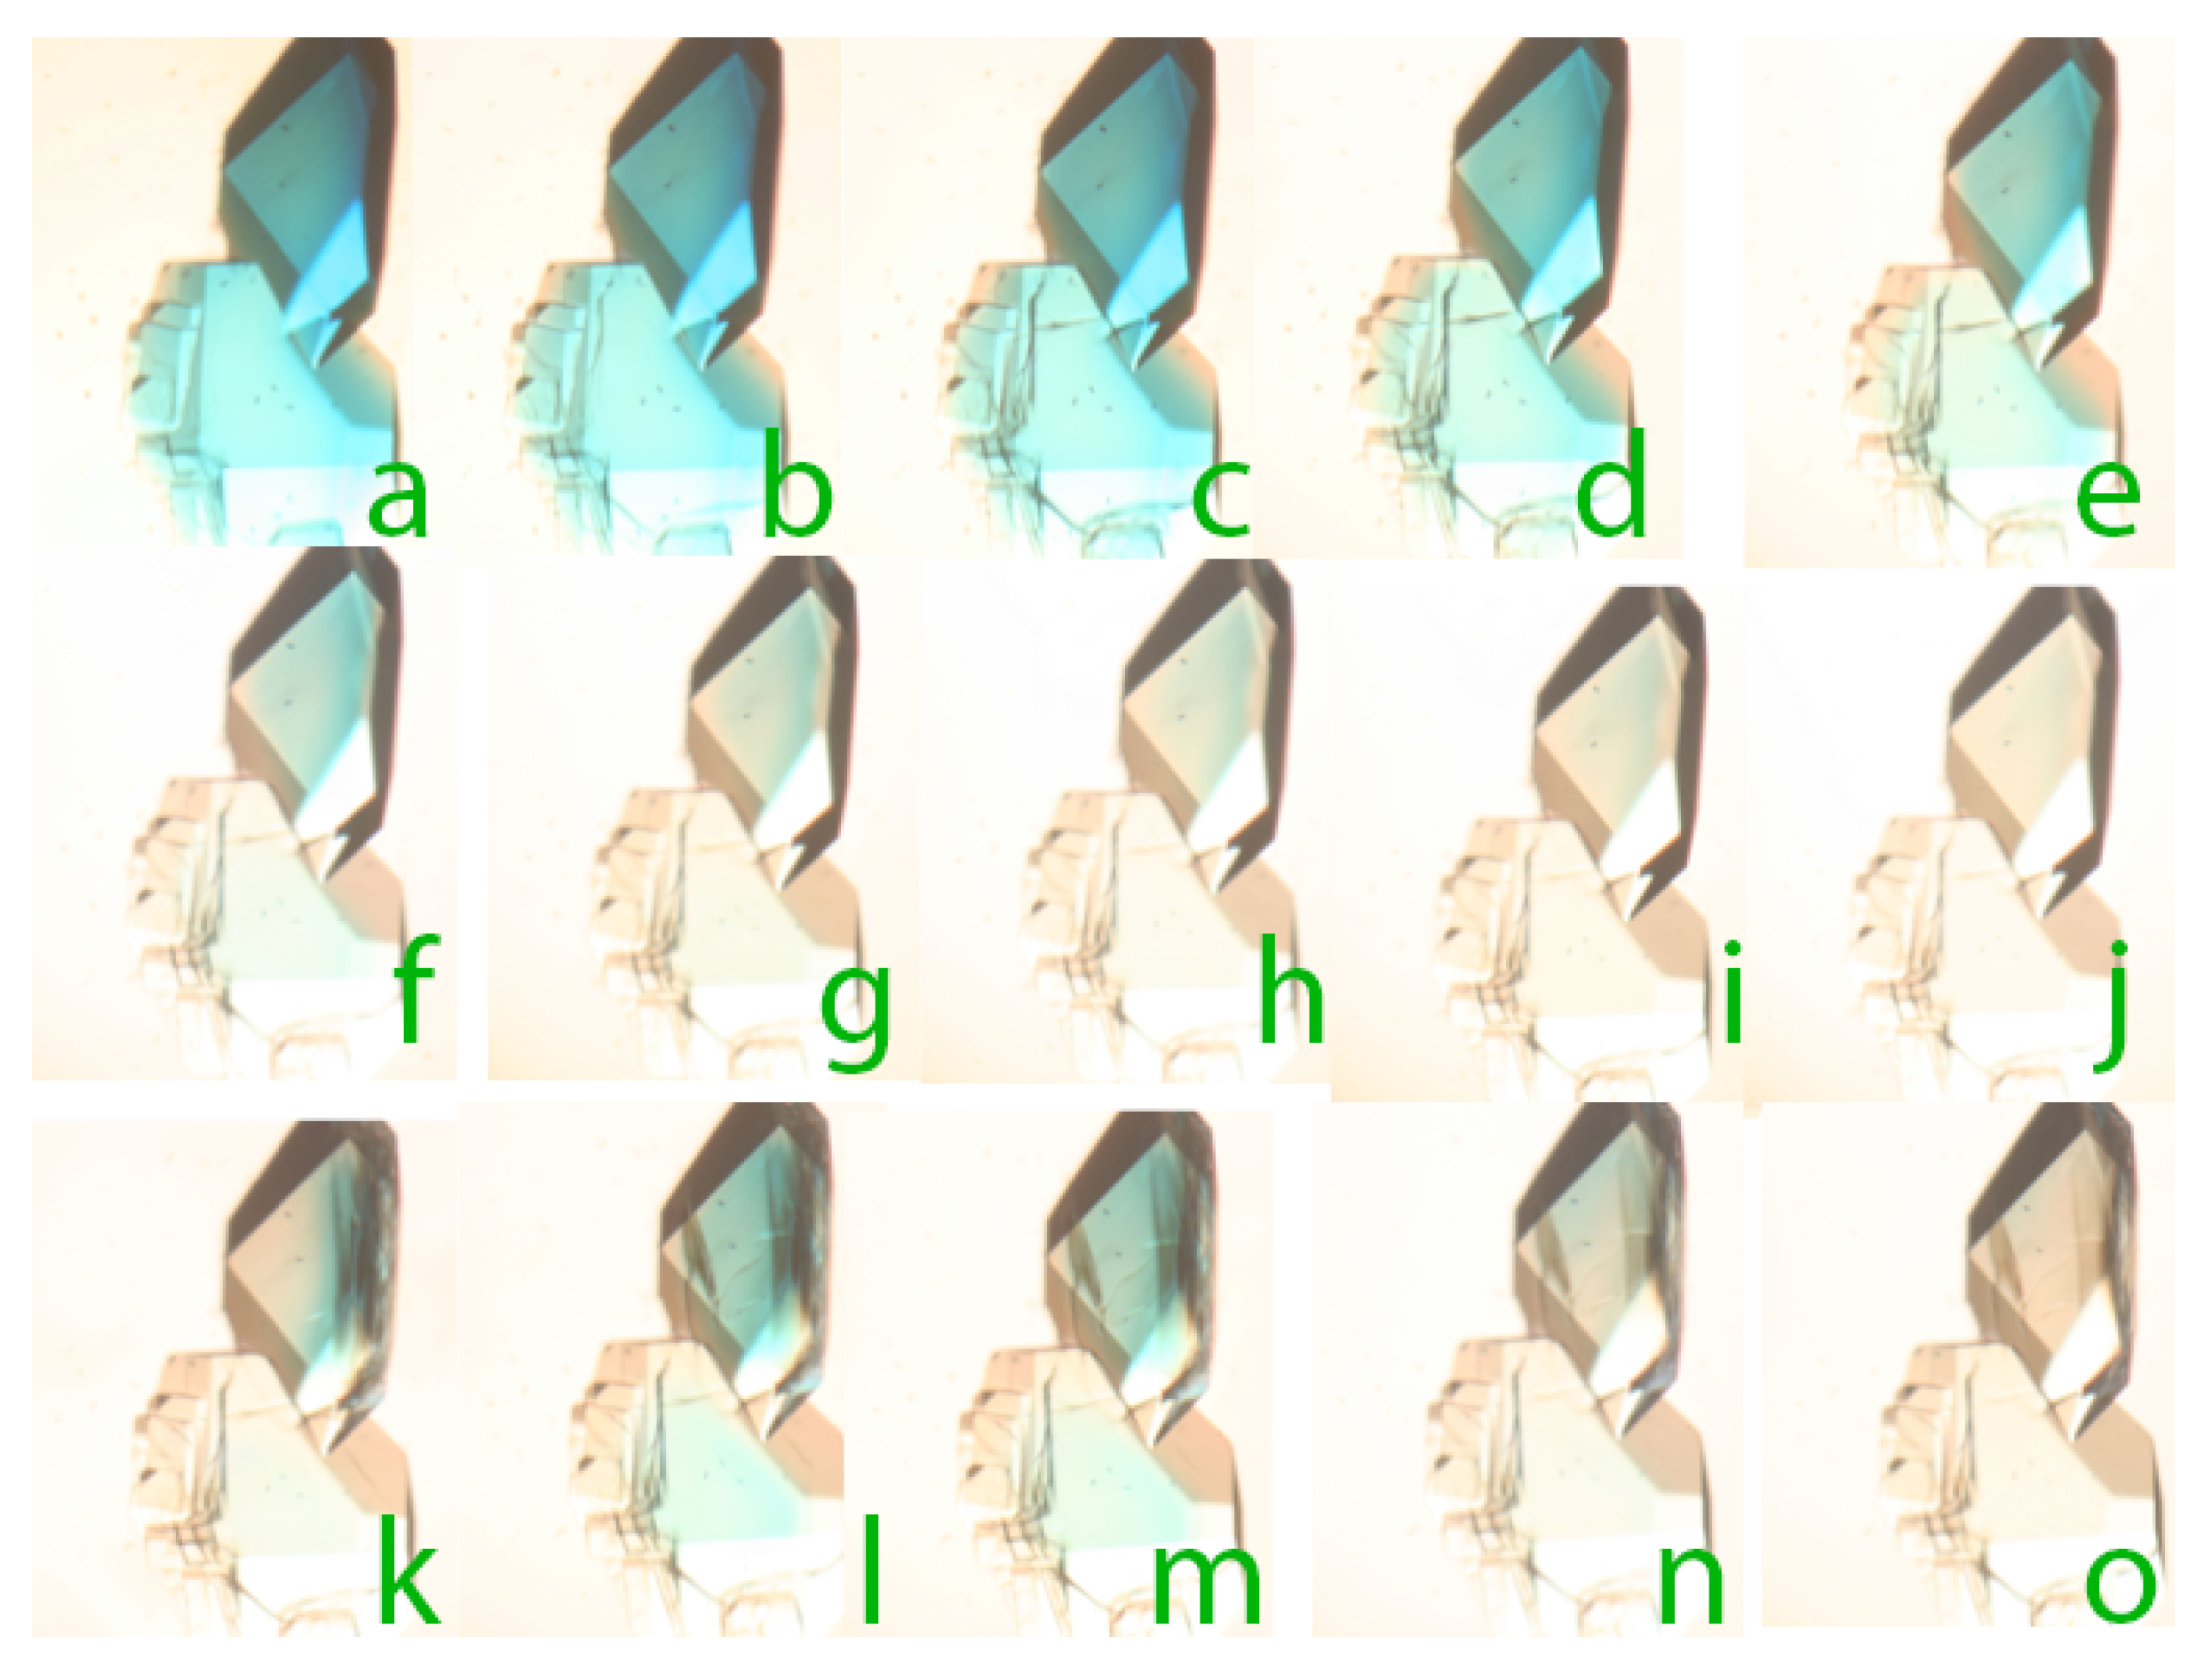
Figure 7.
Lysozyme crystals were saturated with the dye methyl green (a) and bisulfite added to the mother liquor in (b). The green color was progressively lost as the dye was reduced. At (k), however, oxygen from the environment competed to re-oxidize the dye, which then experienced a second cycle of reduction in (n) and (o). The series of images (a–o), taken at appropriate time intervals, shows the progress of the dye.

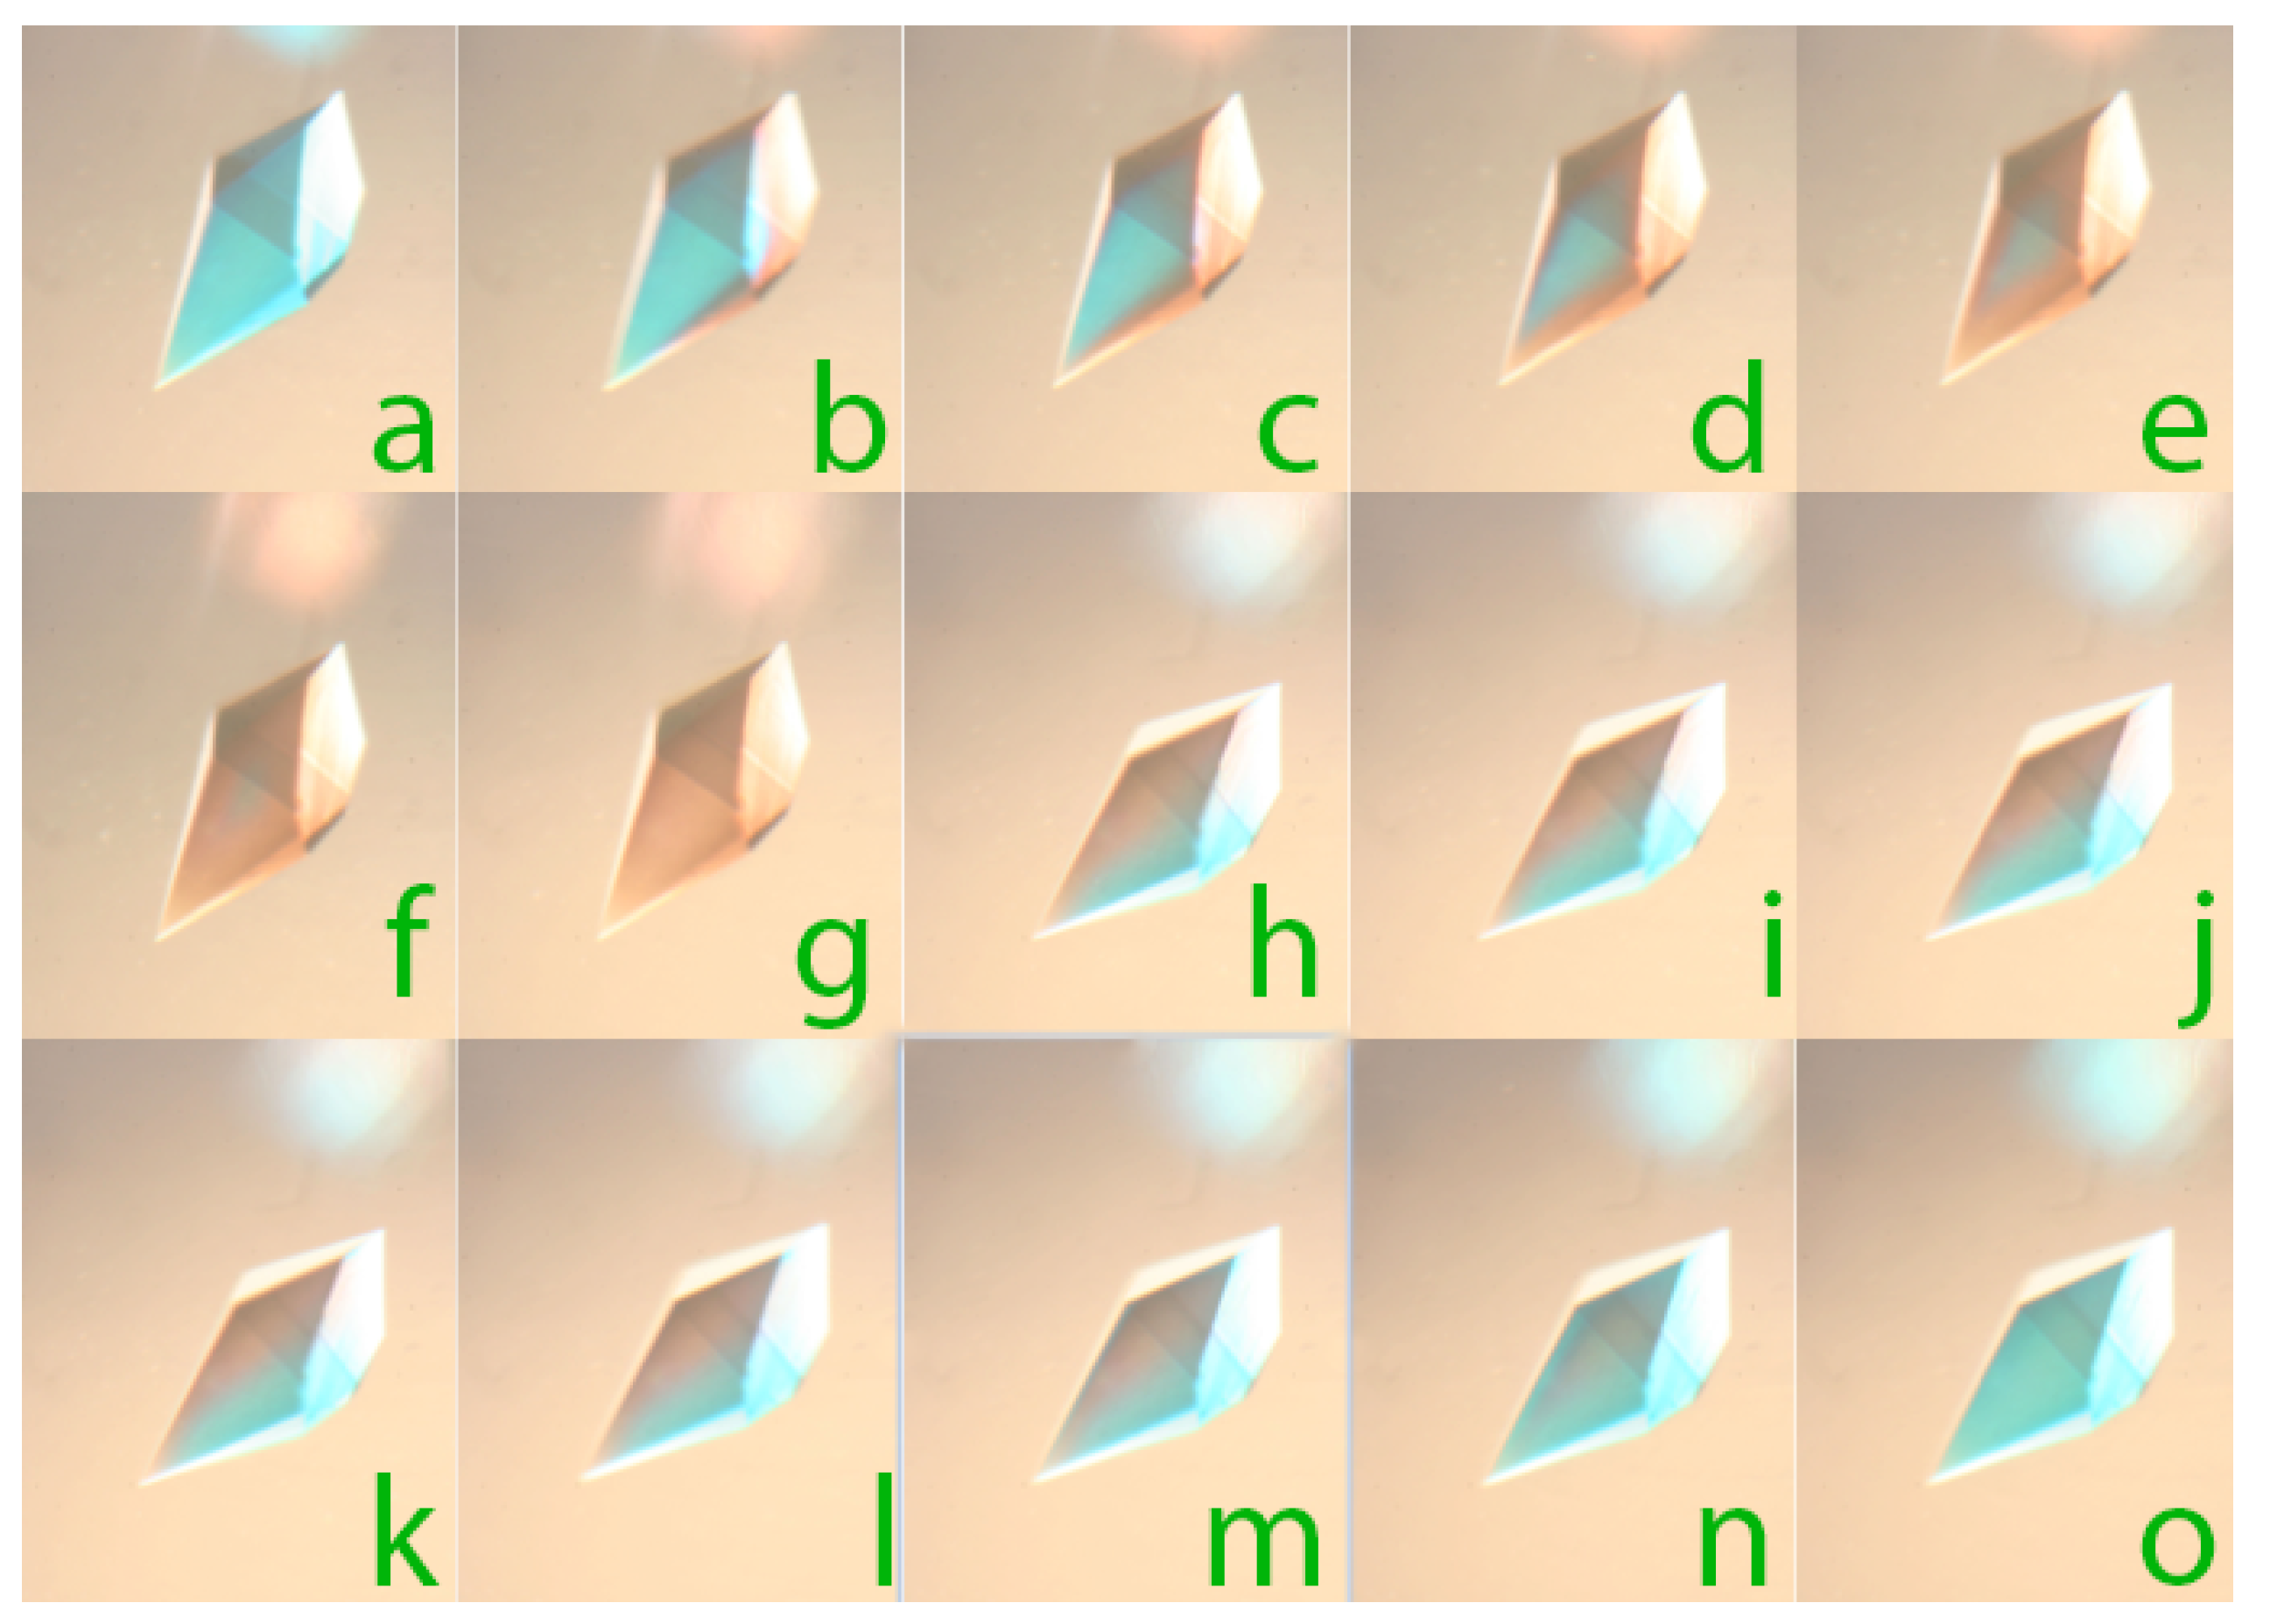
Figure 8.
Lysozyme crystals were saturated with the dye crystal violet (a) and dithionite added to the mother liquor in (b). The purple color was progressively lost as the dye was reduced. At (k), however, oxygen from the environment competed to re-oxidize the dye, which then experienced a second cycle of reduction in (n) and (o). The series of images (a–o), taken at appropriate time intervals, shows the progress of the dye.

Figure 9.
A tetragonal crystal of thaumatin about 1 mm in length was saturated with the redox sensitive dye Luxol blue (Solvent blue 38) giving it an intense blue color. Luxol blue is a porphyrin that contains a copper ion in the plus two state that is responsible for the color. Solid dithionite was added directly to the mother liquor, which reduced the Cu2+ ion to elemental copper. Thus, the transformation of color in the crystal from blue to copper shows the progress of the reduction reaction as the dithionite penetrated the crystal. Beginning with image (h), oxygen in the environment initiated re-oxidation of the copper and the color transitioned again to blue. This is shown in the final images (i) through (o). The series of images (a–o), taken at appropriate time intervals, shows the progress of the dye.

Figure 10.
A tetragonal crystal of thaumatin was saturated with the copper porphyrin dye Luxol blue (Solvent blue 38) in (a) and dithionite then added to the mother liquor (b). The blue color transitioned to elemental copper as the dye was reduced. At about (k) oxygen from the environment began to re-oxidize the copper to the Cu2+ state and the dye regained its blue color. In both the reduction and oxidation phases the redox front was well defined. The series of images (a–o), taken at appropriate time intervals, shows the progress of the dye.

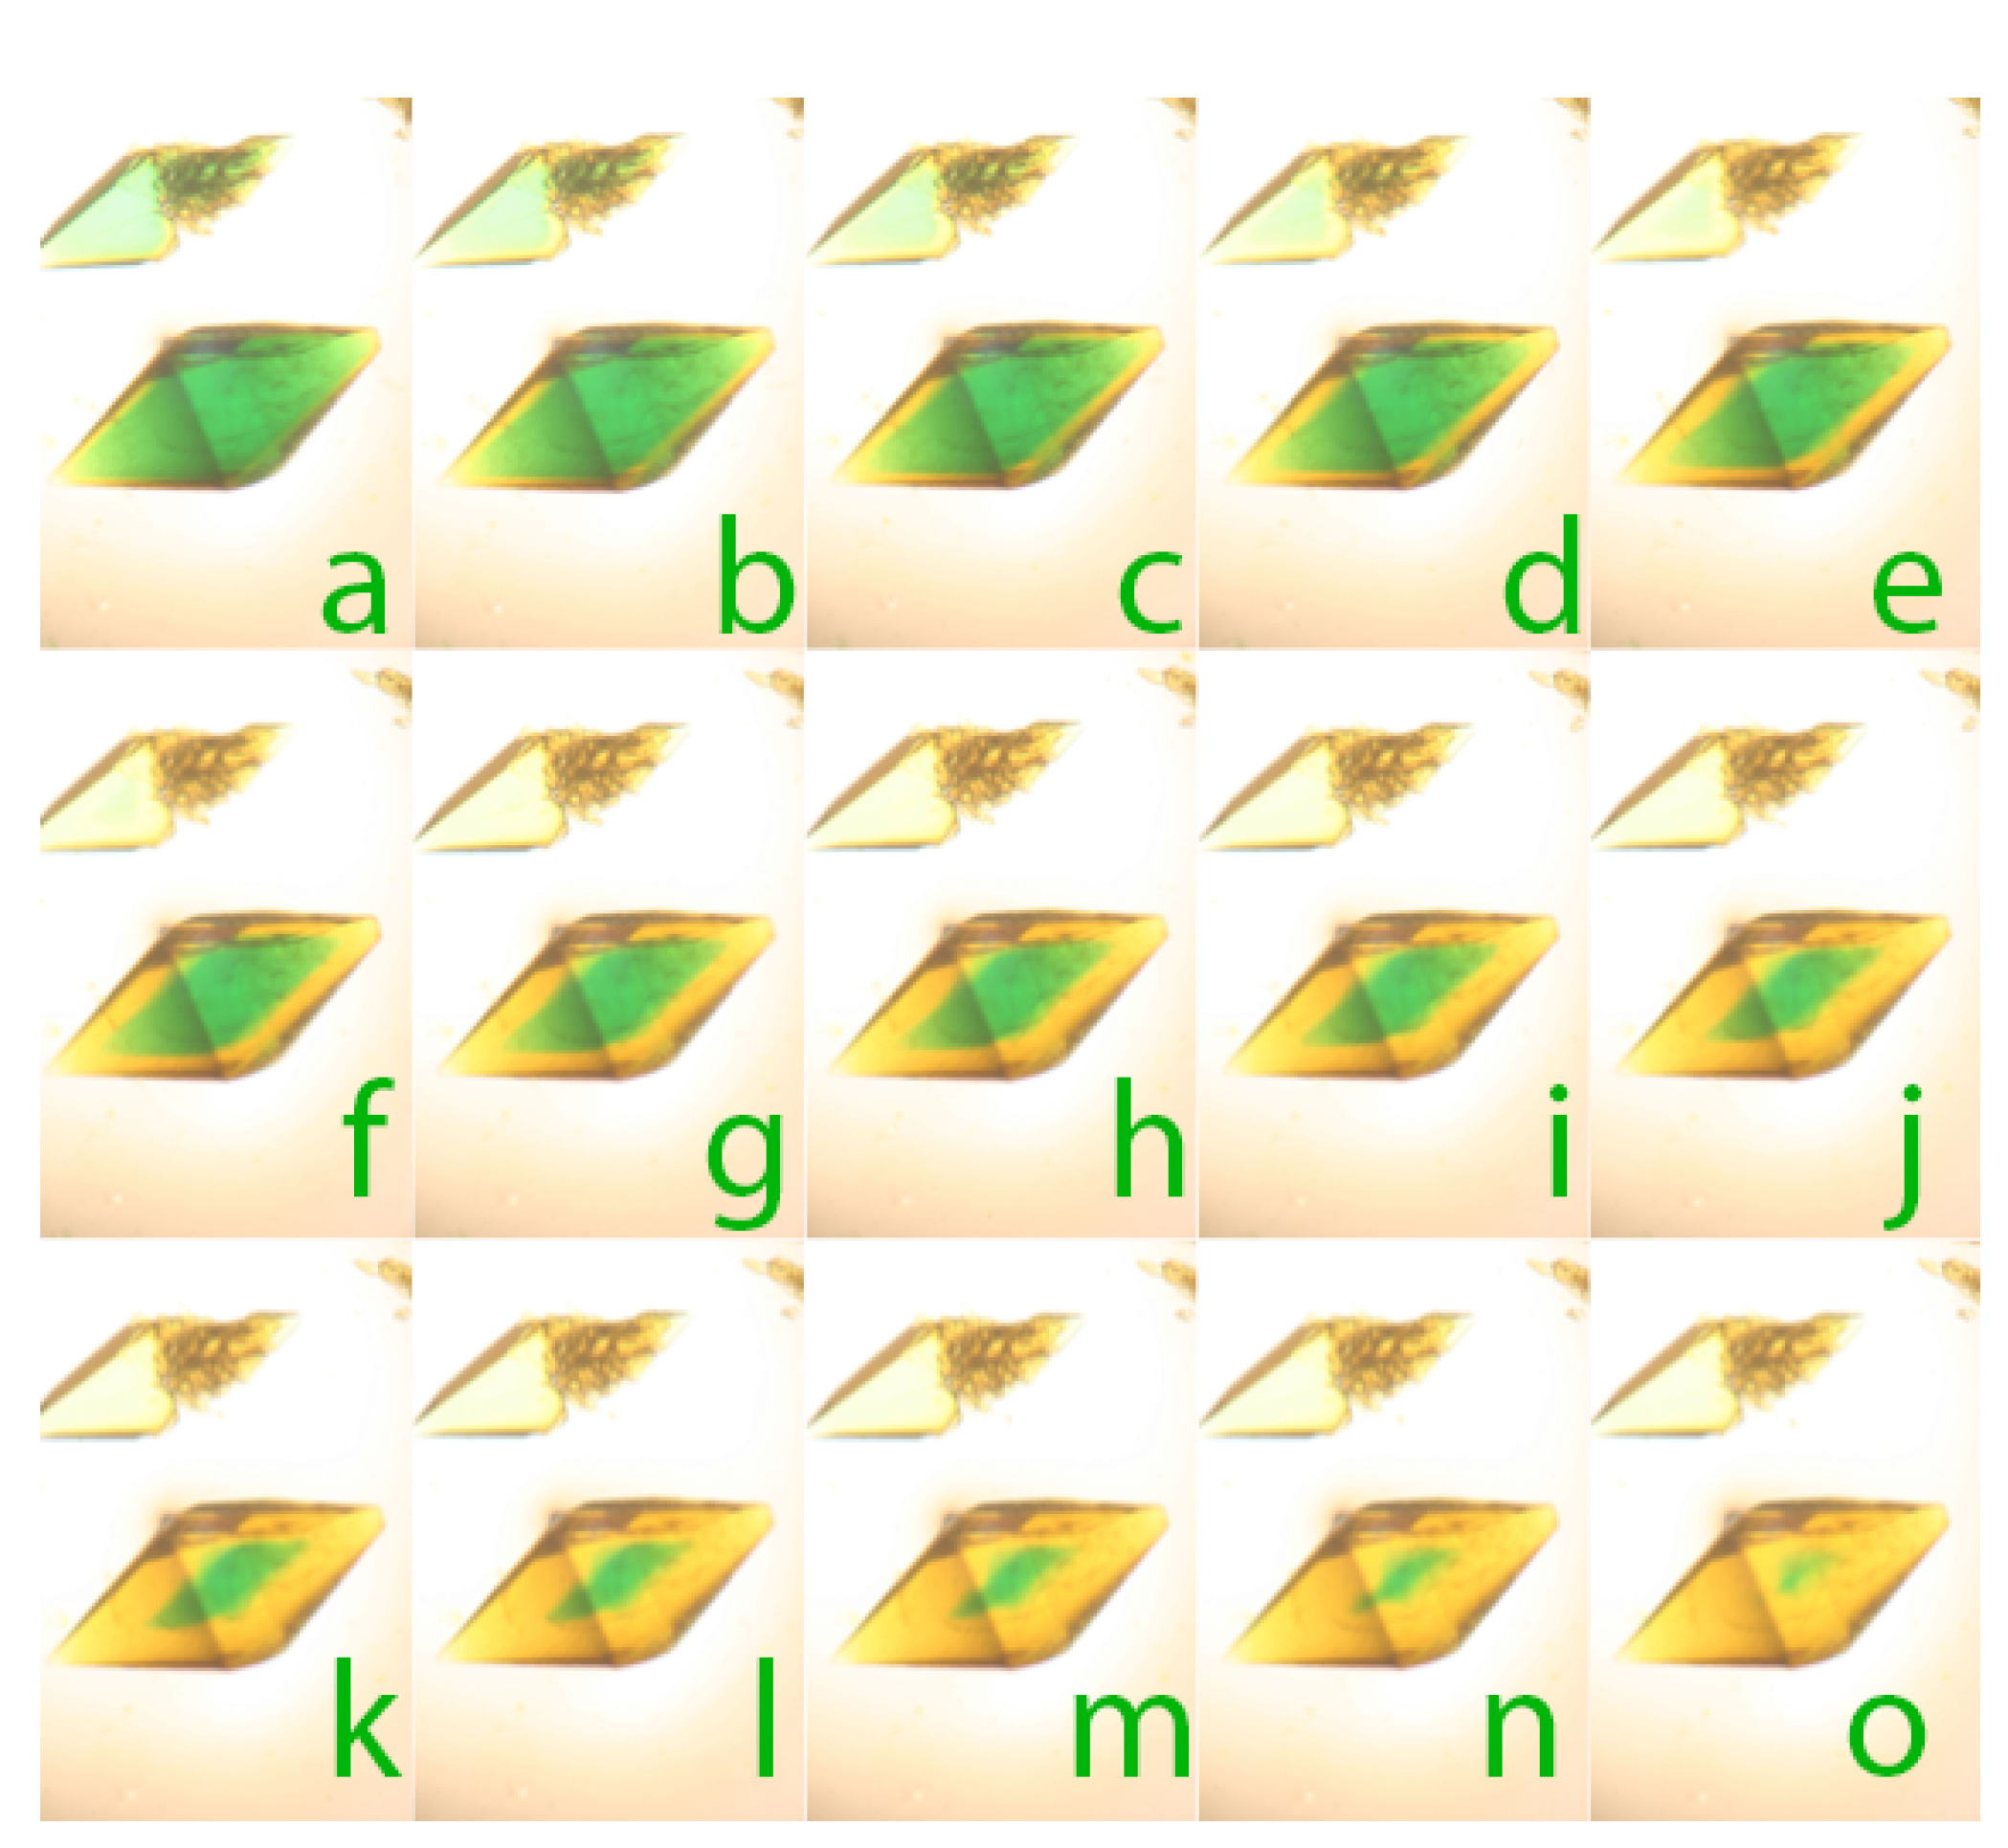
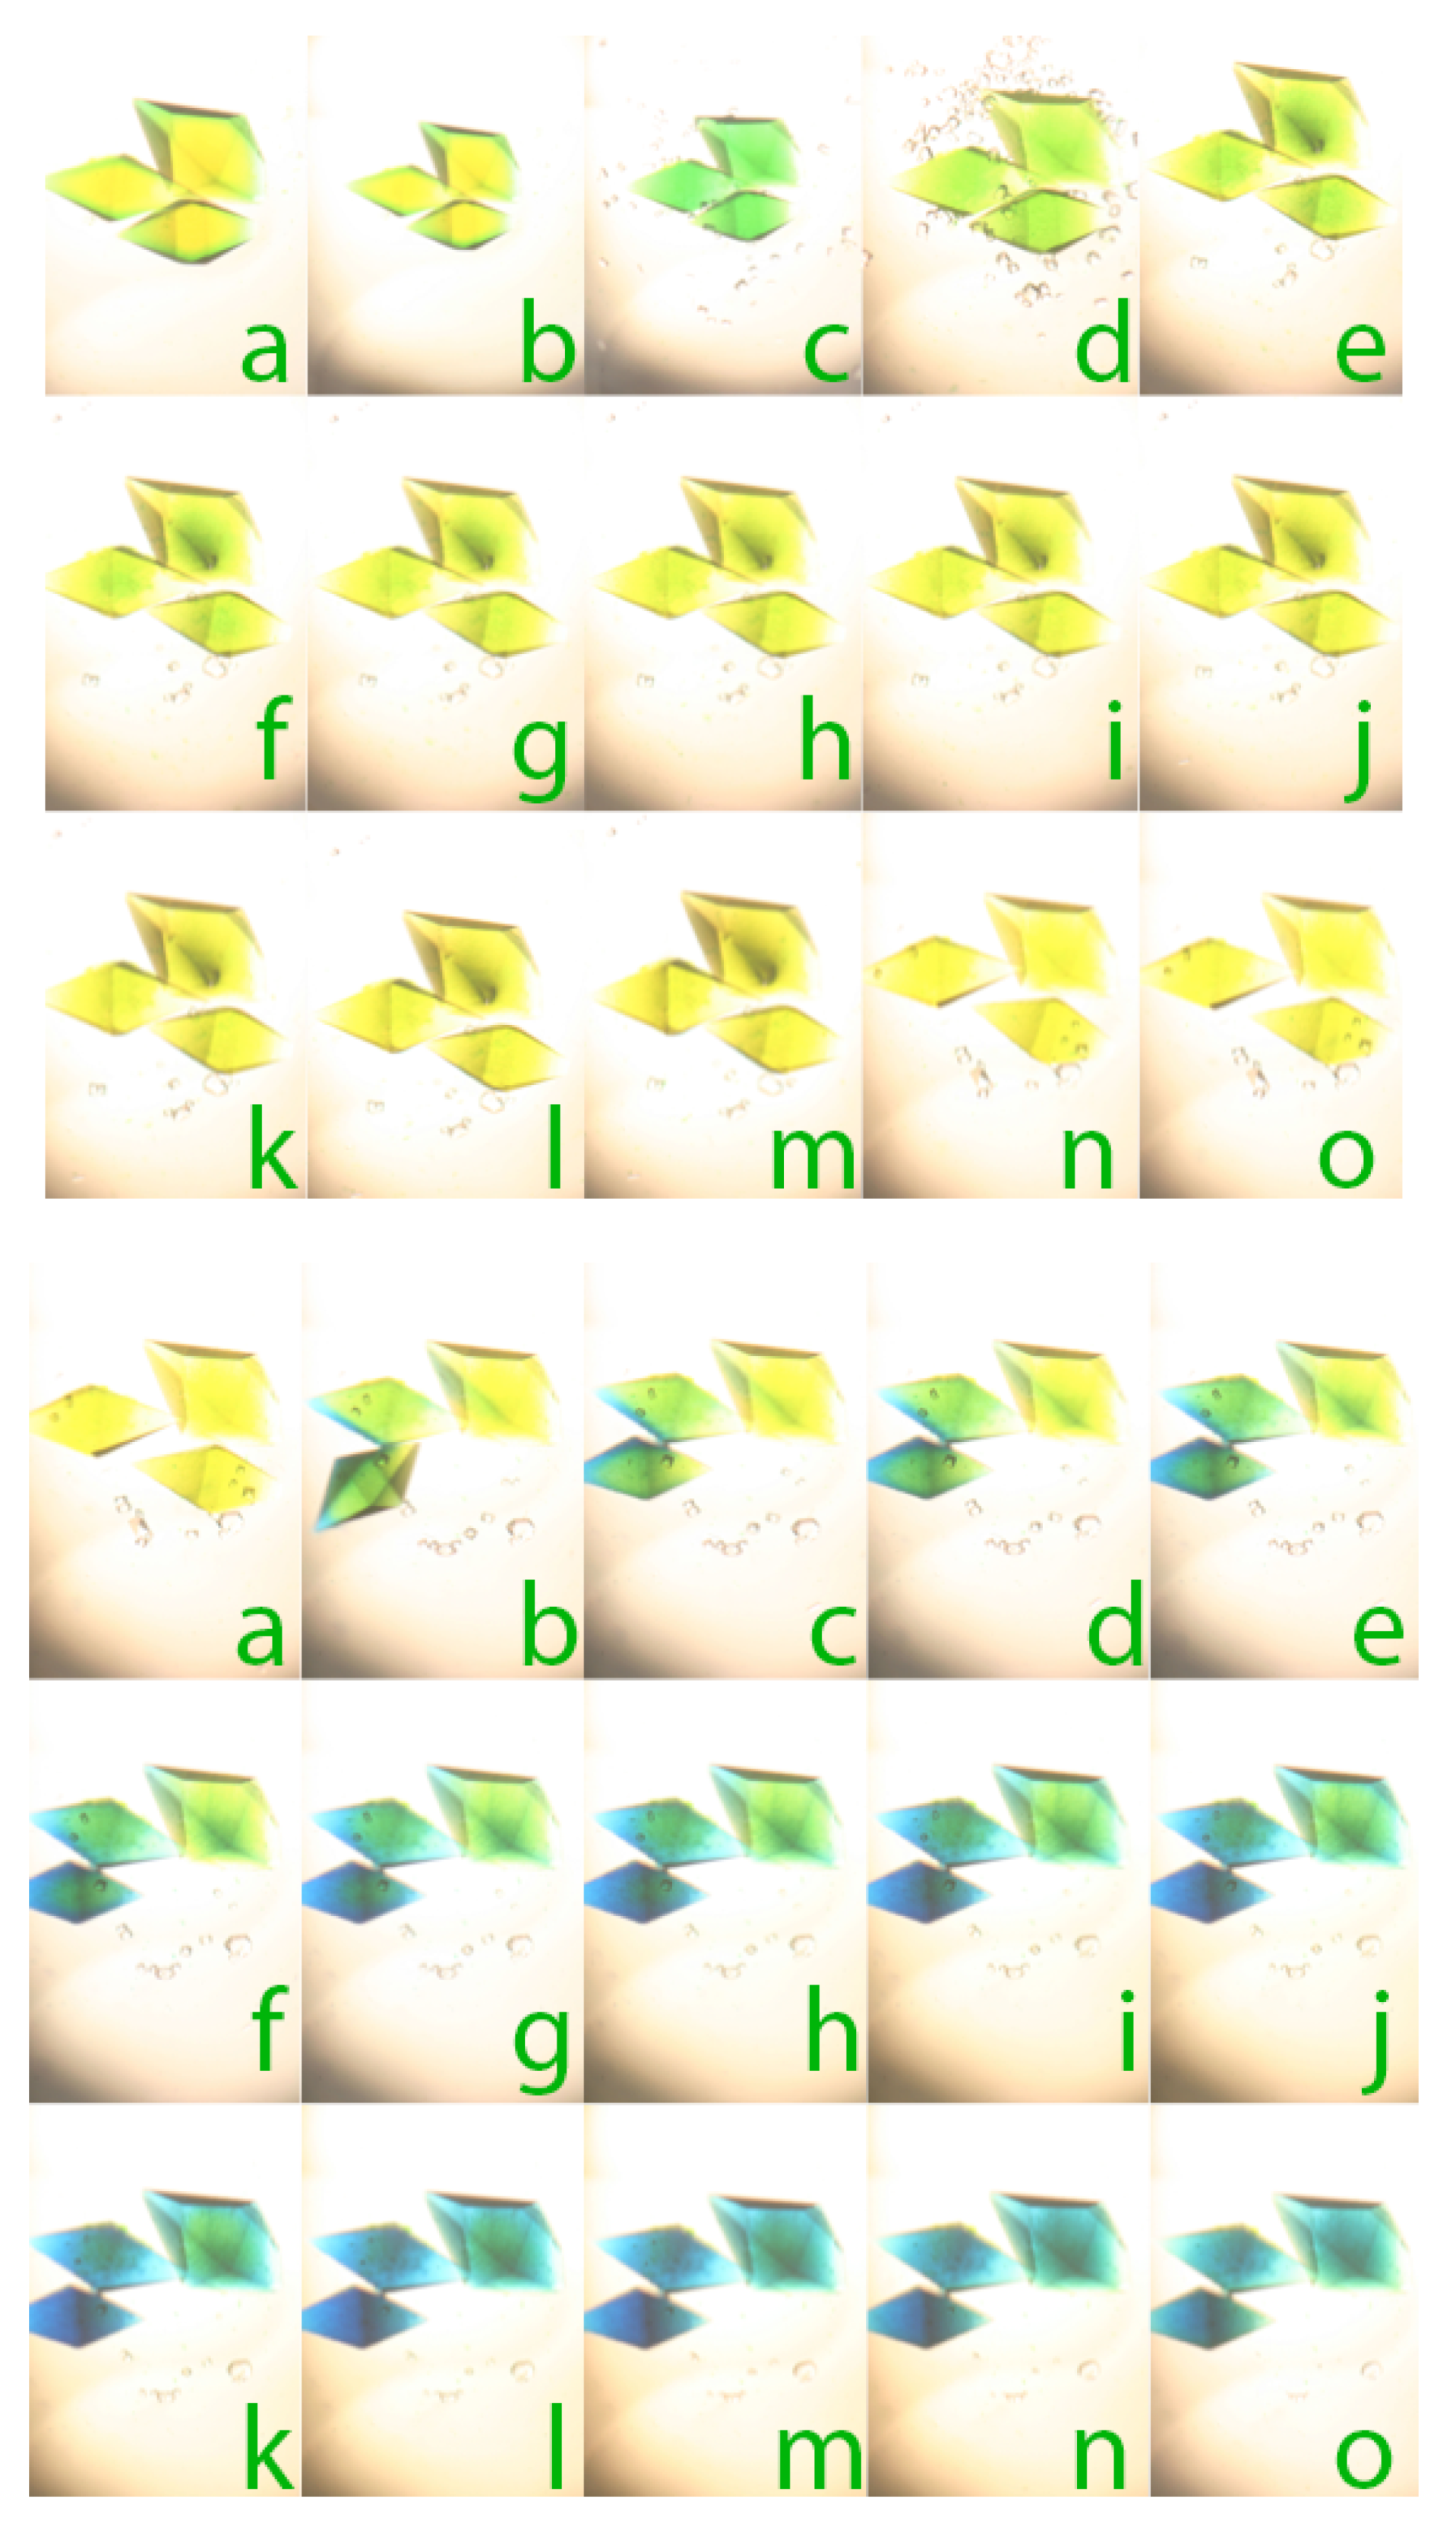
Figure 11.
In the top series, tetragonal crystals of thaumatin were first stained to saturation with the dye bromothymol blue, which at pH 6.5 created a yellow color. This was followed by saturation with the dye toluidine blue that gave the crystals a green (yellow + blue) color. Dithionite was then added to the mother liquor and in (a) of the bottom series, as the dithionite penetrated the crystal, the toluidine blue was reduced thereby yielding the underlying yellow color due to the pH sensitive bromothymol blue at low pH. Reduction proceeded until (o) at which time virtually all of the redox sensitive dye had been reduced. Starting in (e) of the bottom panel the pH of the mother liquor was raised to pH 8.2 and the bromothymol blue dye in the crystal transitioned to the blue chemical state. The series of images (a–o) in both the upper and lower panels, taken at appropriate time intervals, shows the progress of the dye changes with time, for both pH and redox sensitive dyes.


Table 1.
pH sensitive dyes.
| Dye | Low pH Color | Transition pH | High pH Color |
|---|---|---|---|
| Methyl yellow | red | 3.5 | yellow |
| Methyl orange | red | 3 | yellow |
| Bromophenol blue | yellow | 3.8 | blue |
| Chlorophenol red | blue/violet | 4.0 | red |
| Bromcresol green | yellow | 4.6 | blue |
| Methyl red | red | 5.3 | yellow |
| Bromcresol purple | yellow | 6.0 | purple |
| m-cresol purple | yellow | 6.2 | red |
| Bromothymol blue | yellow | 6.8 | blue |
| Phenol red | yellow | 7.2 | red |
| Neutral red | red | 7.4 | yellow |
Table 2.
Oxidation–reduction sensitive dyes.
| Dye | Color Change on Reduction | Reductant |
|---|---|---|
| Basic fuchsin | red > colorless | bisulfite |
| Methyl green | green > colorless | bisulfite |
| Crystal violet | violet > colorless | dithionite |
| Methylene blue | blue > colorless | ascorbic acid |
| Toluidine blue | blue > colorless | ascorbic acid |
| Luxol blue or Solvent blue 38 | blue > copper | dithionite |
© 2019 by the author. Licensee MDPI, Basel, Switzerland. This article is an open access article distributed under the terms and conditions of the Creative Commons Attribution (CC BY) license (http://creativecommons.org/licenses/by/4.0/).
Share and Cite
MDPI and ACS Style
McPherson, A. pH and Redox Induced Color Changes in Protein Crystals Suffused with Dyes. Crystals 2019, 9, 126. https://doi.org/10.3390/cryst9030126
AMA Style
McPherson A. pH and Redox Induced Color Changes in Protein Crystals Suffused with Dyes. Crystals. 2019; 9(3):126. https://doi.org/10.3390/cryst9030126
Chicago/Turabian StyleMcPherson, Alexander. 2019. "pH and Redox Induced Color Changes in Protein Crystals Suffused with Dyes" Crystals 9, no. 3: 126. https://doi.org/10.3390/cryst9030126
Note that from the first issue of 2016, this journal uses article numbers instead of page numbers. See further details here.