1. Introduction
A series of recent works have shown that phononic crystals, or metamaterials, based on bubbles trapped in a soft elastic matrix can exhibit exotic properties such as negative refraction [
1], superabsorption [
2], or subwavelength focusing [
3]. In all these works, the key is that a spherical air cavity in an elastic matrix is an oscillator, much like a bob on a spring, which resonates at a natural frequency given by
with
the bulk modulus of the gas inside the bubble,
and
G’ the mass density and shear storage modulus of the host elastic matrix, respectively, and
the air cavity radius. This formula tells us that the restoring force is due to both the elasticity of the gas and the shear elasticity of the solid while the inertia is that of the solid. Provided that the matrix is soft enough, the resonance is associated to a wavelength much larger than the air cavity size as is the case for the so-called Minnaert frequency resonance of an air bubble in a liquid (i.e., with
).
Based on periodic arrangements of air cavities trapped in PolyDiMethylSiloxane (PDMS), metascreens with adjustable transmission properties can be realized [
4,
5]. A simple analytic model proposed in [
6] allows the transmission and reflection of such metascreens to be predicted. In this short communication, we show reciprocally that this model can be used to infer the high-frequency rheological properties of cross-linked soft polymers in which bubbles are trapped with a controlled periodicity. We demonstrate that this kind of “phononic crystal-based rheometer” allows for high frequency measurements, which would be not attainable with classical rheometers.
2. Materials and Methods
The behavior of viscoelastic materials can be described by their complex shear modulus,
, defined as the ratio of the shear stress to the shear strain. The storage modulus,
, represents the in-phase (elastic) stress response, while the shear loss modulus,
, is related to the dynamic viscosity
through
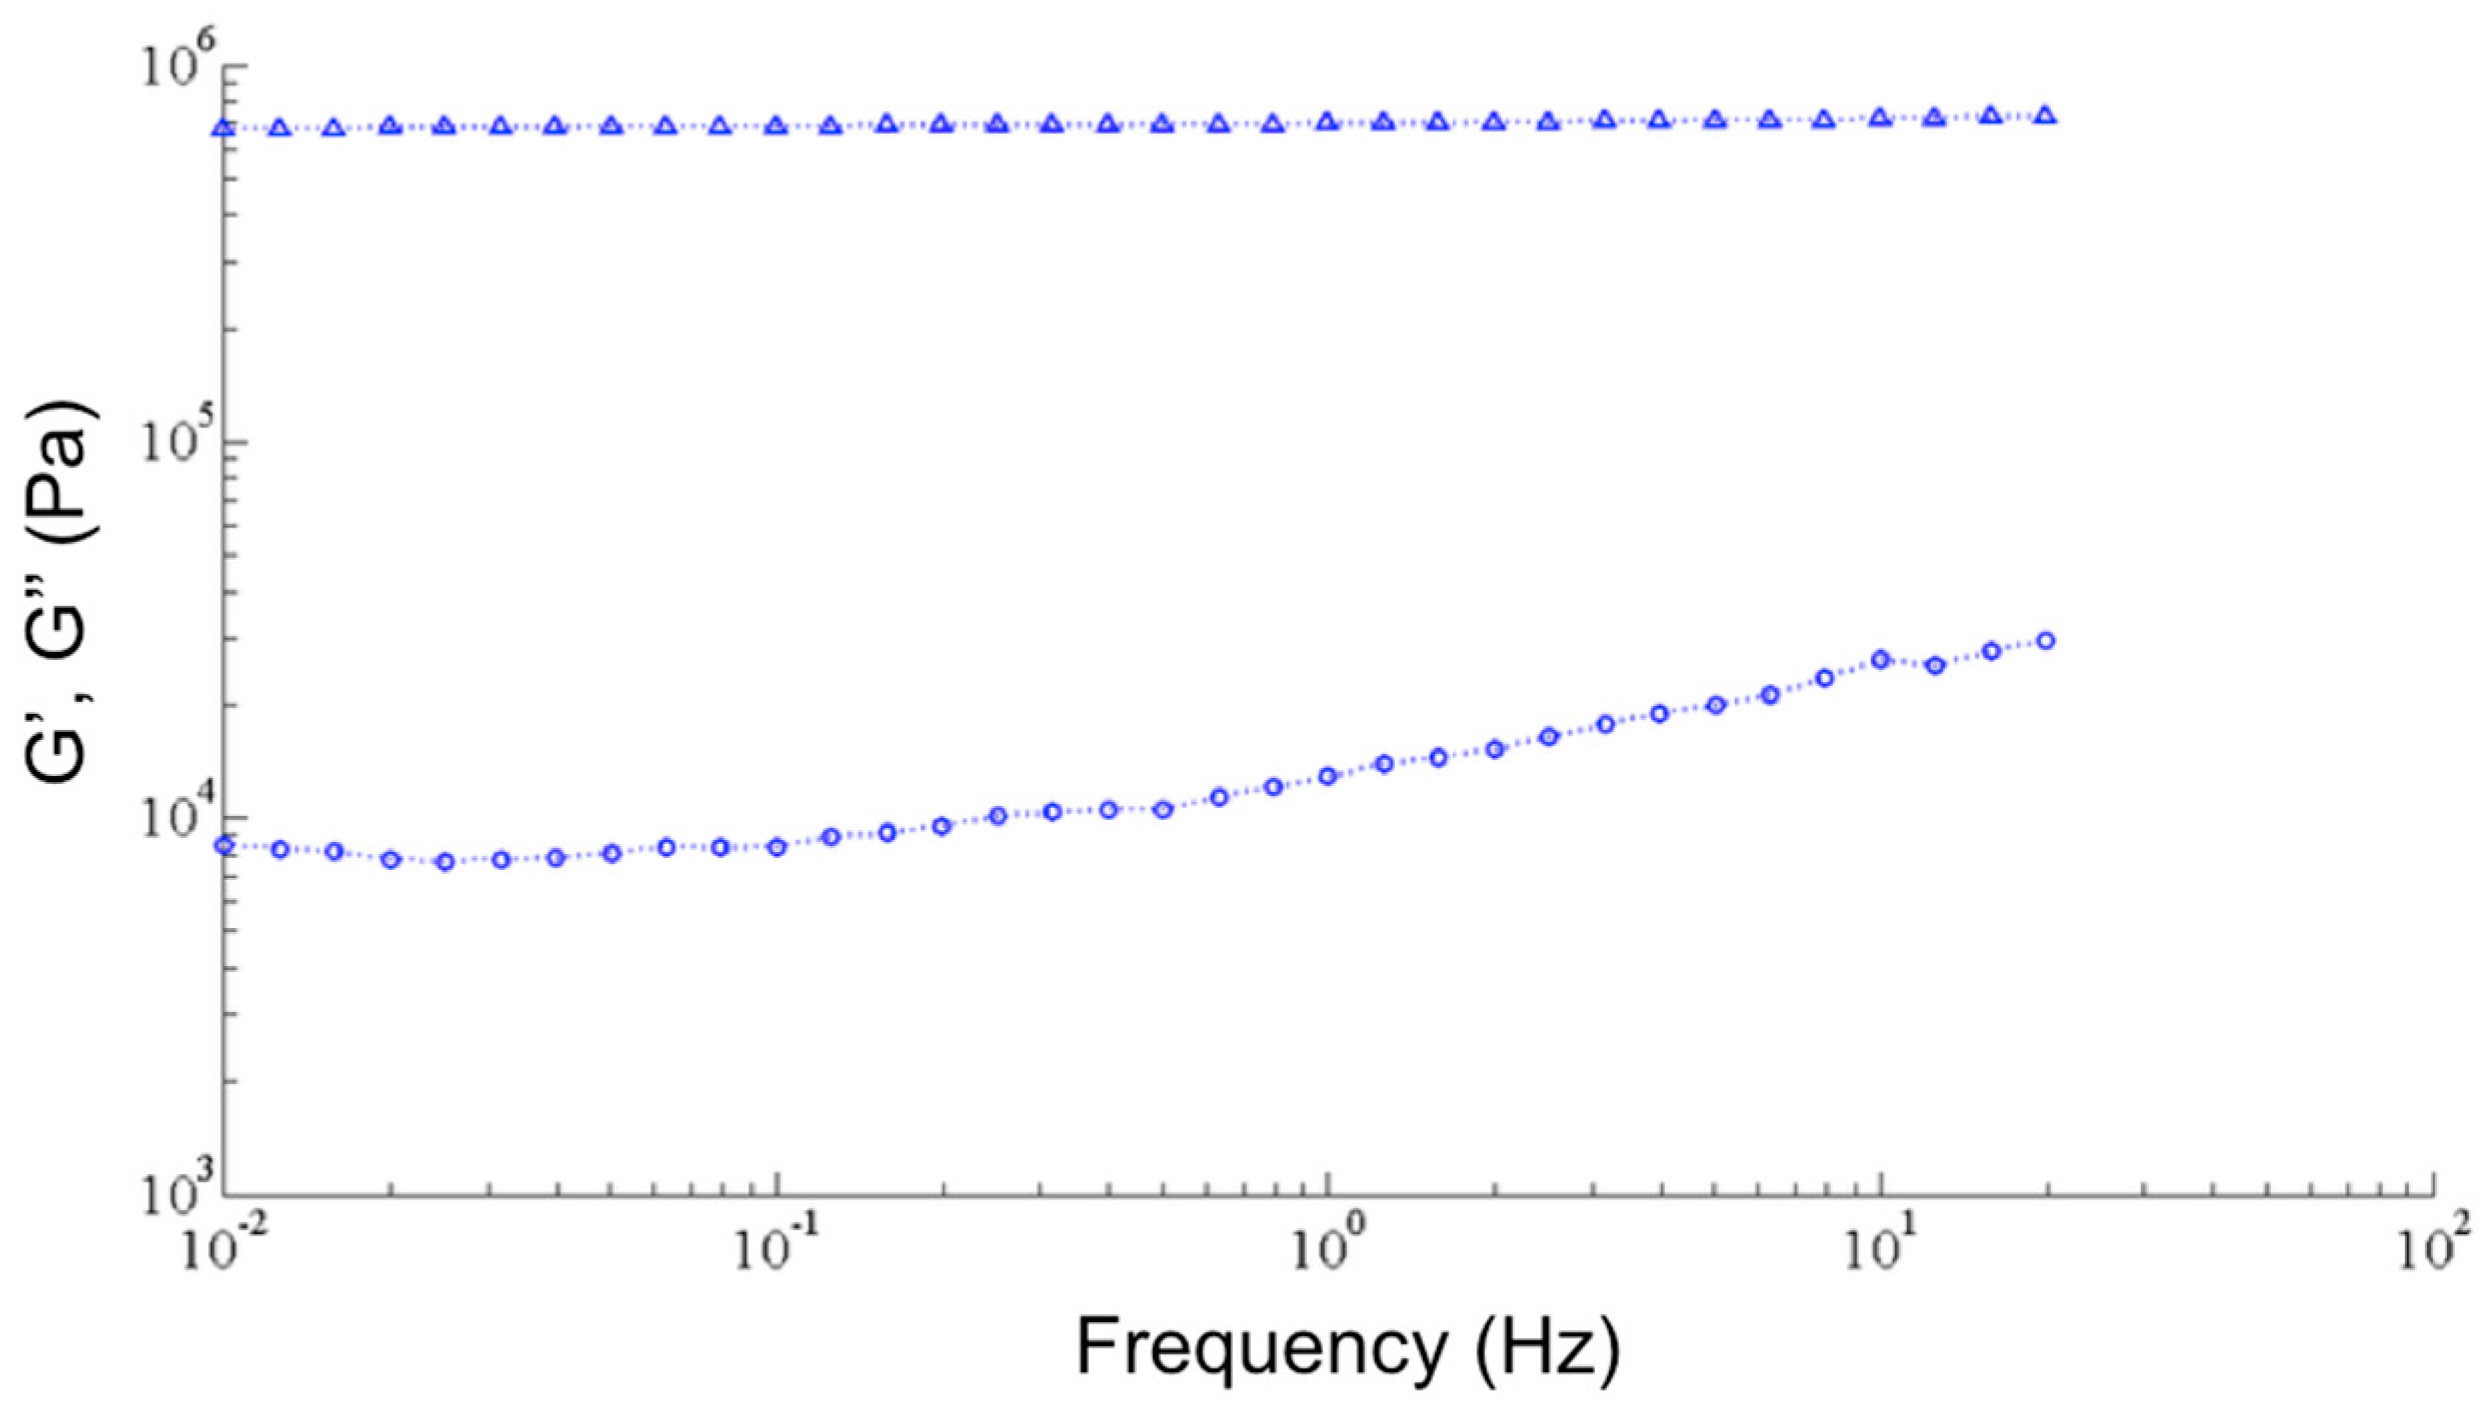
. Dynamic mechanical analysis (DMA) is a standard technique for measuring the frequency, temperature dependence, or both, of both moduli. For example,
Figure 1 shows a typical variation of both the storage and the loss modulus of a PDMS sample measured at 20 °C. It was obtained with an imposed deformation of 5% with frequencies varying between 0.01 Hz and 20 Hz.
By repeating the same kind of measurement at lower temperatures, the behavior of PDMS at higher frequencies can be inferred beyond the frequency range of the apparatus. The idea is to use the principle of Time–Temperature Equivalence (TTE) to generate a master curve of storage modulus vs. frequency at a particular temperature. The TTE principle states that the change in temperature from the measurement temperature,
T, to the reference,
T0, is equivalent to multiplying the frequency scale by the so-called horizontal translation factor
aT(
T,
T0). For example, Palade et al. [
7] were able to determine the viscoelastic properties of polybutadienes over 15 decades of frequencies window by performing rheological tests over a temperature range of 200 °C. However, for some polymers the application of the TTE is limited to a temperature range fixed by the crystallization temperature (~−40 °C for PDMS). Moreover, for most polymers, the translation factor takes different values for different relaxation (terminal or segmental) modes [
8,
9], thus making the TTE difficult to apply.
Here, we propose an alternative method to perform high frequency measurements. The idea is to form a one-layer crystal of bubbles by trapping air cavities in the elastomer of interest (here PDMS), to measure its acoustic transmission and to adjust the results by the simple analytic model presented in [
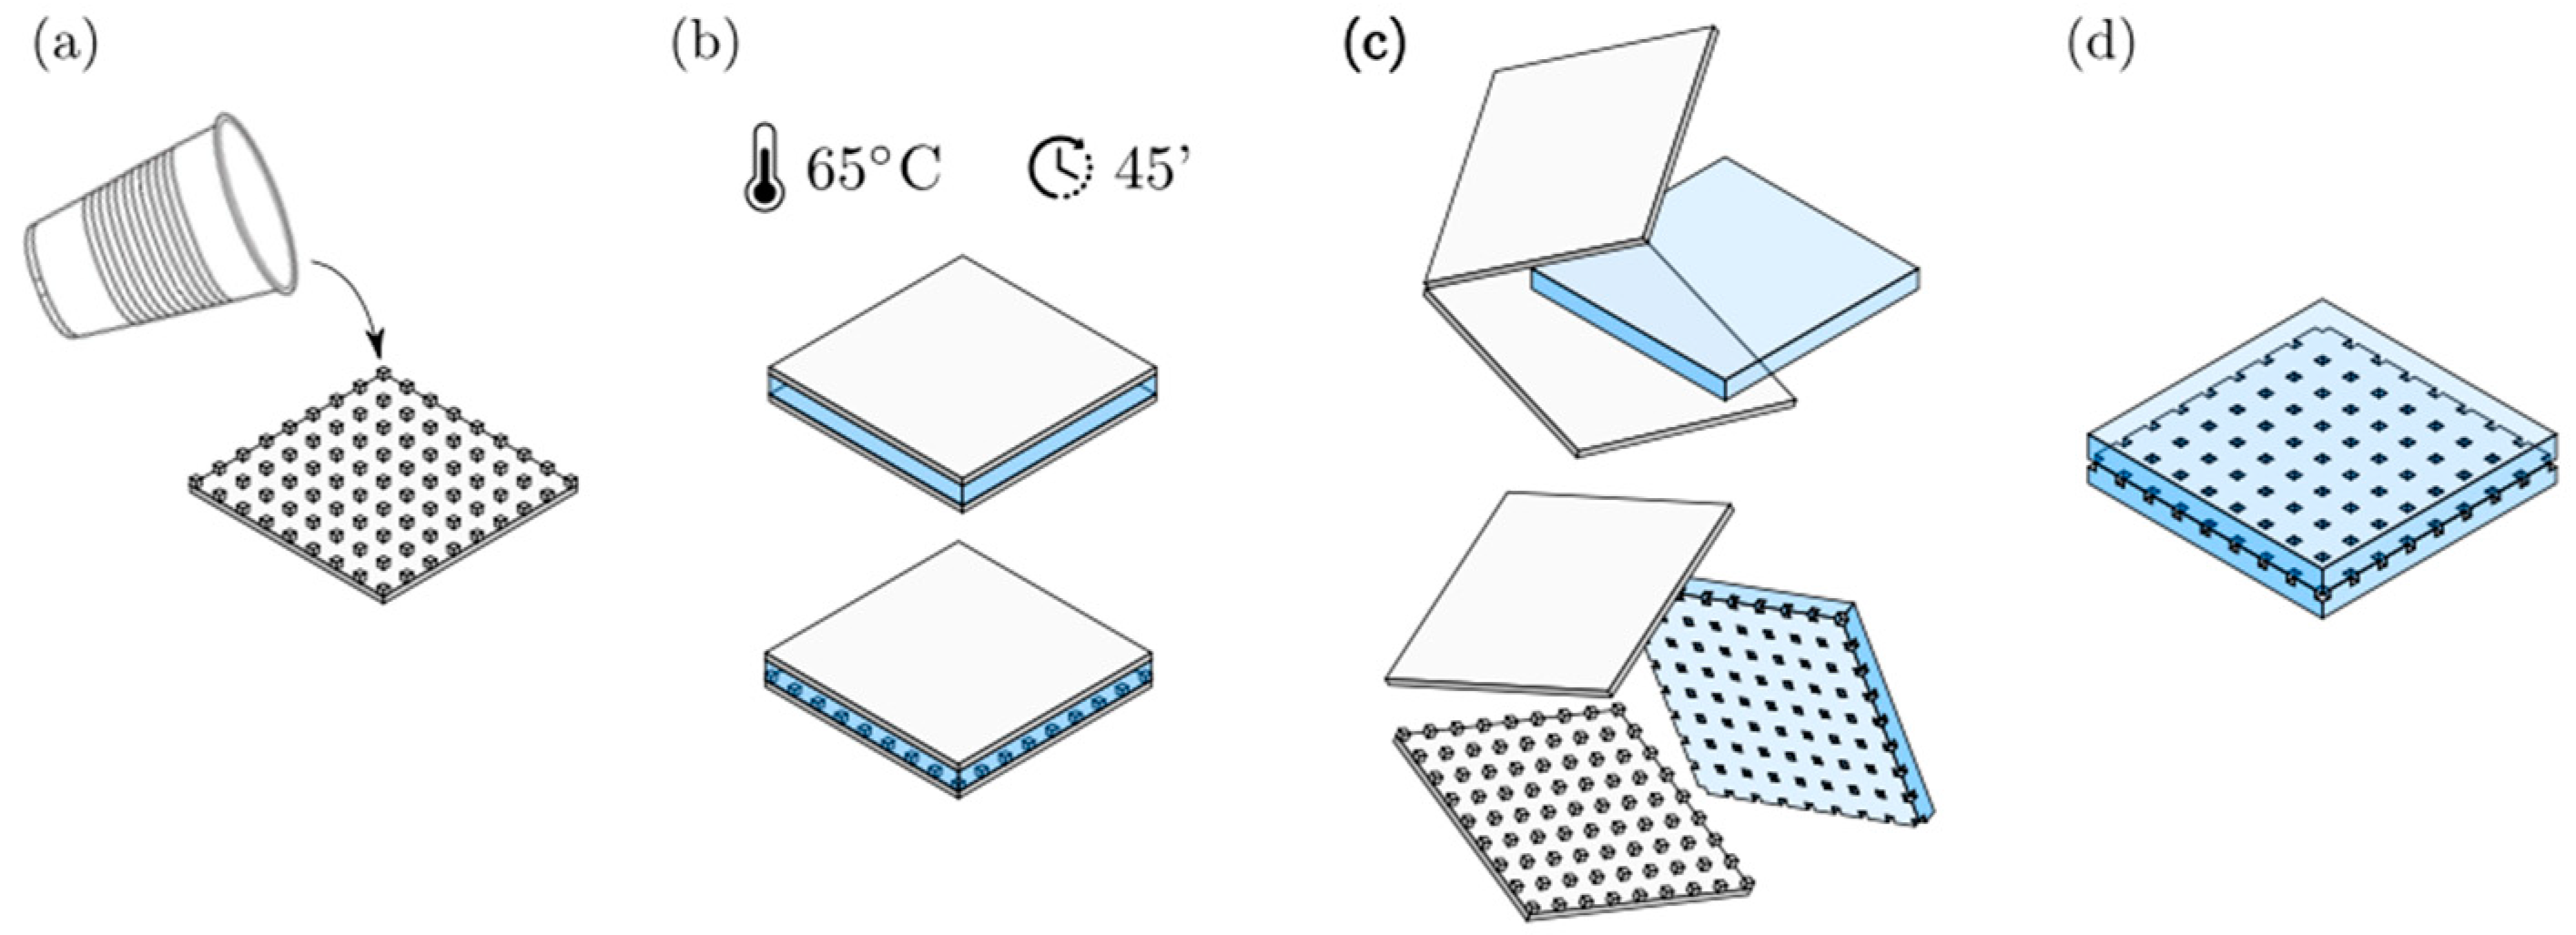
6]. The one-layer crystal of bubbles is fabricated using soft lithography techniques (
Figure 2). One first creates a mold consisting of a two-dimensional square arrangement of cubes. The cube side length is
acube = 590 μm and the lattice constant is
b = 2 mm. PDMS is soft enough such that the cube resonance is associated to a wavelength much larger than the air cavity size and pretty much the same as the one of a sphere with the same volume [
4,
10,
11]. The radius of the equivalent sphere is given by
. A thin layer of PDMS is then deposited on the mold and cured at 65 °C during 45 min. We thus obtain a patterned PDMS layer that we close by a pure PDMS layer.
Then, the transmission coefficient of such a one-layer crystal is predicted to be [
6]:
where
is the dissipative damping constant of the bubbles, and
with
the wavelength for longitudinal waves in PDMS.
For a gas cavity in a soft elastic medium dissipative damping is dominated by viscous losses such that
where
and
are the viscosity and density of PDMS, respectively [
12].
is assumed to be independent of frequency in the frequency range of interest.
Ka is a super-radiative term telling us that the bubble layer radiates
times more than one single bubble, where
represents the number of bubbles that oscillate in phase. We would like to stress that Equation (2) incorporates all multiple scattering events in the bubble layer and that it predicts a minimum in transmission at
.
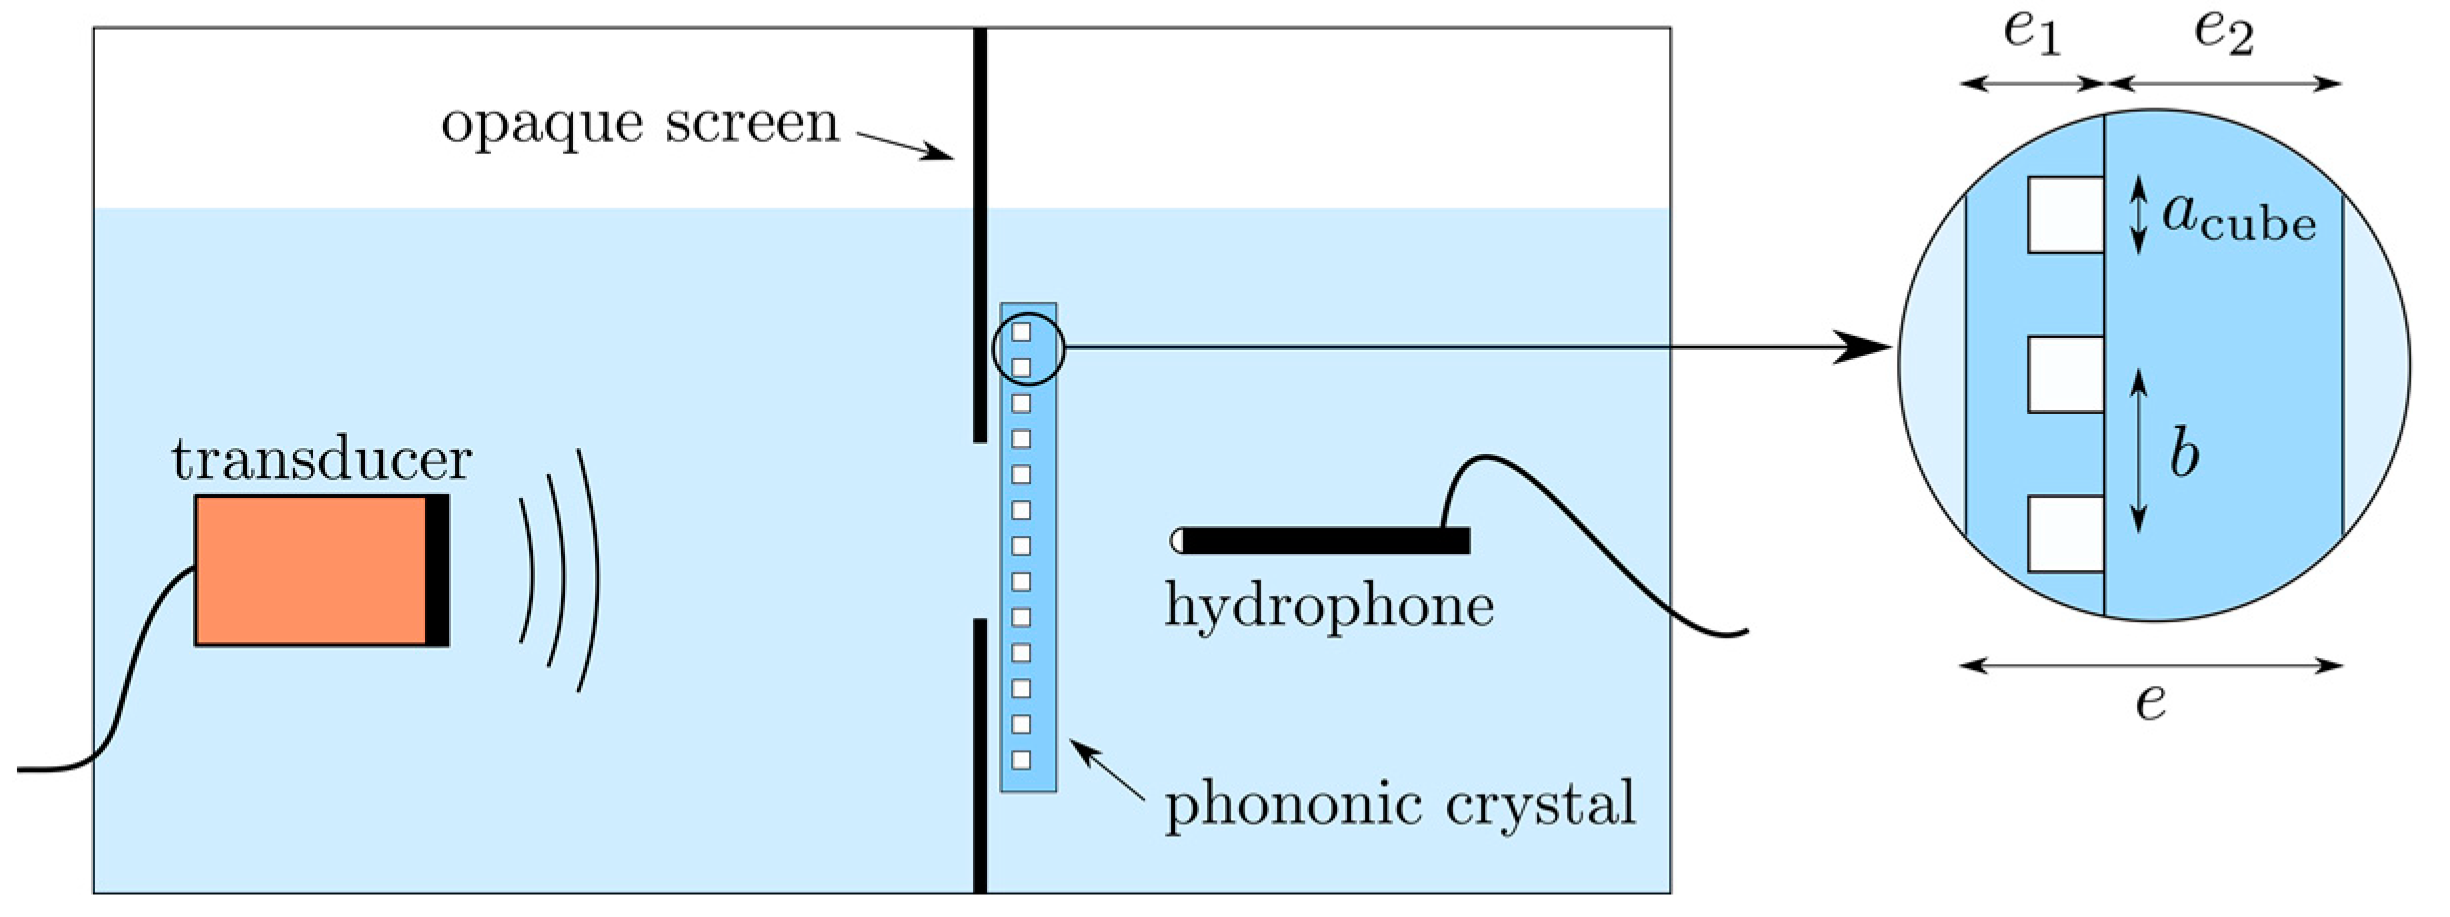
Transmission measurements were carried out in a large water tank (
Figure 3). A piezoelectric transducer generates a short pulse that propagates through water, traverses the bubble crystal, and reaches the hydrophone. To mimic a one-dimensional configuration, the sample is placed in the far field of the transducer. Edge effects were overcome by mounting the sample on the aperture (5 cm diameter) of an acoustically opaque screen.
3. Results
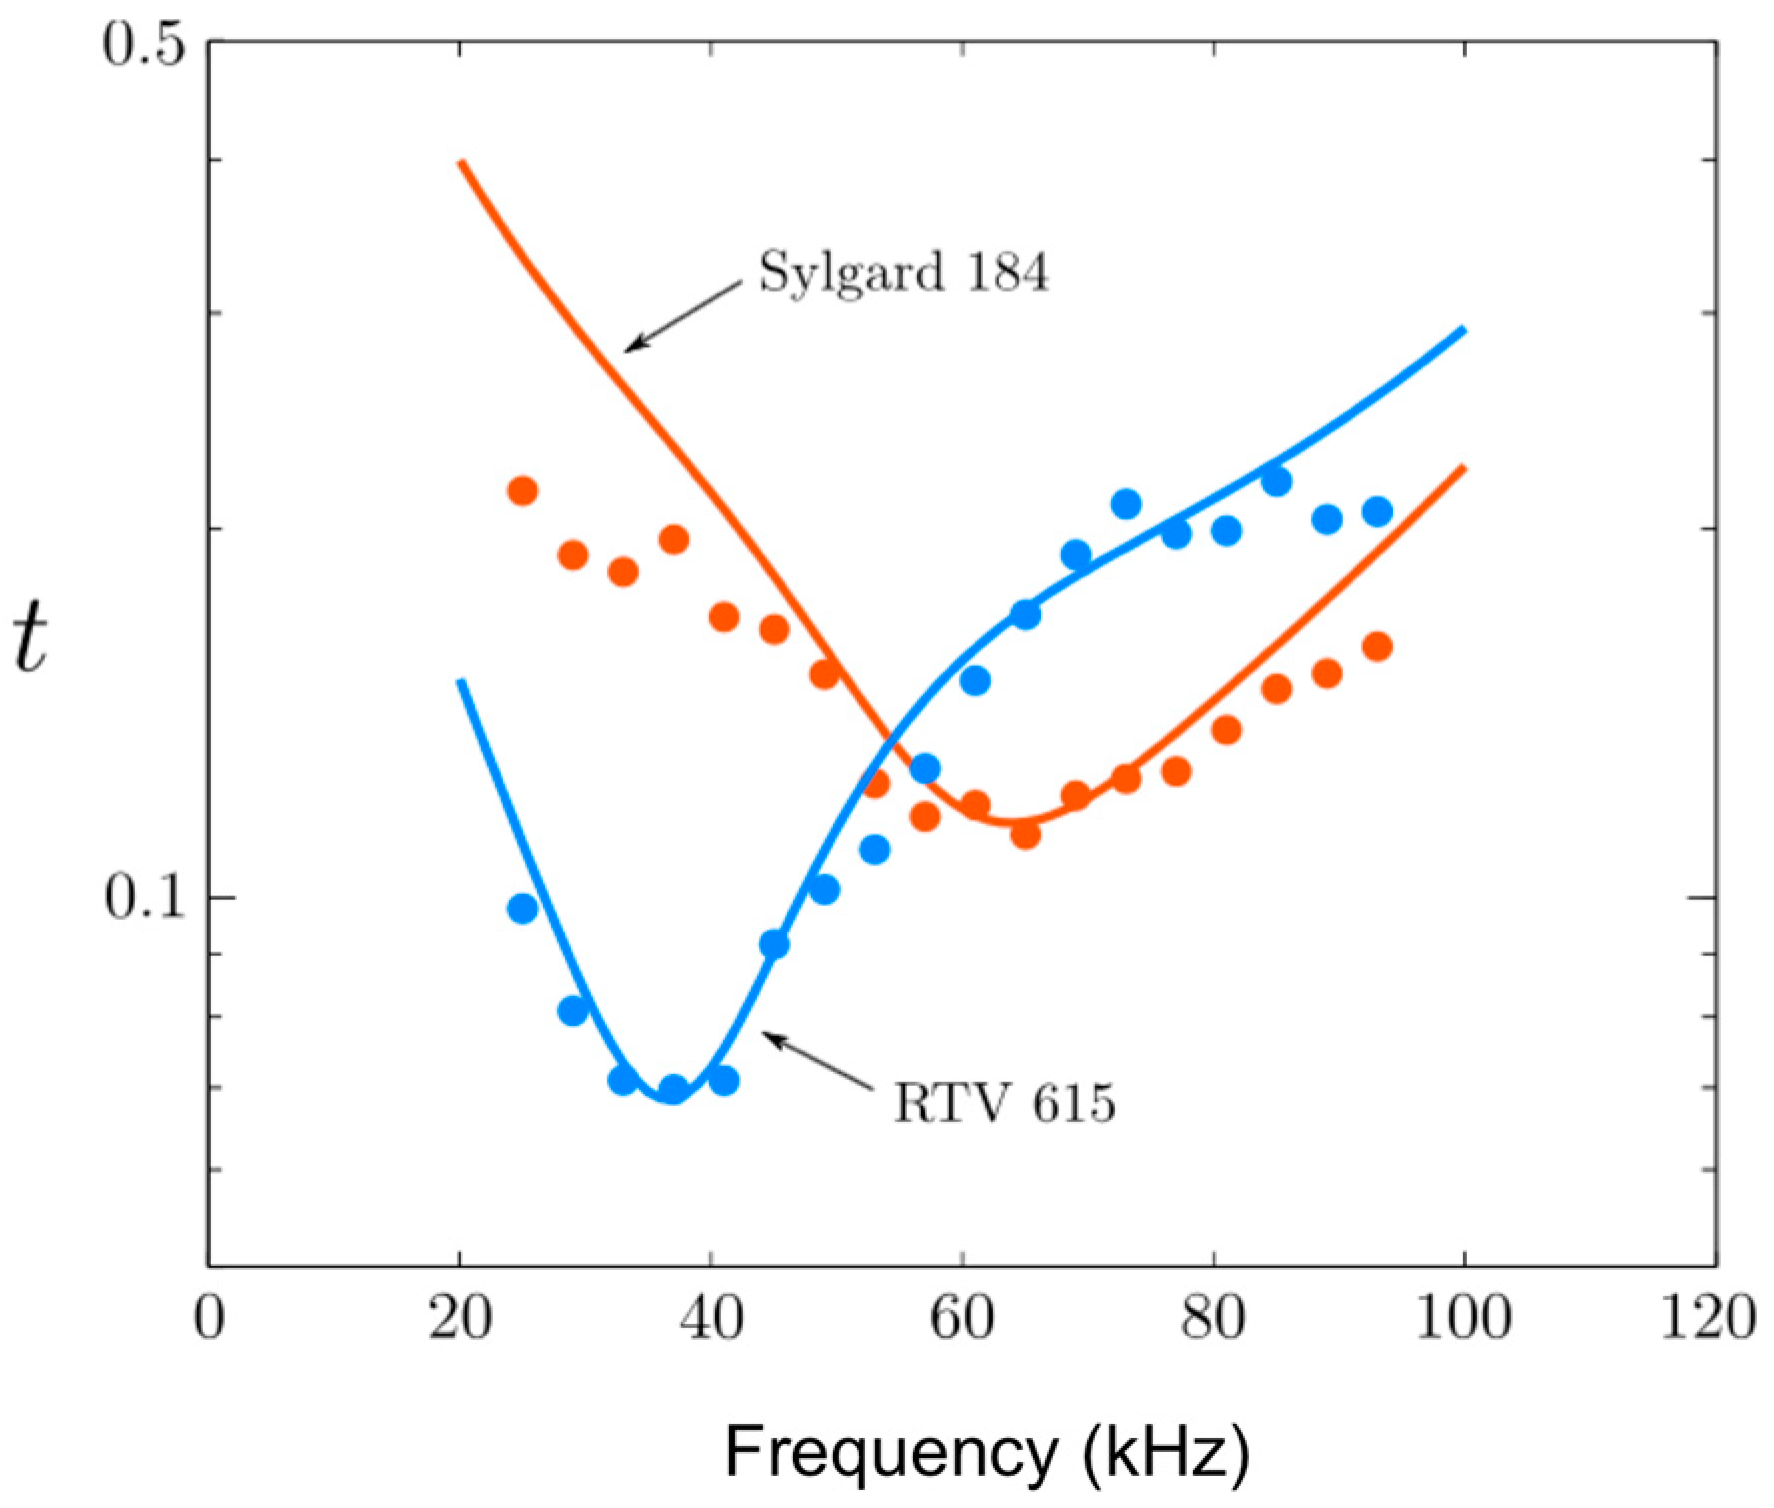
We studied two different commercial PDMS: Sylgard 184 and RTV615. The composition of these two products is carefully kept secret, but the RTV615 is known to be softer than Sylgard 184 and thus more convenient for the fabrication of microvalves in microfluidic devices. We have tested these two materials with our method. Following the process described in the previous section, we have fabricated two bubble crystals with the same structural parameters and measured their transmission coefficients (
Figure 4).
We would like to point out that the gap observed in
Figure 4 does not originate from Bragg scattering but rather from hybridization between the free space propagation mode and the bubble Minnaert resonance [
13,
14]. Such a gap is known to survive disorder [
15,
16]. The position of the transmission dip is driven by the storage modulus while its height is related to the loss modulus. The inferred values are listed in
Table 1. The results confirm that RTV615 is softer and less viscous than Sylgard, which explains why it is preferably used for the fabrication of microvalves.
Note that the uncertainty measurement originates from the margin of error in the cavity size (of the order of 10 μm). Given these promising results, we decided to use our method to monitor the ageing of PDMS, a phenomenon the users of PDMS are familiar with. Although appreciated for its great versatility, this material causes difficulties in terms of repeatability. The chain crosslinking mechanism is a complex phenomenon that depends on working conditions and is often incomplete. A very simplified image consists in picturing the polymer as a complex entanglement of chains with a degree of cross-linking which increases during the polymerization. As a consequence, it quickly becomes difficult for free chains to reach the reactive sites. A well-known manifestation of this phenomenon is the evolution of the interfacial properties of PDMS. While being naturally hydrophobic, PDMS is often treated with oxygen plasma to obtain good conditions of wetting. However, this treatment does not resist in the long-term because of the migration of low molecular weight chains to the surface. However, if these chains move under the effect of diffusion, they are also required to continue crosslinking according to very specific time scales.
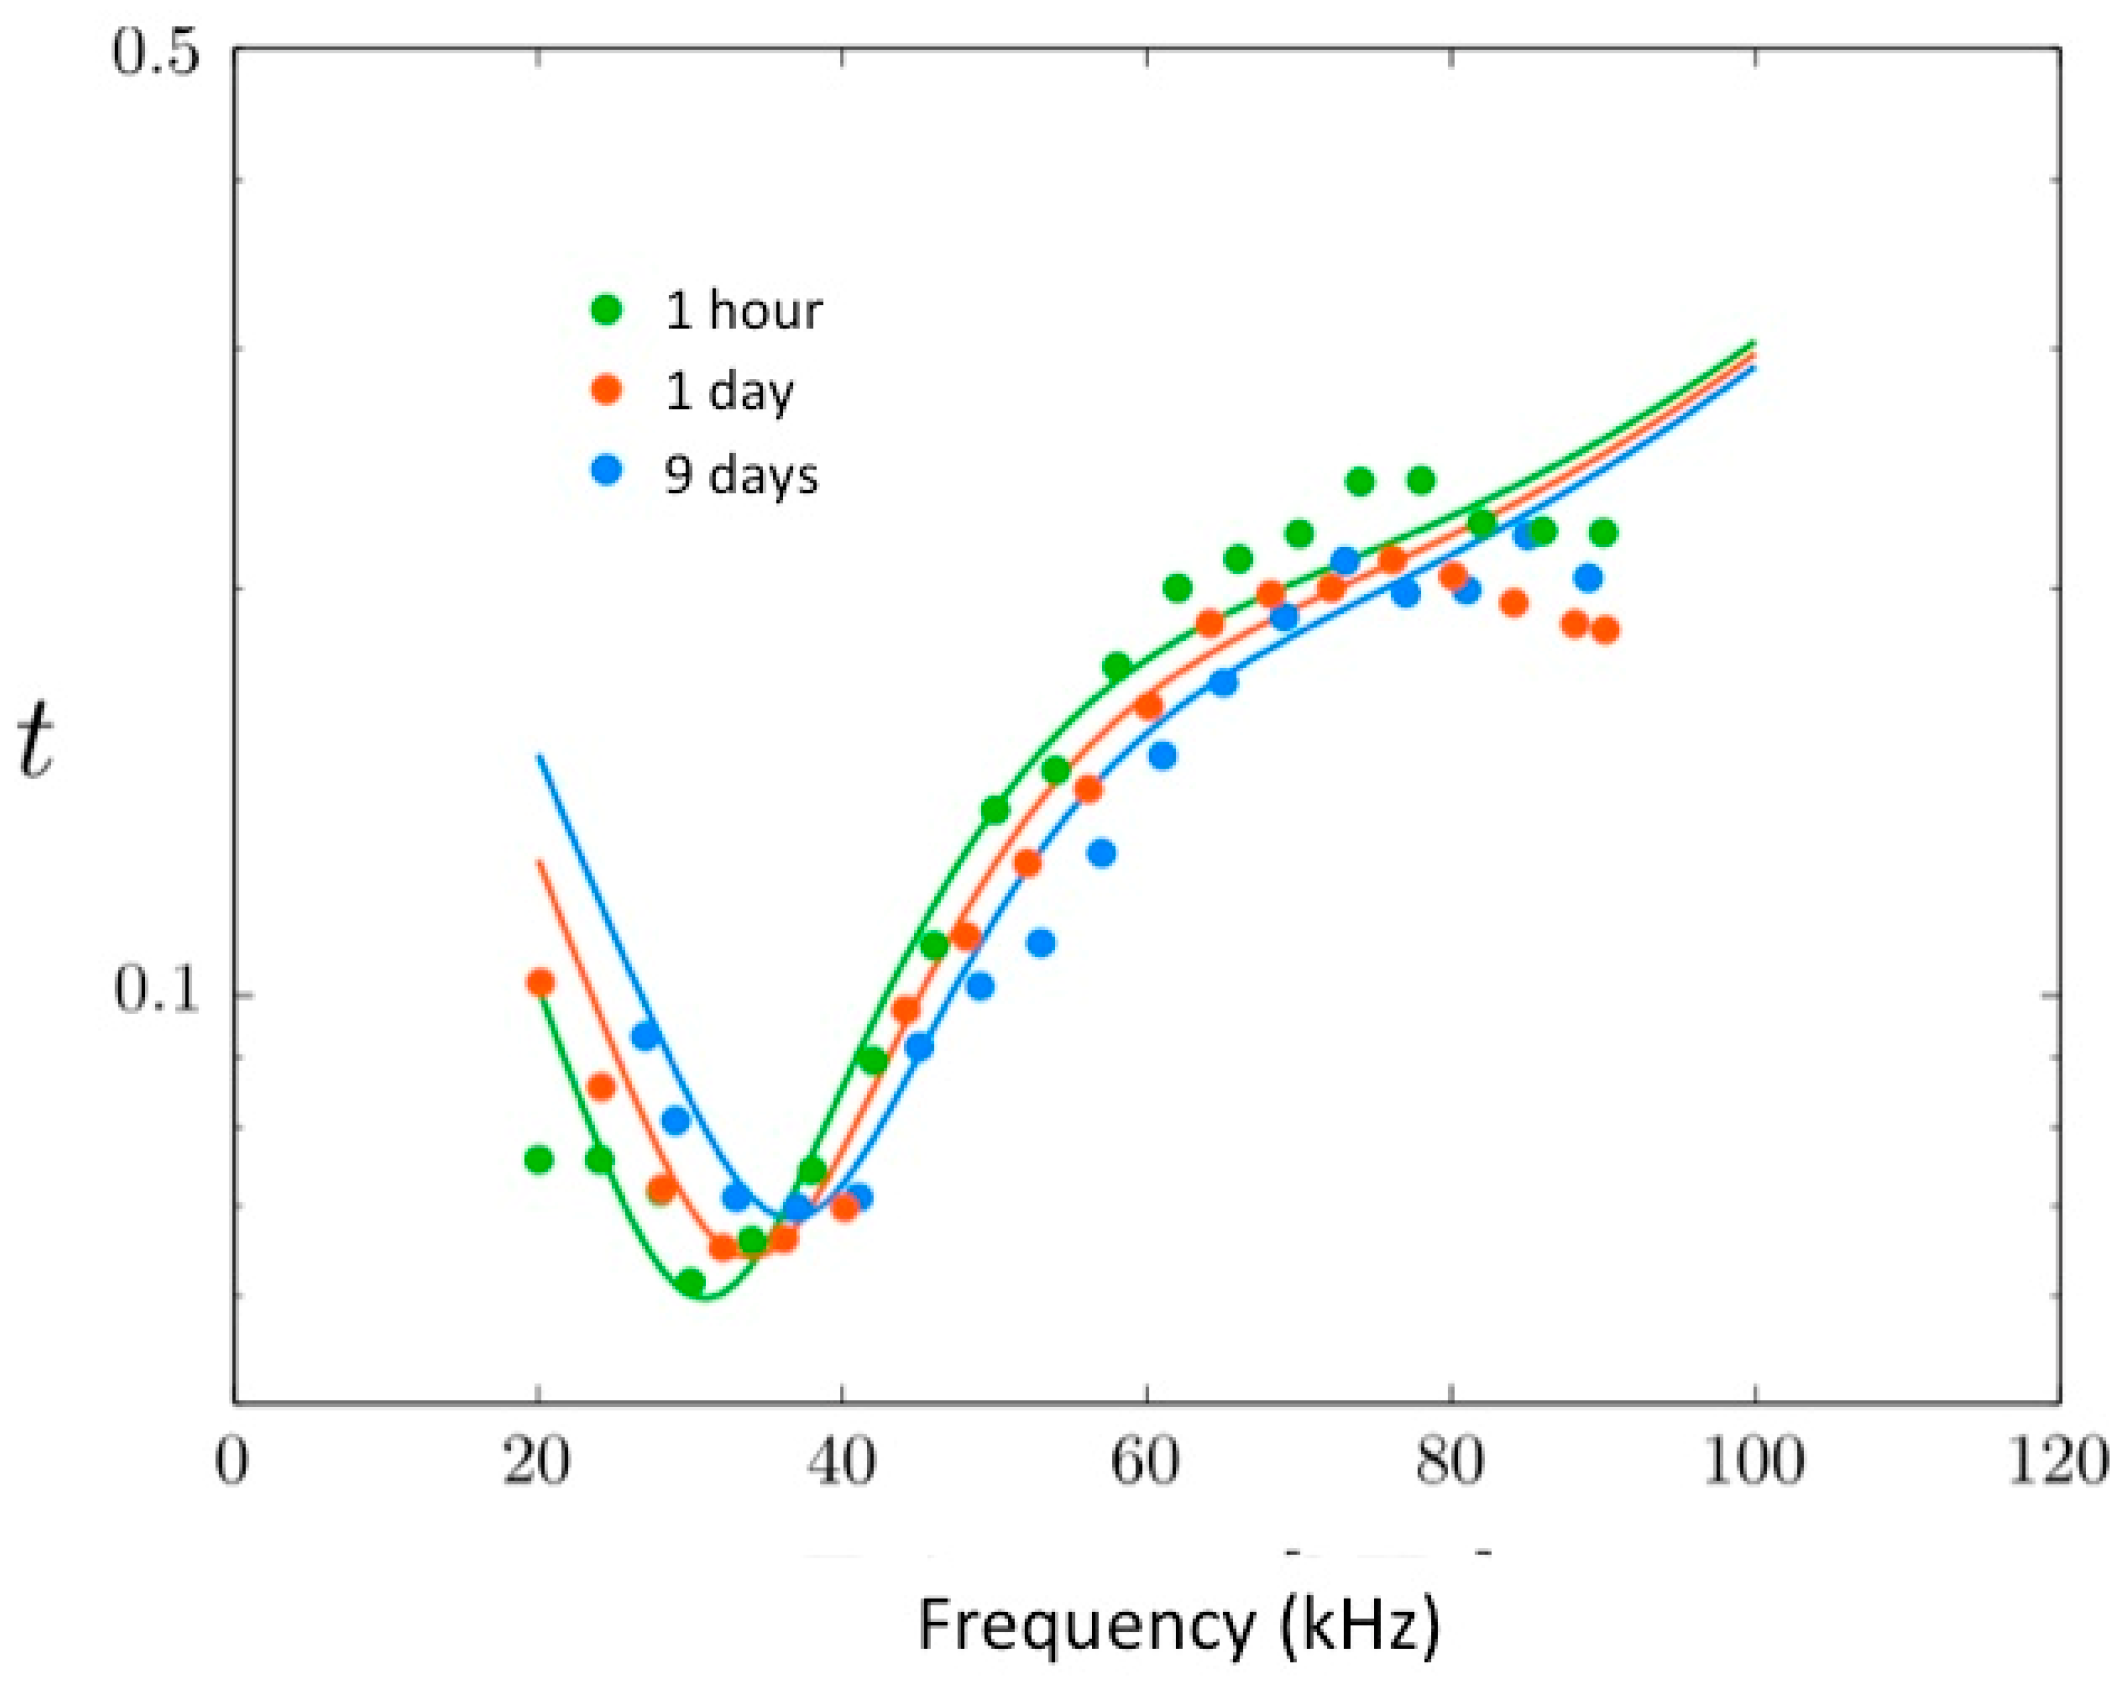
To illustrate this phenomenon, we have performed time-lapse measurements of the acoustic transmission through a periodic layer of bubbles embedded in RTV615.
Figure 5 shows the acoustic transmission curves obtained respectively 1 h, 1 day, and 9 days after curing. Ageing manifests itself in the shift of the resonance towards higher frequency, which reflects an increase in the storage modulus.
This result is consistent: the higher the degree of crosslinking, the less chain rearrangements are likely to occur. The response to a solicitation then becomes essentially elastic and PDMS hardens. From a more quantitative point of view, we obtained a good agreement with the model for the values listed in
Table 2.
4. Discussion
For some polymers, the crystallization phenomenon limits the temperature range which can be explored such that the determination of the shear modulus remains limited to low frequencies. Several strategies based on the measurement of both the velocity and the attenuation of shear waves have been proposed in the past for reaching higher frequencies up to the MHz range. Reflection measurements are preferably used due to the strong attenuation of shear waves in viscoelastic materials at these frequencies. For example, in [
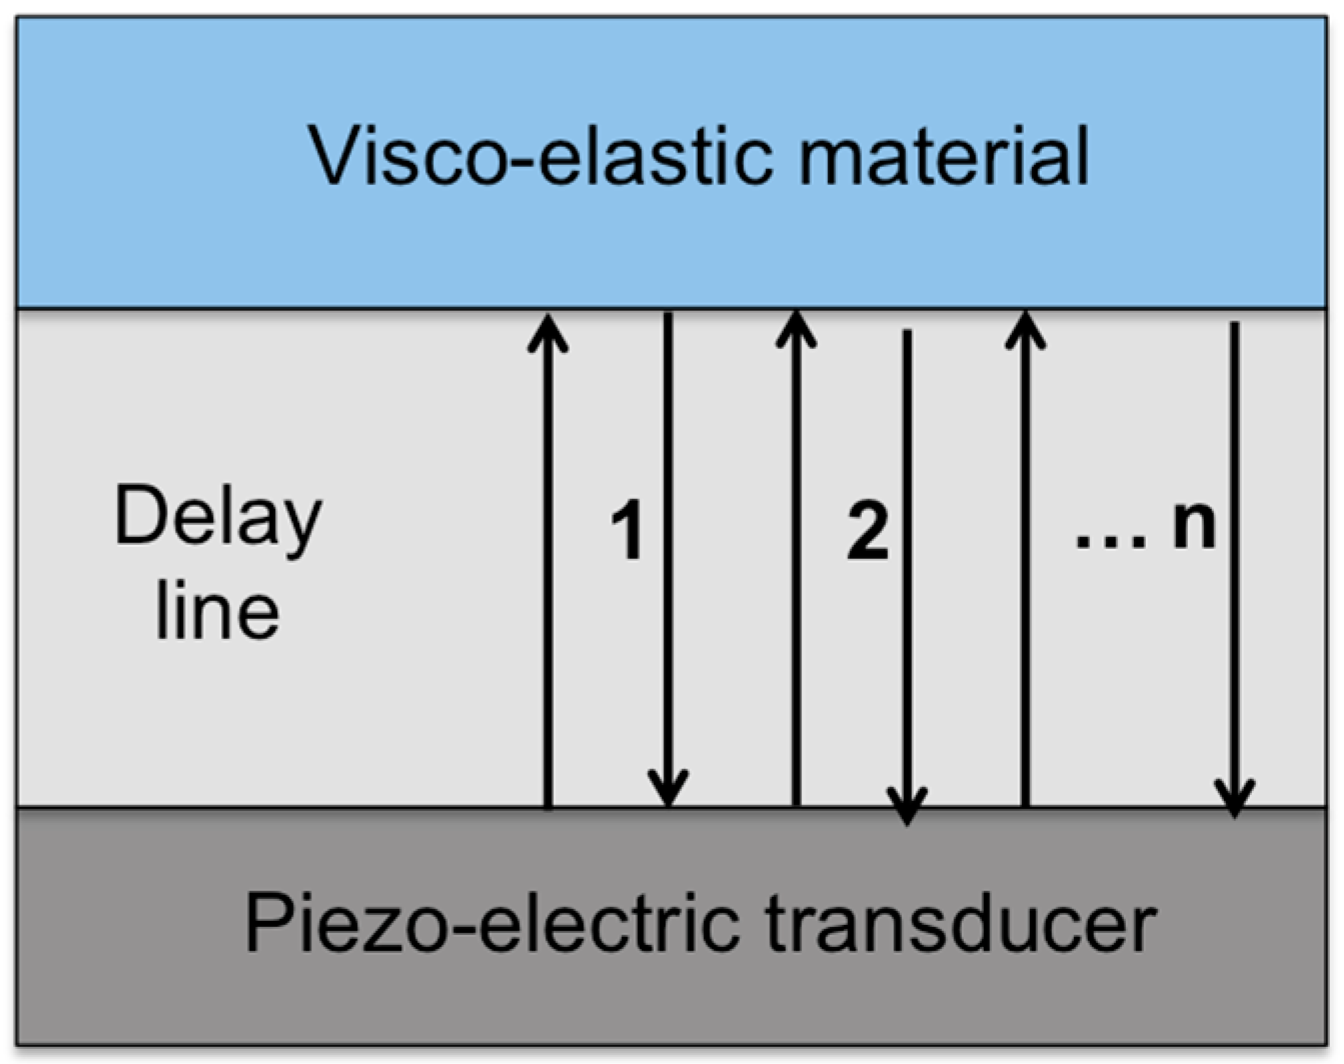
17] the authors exploit the echoes reflected at the interface between the sample of interest and a piece of quartz, the latter being used as a delay line. The echoes measured in absence of the sample (i.e., at the quartz/air interface) are taken as a reference. The storage and loss shear modulus can then be determined from the n
e echo by taking the ratio of its amplitude to the reference and the difference between its arrival time and the one of the reference (
Figure 6).
The method however requires frequencies sufficiently high such that the successive echoes do not overlap. The length of the delay line can be increased to overcome this difficulty, the price to pay being diffraction effects that blur the results. Furthermore, a good coupling between the viscoelastic material and the delay line is crucial.
Our alternative approach avoids these difficulties. We have shown that bubbles trapped in a viscoelastic material to form a bubble phononic crystal can be used to probe its rheological properties in a frequency domain (a few tens of kHz) hard to reach with either DMA or acoustic reflection measurements. Of course, some further tests will be required to fully validate this approach as a new rheology measurement technique. Such a method should be useful to probe the rheological properties of cross-linked polymers in an intermediate frequency range (i.e., from a few tens of kHz up to a few MHz) not accessible by common techniques. Interestingly, it appears as an unexpected outcome of the work we have done for the last ten years on the exotic transmission properties of bubble phononic crystals.


