Article

Fluorine Translational Anion Dynamics in Nanocrystalline Ceramics: SrF2-YF3 Solid Solutions

1
Christian Doppler Laboratory for Lithium Batteries, and Institute for Chemistry and Technology of Materials, Graz University of Technology (NAWI Graz), Stremayrgasse 9, 8010 Graz, Austria
2
Alistore-ERI European Research Institute, 33 rue Saint Leu, 80039 Amiens, France
*
Authors to whom correspondence should be addressed.
Crystals 2018, 8(3), 122; https://doi.org/10.3390/cryst8030122
Submission received: 24 January 2018 / Revised: 1 March 2018 / Accepted: 2 March 2018 / Published: 5 March 2018
(This article belongs to the Special Issue Ceramic Conductors)

Abstract

:
Nanostructured materials have already become an integral part of our daily life. In many applications, ion mobility decisively affects the performance of, e.g., batteries and sensors. Nanocrystalline ceramics often exhibit enhanced transport properties due to their heterogeneous structure showing crystalline (defect-rich) grains and disordered interfacial regions. In particular, anion conductivity in nonstructural binary fluorides easily exceeds that of their coarse-grained counterparts. To further increase ion dynamics, aliovalent substitution is a practical method to influence the number of (i) defect sites and (ii) the charge carrier density. Here, we used high energy-ball milling to incorporate Y 3 + ions into the cubic structure of SrF 2 . As compared to pure nanocrystalline SrF 2 the ionic conductivity of Sr 1 x Y x F 2 + x with x = 0.3 increased by 4 orders of magnitude reaching 0.8 × 10 5 S cm 1 at 450 K. We discuss the effect of YF 3 incorporation on conductivities isotherms determined by both activation energies and Arrhenius pre-factors. The enhancement seen is explained by size mismatch of the cations involved, which are forced to form a cubic crystal structure with extra F anions if x is kept smaller than 0.5.

Graphical Abstract

1. Introduction

Nanostructured materials assume a variety of functions in quite different applications and devices of our daily life [1]. Considering nanocrystalline ionic conductors [2,3,4,5], a range of studies report on enhanced anion and cation dynamics [6,7]. Structural disorder and defects [8,9,10], lattice mismatch [11,12,13] as well as size effects [14,15,16,17,18,19], which results in extended space charge regions, are used to explain the properties of nanocrystalline compounds. Especially for nano-engineered systems, which were prepared by bottom-up procedures, such as gas condensation or epitaxial methods [20,21], space charge regions lead to non-trivial effects that may enhance ion transport. This effect has not only been shown for the pioneering prototype system BaF 2 -CaF 3 [20] but also, quite recently, for nanoscopic, grain-boundary engineered SrF 2 -LaF 3 heterolayers [22].
If prepared via a top-down approach such as ball milling [8,23,24,25], the nanocrystalline material obtained is anticipated to consist of nm-sized crystals surrounded by structurally disordered regions [6,26]. In particular, this structural model helped rationalize ion dynamics in oxides [8]. For fluorides instead, amorphous regions are present to a much lesser extent [27,28]. High-energy ball milling also increases the density of defects in the interior of the nanograins [10,28]. Starting with binary fluorides, such as nanocrystalline BaF 2 , whose F anion conductivity exceeds that of BaF 2 monocrystals by some orders of magnitude [12], iso- and aliovalent substitution of the metal cations drastically improves ion transport [11,29]. As an example, in the nanocrystalline solid solutions Me 1 x Sr x F 2 ( Me = Ca , Ba ) the ionic conductivity passes through a maximum at intermediate values of x while the corresponding activation energy shows a minimum, the same holds for Ba 1 x Ca x F 2 [11]. Although the original cubic crystal structure remains untouched for the mixed systems, strain and defects resulting from mixing sensitively affects F anion dynamics [11,12,30]. Metastable Ba 1 x Ca x F 2 , however, cannot be prepared via solid state synthesis; instead, it is only accessible by high-energy ball milling that forces the cations ions, substantially differing in size, to form a solid solution at atomic scale [12].
Provided the cubic crystal system is retained, aliovalent substitution, e.g., with LaF 3 or YF 3 , increases the number density of mobile F anions. This effect has been shown for Ba 1 x La x F 2 + x [29,31]. Starting with SrF 2 and YF 3 (see Figure 1) a similar behavior is expected. So far, Sr 1 x Y x F 2 + x solid solutions have been prepared by ceramic synthesis and wet chemical approaches. Here, we report the dynamic parameters of nanocrystalline Sr 1 x Y x F 2 + x obtained through high-energy ball milling. By using high impact planetary mills we managed to incorporate YF 3 into SrF 2 until the composition Sr 0.7 Y 0.3 F 2.3 . Ionic conductivity greatly differs from that of Y-free nanocrystalline SrF 2 . Ionic conductivities at elevated temperature might be high enough to realize high-temperature all-solid-state fluorine batteries [32,33,34,35]. In addition, as pointed out by Ritter et al. nanoscopic compounds based on SrF 2 as host for rare elements might act as new luminescent materials [36].

2. Materials and Methods

Nanocrystalline Sr 1 x Y x F 2 + x samples were prepared in a planetary high-energy ball mill (Fritsch P7, Premium line, Fritsch, Idar-Oberstein, Germany) by mixing SrF 2 and YF 3 in the desired molar ratio. We used a 45 mL ZrO 2 cub with 140 zirconium oxide milling balls (5 mm in diameter). To guarantee complete transformation the mixtures were milled for 10 h at a rotation speed of 600 rpm under dry conditions, i.e., without the addition of any solvents.
The phase purity and crystal system was checked via X-ray diffraction (Bruker D8 Advance, Bragg Brentano geometry, 40 kV, Bruker AXS, Rheinstetten, Germany). With the help of the Scherrer equation [37] we roughly estimated the crystallite size of the samples, see ref. [10,38] for further details on this procedure. Usually, after sufficiently long milling periods the mean crystallite size reaches 10 to 20 nm [39]. 19 F magic angle spinning nuclear (MAS) magnetic resonance (NMR) was used to characterize SrF 2 and YF 3 as well as the mixed fluorides at atomic level. We recorded rotor-synchronized Hahn echoes by employing a Bruker 2.5-mm MAS probe placed in a 11.4 T cryomagnet. Spectra were measured with a Bruker Avance 500 spectrometer (Bruker BioSpin, Rheinstetten, Germany). Spinning was carried out with ambient bearing gas pressure. The π / 2 pulse length was 2.1 μ s at 50 W power level; the recycle delay was 20 s and 64 transients were accumulated for each spectrum. We took advantage of LiF powder as a secondary reference ( 204.3 ppm ) [40] to determine chemical shifts δ iso ; CFCl 3 (0 ppm) served as the primary reference.
To analyze ionic conductivities, the powders were uniaxially cold-pressed to pellets (8 mm in diameter, 0.5 to 1 mm in thickness). After applying electrically conducting Au electrodes (100 to 200 nm) via sputtering, a Novocontrol Concept 80 broadband analyzer (Novocontrol Technologies, Montabaur, Germany) was employed to record conductivity isotherms and complex impedances as a function of temperature. The broadband dielectric analyzer was connected to a QUATRO cryo system (Novocontrol Technologies, Montabaur, Germany) that allows precise settings of temperature and an automatic execution of the measurements. The QUATRO is operated with a stream of freshly evaporated nitrogen gas that passes a heater and enters the sample chamber where the temperature is measured using Pt-100 thermocouples. We used a voltage amplitude of 100 mV and varied the frequency ν from 0.1 Hz to 10 MHz. The isotherms revealed distinct frequency-independent plateaus from which direct current DC conductivities σ DC (see above) were read off for each temperature T.

3. Results and Discussion
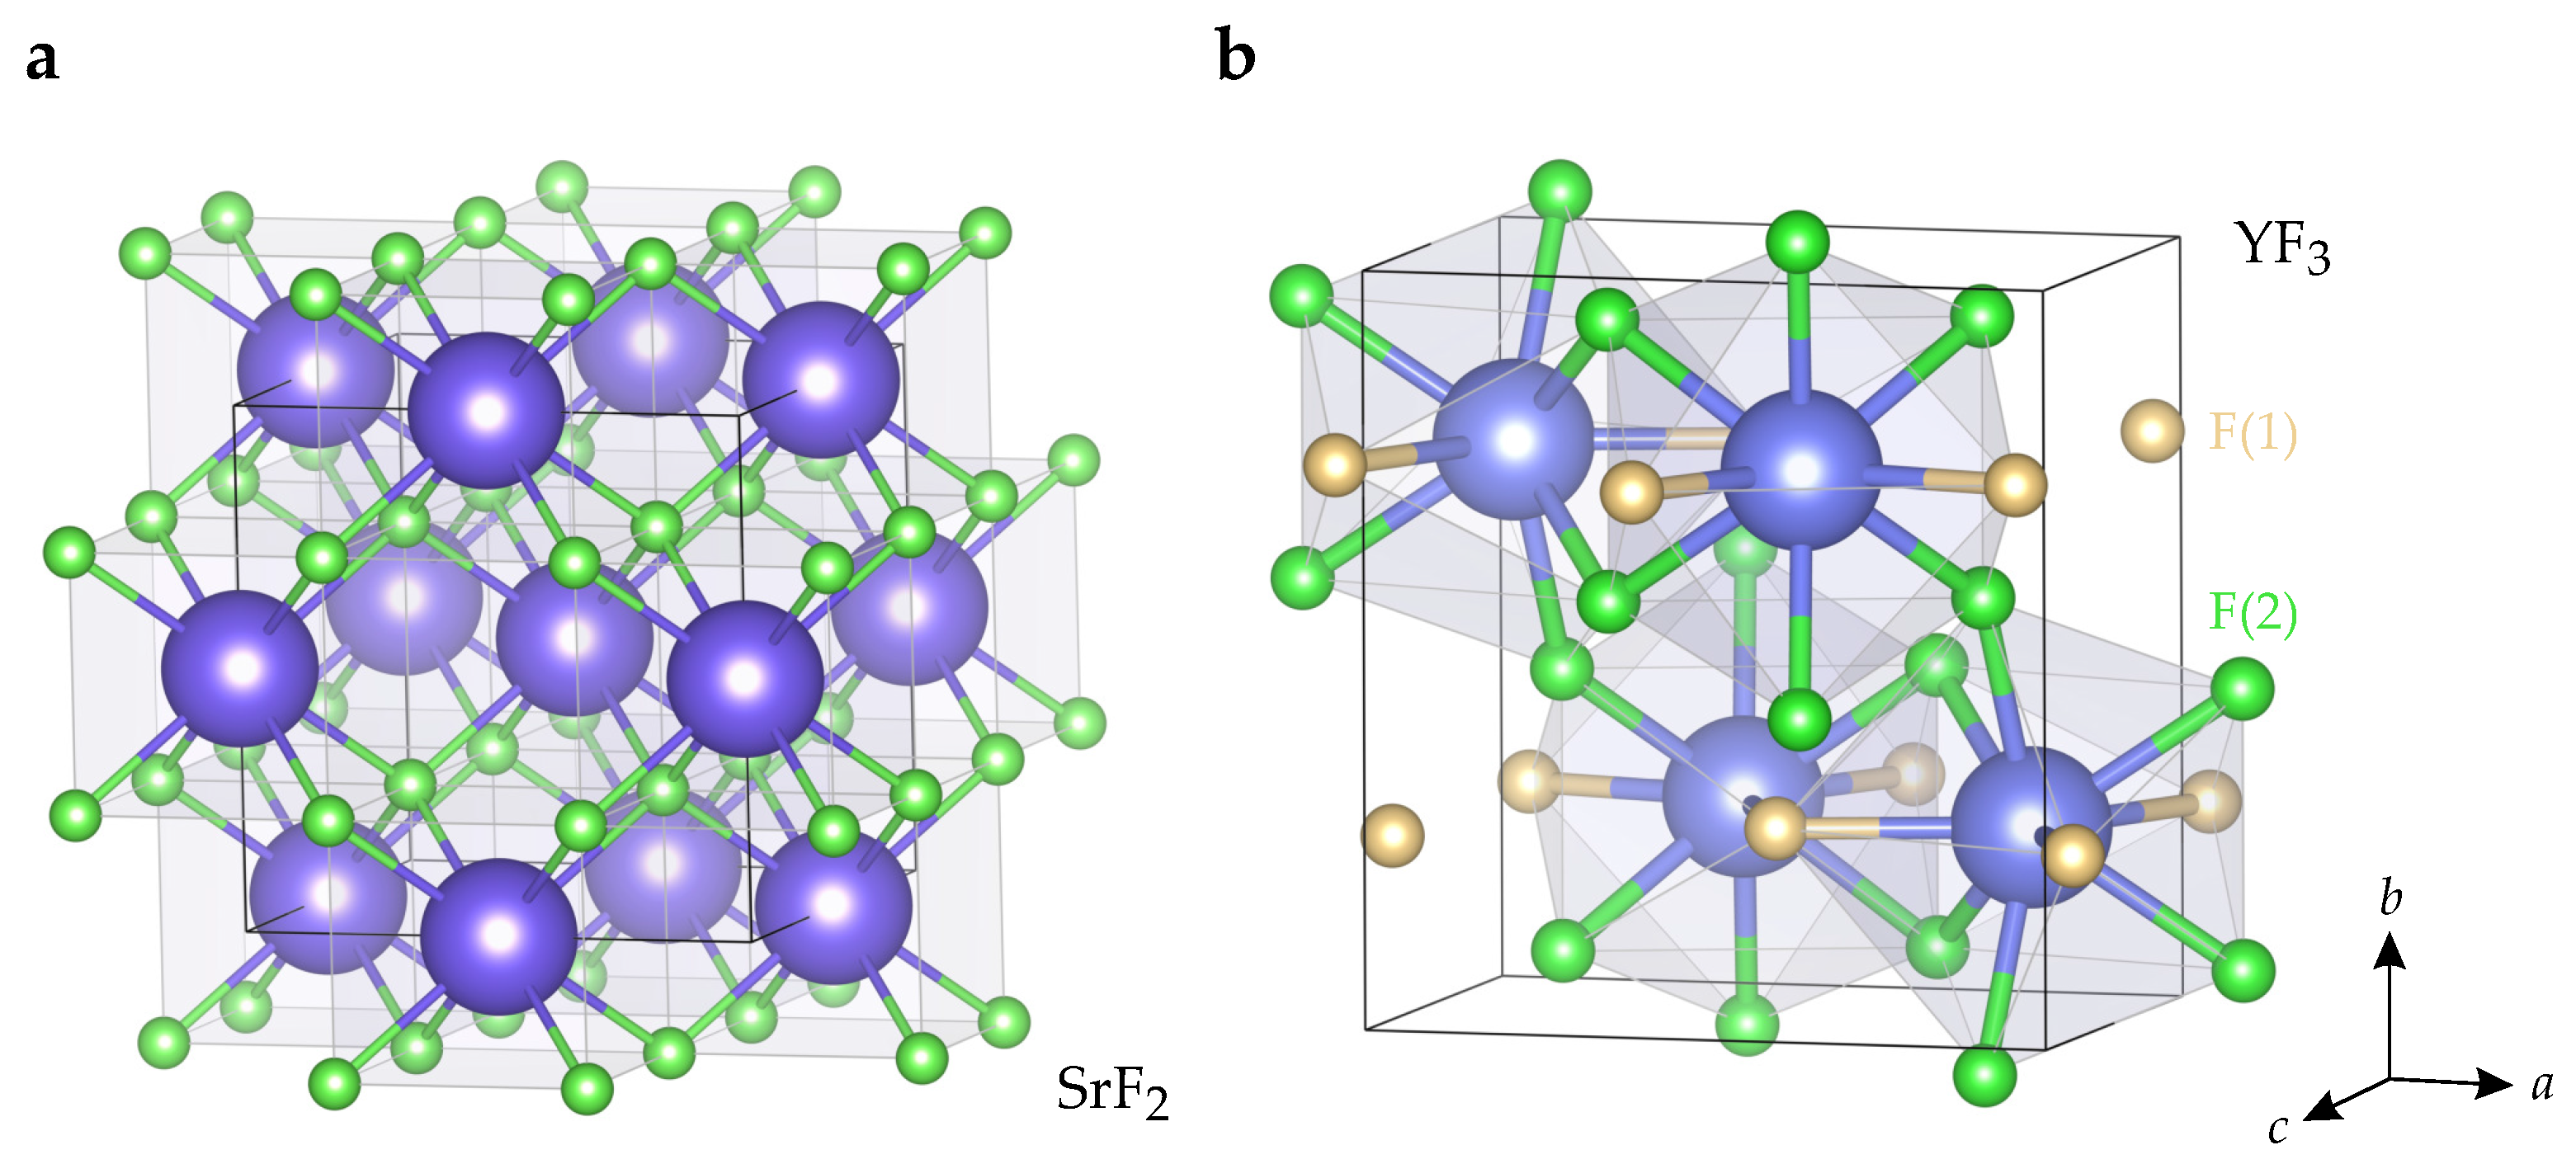
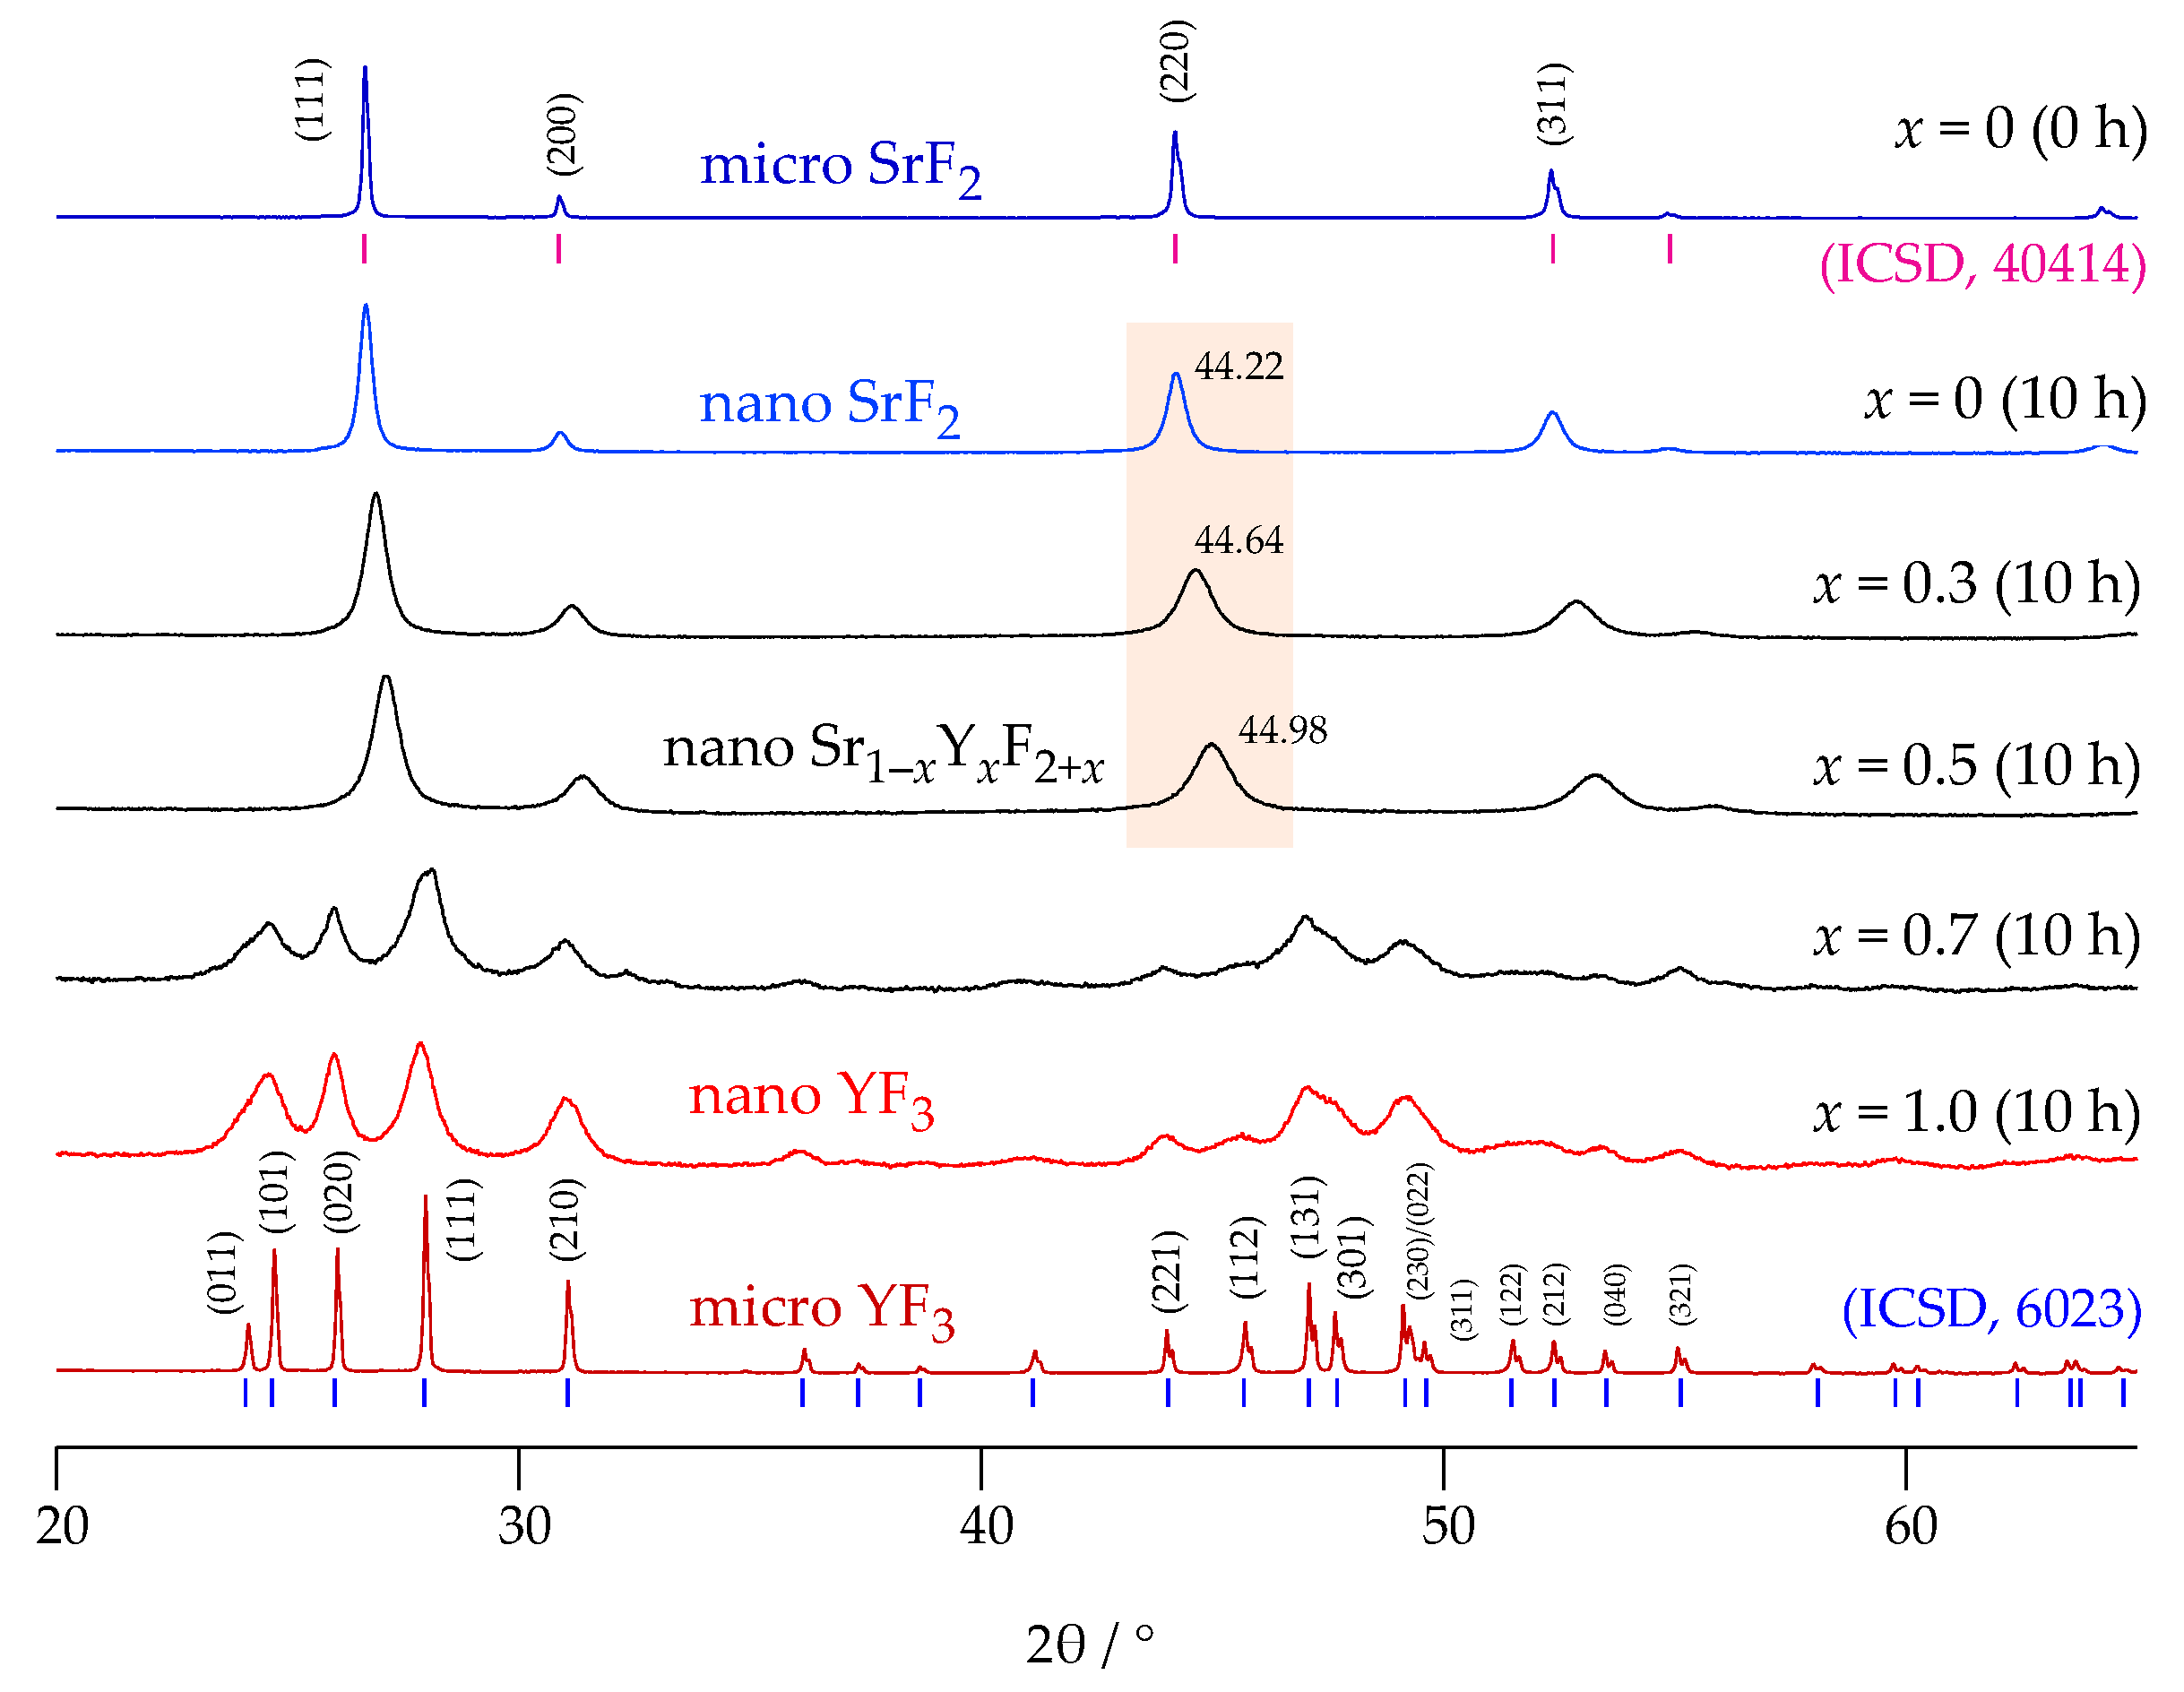
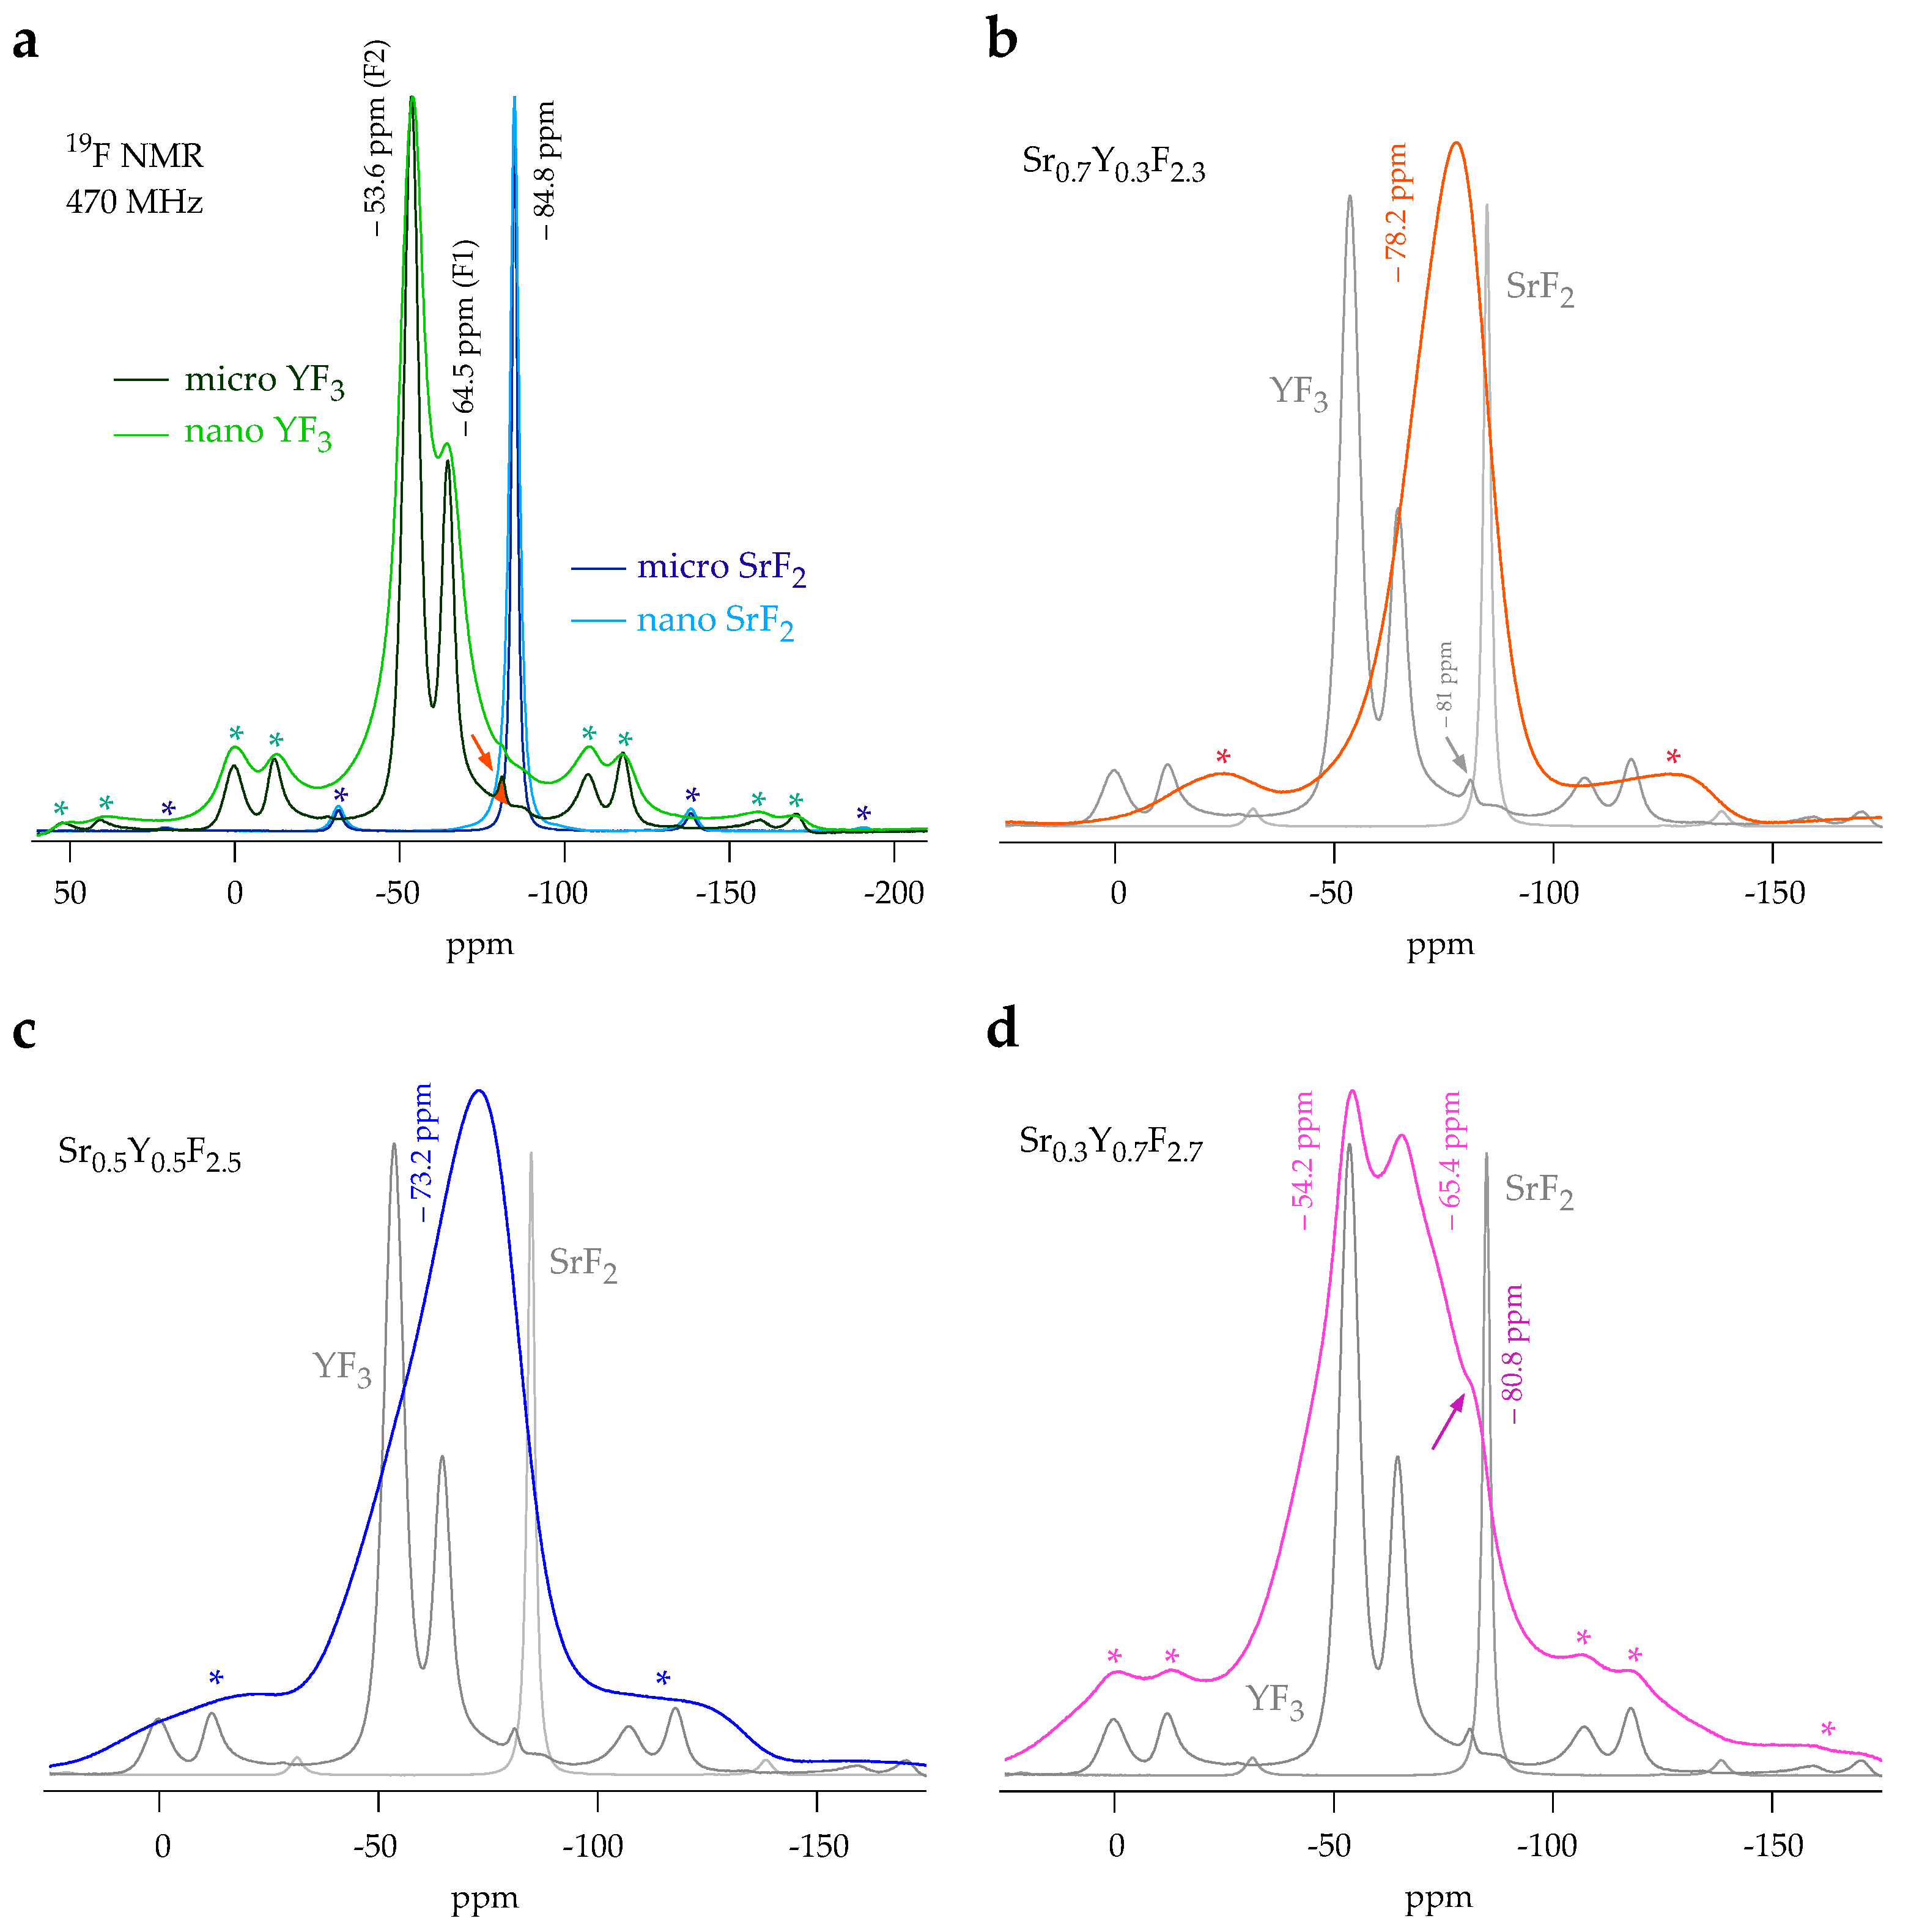
Structure: X-ray Diffraction and 19 F High-Resolution MAS NMR Spectroscopy

Long-range and local structures of Sr 1 x Y x F 2 + x ( 0 x 1 ) were studied by X-ray diffraction and 19 F MAS NMR, see Figure 2 and Figure 3.
SrF 2 crystallizes in the cubic crystal system and YF 3 adopts an orthorhombic structure (see Figure 1). In Figure 2 the X-ray powder patterns of the starting materials as well as those of the milled samples, with the composition Sr 1 x Y x F 2 + x , are shown.
As a result of heavy ball-milling in a planetary mill, the two fluorides form a product with cubic symmetry up to x = 0.5 . Broadening of the reflections is caused by both lattice strain ( ϵ ) and nm-sized crystallites. The equation introduced by Scherrer yields 36(2) nm ( ϵ = 0.0031 ( 5 ) ), 13(2) nm ( ϵ = 0.0083 ( 5 ) ) and 10(2) nm ( ϵ = 0.0123 ( 10 ) ) as average crystallite size for the samples with x = 0 , x = 0.3 and x = 0.5 , respectively. The values in brackets denote microstrain as estimated using the method proposed by Williamson and Hall [41], see also [42] for details. With increasing extent of cation mixing lattice strain enhances.
Furthermore, we clearly observe a shift of the reflections toward larger diffraction angles, see the positions of the (220) reflections as indicated in Figure 2. The lattice constant a gradually changes from 5.8040 Å (SrF 2 ) to 5.7442 Å (Sr 0.7 Y 0.3 F 2.3 ). The linear decrease of a, as a result of incorporation of the smaller Y cations, indicates Vegard behaviour. At the same time, F interstitials are generated that are expected to boost F ionic conductivity, vide infra (Figure 4).
When coming from pure YF 3 , Sr ions are incorporated into the trifluoride. Once again, small crystallites significantly broaden the X-ray reflections; the orthorhombic structure of YF 3 is, however, still conserved (see Figure 2). The patterns do not show large amounts of X-ray amorphous material as featureless, broad humps are missing. Hence, we deal with nanocrystalline samples with local disorder.
Local disorder is also sensed by 19 F MAS NMR spectroscopy. In Figure 3a the spectra of the non-substituted binary fluorides are shown. As expected, coarse grained SrF 2 only shows a single resonance at 84.8 ppm and the spectrum of YF 3 reveals the two crystallographically inequivalent F positions F(1) and F(2). The samples with μ m-sized crystallites are composed of sharp lines that perfectly agree with those presented and analyzed in literature [36,40]. Broadening, but no change in isotropic chemical shift, is observed for the samples treated mechanically. YF 3 shows a negligible amount of an impurity phase, see the NMR signal at δ iso = 81 ppm . Upon incorporation of YF 3 , the 19 F MAS NMR lines drastically broaden because of the introduction of structural disorder, see also [36]. The various Sr-F environments formed as well as the various defects present, including F vacancies and interstitials, result in a broad distribution of 19 F NMR chemical shifts. Depending on which cation is the major component in Sr 1 x Y x F 2 + x the center of the broad lines is either located near the original chemical shifts δ iso of SrF 2 (Figure 3b) or those of YF 3 (Figure 3d). For the equimolar solid-solution with x = 0.5 , the center of the line is in between that of SrF 2 and YF 3 . The shoulder near 50 ppm might indicate Y-rich regions or clusters. For a detailed analysis of 19 F MAS spectra we refer to [36]. Indeed, 89 Y MAS NMR measurements by Ritter et al. [36] suggested F clustering taking place in samples with more than 10 mol % of Y 3 + .
In contrast to other solid-solutions, such as Me 1 z Sr z F 2 ( Me = Ca , Ba ; 0 z 1 ) and Ba 1 z Ca z F 2 [11], line broadening, i.e., the distribution of chemical shifts, is much larger for Sr 1 x Y x F 2 + x . Because of this effect, even under the MAS conditions applied here, we cannot resolve the (Sr,Y) environments as it was possible for the (Ca,Sr) species in cubic Ca 1 z Sr z F 2 with a similar range of chemical shifts, see the MAS NMR spectra presented in [11].
In Figure 4a,b Nyquist plots and conductivity isotherms of Sr 1 x Y x F 2 + x with x = 0.3 are displayed; Figure 5 gives an overview of the temperature dependence of the ionic conductivities.
Plotting the real part σ of the complex conductivity σ ^ results in curves with (i) distinct DC plateaus at sufficiently low frequencies and (ii) a dispersive part at low T and high frequencies. The collapse of σ at the lowest frequencies and highest temperature is because of F anion charge accumulation in front of the ion-blocking electrode. We used the frequency-independent plateau to determine specific ionic conductivities as a function of temperature. These values refer to long-range ion transport and characterize successful charge displacements in the fluoride. The same values for σ can be inferred from analyzing Nyquist plots (see Figure 3a) that show the imaginary part ( Z ) of the complex impedance Z ^ as a function of its real part Z . From the intercept of the semicircle the variable-temperature resistance R can be extracted and converted into σ . The electrical relaxation process seen in conductivity (or impedance) spectroscopy mainly refers to a bulk process as the corresponding electrical capacity takes values in the pF range, see Figure 4a. Most likely, the broad semicircle also contains contributions from grain boundaries and interfacial regions. These regions do not seem to block ion transport as is known for other fast ion conductors [43].
The shape of the isotherms σ ( ν ) , cf. Figure 4b, does not change much with temperature indicating that the same relaxation process is probed at elevated T. At sufficiently high T, the data fulfill the so-called time-temperature superposition principle [44,45]. At low T, however, the dispersive part, which is sensitive to ion dynamics on shorter length scales than those seen in the DC regime, dominates the spectra. This regime can be approximated with Jonscher’s power law ansatz [46], σ ( ν ) ν q [44]. The exponent q increases with temperature, most likely reaching q = 1 at cryogenic temperatures. At such low temperatures localized ion movements might play a rôle that do not contribute to long-range charge transport any longer [47]. The isotherm of Sr 0.7 Y 0.3 F 2.3 recorded at T = 100 °C is characterized by q = 0.83 ( 2 ) . q values of approximately 0.8 are frequently seen for disordered ion conductors in this T range [29].
In Figure 5a the product σ DC T is plotted vs. the inverse temperature 1 / T to determine activation energies E a of the samples prepared and to illustrate the change in ionic conductivity upon Y 3 + incorporation. For comparison, we included the Arrhenius lines of two other mechanochemically prepared F anion conductors viz. Ba 0.5 Ca 0.5 F 2 and La 0.9 Ba 0.1 F 2.9 . In addition, ionic conductivities of YF 3 -doped SrF 2 crystals is also shown [48]. While pure (nanocrystalline) SrF 2 is a poor ionic conductor with an activation energy as high as 0.88 eV; E a is significantly decreased to 0.67 eV for Sr 0.7 Y 0.3 F 2.3 . The ionic conductivity, as well as the activation energy (0.84 eV) of nanocrystalline YF 3 turned out to be very similar to that of nano-SrF 2 . In Figure 5b the change in σ DC T and E a is shown as a function of x. From x = 0 to x = 0.3 the activation energy almost linearly decrease; σ DC T passes through a maximum at ca. x = 0.3 . Further incorporation of YF 3 causes σ DC T to decrease again. Note that the Sr 1 x Y x F 2 + x system adopts cubic structure up to approximately x = 0.5 , while the Y-rich samples crystallize with orthorhombic structure. Ultimately, at 80 °C (see Figure 5b) we notice an enhancement in ionic conductivity by 4 orders of magnitude when going from SrF 2 to Sr 0.7 Y 0.3 F 2.3 . This opens the way to systematically vary the ionic conductivity of the ternary fluoride over a broad dynamic range.
Interestingly, already at low Y 3 + contents, that is, at 10 mol%, we see an increase in ionic conductivity by one order of magnitude. For comparison, the ionic conductivity of the YF 3 -doped SrF 2 crystals studied by Bollmann et al. [48] in 1970 is still lower than that of nanocrystalline SrF 2 highlighting the importance of size effects on ionic transport even in the cation-mixed system. For single crystals based on the LaF 3 tysonite structure also quite high ion conductivities have, however, been reported [49].
The change in E a from 0.88 eV to 0.81 eV is accompanied by a significant increase of the pre-exponential factor σ 0 in σ DC T = σ 0 exp ( E a / ( k B T ) ) , see also [50]. While log ( σ 0 / ( S cm 1 K ) ) of SrF 2 amounts to 4.1, it increases to 5.3 for Sr 0.9 Y 0.1 F 2.1 . Thus, the new defect structure, most likely involving F clustering as seen by 89 Y NMR [36], also influences the attempt frequencies (and/or the number of effective charge carriers) of the underlying jump processes. Presumably, substitution of Sr 2 + with Y 3 + will also influence the activation entropy for ionic migration. For x > 0.1 no further increase of σ 0 is seen; the additional increase in σ DC is mainly governed by the reduction in activation energy. As the defect concentration is already high in this regime, we expect that predominantly lower migration energies facilitate ion transport further.

4. Conclusions

The mixed system Sr 1 x Y x F 2 + x represents an attractive system to control ionic conductivities via the concept of cation mismatch. High-energy ball milling is able to force the distinctly sized cations to form a mixed phase with structural disorder at atomic scale. Treating SrF 2 with YF 3 in a high-energy planetary mill causes the original conductivity to increase by some orders of magnitude. Simultaneously, the corresponding activation energy decreases from 0.88 eV to 0.67 eV clearly showing a lowering of the migration barrier the ions have to surmount to take part in long-range transport. Besides this decrease in E a we also observed the influence of the Arrhenius pre-factor to decisively initiate a further increase in ionic transport at x 0.1 , i.e., in the compositional range where F clustering starts.
Impedance spectroscopy shows that no grain boundary regions hinder the ions from moving over long distances. Most likely, the cation-mixed interfacial regions also provide fast diffusion pathways similar to those in the bulk structure. As we deal with nm-sized crystallites, space charge regions are expected to also contribute to overall F anion dynamics.

Acknowledgments

We thank M. Gabriel for his help with sample preparation. Moreover, we thank the Deutsche Forschungsgemeinschaft (DFG) for financial support (SPP 1415).

Author Contributions

Stefan Breuer, Bernhard Stanje and Martin Wilkening conceived and designed the experiments; Stefan Breuer, Veronika Pregartner and Sarah Lunghammer performed the experiments; all authors were involved in analyzing and interpreting the data. Stefan Breuer and Martin Wilkening wrote the paper.

Conflicts of Interest

The authors declare no conflict of interest. The founding sponsors had no role in the design of the study; in the collection, analyses, or interpretation of data; in the writing of the manuscript, and in the decision to publish the results.

References

  1. Vollath, D. Nanomaterials—An Introduction to Synthesis, Properties and Applications; Wiley-VCH: Weinheim, Germany, 2008; pp. 21–22. [Google Scholar]
  2. Tuller, H.L. Ionic conduction in nanocrystalline materials. Solid State Ion. 2000, 131, 143–157. [Google Scholar] [CrossRef]
  3. Knauth, P. Inorganic solid Li ion conductors: An overview. Solid State Ion. 2009, 180, 911–916. [Google Scholar] [CrossRef]
  4. Kobayashi, S.; Tsurekawa, S.; Watanabe, T. A new approach to grain boundary engineering for nanocrystalline materials. Beilstein J. Nanotechnol. 2016, 7, 1829. [Google Scholar] [CrossRef] [PubMed]
  5. Uitz, M.; Epp, V.; Bottke, P.; Wilkening, M. Ion dynamics in solid electrolytes for lithium batteries. J. Electroceram. 2017, 38, 142–156. [Google Scholar] [CrossRef]
  6. Heitjans, P.; Indris, S. Diffusion and ionic conduction in nanocrystalline ceramics. J. Phys. Condens. Matter 2003, 15, R1257. [Google Scholar] [CrossRef]
  7. Prutsch, D.; Breuer, S.; Uitz, M.; Bottke, P.; Langer, J.; Lunghammer, S.; Philipp, M.; Posch, P.; Pregartner, V.; Stanje, B.; et al. Nanostructured Ceramics: Ionic Transport and Electrochemical Activity. Z. Phys. Chem. 2017, 231, 1361–1405. [Google Scholar] [CrossRef]
  8. Heitjans, P.; Masoud, M.; Feldhoff, A.; Wilkening, M. NMR and impedance studies of nanocrystalline and amorphous ion conductors: Lithium niobate as a model system. Faraday Discuss. 2007, 134, 67–82. [Google Scholar] [CrossRef] [PubMed]
  9. Epp, V.; Wilkening, M. Motion of Li+ in nanoengineered LiBH4 and LiBH4:Al2O3 comparison with the microcrystalline form. ChemPhysChem 2013, 14, 3706–3713. [Google Scholar] [CrossRef] [PubMed]
  10. Wilkening, M.; Epp, V.; Feldhoff, A.; Heitjans, P. Tuning the Li diffusivity of poor ionic conductors by mechanical treatment: High Li conductivity of strongly defective LiTaO3 nanoparticles. J. Phys. Chem. C 2008, 112, 9291–9300. [Google Scholar] [CrossRef]
  11. Düvel, A.; Ruprecht, B.; Heitjans, P.; Wilkening, M. Mixed Alkaline-Earth Effect in the Metastable Anion Conductor Ba1−xCaxF2 (0 ≤ x ≤ 1): Correlating Long-Range Ion Transport with Local Structures Revealed by Ultrafast 19F MAS NMR. J. Phys. Chem. C 2011, 115, 23784–23789. [Google Scholar] [CrossRef]
  12. Ruprecht, B.; Wilkening, M.; Steuernagel, S.; Heitjans, P. Anion diffusivity in highly conductive nanocrystalline BaF2:CaF2 composites prepared by high-energy ball milling. J. Mater. Chem. 2008, 18, 5412–5416. [Google Scholar] [CrossRef]
  13. Sorokin, N.I.; Buchinskaya, I.I.; Fedorov, P.P.; Sobolev, B.P. Electrical conductivity of a CaF2-BaF2 nanocomposite. Inorg. Mater. 2008, 44, 189–192. [Google Scholar]
  14. Maier, J. Ionic conduction in space charge regions. Prog. Solid State Chem. 1995, 23, 171–263. [Google Scholar] [CrossRef]
  15. Maier, J. Nanoionics: Ion transport and electrochemical storage in confined systems. Nat. Mater. 2005, 4, 805–815. [Google Scholar] [CrossRef] [PubMed]
  16. Maier, J. Nano-Ionics: Trivial and Non-Trivial Size Effects on Ion Conduction in Solids. Zeitschrift für Physikalische Chemie 2003, 217, 415–436. [Google Scholar] [CrossRef]
  17. Maier, J. Nanoionics: Ionic charge carriers in small systems. Phys. Chem. Chem. Phys. 2009, 11, 3011–3022. [Google Scholar] [CrossRef] [PubMed]
  18. Puin, W.; Rodewald, S.; Ramlau, R.; Heitjans, P.; Maier, J. Local and overall ionic conductivity in nanocrystalline CaF2. Solid State Ion. 2000, 131, 159–164. [Google Scholar] [CrossRef]
  19. Blanchard, D.; Nale, A.; Sveinbjörnsson, D.; Eggenhuisen, T.M.; Verkuijlen, M.H.W.; Vegge, T.; Kentgens, A.P.; de Jongh, P.E. Nanoconfined LiBH4 as a fast lithium ion conductor. Adv. Funct. Mater. 2015, 25, 184–192. [Google Scholar] [CrossRef]
  20. Sata, N.; Eberman, K.; Eberl, K.; Maier, J. Mesoscopic fast ion conduction in nanometre-scale planar heterostructures. Nature 2000, 408, 946–949. [Google Scholar] [CrossRef] [PubMed]
  21. Jin-Phillipp, N.Y.; Sata, N.; Maier, J.; Scheu, C.; Hahn, K.; Kelsch, M.; Rühle, M. Structures of BaF2-CaF2 heterolayers and their influences on ionic conductivity. J. Chem. Phys. 2004, 120, 2375–2381. [Google Scholar] [CrossRef] [PubMed]
  22. Vergentev, T.; Banshchikov, A.; Filimonov, A.; Koroleva, E.; Sokolov, N.; Wurz, M.C. Longitudinal conductivity of LaF3/SrF2 multilayer heterostructures. Sci. Technol. Adv. Mater. 2016, 17, 799–806. [Google Scholar] [CrossRef] [PubMed]
  23. Šepelak, V.; Düvel, A.; Wilkening, M.; Becker, K.D.; Heitjans, P. Mechanochemical reactions and syntheses of oxides. Chem. Soc. Rev. 2013, 42, 7507–7520. [Google Scholar] [CrossRef] [PubMed]
  24. Wilkening, M.; Bork, D.; Indris, S.; Heitjans, P. Diffusion in amorphous LiNbO3 studied by 7Li NMR—Comparison with the nano-and microcrystalline material. Phys. Chem. Chem. Phys. 2002, 4, 3246–3251. [Google Scholar] [CrossRef]
  25. Wilkening, M.; Indris, S.; Heitjans, P. Heterogeneous lithium diffusion in nanocrystalline Li2O: Al2O3 composites. Phys. Chem. Chem. Phys. 2003, 5, 2225–2231. [Google Scholar] [CrossRef]
  26. Gleiter, H. Nanoglasses: A new kind of noncrystalline materials. Beilstein J. Nanotechnol. 2013, 4, 517–533. [Google Scholar]
  27. Chadwick, A.V.; Düvel, A.; Heitjans, P.; Pickup, D.M.; Ramos, S.; Sayle, D.C.; Sayle, T.X.T. X-ray absorption spectroscopy and computer modelling study of nanocrystalline binary alkaline earth fluorides. In IOP Conference Series: Materials Science and Engineering; IOP Publishing: Bristol, UK, 2005; Volume 80, p. 012005. [Google Scholar]
  28. Preishuber-Pflügl, F.; Wilkening, M. Mechanochemically synthesized fluorides: Local structures and ion transport. Dalton Trans. 2016, 45, 8675–8687. [Google Scholar] [CrossRef] [PubMed]
  29. Preishuber-Pflügl, F.; Bottke, P.; Pregartner, V.; Bitschnau, B.; Wilkening, M. Correlated fluorine diffusion and ionic conduction in the nanocrystalline F solid electrolyte Ba0.6 La0.4F2.419F T1(ρ) NMR relaxation vs. conductivity measurements. Phys. Chem. Chem. Phys. 2014, 16, 9580–9590. [Google Scholar] [CrossRef] [PubMed]
  30. Ruprecht, B.; Wilkening, M.; Feldhoff, A.; Steuernagel, S.; Heitjans, P. High anion conductivity in a ternary non-equilibrium phase of BaF2 and CaF2 with mixed cations. Phys. Chem. Chem. Phys. 2009, 11, 3071–3081. [Google Scholar] [CrossRef] [PubMed]
  31. Rongeat, C.; Reddy, M.A.; Witter, R.; Fichtner, M. Nanostructured fluorite-type fluorides as electrolytes for fluoride ion batteries. J. Phys. Chem. C 2013, 117, 4943–4950. [Google Scholar] [CrossRef]
  32. Anji Reddy, M.; Fichtner, M. Batteries based on fluoride shuttle. J. Mater. Chem. 2011, 21, 17059–17062. [Google Scholar] [CrossRef]
  33. Nowroozi, M.A.; Wissel, K.; Rohrer, J.; Munnangi, A.R.; Clemens, O. LaSrMnO4: Reversible Electrochemical Intercalation of Fluoride Ions in the Context of Fluoride Ion Batteries. Chem. Mater. 2017, 29, 3441–3453. [Google Scholar] [CrossRef]
  34. Grenier, A.; Porras-Gutierrez, A.G.; Groult, H.; Beyer, K.A.; Borkiewicz, O.J.; Chapman, K.W.; Dambournet, D. Electrochemical reactions in fluoride-ion batteries: Mechanistic insights from pair distribution function analysis. J. Mater. Chem. A 2017, 5, 15700–15705. [Google Scholar] [CrossRef]
  35. Grenier, A.; Porras-Gutierrez, A.G.; Body, M.; Legein, C.; Chrétien, F.; Raymundo-Pinñero, E.; Dollé, M.; Groult, H.; Dambournet, D. Solid Fluoride Electrolytes and Their Composite with Carbon: Issues and Challenges for Rechargeable Solid State Fluoride-Ion Batteries. J. Phys. Chem. C 2017, 121, 24962–24970. [Google Scholar] [CrossRef]
  36. Ritter, B.; Krahl, T.; Scholz, G.; Kemnitz, E. Local Structures of Solid Solutions Sr1−x Yx F2+x (x = 0…0.5) with Fluorite Structure Prepared by Sol-Gel and Mechanochemical Syntheses. J. Phys. Chem. C 2016, 120, 8992–8999. [Google Scholar]
  37. Scherrer, P. Bestimmung der Größe und der inneren Struktur von Kolloidteilchen mittels Röntgenstrahlen. Nachrichten Ges. Wiss. Göttingen 1918, 2, 98. [Google Scholar]
  38. Düvel, A.; Wegner, S.; Efimov, K.; Feldhoff, A.; Heitjans, P.; Wilkening, M. Access to metastable complex ion conductors via mechanosynthesis: Preparation, microstructure and conductivity of (Ba, Sr) LiF3 with inverse perovskite structure. J. Mater. Chem. 2011, 21, 6238–6250. [Google Scholar] [CrossRef]
  39. Indris, S.; Bork, D.; Heitjans, P. Nanocrystalline oxide ceramics prepared by high-energy ball milling. J. Mater. Synth. Proc. 2000, 8, 245–250. [Google Scholar] [CrossRef]
  40. Sadoc, A.; Body, M.; Legein, C.; Biswal, M.; Fayon, F.; Rocquefelte, X.; Boucher, F. NMR parameters in alkali, alkaline earth and rare earth fluorides from first principle calculations. Phys. Chem. Chem. Phys. 2011, 13, 18539–18550. [Google Scholar] [CrossRef] [PubMed]
  41. Williamson, G.; Hall, W. X-ray line broadening from filed aluminium and wolfram. Acta Metall. 1953, 1, 22–31. [Google Scholar] [CrossRef]
  42. Düvel, A.; Wilkening, M.; Uecker, R.; Wegner, S.; Šepelak, V.; Heitjans, P. Mechanosynthesized nanocrystalline BaLiF3: The impact of grain boundaries and structural disorder on ionic transport. Phys. Chem. Chem. Phys. 2010, 12, 11251–11262. [Google Scholar] [CrossRef] [PubMed]
  43. Breuer, S.; Prutsch, D.; Ma, Q.; Epp, V.; Preishuber-Pflügl, F.; Tietz, F.; Wilkening, M. Separating bulk from grain boundary Li ion conductivity in the sol-gel prepared solid electrolyte Li1.5Al0.5Ti1.5(PO4)3. J. Mater. Chem. A 2015, 3, 21343–21350. [Google Scholar] [CrossRef]
  44. Dyre, J.C.; Maass, P.; Roling, B.; Sidebottom, D.L. Fundamental questions relating to ion conduction in disordered solids. Rep. Prog. Phys. 2009, 72, 046501. [Google Scholar] [CrossRef]
  45. Sakellis, I. On the origin of time-temperature superposition in disordered solids. Appl. Phys. Lett. 2011, 98, 072904. [Google Scholar] [CrossRef]
  46. Jonscher, A. The ‘universal’ dielectric response. Nature 1977, 267, 673–679. [Google Scholar] [CrossRef]
  47. Funke, K.; Cramer, C.; Wilmer, D. Diffusion in Condensed Matter, 2nd ed.; Heitjans, P., Kärger, J., Eds.; Springer: Berlin, Germany, 2005; Chapter 21; pp. 859–893. [Google Scholar]
  48. Bollmann, W.; Görlich, P.; Hauk, W.; Mothes, H. Ionic conduction of pure and doped CaF2 and SrF2 crystals. Phys. Status Solidi (A) 1970, 2, 157–170. [Google Scholar] [CrossRef]
  49. Sorokin, N.I.; Sobolev, B.P.; Krivandina, E.A.; Zhmurova, Z.I. Optimization of single crystals of solid electrolytes with tysonite-type structure (LaF3) for conductivity at 293 K: 2. Nonstoichiometric phases R1−yMyF3−y (R = La-Lu, Y; M = Sr, Ba). Cryst. Rep. 2015, 60, 123. [Google Scholar]
  50. Breuer, S.; Wilkening, M. Mismatch in cation size causes rapid anion dynamics in solid electrolytes: The role of the Arrhenius pre-factor. Dalton Trans. 2018, in press. [Google Scholar] [CrossRef] [PubMed]
Figure 1. (a) Crystal structure ( F d 3 ¯ m ) of cubic SrF 2 with the Sr 2 + ions (spheres in light blue, ionic radius 0.99 Å) occupying the 4 b positions coordinated by eight fluorine anions residing on 8 c ; In (b) the crystal structure orthorhombic of YF 3 ( P n m a ) is shown; the trivalent Y 3 + ions (light blue spheres, ionic radius 0.90 Å) occupy the 4 c sites, two further crystallographically inequivalent F sites exist which are filled by the F anions F(1) and F (2).
Crystals 08 00122 g001
Figure 2. X-ray powder diffractograms recorded (CuK α 1 , 1.54059 Å) to characterize the phase purity of the starting materials as well as that of the mixed phases formed. The periods indicated in brackets show the milling times. The patterns of microcrystalline SrF 2 and YF 3 perfectly match with those in literature; verticals bars show the average positions of the CuK α 1 and CuK α 2 reflections. The broadening of the reflections, which is evident for the milled samples, indicates nm-sized crystallites; lattice strain and a distribution of lattice constants due to cation mixing may contribute to the broadening effect seen as well. Mixing of the cations is anticipated to have a much larger effect on ionic conductivity than the decrease in crystallite size seen when going from x = 0 to x = 0.3 . See text for further explanation.
Crystals 08 00122 g002
Figure 3. (ad) 19 F magic angle spinning nuclear magnetic resonance (MAS NMR) spectra of Sr 1 x Y x F 2 + x prepared by ball milling. We used a rotor-synchronized Hahn echo pulse sequence to record the spectra at a spinning speed of 25 kHz; asterisks ( ) denote spinning sidebands. The spectra are referenced to CFCl 3 ( 0 ppm ) . In (a) the spectra of microcrystalline, i.e., unmilled, and nanocrystalline SrF 2 and YF 3 are shown. The nanocrystalline samples were obtained after milling the starting materials for 10 h under dry conditions. Mechanical treatment leads to broadening of the NMR lines because of the defects and polyhedra distortions introduced. The spectra of YF 3 reveal the two magnetically equivalent sites of YF 3 ; their isotropic chemical shifts δ iso are 53.6 ppm and 84.8 ppm . For the Sr-rich and Y-rich samples; see (b,d), Sr 1 x Y x F 2 + x with x = 0.3 and x = 0.7 the center of the broad MAS NMR lines shift toward that of SrF 2 and YF 3 , respectively. These isotropic shifts, together with the broadening of the lines, owing to a distribution of chemical shifts caused by atomic disorder, reveals the formation of mixed (Sr,Y) environments the F anions are subjected to. For x = 0.5 the extent of mixing is, of course, most effective; see (c).
Crystals 08 00122 g003
Figure 4. (a) Nyquist plots of the complex impedance of Sr 1 x Y x F 2 + x with x = 0.3 recorded at the temperatures indicated. The solid lines are to guide the eye. The depressed semicircles indicate correlated ion movements in the ternary fluoride; from ω max ( = ν max 2 π ) and R electrical capacities, C = 1 / ( ω max R ) , in the order of 10 pF were estimated indicating that the overall electrical response is mainly given by bulk properties rather than by ion-blocking grain boundary contributions; (b) Conductivity isotherms of Sr 0.7 Y 0.3 F 2.3 recorded from 100 °C to + 180 °C in steps of 20 °C. The pronounced plateaus at intermediate frequencies contain the DC conductivity σ DC , as indicated; (c) Real part, ϵ , of the complex primitivity as a function of frequency. Above 10 3 Hz the bulk response is seen; the capacity associated with that response is in the order of 10 pF.
Crystals 08 00122 g004
Figure 5. (a) Arrhenius plot of σ DC T vs. the 1 / T of mechanochemically prepared Sr 1 x Y x F 2 + x with x 0.3 . Solid and dashed lines represent fits according to an Arrhenius equation, σ DC T exp ( E a / ( k B T ) ) ; k B denotes Boltzmanns constant. The activation energies obtained are indicated; (b) Change of E a (see right axis) and σ DC T of nanocrystalline Sr 1 x Y x F 2 + x as a function of x. See text for further explanation.
Crystals 08 00122 g005

