Brief Report

Refolding, Characterization, and Preliminary X-ray Crystallographic Studies on the Campylobacter concisus Plasmid-Encoded Secreted Protein Csep1p Associated with Crohn’s Disease

1
Infection and Immunity Program, Monash Biomedicine Discovery Institute, Department of Microbiology, Monash University, Clayton, Victoria 3800, Australia
2
Department of Biochemistry and Molecular Biology, Monash University, Clayton, Victoria 3800, Australia
3
School of Biotechnology and Biomolecular Sciences, University of New South Wales, Sydney, New South Wales 2052, Australia
*
Authors to whom correspondence should be addressed.
Crystals 2018, 8(10), 391; https://doi.org/10.3390/cryst8100391
Submission received: 19 September 2018 / Revised: 9 October 2018 / Accepted: 14 October 2018 / Published: 16 October 2018
(This article belongs to the Special Issue Biological Crystallization)

Abstract

:
Colonization of Campylobacter concisus in the gastrointestinal tract can lead to the development of inflammatory bowel disease (IBD). Plasmid-encoded C. concisus-secreted protein 1 (Csep1p) was recently identified as a putative pathogenicity marker associated with active Crohn’s disease, a clinical form of IBD. Csep1p shows no significant full-length sequence similarity to proteins of known structure, and its role in pathogenesis is not yet known. This study reports a method for extraction of recombinantly expressed Csep1p from Escherichia coli inclusion bodies, refolding, and purification to produce crystallizable protein. Purified recombinant Csep1p behaved as a monomer in solution. Crystals of Csep1p were grown by the hanging drop vapour diffusion method, using polyethylene glycol (PEG) 4000 as the precipitating agent. A complete data set has been collected to 1.4 Å resolution, using cryocooling conditions and synchrotron radiation. The crystals belong to space group P62 or P64, with unit cell parameters a = b = 85.8, c = 55.2 Å, α = β = 90, and γ = 120°. The asymmetric unit appears to contain one subunit, corresponding to a packing density of 2.47 Å3 Da−1.

1. Introduction

Campylobacter concisus is a gram-negative, spiral shaped, flagellated bacterium that, albeit being part of the normal human oral microflora [1], is also found in the intestinal tract, where its presence is associated with inflammatory bowel disease (IBD) [2]. C. concisus is genetically heterogeneous, with two distinct genomospecies (GS) that show differential propensities for translocation to and persistence in the human gastrointestinal tract [3,4,5]. In a genome study of 104 C. concisus isolates from 41 individuals, Kirk et al. (2018) [3] found GSII strains predominantly in gut mucosal samples (a result supported by a previous qPCR-based study [5]), and GSI strains were found to be overrepresented in oral samples. Translocation to and colonization of the gastrointestinal tract by C. concisus has been implicated as a potential etiological factor underlying inflammatory bowel disease (IBD); however, the molecular mechanisms underlying C. concisus pathogenesis in this respect remain poorly defined [2,6].
C. concisus has been shown to interact with host cells in a multifaceted manner. It is able to induce apoptosis and perturb the production of proteins associated with occluding junctions in the intestinal epithelium [7], modulate cell responses to bacterial lipopolysaccharides [8], and induce the production of pro-inflammatory cytokines [9]. By searching for homologues of the genes and proteins that had been previously implicated in colonization and virulence of other bacterial species, Kaakoush et al. [10] identified a set of 25 putative virulence factors present in the genome of the C. concisus strain 13826, including invasin InvA, adhesin CadF, two genes that encode zonula occludens toxins (ZOT), and phospholipase A (PldA). It was noted by Kaakoush et al. [10] that the presence of these virulence factors indicates that C. concisus may be capable of attaching to and invading host cells though a mechanism that targets occludens junctions, providing a starting point from which to investigate the enteric pathogenicity of C. concisus.
ZOT have been shown to compromise the intestinal barrier by interfering with proteins on the occludens junctions [11], whereas PldA has been shown to damage the membrane of mammalian cells [12]. Neither of the genes encoding these proteins, however, has a demonstrated association with IBD. Further, ZOT have been identified considerably more frequently in GSI C. concisus strains, which exhibit a reduced ability to persist in the GI tract [3]. As such, the usefulness of these gene products as molecular markers of pathogenicity in C. concisus with respect to IBD development is limited. Liu et al. [13] have recently identified a putative pathogenicity marker—the C. concisus csep1-6bpi gene. This gene was disproportionately present in oral C. concisus strains obtained from patients with active Crohn’s disease (a clinical form of IBD), and were not detected in oral C. concisus strains isolated from both Crohn’s patients in remission and healthy controls, suggesting that the gene may play a role in the development of Crohn’s disease [13]. The csep1-6bpi gene is present in pICON plasmid or chromosome of GSII C. concisus strains, encoding C. concisus-secreted protein 1 (Csep1) that contains an N-terminal secretion signal (amino-acid residues 1-21); this protein was confirmed to have been secreted, being detected in the bacterial culture supernatant [13].
In this paper, we report expression, refolding from inclusion bodies, purification, and characterization of the pICON plasmid-encoded C. concisus-secreted protein 1 (Csep1p), the novel putative virulence factor of C. concisus. This protein shows no significant full-length homology to proteins of known structure. The availability of pure recombinant Csep1p and determination of its atomic structure will greatly facilitate investigation into its function and its role in the C. concisus pathogenesis.

2. Materials and Methods

2.1. Gene Cloning and Overexpression

To express the protein in E. coli, the nucleotide sequence encoding Csep1p (locus tag CCS77_2074 on the pICON plasmid, GenBank ID CP021643.1) minus the signal peptide sequence was codon optimized, synthesized, and cloned into the pET151/D-TOPO vector (Invitrogen, Waltham, MA, USA) by GenScript. This expression vector contains an N-terminal His6 tag followed by a tobacco etch virus (TEV) protease cleavage site. The recombinant protein used for biophysical assays and crystallization contained residues 22–222, plus an additional GIDPFT sequence at the N-terminus, as a cloning artifact originating from the TEV protease cleavage site. The vector was introduced into E. coli BL21 DE3 (Novagen, Merck Group, Darmstadt, Germany), and cells were then cultured with shaking in Luria–Bertani medium supplemented with 50 mg/L ampicillin at 310 K to an OD600 of 0.8. Overexpression of Csep1p was induced with 1 mM of isopropyl β-D-1-thiogalactopyranoside. Cells were then grown for a further 4 h at 310 K and harvested by centrifugation at 4800× g for 15 min at 277 K.

2.2. Solubilization of Inclusion Bodies

The cells were re-suspended in buffer A (20 mM Tris-HCl pH 8.0, 150 mM NaCl, and 1 mM phenylmethanesulfonyl fluoride (PMSF)), lysed using an EmulsiFlex-C5 cell disruption system (Avestin, Ottawa, ON, Canada) and centrifuged at 10,000× g for 30 min at 277 K. SDS-PAGE analysis of the proteins in the resultant pellet and supernatant indicated that Csep1p is predominantly expressed in inclusion bodies (IBs). The IBs were solubilized by following the procedure described in [14], with some modifications. Briefly, the pellet was washed twice with buffer B (10 mM Tris-HCl pH 8.0, 0.2 mM PMSF, and 1% w/v Triton X-100) and once with buffer C (10 mM Tris-HCl pH 8.0 and 0.2 mM PMSF). After centrifugation at 10,000× g for 30 min, the supernatant was discarded and the IBs were solubilized in buffer D (10 mM Tris-HCl pH 8.0, 10 mM dithiothreitol (DTT), 8 M urea, and 0.2 mM PMSF) by axial rotation for 120 min at 277 K. The denatured protein solution was then clarified by centrifugation at 30,000× g for 30 min at 277 K, and protein concentration was determined using the Bradford assay [15]. Protein solution was aliquoted, snap-frozen in liquid nitrogen, and stored at 193 K.

2.3. Refolding and Purification

Refolding of recombinant Csep1p was performed by diluting 70 mg of denatured protein into 250 mL of buffer E (3 M urea, 10 mM Tris-HCl pH 8.0, 0.4 M L-arginine monohydrochloride, 2 mM oxidized L-glutathione, and 20 mM reduced L-glutathione) followed by a 24-h incubation at 227 K with vigorous stirring. The sample was then dialyzed against 7.5 L of buffer F (10 mM Tris-HCl, pH 8.0) at 277 K, with four buffer changes over the period of 24 h. After that, Tris–HCl pH 8.0, NaCl, and imidazole were added to the sample to final concentrations of 20, 500, and 20 mM, respectively. The protein solution was loaded onto a 5 mL Ni-nitrilotriacetic acid (NTA) sepharose affinity column (GE Healthcare, Chicago, IL, USA) pre-equilibrated with buffer G (20 mM Tris–HCl pH 8.0, 500 mM NaCl, and 20 mM imidazole). The column was then washed with seven column volumes of the same buffer to remove unbound proteins, and Csep1p was eluted with buffer H (20 mM Tris–HCl pH 8.0, 500 mM NaCl, and 500 mM imidazole). The N-terminal His6 tag was cleaved off using His-tagged TEV protease (Invitrogen) during overnight dialysis against buffer I (20 mM Tris-HCl pH 8.0, 150 mM NaCl, 2 mM DTT, and 1% v/v glycerol at 277 K. NaCl and imidazole were then added to the sample to final concentrations of 500 and 20 mM, respectively. The uncleaved protein, His6 tag, and TEV protease were removed over the Ni-NTA affinity column. The flow-through fractions were pooled, concentrated to 2 mL in an Amicon Ultracel 10 kDa cutoff concentrator, and loaded onto the Superdex 75 HiLoad 26/60 gel-filtration column (GE Healthcare, Chicago, IL, USA), pre-equilibrated with a buffer containing 20 mM Tris-HCl pH 8.0 and 150 mM NaCl (during the initial purification) or with buffer G (during the purification for crystallization) at a flow rate of 4 mL/min. The peak fractions of the eluate were pooled, and protein purity was assessed by SDS-PAGE. Tandem mass spectrometry analysis of the tryptic digest peptides obtained from the protein band cut out from the gel was performed using the Monash Biomedical Proteomics Facility. The oligomeric state of Csep1p in solution was determined by calculating the molecular weight (MW) based on the retention volume, using the calibration plot for the Superdex 75 HiLoad 26/60 column: Vretention (mL) = 631.3–104.3 × log MW [16].

2.4. Thermal Shift Assay

A thermal shift assay of protein stability in different buffers was performed using a Rotor-Gene Q Real time PCR instrument (QIAGEN, Hilden, Germany). Purified Csep1p in buffer G was concentrated to 12 mg/mL (1 mM) and diluted into a range of different buffers, containing 10 × SYPRO Orange reagent (Sigma-Aldrich, 5000× stock, catalogue number S5692, St. Louis, MI, USA) to a concentration of 10 μM (volume = 25 μL). The samples were thermally denatured by heating from 35 °C to 90 °C at a ramp rate of 0.5 °C/min. Protein denaturation was monitored by following the SYPRO Orange fluorescence emission (λex 530 nm/λem 555 nm). GraphPad Prism was used to fit the denaturation data to a derivation of the Boltzmann equation for the two-state unfolding model, in order to obtain the midpoint of denaturation (the melting temperature Tm) [17]. All experiments were performed in triplicate.

2.5. Circular Dichroism Spectroscopy

Prior to circular dichroism (CD) experiments, purified Csep1p was buffer-exchanged into 10 mM sodium phosphate pH 7.4. Far-UV CD spectra were recorded at a protein concentration of 0.24 mg/mL at 298 K, using a JASCO J-815 spectropolarimeter over a wavelength range from 200–250 nm with a scan rate of 20 nm/min. Spectra were recorded in triplicate and averaged. The secondary structure content was calculated using the BeStSel server [18].

2.6. Crystallization

Prior to crystallization, Csep1p was concentrated to 8 mg/mL and centrifuged at 277 K for 30 min at 13,200× g to clarify the solution. Initial screening for crystallization conditions was performed by the hanging-drop vapor-diffusion method, using an automated Phoenix crystallization robot (Art Robbins Instruments, Sunnyvale, CA, USA) and commercial screens Crystal Screen HT and PEG/Ion HT (Hampton Research, Aliso Viejo, CA, USA), JBS HTS1 and 2 (Jena Bioscience, Jena, Germany), and JCSG+ Suite (Qiagen, Hilden, Germany). The preliminary crystallization droplets contained 100 nL of protein solution mixed with 100 nL of reservoir solution and equilibrated against 50 μL of reservoir solution in a 96-well plate. After one day, crystals appeared in many different conditions. The condition containing 200 mM ammonium acetate, 100 mM sodium acetate trihydrate (pH 4.6), and 30% w/v polyethylene glycol (PEG) 4000 was chosen for optimisation. The refinement of this condition yielded monocrystals using 25% w/v PEG 4000, 100 mM ammonium acetate, 80 mM sodium acetate trihydrate (pH 4.6) as the reservoir solution, and 8 mg/mL of protein (drop size was 2 μL protein solution plus 2 μL reservoir solution, suspended over 500 μL reservoir solution).

2.7. Data Collection and Processing

For data collection, the Csep1p crystal was briefly soaked in a cryoprotectant solution containing 36% w/v PEG 4000, 100 mM ammonium acetate, 80 mM sodium acetate trihydrate (pH 4.6), and 10% v/v glycerol, and flash-cooled by plunging the crystal into liquid nitrogen. An X-ray diffraction data set was collected to 1.4 Å resolution on the MX2 beamline of the Australian Synchrotron (Figure 1). The data were processed and scaled using XDS [19] and AIMLESS [20] from the CCP4 suite [21]. The space group was determined with POINTLESS [22], and the Matthews coefficient was calculated using MATTHEWS_COEF [23] from the CCP4 software package. Data collection statistics are presented in Table 1.

3. Results and Discussion

3.1. Cloning, Overexpression, Refolding, and Purification

An N-terminally His6-tagged expression construct for recombinant Csep1p lacking the signal peptide (residues 1–21) was created by ligating the synthetic, codon-optimized gene into the pET151/D-TOPO vector. Expression of Csep1p-His6 in Escherichia coli BL21 DE3 cells upon induction of T7 polymerase predominantly resulted in protein deposition in inclusion bodies (IBs). We isolated approximately 127 mg of protein in the form of washed IBs from 1 liter of bacterial culture. The recombinant Csep1p was recovered from IBs by following the previously published refolding procedure, which involves diluting denatured protein into a buffer containing 10 mM Tris-HCl (pH 8.0), 10 mM dithiothreitol, 8 M urea, and 0.2 mM protease inhibitor phenylmethanesulfonyl fluoride [14]. Approximately 25 mg of tagged protein was obtained from 70 mg of IBs, corresponding to a soluble protein yield of 45 mg per 1 liter of culture (prior to purification).
Csep1p was purified to higher than 95% homogeneity—based on Coomassie blue staining of the SDS–PAGE gel (Figure 2)—by affinity chromatography, followed by tag removal and gel filtration. The recombinant protein comprised residues 22–222 of Csep1p, as well as six additional residues (GIDPFT) at the N-terminus, originating from the TEV cleavage site. The protein migrated on SDS–PAGE with an apparent molecular weight (MW) of 24 kDa (Figure 2). This value is very close to the MW calculated from the amino-acid sequence (24.34 kDa). The protein identity was confirmed by tandem mass spectrometry (MS) analysis of the tryptic digest peptides obtained from the protein band cut out from the gel. The search for peptides matching the Csep1p sequence against an E. coli background proteome, allowing for semi-tryptic specificity, three missed cleavages, and limited modifications, definitely identifying Csep1p based on 3102 spectra with 98% sequence coverage (Figure S1).

3.2. Protein Buffer Optimization

Our initial attempt to concentrate the protein in a buffer containing 20 mM Tris-HCl pH 8.0 and 150 mM NaCl for crystallization experiments resulted in extensive precipitation, indicating limited solubility under those experimental conditions. We hypothesized that the protein would be more soluble in a buffer that increases its thermodynamic stability. We have therefore assessed the Csep1p stability in different buffers using a thermal shift assay. In this assay, a mixture of the purified protein and fluorescent dye is exposed to a temperature gradient; the dye’s fluorescence increases when it binds to the protein’s hydrophobic core, which becomes gradually exposed upon thermal denaturation. The protein unfolding curve is measured by following changes in the fluorescence. The melting temperature (Tm) value, which corresponds to the temperature at which 50% of the protein has denatured, provides a measure of the thermal stability of the protein.
We first screened nine different buffers commonly used in crystallography, in the pH range between 3.0 and 8.0, each at a concentration of 100 mM and in the presence or absence of 150 mM NaCl. Analysis of the protein unfolding curves (Figure S2a) indicated that under very acidic conditions (pH 3.0–4.0), the protein’s fold is highly unstable, even at room temperature; the fluorescent signal started at a high value and decreased, rather than increasing, with temperature. No meaningful Tm value could be ascribed to those curves. Protein stability under moderately acidic conditions (pH 4.6) was also significantly lower than that in the pH range between 6.0 and 8.0, as evidenced by the lower Tm value (Figure 3a). Furthermore, the presence of 150 mM NaCl had a favorable effect on the protein’s stability, resulting in up to 2 °C increase in the Tm value when compared to the respective buffer without salt (Figure 3a), suggesting that higher ionic strength promotes stabilization of this protein fold. As Csep1p in 100 mM HEPES pH 7.0, 150 mM NaCl showed the highest Tm value (64.6 °C) in this screen, we attempted to concentrate the sample in this buffer; however, that also resulted in protein precipitation.
We then took into account the observation that during the purification procedure, the protein could be concentrated to 10–20 mg/mL in a buffer containing 20 mM Tris-HCl (pH 8.0), 20 mM imidazole, 500 mM NaCl, 2 mM DTT, and 1% v/v glycerol. Since imidazole and glycerol are known to increase the stability of some proteins, we produced a screen designed to systematically test the effect of glycerol and imidazole at increasing salt concentrations (150, 250, and 500 mM NaCl) on Csep1p stability. In addition, we tested the effect of charged amino acids L-Arg and L-Glu at 30 mM on Tm, as the Arg–Glu mix has also been shown to increase the solubility of proteins [24]. The results of the thermal shift assay using this screen are shown in Figure 3b. No significant differences in Tm were observed between the conditions with and without glycerol. In contrast, imidazole, the Arg–Glu mix, and higher NaCl concentrations each showed a stabilizing effect, as judged by an increase in the respective Tm value (Figure 3b), with 500 mM NaCl having a more pronounced effect than 150 or 250 mM. We have selected three conditions corresponding to the highest observed Tm values: (1) 100 mM Tris-HCl (pH 8.0), 30 mM Arg, 30 mM Glu, and 500 mM NaCl (Tm = 66.0 °C); (2) 100 mM Tris-HCl (pH 8.0), 10 mM imidazole, and 500 mM NaCl (Tm = 65.8 °C); and (3) 100 mM HEPES (pH 7.0), 10 mM imidazole, and 500 mM NaCl (Tm = 65.8 °C). We tested protein solubility in these buffers by concentrating the dilute protein, buffer-exchanged into the respective buffer by dialysis up to the solubility limit. The highest concentration of ~20 mg/mL was achieved in condition 2; similar levels were achieved in a slightly modified condition 2, containing 20 mM Tris-HCl (pH 8.0), 20 mM imidazole, and 500 mM NaCl (buffer G, see “Materials and Methods”). Therefore, to streamline the purification procedure while retaining protein solubility at high levels, the final gel-filtration and concentration steps were performed in buffer G.

3.3. Stoichiometry and Secondary Structure Content of Csep1p

When subjected to size-exclusion chromatography on a calibrated gel-filtration column, the protein eluted as a single, symmetrical peak with a retention volume of 176 mL (Figure S3), which corresponds to an apparent MW of approximately 23 kDa. This indicates that Csep1p is monomeric under the tested buffer conditions.
To ascertain the fold integrity of the prepared Csep1p sample prior to crystallization trials, we estimated its secondary structure content using circular dichroism (CD). Analysis of the CD spectrum (Figure 4) yielded values of 38% and 20% for α-helix and β-sheet content, respectively. These values are close to those predicted from the primary sequence analysis (α = 38%, β = 19%) using the Jpred4 server [25], confirming that Csep1p extracted from IBs is folded.

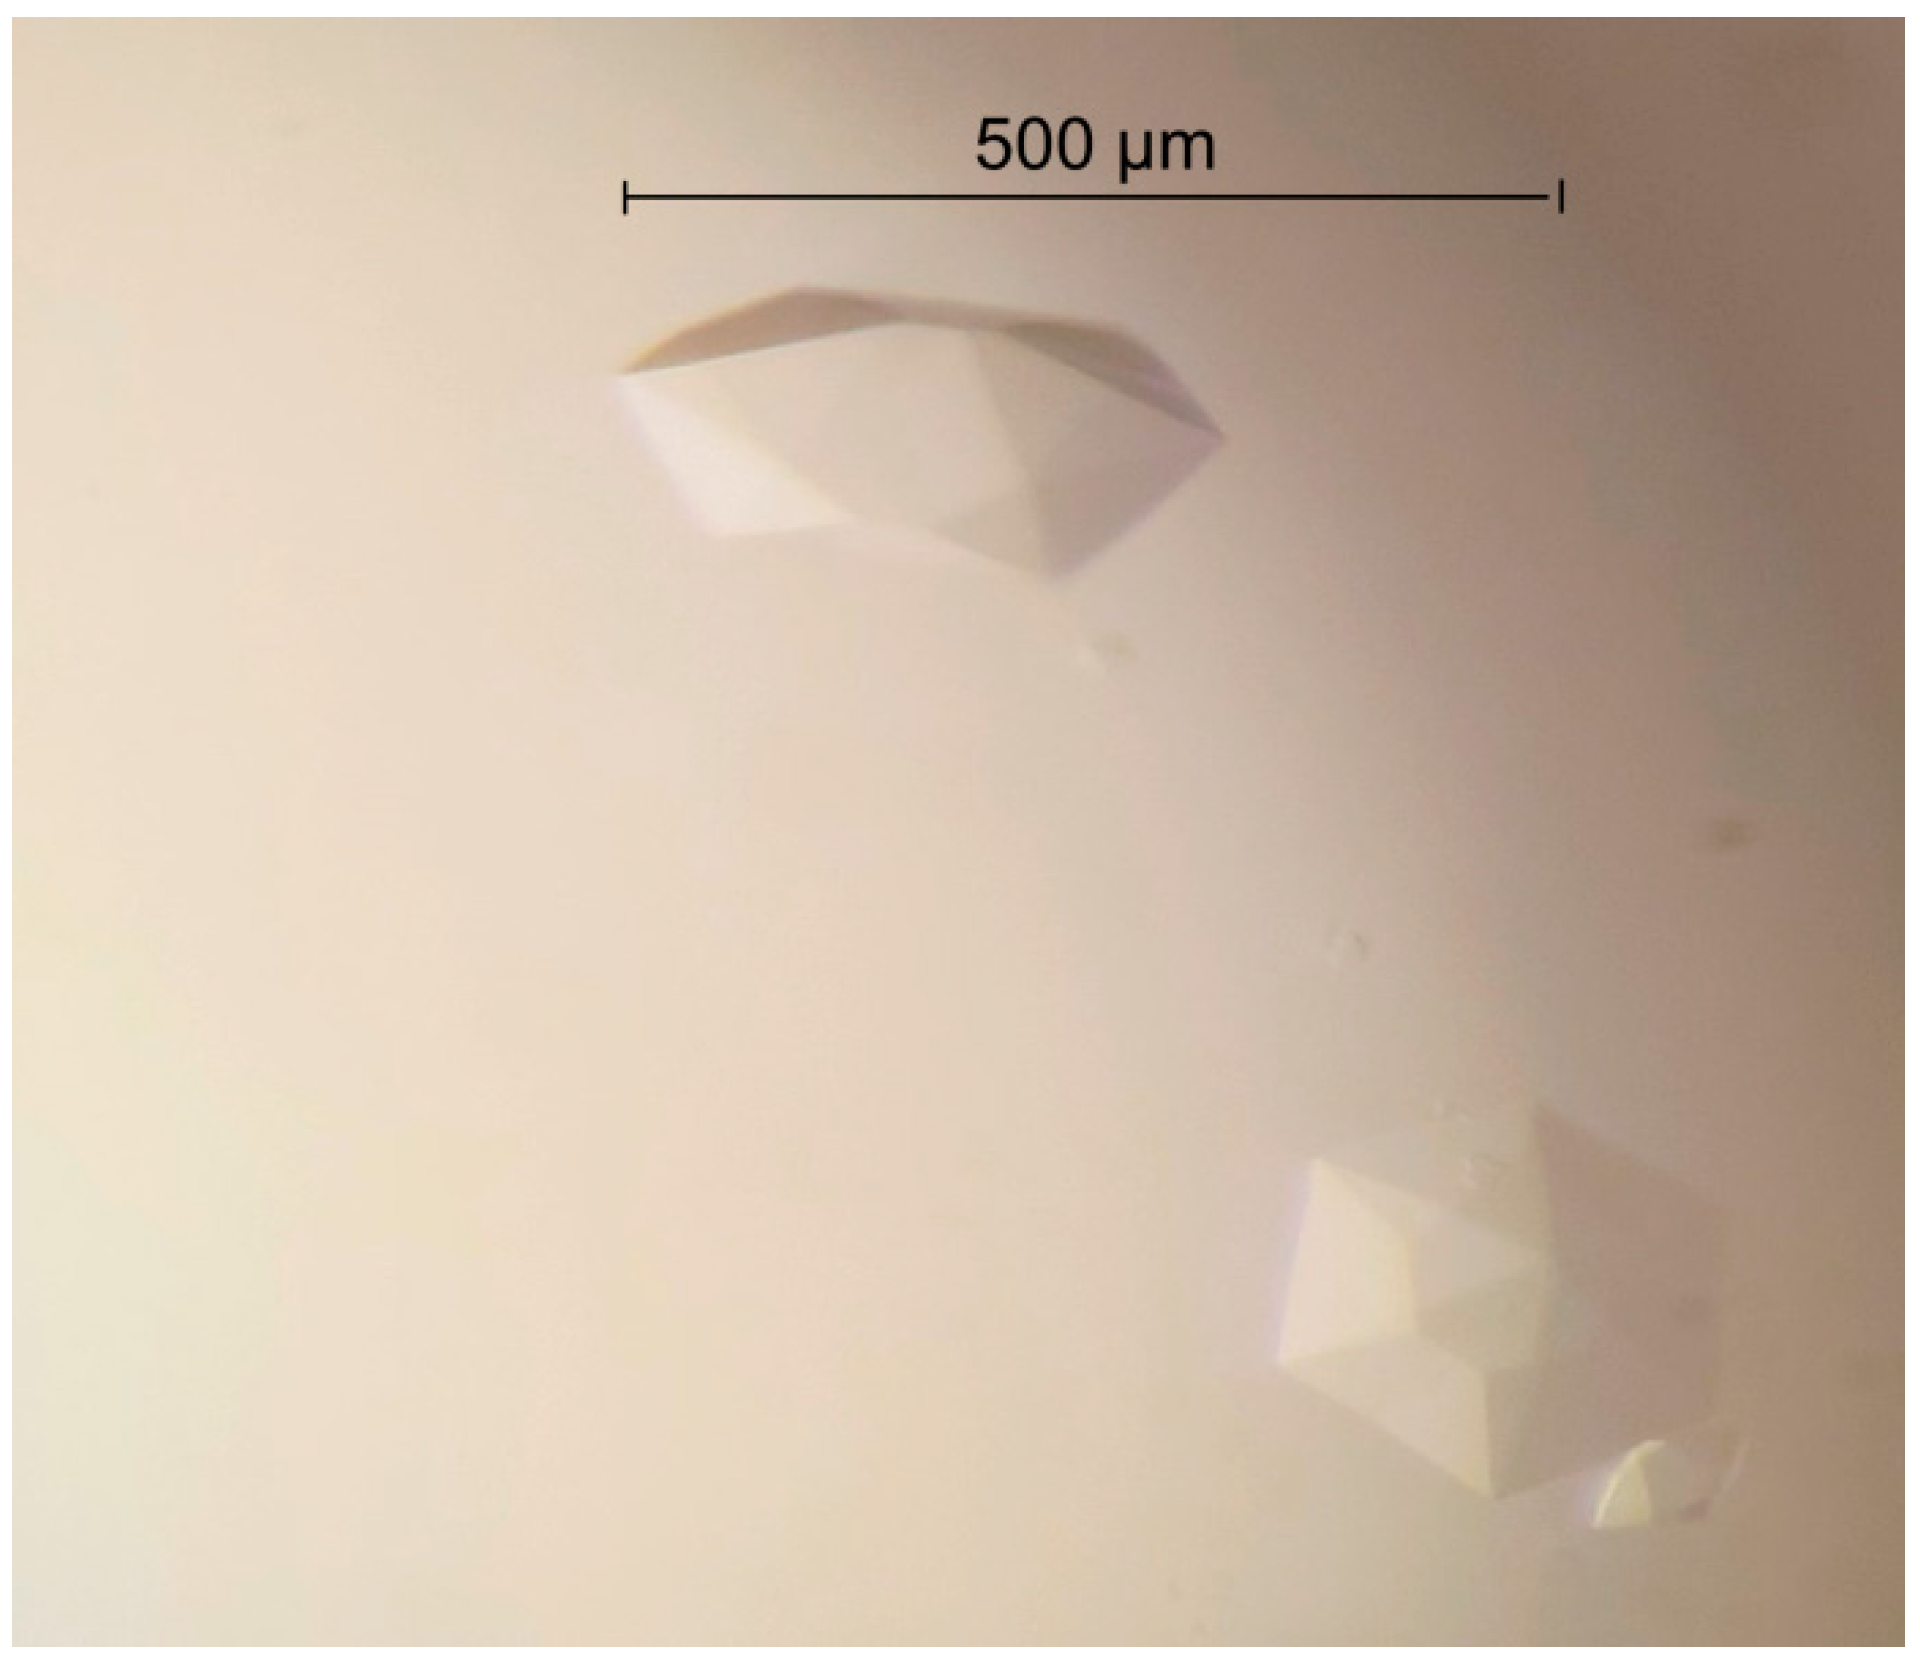
3.4. Crystallization and Preliminary X-ray Analysis

To initiate a study of the structure/function relationship of Csep1p, we undertook robotic crystallization trials using commercially available screens, and optimized the preliminary hits manually to produce monocrystals of suitable size and diffraction quality. The best crystals were obtained using PEG 4000 as a precipitant and a protein concentration of 8 mg/mL. The crystals typically appeared after two days (Figure 5). An X-ray diffraction data set was collected for a single cryo-cooled crystal, using beamline MX2 at the Australian Synchrotron to a resolution of 1.4 Å. Auto-indexing of the diffraction data using XDS [19] was consistent with a trigonal or hexagonal crystal system. The data could be scaled using AIMLESS [20] in the hexagonal system, and analysis using POINTLESS [22] showed systematic absences along the 00l axis, with reflections only present when l = 3n, which suggested that the crystals belong to space group P62 or its enantiomorph P64. The average I/σ(I) value was 15.1 for all reflections (resolution range 28.08–1.40 Å) and 1.0 in the highest resolution shell (1.42–1.40 Å). A total of 189,480 measurements were made of 43,067 independent reflections. Data processing gave an Rmerge of 0.03 for intensities (0.288 in the 1.42–1.40 Å resolution shell). The data was 94% complete, with 61% completeness in the highest resolution shell (Table 1). Analysis of the data using PHENIX Xtriage [26] detected no signs of twinning. Calculation of the Matthews coefficient and solvent content for one molecule in the asymmetric unit gave values of 2.47 Å3 Da−1 and 50%, respectively, which lies in the range observed for protein crystals [27]. Determination of the structure will require heavy-atom derivatization or selenomethionine substitution to allow experimental phasing using multiple isomorphous replacement or single- or multi-wavelength anomalous dispersion methods.

Supplementary Materials

The following are available online at https://www.mdpi.com/2073-4352/8/10/391/s1. Figure S1: Csep1p sequence coverage by the tryptic digest peptides identified in the sample using tandem mass spectrometry analysis. Figure S2: Normalised thermal unfolding (melting) curves of Csep1p in different buffers, measured by following changes in the fluorescence of SYPRO Orange. (a) Effect of pH and presence or absence of 150 mM NaCl; (b) effect of additives (glycerol, imidazole, or Arg–Glu mix) and increasing NaCl concentration. Figure S3: Gel filtration chromatogram. The minor peak at the void volume (~85 mL) corresponds to a small amount of non-specific, large aggregates.

Author Contributions

L.Z. and A.R. conceived and coordinated this study; M.M.R. and A.R. designed the experiments; M.M.R. and B.G. performed the experiments; M.M.R. and A.R. analyzed the data; all authors wrote or edited the paper; all authors read and approved the final manuscript.

Acknowledgments

We thank Danuta Maksel and Geoffrey Kwai Wai Kong at the Monash Macromolecular Crystallisation Facility for their assistance in setting up robotic crystallization screens. Part of this research was undertaken on the MX2 beamline of the Australian Synchrotron (AS), Victoria, Australia. We also thank the AS staff for their assistance with data collection.

Conflicts of Interest

The authors declare that they have no competing interests.

References

  1. Zhang, L.; Budiman, V.; Day, A.S.; Mitchell, H.; Lemberg, D.A.; Riordan, S.M.; Grimm, M.; Leach, S.T.; Ismail, Y. Isolation and detection of Campylobacter concisus from saliva of healthy individuals and patients with inflammatory bowel disease. J. Clin. Microbiol. 2010, 48, 2965–2967. [Google Scholar] [CrossRef] [PubMed]
  2. Zhang, L.; Lee, H.; Grimm, M.C.; Riordan, S.M.; Day, A.S.; Lemberg, D.A. Campylobacter concisus and inflammatory bowel disease. World J. Gastroenterol. 2014, 20, 1259–1267. [Google Scholar] [CrossRef] [PubMed]
  3. Kirk, K.F.; Meric, G.; Nielsen, H.L.; Pascoe, B.; Sheppard, S.K.; Thorlacius-Ussing, O.; Nielsen, H. Molecular epidemiology and comparative genomics of Campylobacter concisus strains from saliva, faeces and gut mucosal biopsies in inflammatory bowel disease. Sci. Rep. 2018, 8, 1902. [Google Scholar] [CrossRef] [PubMed]
  4. Mahendran, V.; Octavia, S.; Demirbas, O.F.; Sabrina, S.; Ma, R.; Lan, R.; Riordan, S.M.; Grimm, M.C.; Zhang, L. Delineation of genetic relatedness and population structure of oral and enteric Campylobacter concisus strains by analysis of housekeeping genes. Microbiology 2015, 161, 1600–1612. [Google Scholar] [CrossRef] [PubMed]
  5. Wang, Y.; Liu, F.; Zhang, X.; Chung, H.K.L.; Riordan, S.M.; Grimm, M.C.; Zhang, S.; Ma, R.; Lee, S.A.; Zhang, L. Campylobacter concisus genomospecies 2 is better adapted to the human gastrointestinal tract as compared with Campylobacter concisus genomospecies 1. Front. Physiol. 2017, 8, 543. [Google Scholar] [CrossRef] [PubMed]
  6. Zhang, L. Oral Campylobacter species: Initiators of a subgroup of inflammatory bowel disease? World J. Gastroenterol. 2015, 21, 9239–9244. [Google Scholar] [CrossRef] [PubMed]
  7. Nielsen, H.L.; Nielsen, H.; Ejlertsen, T.; Engberg, J.; Günzel, D.; Zeitz, M.; Hering, N.A.; Fromm, M.; Schulzke, J.-D.; Bücker, R. Oral and fecal Campylobacter concisus strains perturb barrier function by apoptosis induction in HT-29/B6 intestinal epithelial cells. PLoS ONE 2011, 6, e23858. [Google Scholar] [CrossRef] [PubMed]
  8. Ismail, Y.; Mahendran, V.; Octavia, S.; Day, A.S.; Riordan, S.M.; Grimm, M.C.; Lan, R.; Lemberg, D.; Tran, T.A.; Zhang, L. Investigation of the enteric pathogenic potential of oral Campylobacter concisus strains isolated from patients with inflammatory bowel disease. PLoS ONE 2012, 7, e38217. [Google Scholar] [CrossRef] [PubMed]
  9. Man, S.M.; Kaakoush, N.O.; Leach, S.T.; Nahidi, L.; Lu, H.K.; Norman, J.; Day, A.S.; Zhang, L.; Mitchell, H.M. Host attachment, invasion, and stimulation of proinflammatory cytokines by Campylobacter concisus and other non-Campylobacter jejuni Campylobacter species. J. Infect. Dis. 2010, 202, 1855–1865. [Google Scholar] [CrossRef] [PubMed]
  10. Kaakoush, N.O.; Man, S.M.; Lamb, S.; Raftery, M.J.; Wilkins, M.R.; Kovach, Z.; Mitchell, H. The secretome of Campylobacter concisus. FEBS J. 2010, 277, 1606–1617. [Google Scholar] [CrossRef] [PubMed]
  11. Mahendran, V.; Liu, F.; Riordan, S.M.; Grimm, M.C.; Tanaka, M.M.; Zhang, L. Examination of the effects of Campylobacter concisus zonula occludens toxin on intestinal epithelial cells and macrophages. Gut Pathog. 2016, 8, 18. [Google Scholar] [CrossRef] [PubMed]
  12. Istivan, T.S.; Coloe, P.J.; Fry, B.N.; Ward, P.; Smith, S.C. Characterization of a haemolytic phospholipase A(2) activity in clinical isolates of Campylobacter concisus. J. Med. Microbiol. 2004, 53, 483–493. [Google Scholar] [CrossRef] [PubMed]
  13. Liu, F.; Ma, R.; Tay, C.Y.A.; Octavia, S.; Lan, R.; Chung, H.K.L.; Riordan, S.M.; Grimm, M.C.; Leong, R.W.; Tanaka, M.M.; et al. Genomic analysis of oral Campylobacter concisus strains identified a potential bacterial molecular marker associated with active Crohn’s disease. Emerg. Microbes Infect. 2018, 7, 64. [Google Scholar] [CrossRef] [PubMed]
  14. Liu, Y.C.; Roujeinikova, A. Expression, refolding, purification and crystallization of the sensory domain of the TlpC chemoreceptor from Helicobacter pylori for structural studies. Protein Expr. Purif. 2015, 107, 29–34. [Google Scholar] [CrossRef] [PubMed]
  15. Bradford, M.M. A rapid and sensitive method for the quantitation of microgram quantities of protein utilizing the principle of protein-dye binding. Anal. Biochem. 1976, 72, 248–254. [Google Scholar] [CrossRef]
  16. Aydin, I.; Dimitropoulos, A.; Chen, S.H.; Thomas, C.; Roujeinikova, A. Purification, crystallization and preliminary X-ray crystallographic analysis of the putative Vibrio parahaemolyticus resuscitation-promoting factor YeaZ. Acta Crystallogr. Sect. F Struct. Biol. Cryst. Commun. 2011, 67, 604–607. [Google Scholar] [CrossRef] [PubMed]
  17. Orwig, S.D.; Lieberman, R.L. Biophysical characterization of the olfactomedin domain of myocilin, an extracellular matrix protein implicated in inherited forms of glaucoma. PLoS ONE 2011, 6, e16347. [Google Scholar] [CrossRef] [PubMed]
  18. Micsonai, A.; Wien, F.; Bulyaki, E.; Kun, J.; Moussong, E.; Lee, Y.H.; Goto, Y.; Refregiers, M.; Kardos, J. BeStSel: A web server for accurate protein secondary structure prediction and fold recognition from the circular dichroism spectra. Nucleic Acids Res 2018, 46, W315–W322. [Google Scholar] [CrossRef] [PubMed]
  19. Kabsch, W. XDS. Acta Crystallogr. D Biol. Crystallogr. 2010, 66, 125–132. [Google Scholar] [CrossRef] [PubMed] [Green Version]
  20. Evans, P.R.; Murshudov, G.N. How good are my data and what is the resolution? Acta Crystallogr. D Biol. Crystallogr. 2013, 69, 1204–1214. [Google Scholar] [CrossRef] [PubMed] [Green Version]
  21. Winn, M.D.; Ballard, C.C.; Cowtan, K.D.; Dodson, E.J.; Emsley, P.; Evans, P.R.; Keegan, R.M.; Krissinel, E.B.; Leslie, A.G.; McCoy, A.; et al. Overview of the CCP4 suite and current developments. Acta Crystallogr. D Biol. Crystallogr. 2011, 67, 235–242. [Google Scholar] [CrossRef] [PubMed]
  22. Evans, P. Scaling and assessment of data quality. Acta Crystallogr. D Biol. Crystallogr. 2006, 62, 72–82. [Google Scholar] [CrossRef] [PubMed]
  23. Kantardjieff, K.A.; Rupp, B. Matthews coefficient probabilities: Improved estimates for unit cell contents of proteins, DNA, and protein–nucleic acid complex crystals. Protein Sci. 2003, 12, 1865–1871. [Google Scholar] [CrossRef] [PubMed]
  24. Golovanov, A.P.; Hautbergue, G.M.; Wilson, S.A.; Lian, L.-Y. A simple method for improving protein solubility and long-term stability. J. Am. Chem. Soc. 2004, 126, 8933–8939. [Google Scholar] [CrossRef] [PubMed]
  25. Drozdetskiy, A.; Cole, C.; Procter, J.; Barton, G.J. JPred4: A protein secondary structure prediction server. Nucleic Acids Res. 2015, 43, W389–W394. [Google Scholar] [CrossRef] [PubMed]
  26. Zwart, P.H.; Grosse-Kunstleve, R.W.; Lebedev, A.A.; Murshudov, G.N.; Adams, P.D. Surprises and pitfalls arising from (pseudo)symmetry. Acta Crystallogr. D Biol. Crystallogr. 2008, 64, 99–107. [Google Scholar] [CrossRef] [PubMed]
  27. Matthews, B.W. Solvent content of protein crystals. J. Mol. Biol. 1968, 33, 491–497. [Google Scholar] [CrossRef]
Figure 1. A representative oscillation image of the data collected from the Csep1p crystal, using an EIGER X 16M pixel detector on the MX2 station at the Australian Synchrotron, Victoria, Australia. The edge of the detector corresponds to the resolution of 1.45 Å.
Crystals 08 00391 g001
Figure 2. SDS-PAGE Coomassie Blue-stained gel (15%) of samples taken during the purification of recombinant Csep1p. Lane M: molecular weight ladder; Lane 1: inclusion bodies (IBs) after washing with buffer B; Lane 2: urea-solubilized IBs containing Csep1p-His6; Lane 3: 15 μg of refolded Csep1p-His6 after an affinity chromatography step; Lane 4: 15 μg of purified Csep1p with the His6-tag removed.
Crystals 08 00391 g002
Figure 3. Comparison of melting temperature (Tm) of Csep1p in different buffers. (a) Effect of pH and presence or absence of 150 mM NaCl; (b) Effect of additives (glycerol, imidazole or Arg-Glu mix) and increasing NaCl concentration. Results are means ± S.D. for three independent replicates.
Crystals 08 00391 g003
Figure 4. Circular dichroism (CD) spectrum of recombinant Csep1p.
Crystals 08 00391 g004
Figure 5. Crystals of Csep1p from a pICON plasmid.
Crystals 08 00391 g005
Table 1. Data collection and processing statistics. Values in parentheses are for the highest resolution shell.
Diffraction SourceMX2 beamline, Australian Synchrotron
DetectorEIGER X 16M
Wavelength (Å)1.07
Temperature (K)100
Total oscillation span (°)90
Mosaicity (°)0.11
Space groupP62 or P64
Unit cell parameters
a, b, c (Å)85.8   85.8   55.2
α, β, γ (°)90   90   120
Resolution range (Å)28.08–1.40 (1.42–1.40)
Observed reflections189,480 (2515)
Unique reflections43,067 (1401)
Mean I/σ(I)15.1 (1.0)
Completeness (%)94 (61)
Multiplicity4.4 (1.8)
Rmerge 10.030 (0.288)
CC(1/2) 2 (%)99 (64)
1. R m e r g e = ( h i | I h i I h | ) h i | I h i | , where I h i is the intensity of the ith observation of reflection h. 2 CC(1/2) is the Pearson correlation coefficient calculated between two random half data sets.

