
Hot Deformation Behavior and Microstructure Evolution of Ti–6Cr–5Mo–5V–4Al–1Nb Alloy

1
State Key Lab of Nonferrous Metals & Processes, GRIMAT Engineering Institute Co., Ltd., Beijing 101417, China
2
School of Power and Mechanical Engineering, Wuhan University, Wuhan 430072, China
3
AVIC the First Aircraft Institute, Xi’an 710089, China
*
Authors to whom correspondence should be addressed.
Crystals 2023, 13(2), 182; https://doi.org/10.3390/cryst13020182
Submission received: 12 December 2022
/
Revised: 16 January 2023
/
Accepted: 17 January 2023
/
Published: 20 January 2023
(This article belongs to the Section Crystalline Metals and Alloys)
Abstract
:This study looked into the thermo-mechanical properties and the recrystallization mechanisms of the Ti–5.5Cr–5Mo–5V-4Al–1Nb alloy (wt.%, Ti−65541). Hot compression experiments were conducted at two phase regions (740~950 °C) and strain rates from 0.001 to 1 s−1. The compressive strain–stress curves were corrected by the adiabatic heating effect. The Arrhenius model was established and provided a reliable prediction of the value of stress with a 0.992 correlation coefficient. The constructed processing map demonstrated that when the temperature rose and the strain rate fell, the power dissipation efficiency (η) showed a rising trend. By utilizing electron backscattered diffraction (EBSD), the microstructural evolution and deformation process were analyzed. It was possible to witness both continuous dynamic recrystallization (cDRX) and discontinuous dynamic recrystallization (dDRX). The dynamic recovery (DRV) and dDRX eventually replaced dDRX while η decreased. Moreover, the deformation band (DB) impeded re-crystallization in the low η area. This study can supply a relatively reliable processing interval for the new Ti−65541 alloy.
1. Introduction
In light of its excellent strength, stiffness, hardenability, corrosion resistance, and fatigue performance, metastable titanium alloys are applied as large structural parts, human implants, and antiseptic materials [1,2]. Die forging is still the most commonly used molding method for large structural parts in applications. However, the forging of titanium alloys is significantly influenced by the original state, cooling rate, forging quantity, forging speed, and other forging factors in addition to the titanium alloys’ low heat conductivity and poor flowability [3]. Therefore, it is of practical application value to study its hot processing performance and its influencing factors in depth and then select the best processing technology [4,5].
To better understand how metals and alloys behave during hot working for metal forming operations, many researchers have conducted thermal mechanical tests on various alloys in a broad range of hot working conditions and created a variety of constitutive models to explain the behavior of materials during thermal deformation. Lin, Y. et al. distinguished that artificial neural network (ANN) models, phenomenological models, and physical-based models were three categories of constitutive models, each of which has unique properties [6]. Phenomenological plastic constitutive models are the most frequently utilized constitutive models to describe hot deformation behavior. Phenomenological models fit the macroscopic experimental data to establish functional equations of the processing parameters and flow stress. A number of phenomenological models have been applied including the Arrhenius equation [7,8,9], Johnson–Cook (JC) model [10], Khan–Huang–Liang (KHL) model [11,12,13], and so on. However, phenomenological models have apparent defects in that they cannot describe the experimental results at temperatures and strain rates that are relatively high because the microstructure of the material changes significantly and phenomenological models do not take account of the effects of these factors. Therefore, plenty of physical-based models have been proposed such as the dynamic recrystallization (DRX) model [14], Zerilli–Armstrong (ZA) model [15], Voyiadjis–Almasri (VA) model [16], and so on. In general, the deformation behavior is extremely nonlinear, which decreases the accuracy of the prediction. The ANN excels at solving nonlinear problems, and it is widely utilized to model and forecast hot deformation behavior; nevertheless, its performance is contingent on the usage of high-quality data and defining parameters [17,18,19,20].
In the course of studying thermal deformation, some researchers have compared several models and chosen the best constitutive model for certain issues. For example, Shokry. A. [21] employed three different types of models, with the ANN model performing the best in capturing the mechanical behavior of Ti–6Al–4V comparatively. Each type of model has its own features; due to the consideration of the thermal deformation mechanism, many material parameters determined by precision instruments will be introduced into the physical-based model. The ANN model sets greater standards for the amount and quality of data and offers no physical insights [6]. This research aimed to shed light on the connection between the machining parameters and microstructure evolution. It paid little attention to the physical principles underlying the process of deformation, so one of the most popular phenomenological models, the Arrhenius equation, was employed in this article.
In addition to theoretical modeling and prediction, analyzing the evolution of the microstructure of materials is also crucial. In the past few years, numerous scholars have researched the microstructure evolution during the thermal mechanical progress of β titanium. By studying the evolution of the coarse crystalline structure of Ti−53331, Fan et al. [22] found that the sparsity of substructures depended on the processing speed, and the substructures gradually became discontinuous as the strain rate increased. The continuous recrystallized grain structures gradually separated into multiple bands of fine particles with increasing strain, which is actually a two-step cDRX. They also revealed that the dominant restoration is DRV, and dDRX takes place at low strain rates. Li et al. [23,24,25] investigated the thermomechanical properties of the Ti−6554 alloy, mainly by establishing the link between η and the deformation mechanisms through the establishment of the constitutive equations and the microstructure analysis of the thermal compression under a variety of different experimental conditions. In their research, dDRX occurred first, followed by CDRX, and finally DRV as the value of η increased. Zhao et al. [26] found that the dynamic recrystallization grain volume fraction of Ti−1023 was only 10% under single-phase region conditions, indicating that DRV was the primary softening mechanism. Aside from DRV, cDRX was also observed and when cDRX occurred, there were significant differences in the dislocation densities between the grain boundaries and grain centers.
This study aimed to investigate the behavior and mechanisms of Ti–5.5Cr–5Mo–5V–4Al–1Nb (wt.%, Ti−65541) alloy during hot deformation under different conditions. Ti−65541 alloy samples were subjected to hot compression experiments at temperatures between 740 and 950 °C and strain rates between 0.001 and 1 s−1. By establishing the Arrhenius equations and the analysis of the microstructure, the hot workability was revealed and the different mechanisms under each condition were analyzed. Ultimately, the recommended processing interval was given.
2. Materials and Methods
2.1. Experimental Materials
The raw material of Ti−65541 was a 500 mm diameter bar using a forging process. The chemical compositions (wt.%) are listed in Table 1. The phase change point of Ti−65541 is 815 ± 5 °C measured by a metallurgical method. The microstructure of the initial sample in Figure 1a shows that the α phase was uniformly distributed in the β phase matrix.
2.2. Experimental Method
As preparation for the experiments, the samples were machined into cylinders with a diameter of 8 mm and a height of 12 mm. The hot compression tests were carried out at temperatures of 740~950 °C and strain rates of 0.001~1 s−1 on a Gleeble-3500 isothermal simulator. The heating rate was 10 °C/s, and the samples were held for 5 min after reaching the target temperature. The heated samples were then compressed until reaching a height reduction of 50% and then rapidly cooled by using compressed air. The experimental flow diagram and the deformation parameters of the experiments are shown in Figure 1b.
2.3. Microstructure Observation
A wire cutting machine was utilized to cut the samples after compression from the compression direction. The surfaces of the samples were mechanically polished by 5 μm, 1.5 μm diamond paste, and then 0.04 μm OPS solutions. A field emission scanning electron microscope (SEM TESCAN MIRA III) was used to observe the center areas of the deformed samples. EBSD characterizations were also carried out with a step size of 6 μm at a voltage of 20 kV.
3. Results
3.1. Correction of Adiabatic Heating Effect
Figure 2 shows the original and corrected stress–strain curves under different deformation conditions and the original curves are shown by the solid lines and the revised curves are shown by the dashed lines. The deformation process had a very short elastic strain range. The dislocation density exploded and the stress rose quickly at the beginning of the curves because of the lack of softening mechanisms. In this stage, the work hardening behavior was very obvious. After attaining its highest value, the stress quickly decreased. Increased strain rate and decreased deformation temperature resulted in the peak value rising because a certain deformation with an increasing dislocation multiplication rate was reached faster at the condition. The discontinuous yield phenomenon (DYP), which occurs in a variety of titanium alloys [27], was also observed in Figure 2a,b. However, the stress–strain curves alone could not fully describe the thermal deformation behavior, so the further establishment of the constitutive model and microstructure observations were subsequently required.
When the deformation speed is slow, the compression process is considered to take place in an isothermal environment because it has sufficient time for heat exchange, but not at high strain rates where excessive strain rates will lead to a rise in the temperature due to the lack of rapid heat transfer. Therefore, it is necessary to correct the strain–stress curves to eliminate the effect of the adiabatic heating effect. Generally, the temperature rise during thermal compression is expressed as [28]:
where ΔT is the temperature rise; η is the adiabatic correction parameter; ρ is the density of the Ti−65541 alloy (4.83 g/cm3); and Cp is the specific heat (0.612 J·g−1·°C−1). It was observed in Figure 2 that ΔT increased with lower temperature and larger strain rate and strain. The stress was not corrected in Figure 2d because low strain rates allow the samples to have enough time to exchange heat. Two main mechanisms exist during thermal deformation: work hardening and dynamic softening. In the period of low strain, some dislocations annihilate and form substructures that can drive the softening mechanism. After the stress peak, dynamic softening gradually becomes the dominant mechanism of thermal deformation, and the stress decreases. Therefore, two mechanisms are in competition with each other during thermal deformation and reach equilibrium after reaching a certain strain, and the curves tend to be horizontal.
3.2. Constitutive Modeling
It is generally recognized that establishing constitutive models is very important in the hot process. A lot of research on different materials has shown that temperature and strain rate are two major impact factors in hot compression. The Arrhenius model, shown in Equation (3), is a semi-empirical model that is widely utilized to describe the link between the deformation parameters and stress in the metals and alloys [29,30]. In addition, Zener et al. proposed the temperature compensation strain rate factor (Z) to explain the effect of the above two factors on hot working as follows [9]:
where is the strain rate (s−1); σp is the peak stress; Q is the apparent activation energy (J·mol−1) for the hot process; R is the universal gas constant (8.314 J·mol−1·K−1); T is the absolute deformation temperature (K); A, A1, A2, n1, α and β are material constants; and n is the stress exponent. Equation (4) gives three different expressions describing the relationship between the parameter Z and the peak stress while the hyperbolic sine function can well describe the relationship between them under all stress ranges. The logarithm of Equation (4) was taken to calculate each parameter in the above equation:
As shown in Equation (5), n1, β, and n exist as coefficients of stress terms, so we can calculate these constants by partial differentiation of the stress terms in Equation (5):
As shown in Equation (6), n1, β, and n can be expressed as the ratios at a determined temperature, where the data are all taken from the corrected curves. Material constants were solved and averaged for all temperatures and all material parameters were calculated separately for different phase regions. n1 and β were obtained from the linear regression of Figure 3a,b, where n1 = 5.48405957 and β = 0.030663202 in the α + β phase region and n1 = 4.19621501 and β = 0.043775198 in the β phase region. Furthermore, α can be calculated (α = β/n1) as α = 0.00559133 for the α + β phase region and α = 0.01043207 for the β region. Similarly, n can be calculated by the above methods in Figure 3c, where the value of n is 4.089812278 for the α + β phase region and 3.080847603 for the β phase region. For a certain strain rate, taking the partial differential of the third equation in Equation (5) can give the expression of Q as follows:
Based on R and the obtained n, we only need to compute k by linear regression in Figure 3d to obtain Q according to Equation (7). Q is 323.0987 kJ·mol−1 for the α + β phase region and 241.62900 kJ·mol−1 for the β phase region. From the third equation in Equation (5), the linear relationship between ln Z and ln[sinh(σp)] is shown in Figure 3e, and its intercept is the value of ln A. At this point, all material parameters are calculated, and the Z of the α + β phase region and β phase region can be calculated as follows:
Typically, strain significantly affects the individual material constants [31], however, only the peak stress was used to calculate the Arrhenius model. In order to better comprehensively consider the influence of each factor on the flow stress during heat deformation, the influence of the strain variables was further discussed. The n, Q, ln A, and α corresponding to all strain values from 0 to 0.7 were calculated in steps of 0.05 in Figure 4. The material constants changed significantly as the strain increased. Obviously, the influence of the strain variable on the constitutive equations cannot be ignored. Studies have shown that a polynomial fit can be utilized to obtain a function of the material constants and strain [32]. In this research, the sixth-order polynomial equations fit the data well, as shown in Equation (10), and the coefficients of the polynomial equations are shown in Table 2 and Table 3.
where P represents the material constant and k is the polynomial coefficient. After calculating these material parameters, based on the derivation of the hyperbolic sine function, the values of stress can be predicted by the following equation, which expresses the flow stress as a function of the Z [33]:
P = k0 + k1ε + k2ε2 + k3ε3 + k4ε4 + k5ε5 + k6ε6 + ……
Figure 5 shows a good match between the experimental and calculated stress indicating that the Arrhenius model gives a nice description of the flow stress of the Ti−65541 alloy. In addition, the correlation coefficients (R) and the mean absolute errors (Δ) were used to assess the accuracy of the predictions [34]:
where is the experimental stress; is the predicted stress; are the average values of , and N is the number of data. As shown in Figure 6, the experimental data and the predicted data agreed well. The R calculated by Equation (12) was 0.992 and the Δ calculated by Equation (13) was 5.32%. These further support that the Arrhenius model established constructs with good prediction.
3.3. Hot Processing Map
Thermal processing diagrams are often used to synthesize and evaluate the processing performance of materials to optimize the optimal processing parameters. Prasad et al. [35] proposed the dynamic materials model (DMM) for generating the thermal processing map by superimposing the plastic instability map over the power dissipation map. The total power input (P) to the system during thermal compression may be described as the following, using the law of thermodynamics:
where G represents the power dissipation resulting from plastic deformation and J represents the power dissipation due to microstructure evolution. The following equation can be used to compute the introduced power dissipation efficiency (η):
where m is the index of the strain rate sensitivity, which can be expressed as:
Based on the maximum entropy generation principle, the plastic instability parameter ξ () can be expressed as [36]:
The plastic instability map and power dissipation efficiency map for various deformation circumstances were obtained by interpolating the values of η and ξ. The contour values in Figure 7c represent the η values, and the thermal processing graph was divided into four different colored sections representing the different levels of power efficiency. Figure 7c clearly shows that there was a sizable area of high value of η and the value declined with rising strain rate and lowering temperature. Additionally, a plastic instability zone was located in the processing figure’s top left corner.
3.4. Microstructure Evolution
3.4.1. High η Region
Region A is a safe zone with a η value between 0.45 and 0.46; the temperatures and strain rates are 940~950 °C and 0.001~0.006 s−1, respectively. Figure 8a shows the intact DRX and that some of the DRX grains substantially coarsened. High angle grain boundaries (HAGBs) are shown as black whereas low angle grain boundaries (LAGBs) are shown as red in Figure 8b. Under the right circumstances, LAGBs may undergo a transition into HAGBs, and this takes place sooner as the η rises [23]. In Figure 8b, the proportions of the LAGBs and the HAGBs of region A were 45.6% and 54.4%, respectively. There were very few LAGBs in the DRX grains that had been completed and Figure 8b shows a common occurrence of the DRX process: bridging LAGBs form behind the bulge of HAGBs [37]. Furthermore, the DRX was correlated with dislocation density during hot deformation and dislocation density analysis is often performed using KAM maps. Figure 8 shows regions with low KAM values as blue and areas with high KAM values as green. In Figure 8c, the blue portions can be mostly found in the DRX grains and the KAM peak value was lower than that of other regions, demonstrating that the DRX phenomena may dramatically reduce dislocation density and deformation energy.
The temperature and strain rate in region B were 860~880 °C and 0.001~0.002 s−1, respectively. Figure 8d depicts the occurrence of DRX with certain elongated grains. The distribution of DRX grains alongside elongated grains suggests that deformation grains are gradually replaced by DRX grains as a result of that high temperature, providing sufficient energy for the nucleation of DRX and lower strain rate, allowing the dislocations to have sufficient time to migrate and proliferate. The lack of coarsening in the DRX grains is likely to be caused by the temperature not being high enough to provide adequate energy for growth. A great number of LAGBs and Figure 8f showed elongated grains with dense dislocations that are beneficial for the substructures to transform into new grains.
High temperature (950 °C) and medium strain rate (0.01 s−1) of region C caused fewer and small DRX grains that were distributed between the elongated grains (Figure 8g). Unlike region A or B, Figure 8h,i showed that lots of LAGBs existed along the GBs and in small DRX grains, and the KAM values were very high on the grain boundaries, but several blue regions could still be seen in the center of the elongated grains. In the nucleation process, certain DRX grains located close to the elongated grain boundaries likely cause the aforementioned occurrence by facilitating the activation and diffusion of dislocations.
Apparently, all regions with high η values had various degrees of DRX. DRX provides uniform and fine grains by eliminating dislocations, which creates good processability. The deformation should be controlled cautiously to obtain a high η region.
3.4.2. Medium η Region
Region D is associated with a low strain rate (0.001~0.006 s−1) and temperature (750~780 °C) where η is in the range of 0.38~0.42. In Figure 9a, the boundaries of those seriously deformed grains became serrated with a new phenomenon of necklace structures distributed beside the deformed grain boundaries. Compared with Region C, the boundaries became smoother and most DRX grains were continuous, but the relatively lower temperature rendered much finer DRX grains. Homoplastically, the higher dislocation density and more LAGBs were mainly concentrated near grain boundaries and in the necklace structures that are conducive to the DRX.
Region E had a η of around 0.37 and is characterized by a medium strain rate (0.1 s−1) and temperature (830 °C). It was noted that grains were strongly deformed in Figure 9d and the proportion of DRX grains was negligible in comparison to the aforementioned zones. Moreover, the DRX grains were only seldomly discovered in the crevices between the deformed grains and the boundaries of the lathy grains were very straight, which are common features of DRV. Obviously, the dislocation density of region E (Figure 9f) was so high because the relatively larger strain rate accelerated the proliferation of dislocations.
It can be found that the mechanism of DRX still plays a part in the middle regions, but DRV gradually replaced the status of DRX as the leading softening mechanism with smaller and fewer DRX grains. Comparatively speaking, lower η resulted in many more dislocations in these regions. Furthermore, the microstructures of regions with middle power dissipation efficiency were nonuniform, which is not conducive to engineering applications.
3.4.3. Low η Region
The instability zone was mostly covered by the low η region, which is located at the top left of the processing map as the blue zone shown in Figure 7.
Region F occurred at the top of the processing map where the η was 0.2~0.3. In Figure 10, the grains were seriously deformed in the flow area and few DRX grains could be observed next to the spindly grains with irregular GBs, which manifested the phenomenon of a deformation band (DB). The deformed grains and the small DRX grains showed a banded distribution with many LAGBs. Meanwhile, the KAM map revealed that the dislocation density was higher than the stable region in the elongated grains and the small DRX grains relatively.
The processing map’s most unstable region was region F. There were few DRX grains in the low dissipation efficiency region. The low value of η resulted in plastic flow instability with nonuniform microstructures. When hot processing Ti−65541, this region should be avoided.
4. Discussion
The objective of managing thermal deformation is to produce a homogeneous and fine microstructure and DRX was the most influential dynamic softening mechanism on the final microstructure. There are usually two types of DRX including cDRX and dDRX [38]. It is well-known that the cDRX is usually accompanied by dislocations, LAGBs, and DRV [39]. cDRX is accomplished by the incremental rotation of sub-grains next to the original grain boundaries, producing a gradient of misorientation from the original grain center to the grain border [40]. Therefore, the cDRX grains and original grains around usually have similar misorientations. Then, with an increasing degree of deformation, LAGBs absorb dislocations to become HAGBs and new grains are created. There is another characteristic that requires a large strain to complete cDRX. As seen in Figure 11a, LAGBs subdivide the grain into multiple sub-grains. Figure 11c demonstrates that the point-to-point misorientation was above 6° and the cumulative margin of misorientation was more than 15° from A to B, demonstrating the extreme activity of the progressive rotation of sub-grains. Furthermore, the appearance of cDRX can be judged by whether the point-to-origin misorientation is more than 15° [23,41]. Line (A–B) passed through four adjacent sub-grains, and the line of point-to-origin misorientation had four plateaus correspondingly indicating stabilization in the sub-grains. It can be expected that the sub-grains in Figure 11a will transform into DRX grains when increasing the strain to a certain extent. Figure 11b,d shows the mechanism of dDRX in region A. As another DRX mechanism, dDRX was also observed in region A. The jagged protrusion of the unrecrystallized grain boundaries, where LAGBs are located, is a distinguishing characteristic of dDRX. It was observed from Figure 11b that the LAGBs in the dDRX grains were much less than in the cDRX grains. Figure 11d shows that the cumulative misorientation was much lower than 15° from A to B in Figure 11b, and that there was no progressive rotation of sub-grains in this grain. dDRX was confirmed by all the phenomena above. Both DRX mechanisms appeared in region A. However, most of the grains in Figure 8a had sparse LAGBs but many bulges, and a more important reason is that the point-to-origin misorientation of most grains was much lower than 15°, so dDRX is the main softening mechanism in region A. As shown in the hot processing map, values of η that are rather high are often accompanied by microstructures that are of acceptable quality. High temperature and slow deformation speed provide DRX with adequate time and energy to form and develop.
In region B, grains were elongated seriously and the LAGBs increased greatly in Figure 8d. In comparison to region A, a lower temperature increased the deformation resistance, which means that the DRV becomes more active at this condition. Like region A, a deal of DRX grains can be found in Figure 8d. Although many bulges and DRX grains likely transformed from bulges can be seen, the orientations of these DRX grains were close to the original grains laterally. Figure 12 shows the misorientation in the grains of region B. Noteworthy is the fact that the point-to-origin misorientation exceeded 20°, which illustrates a more active progressive rotation of sub-grains than region A to a certain extent. Figure 12c,d shows one of only several dDRX appearances. Based on the reasons above, cDRX is regarded as the dominant DRX mechanism.
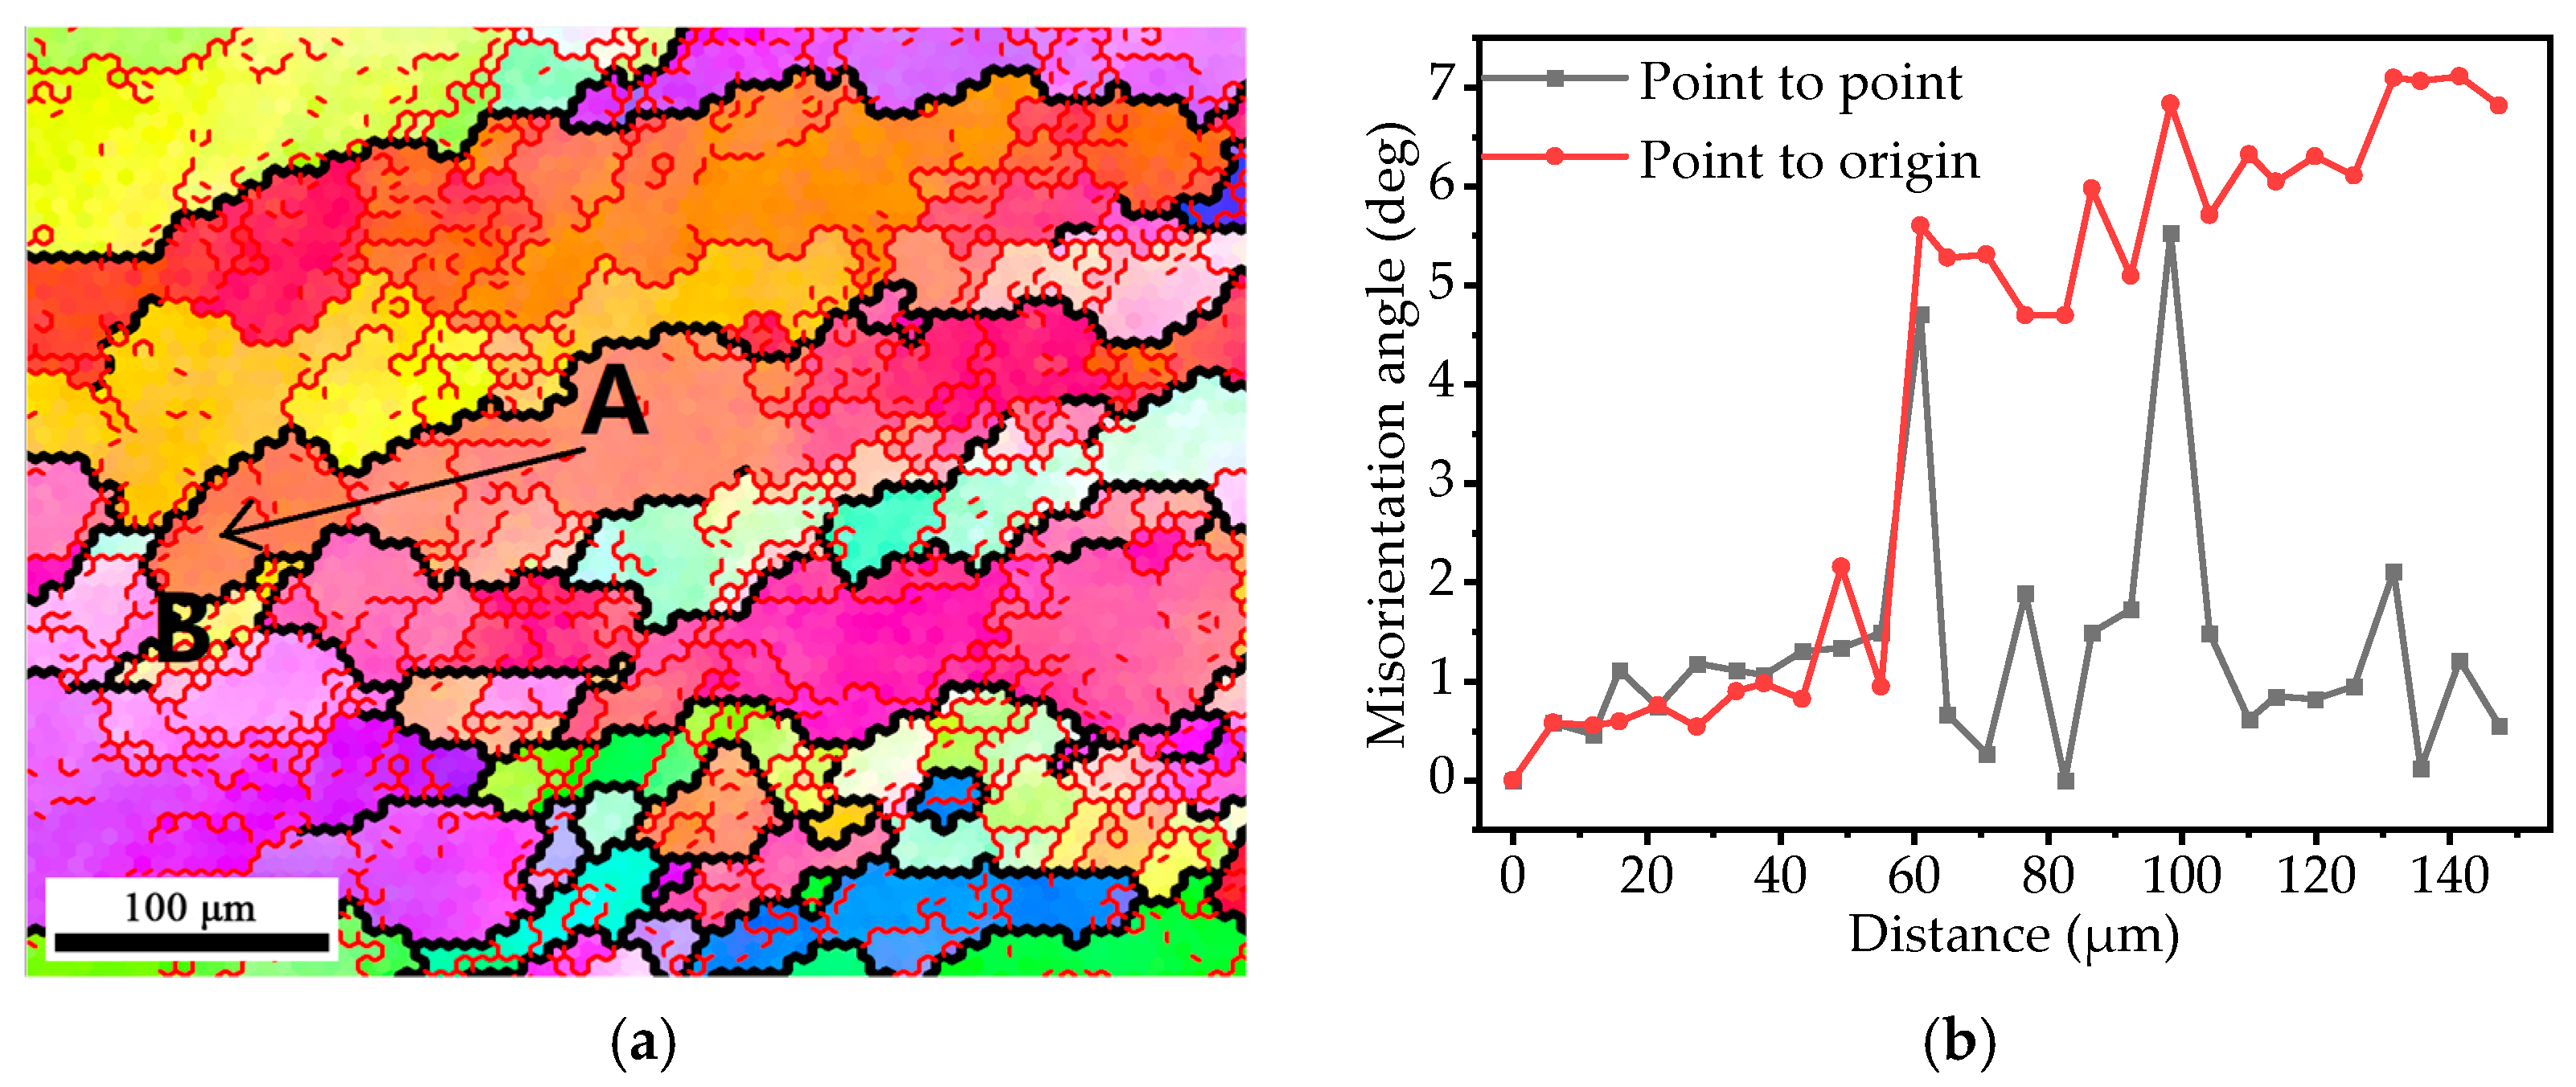
DRV takes the dominant state in region D, which is reflected in many more LAGBs and higher dislocation density on the junction of boundaries of the original grains and DRX grains. In region D, the DRX grains became smaller and fewer than in region B. No dDRX grains could be found in Figure 9a, but the misorientation chart (Figure 13b) confirmed the appearance of cDRX. By contrasting Figure 11c, Figure 12c, and Figure 13b, the point-to-origin misorientation increased as the temperature decreased because more sub-boundaries make more sub-grains to enlarge the misorientation.
In region C, the higher strain rate encouraged the development of LAGB in a subset of elongated grains. Many bulges were obvious, which are typical dDRX characteristics. There were even some bulges that occurred in the same elongated grain in Figure 14b. Although the DRX mechanism of region C is like that of region A, dDRX is dominated in both two regions, so region C also has some dynamic recovery.
As the strain rate increased to 1 s−1, almost no DRX occurred. If the temperature is reduced at the same time, a deformation band (DB) like that of region F in Figure 10 will form In summary, the deformation mechanism is affected by deformation conditions. First, there was the shift from dDRX to dDRX, and then the gradual domination of DRV with the temperature decreasing and the strain rate increasing.
5. Conclusions
Through the establishment of the constitutive equations and microstructure observations, the flow behavior and deformation mechanisms of the Ti−65541 alloy during thermal deformation were comprehensively explored in this study, and the following conclusions were drawn:
- The strain–stress curves were characterized by a single peak. With the increase in strain, the curves showed two stages of work hardening and flow softening, and discontinuous yielding was observed in the strain–stress plots.
- The present constitutive equations were established in each phase region, and by comparing the calculated and actual values at each strain, it was found that the Arrhenius model can well describe the flow behavior of Ti−65541.
- Through the hot processing map of Ti−65541, a high η region mainly existed in the areas regarding low strain rates and high temperatures and the recrystallization ratio was higher in these areas, which represents a beneficial interval of processing.
- The dynamic softening mechanisms can be distinguished at different processing conditions where the cDRX and dDRX were observed mainly in the high η region and, DRV and cDRX gradually replaced dDRX with the decrease in η. Furthermore, the DB, which hinders recrystallization, will occur when the η is less than 0.34 (low η region).
Author Contributions
Conceptualization, H.C. and H.Q.; methodology, F.Q. and B.L.; formal analysis, F.Q. and B.L.; investigation, F.Q. and B.L.; writing—original draft preparation, H.C.; writing—review and editing, Y.Y. and C.L.; visualization, H.C. and H.Q.; supervision, Y.Y.; project administration, C.L.; funding acquisition, C.L. All authors have read and agreed to the published version of the manuscript.
Funding
This research was funded by the Natural Science Foundation of Hubei Province of China (Grant No. 2022CFB016).
Data Availability Statement
Not applicable.
Conflicts of Interest
The authors declare that the research was conducted in the absence of any 356 commercial or financial relationships that could be construed as potential conflicts of interest.
References
- Boyer, R.; Briggs, R. The use of β titanium alloys in the aerospace industry. J. Mater. Eng. Perform. 2005, 14, 681–685. [Google Scholar] [CrossRef]
- Li, C.-M.; Huang, L.; Li, C.-L.; Hui, S.-X.; Yu, Y.; Zhao, M.-J.; Guo, S.-Q.; Li, J.-J. Research progress on hot deformation behavior of high-strength β titanium alloy: Flow behavior and constitutive model. Rare Met. 2022, 41, 1434–1455. [Google Scholar] [CrossRef]
- CHEN, Z.-q.; XU, L.-j.; CAO, S.-z.; YANG, J.-k.; ZHENG, Y.-f.; XIAO, S.-l.; Jing, T.; CHEN, Y.-y. Characterization of hot deformation and microstructure evolution of a new metastable β titanium alloy. Trans. Nonferrous Met. Soc. China 2022, 32, 1513–1529. [Google Scholar] [CrossRef]
- Chen, W.; Lv, Y.; Zhang, X.; Chen, C.; Lin, Y.; Zhou, K. Comparing the evolution and deformation mechanisms of lamellar and equiaxed microstructures in near β-Ti alloys during hot deformation. Mater. Sci. Eng. A 2019, 758, 71–78. [Google Scholar] [CrossRef]
- Wang, H.; Xin, S.-W.; Zhao, Y.-Q.; Zhou, W.; Zeng, W.-D. Forging–microstructure–tensile properties correlation in a new near β high-strength titanium alloy. Rare Met. 2021, 40, 2109–2117. [Google Scholar] [CrossRef]
- Lin, Y.; Chen, X.-M. A critical review of experimental results and constitutive descriptions for metals and alloys in hot working. Mater. Des. 2011, 32, 1733–1759. [Google Scholar] [CrossRef]
- Sellars, C.M.; McTegart, W. On the mechanism of hot deformation. Acta Metall. 1966, 14, 1136–1138. [Google Scholar] [CrossRef]
- Shi, H.; McLaren, A.; Sellars, C.; Shahani, R.; Bolingbroke, R. Constitutive equations for high temperature flow stress of aluminium alloys. Mater. Sci. Technol. 1997, 13, 210–216. [Google Scholar] [CrossRef]
- Zener, C.; Hollomon, J.H. Effect of strain rate upon plastic flow of steel. J. Appl. Phys. 1944, 15, 22–32. [Google Scholar] [CrossRef]
- Johnson, G.R. A constitutive model and data for materials subjected to large strains, high strain rates, and high temperatures. Proc. 7th Inf. Sympo. Ballist. 1983, 541–547. [Google Scholar]
- Khan, A.S.; Suh, Y.S.; Chen, X.; Takacs, L.; Zhang, H. Nanocrystalline aluminum and iron: Mechanical behavior at quasi-static and high strain rates, and constitutive modeling. Int. J. Plast. 2006, 22, 195–209. [Google Scholar] [CrossRef]
- Khan, A.S.; Suh, Y.S.; Kazmi, R. Quasi-static and dynamic loading responses and constitutive modeling of titanium alloys. Int. J. Plast. 2004, 20, 2233–2248. [Google Scholar] [CrossRef]
- Khan, A.S.; Zhang, H.; Takacs, L. Mechanical response and modeling of fully compacted nanocrystalline iron and copper. Int. J. Plast. 2000, 16, 1459–1476. [Google Scholar] [CrossRef]
- Lin, Y.; Chen, M.-S.; Zhong, J. Prediction of 42CrMo steel flow stress at high temperature and strain rate. Mech. Res. Commun. 2008, 35, 142–150. [Google Scholar] [CrossRef]
- Zerilli, F.J.; Armstrong, R.W. Dislocation-mechanics-based constitutive relations for material dynamics calculations. J. Appl. Phys. 1987, 61, 1816–1825. [Google Scholar] [CrossRef] [Green Version]
- Bodner, S.; Partom, Y. Constitutive equations for elastic-viscoplastic strain-hardening materials. J. Appl. Mech. 1975, 42, 385–389. [Google Scholar] [CrossRef]
- Lin, Y.; Liu, G.; Chen, M.-S.; Zhong, J. Prediction of static recrystallization in a mulTi–Pass hot deformed low-alloy steel using artificial neural network. J. Mater. Process. Technol. 2009, 209, 4611–4616. [Google Scholar] [CrossRef]
- Lin, Y.; Zhang, J.; Zhong, J. Application of neural networks to predict the elevated temperature flow behavior of a low alloy steel. Comput. Mater. Sci. 2008, 43, 752–758. [Google Scholar] [CrossRef]
- Quan, G.; Tong, Y.; Luo, G.; Zhou, J. A characterization for the flow behavior of 42CrMo steel. Comput. Mater. Sci. 2010, 50, 167–171. [Google Scholar] [CrossRef]
- Sheikh, H.; Serajzadeh, S. Estimation of flow stress behavior of AA5083 using artificial neural networks with regard to dynamic strain ageing effect. J. Mater. Process. Technol. 2008, 196, 115–119. [Google Scholar] [CrossRef]
- Shokry, A.; Gowid, S.; Kharmanda, G.; Mahdi, E. Constitutive models for the prediction of the hot deformation behavior of the 10% Cr steel alloy. Materials 2019, 12, 2873. [Google Scholar] [CrossRef] [PubMed]
- Fan, X.; Zhang, Y.; Gao, P.; Lei, Z.; Zhan, M. Deformation behavior and microstructure evolution during hot working of a coarse-grained Ti−5Al-5Mo-5V-3Cr-1Zr titanium alloy in beta phase field. Mater. Sci. Eng. A 2017, 694, 24–32. [Google Scholar] [CrossRef]
- Li, C.; Huang, L.; Zhao, M.; Guo, S.; Li, J. Hot deformation behavior and mechanism of a new metastable β titanium alloy Ti–6Cr–5Mo–5V–4Al in single phase region. Mater. Sci. Eng. A 2021, 814, 141231. [Google Scholar] [CrossRef]
- Li, C.; Huang, L.; Zhao, M.; Guo, S.; Li, J. Study on microstructure evolution and deformation mechanism of Ti−6554 based on power dissipation efficiency at supertransus temperatures. J. Alloys Compd. 2022, 924, 166481. [Google Scholar] [CrossRef]
- Li, C.; Huang, L.; Zhao, M.; Guo, S.; Su, Y.; Li, J. Characterization of hot workability of Ti−6Cr-5Mo-5V-4Al alloy based on hot processing map and microstructure evolution. J. Alloys Compd. 2022, 905, 164161. [Google Scholar] [CrossRef]
- Zhao, J.; Zhong, J.; Yan, F.; Chai, F.; Dargusch, M. Deformation behaviour and mechanisms during hot compression at supertransus temperatures in Ti−10V-2Fe-3Al. J. Alloys Compd. 2017, 710, 616–627. [Google Scholar] [CrossRef] [Green Version]
- Weiss, I.; Semiatin, S. Thermomechanical processing of beta titanium alloys—An overview. Mater. Sci. Eng. A 1998, 243, 46–65. [Google Scholar] [CrossRef]
- Goetz, R.; Semiatin, S. The adiabatic correction factor for deformation heating during the uniaxial compression test. J. Mater. Eng. Perform. 2001, 10, 710–717. [Google Scholar] [CrossRef]
- Ding, S.; Khan, S.A.; Yanagimoto, J. Flow behavior and dynamic recrystallization mechanism of A5083 aluminum alloys with different initial microstructures during hot compression. Mater. Sci. Eng. A 2020, 787, 139522. [Google Scholar] [CrossRef]
- Souza, P.M.; Beladi, H.; Singh, R.P.; Hodgson, P.D.; Rolfe, B. An analysis on the constitutive models for forging of Ti6Al4V alloy considering the softening behavior. J. Mater. Eng. Perform. 2018, 27, 3545–3558. [Google Scholar] [CrossRef]
- Cai, J.; Li, F.; Liu, T.; Chen, B.; He, M. Constitutive equations for elevated temperature flow stress of Ti–6Al–4V alloy considering the effect of strain. Mater. Des. 2011, 32, 1144–1151. [Google Scholar] [CrossRef]
- Samantaray, D.; Mandal, S.; Bhaduri, A. Constitutive analysis to predict high-temperature flow stress in modified 9Cr–1Mo (P91) steel. Mater. Des. 2010, 31, 981–984. [Google Scholar] [CrossRef]
- Ashtiani, H.R.; Shahsavari, P. A comparative study on the phenomenological and artificial neural network models to predict hot deformation behavior of AlCuMgPb alloy. J. Alloys Compd. 2016, 687, 263–273. [Google Scholar] [CrossRef]
- Wang, J.; Liu, Y.; Liu, B.; Wang, Y.; Cao, Y.; Li, T.; Zhou, R. Flow behavior and microstructures of powder metallurgical CrFeCoNiMo0. 2 high entropy alloy during high temperature deformation. Mater. Sci. Eng. A 2017, 689, 233–242. [Google Scholar] [CrossRef]
- Prasad, Y.; Gegel, H.; Doraivelu, S.; Malas, J.; Morgan, J.; Lark, K.; Barker, D. Modeling of dynamic material behavior in hot deformation: Forging of Ti−6242. Metall. Trans. A 1984, 15, 1883–1892. [Google Scholar] [CrossRef]
- Seshacharyulu, T.; Medeiros, S.; Frazier, W.; Prasad, Y. Hot working of commercial Ti–6Al–4V with an equiaxed α–β microstructure: Materials modeling considerations. Mater. Sci. Eng. A 2000, 284, 184–194. [Google Scholar] [CrossRef]
- Beer, A.G.; Barnett, M. Microstructural development during hot working of Mg-3Al-1Zn. Metall. Mater. Trans. A 2007, 38, 1856–1867. [Google Scholar] [CrossRef]
- Lin, Y.; Huang, J.; He, D.-G.; Zhang, X.-Y.; Wu, Q.; Wang, L.-H.; Chen, C.; Zhou, K.-C. Phase transformation and dynamic recrystallization behaviors in a Ti55511 titanium alloy during hot compression. J. Alloys Compd. 2019, 795, 471–482. [Google Scholar] [CrossRef]
- Mehtonen, S.; Palmiere, E.; Misra, R.; Karjalainen, L.; Porter, D. Dynamic restoration mechanisms in a Ti–Nb stabilized ferritic stainless steel during hot deformation. Mater. Sci. Eng. A 2014, 601, 7–19. [Google Scholar] [CrossRef]
- Chao, Q.; Hodgson, P.D.; Beladi, H. Ultrafine grain formation in a Ti−6Al-4V alloy by thermomechanical processing of a martensitic microstructure. Metall. Mater. Trans. A 2014, 45, 2659–2671. [Google Scholar] [CrossRef]
- Chen, W.; Hu, B.; Jia, C.; Zheng, C.; Li, D. Continuous dynamic recrystallization during the transient deformation in a Ni-30% Fe austenitic model alloy. Mater. Sci. Eng. A 2019, 751, 10–14. [Google Scholar] [CrossRef]
Figure 1.
(a) Original microstructure of the Ti−65541 alloy, and (b) experimental flow diagram of the hot compression tests.
Figure 1.
(a) Original microstructure of the Ti−65541 alloy, and (b) experimental flow diagram of the hot compression tests.

Figure 2.
Stain−stress curves of Ti−65541 under different strain rates: (a) 1 s−1, (b) 0.1 s−1, (c) 0.01 s−1, (d) 0.001 s−1.
Figure 2.
Stain−stress curves of Ti−65541 under different strain rates: (a) 1 s−1, (b) 0.1 s−1, (c) 0.01 s−1, (d) 0.001 s−1.

Figure 3.
The linear regression between (a) −ln, (b) −ln, (c) ln[sinh()]−ln, (d) ln[sinh( )]−1/T, (e) ln[sinh)]−ln Z of the Ti−65541 alloy in different phase regions.
Figure 3.
The linear regression between (a) −ln, (b) −ln, (c) ln[sinh()]−ln, (d) ln[sinh( )]−1/T, (e) ln[sinh)]−ln Z of the Ti−65541 alloy in different phase regions.
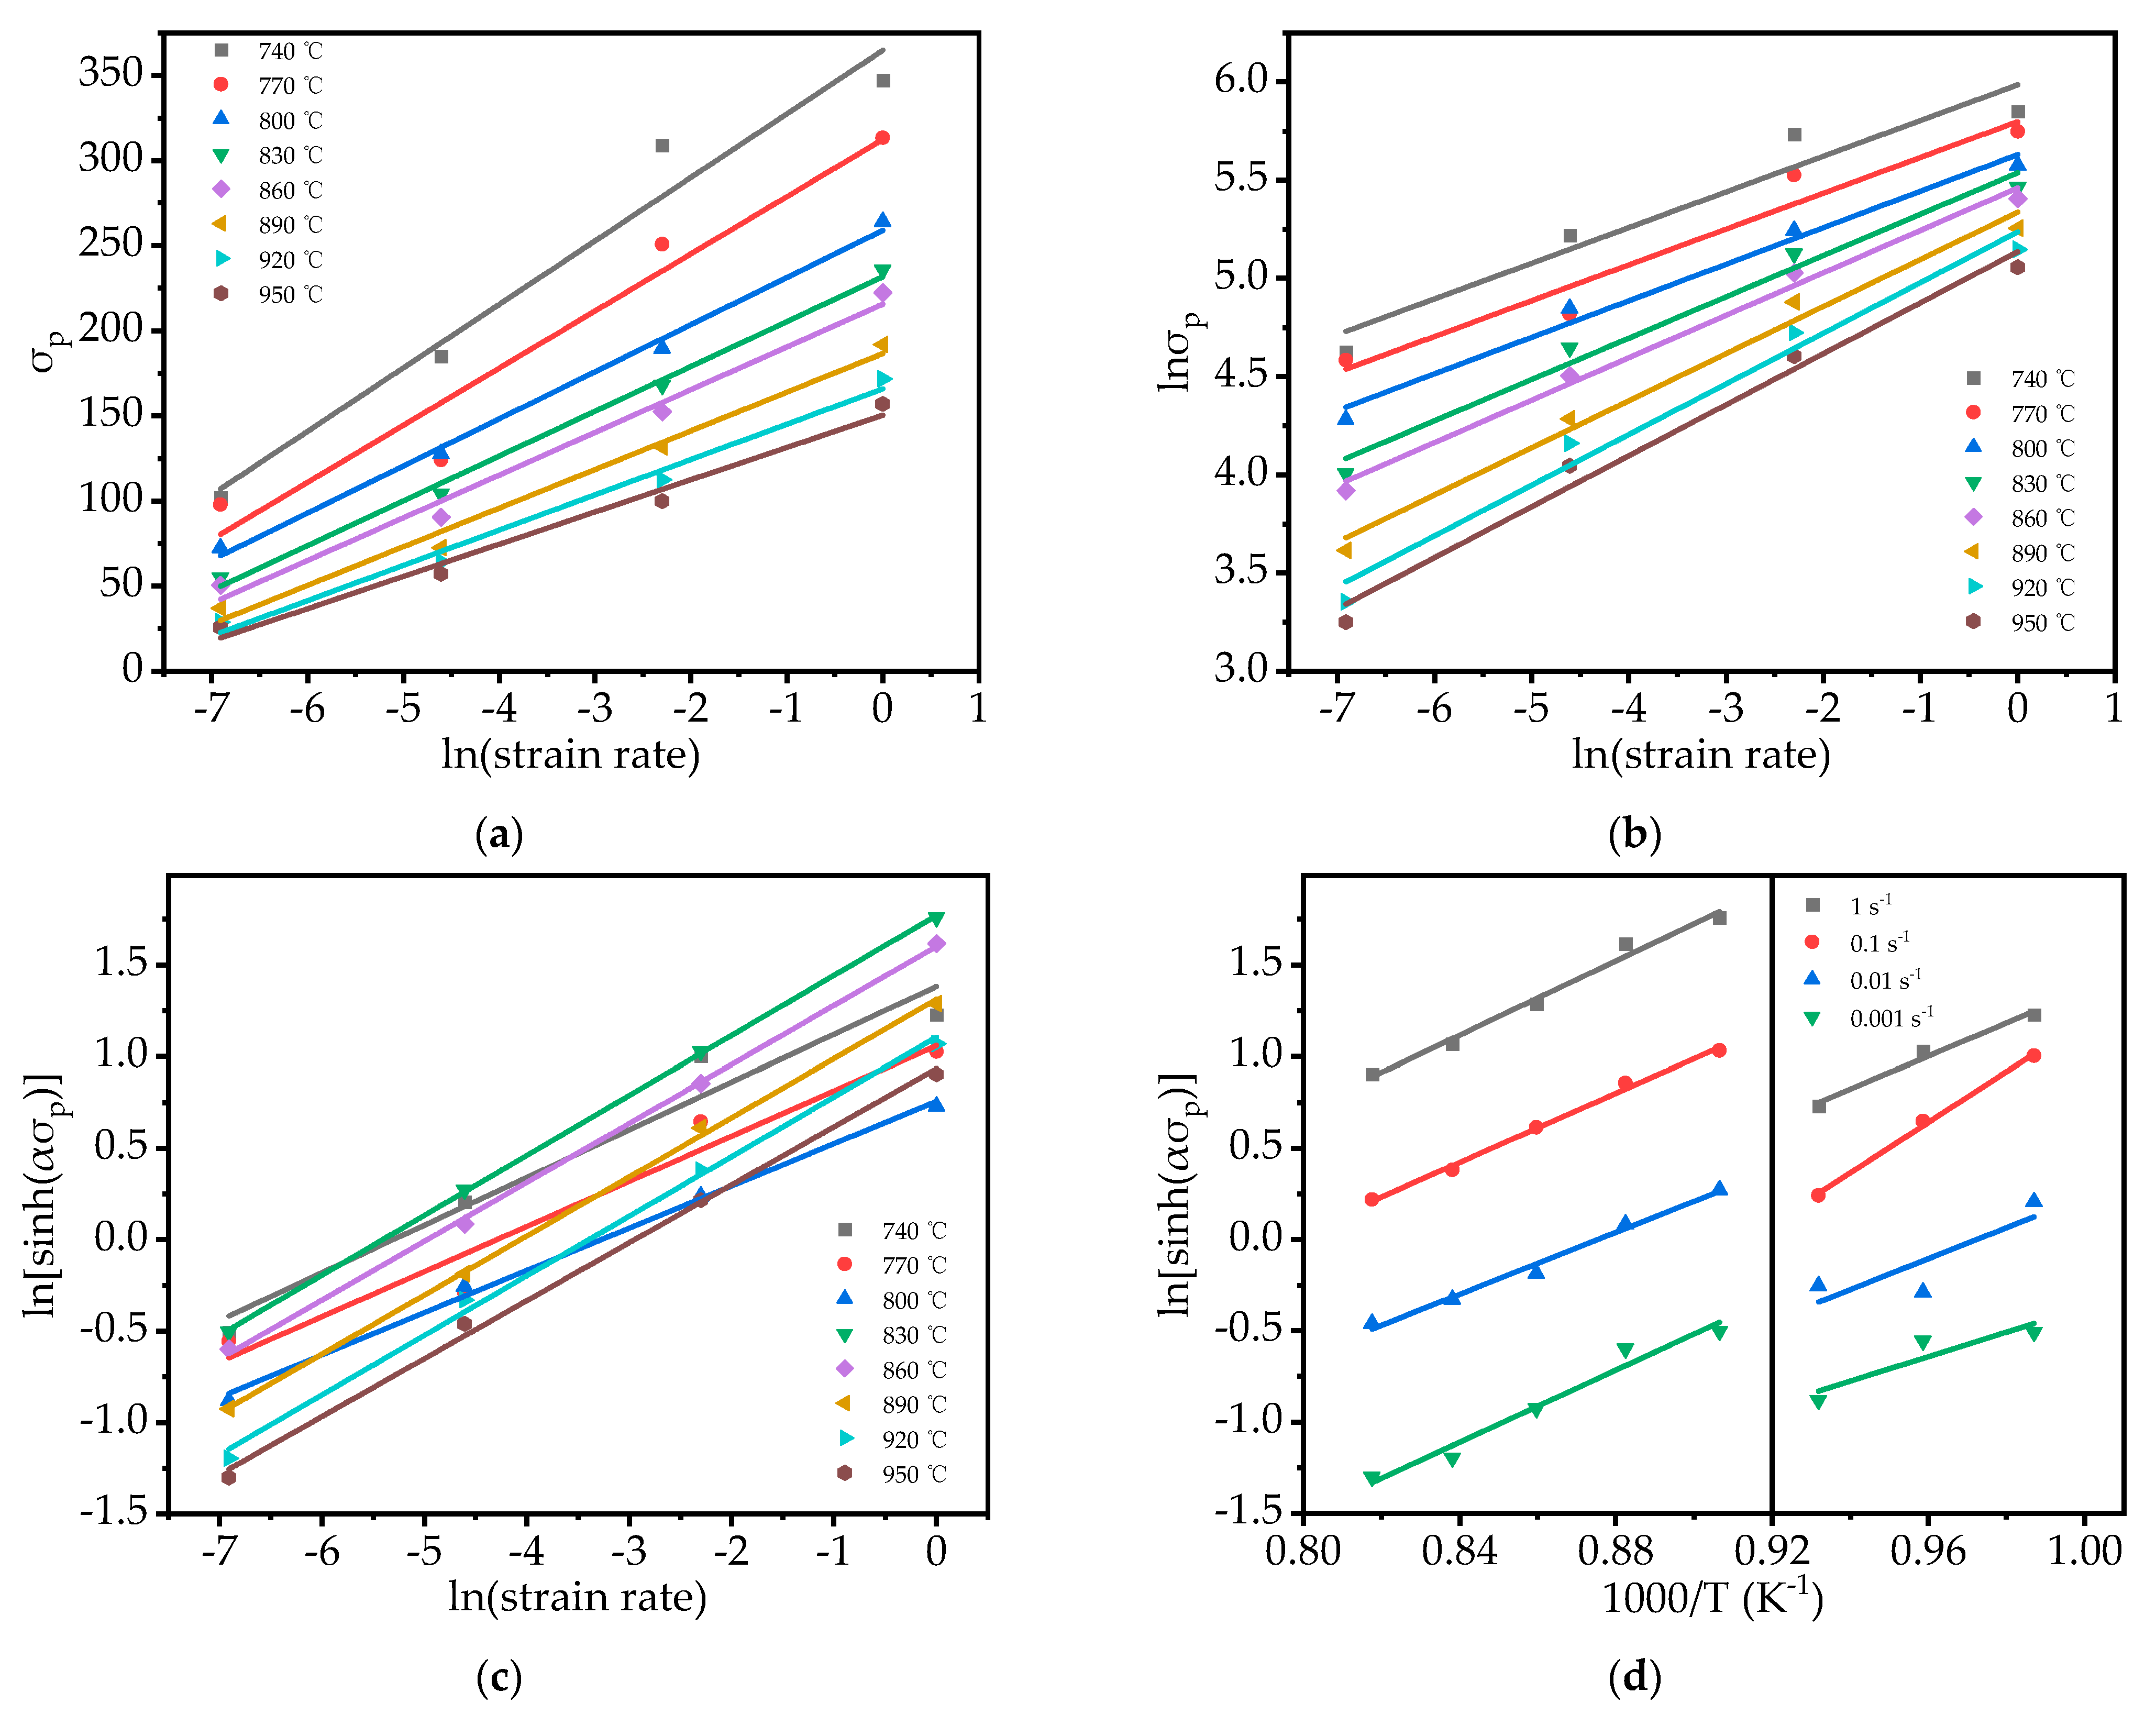

Figure 4.
Variations in the (a) ln A, (b) n, (c) Q, (d) α values with strain for the Ti−65541 alloy.
Figure 4.
Variations in the (a) ln A, (b) n, (c) Q, (d) α values with strain for the Ti−65541 alloy.

Figure 5.
Comparison of the experimental and predicted stress under different strains of the Ti−65541 alloy: (a) 950 °C, and (b) 0.01 s−1.
Figure 5.
Comparison of the experimental and predicted stress under different strains of the Ti−65541 alloy: (a) 950 °C, and (b) 0.01 s−1.

Figure 6.
Correlation analysis of the experimental and predicted flow stress under all conditions of the Ti−65541 alloy.
Figure 6.
Correlation analysis of the experimental and predicted flow stress under all conditions of the Ti−65541 alloy.

Figure 7.
(a) Power dissipation efficiency map, (b) plastic flow instability map, and (c) hot processing map of Ti−65541 alloy at a strain of 0.7.
Figure 7.
(a) Power dissipation efficiency map, (b) plastic flow instability map, and (c) hot processing map of Ti−65541 alloy at a strain of 0.7.

Figure 8.
(a,d,g) IPF map, (b,e,h) GB map, and the (c,f,i) KAM map of high η regions.
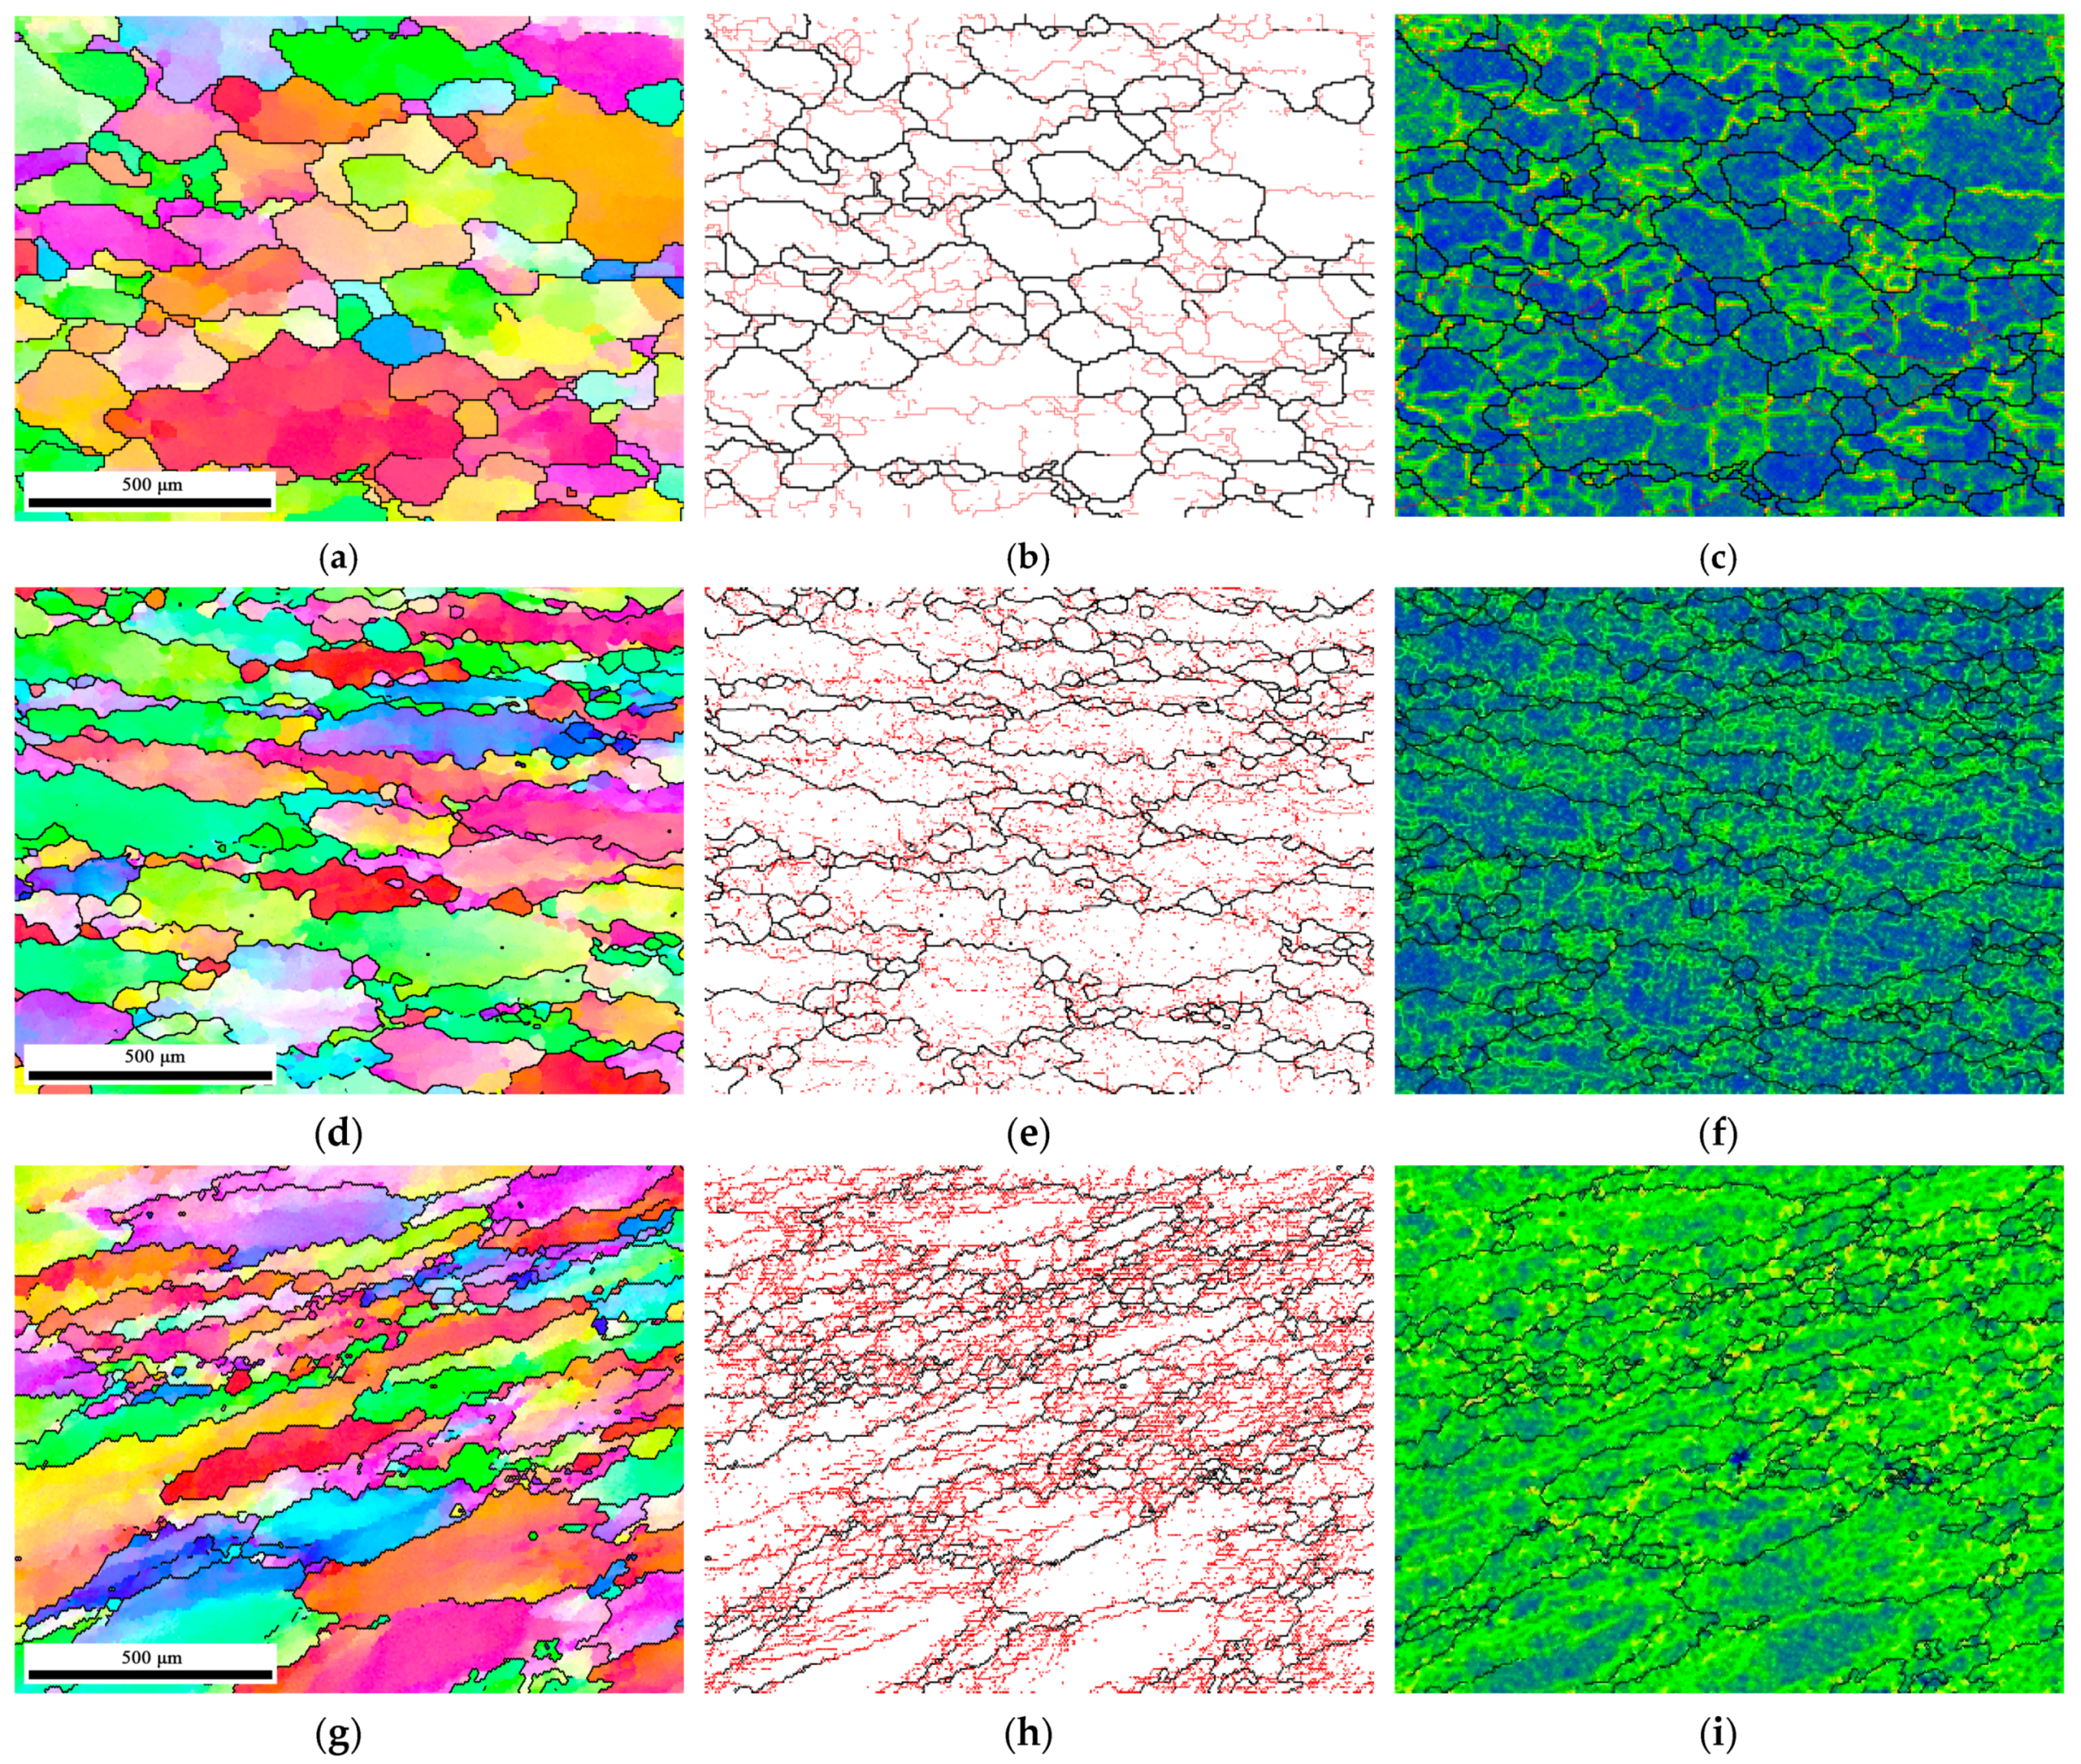
Figure 9.
(a,d) IPF map, (b,e) GB map, and the (c,f) KAM map of medium η regions.
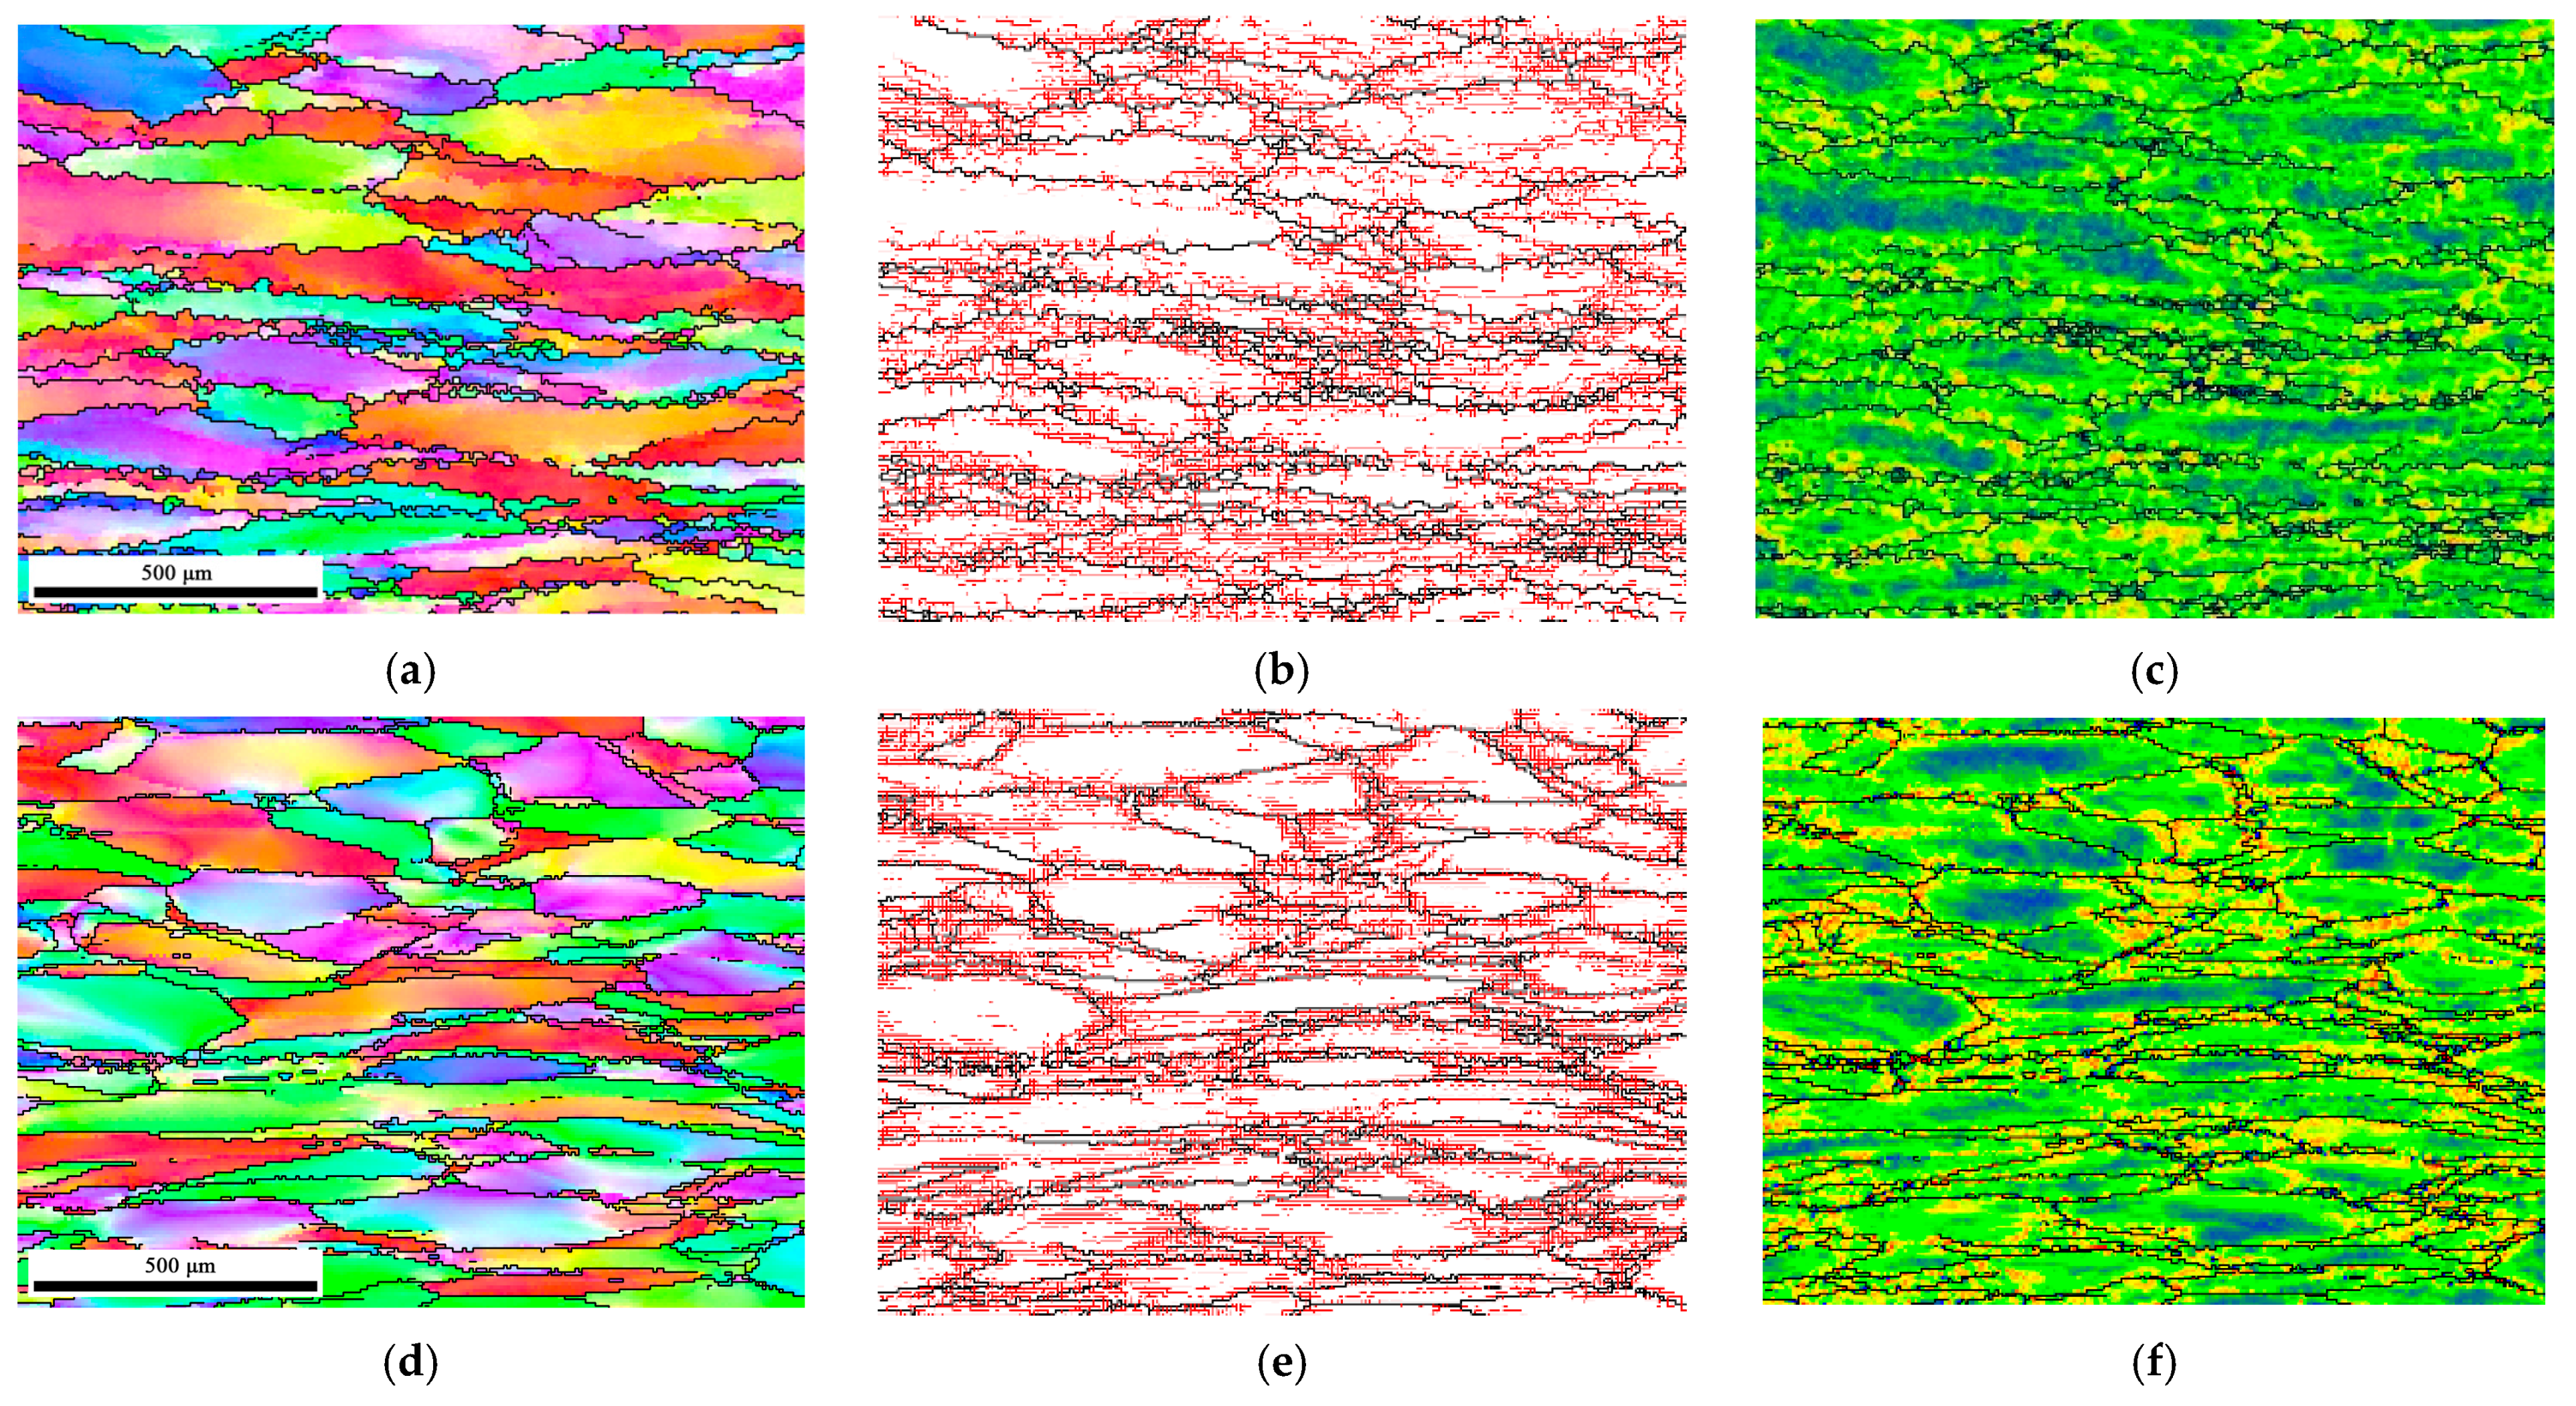
Figure 10.
(a) IPF map, (b) GB map, and the (c) KAM map of low η regions.
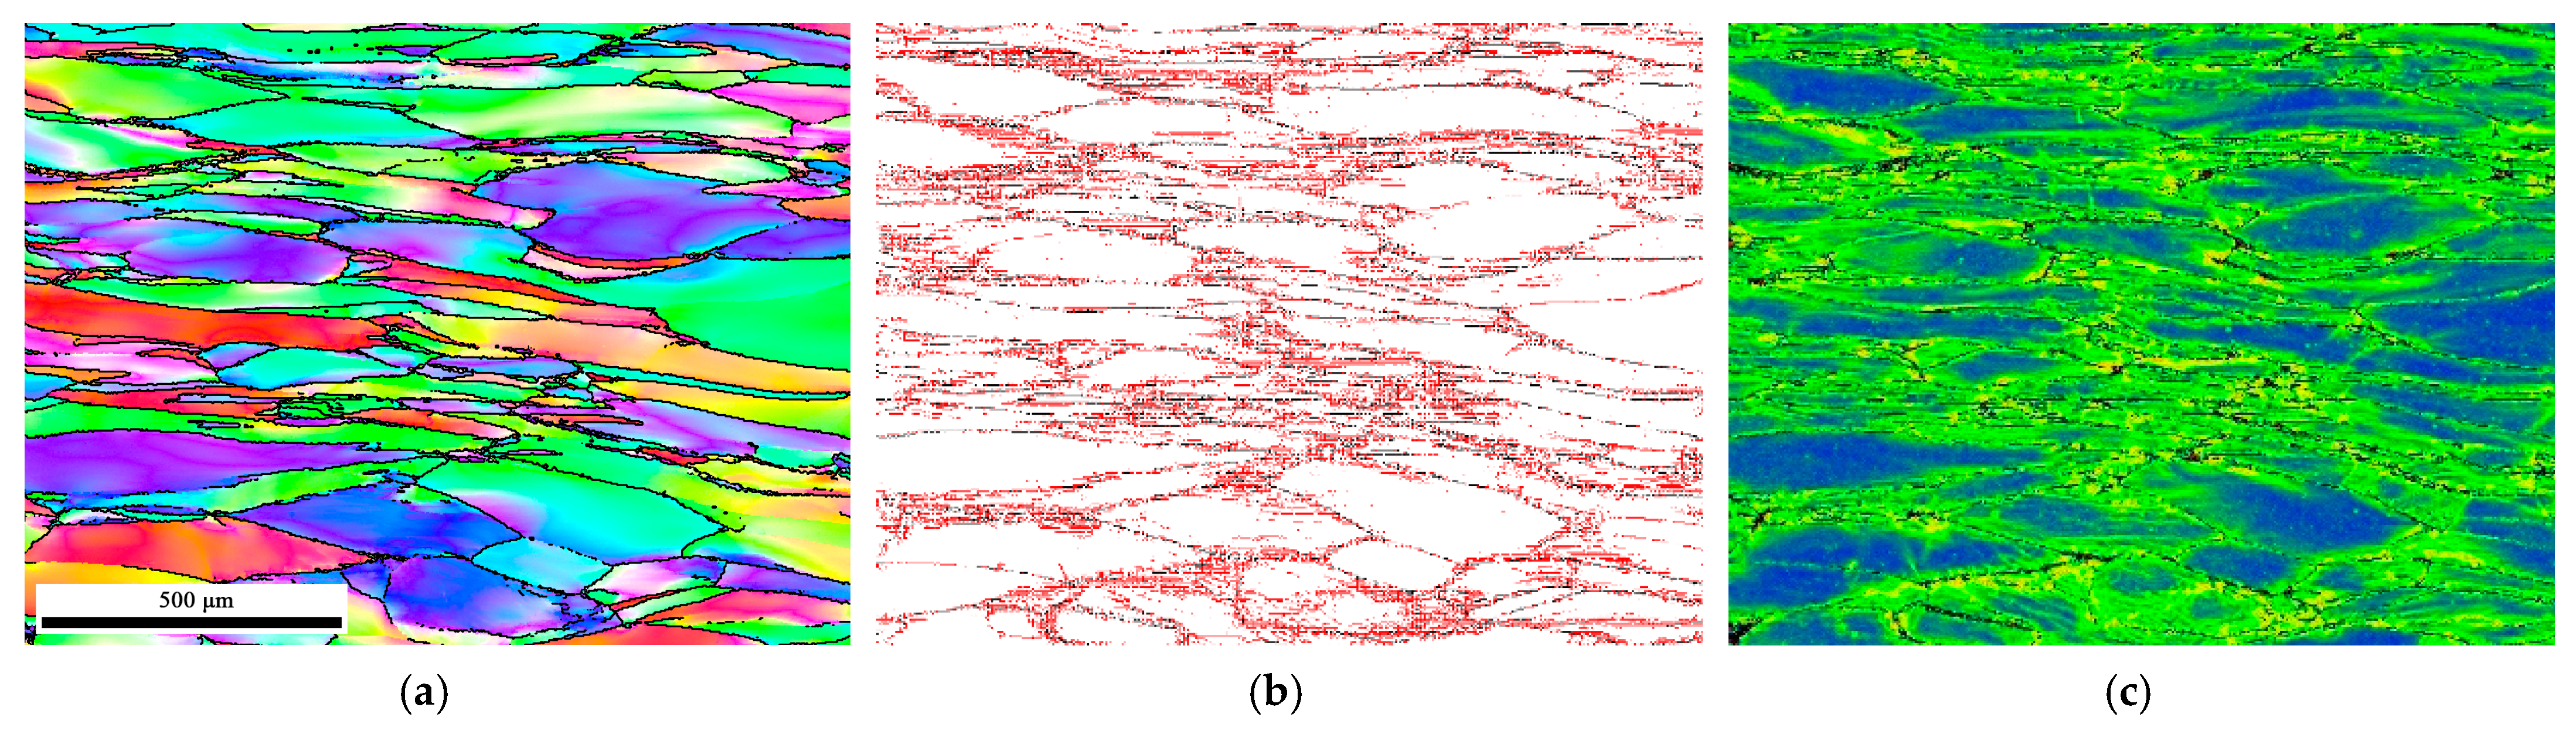
Figure 11.
cDRX and dDRX of Ti−65541 alloy in region A: (a,b) EBSD map, (c,d) the map of misorientation.
Figure 11.
cDRX and dDRX of Ti−65541 alloy in region A: (a,b) EBSD map, (c,d) the map of misorientation.
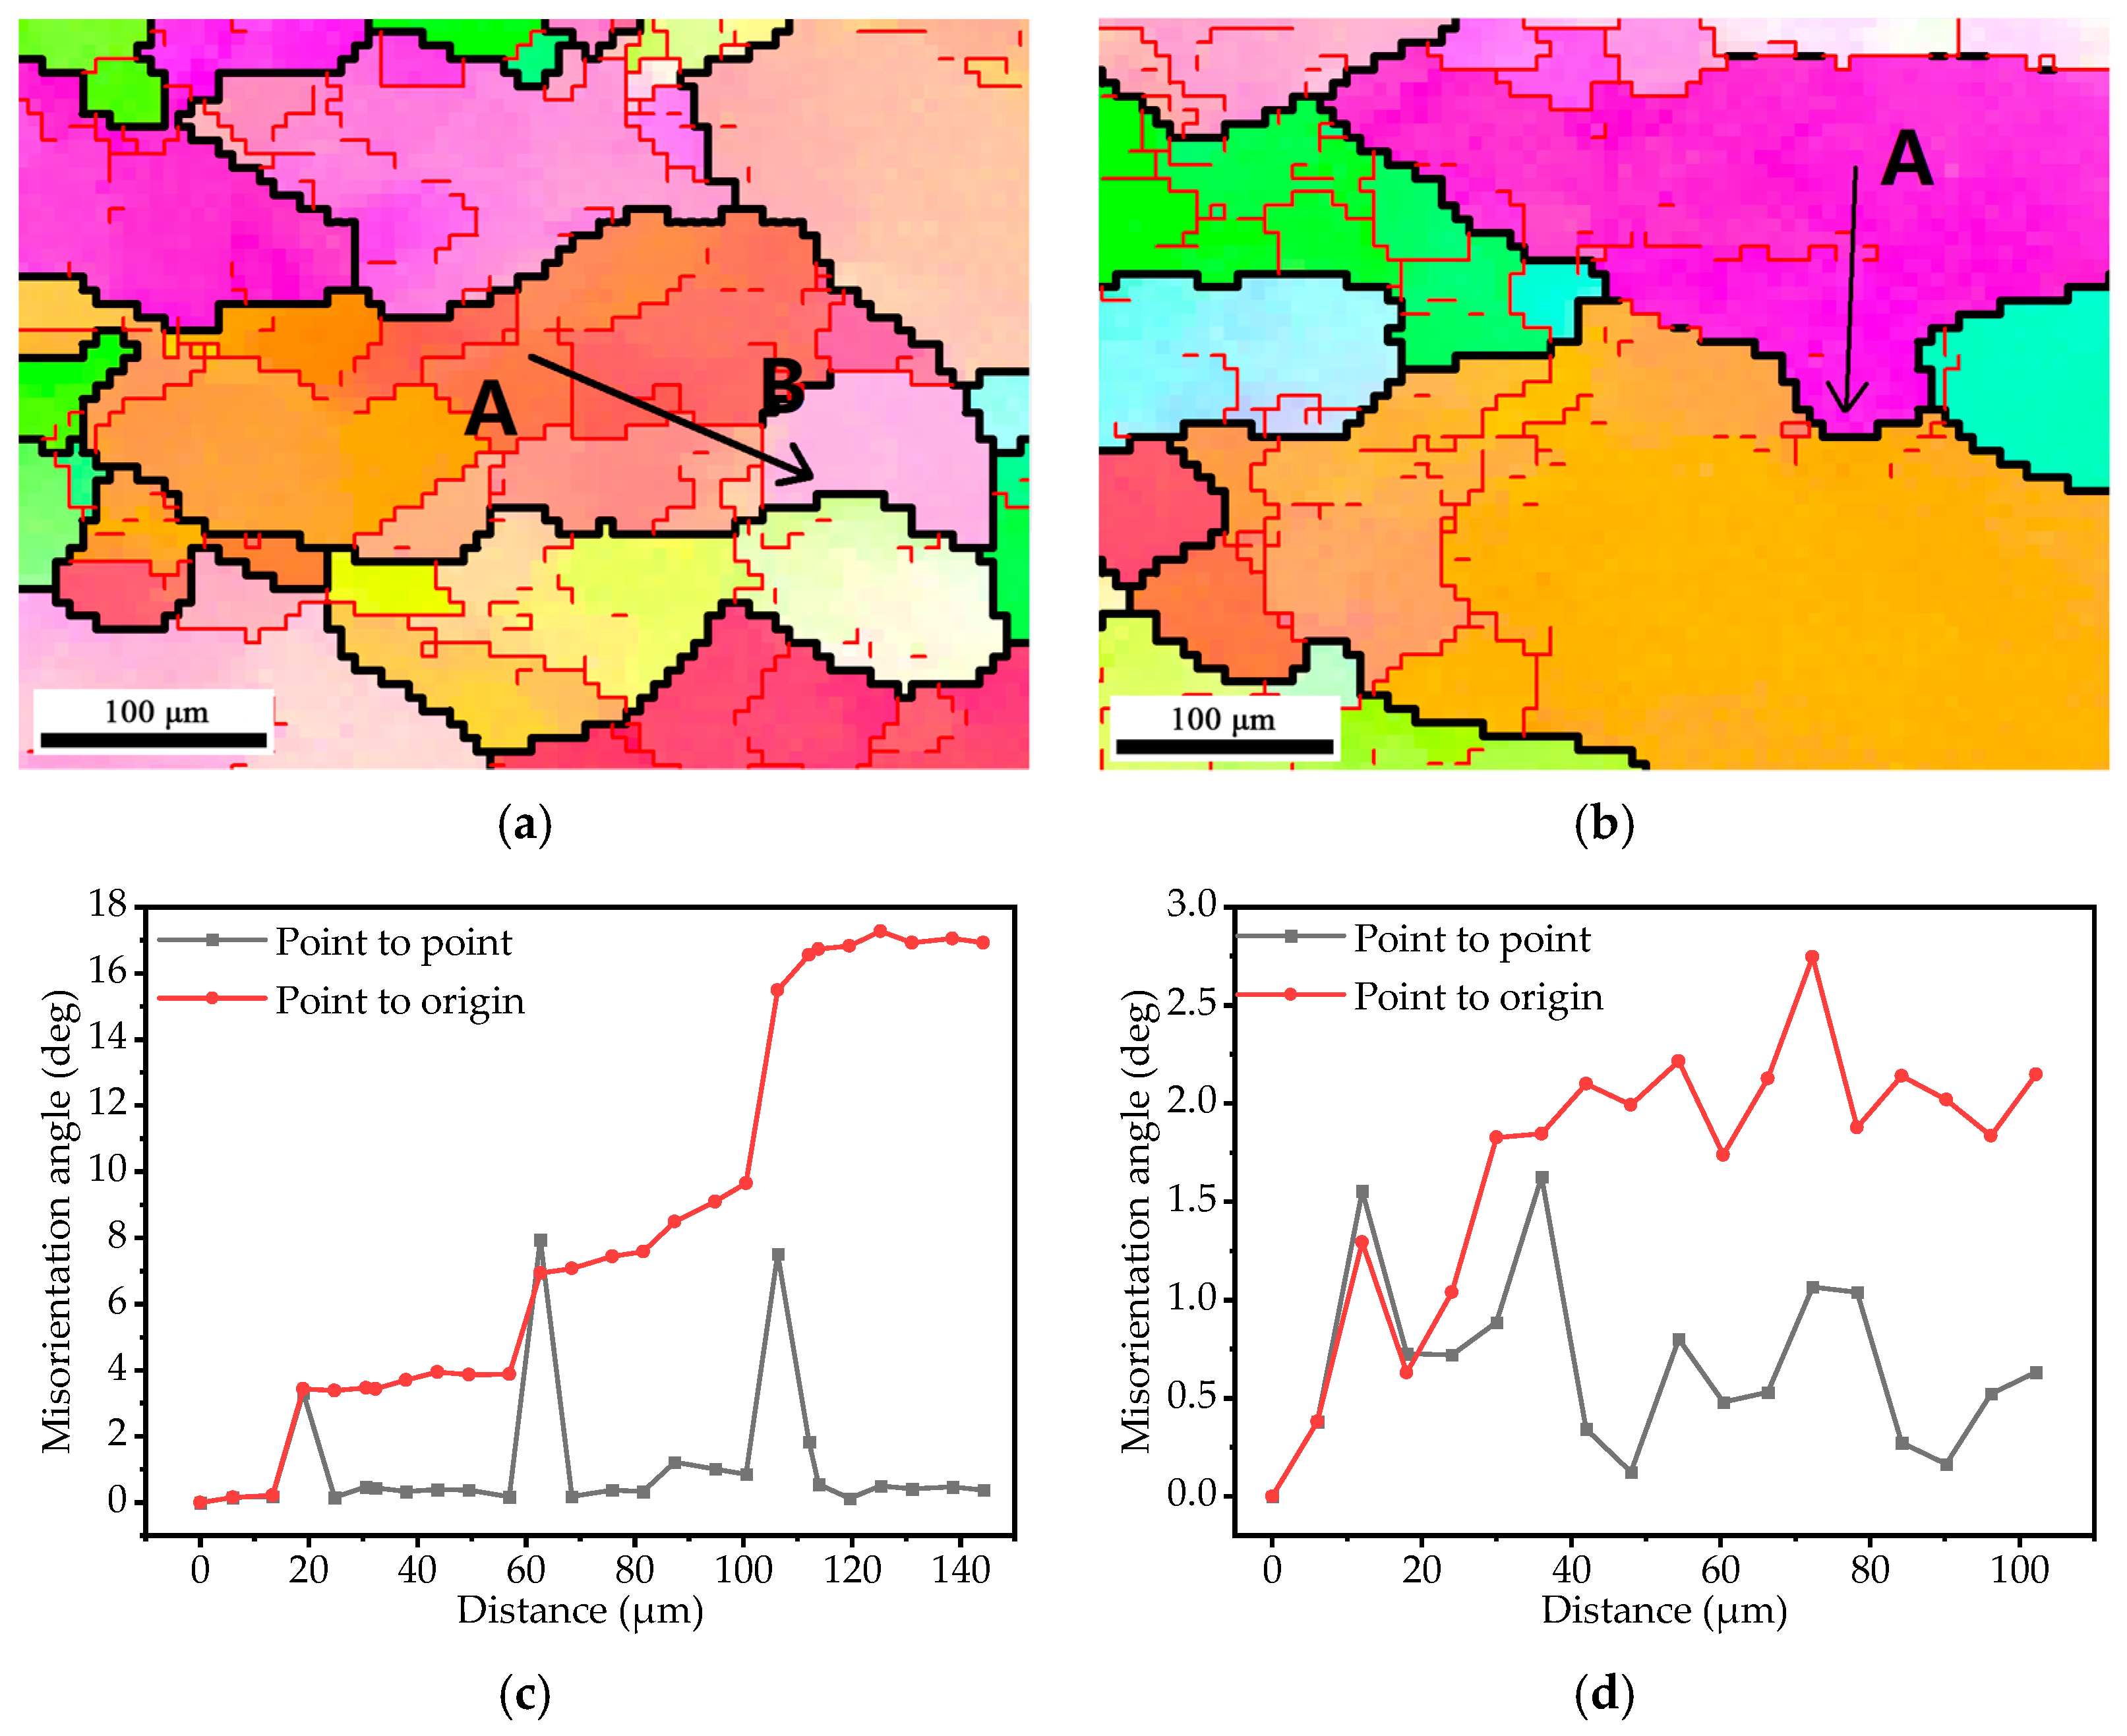
Figure 12.
cDRX and dDRX of the Ti−65541 alloy in region B: (a,b) EBSD map, (c,d) the map of misorientation.
Figure 12.
cDRX and dDRX of the Ti−65541 alloy in region B: (a,b) EBSD map, (c,d) the map of misorientation.

Figure 13.
cDRX of Ti−65541 alloy in region D: (a) EBSD map, (b) the map of misorientation.
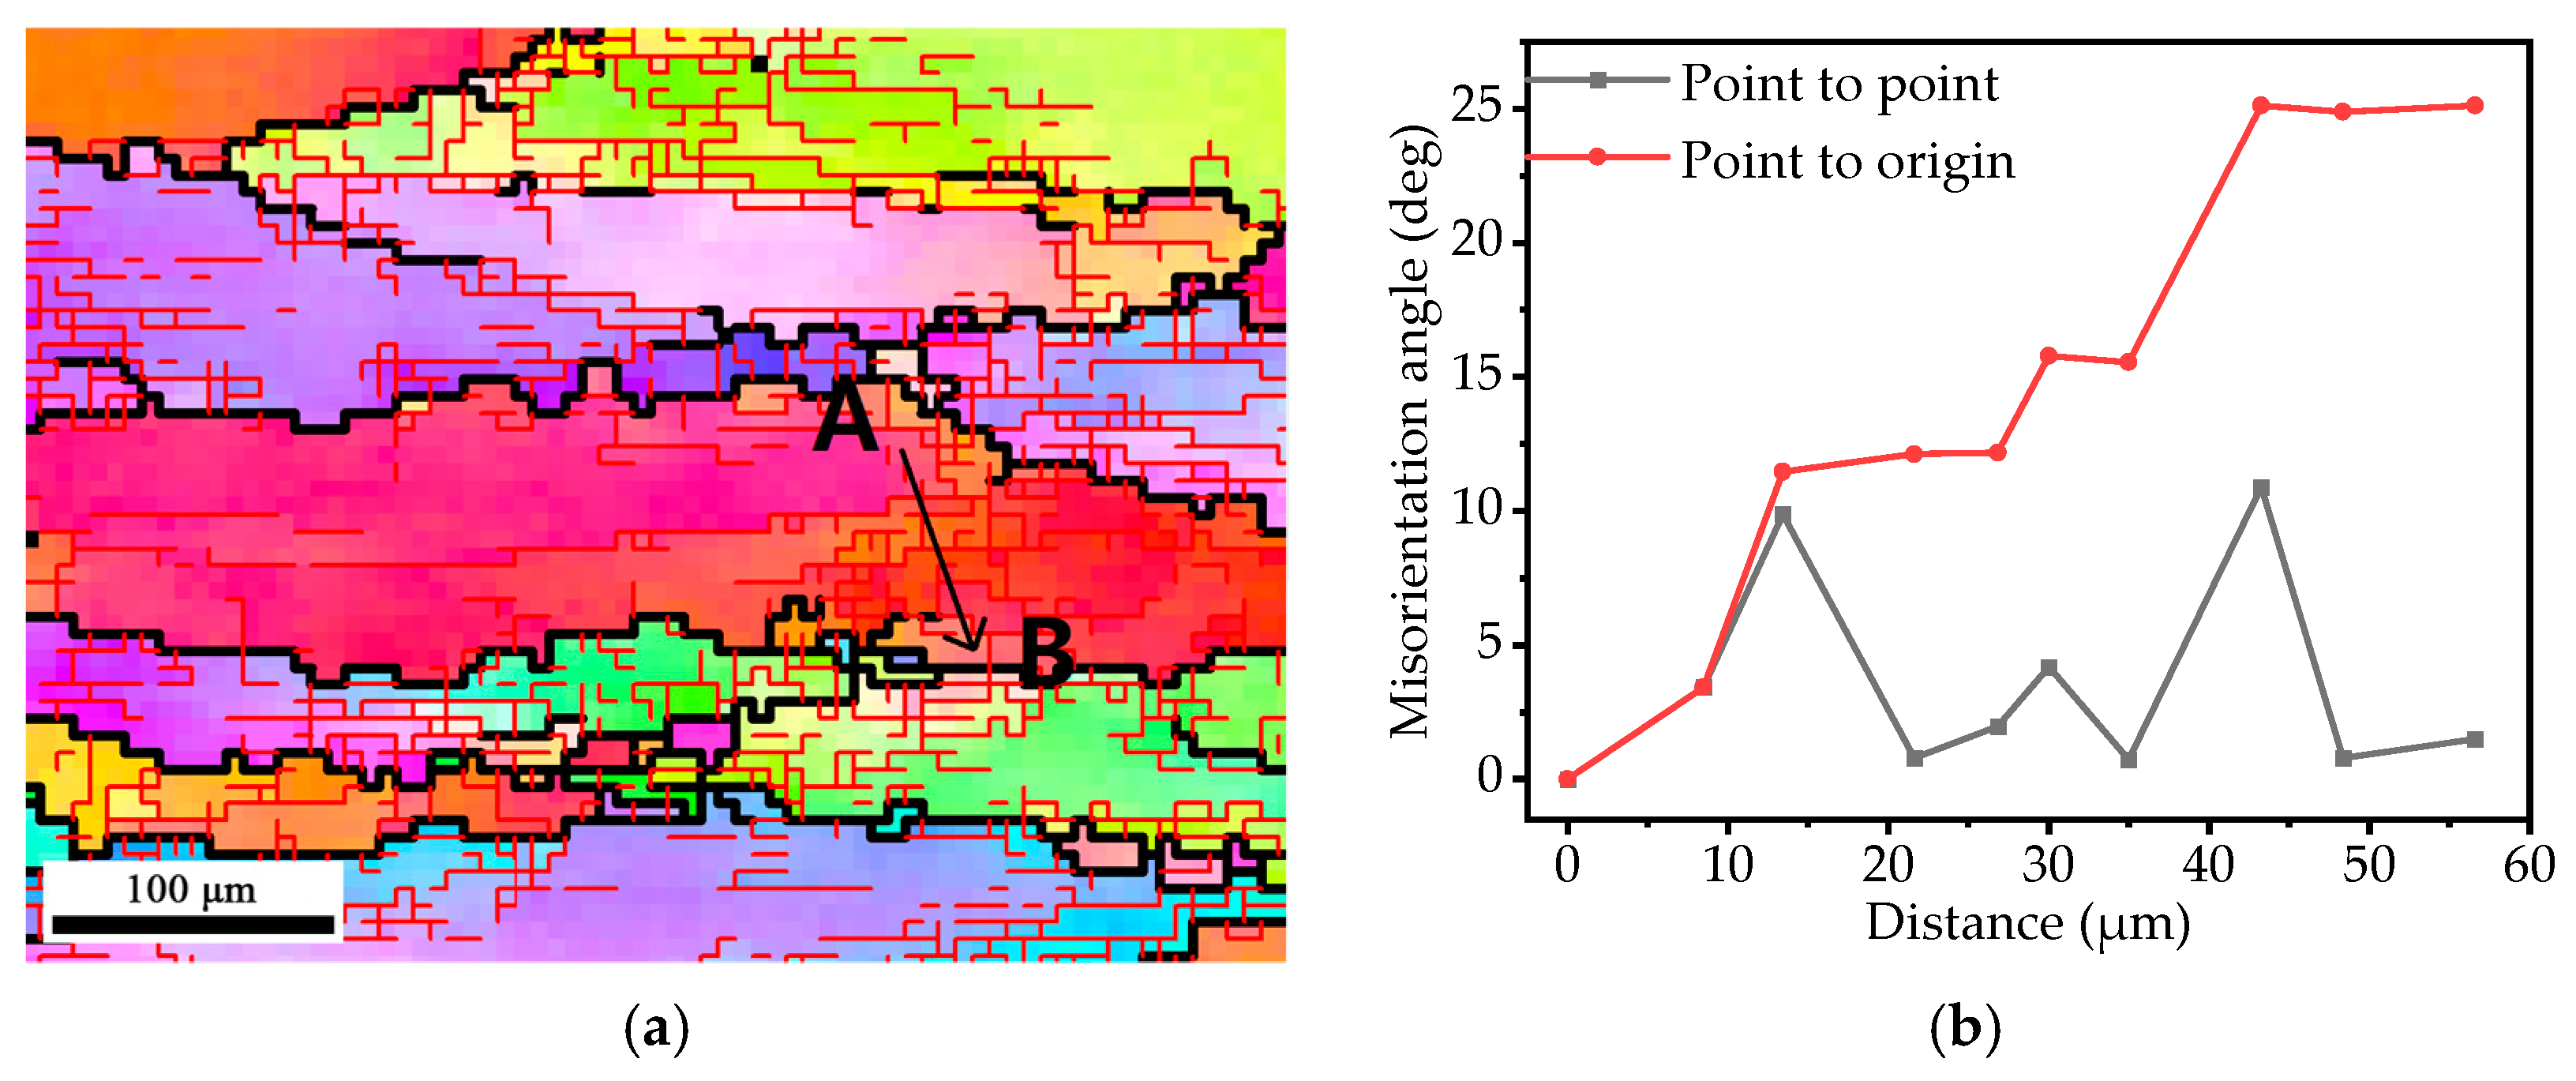
Figure 14.
dDRX of the Ti−65541 alloy in region C: (a) EBSD map, (b) the map of misorientation.

Table 1.
Chemical composition of the Ti−65541 alloy (%, mass fraction).
| Elements | Cr | Mo | V | Al | Nb | Fe | C | N | O | H | Ti |
| Content | 5.51 | 5.24 | 5.26 | 4.45 | 1.00 | 0.04 | 0.012 | 0.005 | 0.100 | <0.002 | Bal. |
Table 2.
Polynomial fit coefficients of α, n, Q, and ln A for the Ti−65541 alloy of the α+β phase.
| α | n | Q (kJ/mol) | ln A | |
|---|---|---|---|---|
| k0 | 0.00566 | 3.56477 | 276.5243 | 27.24064 |
| k1 | 0.01211 | 12.10995 | 678.204 | 84.59967 |
| k2 | −0.11975 | −149.178 | −6102.51 | −752.145 |
| k3 | 0.548 | 687.5365 | 24,980.34 | 3074.966 |
| k4 | −1.21746 | −1585.14 | −53044.6 | −6528.61 |
| k5 | 1.31886 | 1801.093 | 56,315.46 | 6934.72 |
| k6 | −0.56076 | −800.526 | −23,917.7 | −2945.3 |
Table 3.
Polynomial fit coefficients of α, n, Q, and ln A for the Ti−6554 alloy of the β phase.
| α | n | Q (kJ/mol) | ln A | |
|---|---|---|---|---|
| k0 | 0.00958 | 2.74844 | 224.4544 | 19.20754 |
| k1 | 0.03877 | 7.61912 | 325.3536 | 32.96578 |
| k2 | −0.38192 | −69.0918 | −3615.99 | −409.724 |
| k3 | 1.71311 | 262.9281 | 15445.43 | 1952.003 |
| k4 | −3.81289 | −524.632 | −33991.3 | −4681.51 |
| k5 | 4.16758 | 533.0972 | 37,504.83 | 5502.722 |
| k6 | −1.79161 | −216.532 | −16,338.9 | −2511.31 |
Disclaimer/Publisher’s Note: The statements, opinions and data contained in all publications are solely those of the individual author(s) and contributor(s) and not of MDPI and/or the editor(s). MDPI and/or the editor(s) disclaim responsibility for any injury to people or property resulting from any ideas, methods, instructions or products referred to in the content. |
© 2023 by the authors. Licensee MDPI, Basel, Switzerland. This article is an open access article distributed under the terms and conditions of the Creative Commons Attribution (CC BY) license (https://creativecommons.org/licenses/by/4.0/).
Share and Cite
MDPI and ACS Style
Chen, H.; Qin, H.; Qin, F.; Li, B.; Yu, Y.; Li, C. Hot Deformation Behavior and Microstructure Evolution of Ti–6Cr–5Mo–5V–4Al–1Nb Alloy. Crystals 2023, 13, 182. https://doi.org/10.3390/cryst13020182
AMA Style
Chen H, Qin H, Qin F, Li B, Yu Y, Li C. Hot Deformation Behavior and Microstructure Evolution of Ti–6Cr–5Mo–5V–4Al–1Nb Alloy. Crystals. 2023; 13(2):182. https://doi.org/10.3390/cryst13020182
Chicago/Turabian StyleChen, Haodong, Hanzhao Qin, Fengying Qin, Bo Li, Yang Yu, and Chenglin Li. 2023. "Hot Deformation Behavior and Microstructure Evolution of Ti–6Cr–5Mo–5V–4Al–1Nb Alloy" Crystals 13, no. 2: 182. https://doi.org/10.3390/cryst13020182
Note that from the first issue of 2016, this journal uses article numbers instead of page numbers. See further details here.