Article

Study on the High-Temperature Deformation and Dynamic Recrystallization Behavior near the Interface of Stainless Steel Cladding

Coordinative Innovation Center of Taiyuan Heavy Machinery Equipment, Taiyuan University of Science and Technology, Taiyuan 030024, China
*
Author to whom correspondence should be addressed.
Crystals 2022, 12(1), 81; https://doi.org/10.3390/cryst12010081
Submission received: 8 December 2021 / Revised: 2 January 2022 / Accepted: 4 January 2022 / Published: 7 January 2022
(This article belongs to the Topic Metal Matrix Composites: Recent Advancements)

Abstract

:
To ensure the long service life of concrete buildings in the marine environment, it is urgent to develop building materials with good corrosion resistance and weatherability. Stainless steel cladding is suitable for a highly corrosive environment and provides cost advantages. This paper investigated the deformation coordination and the microstructure evolution near the cladding interface of stainless steel/carbon steel. The stress-strain curves at different temperatures and strain rates were analyzed on the basis of high-temperature compression experiments. In addition, the sin-hyperbolic constitutive model was constructed, and the optimized parameters were obtained using electron backscatter diffraction characterization technology. The results show that at the deformation temperature of 1100 °C and the strain rate of 1 s−1, the deformation coordination increases significantly near the interface, accompanied by a large number of recrystallized grains, which has a positive impact on the comprehensive performance of the materials.

1. Introduction

Marine resource engineering is a leading industry that is tasked with the development of national strategic infrastructure. In the United States, the annual economic loss caused by chloride corrosion accounts for about 4% of GDP, and 40% to 50% of corrosion is related to reinforcing bars [1,2]. In China, concrete structures also suffer chloride corrosion in many seaports and docks. The main damage factors leading to cracks and corrosion include the corrosion of rebar, the carbonization of the protective cover, and the erosion of chloride, etc. Consequently, it is urgent to develop building materials with good corrosion resistance and weatherability to suit the marine environment [3,4].
The bimetallic steel of stainless steel/carbon steel is characterized by good corrosion resistance, mechanical properties, and cost advantages [5,6,7]. In view of stainless steel cladding, studies on the interface bonding mechanism and optimization of the process are critical and difficult. Sun et al. [8] proposed a modified element diffusion model based on the microscopic evolution mechanism in the transition zone, which could predict accurately the concentration distribution of atoms and the diffusion distance. Mudhaffar et al. [9] found good mechanical properties for bimetallic steel at a preheating temperature of 1200 °C, rolling speed of 30 m/min, and reduction ratio of 32%. Wang et al. [10] affirmed that the increase in rolling reduction rate improved tensile strength and interface deformation coordination and revealed that the interface bonding mechanism was related to the diffusion of elements, phase transition, and severe plastic deformation. Ban et al. [11] proposed calculation formulas based on the influence of the cladding ratio at high temperature, which could be utilized in the study of mechanical properties.
Studies on stainless steel cladding have achieved remarkable results, but there still exist key technical problems such as the uncontrollable deformation coordination, low bonding strength, and unstable structural evolution in the transition zone. The involved questions are closely linked with the deformation attributes and preparation methods for bimetallic steel. In this paper, the high-temperature deformation behavior of bimetallic steel was studied, and the constitutive model was established. In addition, the microstructure evolution near the interface was analyzed using electron backscatter diffraction technology (EBSD). The thermal deformation process was further optimized, which could contribute to improving the deformation coordination and comprehensive properties.

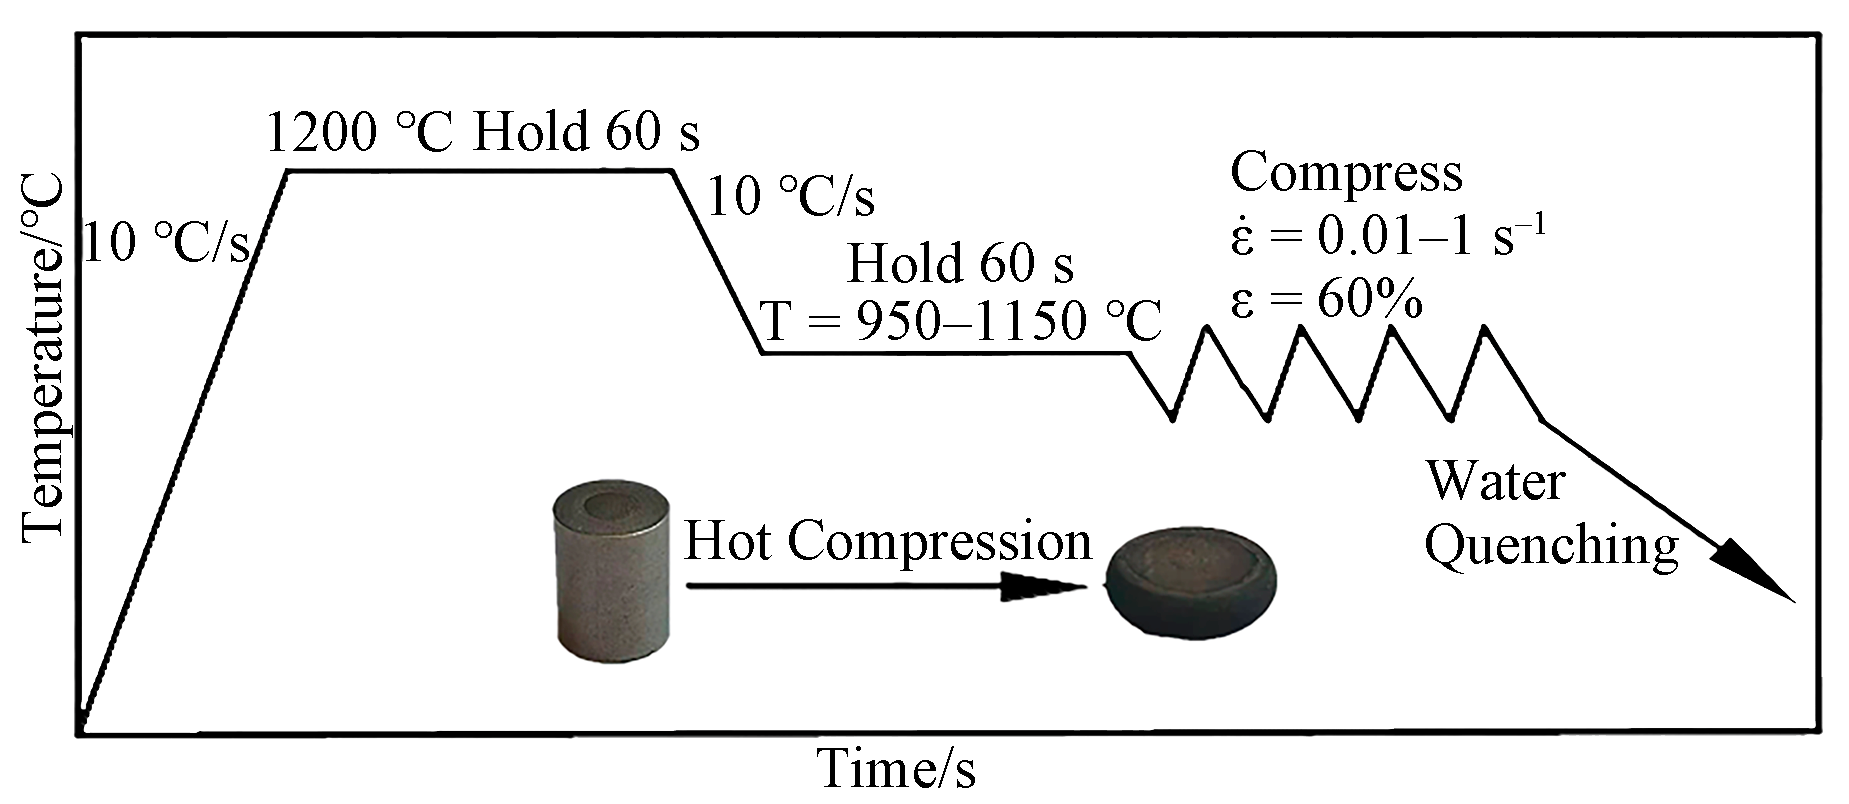
2. Materials and Experiments

The cladding tube consisted of 304 stainless steel with a diameter of 10 mm and a wall thickness of 3 mm, and the core rod consisted of Q235 carbon steel with a diameter of 4 mm. The total height was 15 mm. The inner wall of the stainless steel tube and the surface of the carbon steel rod were machined on a turning lathe to remove surface dirt and expose the internal fresh metal. The rod was pressed into the cladding tube and SC bimetallic steel was formed. Table 1 shows the main chemical composition.
A series of high-temperature compression experiments with SC bimetallic steel were carried out on a Gleeble-3800 thermal simulator (Dynamic Systems Inc., Poestenkill, NY, USA). The procedure of high-temperature compression is shown in Figure 1. The samples were heated to 1200 °C at a heating rate of 10 °C/s and held for 60 s to achieve thermal equilibration on the cross-section of the specimens, then cooled to different deformation temperatures at a cooling rate of 10 °C/s and held for 60 s. The deformation temperature of high-temperature compression generally ranges from 950 °C to 1150 °C. Based on actual conditions, the compression process was started under vacuum at deformation temperatures of 950, 1000, 1050, 1100, and 1150 °C respectively, accompanied by a strain rate of 0.01, 0.1, and 1 s−1 respectively. The total strain was 0.92. Finally, the samples were cooled rapidly to retain the hot deformed microstructure.
After the high-temperature compression experiments, the samples were cut into two halves along the axial direction and subjected to microstructural characterization using the EBSD technique. An electrolysis experiment was performed in a solution of 10:1 ethanol and perchloric acid at a voltage of 30 V for 20 s. The EBSD scans with a step size of 2 µm were performed with a SIGMA-300 scanning electron microscope (Zeiss, Oberkochen, Germany). The scanned data were analyzed using HKL Channel 5 software (v5.0 https://hkl-channel.software.informer.com/5.0/ (accessed on 1 September 2021)).

3. Results and Discussion

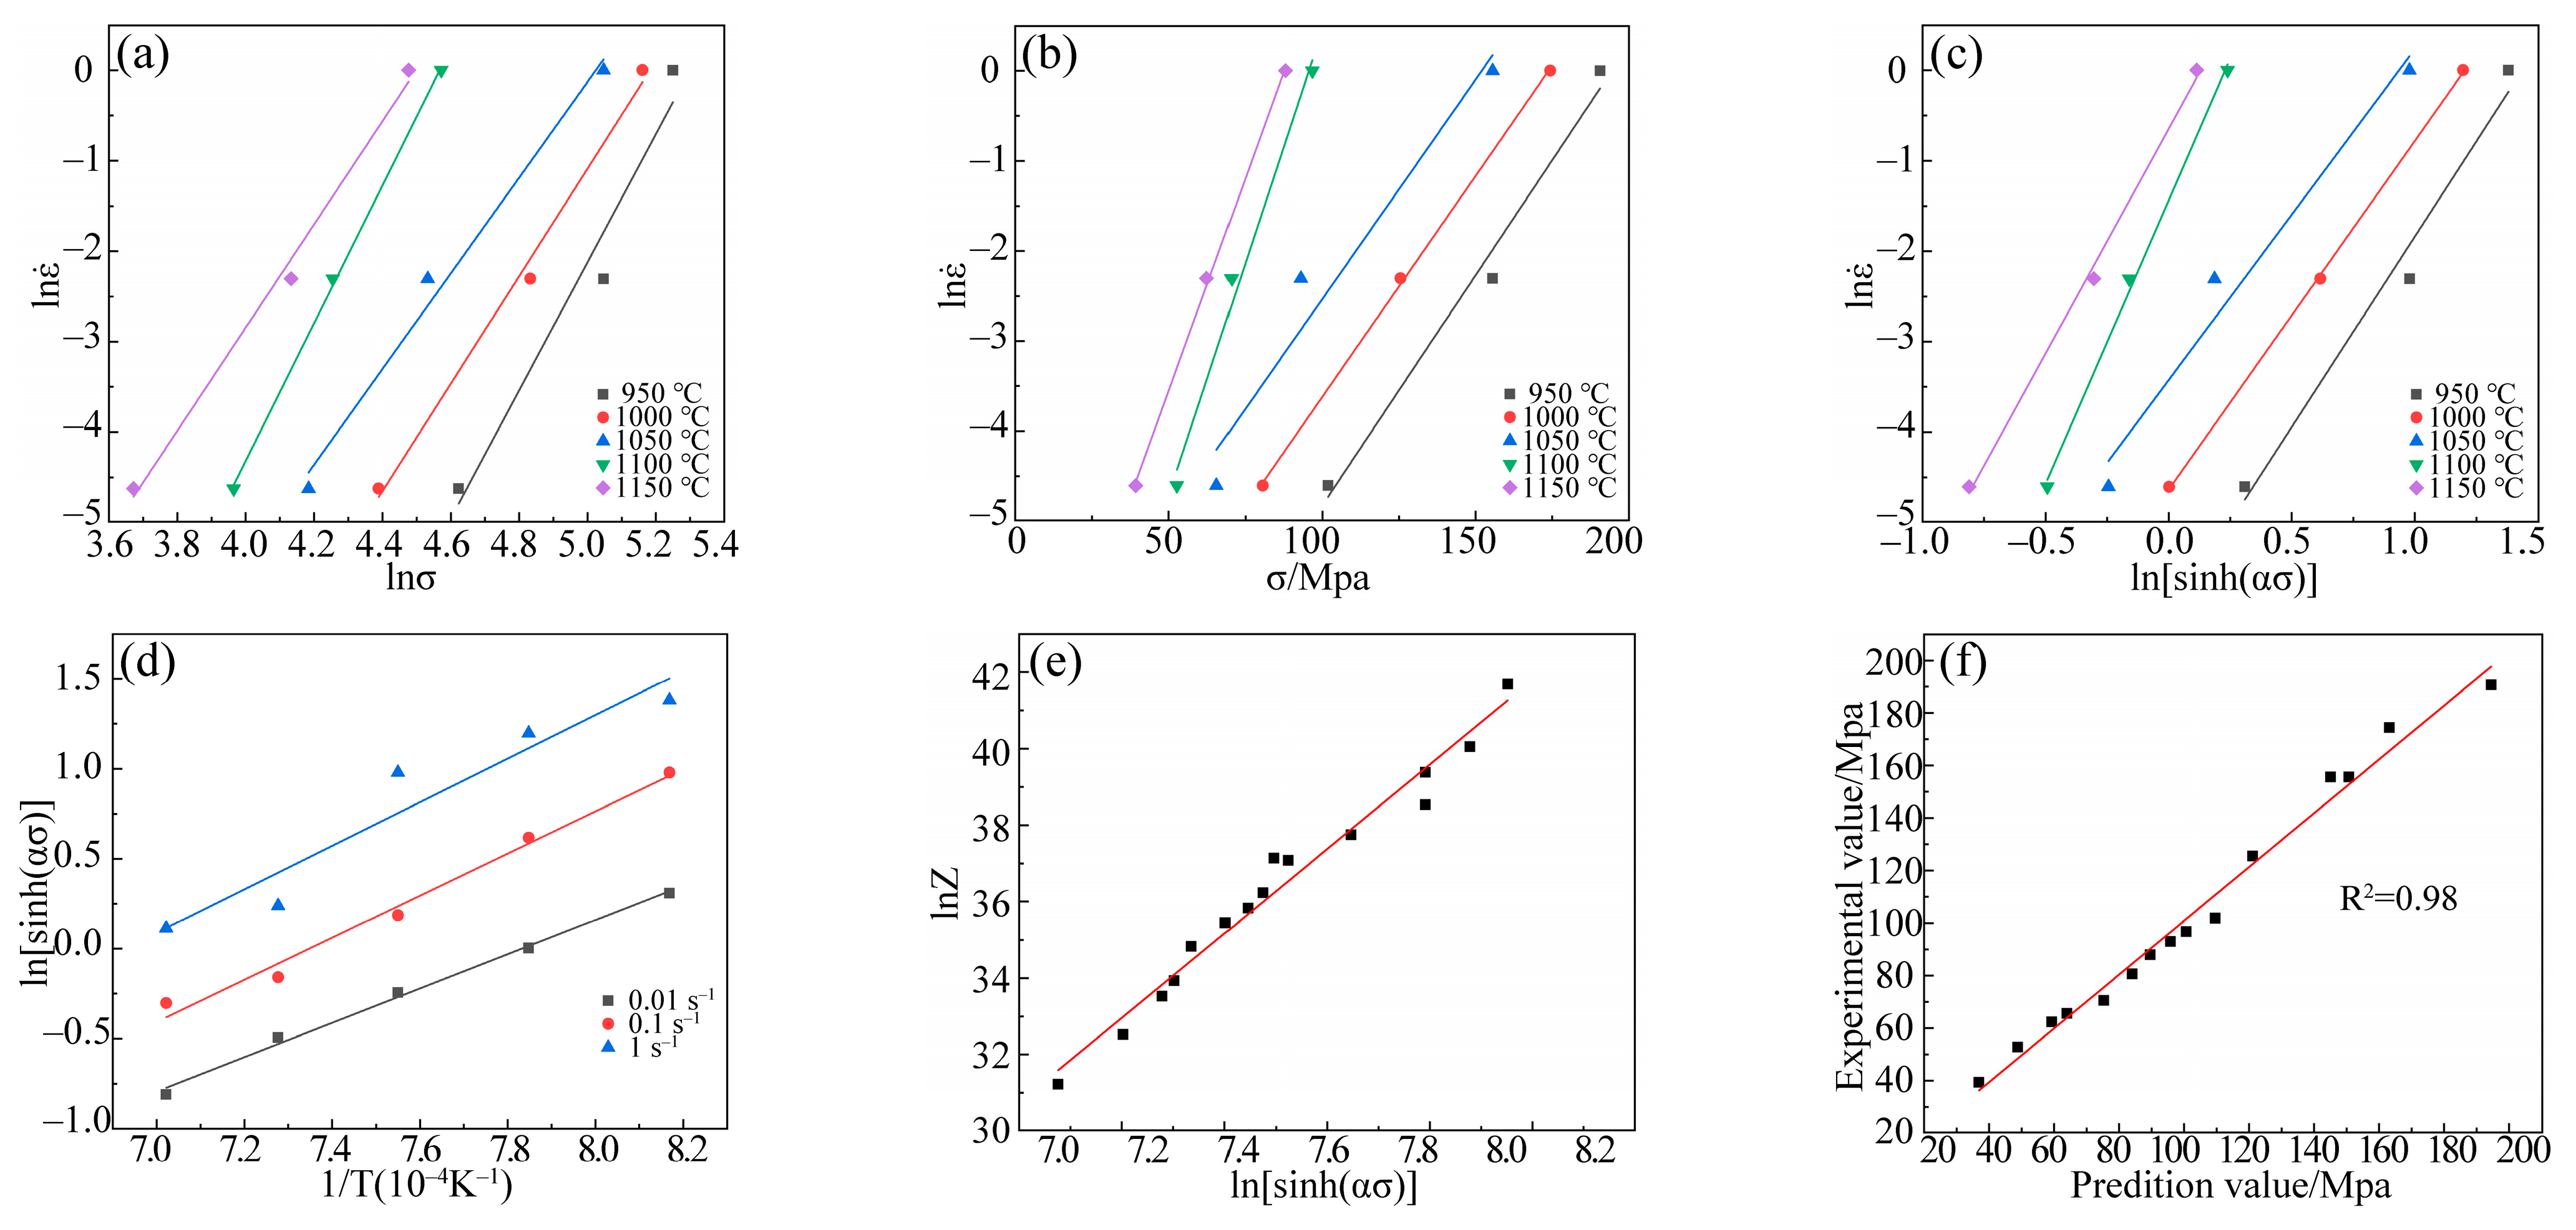
3.1. Analysis of Thermodynamic Behavior

Figure 2 shows the true stress-strain curves for the SC bimetallic steel under various deformation conditions. At the strain rates of 0.01 and 0.1 s−1, as shown in Figure 2a,b, the flow stress rose rapidly with the increased dislocation density in the early deformation stage. Then, the dislocations moved in cross-slip and climbing patterns, resulting in the disappearance or rearrangement of some dislocations. It was shown that the flow stress increases slowly with the amount of deformation. When the internal distortion energy of the metal rises to some extent, the austenite will undergo dynamic recrystallization, causing more dislocations to disappear and the flow stress to drop. After that, the flow stress remains unchanged, although the strain increases. This indicates that the characteristics of dynamic recrystallization are pronounced under low strain rates.
At the strain rate of 1 s−1, as shown in Figure 2c, the difference from the low strain rate is that after peak stress, the decreasing trend becomes relaxed, which is mainly affected by factors unfavorable to softening, such as the shortening time of the dislocation and climbing, the weakened recovery, the low growth rate of grain, etc. [12,13]. It revealed a different type of mechanism of thermal deformation at the strain rate of 1 s−1.
In addition, the flow stress drops with increasing temperature at the same strain rate. It mainly shows that the driving force of vacancy atomic diffusion and dislocation motion increases at high temperature, which leads to the decreased dislocation density and the significant softening behavior.

3.2. The Establishment of Constitutive Model

The constitutive model of the material belongs to a mathematical model reflecting the macroscopic and inherent properties. Studies have shown that the constitutive model could describe the relationship among the deformation parameters during thermal deformation [14,15].
During thermal deformation, the flow stress σ depends on the deformation temperature T and the strain rate ε ˙ . At present, there are three types of thermal deformation equations as shown in Equations (1)–(3). They are named the power function equation, exponential equation, and sin-hyperbolic equation, respectively. The power function equation is useful for calculations of lower stress [16], and the exponential equation is suitable for the hot-working process at low temperatures and high-strain rates [17], while the sin-hyperbolic equation proposed by Sellars and Tegart could be employed to calculate the flow stress in a large range [18], and thus was adopted to describe the constitutive equation in this paper.
ε ˙ = A 1 σ n 1 exp [ Q / ( R T ) ]     α σ < 0.8
ε ˙ = A 2 exp ( β σ ) exp [ Q / ( R T ) ]     α σ > 1.2
ε ˙ = A [ sinh ( α σ ) ] n exp [ Q / ( R T ) ]     a l l σ
where σ is the peak stress, Q is the deformation activation energy, R is the gas constant, T is the deformation temperature, A1, A2 and A are the material constants, n1 and n are the stress exponents, and α and β are the stress factors, in which α = β / n 1 .
Taking the natural logarithm on both sides of Equations (1) and (2) and fitting ln ε ˙ ln σ , as shown in Figure 3a,b. In which, n 1 = 6.3293 , β = 0.0693 , α = β / n 1 = 0.0109 .
Taking the natural logarithm on both sides of Equation (3),
ln ε ˙ = ln A + n ln [ sinh ( α σ ) ] Q / ( R T )
where the average slope of straight lines represents n, and n = 4.5929 . The relationship of ln ε ˙ ln [ sinh ( α σ ) ] is shown in Figure 3c.
When the strain rate is constant, the deformation activation energy Q is also invariant. Equation (5) is obtained by computing a partial derivative of Equation (3).
Q = R n ln [ sinh ( α σ ) ] ( 1 / T ) ε ˙
where, the average slope of straight lines represents Q, and Q = 454.2321 KJ/mol. The relationship of ln [ sinh ( α σ ) ] 1 / T is shown in Figure 3d.
Parameter Z represents the combined effects of temperature and strain rate in the thermal deformation process [19] as expressed in Equation (6).
Z = ε ˙ exp [ Q / ( R T ) ]
Taking Equation (6) into Equation (3), and taking the logarithm of both sides.
ln Z = ln A + n 2 ln [ sinh ( α σ ) ]
where n 2 = 4.4173 , A = 1.8759 × 10 15 . The material constants of SC bimetallic steel are shown in Table 2. The linear relationship of ln Z ln [ sinh ( α σ ) ] is shown in Figure 3e.
This Q-value of approximately 454 KJ/mol is obtained in this paper. It is worth mentioning that the Q-value of about 400 KJ/mol has been reported in the literature for 304 stainless steel under similar conditions [20]. This is mainly due to the fact that the fragile compounds (Si-Mn oxide, MnCr2O4 spinel oxide, etc.) at the interface hinder the migration of the crystal boundary, which further forces the activation energy to increase. It reveals that the composite materials need higher energy for dynamic recrystallization. In addition, the obtained n and A values show good agreement with the ones reported by Wang et al. [21].
The constitutive model could be expressed as follows:
ε ˙ = 1.8759 × 10 15 [ sinh ( 0.0109 σ ) ] 4.5929 exp [ 454.2321 / ( R T ) ]
The improved Arrhenius constitutive model based on Z parameter could also be obtained as follows:
σ = 1 0.0109 ln { ( Z 1.8759 × 10 15 ) 1 4.4173 + [ ( Z 1.8759 × 10 15 ) 2 4.4173 + 1 ] 1 2 }
To verify the accuracy of the Arrhenius constitutive model, as shown in Figure 3f, the correlation coefficient R2 is 0.98 between the predicted and experimental stresses. Therefore, the model could accurately predict the macroscopic stress and describe the flow behavior of bimetallic steel.

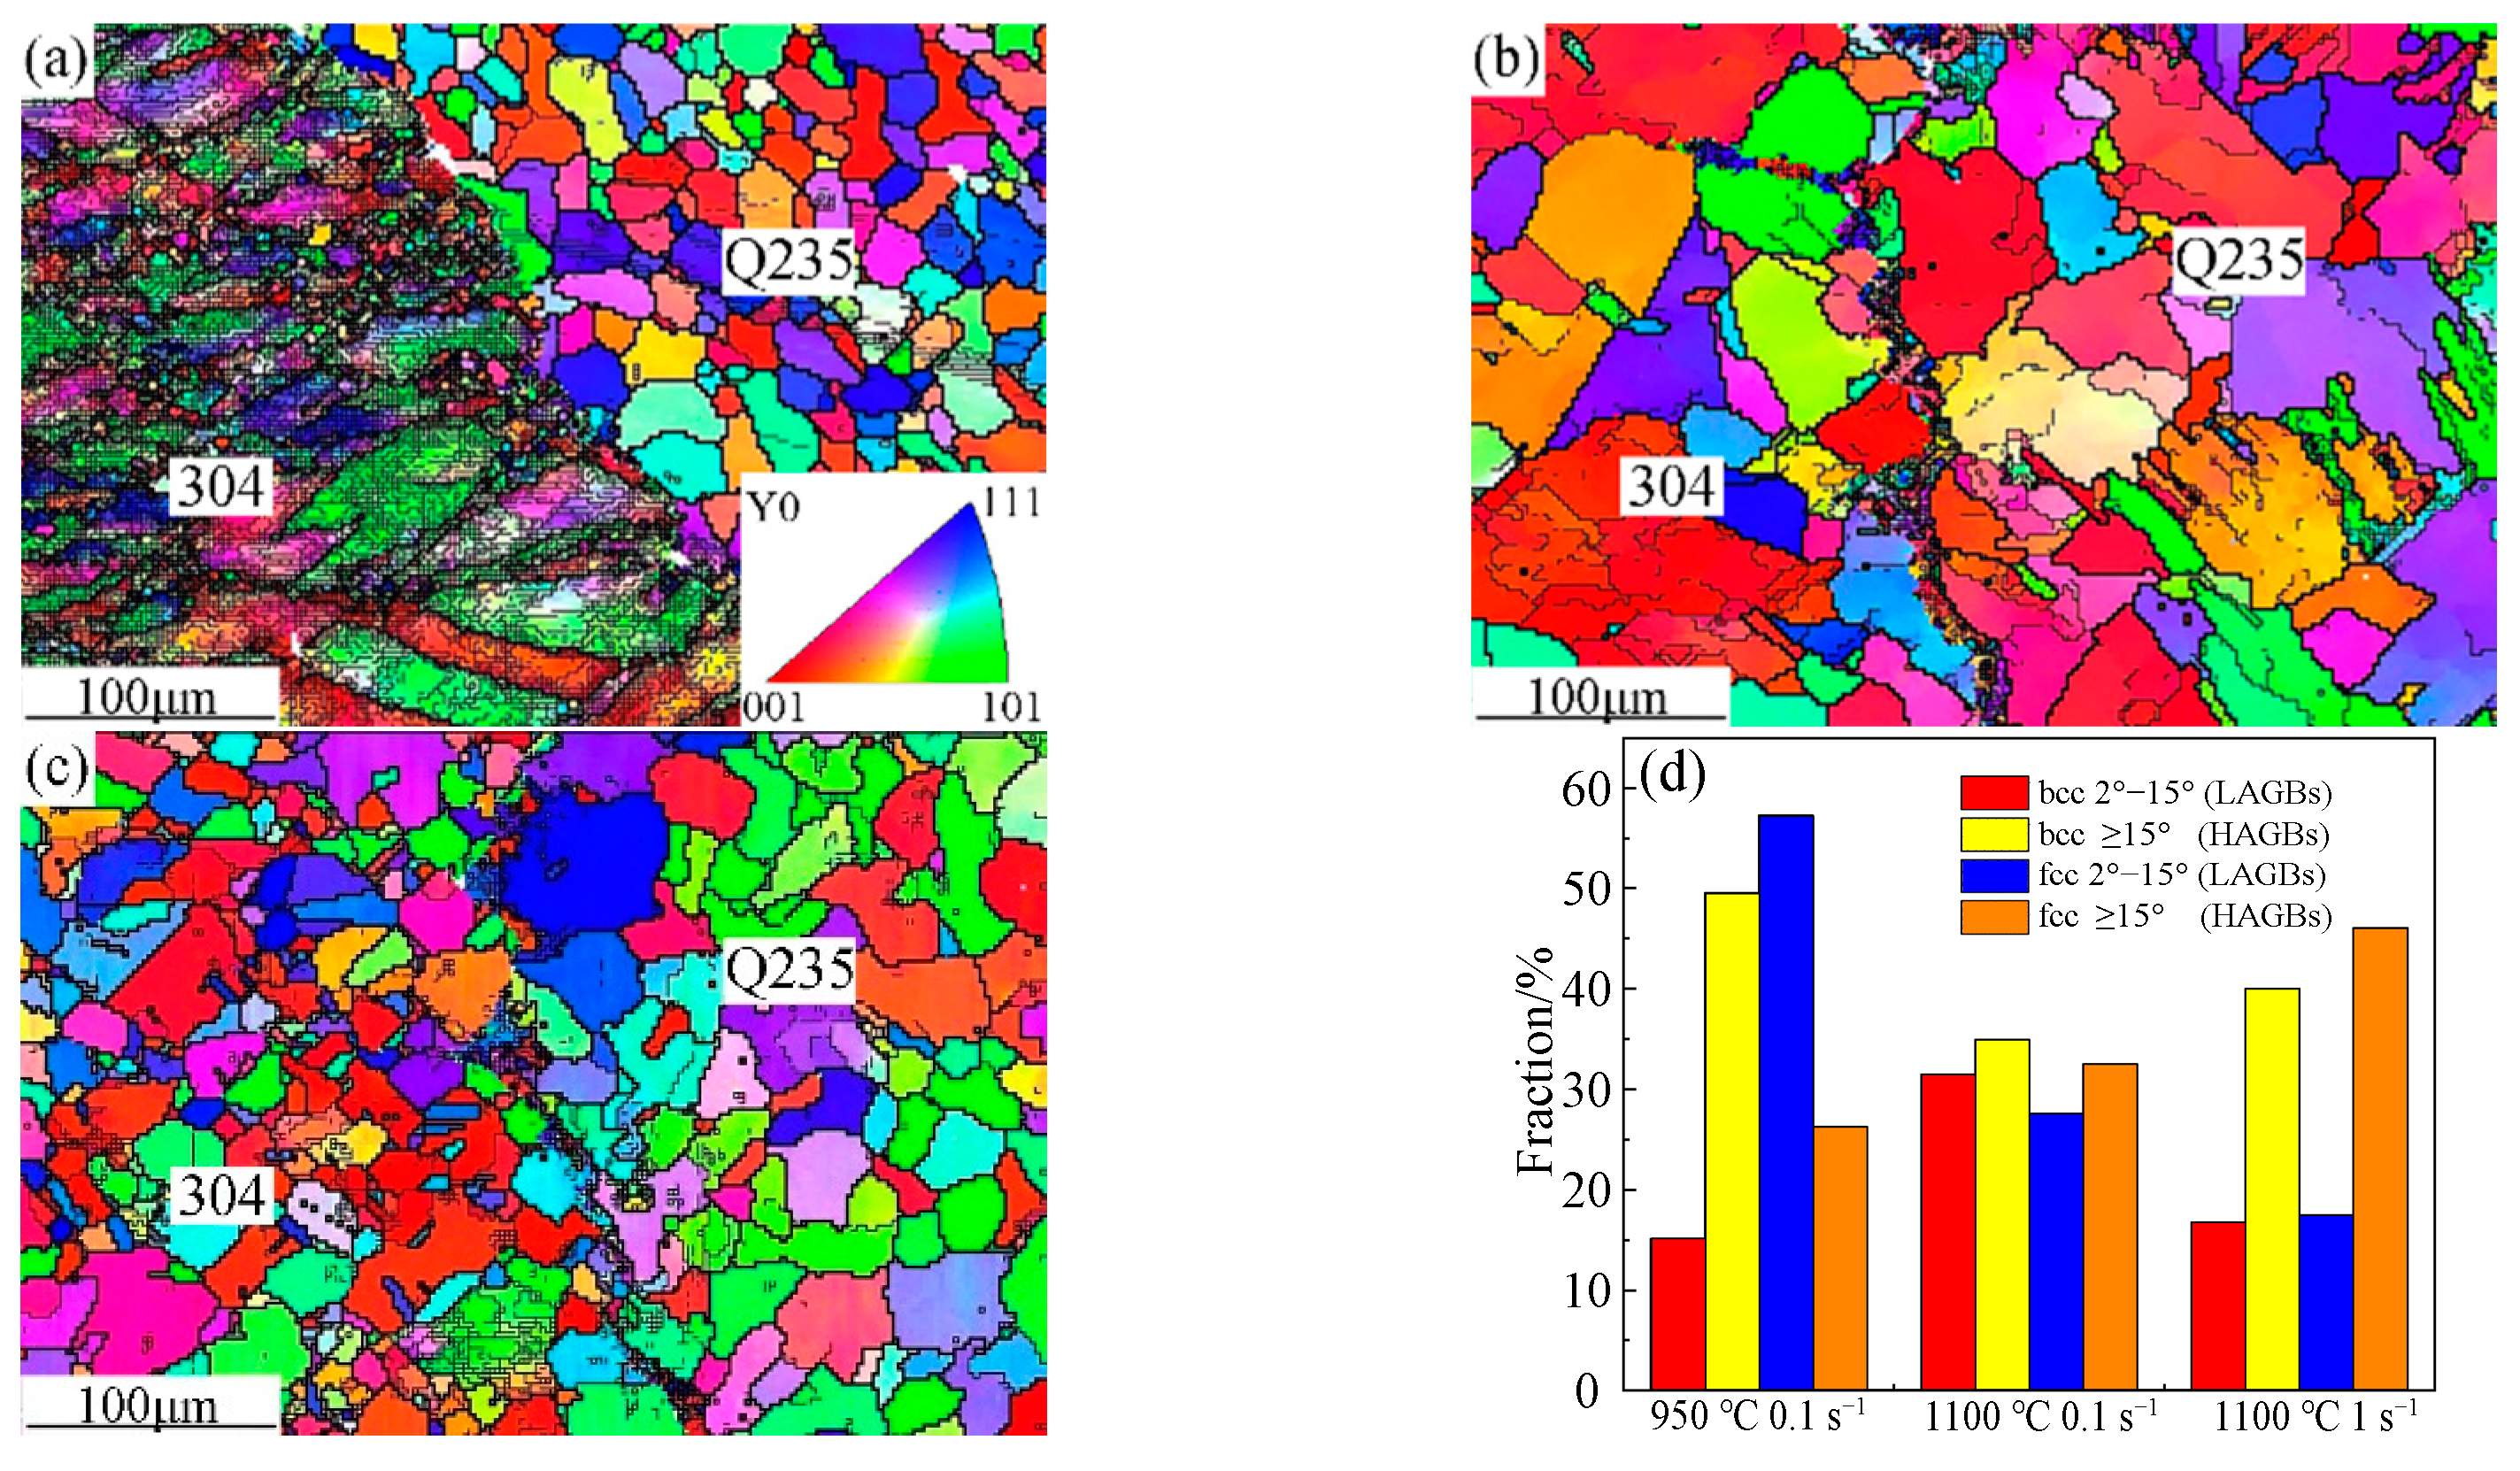
3.3. Microstructure Evolution near Interface

Figure 4a–c shows the interface inverse pole figures (IPFs) of the specimens under various deformation conditions. The thin line represents low-angle grain boundaries (LAGBs) with misorientation between 2° and 15°, while the thick line represents high-angle grain boundaries (HAGBs) with misorientation over 15°.
As shown in Figure 4a, at 950 °C and 0.1 s−1, there is an average grain size of about 10.18 μm and clear HAGBs on the carbon-steel side of the interface, indicating the appearance of a dynamic recrystallization phenomenon. Besides that, the austenite grains on the stainless-steel side of the interface are deformed and elongated along the compression direction. The sub-grain organization of high-density LAGBs appears in the grains, and a dislocation network in the low-energy state is also formed [22]. It is obvious that the density of dislocation is high, and the hardening is dominant.
As shown in Figure 4b, at 1100 °C and 0.1 s−1, the grain distribution on the carbon-steel side of the interface is uneven. Driven by the energy of the interface, most of the grains devour each other and merge into larger ones, and the sub-grains with an average size of about 17.88 μm become separated due to the tangle of dislocation, which was calculated using HKL Channel 5 software. In addition, the dislocation density on the stainless-steel side of the interface increases with cumulative deformation, leading the stored energy to increase. When it reaches a certain value, the boundaries of the chain grains move to the nucleating positions, and the grains grow to an average size of about 20.49 μm. However, the average size of the grains from both sides of the interface is coarse and uneven, which is disadvantageous for the strength and plasticity of bimetallic steel [23].
As shown in Figure 4c, at 1100 °C and 1 s−1, it is obvious that the grains are refined on both sides of the interface. The average size of the grains decreases to 11.38 μm on the side of stainless steel, while it is 13.54 μm on the side of carbon steel. The even and refined grains help to improve the mechanical properties.
Figure 4d further shows that the HAGBs account for 49.23% and 26.28% at 950 °C and 0.1 s−1, 34.95% and 32.52% at 1100 °C and 0.1 s−1, and 40.02% and 46.06% at 1100 °C and 1 s−1. The higher fractions of HAGBs indicate a larger misorientation between neighboring grains and could avert the disruption of grain boundaries and efficiently stop the propagation of brittle microcracks [24,25]. It is obvious that at 1100 °C and 1 s−1, the proportion of HAGBs near the interface is large and closer, indicating a higher coordinate deformation [26,27].
Figure 5 shows the distribution of the dynamic recrystallization under various deformation conditions. The recrystallized grains, the sub-grains, and the deformed grains are marked with blue, yellow, and red, respectively. Figure 6 shows the volume fraction of the recrystallization grains. At a constant strain rate (0.1 s−1), as the deformation temperature increases (950, 1100 °C), the recrystallized regions decrease from 30.6% to 18.9% on the carbon steel side, while increasing from 8.9% to 28.7% on the stainless steel side. At a constant deformation temperature (1100 °C), as the strain rate increases (0.1, 1 s−1), the recrystallized regions just increase on both sides. The corresponding volume increases from 18.9% to 39.3% on the carbon steel side, and from 28.7% to 31.2% on the stainless steel side. The energy of the crystal boundary is proportional to the misorientation between the adjacent grains, while the driving force of the interface movement is proportional to the interface energy [28]. According to Figure 4, the HAGBs account for 40.02% and 46.06%, respectively, on the CS and SS sides at 1100 °C and 1 s−1. It is concluded that there is a large driving force to interface movement and dynamic recrystallization. Consequently, at 1100 °C and 1 s−1, the volume proportion of recrystallized grains is of an excellent match on both sides of the interface and benefits the general properties of the materials.
Furthermore, it can be seen in Figure 5c that a large number of the blue fine recrystallized grains appear uniformly along the interface, which would effectively promote the diffusion of elements to form strong metallurgical bonding along the interface [29].

4. Conclusions

(1) At temperatures from 950 °C to 1150 °C, the stress-strain curves of SC bimetallic steel are characterized by dynamic recrystallization at a low strain rate of 0.01 and 0.1 s−1 and characterized by dynamic recovery at a high strain rate of 1 s−1. However, it is seen from microstructure experiments that there are still many generated recrystallized grains near the interface at the high strain rate, revealing that it is not related to the features of the stress-strain curves.
(2) Having considered fully the influence of the deformation temperature and the strain rate on the flow stress, the constitutive model of thermal deformation is proposed and established based on the sin-hyperbolic equation. Additionally, the correlation coefficient (R2) was calculated as 0.98, verifying that it could be used to accurately calculate the flow stress.
(3) The volume fractions of HAGBs and recrystallized grains were large and closer near the interface at 1100 °C and 1 s−1, indicating high deformation coordination and an even microstructure. This finding could provide a theoretical principle for optimizing the deformation process and improving the performance of SC bimetallic steel.

Author Contributions

Methodology, M.S., B.C., Z.C. and H.L.; software, L.L.; writing—original draft preparation, M.S. and B.C.; writing—review and editing, M.Z. and L.Z.; project administration, M.S. All authors have read and agreed to the published version of the manuscript.

Funding

This research received was funded by National Natural Science Foundation Projects of China (U1710113); Key Research and Development Projects of Shanxi Province (201903D121043); Rolling Technology and Continuous Rolling Automation State Key Laboratory (Northeast University) Open projects (2020RALKFKT013); Graduate Education Reform Research Project of Shanxi Province (2020YJJG241).

Institutional Review Board Statement

Not applicable.

Informed Consent Statement

Not applicable.

Data Availability Statement

Not applicable.

Conflicts of Interest

The authors declare no conflict of interest.

References

  1. Mehta, P.K.; Burrows, R.W. Building durable structures in the 21st century. Indian Concr. J. 2001, 75, 437–443. [Google Scholar]
  2. García-Alonso, M.C.; Escudero, M.L.; Miranda, J.M.; Vega, M.I.; Capilla, F.; Correia, M.J.; Salta, M.; Bennani, A.; González, J.A. Corrosion behaviour of new stainless steels reinforcing bars embedded in concrete. Cem. Concr. Res. 2007, 37, 1463–1471. [Google Scholar] [CrossRef] [Green Version]
  3. Gu, X.L.; Guo, H.Y.; Zhou, B.B.; Zhang, W.P.; Jiang, C. Corrosion non-uniformity of steel bars and reliability of corroded RC beams. Eng. Struct. 2018, 167, 188–202. [Google Scholar] [CrossRef]
  4. Li, K.F.; Li, L. Crack-altered durability properties and performance of structural concretes. Cem. Concr. Res. 2019, 124, 105811. [Google Scholar] [CrossRef]
  5. Karabulut, B.; Ferraz, G.; Rossi, B. Cost assessment of high strength carbon and stainless steel. J. Environ. Manag. 2021, 277, 111460. [Google Scholar] [CrossRef]
  6. Sawicki, S.; Dyja, H. Theoretical and Experimental Analysis of The Bimetallic Ribbed Bars Steel-steel Resistant to Corrosion Rolling Process. Arch. Metall. Mater. 2012, 57, 61–69. [Google Scholar] [CrossRef] [Green Version]
  7. Ban, H.Y.; Zhu, J.C.; Shi, G.; Zhang, Y. Tests and modelling on cyclic behaviour of stainless-clad bimetallic steel. J. Constr. Steel Res. 2020, 166, 105944. [Google Scholar] [CrossRef]
  8. Sun, C.Y.; Li, L.; Fu, M.W.; Zhou, Q.J. Element diffusion model of bimetallic hot deformation in metallurgical bonding process. Mater. Des. 2016, 94, 433–443. [Google Scholar] [CrossRef]
  9. Mudhaffar, M.A.; Saleh, N.A.; Aassy, A. influence of hot clad rolling process parameters on life cycle of reinforced bar of stainless steel carbon steel bars. Procedia Manuf. 2017, 8, 353–360. [Google Scholar] [CrossRef]
  10. Wang, S.; Liu, B.X.; Chen, C.X.; Feng, J.H.; Yin, F.X. Microstructure, Mechanical Properties and Interface Bonding Mechanism of Hot-rolled Stainless Steel Clad Plates at Different Rolling Reduction Ratios. J. Alloys Compd. 2018, 766, 517–526. [Google Scholar] [CrossRef]
  11. Ban, H.Y.; Bai, R.S.; Yang, L.; Bai, Y. Mechanical properties of stainless-clad bimetallic steel at elevated temperatures. J. Constr. Steel Res. 2019, 162, 105704. [Google Scholar] [CrossRef]
  12. Tsuchida, N.; Harjo, S.; Ohnuki, T.; Tomota, Y. TI Stress-strain curves of steels. Tetsu-to-Hagane 2014, 100, 1191–1206. [Google Scholar] [CrossRef] [Green Version]
  13. Peng, J.L.; Du, T.; Zhao, T.S.; Song, X.Q.; Tang, J.J. Stress-strain relationship model of recycled concrete based on strength and replacement rate of recycled coarse aggregate. J. Mater. Civ. Eng. 2019, 31, 04019189. [Google Scholar] [CrossRef]
  14. Sun, C.C.; Liu, K.; Wang, Z.H.; Li, S.B.; Du, X.; Du, W.B. Hot deformation behaviors and processing maps of Mg-Zn-Er alloys based on Gleeble-1500 hot compression simulation. Trans. Nonferrous Met. Soc. China 2016, 26, 3123–3134. [Google Scholar] [CrossRef]
  15. Zhou, H.T.; Kong, F.T.; Wang, X.P.; Chen, Y.Y. Hot deformation behavior and microstructural evolution of As-forged Ti-44Al-8Nb-(W, B, Y) alloy with nearly lamellar microstructure. Intermetallics 2017, 81, 62–72. [Google Scholar] [CrossRef]
  16. Slooff, F.A.; Zhou, J.; Duszczyk, J.; Katgerman, L. Constitutive analysis of wrought magnesium alloy Mg-Al4-Zn1. Scrip. Mater. 2007, 57, 759–762. [Google Scholar] [CrossRef]
  17. Li, L.; Zhou, J.; Duszczyk, J. Determination of a constitutive relationship for AZ31B magnesium alloy and validation through comparison between simulated and real extrusion. J. Mater. Process. Technol. 2006, 172, 372–380. [Google Scholar] [CrossRef]
  18. Sellars, C.M.; McTegart, W.J. On the mechanism of hot deformation. Acta Metall. 1966, 14, 1136–1138. [Google Scholar] [CrossRef]
  19. Zener, C.; Hollomon, J.H. Effect of strain-rate upon the plastic flow of steel. J. Appl. Phys. 1944, 15, 22–32. [Google Scholar] [CrossRef]
  20. Dehghan-Manshadi, A.; Barnett, M.R.; Hodgson, P.D. Recrystallization in AISI 304 Austenitic Stainless Steel during and after hot deformation. Mater. Sci. Eng. 2008, 485A, 664. [Google Scholar] [CrossRef]
  21. Wang, S.; Zhang, M.X.; Wu, H.C.; Yang, B. Study on the dynamic recrystallization model and mechanism of nuclear grade 316LN austenitic stainless steel. Mater. Charact. 2016, 118, 92–101. [Google Scholar] [CrossRef]
  22. Humphreys, F.J. Grain and subgrain characterisation by electron backscatter diffraction. J. Mater. Sci. 2001, 36, 3833–3854. [Google Scholar] [CrossRef]
  23. Naghizadeh, M.; Mirzadeh, H. Effects of Grain Size on Mechanical Properties and Work-Hardening Behavior of AISI 304 Austenitic Stainless Steel. Steel Res. Intern. 2019, 90, 1900153. [Google Scholar] [CrossRef]
  24. Canadinc, D.; Biyikli, E.; Niendorf, T.; Maier, H.J. Experimental and numerical investigation of the role of grain boundary misorientation angle on the dislocation-grain boundary interactions. Adv. Eng. Mater. 2011, 13, 281–287. [Google Scholar] [CrossRef]
  25. Lambert-Perlade, A.; Gourgues, A.F.; Pineau, A. Austenite to bainite phase transformation in the heat-affected zone of a high strength low alloy steel. Acta Mater. 2004, 52, 2337–2348. [Google Scholar] [CrossRef]
  26. Liu, Z.G.; Li, P.J.; Geng, L.L.; Liu, T.Y.; Gao, H.T. Microstructure and texture evolution of TA32 titanium alloy during superplastic deformation. Mater. Sci. Eng. A 2017, 699, 71–88. [Google Scholar] [CrossRef]
  27. Zhao, H.T.; Palmiere, E.J. Influence of cooling rate on the grain-refining effect of austenite deformation in a HSLA steel. Mater. Charact. 2019, 158, 109990. [Google Scholar] [CrossRef]
  28. Cui, Z.Q.; Qin, Y.C. Metallography and Heat Treatment; Machinery Industry Press: Harbin, China, 2008; pp. 136–182. [Google Scholar]
  29. Wang, S.; Zhao, G.H.; Li, Y.G.; Li, J.; Song, Y.H. Effect of different reduction rates on the near-interfacial structure of pressed 304/Q235 composite plate. Mater. Res. Express 2020, 7, 066531. [Google Scholar] [CrossRef]
Figure 1. The high-temperature compression procedure.
Crystals 12 00081 g001
Figure 2. True stress-strain curves under different deformation conditions, i.e., (a) ε ˙ = 0.01 (b) ε ˙ = 0.1 and (c) ε ˙ = 1 .
Crystals 12 00081 g002
Figure 3. The fitting relations from the constitutive model, i.e., (a) ln ε ˙ ln σ , (b) ln ε ˙ σ , (c) ln ε ˙ ln [ sinh ( α σ ) ] , (d) 1 / T ln [ sinh ( α σ ) ] , (e) ln Z ln [ sinh ( α σ ) ] and (f) R2.
Crystals 12 00081 g003
Figure 4. IPF + grain boundary of each phase at (a) 950 °C, 0.1 s−1, (b) 1100 °C, 0.1 s−1 and (c) 1100 °C, 1 s−1 and their (d) volume fraction.
Crystals 12 00081 g004
Figure 5. The distribution of dynamic recrystallized grains at (a) 950 °C, 0.1 s−1, (b) 1100 °C, 0.1 s−1 and (c) 1100 °C, 1 s−1.
Crystals 12 00081 g005
Figure 6. Volume fraction of recrystallized grains in (a) Q235 carbon steel and (b) 304 stainless steel.
Crystals 12 00081 g006
Table 1. The main chemical composition (wt.%).
MaterialCrNiCMnFe
30418–208–11≤0.08≤2Balance
Q235-0.1–0.220.30–0.65Balance
Table 2. The parameter values of equations.
αnβn2AQ (KJ/mol)
0.01094.59290.06934.41731.8759 × 1015454.2321
Publisher’s Note: MDPI stays neutral with regard to jurisdictional claims in published maps and institutional affiliations.

