
Sodium, Silver and Lithium-Ion Conducting β″-Alumina + YSZ Composites, Ionic Conductivity and Stability


1
Materials Science & Engineering Department, University of Utah, Salt Lake City, UT 84112, USA
2
Ningbo Institute of Materials Technology & Engineering, Chinese Academy of Sciences, Ningbo 315201, China
*
Author to whom correspondence should be addressed.
Crystals 2021, 11(3), 293; https://doi.org/10.3390/cryst11030293
Submission received: 10 February 2021
/
Revised: 9 March 2021
/
Accepted: 13 March 2021
/
Published: 16 March 2021
(This article belongs to the Special Issue Highly-Conductive Ceramics with Multiple Types of Mobile Charge Carriers)
Abstract
:Na-β″-alumina (Na2O.~6Al2O3) is known to be an excellent sodium ion conductor in battery and sensor applications. In this study we report fabrication of Na- β″-alumina + YSZ dual phase composite to mitigate moisture and CO2 corrosion that otherwise can lead to degradation in pure Na-β″-alumina conductor. Subsequently, we heat-treated the samples in molten AgNO3 and LiNO3 to respectively form Ag-β″-alumina + YSZ and Li-β″-alumina + YSZ to investigate their potential applications in silver- and lithium-ion solid state batteries. Ion exchange fronts were captured via SEM and EDS techniques. Their ionic conductivities were measured using electrochemical impedance spectroscopy. Both ion exchange rates and ionic conductivities of these composite ionic conductors were firstly reported here and measured as a function of ion exchange time and temperature.
1. Introduction
Na-β″-alumina (Na2O.~6Al2O3) solid electrolyte (BASE) is known to be an excellent sodium ion conductor with uses in sodium-sulfur batteries, sodium-nickel chloride (ZEBRA) batteries, alkali-metal thermoelectric convertors (AMTEC) and in sensors [1,2,3,4,5,6,7,8]. Among these applications, sodium sulfur batteries, originally developed by Weber and Kummer at the Ford Motor Company in the 1960s [9] have demonstrated attractive applications in automobiles before lithium batteries became more popular. Due to the abundance of sodium compared to lithium resulting in lower cost [10,11,12] and high ionic conductivity of about 1 Scm−1 in single crystal Na-β″-alumina and 0.2–0.4 Scm−1 in polycrystalline β″-alumina at 300 °C, Na-β″-alumina still sees an encouraging future in certain applications.
Conventional process for the fabrication of Na-β″-alumina involves first calcining a mixture of alumina (Al2O3), Na2CO3 and LiNO3 (or MgO) at 1250 °C for 2 h. This leads to the formation of a mixture of Na-β″-alumina, Na-β-alumina (Na2O.~11Al2O3) and NaAlO2. Discs, bars or tubes are formed by powder-pressing. The samples are then placed in platinum containers or MgO containers and heated in air to ~1600 °C for a few minutes and rapidly cooled to ~1450 °C and heat-treated for an hour to convert Na-β-alumina into Na-β″-alumina by the reaction [13]:
Na2O.~11Al2O3 + 2NaAlO2 → 2(Na2O.~6Al2O3)
Sintering occurs by a transient liquid phase mechanism. Some NaAlO2 remains at the grain boundaries, which makes the material susceptible to degradation by moisture and CO2 present in the atmosphere. Thus, Na-β″-alumina made by conventional methods typically needs to be stored in desiccators.
A vapor phase process was originally developed by one of the authors to fabricate Na-β″-alumina-containing materials in which two phase samples of α-alumina + YSZ are fabricated by pressing and sintering [14,15,16]. The proportions of the two phases are such that both phases are contiguous. The sintered samples are then buried in Na-β″-alumina powder and heat-treated at 1250 °C to 1400 °C for several hours. This leads to the conversion of α-alumina into Na-β″-alumina thus forming a two phase composite of Na-β″-alumina + YSZ. Rapid conversion occurs since the incorporation of Na2O occurs by a coupled transport of 2Na+ through the formed Na-β″-alumina and O2− through YSZ, which is an oxygen ion conductor [14,15,16]. The overall reaction is:
6Al2O3 + Na2O → Na2O.~6Al2O3
In this process, NaAlO2 is not present and thus boundaries are free of any NaAlO2. Such samples are resistant to degradation by moisture and CO2 in the atmosphere. Samples of the composite are very fine-grained and thus exhibit excellent strength.
It has been known for a long time that β″-alumina is capable of transporting other alkali ions, silver ion, some divalent ions and even trivalent ions and can be made by ion exchange in which Na-β″-alumina is immersed in the respective molten salt for several hours [17,18,19,20,21]. For example, to form Ag-β″-alumina, Na-β″-alumina is immersed in molten AgNO3. The reaction:
occurs to some extent. Typically, partial replacement of Na+ occurs by Ag+, thus forming a silver ion-conducting β″-alumina. Many β″-alumina formed by ion exchange are kinetically stable at low temperatures because oxygen diffusion through β″-alumina is extremely sluggish. Thus, reactions such as:
do not occur at low temperatures (e.g., below about 600 °C).
Na2O.~6Al2O3 + Ag+ → Ag2O.~6Al2O3 + Na+
Ag2O.~6Al2O3 → ~6Al2O3 + 2Ag + 1/2O2
The objective of this work was to investigate ion-exchange of Na-β″-alumina + YSZ to form Ag-β″-alumina + YSZ and Li-β″-alumina + YSZ composites. At low temperatures, below about 500 °C, oxygen ion conductivity of YSZ is much lower than sodium ion conductivity of Na-β″-alumina. Thus, the composite is essentially a sodium ion conductor. However, at elevated temperatures, the oxygen ion conductivity is significant. In samples made by ion exchange, the stability is kinetic. Thus, samples of Ag-β″-alumina + YSZ may become unstable. In order to explore this possibility, it was also the objective of this work to determine its stability at elevated temperatures.
2. Materials and Methods
α-Alumina (Baikowski, France) powder and 3YSZ (Tosoh, Tokyo, Japan) powder in a volume proportion of ~70% and ~30% were mixed and ball-milled for 12 h. Discs were uniaxially pressed followed by isostatic pressing. The discs were sintered in air at 1600 °C for 5 h. Na-β″-alumina packing powder was made by mixing Na2CO3, LiNO3 and α-Al2O3 and calcined at 1250 °C for 2 h. The composition of the powder was ~8.85 wt.% Na2O, 0.75 wt. Li2O% (as stabilizer) and balance Al2O3. Sintered α-alumina + YSZ samples were buried in Na-β″-alumina powder and heat-treated at 1250 °C and 1350 °C for several hours. Samples were periodically cooled to room temperature and weighed. After each treatment, sample weight was measured to monitor the conversion of α-alumina into Na-β″-alumina. The samples were heat treated until no further weight change occurred, indicating full conversion through the thickness of the sample.
Flat surfaces of the discs were polished. The discs were then immersed in molten AgNO3 and LiNO3 for ion exchange to respectively form Ag-β″-alumina + YSZ and Li-β″-alumina + YSZ at 300 °C and 365 °C (in AgNO3) and 300 °C and 370 °C (in LiNO3). Samples were periodically removed, cooled to room temperature, washed in water to remove salt sticking to the samples, dried and weighed to determine the extent of ion exchange. Thin layers of gold were applied as a paste on the surfaces and fired at 500 °C for 1 h. Platinum mesh was placed on the two surfaces and then placed between ceramic honeycomb structures and spring-loaded. EIS was conducted over a range of temperatures. Upon removal from the fixture, the gold layers formed thin films bonded to the platinum mesh. The samples were further ion exchanged for a period of time, and weighed. In this manner, EIS measurements could be made after various ion exchange treatments, allowing a study of conductivity as a function of the degree of ion-exchange. After a certain period of time, samples were immersed in molten NaNO3 to reverse ion exchange back to predominantly Na-β″-alumina + YSZ. EIS measurements were also made after reverse ion exchange with sodium. At these relatively low temperatures, the oxygen ion conductivity of YSZ is much lower than that of β″-alumina. Thus, the only transport occurs through the β″-alumina phase.
In order to determine the possible instability of Ag-β″-alumina at elevated temperatures, a disc of ion-exchanged sample was first weighed to the accuracy of 0.0001 g. One disk was then heated in air at 900 °C for 2 and 3 h. Another ion-exchanged disc was heated in air at 900 °C for 12 h. The samples were weighed after each treatment. After the final treatment, the sample heated for 3 h was leached in nitric acid. After drying, the sample once again was weighed.Samples were characterized using scanning electron microscopy (SEM, FEI Nova Nano, Hillsboro, USA), EDS (FEI Nova Nano, Hillsboro, USA) and X-ray diffraction (Philips PANalytical X’Pert, Amsterdam, Netherlands).
3. Results
3.1. Microstructure, Elemental Distribution, and Crystal Structure
Figure 1a shows an SEM micrograph of an as-converted Na-β″-alumina + YSZ sample. Figure 1b shows an SEM image of the sample after ion exchange in LiNO3 for 24 h. No microstructural changes are observed, consistent with expectations, since the only change that occurs is the partial replacement of Na+ by Li+ in Na-β″-alumina. Also shown in insets are EDS scans. Lithium is too light to be detected. However, it is seen that in the partially ion-exchanged sample, the sodium count is lower, consistent with its partial replacement.
Figure 2a shows an SEM image of a sample that had been ion-exchanged in LiNO3 at 300 °C for 2 h. Figure 2b–d show respectively, EDS maps of O, Al and Zr. All three are uniform through the width of the image. Figure 2e shows EDS map of Na. At about 80 microns from the left, a distinct change in color is observed. Figure 2f shows actual counts of sodium. Again at ~80 microns, a clear change in the sodium count is observed. This suggests that in 2 h, approximate depth of ion exchange is ~80 microns. In samples not exchanged throughout the thickness, the measured conductivity reflects total conductivity which includes contributions that are spatially dependent.
Figure 3 shows EDS line scans of a sample ion-exchanged in AgNO3 at 300 °C for 1 h. The measurements were performed at near the surface region since the sample is relatively thick. At both surfaces, high concentration of silver atoms and depletion of sodium atoms are observed, indicating sodium to silver ion exchange has occurred. Away from the surface, silver concentration gradually decreases to nearly zero while Na concentration gradually recovers to a steady value reaching bulk concentration. Comparing Figure 2 and Figure 3 suggests that at the same temperature, ion exchange of Na+ by Ag+ can happen more rapidly, which can be understood as to be shown later as well as reported by Yao and Kummer that Na+ to Ag+ ion exchange has a much higher maximum ion exchange percentage (90–100%) than that of maximum Na+ to Li+ ion exchange (40–50%) [1]. And more importantly, even when ion-exchanged with only 10% AgNO3 in AgNO3/NaNO3 molten mixture, the maximum Na+ to Ag+ ion exchange percentage can exceed 80% while Na+ to Li+ ion exchange percentage remains less than 10% in 80% LiNO3 in LiNO3/NaNO3 molten mixture [1].
Figure 4 compares samples without (converted only) and with ion exchange for 24 h at 370 °C in LiNO3 where β″-alumina, tetragonal and monoclinic phases of zirconia were observed. Identification of β″-alumina structure usually can be characterized by a few single peaks and a set of low scattered peaks with relatively low intensity at 35°–45°. The samples were very strong and no cracks were observed. Note in the samples before and after ion exchange, both tetragonal and monoclinic zirconia were observed. This is not surprising since 3YSZ is not a fully stabilized zirconia. It is known that tetragonal zirconia can slowly transforms to monoclinic zirconia (sometimes referred to as t-m transformation) over a rather narrow but important temperature range, typically room temperature to around 400 °C over extended period, which is referred to as low-temperature degradation (LTD) [22]. This phenomenon had been an issue in biomedical applications, such as hip implants and dental restorations, before the LTD mechanism was discovered. It is obvious t-m transformation has occurred after ion exchange process based on the suppressed intensity of tetragonal phase and increasing intensity of monoclinic phase for a few major peaks (indicated by double arrows).
3.2. Ion Exchange Kinetics
Figure 5 shows the extent of ion exchange as a function of time. A sample of Na-β″-alumina + YSZ was ion exchanged in AgNO3 at 365 °C for up to 20 h. Subsequently, the sample was reverse ion exchanged in NaNO3 for an additional 61 h. The figure shows an increase in Ag+/[Ag+ + Na+] ratio eventually reaching saturation. One sample was further ion-exchanged for up to 60 h with no change in the Ag+/[Ag+ + Na+] ratio indicating saturation occurred in 20 h. After ion exchange in NaNO3, the Ag+/[Ag+ + Na+] decreased and eventually attained a lower saturation limit. Table 1 gives the weights of the sample after successive ion exchange. The ‘before’ column lists weight of the sample before subsequent ion exchange. The ‘after’ column lists weight after that ion exchange step. As seen in the table, during ion exchange in AgNO3, the weight increases since Ag has higher atomic mass than Na. For the same reason, when ion exchanged in NaNO3, the weight decreases, as expected. The angled arrows show weights after removing gold electrode/platinum grid from EIS measurements. There is virtually no change, indicating that there was no physical or chemical bonding between the electrodes and the sample. Table 2 shows similar data for ion exchange in LiNO3 and reverse ion exchange in NaNO3. In this case, weight decreases with increasing Li+/[Li+ + Na+] since lithium has a smaller atomic mass than sodium.
3.3. Conductivity of as Converted and Ion-Exchanged Samples
Figure 6 shows the ionic conductivity measured by EIS on a fully converted sample and after ion exchange for 24 h in LiNO3 at 300 °C. Representative EIS spectra are shown in Figure 6a,b. The spectra show no semicircles which are usually seen in electrochemical cells such as in fuel cells with active electrodes. This is partly due to poor electrode performance at low temperatures with pure Au electrodes. On the other hand, wire inductance can play a role too so that semicircles can be completely overlapped by inductance, the true semicircle in this case may be recovered by firstly measuring wire/metal-contact EIS spectrum and followed by subtracting wire/metal-contact spectrum point by point from measured wire/metal-contact + sample EIS spectrum [23]. Removal of the inductance is particularly important if separation of grain and grain boundary resistance is required. Similar behavior has been noted for some other solid state lithium ion conductors[23]. Since in this study, total ionic conductivity is of most interest, we therefore directly take the intercept in the high frequency range with real axis for the conductivity measurement. Figure 6c shows the Arrhenius plots of the total ionic conductivity. Both samples exhibit an Arrhenius behavior. The activation energy for the converted sample is 0.13 eV while it is 0.18 eV for the ion exchanged sample. These two values agrees relatively well with that of reported activation energies of single crystal β″-alumina of 0.10–0.33 eV and polycrystalline β″-alumina of 0.16–0.22 eV [1].The room temperature conductivities were estimated by extrapolation. The estimated total ionic conductivities at room temperature are 3.6 × 10⁻³ S cm−1 and 7.5 × 10⁻⁴ S cm−1 for the as-converted and ion-exchanged samples, respectively. Koh et al. reported vapor phase exchange of Li+ to replace Na+ [18]. The extrapolated conductivity at room temperature in their work was ~7 × 10⁻⁵ S cm−1. The conductivity of the Li-ion exchanged sample likely contains contributions from both Na+ and Li+ ions. However, it has been reported that the Li+ transport number is nearly one if the Li+/(Na+ + Li+) ratio is greater than about 0.5 in Li+/Na+ - β-alumina [17]. Since β and β″ have similar structures, we expect the partially ion-exchanged Li-β″-alumina to also be a predominantly Li+-ion conductor if Li+/(Na+ + Li+) ratio is greater than 0.5 in Li+/Na+ - β″-alumina. In Figure 4, Li+/(Na+ + Li+) ratio is about 0.35, the composite is a mixed Na+ and Li+ conductor with Li+ being the dominant conducting species, this may partially contribute to the measured higher conductivity in the ion exchanged Li+/Na+ - β-alumina than the extrapolated conductivity from Koh et al.’s work.
Figure 7 shows Arrhenius plots of the ionic conductivity of the as-converted Na-β″-alumina + YSZ sample, after ion exchange in molten LiNO3, and after reverse exchange in NaNO3 as a function of temperature and time for two samples. The conductivity is the highest for the as converted Na-β″-alumina + YSZ, and the lowest after ion exchanged in LiNO3 and reversely ion exchanged in NaNO3. The conductivity is slightly higher in the as-converted Na-β″-alumina + YSZ sample at 1350 °C indicating slightly higher Na+ concentration, but becomes slightly lower after LiNO3 ion exchange and NaNO3 reverse ion exchange in the same sample. Since we have seen a dramatic reduction of conductivity after LiNO3 ion exchange, a sample containing higher initial Na+ concentration will likely have higher Li+ concentration after reaching Li+ saturation. Upon reverse ion exchange, a higher Na+ concentration may be replaced by a higher Li+ concentration resulting a lower overall conductivity.
Figure 8 shows Arrhenius plots of the ionic conductivity after silver ion exchange for various periods of time. As seen in the figure, the conductivity decreases with increased Ag+/[Ag+ + Na+] ratio and saturated in about 3 h. Reverse ion exchange by NaNO3 did not recover the conductivity to the initial value in the as-converted state.
3.4. Stability of Ag-β″-Alumina + YSZ Composites
Samples of Ag-β″-alumina + YSZ were heated in air at 900 °C for various periods of time (up to 20 h) and their weights were measured. The initial mass of one sample was 1.1797 g. After 3 h, the mass of the sample was 1.1784 g. The surface of the sample was metallic indicating some loss of oxygen and formation of Ag metal. Figure 9a shows a photograph of the sample before heat treatment. Figure 9b shows a photograph of the sample after the heat treatment. The loss of mass attributed to oxygen corresponds to 0.0013 g and the corresponding moles of oxygen lost was 8.13 × 10⁻⁵ mol. The sample was then etched in nitric acid to dissolve silver from the surface. The weight of the sample after leaching was 1.1665 g. This corresponds to a loss of silver of 0.0119 g. The corresponding moles of silver lost was 1.1 × 10⁻⁴ moles. Thus, the mole ratio of loss corresponds to Ag1.35O. Ideally, it should be Ag2O. Given the very small mass loss, especially of oxygen, the accuracy of the balance is not sufficient. So we will assume that the loss of mass of the two elements must be in 2(Ag) to 1(O) ratio.
The vapor phase process for the conversion of α-Al2O3 + YSZ is made possible because Na-β″-alumina is a sodium ion conductor and YSZ is an oxygen ion conductor. This allows the conversion by incorporation of Na2O as a coupled transport of Na+ through the formed Na-β″-alumina and of O2− through YSZ. Detailed mechanism of the process has been described by Parthasarathy and Virkar [16].
The process occurs because reaction (1) is thermodynamically favored. The formation of Ag-β″-alumina + YSZ by ion exchange in molten AgNO3 starting with Na-β″-alumina + YSZ is thermodynamically favored since it is only a reaction involving entropy change with essentially no enthalpy change. This makes it possible to make many β″-alumina capable of transporting other cations by ion exchange, even though such phases may not be thermodynamically stable. Since the alumina spinel blocks in β″-alumina and YSZ are very refractory materials, such phases are kinetically stable.
When heated to a high temperature, e.g., 900 °C, there is sufficient conductivity for oxygen ions in YSZ so that, what makes possible to make the original Na-β″-alumina + YSZ by coupled transport, also makes the thermodynamically unstable Ag-β″-alumina to decompose. In this process some of Ag+ is removed from Ag-β″-alumina and some of O2− is removed from YSZ. The β″-alumina structure as such does not decompose since oxygen ion diffusion in the spinel block is very sluggish. While the kinetics of the decomposition process is believed to be controlled by coupled diffusion of 2Ag+ through Ag-β″-alumina and O2− through YSZ. However, it is possible to remove oxygen from YSZ. So the process involves some removal of Ag+ from Ag-β″-alumina and some removal of O2− from YSZ. If this happens, it is conceivable the there may be some positive charge in YSZ grains and balancing negative charge in Ag-β″-alumina, which may be similar to that of space charge phenomenon along grain boundaries of sintered polycrystalline yttrium stabilized zirconia [24]. Alternatively, some electronic transport may occur through both Ag-β″-alumina and YSZ to remove Ag and O by the reactions:
and:
and the 2e are transferred to Ag+ at the surface. Otherwise, O2 and Ag may form inside the sample. Since Ag was observed only at the surface, it means the charge transfer should mainly have started from Ag-β″-alumina/YSZ grain boundary at the surface.
2Ag+ + 2e → 2Ag
O2− → 1/2O2 (g) + 2e
4. Conclusions
Na-β″-alumina + YSZ two phase composite solid electrolytes were fabricated by vapor phase conversion of sintered α-alumina + YSZ composites. Na-β″-alumina + YSZ composites were ion-exchanged in AgNO3 and LiNO3 for various periods of time to respectively form Ag-β″-alumina + YSZ and Li-β″-alumina + YSZ composites, which are respectively silver and lithium ion conductors. Their conductivity was measured by electrochemical impedance spectroscopy (EIS), also as a function of the degree of ion exchange. EDS analysis was performed on the ion-exchanged samples to further confirm the occurrence of ion exchange. When Ag-β″-alumina + YSZ samples were heated to 900 °C in air, a thin layer of metallic silver formed on the surface. This was attributed to the thermodynamic instability of Ag-β″-alumina/YSZ composite The kinetics of the decomposition process is believed to be controlled by coupled diffusion of 2Ag+ through Ag-β″-alumina and O2− through YSZ.
Author Contributions
L.Z. and A.V.V. designed the experiments, reviewed the data, and finalized the publication. L.Z. fabricated cells, executed tests, wrote the draft of the manuscript, and revised the manuscript. All authors have read and agreed to the published version of the manuscript.
Funding
This work was supported in part by the National Science Foundation under grant numbers NSF-DMR-1742696, and in part by the US Department of Energy under grant number DE-FG02-03ER46086.The work also received financial support from Zhejiang key research and development program under grant number 2021C01101 and National Natural Science Foundation of China under grant number U20A20251.
Data Availability Statement
All data relevant to this work are reported in the corresponding figures and tables. Raw data for XRD or figures presented in this study are available from the corresponding author on reasonable request.
Acknowledgments
The authors appreciate support from US National Science Foundation, US Department of Energy, Zhejiang Provincial Department of Science and Technology, and National Natural Science Foundation of China.
Conflicts of Interest
The authors declare no conflict of interest.
References
- Sudworth, J.L.; Tilley, A.R. The Sodium Sulfur Battery; Chapman and Hall: London, UK, 1985. [Google Scholar]
- Sudworth, J.L. The sodium/nickel chloride (ZEBRA) battery. J. Power Sources 2001, 100, 149–163. [Google Scholar] [CrossRef]
- Hunt, T.K.; Weber, N.; Cole, T. High efficiency thermoelectric conversion with beta″-alumina electrolytes, the sodium heat engine. Solid State Ion. 1981, 5, 263–265. [Google Scholar] [CrossRef]
- Chang, H.-J.; Lu, X.; Bonnett, J.F.; Canfield, N.L.; Han, K.; Engelhard, M.H.; Jung, K.; Sprenkle, V.L.; Li, G. Decorating β′′-alumina solid-state electrolytes with micron Pb spherical particles for improving Na wettability at lower temperatures. J. Mater. Chem. A 2018, 6, 19703–19711. [Google Scholar] [CrossRef]
- Sparks, T.D.; Ghadbeigi, L. Anisotropic properties of Na-β″-alumina + YSZ composite synthesized by vapor phase method. J. Mater. Res. 2018, 33, 81–89. [Google Scholar] [CrossRef] [Green Version]
- Li, K.; Yang, Y.; Zhang, X.; Liang, S. Highly oriented β″-alumina ceramics with excellent ionic conductivity and mechanical performance obtained by spark plasma sintering technique. J. Mater. Sci. 2020, 55, 8435–8443. [Google Scholar] [CrossRef]
- Ligon, S.C.; Bay, M.-C.; Heinz, M.V.F.; Battaglia, C.; Graule, T.; Blugan, G. Large planar Na-β″-Al(2)O(3) solid electrolytes for next generation na-batteries. Materials 2020, 13, 433. [Google Scholar] [CrossRef] [Green Version]
- Bay, M.-C.; Wang, M.; Grissa, R.; Heinz, M.V.F.; Sakamoto, J.; Battaglia, C. Sodium plating from Na-β″-alumina ceramics at room temperature, paving the way for fast-charging all-solid-state batteries. Adv. Energy Mater. 2020, 10, 1902899. [Google Scholar] [CrossRef] [Green Version]
- Weber, N.; Kummer, J.T. Sodium sulfur batteries. Annu. Power Sources Conf. 1967, 21, 37–39. [Google Scholar]
- Long, W.; Yuhao, L.; Jue, L.; Maowen, X.; Jinguang, C.; Dawei, Z.; Goodenough, J.B. A superior low-cost cathode for a Na-Ion battery. Angew. Chem. Int. Ed. 2013, 52, 1964–1967. [Google Scholar] [CrossRef]
- Jian, Z.; Han, W.; Lu, X.; Yang, H.; Hu, Y.-S.; Zhou, J.; Zhou, Z.; Li, J.; Chen, W.; Chen, D.; et al. Superior electrochemical performance and storage mechanism of Na3V2(PO4)3 cathode for room-temperature sodium-ion batteries. Adv. Energy Mater. 2013, 3, 156–160. [Google Scholar] [CrossRef]
- Kubota, K.; Komaba, S. Review—Practical issues and future perspective for Na-Ion batteries. J. Electrochem. Soc. 2015, 162, A2538–A2550. [Google Scholar] [CrossRef]
- Youngblood, G.E.; Virkar, A.V.; Cannon, W.R.; Gordon, R.S. Sintering processes and heat treatment schedules for conductive, lithia-stabilized β′′-Al2O3. Am. Ceram. Soc. Bull. 1977, 56, 206–210. [Google Scholar]
- Virkar, A.V.; Jue, J.-F.; Fung, K.-Z. Alkali Metal β and β″-Alumina and gallate polycrystalline ceramics by a vapor phase method. US Patent 6,117,807, 12 September 2000. [Google Scholar]
- Parthasarthy, P.; Weber, N.; Virkar, A.V. High temperature sodium-zinc chloride batteries with sodium beta-alumina solid electrolyte. ECS Trans. 2007, 6, 67. [Google Scholar] [CrossRef]
- Parthasarathy, P.; Virkar, A.V. Vapor phase conversion of α-alumina + zirconia composites into sodium ion conducting Na-β″-alumina + zirconia solid electrolytes. J. Electrochem. Soc. 2013, 160, A2268–A2280. [Google Scholar] [CrossRef]
- Yao, Y.; Kummer, J.T. Ion exchange properties of and rates of ionic diffusion in beta-alumina. J. Inorg. Nucl. Chem. 1967, 29, 2453–2466. [Google Scholar]
- Koh, J.-H.; Weber, N.; Virkar, A.V. Synthesis of lithium-beta-alumina by various ion-exchange and conversion processes. Solid State Ion. 2012, 220, 32–38. [Google Scholar] [CrossRef]
- Roth, W.L.; Farrington, G.C. Lithium-Sodium Beta alumina: First of a Family of Co-ionic Conductors? Science 1977, 196, 1332. [Google Scholar] [CrossRef]
- Dunn, B.; Farrington, G.C. Trivalent ion exchange in beta″ alumina. Solid State Ion. 1983, 9–10, 223–225. [Google Scholar] [CrossRef]
- Dunn, B.; Farrington, G.C. Fast divalent ion conduction in Ba++, Cd++ and Sr++ beta″ aluminas. Mater. Res. Bull. 1980, 15, 1773–1777. [Google Scholar] [CrossRef]
- Chevalier, J.r.m.; Gremillard, L.; Virkar, A.V.; Clarke, D.R. The tetragonal-monoclinic transformation in zirconia: Lessons learned and future trends. J. Am. Ceram. Soc. 2009, 92, 1901–1920. [Google Scholar] [CrossRef]
- Allen, J.L.; Wolfenstine, J.; Ramaswamy, E.; Sakamoto, J. Effect of substitution (Ta, Al, Ga) on the conductivity of Li7La3Zr2O12. J. Power Sources 2012, 206, 315–319. [Google Scholar] [CrossRef]
- Zhang, L.; Virkar, A.V. On space charge and spatial distribution of defects in yttria-stabilized zirconia. J. Electrochem. Soc. 2017, 164, F1506–F1523. [Google Scholar] [CrossRef]
Figure 1.
(a) An SEM image of a fully converted sample before ion exchange. The light areas are YSZ and the dark areas are Na-β″-alumina. The sample exhibits high density (negligible porosity) and fine microstructure. The EDS spectrum shows peaks corresponding to O, Na, Al, Zr and Y. (b) An SEM image of the sample after ion exchange in LiNO3 at 370 °C for 24 h. The microstructure is virtually unchanged. The EDS spectrum shows peaks corresponding to O, Na, Al, Zr and Y. The intensity of the Na peak is much lower in the ion-exchanged sample consistent with its partial replacement by Li.
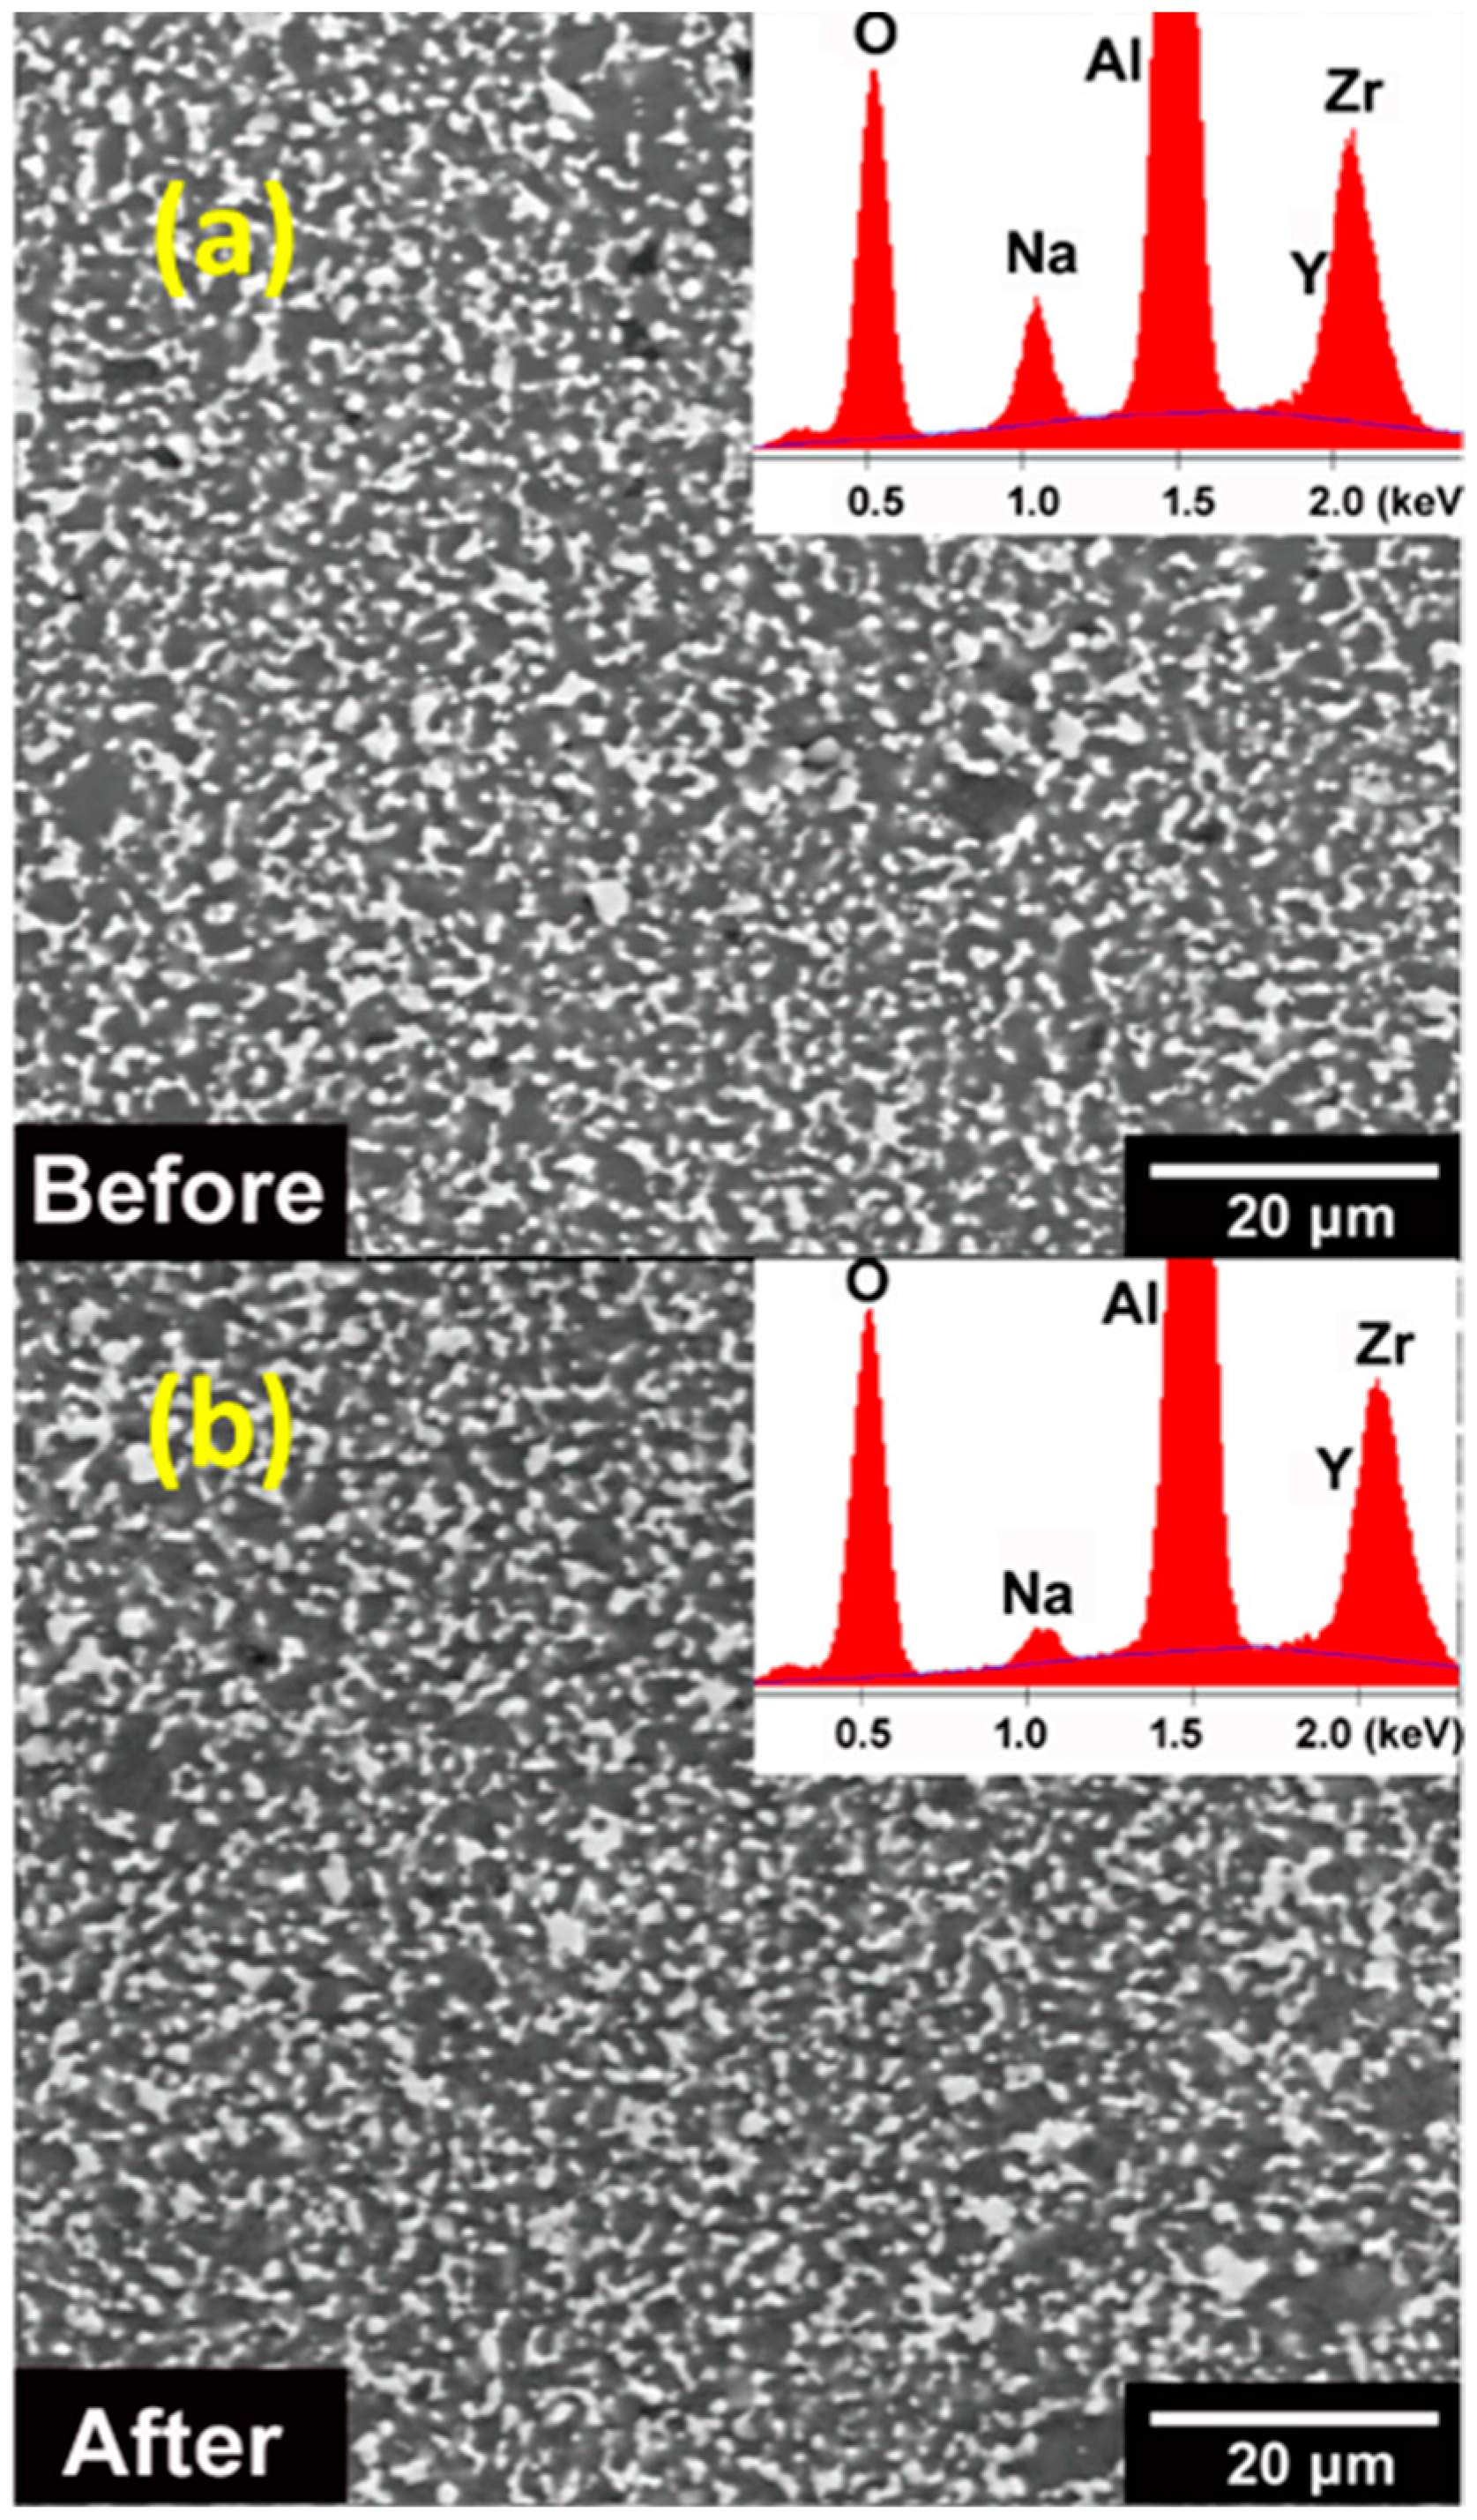
Figure 2.
(a) An SEM image of a sample that had been ion exchanged at 300 °C in LiNO3 for 2 h. The micrograph shows ~250 microns of the sample. The microstructure is similar to that in Figure 1. (b–d) show respectively EDS maps of O, Al and Zr. All three are uniform through the width of the image. (e) An EDS map of Na. As seen in the map, there is a distinct change in color at approximately 80 microns. This suggests that in 2 h, lithium ion exchange had occurred to a depth of about 80 microns. The demarcation line is marked by a red arrow. (f) Actual EDS counts of Na showing a distinct change in counts at about 80 microns.
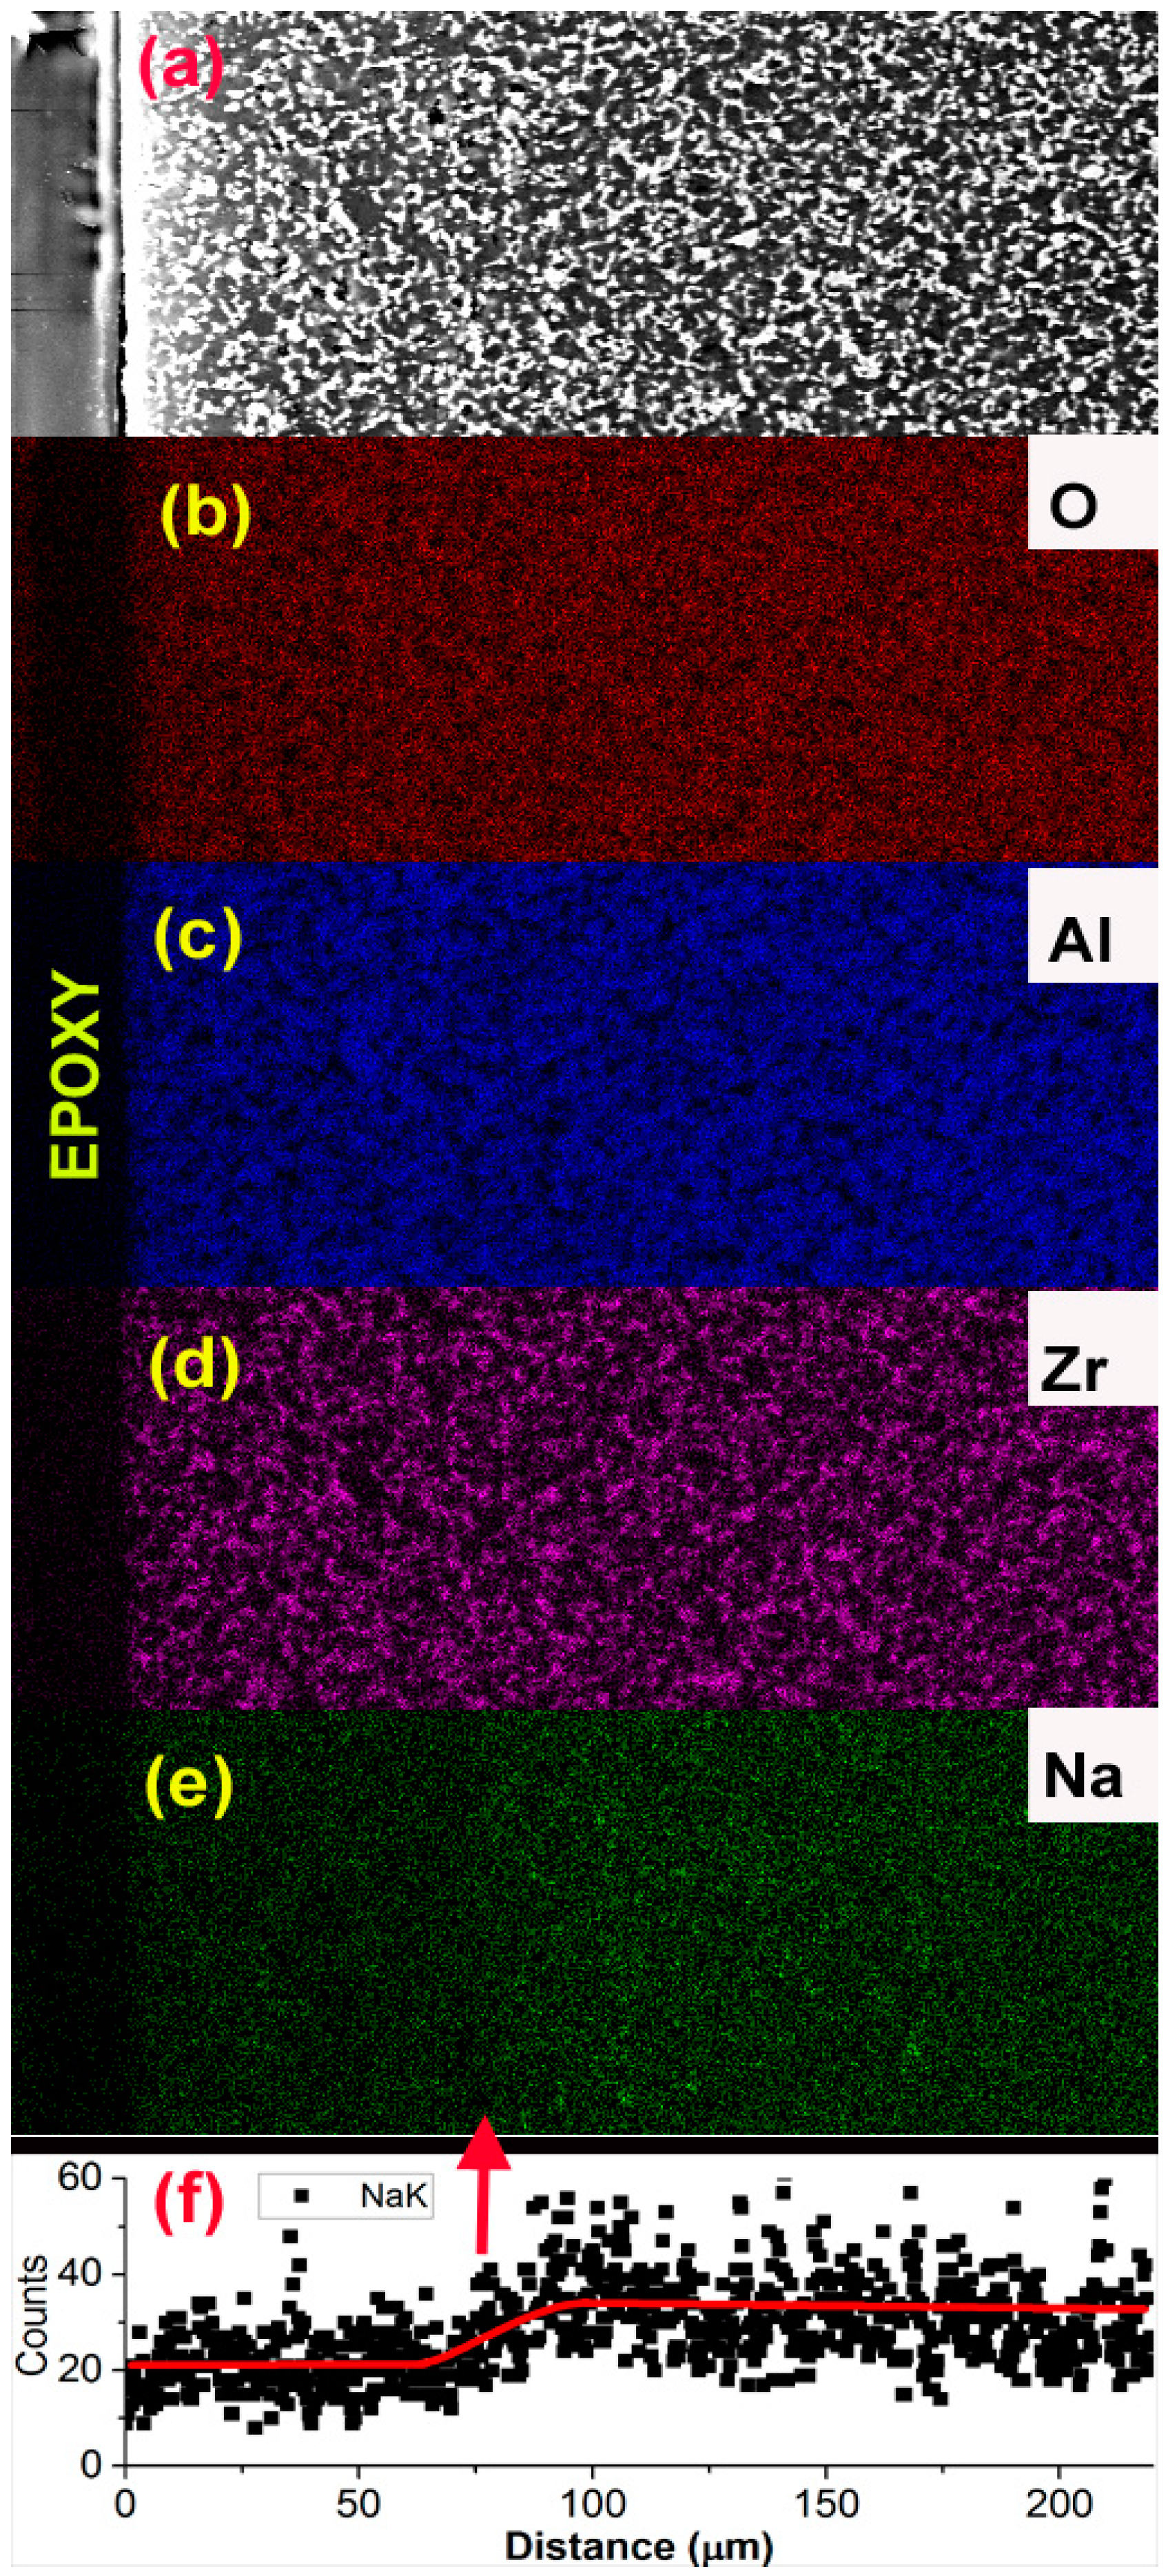
Figure 3.
EDS line scans of a sample ion-exchanged in AgNO3 at 300 °C for 1 h. The “left” surface was arbitrarily chosen from one of the planar surfaces of a disc sample.
Figure 3.
EDS line scans of a sample ion-exchanged in AgNO3 at 300 °C for 1 h. The “left” surface was arbitrarily chosen from one of the planar surfaces of a disc sample.

Figure 4.
Comparison of samples without (converted only) and with ion exchange for 24 h at 370 °C in LiNO3. The characteristic β″-alumina peaks are labeled (mainly for peaks at 16°, 32°, 46° and a group of low scattered between 35°–45°). Both tetragonal and monoclinic phases of zirconia can be seen in the figure. Tetragonal to monoclinic phase transformation was observed based on relative intensity change of two zirconia phases. The sample was very strong and exhibited no obvious cracks. Double arrows indicate sign of tetragonal to monoclinic zirconia transformation after extended ion exchange period.
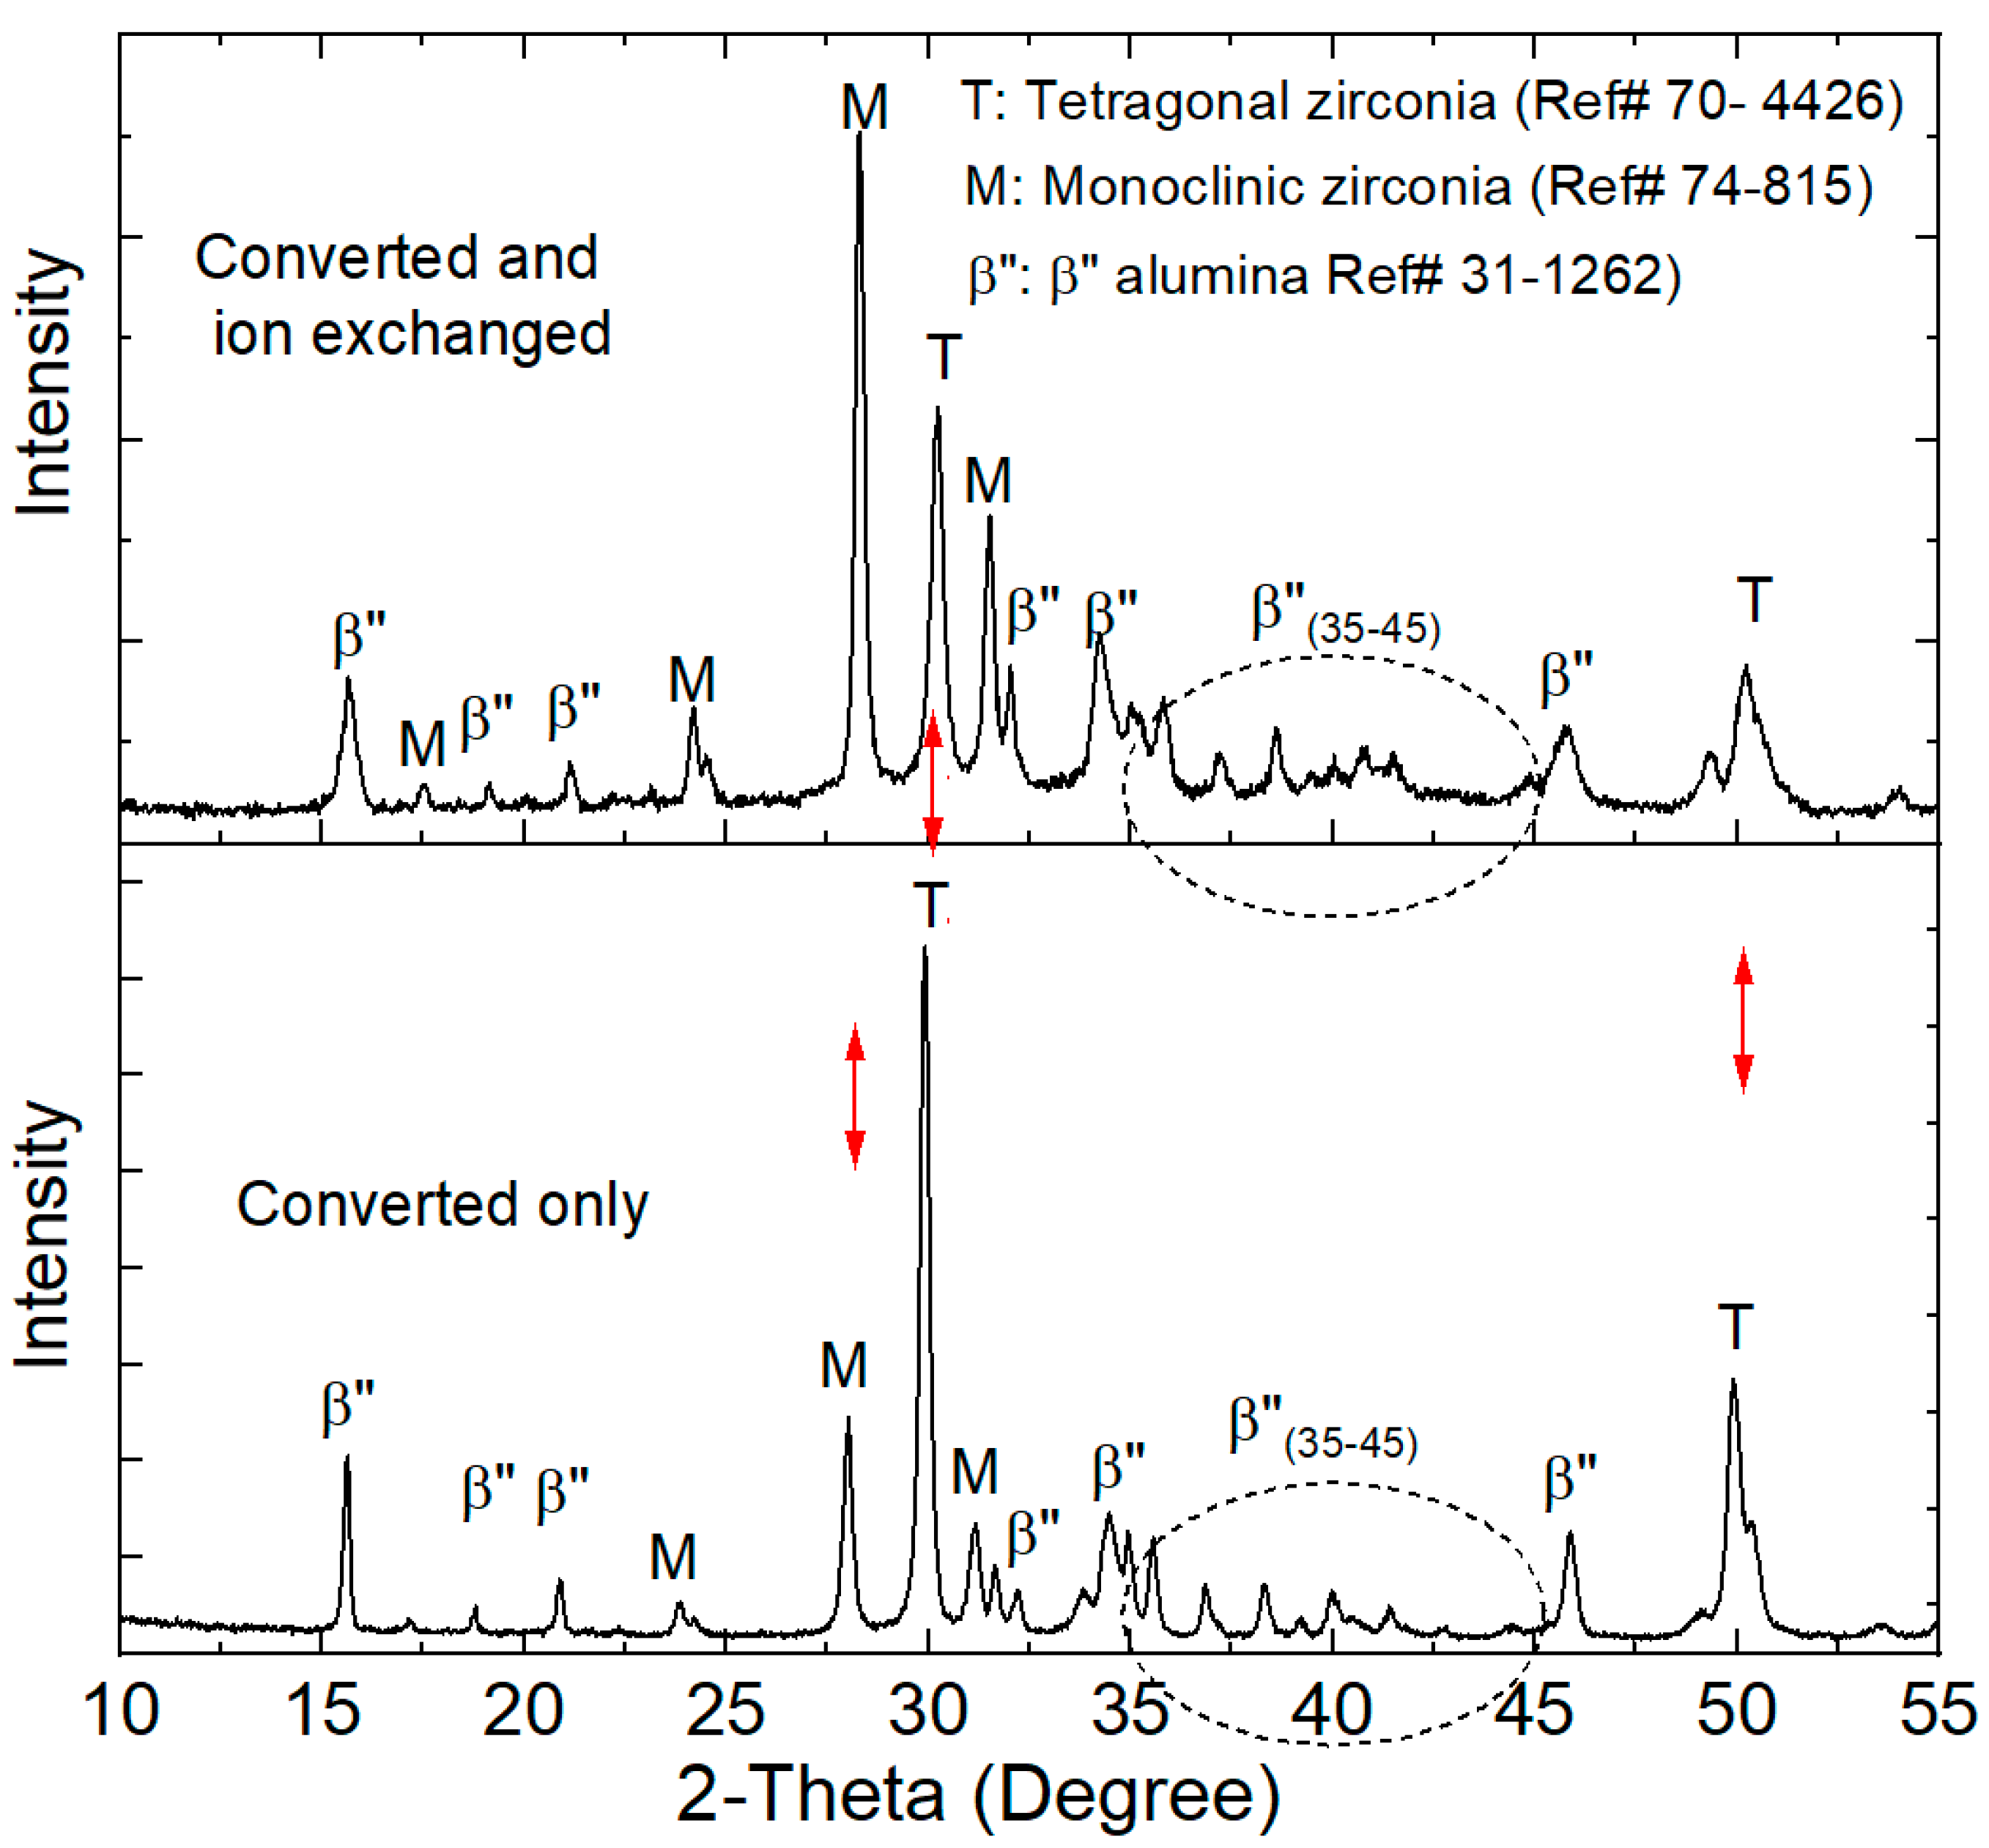
Figure 5.
Measured Ag+/[Ag+ + Na+] and Li+/[Li+ + Na+] ratios after ion exchange in AgNO3 and later after reverse ion exchange in NaNO3 as a function of time from five converted samples. Li ion exchange was conducted at two temperatures; 300 °C and 370 °C.
Figure 5.
Measured Ag+/[Ag+ + Na+] and Li+/[Li+ + Na+] ratios after ion exchange in AgNO3 and later after reverse ion exchange in NaNO3 as a function of time from five converted samples. Li ion exchange was conducted at two temperatures; 300 °C and 370 °C.

Figure 6.
Ionic conductivity measured by EIS on a fully converted sample and after ion exchange for 24 h in LiNO3 at 300 °C. (a) EIS spectra for a fully converted sample (EIS measured at 381 °C) and after ion exchange for 24 h in LiNO3 at 300 °C (EIS measured at 387 °C). (b) Enlarged EIS spectra for a). and intercept with real axis is taken as the total ionic conductivity; (c) Arrhenius plots of the measured conductivity on a fully converted sample and after ion exchange in LiNO3 for 24 h at 300 °C.

Figure 7.
Arrhenius plots of the measured conductivity of the as fabricated samples and after successive lithium ion exchange and after reverse exchange in NaNO3.
Figure 7.
Arrhenius plots of the measured conductivity of the as fabricated samples and after successive lithium ion exchange and after reverse exchange in NaNO3.
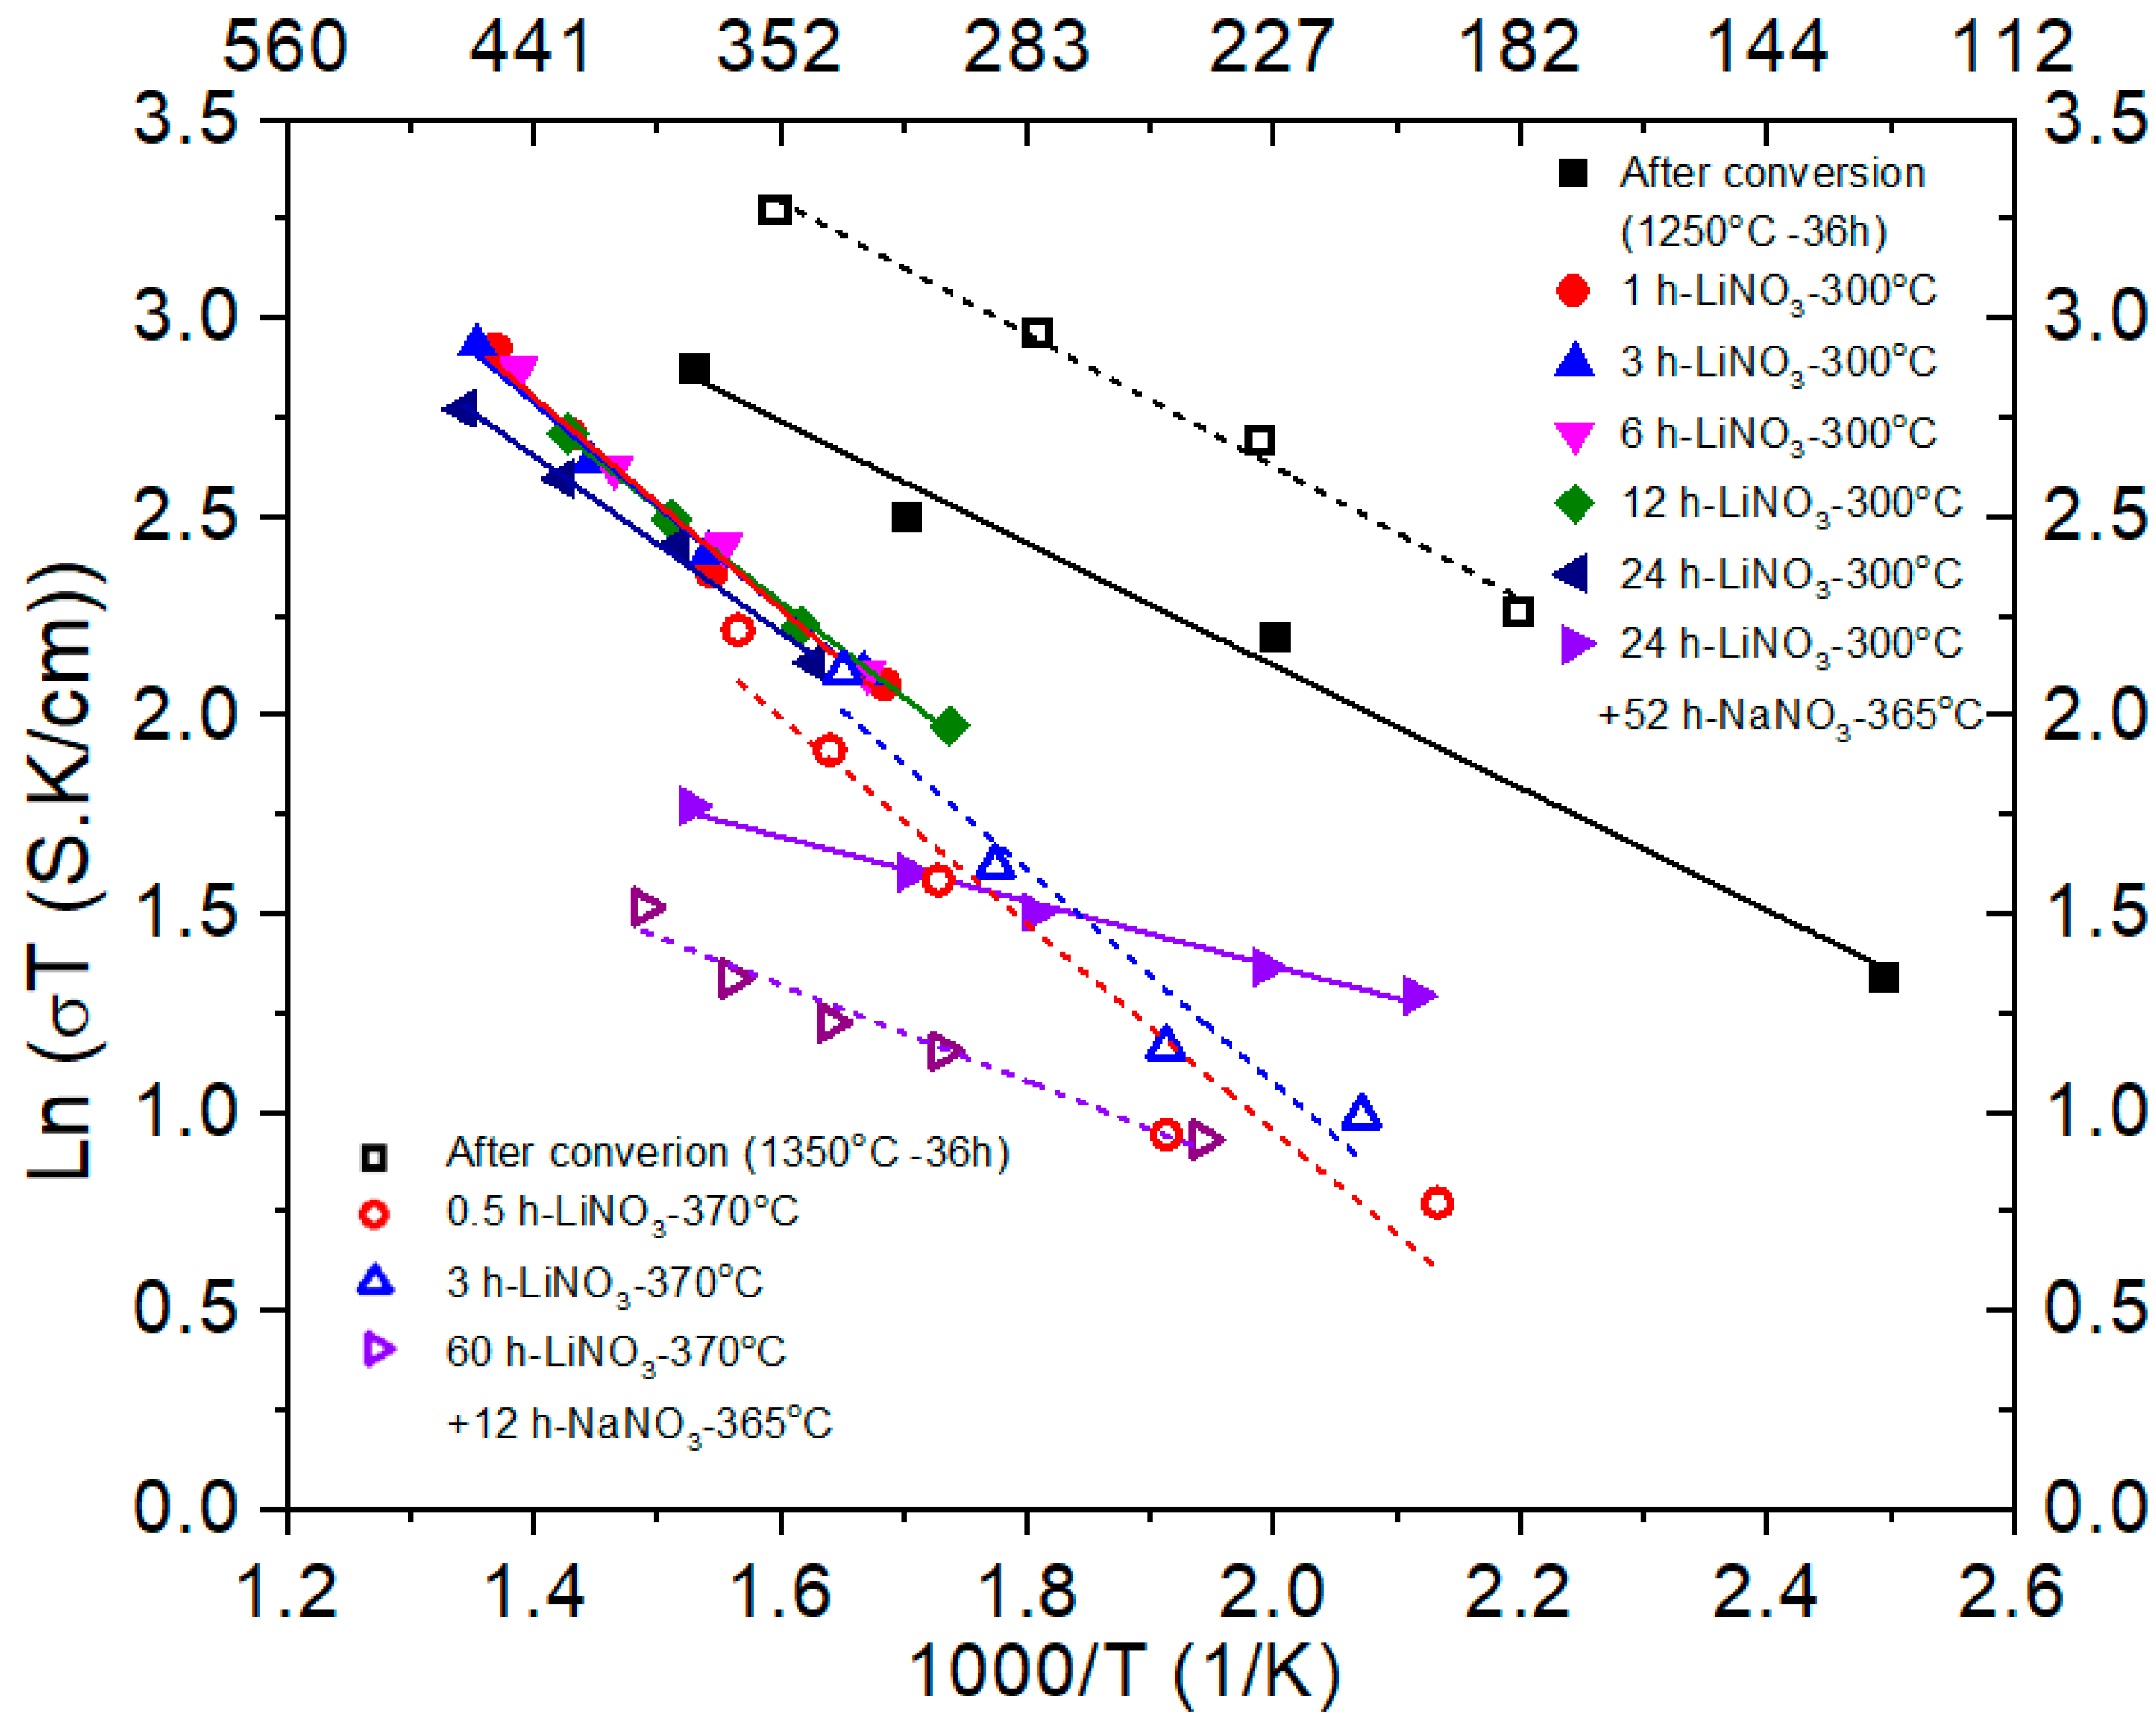
Figure 8.
Arrhenius plots of the measured conductivity of the as fabricated sample and after successive silver ion exchange.
Figure 8.
Arrhenius plots of the measured conductivity of the as fabricated sample and after successive silver ion exchange.
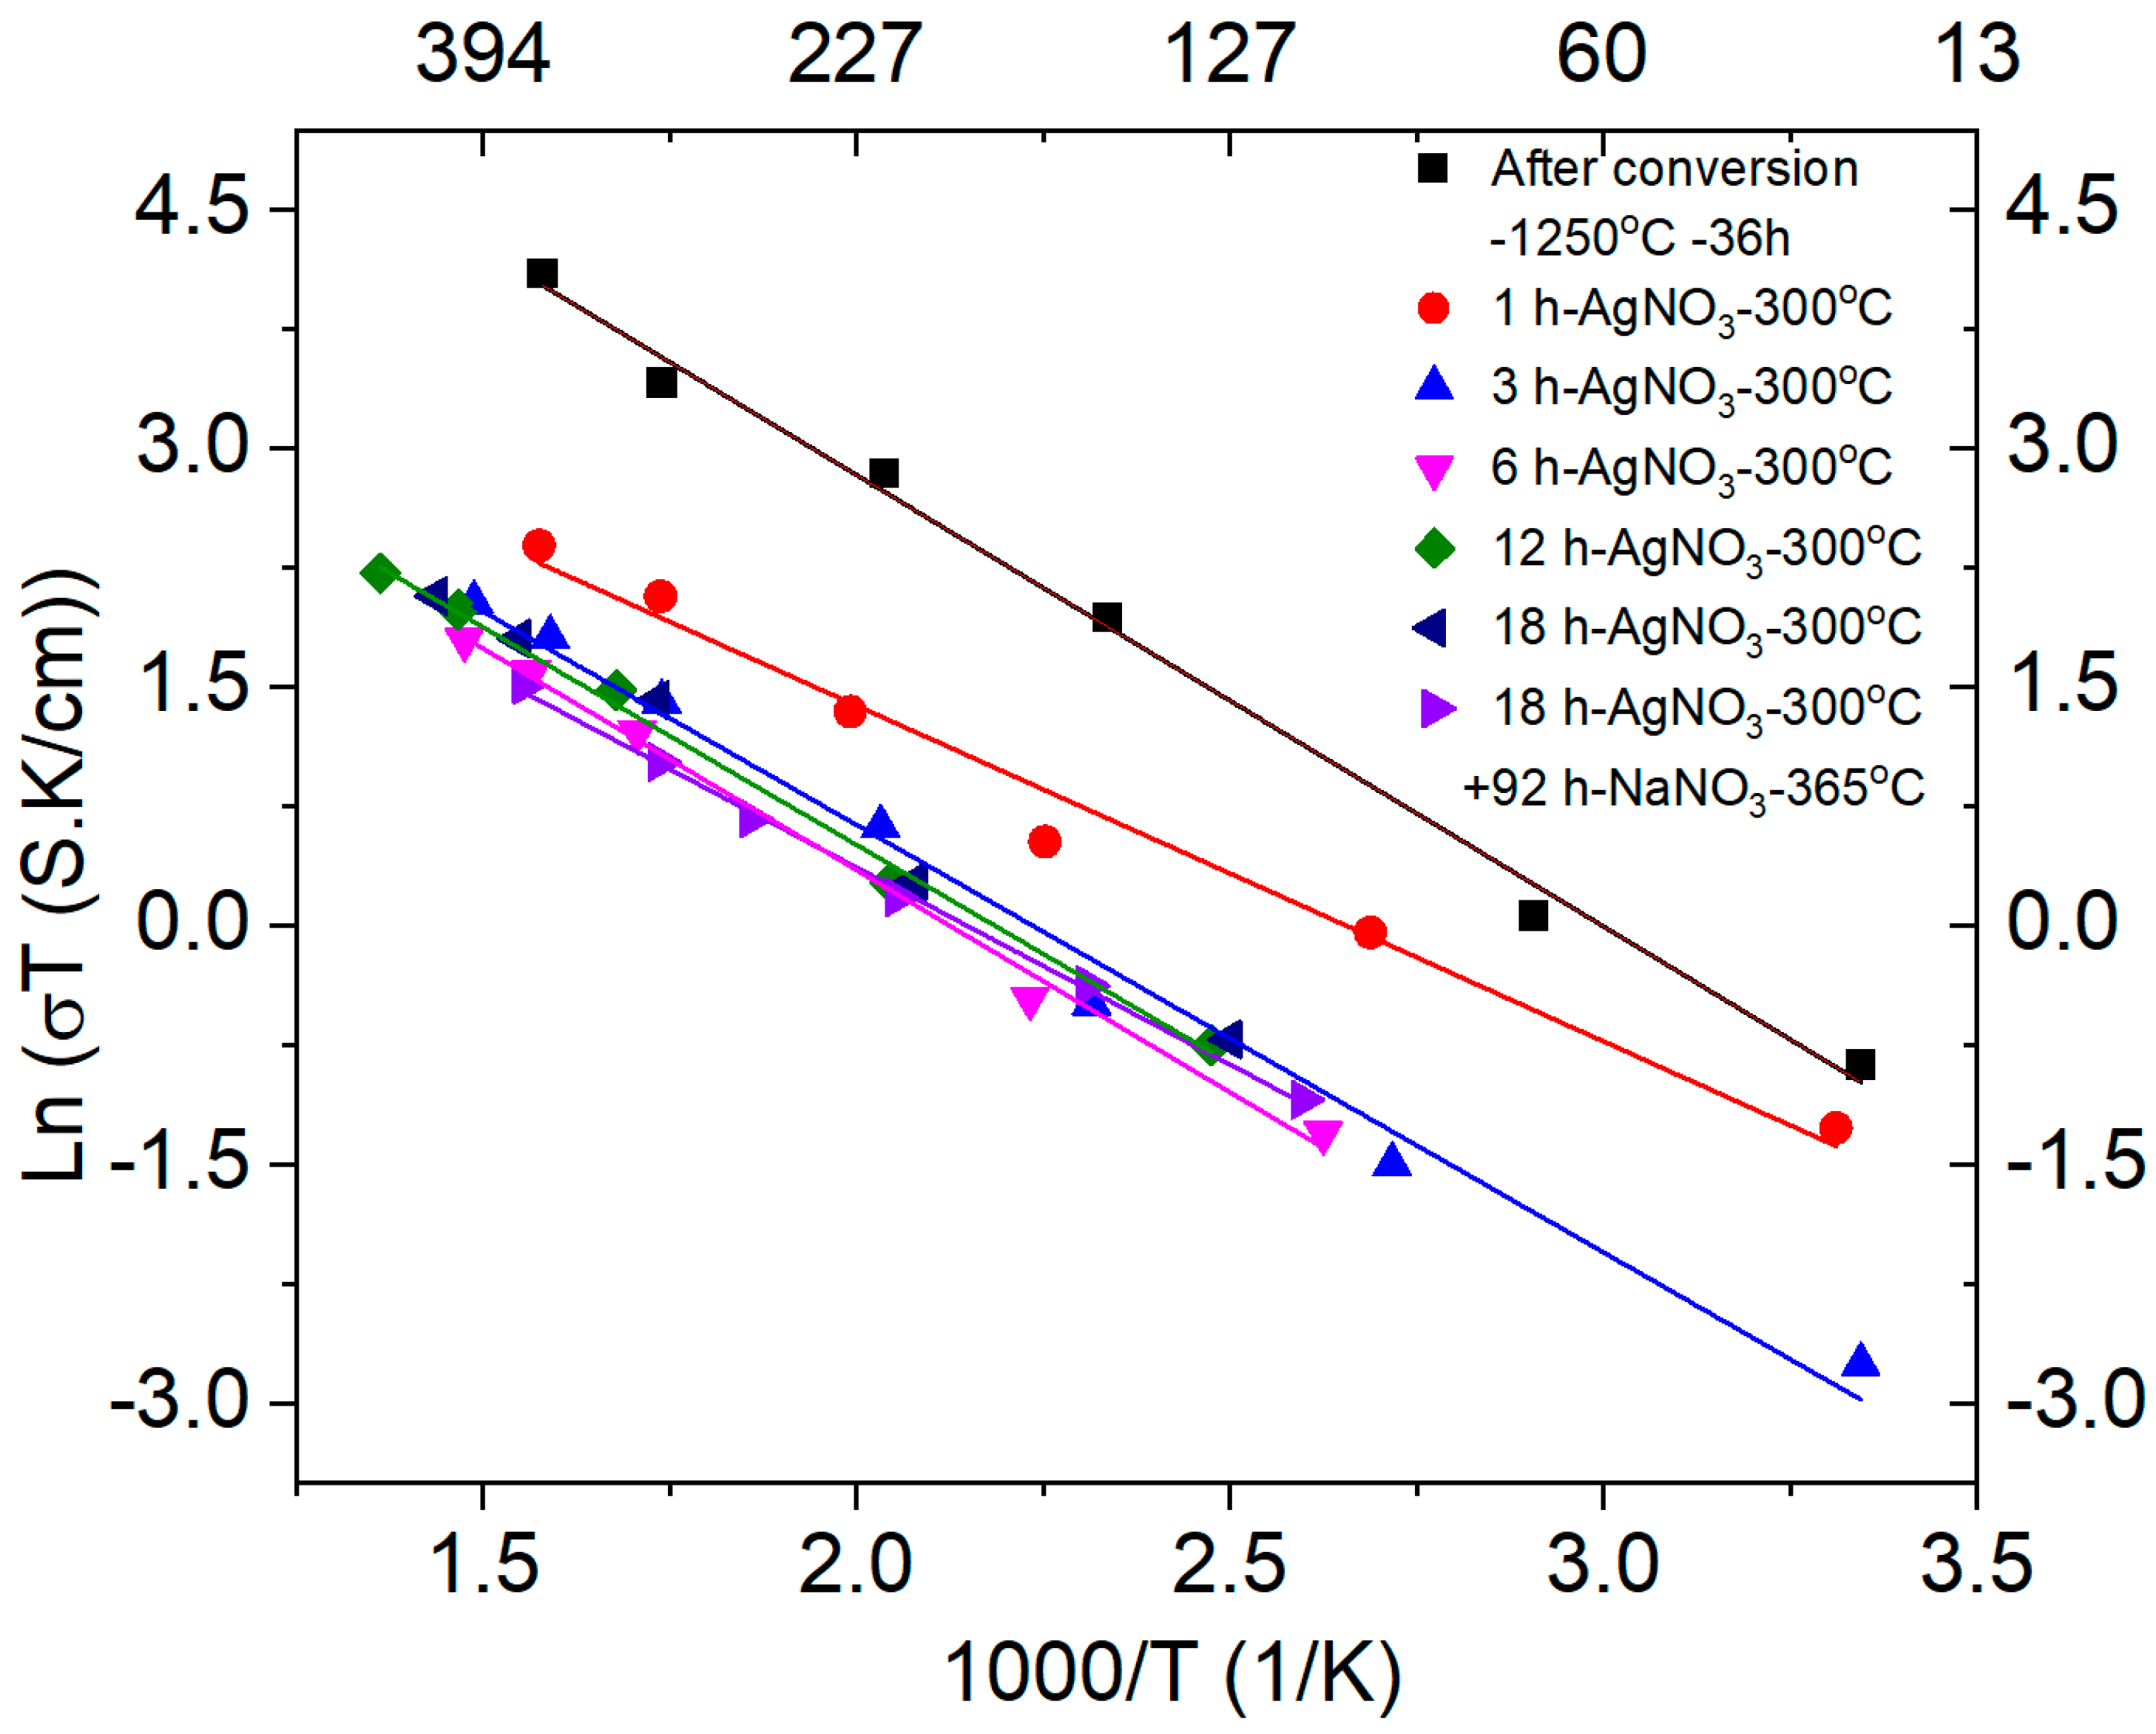
Figure 9.
(a) A sample of Ag-β″-alumina + YSZ. (b) The sample after heat treating at 900 °C in air showing metallic color.
Figure 9.
(a) A sample of Ag-β″-alumina + YSZ. (b) The sample after heat treating at 900 °C in air showing metallic color.
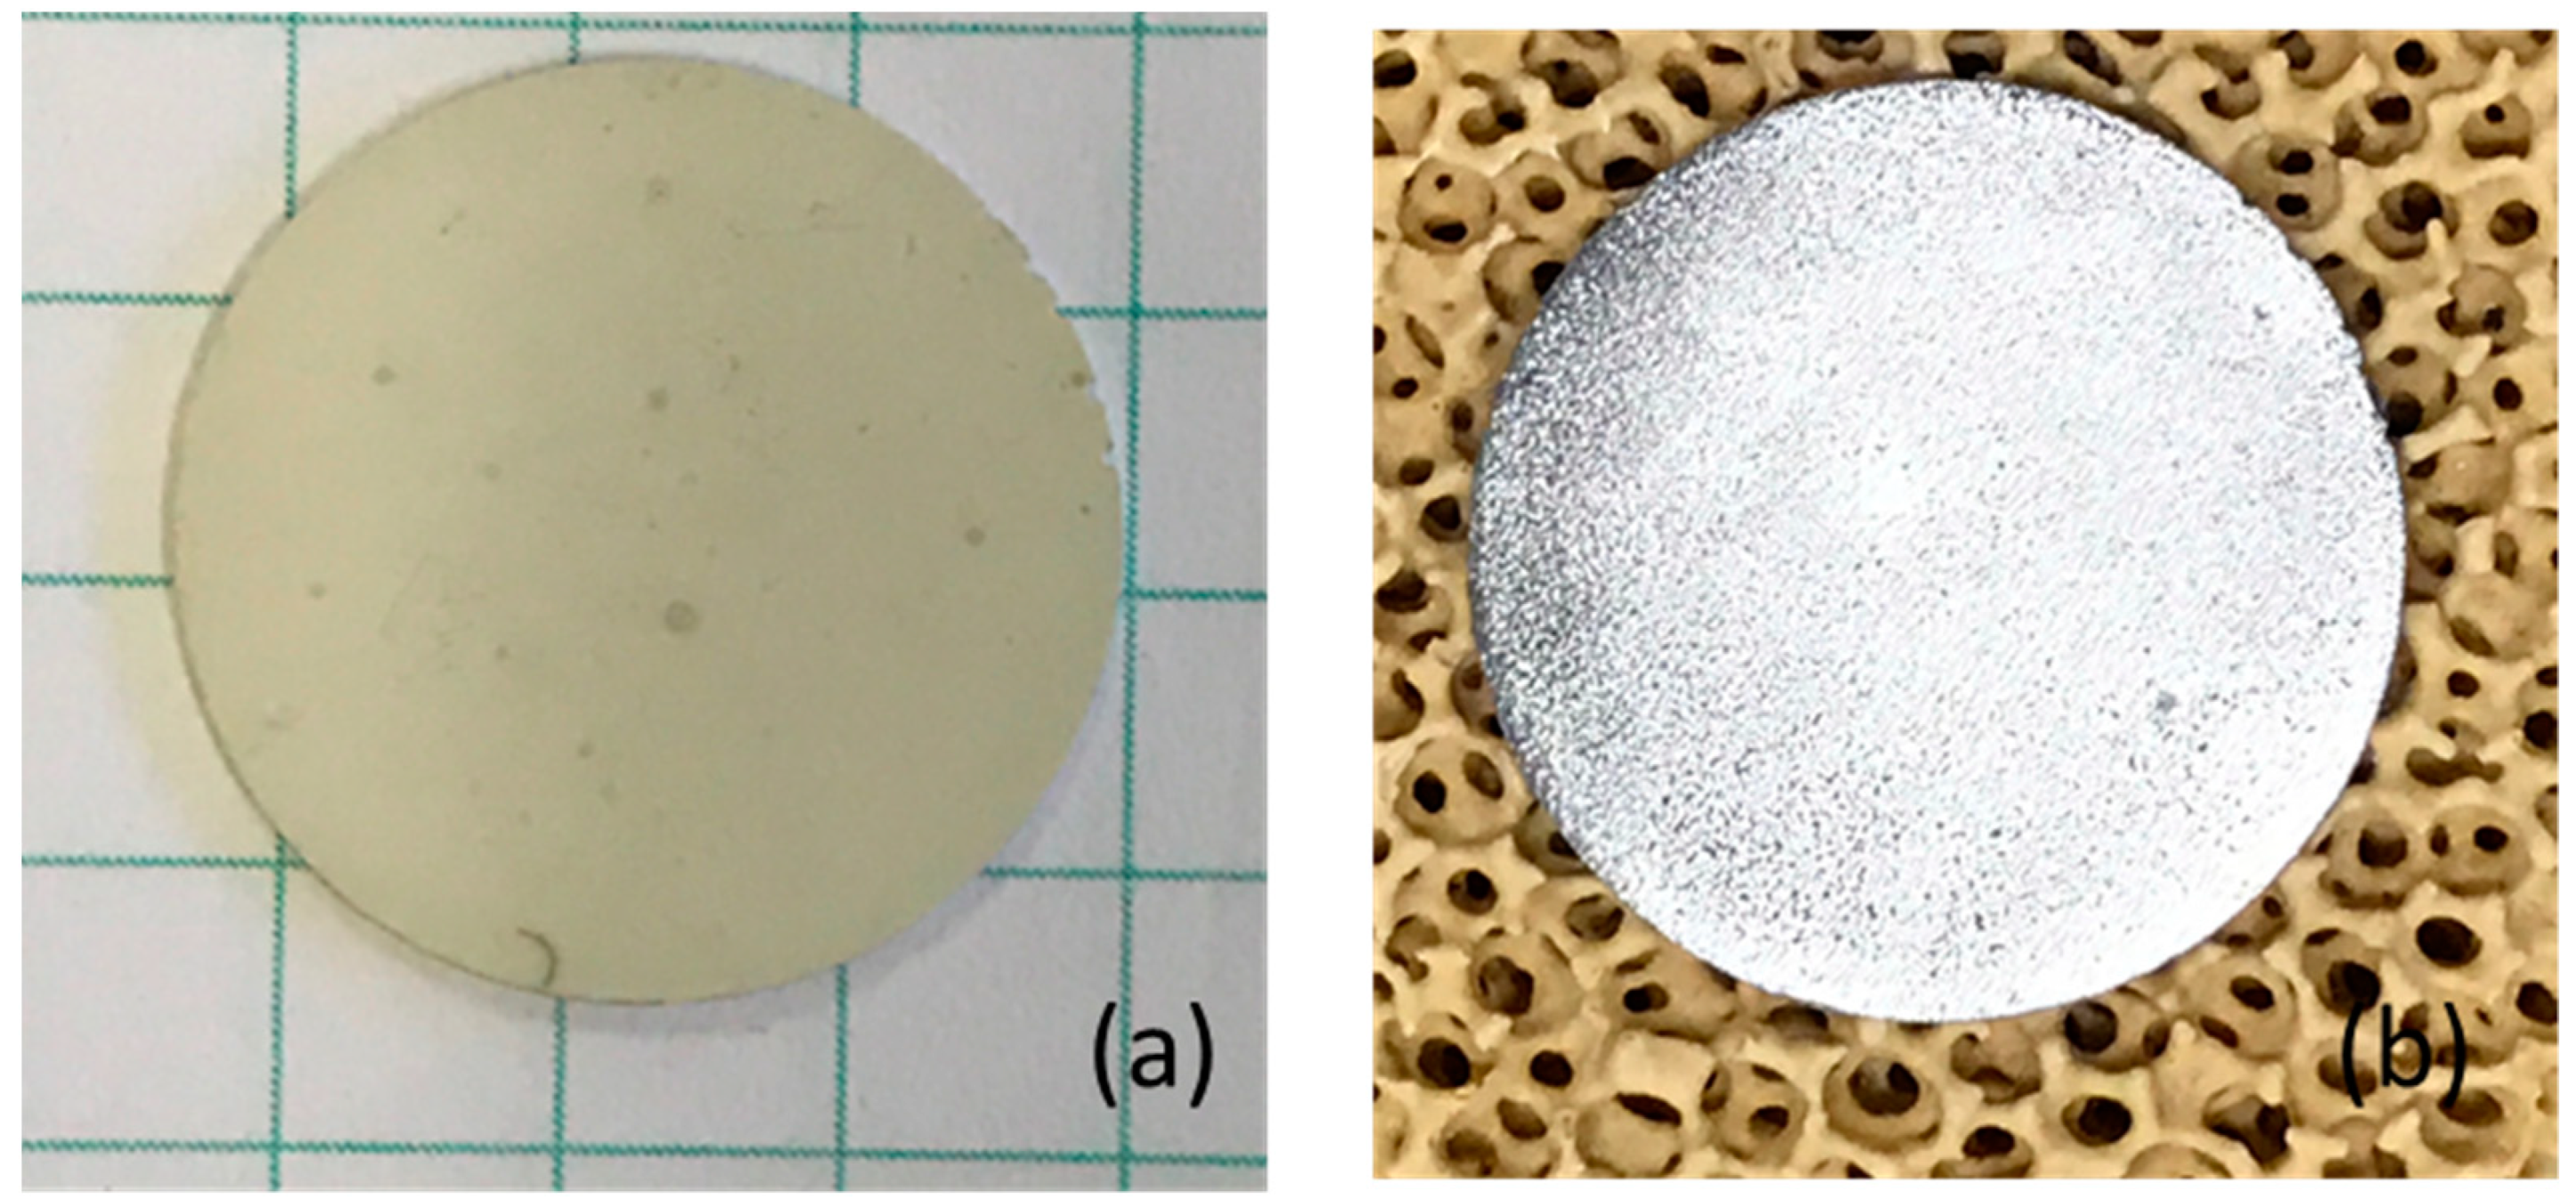
Figure 10.
(a) A fractured piece of the sample showing metallic surface and grey interior. (b) The fractured sample after leaching in HNO3. The surface has turned dark in color.
Figure 10.
(a) A fractured piece of the sample showing metallic surface and grey interior. (b) The fractured sample after leaching in HNO3. The surface has turned dark in color.


Table 1.
Summary of AgNO3 ion exchange & reverse NaNO3 Ion exchange experiment data.
 |
Note: Each change of arrow direction from an upper row to a lower row corresponds to an EIS measurement and gentle removal of Au electrode.
Table 2.
Summary of LiNO3 ion exchange & reverse NaNO3 Ion exchange experiment data.
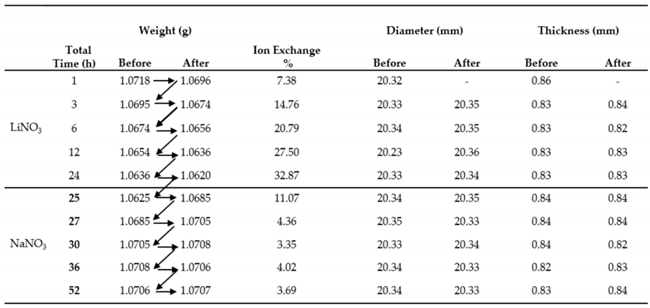 |
Note: Each change of arrow direction from an upper row to a lower row corresponds to an EIS measurement and gentle removal of Au electrode.
Publisher’s Note: MDPI stays neutral with regard to jurisdictional claims in published maps and institutional affiliations. |
© 2021 by the authors. Licensee MDPI, Basel, Switzerland. This article is an open access article distributed under the terms and conditions of the Creative Commons Attribution (CC BY) license (http://creativecommons.org/licenses/by/4.0/).
Share and Cite
MDPI and ACS Style
Zhu, L.; Virkar, A.V. Sodium, Silver and Lithium-Ion Conducting β″-Alumina + YSZ Composites, Ionic Conductivity and Stability. Crystals 2021, 11, 293. https://doi.org/10.3390/cryst11030293
AMA Style
Zhu L, Virkar AV. Sodium, Silver and Lithium-Ion Conducting β″-Alumina + YSZ Composites, Ionic Conductivity and Stability. Crystals. 2021; 11(3):293. https://doi.org/10.3390/cryst11030293
Chicago/Turabian StyleZhu, Liangzhu, and Anil V. Virkar. 2021. "Sodium, Silver and Lithium-Ion Conducting β″-Alumina + YSZ Composites, Ionic Conductivity and Stability" Crystals 11, no. 3: 293. https://doi.org/10.3390/cryst11030293
Note that from the first issue of 2016, this journal uses article numbers instead of page numbers. See further details here.