Study on Nanofibrous Catalysts Prepared by Electrospinning for Methane Partial Oxidation

School of Materials Science and Engineering, University of Jinan, Jinan 250022, China
*
Author to whom correspondence should be addressed.
Catalysts 2019, 9(5), 479; https://doi.org/10.3390/catal9050479
Submission received: 4 April 2019
/
Revised: 14 May 2019
/
Accepted: 17 May 2019
/
Published: 23 May 2019
(This article belongs to the Special Issue Rational Design of Non-precious Metal Oxide Catalysts by Means of Advanced Synthetic and Promotional Routes)
Abstract
:Electrospinning is a simple and efficient technique for fabricating fibrous catalysts. The effects of preparation parameters on catalyst performance were investigated on fibrous Ni/Al2O3 catalysts. The catalyst prepared with H2O/C2H5OH solvent showed higher catalytic activity than that with DMF/C2H5OH solvent because of the presence of NiO in the catalyst prepared with DMF/C2H5OH solvent. The metal ion content of the precursor also influences catalyst properties. In this work, the Ni/Al2O3 catalyst prepared with a solution containing the metal ion content of 30 wt % demonstrated the highest Ni dispersion and therefore the highest catalytic performance. Additionally, the Ni dispersion decreased as calcination temperature was enhanced from 700 to 900 °C due to the increased Ni particle sizes, which also caused a high reduction temperature and low catalytic activity in methane partial oxidation. Finally, the fibrous Ni/Al2O3 catalysts can achieve high syngas yields at high reaction temperatures and high gas flow rates.
1. Introduction
Electrospinning has been developed to fabricate one-dimensional materials with controllable fiber diameters, morphologies and compositions. Electrospun nanofibers have special features, such as hierarchically porous structure and high surface area, which have been successfully applied in various fields such as nanocatalysts, filtration, biomedical, optical electronics and electrodes for energy conversion or storage devices [1,2,3,4,5].
Ni/Al2O3 fibrous catalysts prepared by electrospinning have applied in catalytic methane reforming [1,6,7]. Ni nanoparticles can be in situ formed on the nanofiber surface via reducing catalyst precursor NiAl2O4. The fibrous structure of the catalysts is stable up to 1000 °C [6]. Moreover, the fibrous structure has a large void fraction (about 95%), which enables operation at high gas hourly space velocities through catalyst bed. It matches with the fast reaction of methane partial oxidation, which can be completed within a contact time of sub-milliseconds [8,9]. Therefore, the fibrous catalysts can produce high syngas yields [1].
Catalyst precursor solution greatly affects the electrospinning process via viscosity and evaporation [2]. To the best of our knowledge, the effect of preparation parameters on electrospun catalyst has not been reported previously. This study has investigated the effects of solvent, metal ion content and calcination temperature on catalyst properties, including crystallinity, particle size, microstructure, reducibility and catalytic performance. The preparation parameters were optimized to achieve high performance of methane partial oxidation (POM). The effects of reaction parameters on catalyst properties was also studied to utilize the advantages of fibrous catalysts.
2. Experimental
2.1. Catalyst Preparation
The fibrous Ni/Al2O3 catalysts were prepared by electrospinning, and the electrospinning process was started with preparing a spinning solution. A certain amount of polyvinyl pyrrolidone (PVP, molecular weight = 1.3 × 10⁶, Shanghai Dibo Chemical Technology Co., Ltd., Shanghai, China) was dissolved in 2.0 g C2H5OH (≥99.7 wt %, Sinopharm Chemical Reagent Co., Ltd., Shanghai, China) and 8.0 g H2O to prepare a PVP solvent. Al(NO3)3·9H2O (≥99.0 wt %, Sinopharm Chemical Reagent Co., Ltd., Shanghai, China) and Ni(NO3)2·6H2O (≥99.0 wt %, Sinopharm Chemical Reagent Co., Ltd., Shanghai, China) were dissolved in the solvent to form the catalyst with the Ni content of 30 wt % in Ni/Al2O3, and the Ni content was same for all catalysts. The electrospinning solutions with different metal ion contents are denoted CX (X = 10, 20, 30 and 40), where X represents the metal ion content, defined as solute (nitrate) weight percentage in precursor solution (solute + solvent). The ratio between solvent and solute in the C10, C20, C30 and C40 catalysts was 8.7:1, 4:1, 2.2:1 and 1.5:1, respectively.
Electrospinning was conducted on a device (Ucalery ET-2535H, Beijing, China) with a spinning distance of 30cm driven by a applied voltage of 19 kV. The feeding rate was maintained at 0.05 mm min−1. The sample was calcined at 800 °C for 1 h in air.
The effect of solvents was compared by using the catalysts with 20 wt % metal ion content. Only H2O in the solvent was changed to DMF (≥99.5 wt %, Sinopharm Chemical Reagent Co., Ltd., Shanghai, China), and the weight ratio to distilled water was 4:1. Other preparation parameters are the same. In addition, the catalyst prepared with a metal ion content of 30% was calcined at 700, 800 and 900 °C, separately, to study the effect of calcination temperature on catalyst properties.
2.2. Catalyst Characterisation
Scanning electron microscopy (SEM) images of catalyst microstructure were acquired with a FEI QUANTA FEG 250 microscope. Crystal sizes were measured using an X-ray diffractometer (XRD, Bruker D8 Advance) with Cu-Kα radiation (λ = 0.15408 nm). Temperature-programmed reduction (TPR) was conducted on a Micrometric ChemiSorb 2720 using a 10 mg of catalyst and a feeding gas of 10 vol % H2 in Ar with a gas flow rate of 30 mL min−1. The TPR tests were operated from room temperature to 1000 °C at a heating rate of 10 °C min−1. CO-chemisorption was performed on a Micrometric ChemiSorb 2720 using a 30 mg of catalyst. First, the catalyst was reduced by the TPR process. Next, the catalyst was cooled to room temperature for pulse chemisorption using 5 vol % CO in He.
2.3. Catalytic Reaction
The calcined catalysts were crushed into sheets about 900 μm in size to ensure the similar density of catalyst beds. Catalytic evaluation was tested in a fixed bed quartz tube reactor (inner diameter = 6 mm) with a central K-type thermocouple. 10 mg of the catalyst was pre-reduced in situ by 10 vol % H2 in Ar at 750 °C for 1 h. The reactant gas of CH4, O2 and Ar with a molar ratio of 2:1:17 was introduced into the reactor at 750 °C at a gas flow rate of 800 mL min−1. Reaction products were sampled by a gas chromatography (GC, Shimadzu GC-2014).
3. Results and Discussions
3.1. Effect of Solvent
A solvent is used to dissolve catalyst precursors and polymer, forming electrospinning solution. During the electrospinning, the solvent needs to be evaporated before electrospun fibrous composites reach collectors so as to retain fibrous morphology. Solvent properties affect solution viscosity and solvent evaporation. Therefore, two common solvents, H2O/C2H5OH and DMF/C2H5OH, are employed to investigate the solvent effect. Both catalysts had a metal ion content of 20 wt % and were calcined at 800 °C for 1 h.
3.1.1. XRD
Figure 1 shows the XRD patterns of the catalysts prepared with different solvents. The catalyst prepared with the H2O/C2H5OH solvent has no NiO diffraction peaks while the catalyst prepared with the DMF/C2H5OH solvent shows NiO peaks, indicating Ni segregation during electrospinning. The segregation might be caused by the solubility difference of two metal ions in the two solvents. Ni(NO3)2·6H2O has a lower solubility in the DMF/C2H5OH than the H2O/C2H5OH, while Al(NO3)3·9H2O has the similar solubility in the two solvents (Table 1). The lower solubility of Ni(NO3)2·6H2O in the DMF/C2H5OH causes the segregation during drying electrospun fibrous composites. The phase segregation also resulted in the higher crystallinity of NiAl2O4 and Al2O3. After reduction, Ni presents in both catalysts while the catalyst prepared with the DMF/C2H5OH solvent shows the larger Ni crystal sizes due to NiO reduction.
3.1.2. SEM
The morphologies of the reduced catalysts prepared with different solvents are presented in Figure 2. The fibrous structure has high void fraction and therefore achieves fast mass transfer [10]. Figure 2a shows the morphology of the catalyst prepared with the H2O/C2H5OH solvent, uniform Ni particles anchored on the surface of fibrous support. As shown in Figure 2b, some large Ni particles appeared on the catalyst surface prepared with the DMF/C2H5OH solvent, which was attributed to NiO reduction.
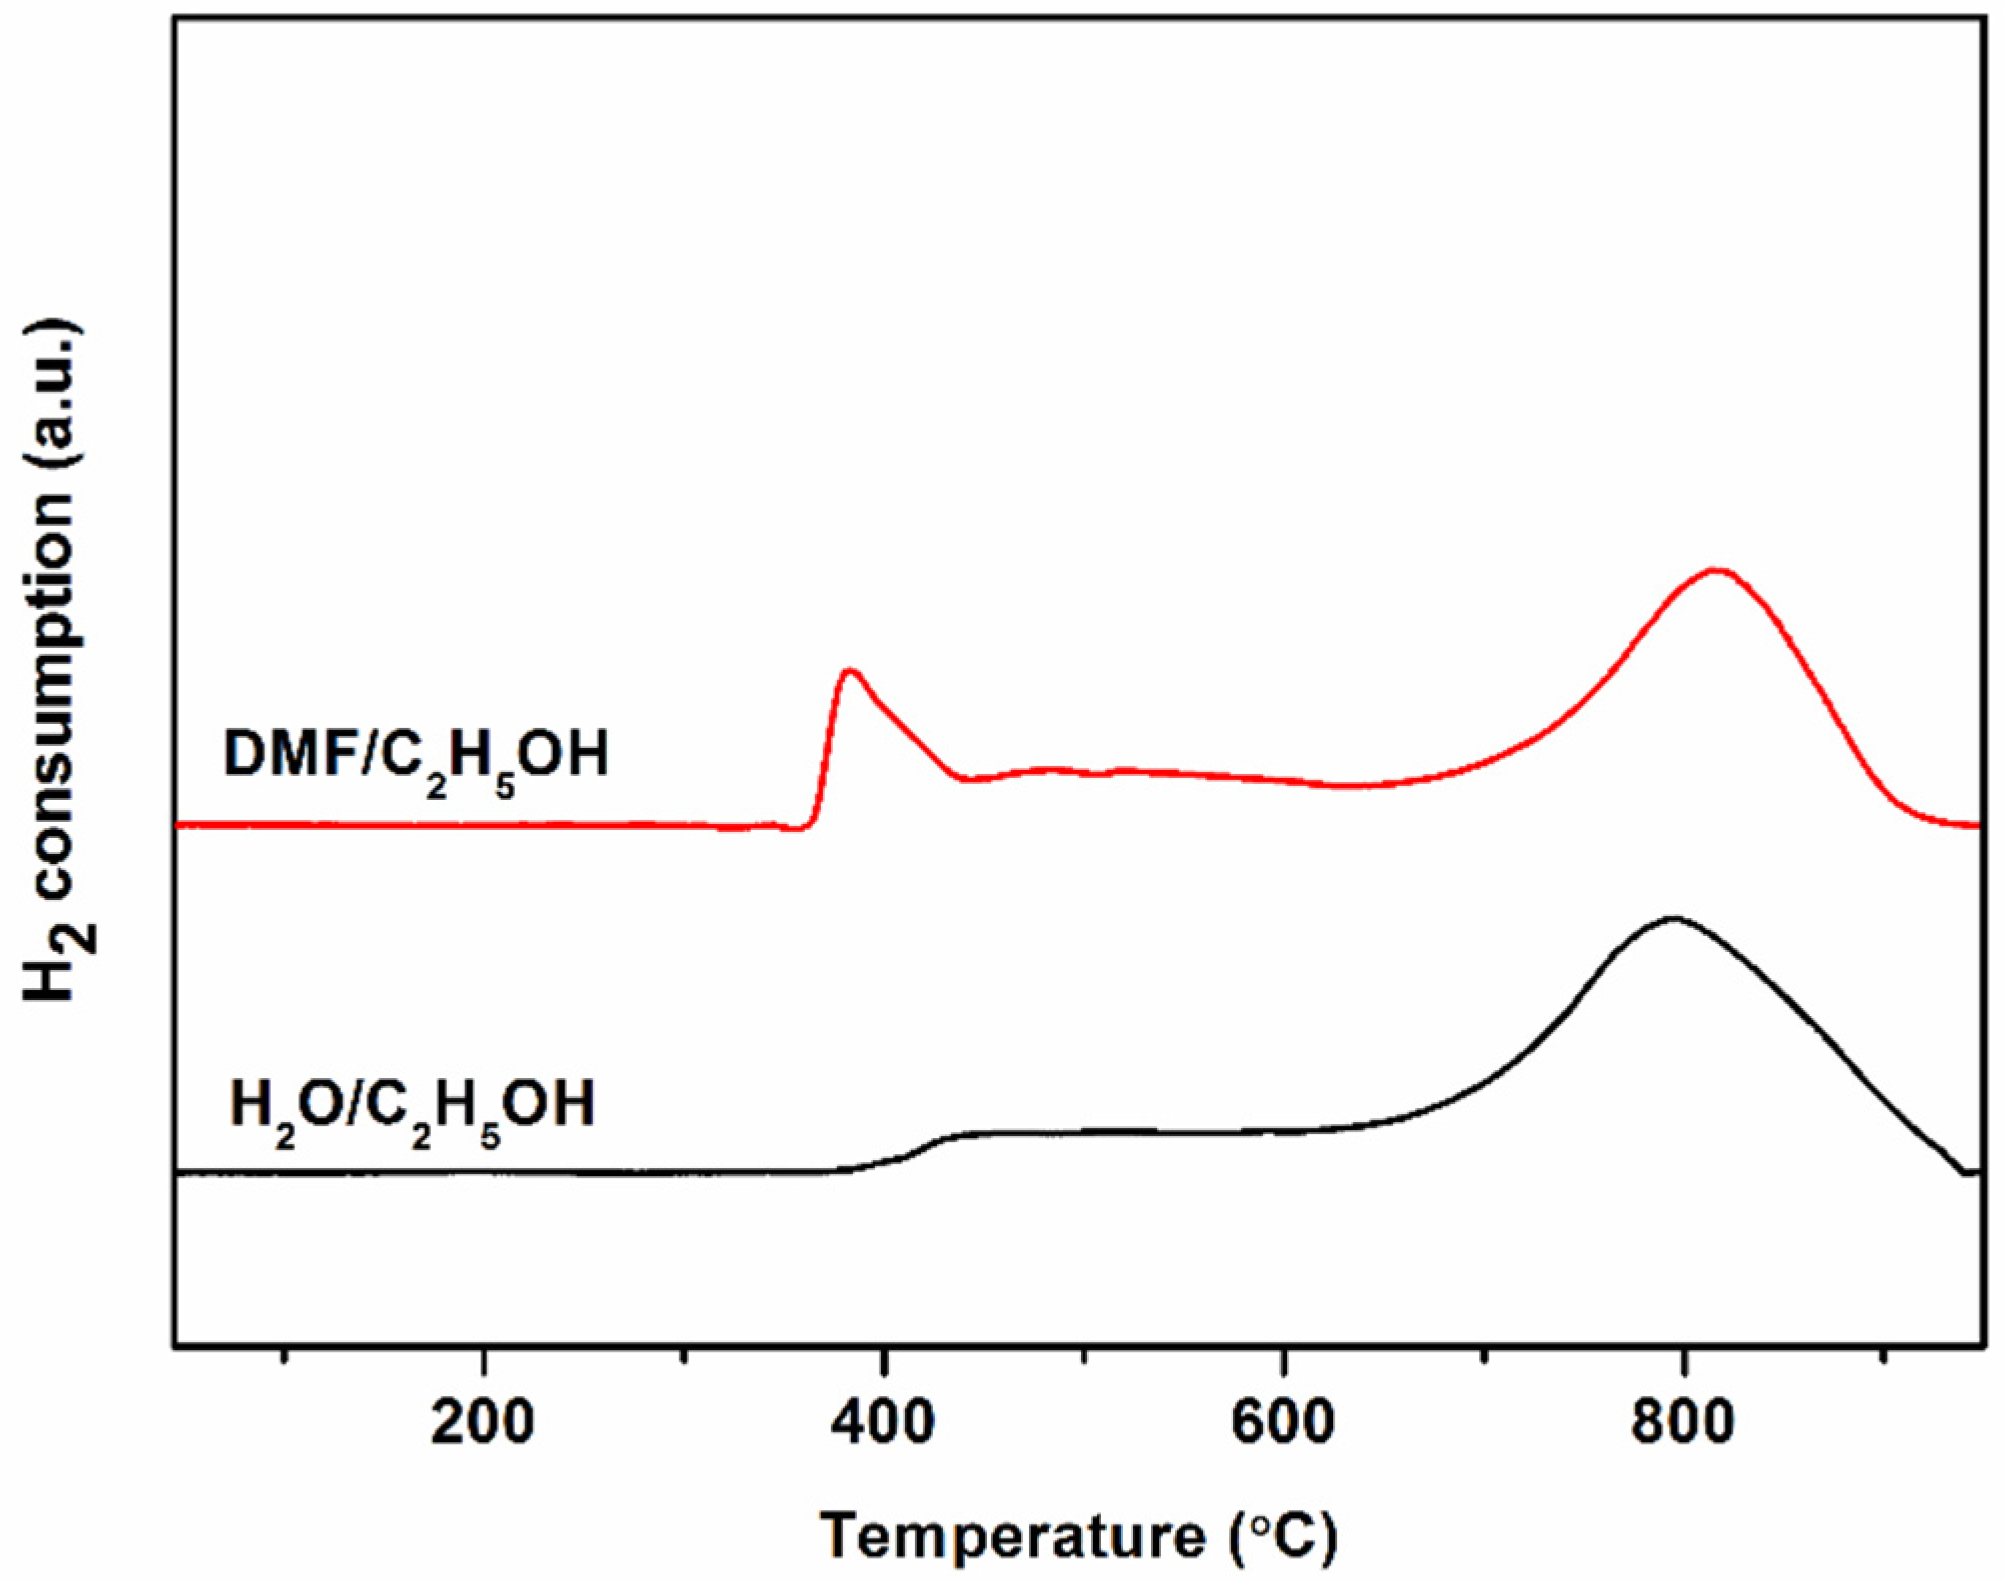
3.1.3. TPR and CO-Chemisorption
TPR was carried out on fibrous catalysts to investigate reducibility. Figure 3 shows that the TPR profiles of the catalysts consist of two reduction peaks centered at 500 and 800 °C, respectively. NiO reduction occurs at low temperatures (400–600 °C) while NiAl2O4 reduction takes place at temperatures above 600 °C [6,11]. For the catalyst prepared with the DMF/C2H5OH solvent, the NiO reduction peak is stronger than the catalyst prepared with the H2O/C2H5OH solvent. The H2 consumption peak areas and reducibilities are compared in Table 2. The reducibility of the catalyst prepared with the DMF/C2H5OH solvent is lower than that of the catalyst prepared with the H2O/C2H5OH solvent. It might be attributed to Ni segregation because the Ni segregation causes NiO aggregation on the fiber surface, and the formed large NiO particles cause a decrease in reducibility. In addition, the Ni dispersion of the catalyst prepared with the DMF/C2H5OH solvent is smaller than that of the catalyst prepared with the H2O/C2H5OH solvent (Table 2) because the large Ni particles formed by NiO reduction decrease the Ni dispersion.
3.1.4. Catalytic Performance
Figure 4 shows catalyst performance during methane partial oxidation at 750 °C and a gas flow rate of 800 mL∙min−1. The catalyst prepared with the DMF/C2H5OH solvent generated a low methane conversion of about 10%, which degraded rapidly. According to the TPR results of the spent catalysts in Figure 5, a substantial amount of Ni particles in the catalyst prepared with the DMF/C2H5OH solvent were oxidized into NiO during the POM. In contrast, there is no obvious NiO reduction peak in the catalyst prepared with the H2O/C2H5OH solvent as the fresh catalyst. Our previous study shows the catalytic activity is mainly contributed by Ni-NiOx particles formed from NiAl2O4 reduction rather than Ni particles formed from NiO reduction. Therefore, the catalyst prepared with the H2O/C2H5OH solvent demonstrated a high and stable methane conversion of 30%, which is consistent with the results of Ni dispersion in Table 2.
3.2. Effect of Metal Ion Content
During electrospinning, electrical filed force pulls solution drop from spinneret to form a jet. Metal ion content affects solution viscosity, electrical filed force and final ceramic fibers. Therefore, the effect of metal ion content was investigated. All catalysts were prepared with the H2O/C2H5OH solvent and calcined at 800 °C for 1 h.
3.2.1. XRD
Figure 6 exhibits the XRD patterns of the catalyst prepared with different metal ion contents. As the metal ion content is increased, NiO phase started to present, indicating Ni segregation. It is because Ni prefers to accumulate on the surface in NiO-Al2O3 system [12,13]. As shown in Figure 6a, calculated using the Scherrer equation, the NiAl2O4 crystal sizes of the C10, C20, C30 and C40 catalysts are 9.7, 8.5, 8.0 and 7.5 nm, respectively. The NiAl2O4 crystal sizes decrease as the metal ion content is increased, which is because NiO presence dispersed NiAl2O4 phase, inhibiting NiAl2O4 growth. After reduction, Ni peaks are observed in addition to the NiAl2O4/Al2O3 peaks.
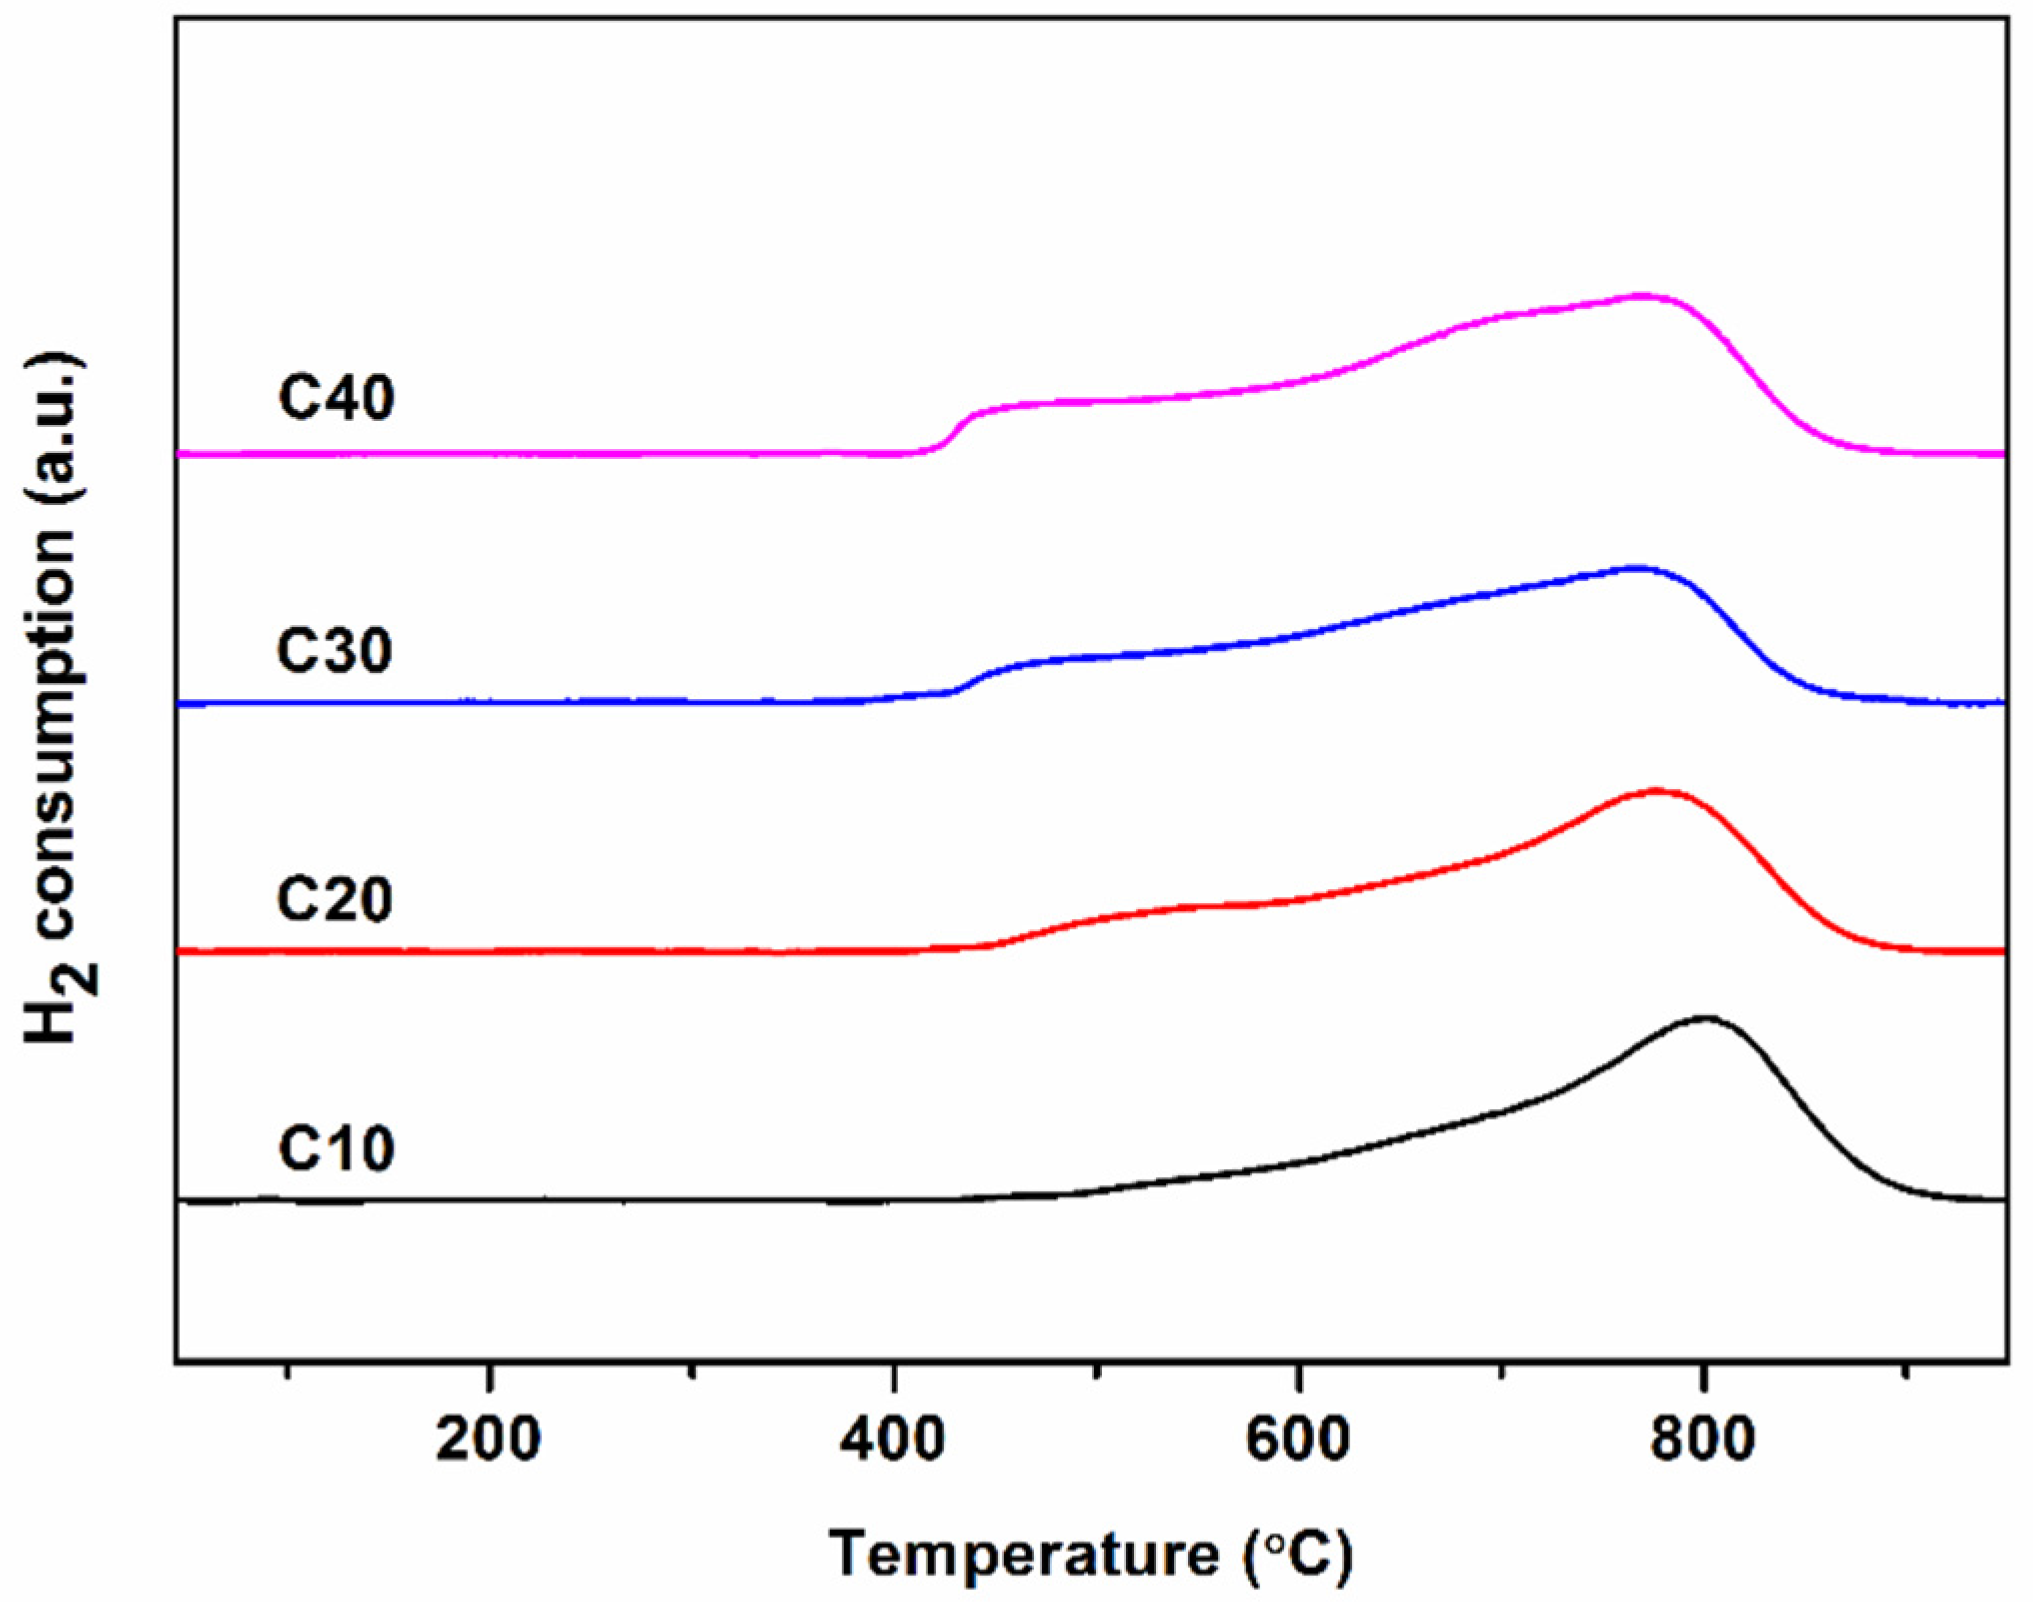
3.2.2. TPR and CO-Chemisorption
As shown in Figure 7, for the C10 catalyst, a single NiAl2O4 reduction peak was centred at 800 °C. When metal ion content was increased to 20 wt %, the reduction peak occurs around 400 °C, which is attributed to NiO reduction. The H2 consumption peak areas and reducibilities are summarized in Table 3. As the metal ion content is increased, the amount of reduced NiO increases, indicating more NiO segregated. Therefore, the reducibility of fibrous catalysts also increases. Furthermore, the Ni dispersion increases with metal ion content up to 30 wt %. However, the Ni dispersion of the C40 catalyst is reduced because of NiO aggregation [14]. Therefore, a certain amount of NiO can improve Ni dispersion.
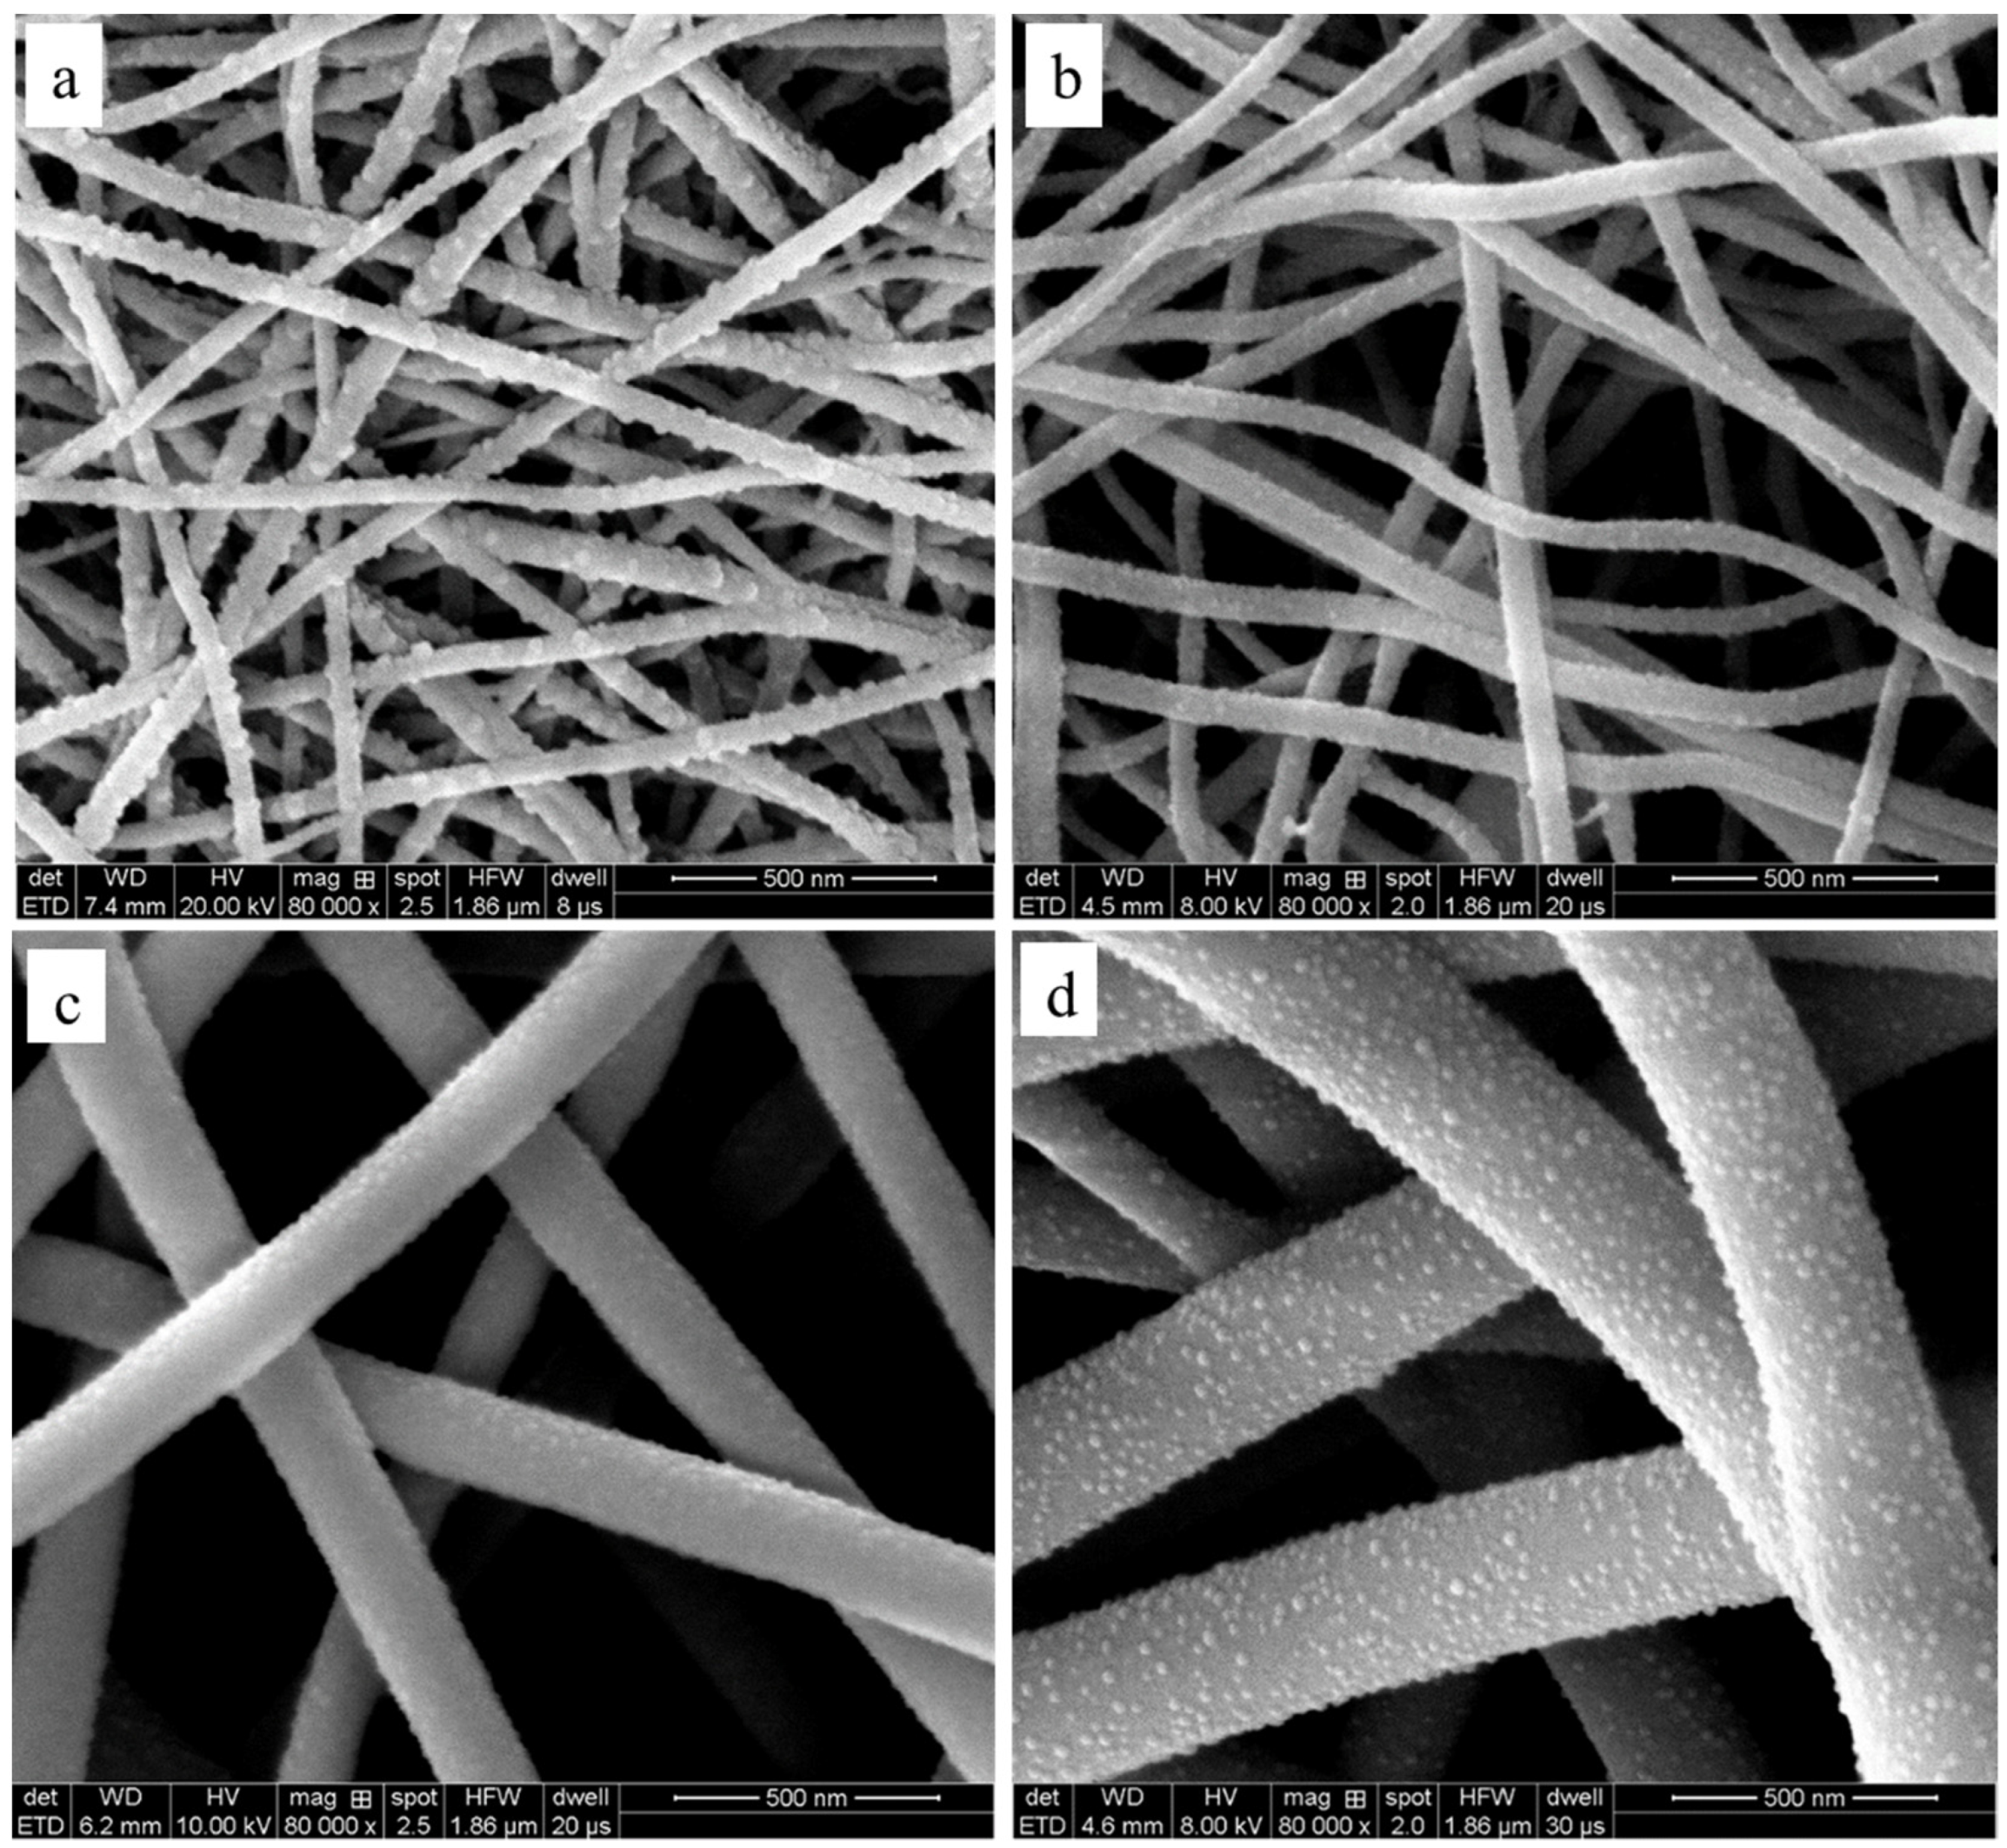
3.2.3. SEM
The morphologies of reduced catalysts made from the solution prepared with different metal ion contents are shown in Figure 8. The fiber diameter increases with the increase of metal ion content from 50 to 300 nm due to the increased solution viscosity and metal ion loading. Ni particles present on fiber surface after reduction. The C10 catalyst shows the largest Ni particle sizes, and Ni particle sizes increase when metal ion content was increased from 20 to 40%. The change of Ni particle sizes are consistent with the change of crystal sizes in Figure 6a, and the large crystal sizes generate the big Ni particles.
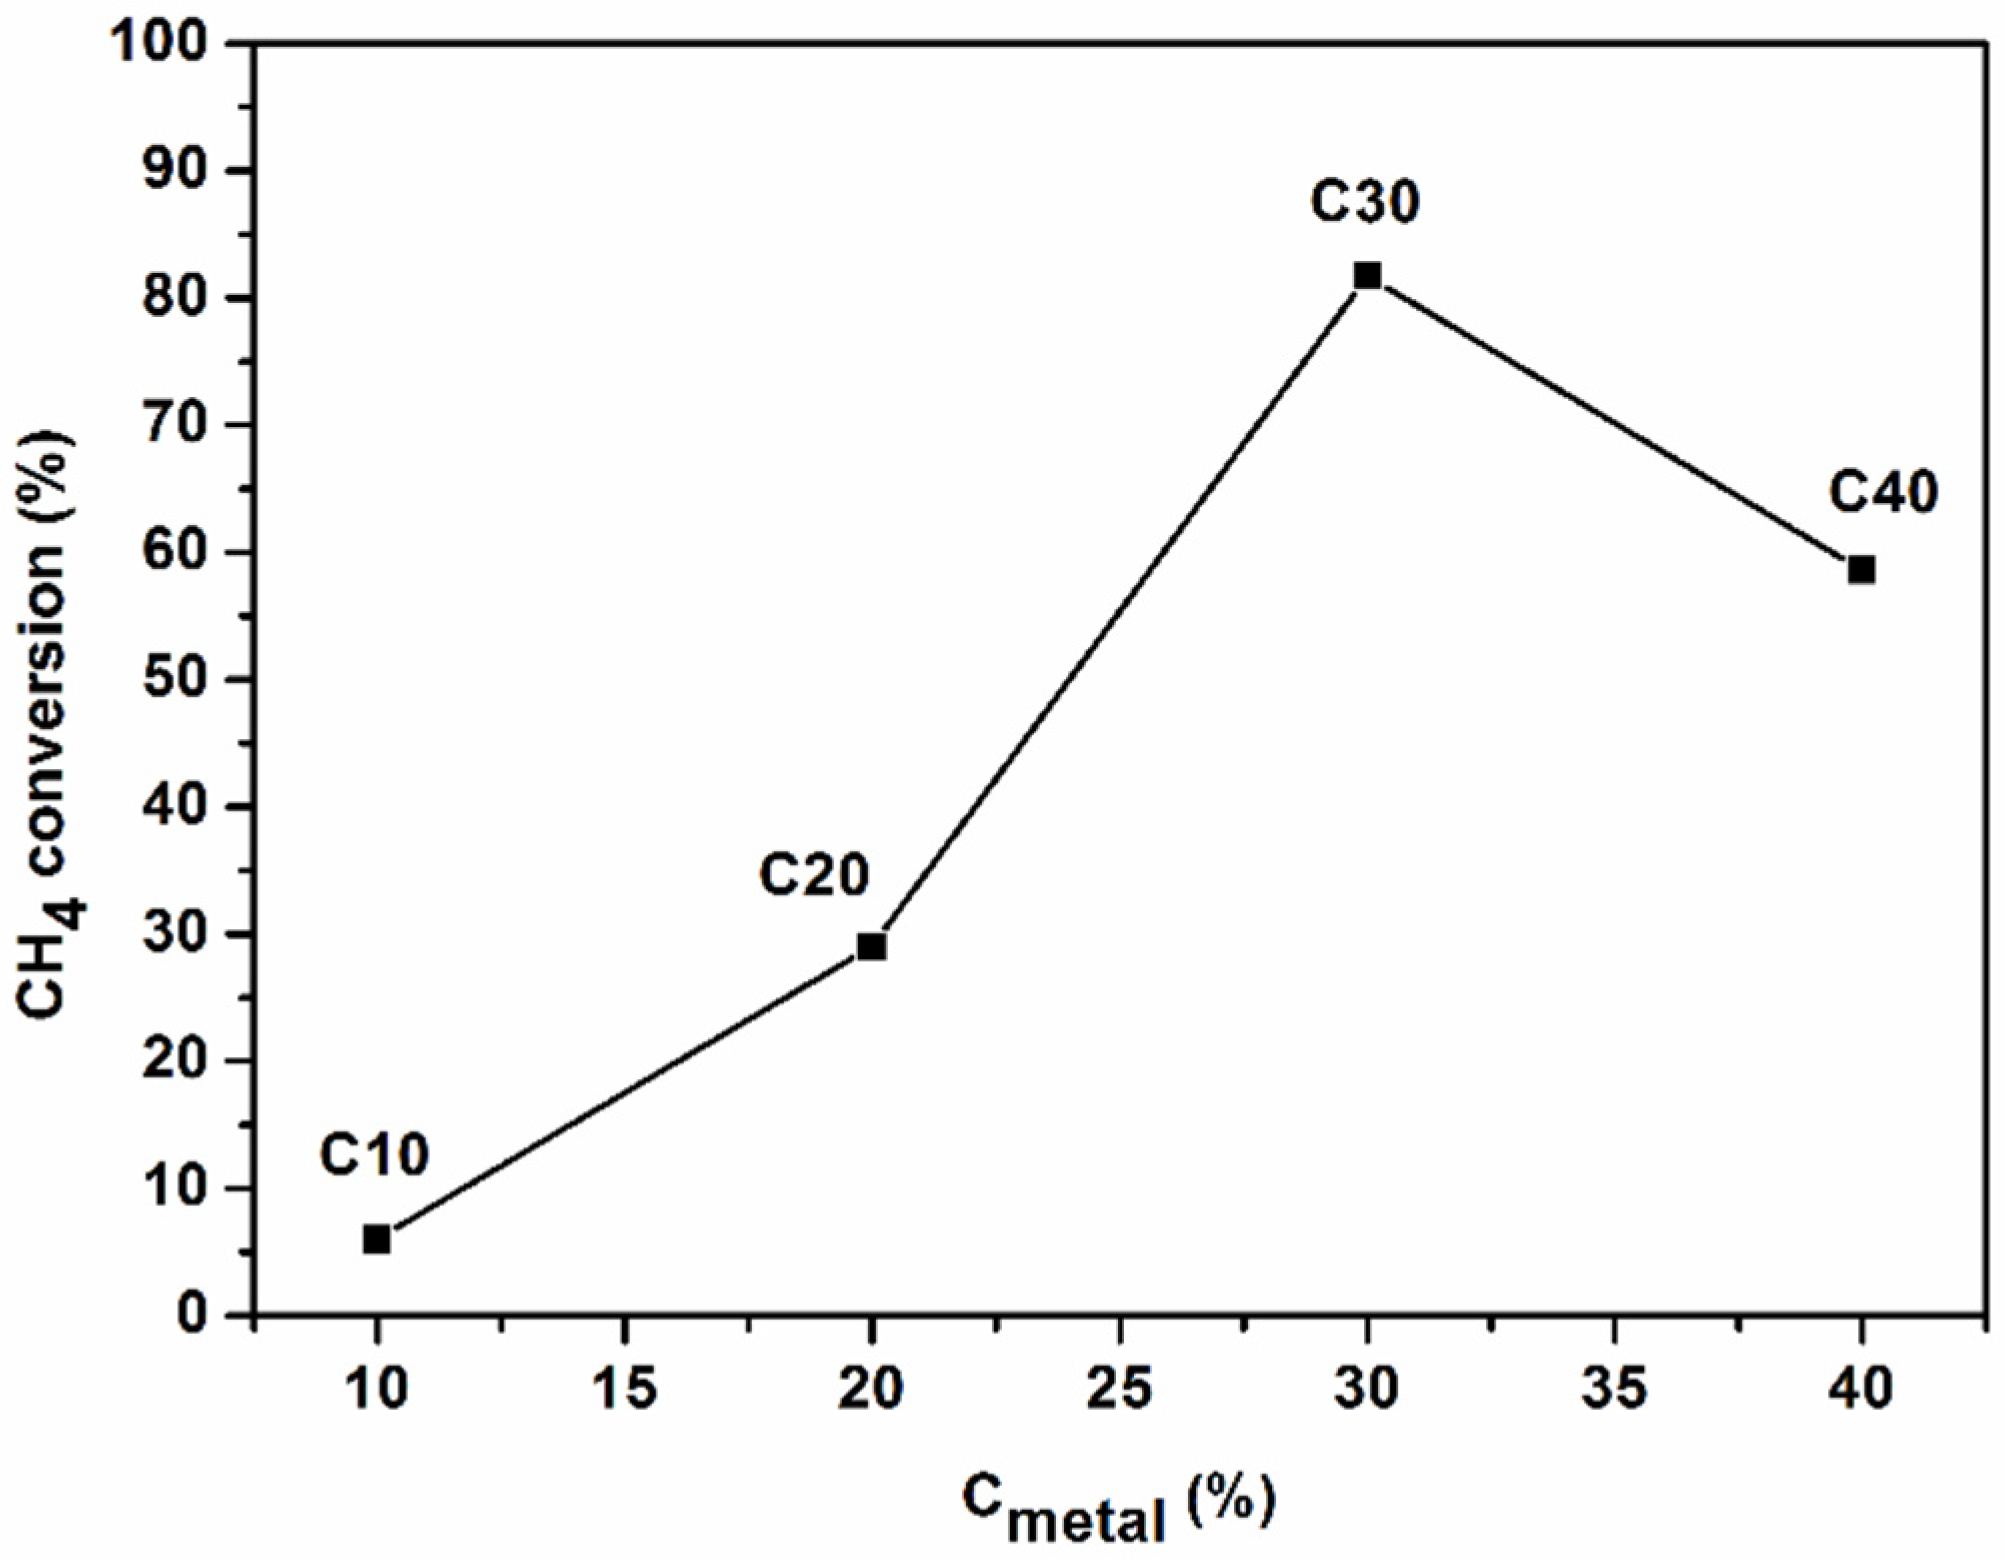
3.2.4. Catalytic Performance
The fibrous catalyst prepared with different metal ion contents were tested for the POM at 750 °C and a gas flow rate of 800 mL min−1 to investigate catalytic activity. As shown in Figure 9, methane conversion improves with metal ion content up to 30 wt %, and further increasing metal ion content to 40 wt % causes a decline in CH4 conversion. The catalytic performance is consistent with Ni dispersion in Table 3, and the higher dispersion contribute the higher catalytic performance. In addition, the Ni particles formed by NiO are easily oxidized during the POM, which has the limited contribution to catalytic performance [14].
The morphologies of the catalysts after 10 h-POM test are shown in Figure 10, and the fibrous structure was stable during reactions. The Ni particles on the C10 and C20 catalyst surface disappeared after the reaction due to Ni oxidation. In contrast, the Ni particles retained for the C30 and C40 catalysts while carbon fibers could be found.
3.3. Effect of Calcination Temperature
Ni catalysts are formed via reducing NiAl2O4, and catalytic activity is affected by catalyst crystallinity, which is determined by calcination temperature. To study the effect of calcination temperature on catalytic activity, the fibrous catalysts were calcined at temperatures ranging from 700 to 900 °C. All catalysts were prepared with a metal ion content of 30 wt % and the H2O/C2H5OH solvent. As shown in Figure 11a, NiAl2O4 has a low crystallinity when calcined at 700 °C. With the increase of calcination temperature, the crystallinity is enhanced, resulting in the increase of crystal sizes. Accordingly, the reduced catalysts show the increased Ni crystal sizes with calcination temperature according to the diffraction intensity in Figure 11b. Calculated by the Scherrer equation, the Ni crystal sizes are 7.4, 8.1 and 9.2 nm at the calcination temperatures of 700, 800 and 900 °C, respectively.
TPR profiles are shown in Figure 12. According to the XRD results, NiAl2O4 crystallinity enhances with the increase of calcination temperature, resulting in the increase of reduction temperature. As shown in Figure 11a, Ni reducibility increases slightly due to the presence of NiO with the increase of calcination temperature. Additionally, the Ni dispersion of catalysts reduces with the increase of calcination temperature, which is attributed to the increase of Ni crystal size [6].
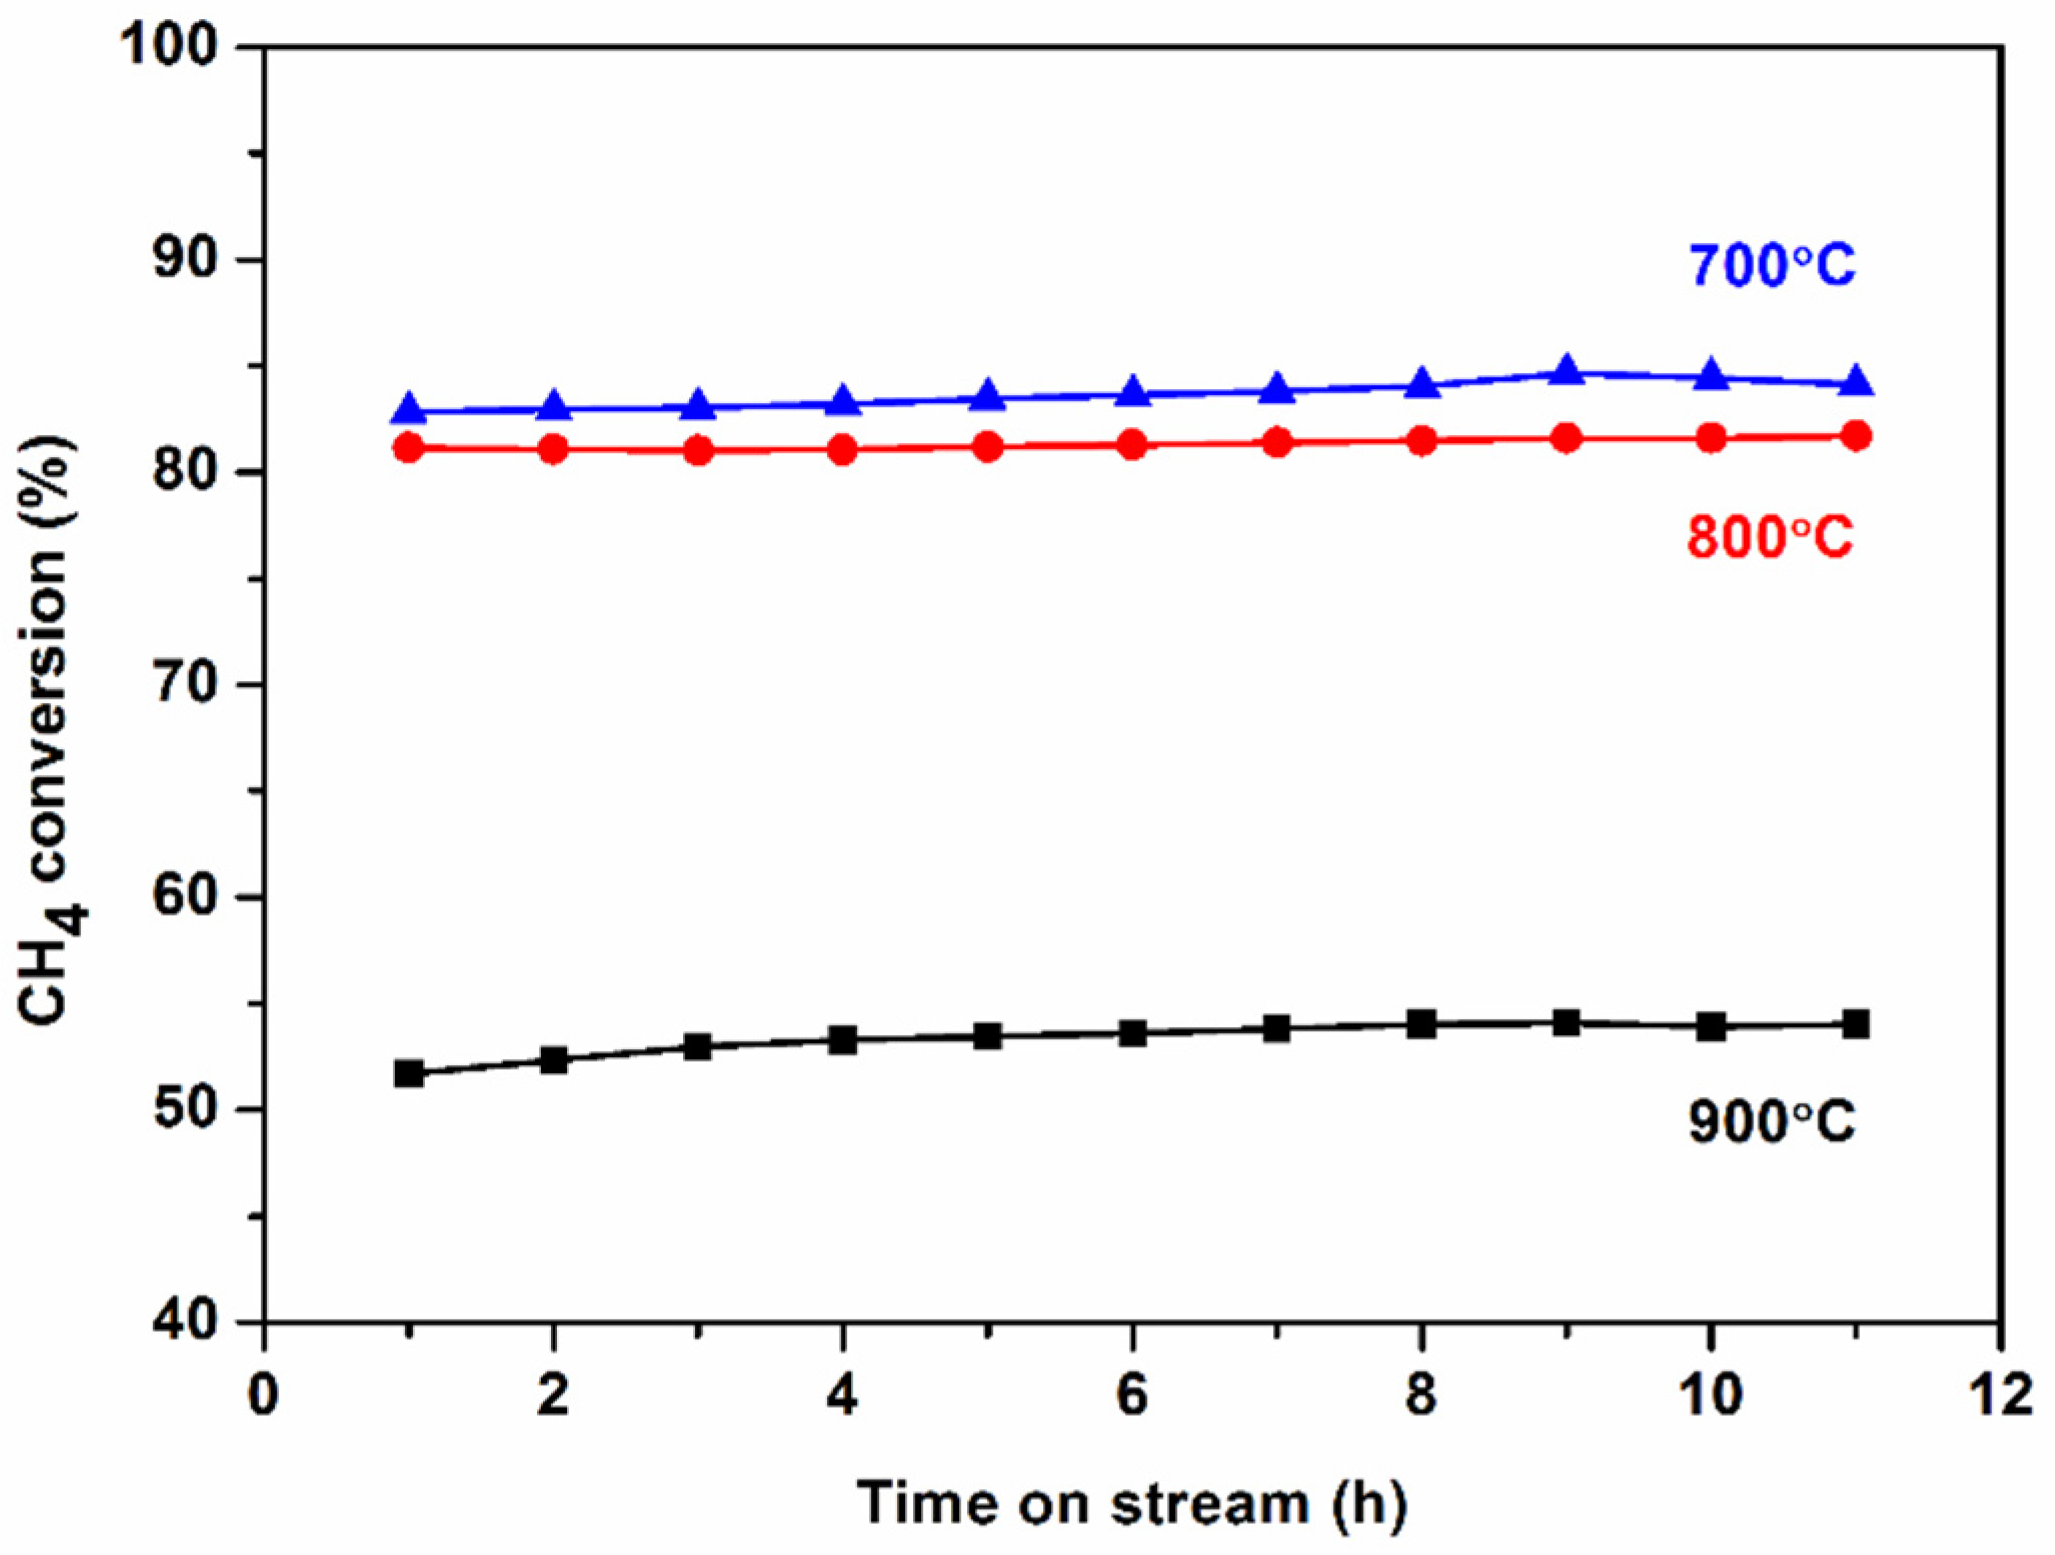
The POM was conducted at 750 °C and a gas flow rate of 800 mL min−1, and the methane conversions are shown in Figure 13. According to the TPR results in Figure 12, the catalysts calcined at 700, 800 and 900 °C were reduced for 1 h at a reduction peak temperature of 615, 750 and 800 °C, respectively, which ensures that the catalysts were pre-reduced to the same extent. The catalyst calcined at the higher temperature showed the lower catalytic activity due to the decrease of Ni dispersion (Table 4).
3.4. Effect of Reaction Temperature and Gas Flow Rate
The fibrous structure has high thermal stability and large void fraction, which makes it possible to operate at high temperatures and gas flow rates. The C30 catalyst was chosen to investigate the effect of reaction conditions on catalytic activity. Figure 14 shows that CH4 conversion increases with reaction temperature at a gas flow rate of 1000 mL min−1, and the catalytic reaction rate increases with gas flow rate at 750 °C. Under the reaction conditions of 800 °C and a flow rate of 1000 mL min−1, the selectivity of H2 and CO was 97% and 87%, respectively, and the yield was 9.8 × 10⁵ L Kg−1 h−1 and 4.4 × 10⁵ L Kg−1 h−1, respectively. The H2 and CO yields were calculated according to H2 and CO amounts in the product gas. Therefore, the fibrous Ni/Al2O3 catalyst can generate high syngas yields owing to the fibrous structure.
4. Conclusions
In this study, the effects of preparation parameters on catalyst properties were investigated on electrospun fibrous Ni/Al2O3 catalysts. The catalyst prepared with the H2O/C2H5OH solvent mainly consisted of NiAl2O4, while the catalyst prepared with the DMF/C2H5OH solvent formed NiO due to Ni segregation. The catalytic performance is mainly contributed by the Ni from NiAl2O4 reduction, and therefore the catalytic activity of the catalyst prepared with the H2O/C2H5OH solvent was higher than that of the catalyst prepared with the DMF/C2H5OH solvent. The metal ion content affects catalyst composition, microstructure, reducibility and dispersion and therefore catalytic performance during the POM. The C30 catalyst had the highest catalytic performance. In addition, the higher calcination temperature produced the larger Ni particles due to the larger crystal size of NiAl2O4, which required a high reduction temperature. Therefore, the catalytic activity during the POM decreased with the increase of calcination temperature. Finally, it has been confirmed that the fibrous Ni/Al2O3 catalysts can achieve high syngas yields through the POM owing to the fibrous structure.
Author Contributions
Conceptualization, Y.M. (Yuyao Ma) and D.D.; methodology, Y.M. (Yuyao Ma), Y.M. (Yuxia Ma), M.L. and Y.C.; software, Y.M. (Yuyao Ma); validation, X.H., Z.Y. and D.D.; formal analysis, Y.M. (Yuyao Ma), Y.M. (Yuxia Ma) and D.D.; investigation, Y.M. (Yuyao Ma), Y.M. (Yuxia Ma), M.L. and Y.C.; resources, D.D.; data curation, Y.M. (Yuyao Ma), M.L. and Y.C.; writing—original draft preparation, Y.M. (Yuyao Ma); writing—review and editing, D.D.; visualization, X.H., Z.Y. and D.D.; supervision, X.H., Z.Y. and D.D.; project administration, D.D.; funding acquisition, D.D.
Funding
This research was funded by Natural Science Foundation of Shandong Province (ZR2017MEM022) and Shandong Province Key Research and Development Program (2018GGX102037).
Acknowledgments
D. H. Dong acknowledges the startup funding provided by the University of Jinan. The study is a part of the projects of Natural Science Foundation of Shandong Province (ZR2017MEM022) and Shandong Province Key Research and Development Program (2018GGX102037).
Conflicts of Interest
The authors declare no conflict of interest. The funder played a decisive role in the design of the study; in the collection, analyses or interpretation of data; in the writing of the manuscript and in the decision to publish the results.
References
- Wang, Z.; Cheng, Y.; Shao, X.; Veder, J.P.; Hu, X.; Ma, Y.; Wang, J.; Xie, K.; Dong, D.; Jiang, S.P.; et al. Nanocatalysts anchored on nanofiber support for high syngas production via methane partial oxidation. Appl. Catal. A 2018, 565, 119–126. [Google Scholar] [CrossRef]
- Dai, Y.; Liu, W.; Formo, E.; Sun, Y.; Xia, Y. Ceramic nanofibers fabricated by electrospinning and their applications in catalysis, environmental science, and energy technology. Polym. Adv. Technol. 2011, 22, 326–338. [Google Scholar] [CrossRef]
- Lasprilla-Botero, J.; Álvarez-Láinez, M.; Lagaron, J.M. The influence of electrospinning parameters and solvent selection on the morphology and diameter of polyimide nanofibers. Materi. Today Commun. 2018, 14, 1–9. [Google Scholar] [CrossRef]
- Bhardwaj, N.; Kundu, S.C. Electrospinning: A fascinating fiber fabrication technique. Biotechnol. Adv. 2010, 28, 325–347. [Google Scholar] [CrossRef] [PubMed]
- Thavasi, V.; Singh, G.; Ramakrishna, S. Electrospun nanofibers in energy and environmental applications. Energy Environ. Sci. 2008, 1, 205–221. [Google Scholar] [CrossRef]
- Wang, Z.; Hu, X.; Dong, D.; Parkinson, G.; Li, C.Z. Effects of calcination temperature of electrospun fibrous Ni/Al2O3 catalysts on the dry reforming of methane. Fuel Process. Technol. 2017, 155, 246–251. [Google Scholar] [CrossRef]
- Liu, L.; Wang, S.; Guo, Y.; Wang, B.; Rukundo, P.; Wen, S.; Wang, Z.-J. Synthesis of a highly dispersed Ni/Al2O3 catalyst with enhanced catalytic performance for CO2 reforming of methane by an electrospinning method. Int. J. Hydrog. Energy 2016, 41, 17361–17369. [Google Scholar] [CrossRef]
- Goetsch, D.A.; Schmidt, L.D. Microsecond catalytic partial oxidation of alkanes. Science 1996, 271, 1560–1562. [Google Scholar] [CrossRef]
- Hickman, D.A.; Schmidt, L.D. Production of syngas by direct catalytic-oxidation of methane. Science 1993, 259, 343–346. [Google Scholar] [CrossRef] [PubMed]
- Reichelt, E.; Heddrich, M.P.; Jahn, M.; Michaelis, A. Fiber based structured materials for catalytic applications. Appl. Catal. A 2014, 476, 78–90. [Google Scholar] [CrossRef]
- Sahli, N.; Petit, C.; Roger, A.C.; Kiennemann, A.; Libs, S.; Bettahar, M. Ni catalysts from NiAl2O4 spinel for CO2 reforming of methane. Catal. Today 2006, 113, 187–193. [Google Scholar] [CrossRef]
- Jiménez-González, C.; Boukha, Z.; De Rivas, B.; Delgado, J.J.; Cauqui, M.Á.; González-Velasco, J.R.; Gutiérrez-Ortiz, J.I.; López-Fonseca, R. Structural characterisation of Ni/alumina reforming catalysts activated at high temperatures. Appl. Catal. A 2013, 466, 9–20. [Google Scholar] [CrossRef]
- Li, C.; Chen, Y.W. Temperature-programmed-reduction studies of nickel oxide/alumina catalysts: Effects of the preparation method. Thermochim. Acta 1995, 256, 457–465. [Google Scholar] [CrossRef]
- Ma, Y.; Ma, Y.; Zhao, Z.; Hu, X.; Ye, Z.; Yao, J.; Buckley, C.E.; Dong, D. Comparison of fibrous catalysts and monolithic catalysts for catalytic methane partial oxidation. Renew. Energy 2019, 138, 1010–1017. [Google Scholar] [CrossRef]
Figure 1.
XRD patterns of the catalysts with different solvents: (a) Before reduction; (b) after reduction at 750 °C for 1 h.
Figure 1.
XRD patterns of the catalysts with different solvents: (a) Before reduction; (b) after reduction at 750 °C for 1 h.

Figure 2.
SEM images of the reduced catalysts prepared with different solvents: (a) H2O/C2H5OH; (b) DMF/C2H5OH.
Figure 2.
SEM images of the reduced catalysts prepared with different solvents: (a) H2O/C2H5OH; (b) DMF/C2H5OH.

Figure 3.
TPR profiles of the catalysts prepared with different solvents.

Figure 4.
Methane conversion of the catalysts prepared with different solvents during the POM 10 h at 750 °C and a gas flow rate of 800 mL∙min−1.
Figure 4.
Methane conversion of the catalysts prepared with different solvents during the POM 10 h at 750 °C and a gas flow rate of 800 mL∙min−1.

Figure 5.
TPR profiles of the spent catalysts prepared with different solvents.

Figure 6.
XRD patterns of the catalysts with different metal ion contents: (a) Before reduction; (b) after reduction at 750 °C for 1 h.
Figure 6.
XRD patterns of the catalysts with different metal ion contents: (a) Before reduction; (b) after reduction at 750 °C for 1 h.

Figure 7.
TPR profiles of the catalysts prepared with different metal ion contents.

Figure 8.
SEM images of the reduced catalysts made from the solution with different metal ion contents: (a) C10; (b) C20; (c) C30; (d) C40.
Figure 8.
SEM images of the reduced catalysts made from the solution with different metal ion contents: (a) C10; (b) C20; (c) C30; (d) C40.

Figure 9.
Methane conversion of the catalysts prepared with different metal ion contents during the POM for 10 h at 750 °C and a gas flow rate of 800 mL min−1.
Figure 9.
Methane conversion of the catalysts prepared with different metal ion contents during the POM for 10 h at 750 °C and a gas flow rate of 800 mL min−1.

Figure 10.
SEM images of the spent catalysts made from the solution with different metal ion contents: (a) C10; (b) C20; (c) C30; (d) C40.
Figure 10.
SEM images of the spent catalysts made from the solution with different metal ion contents: (a) C10; (b) C20; (c) C30; (d) C40.

Figure 11.
XRD patterns of the catalysts with different calcination temperatures: (a) Before reduction; (b) after reduction at 750 °C for 1 h.
Figure 11.
XRD patterns of the catalysts with different calcination temperatures: (a) Before reduction; (b) after reduction at 750 °C for 1 h.

Figure 12.
TPR profiles of the catalysts prepared at different calcination temperatures.

Figure 13.
Methane conversion of the catalysts prepared at different calcination temperatures during the POM for 10 h at 750 °C and a gas flow rate of 800 mL min−1.
Figure 13.
Methane conversion of the catalysts prepared at different calcination temperatures during the POM for 10 h at 750 °C and a gas flow rate of 800 mL min−1.

Figure 14.
Catalytic performance of the C30 catalyst during the POM changing with operation temperature and gas flow rate.
Figure 14.
Catalytic performance of the C30 catalyst during the POM changing with operation temperature and gas flow rate.


Table 1.
Solubility of nitrates in two solvents.
| Solvent (8 g/2 g) | Ni(NO3)2·6H2O (g) | Al(NO3)3·9H2O (g) |
|---|---|---|
| DMF/C2H5OH | 24.5 | 18.5 |
| H2O/C2H5OH | 35.5 | 19.5 |
Table 2.
Reducibility and Ni dispersion of Ni/Al2O3 catalysts.
| Sample | Peak Area | Reducibility (%) | Ni dispersion (%) |
|---|---|---|---|
| DMF/C2H5OH | 48.3 | 76.6 | 0.05 |
| H2O/C2H5OH | 51.6 | 83.4 | 0.27 |
Table 3.
Reducibility and Ni dispersion of Ni/Al2O3 catalysts.
| Sample | Peak Area | Reducibility (%) | Ni Dispersion (%) |
|---|---|---|---|
| C10 | 50.8 | 81.7 | 0.17 |
| C20 | 51.6 | 83.4 | 0.27 |
| C30 | 52.7 | 85.7 | 0.60 |
| C40 | 57.4 | 95.4 | 0.39 |
Table 4.
Reducibility and Ni dispersion of Ni/Al2O3 catalysts.
| Temperature (°C) | Peak Area | Reducibility (%) | Ni Dispersion (%) |
|---|---|---|---|
| 700 | 50.8 | 81.7 | 0.63 |
| 800 | 52.7 | 85.7 | 0.60 |
| 900 | 55.5 | 91.5 | 0.38 |
© 2019 by the authors. Licensee MDPI, Basel, Switzerland. This article is an open access article distributed under the terms and conditions of the Creative Commons Attribution (CC BY) license (http://creativecommons.org/licenses/by/4.0/).
Share and Cite
MDPI and ACS Style
Ma, Y.; Ma, Y.; Liu, M.; Chen, Y.; Hu, X.; Ye, Z.; Dong, D. Study on Nanofibrous Catalysts Prepared by Electrospinning for Methane Partial Oxidation. Catalysts 2019, 9, 479. https://doi.org/10.3390/catal9050479
AMA Style
Ma Y, Ma Y, Liu M, Chen Y, Hu X, Ye Z, Dong D. Study on Nanofibrous Catalysts Prepared by Electrospinning for Methane Partial Oxidation. Catalysts. 2019; 9(5):479. https://doi.org/10.3390/catal9050479
Chicago/Turabian StyleMa, Yuyao, Yuxia Ma, Min Liu, Yang Chen, Xun Hu, Zhengmao Ye, and Dehua Dong. 2019. "Study on Nanofibrous Catalysts Prepared by Electrospinning for Methane Partial Oxidation" Catalysts 9, no. 5: 479. https://doi.org/10.3390/catal9050479
Note that from the first issue of 2016, this journal uses article numbers instead of page numbers. See further details here.