Research on Optimization Design of SCR Nozzle for National VI Heavy Duty Diesel Engine

1
School of Automotive and Transportation Engineering, Wuhan University of Science and Technology, Wuhan 430081, China
2
Vehicle Emission Control Center, State Environmental Protection Key Laboratory of Vehicle Emission Control and Simulation, Chinese Research Academy of Environmental Sciences, Beijing 100012, China
3
School of Environment, Tsinghua University, Beijing 100084, China
4
Key Laboratory of High Performance Ship of Ministry of Education, Wuhan University of Technology, Wuhan 430063, China
*
Author to whom correspondence should be addressed.
Catalysts 2019, 9(5), 452; https://doi.org/10.3390/catal9050452
Submission received: 9 April 2019
/
Revised: 27 April 2019
/
Accepted: 7 May 2019
/
Published: 16 May 2019
(This article belongs to the Special Issue Aftertreatment DeNOx Systems for Future Light Duty Lean-Burned Emission Regulations)
Abstract
:For the National VI heavy-duty diesel vehicles, NOx emission regulations are becoming more and more stringent, and the selective catalytic reduction (SCR) system has become a necessary device. The design of the adblue nozzle in the SCR system is especially critical, directly affecting the NOx conversion efficiency and deposit formation. According to the structure of a National VI diesel engine exhaust pipe and SCR system, the nozzle is optimized by computational fluid dynamics (CFD) method to avoid the collision between the urea droplets and the exhaust pipe wall, to ensure that the exhaust gas and the urea droplets are as much as possible in full contact to ensure a sufficient urea pyrolysis. With the optimized nozzle, the NH3 distribution uniformity of the inlet face of the SCR catalyst can increase from 0.58 to 0.92. Additionally, test verifications are implemented based on the spray particle size test and the engine bench tests; the results show that the Sauter mean diameter of the optimized nozzle is more decreased than the initial nozzle and that the NOx conversion efficiency of the World Harmonized Transient Cycle (WHTC) and World Harmonized Stationary Cycle (WHSC) cycle improves by nearly 3%; additionally, it can also avoid deposit formation.
1. Introduction
With increasingly stringent diesel emission regulations, Selective Catalytic Reduction (SCR) technology is considered one of the most promising technologies for most post-treatment treatments. As the main diesel engine emission control technology in the national VI stage, there are still many problems to be solved in the application of SCR on diesel vehicles. Among them, the low-temperature NOx conversion efficiency of the Europe 6 SCR system and the need to avoid deposit formation are particularly urgent. The pump, control unit and nozzle complete the quantitative injection and atomization of the adblue together, playing a vital role in the adblue injection system. The research shows, for example, that the nozzle structure has a direct impact on the NOx conversion efficiency and deposit formation of the SCR system [1,2]. If the nozzle installation position or structural design is not well matched, the adblue injection and atomization will be worse, which affects the evaporation and decomposition of the urea.
The SCR adblue injection system is mainly composed of an adblue tank, a control unit, an adblue supply unit, an adblue injection unit, a sensor and corresponding pipelines. Depending on the mode of operation of the adblue injection unit, it can be divided into an air-assisted injection system and an airless injection system. Nowadays, most nozzles are air-assisted because this can generate droplets with a smaller Saunter mean diameter. Additionally, the research by Needham shows that the adblue injection system becomes integrated and that it gradually evolves from an air-assisted system to an airless auxiliary system [3]. The new generation of Denoxtronic’s Adblue Injection System from Bosch is a self-service integrated adblue injection system that does not require external compressed air [4]. The supply unit in the Denoxtronic system delivers the adblue to the spray unit, and the high-speed droplets pass through the spray unit to achieve the quantitative injection and atomization of the adblue. The atomized adblue droplets are approximately 75 μm in diameter. The EcoFitTM UL2 Plus Adblue Injection System from Cummins is also an airless auxiliary adblue injection system [5]. The EcoFitTM Adblue Injector system has a maximum adblue injection volume of 20.5 kg/h and a nebulized droplet diameter of approximately 40 μm, which can be applied to road vehicles and non-road equipment.
Fang et al. [6] found that the NOx conversion efficiency and amount of deposit formation are related to the decomposition rate of the adblue. The faster the decomposition rate of the adblue, the less the amount of deposit that is formed. By optimizing the nozzle structure and improving the spray quality, the NOx conversion can be effectively improved.
Zheng and others [7] visualized the process of the adblue spray process, and found that under steady conditions, there is a critical adblue flow that induces the formation of wall film or sediment. When the actual adblue flow is higher than the critical value, deposits are inevitably formed on the tracheal wall. The critical adblue flow rate at each temperature and space velocity is determined by means of experiments, and it is applied to the adblue injection strategy as the upper limit of the adblue flow rate, which can effectively improve the NOx conversion and avoid the formation of deposits.
Zhang [8] and Zhao [9] studied the influence of the flow of the adblue on the NOx conversion and deposit. The results show that optimizing the injection system can improve the NOx conversion efficiency and reduce the deposit.
In 2013, Chu, from the Shanghai University of Engineering and Technology, [10] found that one of the causes of low NOx conversion and deposits is the poor quality of the spray atomization. The optimization designs can be taken into consideration: selecting the appropriate nozzle position and increasing the number of nozzles to 4 ~6 holes, etc. Additionally, [11,12] show the same results.
In this paper, an air-assistant nozzle is taken as the research object. The multi-phase flow simulation of the nozzle and SCR flow field is carried out to optimize the nozzle structure, which provides a scientific basis to further improve the NOx conversion and to avoid a deposit.
2. SCR System Nozzle Introduction
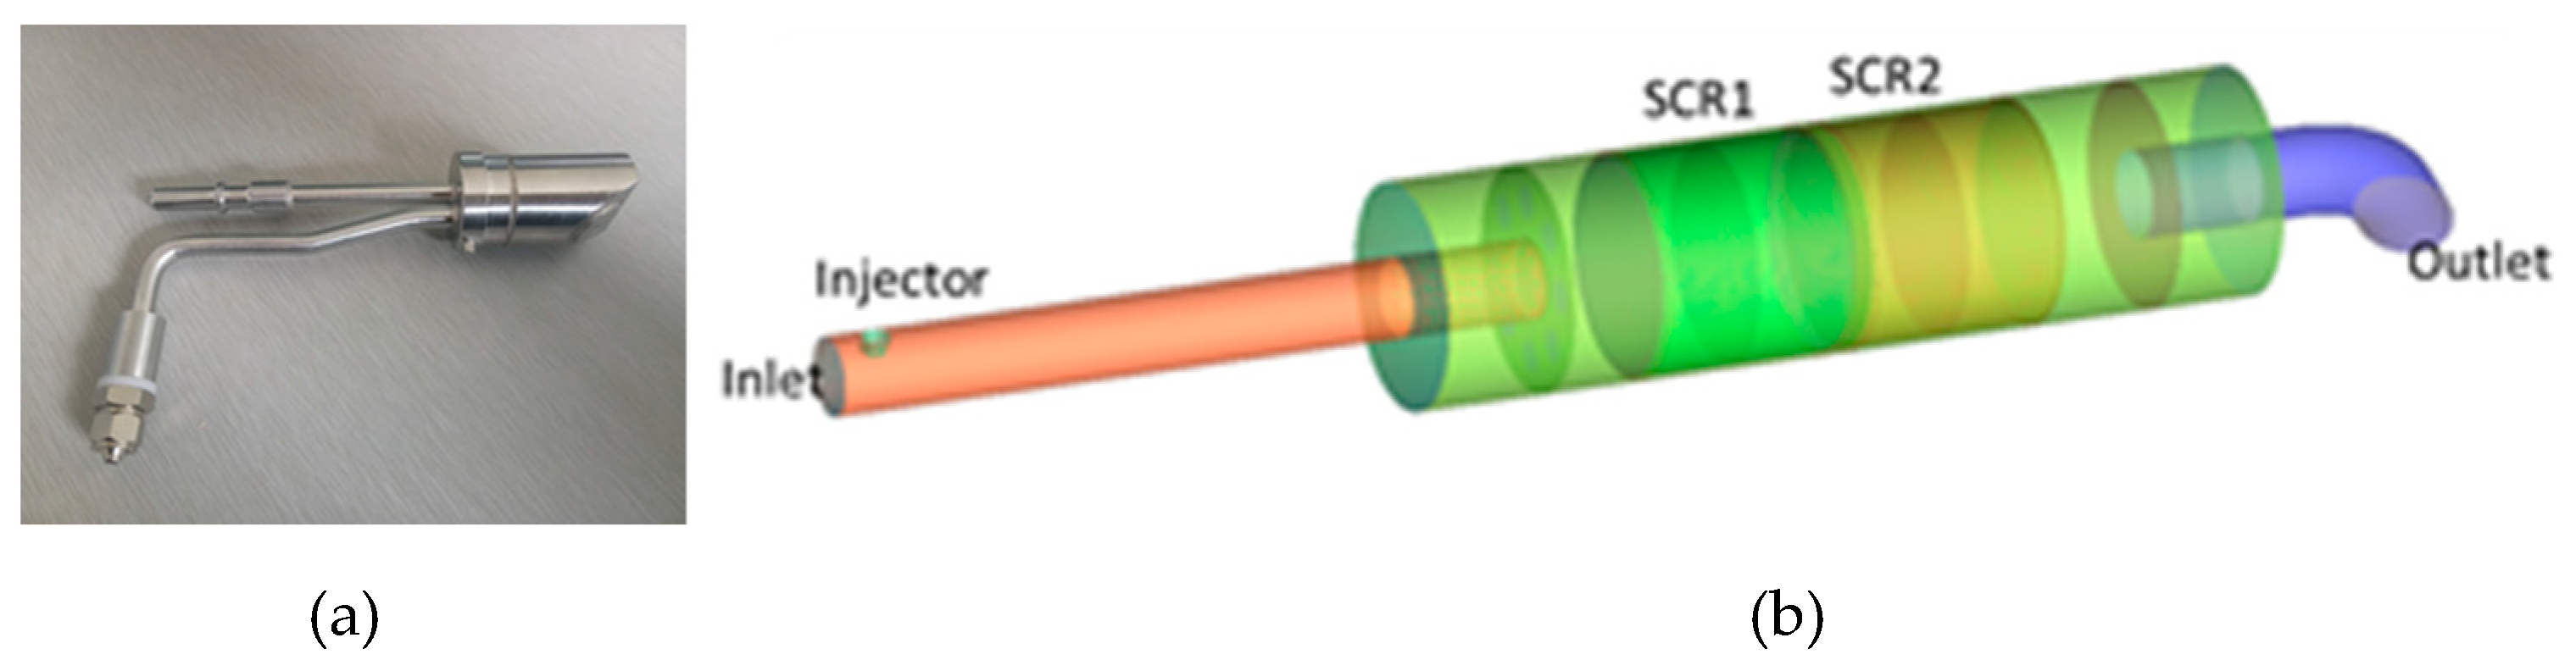
Figure 1 shows an air-assisted adblue nozzle, and the structure of the SCR system of the diesel vehicle. Generally the air-assisted injection system can be divided into the external mixing type and internal mixing type: the external mixing type breaks and atomizes the urea aqueous solution through the impact of the high-speed air flow; the internal mixing type mixes the compressed air into the mixing chamber and mixes with the urea aqueous solution. After the bubble leaves the nozzle, it expands rapidly due to the pressure difference between the internal and external environments, and the breakage of the bubble can for example promote the atomization of the droplet [13]. The air-assisted injection system can achieve a good atomization effect, and it is more convenient and reliable to apply it on the vehicle diesel engine because of the self-contained compressed air on the real vehicle. Therefore, the research object of this paper is determined as an air-assisted adblue nozzle, and it’s an internal mixing type.
When the adblue injection system is working, the diaphragm pump draws in a fixed amount of urea aqueous solution, and pushes the urea aqueous solution at a fixed frequency under the action of the controller; the compressed air is depressurized, enters the mixing chamber and mixes with the urea aqueous solution, before finally being sprayed into the exhaust pipe through the nozzle. For this pneumatic atomizing nozzle, the atomization process is mainly divided into two processes: primary crushing and secondary crushing: (1) When the liquid exists in the form of a liquid column, the movement of the airflow can cause the unstable fluctuation of the gas-liquid interface, resulting in the instability and rupture of the liquid column, followed by the first break, which forms a larger droplet; (2) The large droplet continues to deform and rupture under the action of the air stream, generating a large number of small droplets, which constitutes a secondary crushing process. The gas-liquid flow inside the nozzle has a great influence on the spray field outside the nozzle, and even directly determines the atomization effect [13].
3. CFD Simulation and Model Selection
The Euler-Euler model is mainly used to deal with the flow problem of any multiphase, and it can be calculated that the volume fraction of each phase in the multiphase flow is its largest feature [14]. Commercial software AVL (AVL List Company from Austria)-Fire includes three multi-phase flow models based on the Euler-Euler method, namely the multi-fluid model, homogeneous model and VOF (Volume-of-Fluid Model) model. Among them, the homogeneous model has the lowest precision, which assumes that all phases are uniformly mixed, so only one momentum equation needs to be solved. The VOF model can be used to track the interface of two or more mutually incompatible fluids. In Fire, the VOF equation must be solved by high-order discrete equations. The dependence on the grid is too high. The multi-fluid model requires a complete calculation of the conservation equations for all phases, which represents the basic principle of the Euler-Euler method [15]. In view of the accuracy of the multi-fluid model and the low grid dependence, this paper uses the multi-fluid model to simulate the gas-liquid two-phase flow in the nozzle.
In order to achieve the simulation of the primary fracture, it is necessary to study the fluid properties at the near orifice and the interaction between the gas and liquid phases. In the area far from the nozzle, the Euler/Lagrangian method (DDM dispersion phase model) is used to describe the movement trajectory of the droplet by integrating the motion equation of a large number of particles. Under the specific nozzle structure and operating conditions, the two-phase flow simulation results in the nozzle can provide relevant information at the nozzle outlet, including the fluid velocity, turbulence intensity and mass fraction of each phase. The hole characteristics in the nozzle can also be accurately captured. For the transient calculation of the multiphase flow in the nozzle, select the data of the nozzle at any position and time step, and perform a linear interpolation when calling, for example [16].
The simulation results of the two-phase flow in the nozzle based on the Euler/Eulerian method can be combined with the spray field simulation based on the particle group trajectory through the nozzle interface form, that is to say the former as the boundary condition of the latter. At the nozzle interface, the fluid data, including the fluid velocity, density, and turbulent energy, are transmitted smoothly. The benefits of this combination are: providing more accurate and reliable initial injection conditions: the injection speed and spray cone angle; and obtaining detailed nozzle exit data, including the turbulent kinetic energy and cavitation volume, for a more accurate primary fracture model.
3.1. Droplet Breakage
After the urea aqueous solution is sprayed from the nozzle, the primary crushing and secondary crushing will occur in the exhaust pipe, and will collide and merge with each other under the action of the turbulent diffusion and pulling, accompanied by the simultaneous droplet breaking process, evaporation and wall-impacting process. Theoretically, the order in which the droplets are broken is that the firstly are broken first, followed by the secondary broken. There are many models for simulating droplet breakage, based on different physical backgrounds and numerical algorithms. In general, most models have the size of the initial droplet set within the diameter of the orifice, while for nozzles with a sharp corner structure the initial droplet can be appropriately reduced due to the action of the cavity. This paper mainly studies the cold atomization process of the internal and external spray fields of SCR adblue nozzles. Therefore, only the primary crushing and secondary crushing models are introduced in detail.
3.1.1. Primary Fracture Model
How to identify and quantify the fracture mechanism of the urea aqueous solution is the main problem that needs to be solved to simulate the atomization process. In recent years, domestic and foreign scholars have carried out a large number of spray tests, which have promoted the research progress of the relevant physical processes at the nozzle exit. For different nozzle structures and operating conditions, the study of the fluctuation process of the surface of the liquid core and the influencing factors of the primary fracture is of great significance for understanding the fracture mechanism.
During the flow inside the nozzle, the intensity and frequency of the fluid fluctuations cause a change in the turbulent velocity, causing the formation, development and collapse of the gas core or gas vacuoles, and accelerating the subsequent collapse of the liquid core. The diffuse phase model (DPM) contains two forms of primary fracture: the independent model is used to calculate the erosion of the liquid core, and the primary fracture occurs on the surface of the liquid core. The main feature of the method is that the initial droplet size is smaller than the orifice. The mechanism is therefore different from the first method.
In general, the primary fracture model must be used in conjunction with the secondary fracture model, and the order is sequential. For the DPM simulation method, the criteria for the primary fracture to secondary fracture are the Weber number and the minimum droplet diameter of the droplet. In this paper, the initial crushing model of Blob Injection is used to simulate the primary crushing process of droplets by simulating the phenomenon of cavity and aerodynamics in the nozzle.
3.1.2. Secondary Fracture Model
In this paper, the TAB model is used to simulate the secondary crushing process of droplets. Based on the theory of elastic mechanics, the model is subjected to various forces in the movement, so that the droplet itself vibrates and twists like an elastomer. When the deformation occurs to a certain extent, it will break. The aerodynamic forces in the spray field, the surface tension of the droplets, and the droplet viscosity are similar to the external forces, elastic forces, and damping forces in the mass spring system, respectively [17].
The mother droplet oscillates in the direction of the injection axis, and if that is the case, the mother droplet breaks into smaller droplets. The normal velocity of the sub-droplet is approximately equal to the vibration velocity at the time of the fracture, and at the same time the model can automatically calculate the spray cone angle. Through the energy conservation equation, the Sauter mean diameter of the sub-droplet can be calculated. The calculation result of the droplet radius constitutes the chi-square distribution of the droplet size, and the actual droplet size can be randomly selected from [18]. For the ratio of the mother droplet to the sub-droplet radius, the larger the value is, the smaller the diameter of the sub-droplet is.
3.2. Droplet Evaporation and Urea Decomposition
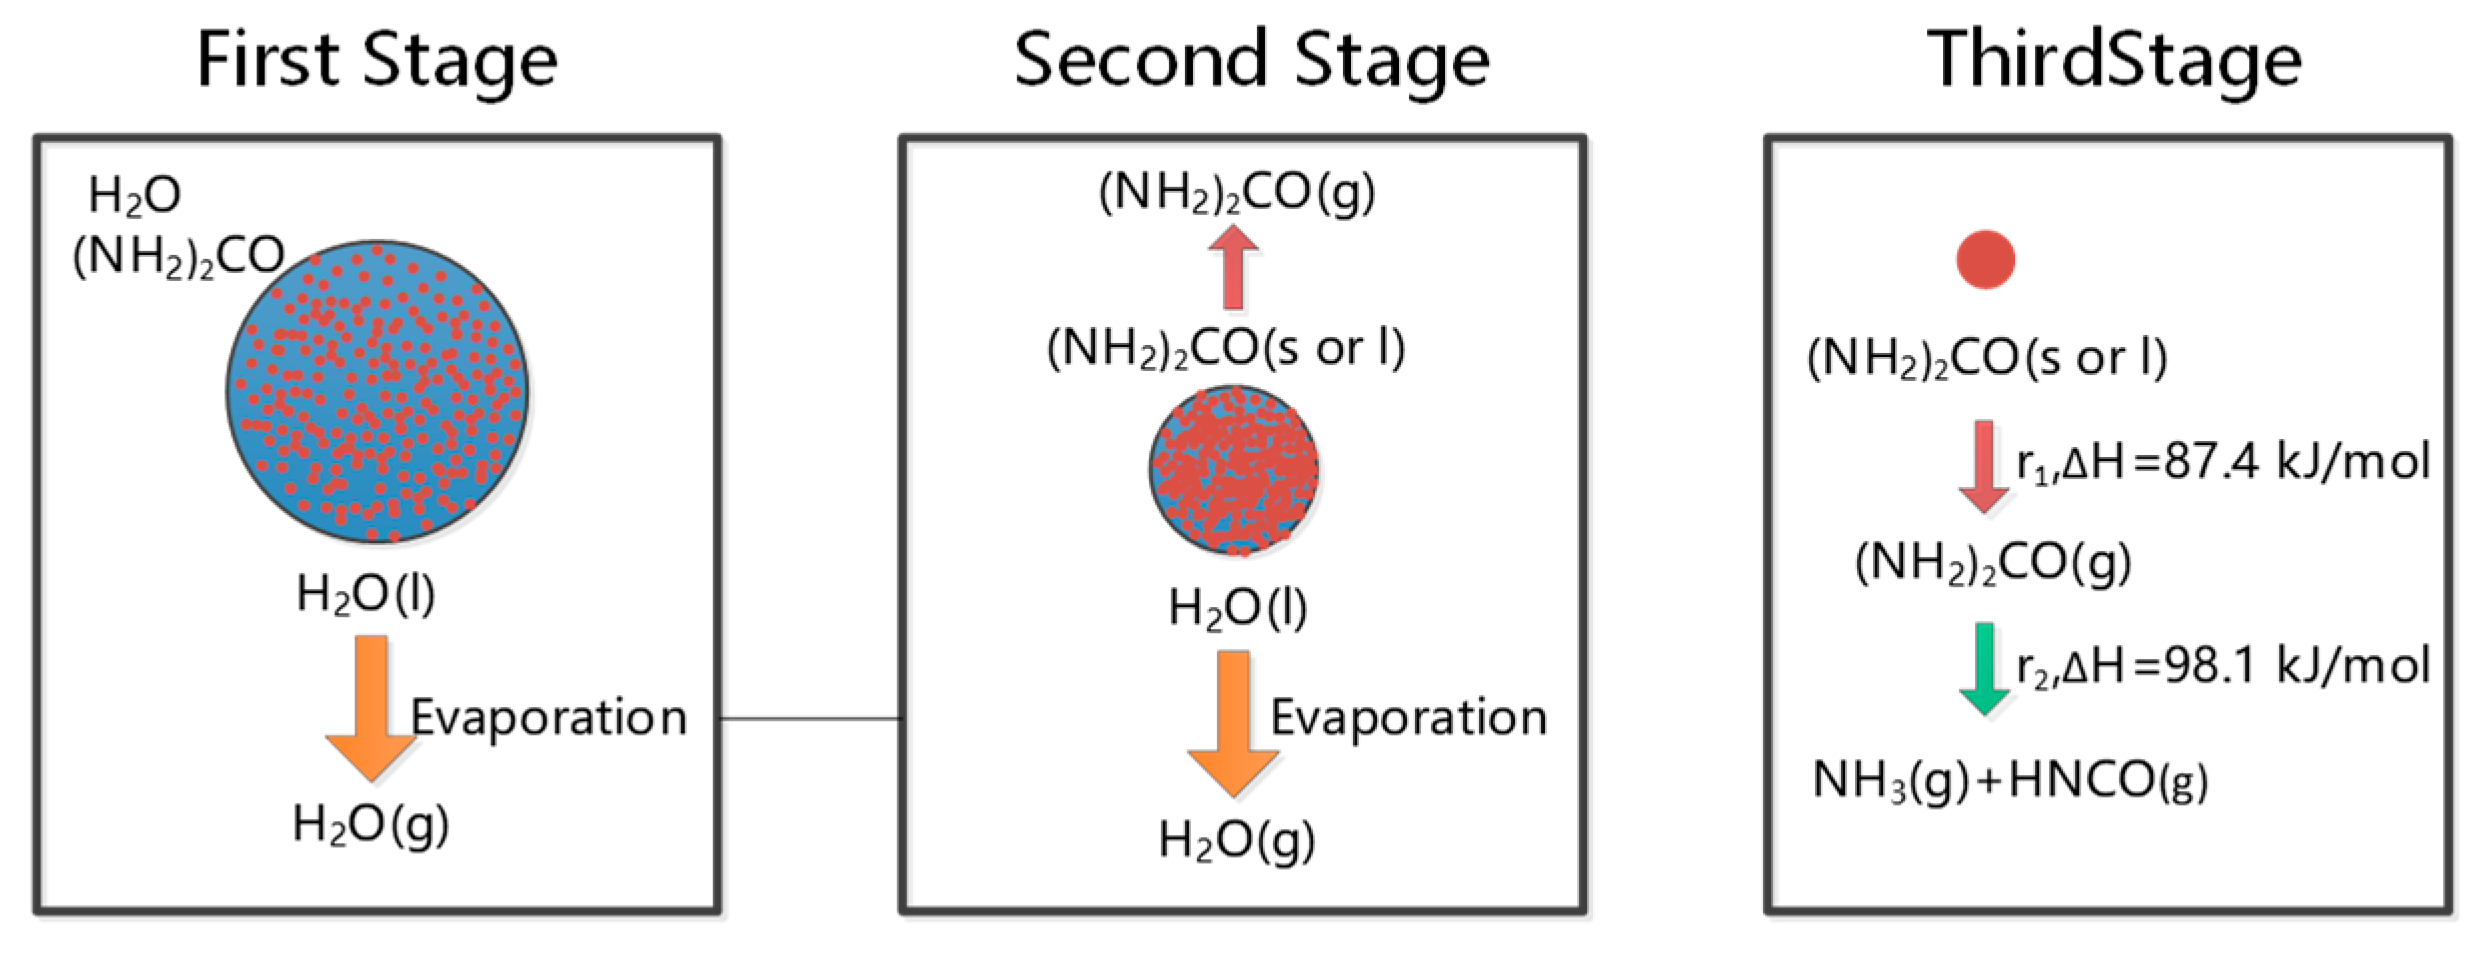
This paper uses the Multi-Component model to describe the droplet evaporation process, including urea pyrolysis. Figure 2 is a schematic illustration of the droplet evaporation and urea pyrolysis. As can be seen from Figure 2, the urea droplets injected into the exhaust pipe are gradually heated by the exhaust gas, and the droplets begin to evaporate as the temperature rises. Since the boiling point of water is low, the water in the aqueous urea solution begins to evaporate at the earliest point in time. Urea can be directly pyrolysized from the solid or liquid phase, so the presence or absence of an intermediate product, urea vapor, is still unknown, i.e., Stage II in Figure 2 is negligible.
The water vapor pressure on the surface of the droplet can be obtained through the modified formula of Perman and Lovett [19], which is used to calculate the evaporation rate of water. According to Birkhold’s theory [13], wall membrane evaporation is divided into two phases: (1) evaporation of water from the urea aqueous solution; and (2) when the mass fraction of water in the urea aqueous solution is under 5%, urea begins to pyrolysize. The thermal decomposition of urea mainly considers the following chemical reaction equations:
4. Spray Simulation Study of SCR Nozzle
4.1. Simulation Analysis Indicators
The simulation analysis indicators are mainly the flow uniformity and NH3 uniformity. In order to study the influence of different structural parameters on the flow uniformity and uniformity of the reducing agent concentration, it is necessary to give reasonable evaluation criteria to provide guidance for the optimization of the flow field. There are two main types of evaluations for the flow uniformity and concentration uniformity:
- (1)
- Qualitative analysis: Using the slice of the 3D simulation results, the uniformity of flow and concentration distribution on the cross section can be visually analyzed, and the advantages and disadvantages of different schemes can be compared;
- (2)
- Quantitative analysis: The uniformity index was established to evaluate the uniformity of the flow rate and concentration distribution as a preferred basis. Many researchers have given different definitions of the uniformity index:
Chen [21] used the uniformity index defined by Equation (3) to compare the influence of different mixer structures on the flow characteristics and NH3 distribution in the SCR system. The results show that the uniformity of the NH3 distribution at the catalyst inlet is greatly improved after the addition of a well-structured mixer, but that the flow uniformity is reduced. In the formula of the uniformity index, the area representing the size of the calculated grid element is added, which not only reflects the structural features of the geometric model, but also reduces the requirement for grid regularity, so that the velocity or concentration distribution can be applied to the entire section. The degree of uniformity is accurately described. Therefore, the index is suitable for evaluating the uniformity of the internal velocity/concentration distribution of SCR systems having different structural types.
4.2. Simulation Analysis of Boundary Conditions
Select three typical operating points of the engine as the boundary for simulation. The selected operating points are shown in Table 2:
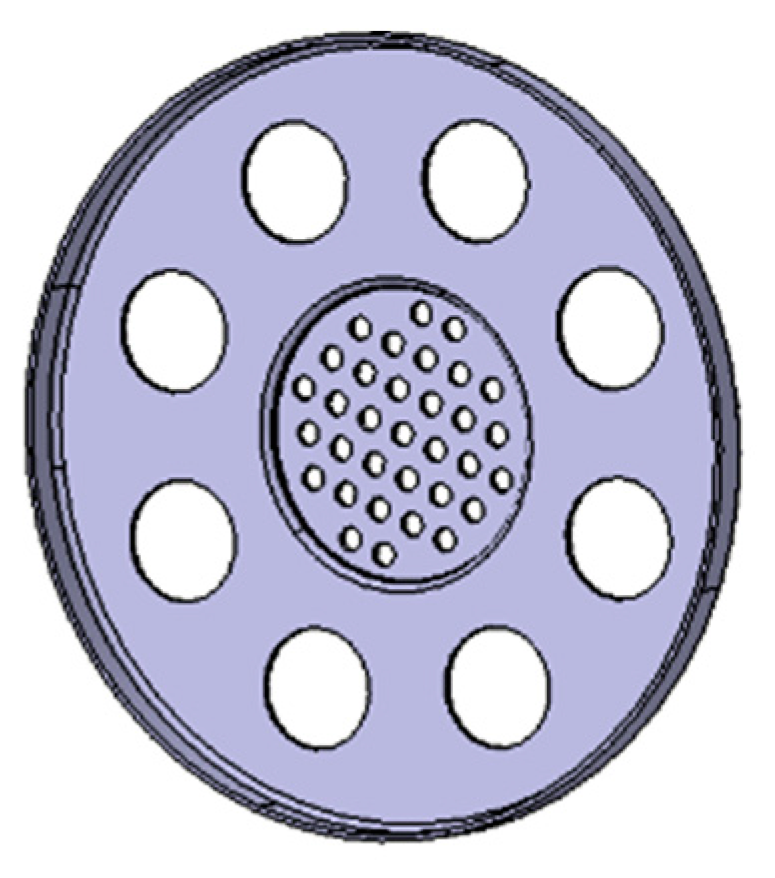
The original nozzle model was built based on the CFD simulation method, in Figure 3. Eight large holes are evenly arranged on the outer circle and many small holes are evenly arranged in the inner circle. The purpose is to make the atomization of adblue more uniform.
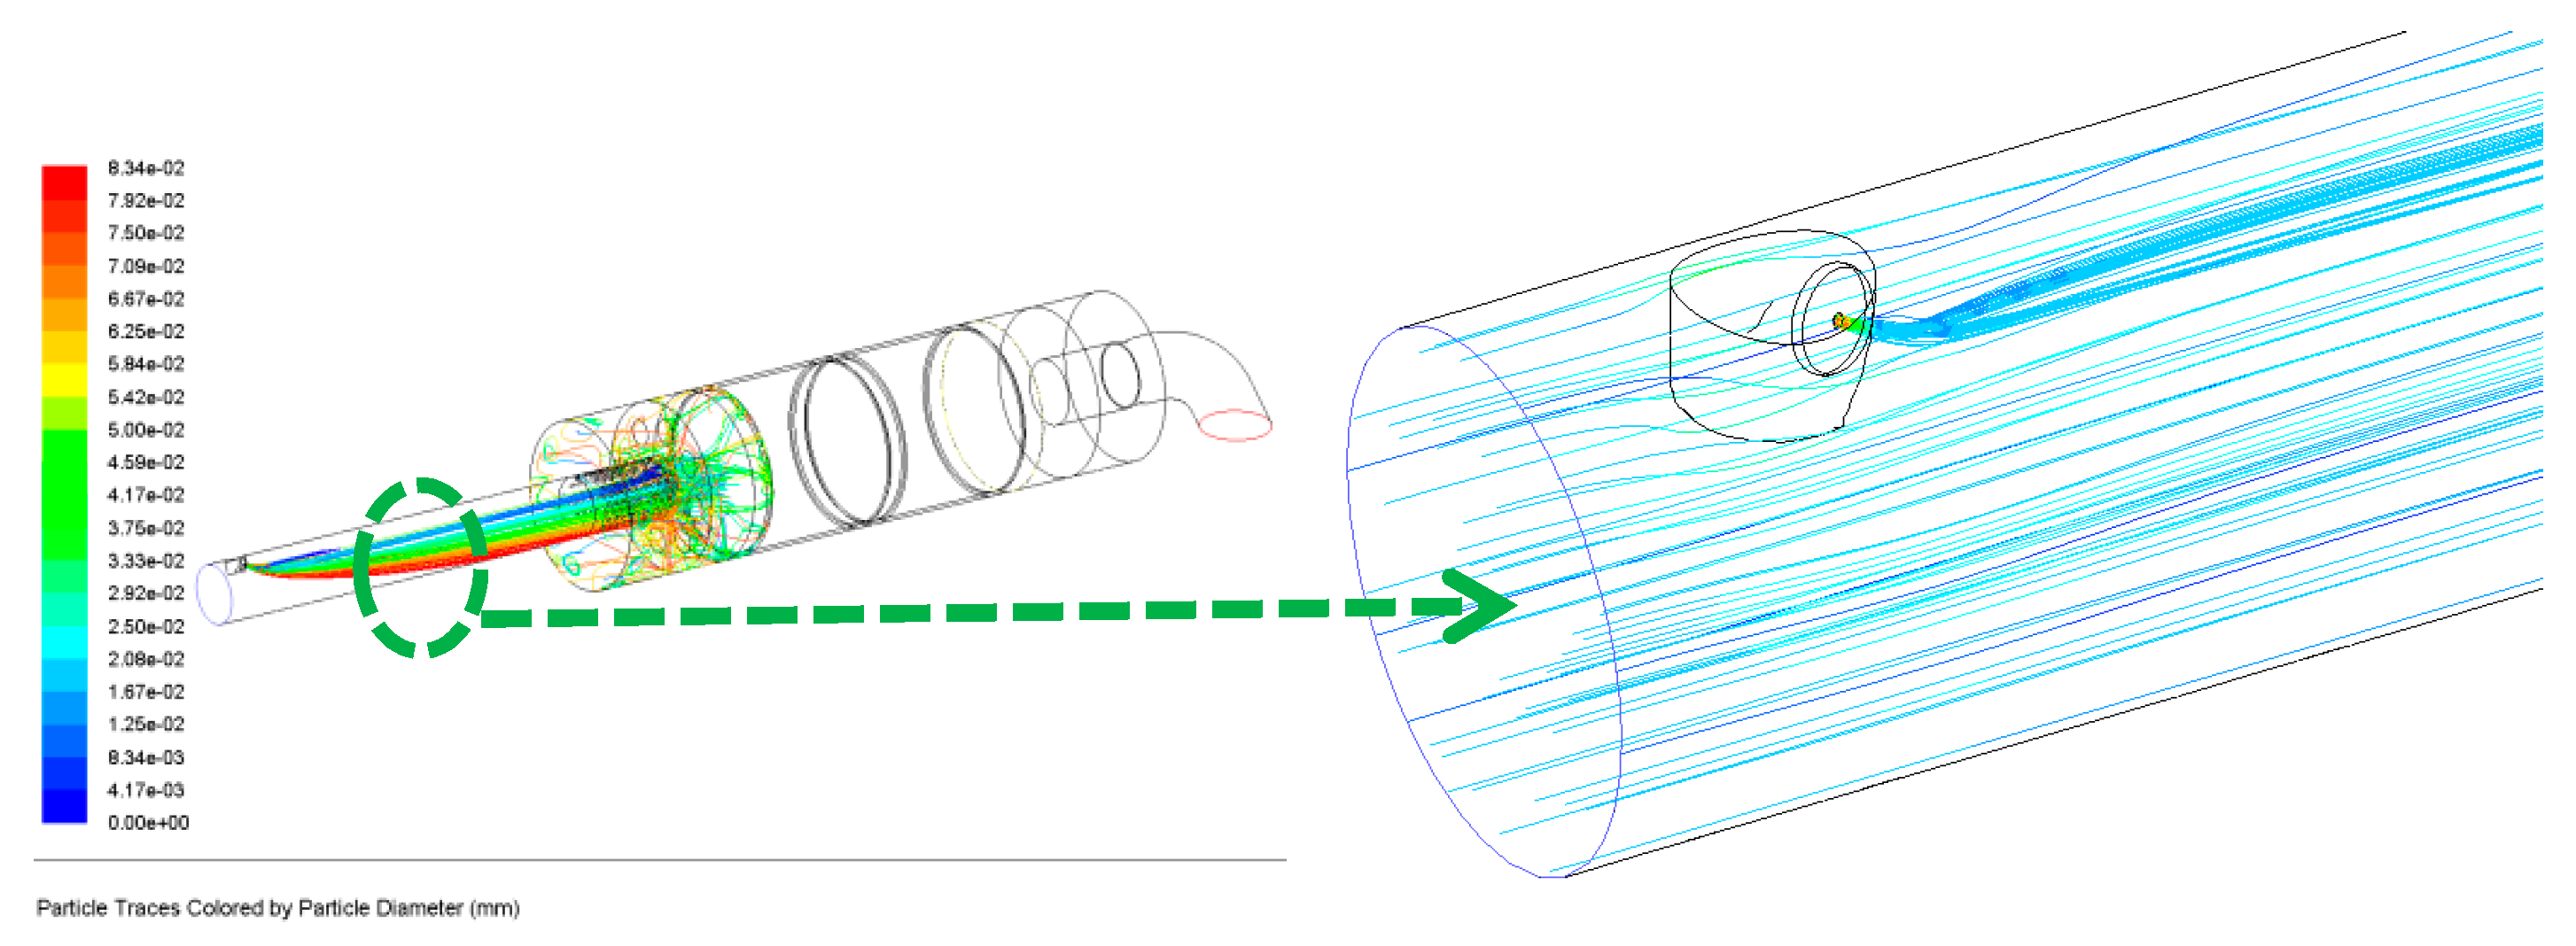
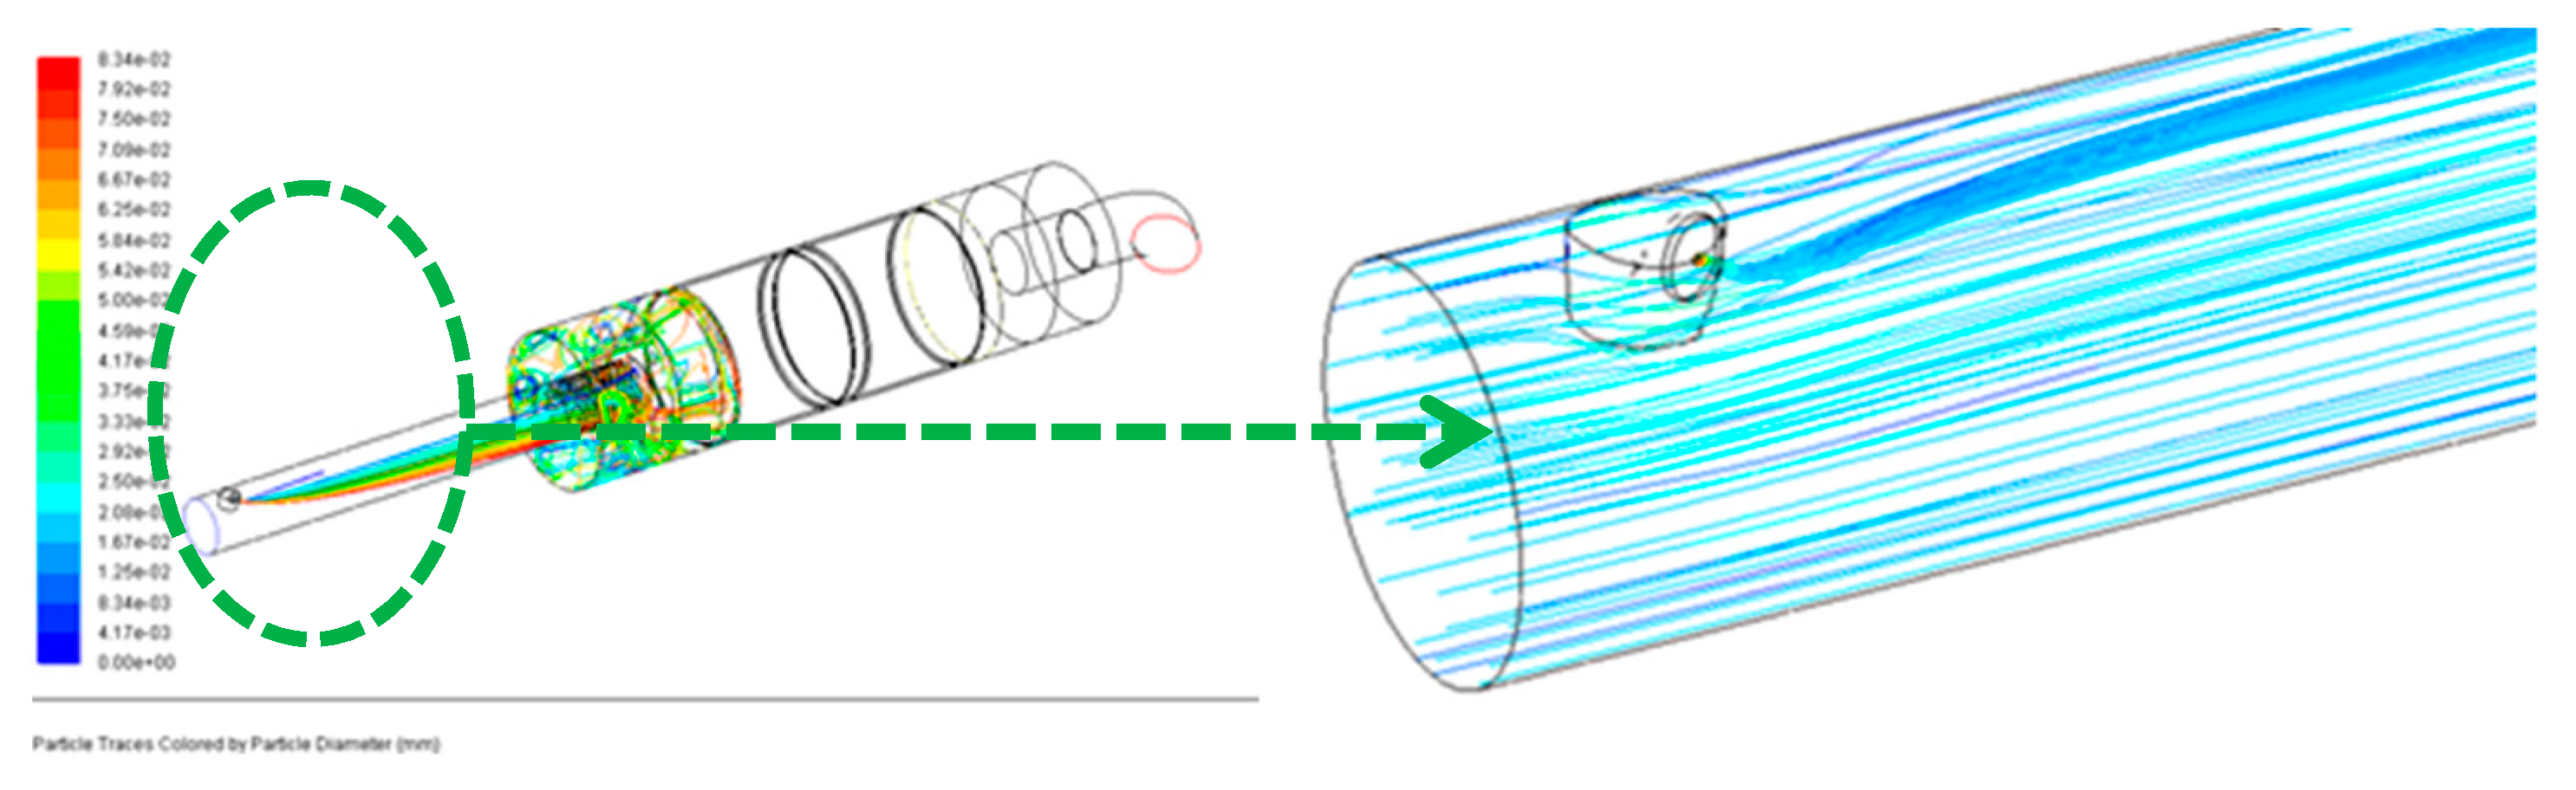
Figure 4 shows the particle traces and flow line distribution of the initial nozzle based on the simulation. According to the results, most of the larger droplets hit the wall of the exhaust pipe. Additionally, the heat exchange between the exhaust and the droplet was relatively small. It is unfavorable for the pyrolysis of urea droplets.
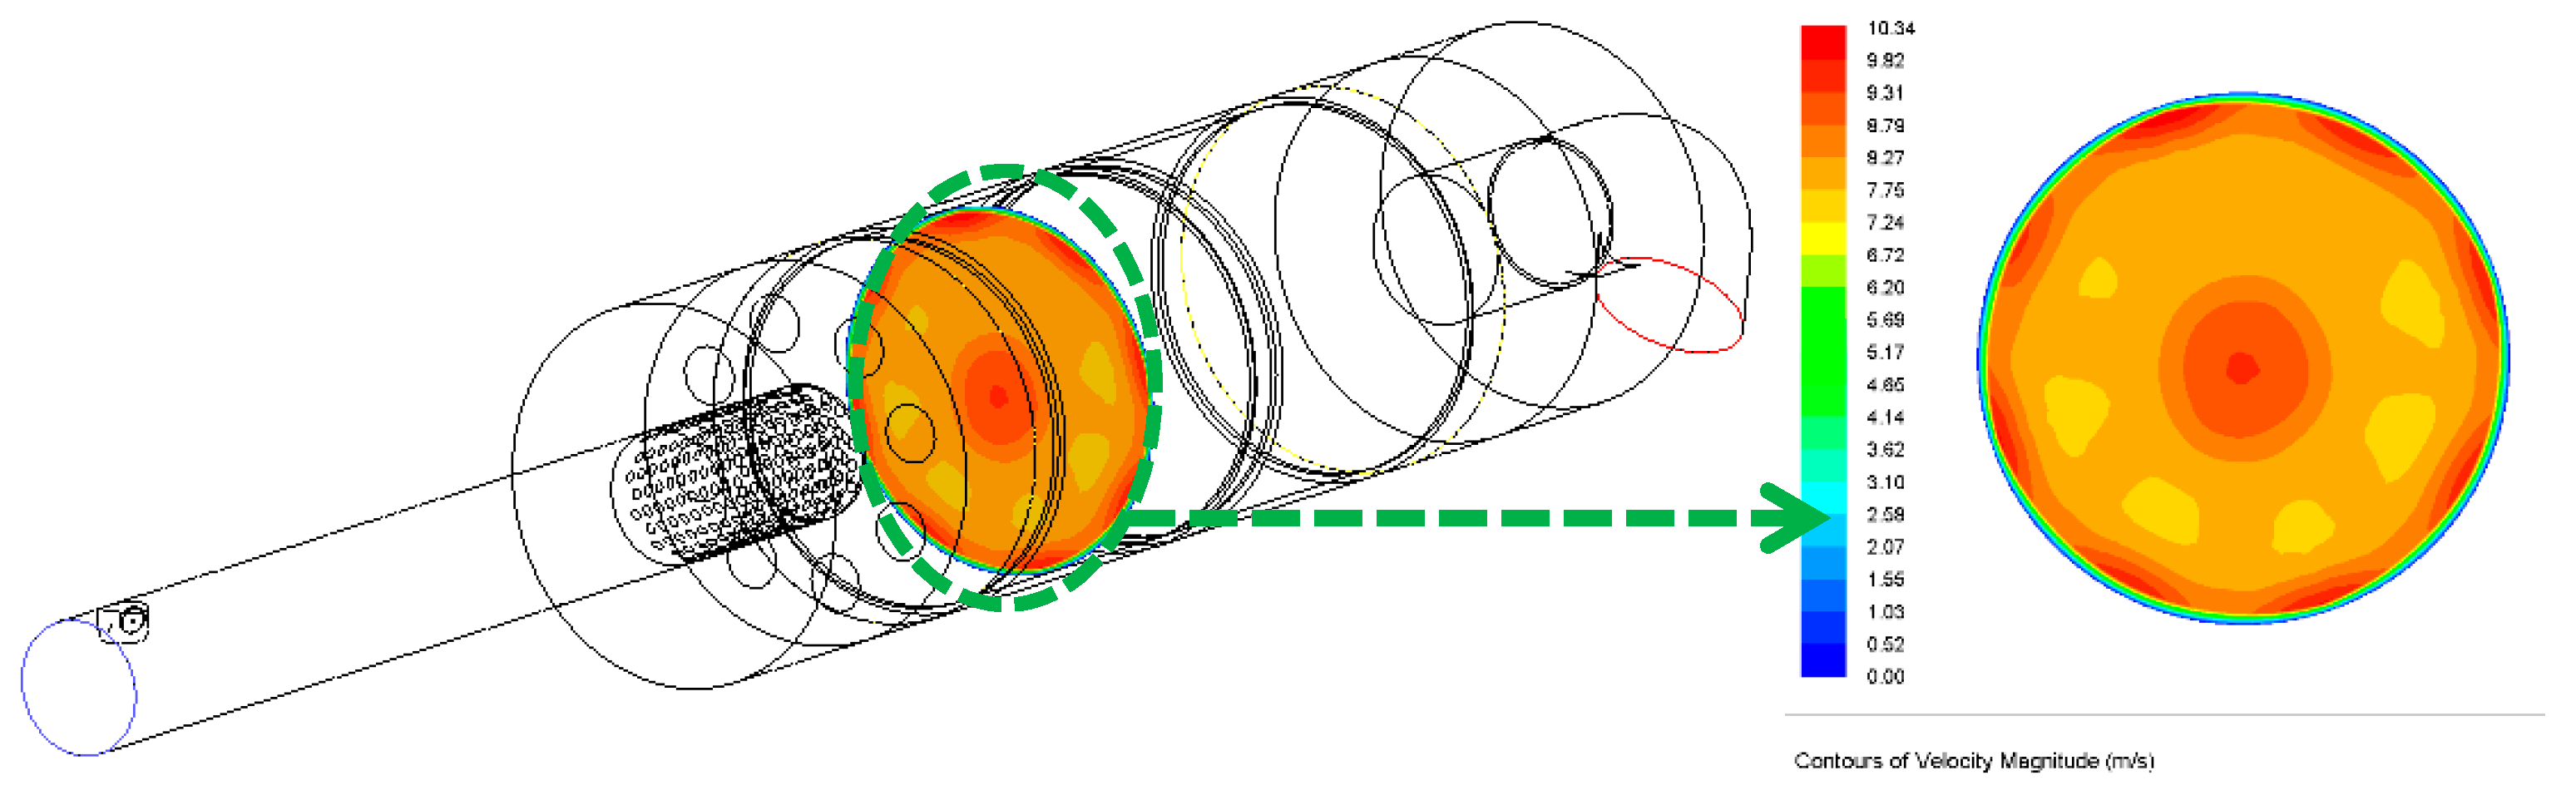
Figure 5 shows the flow rate distribution on the inlet face of the catalyst. The flow is uniformly 0.94, beyond the design target of 0.9. Consequently, the flow distribution does not need to be optimized.
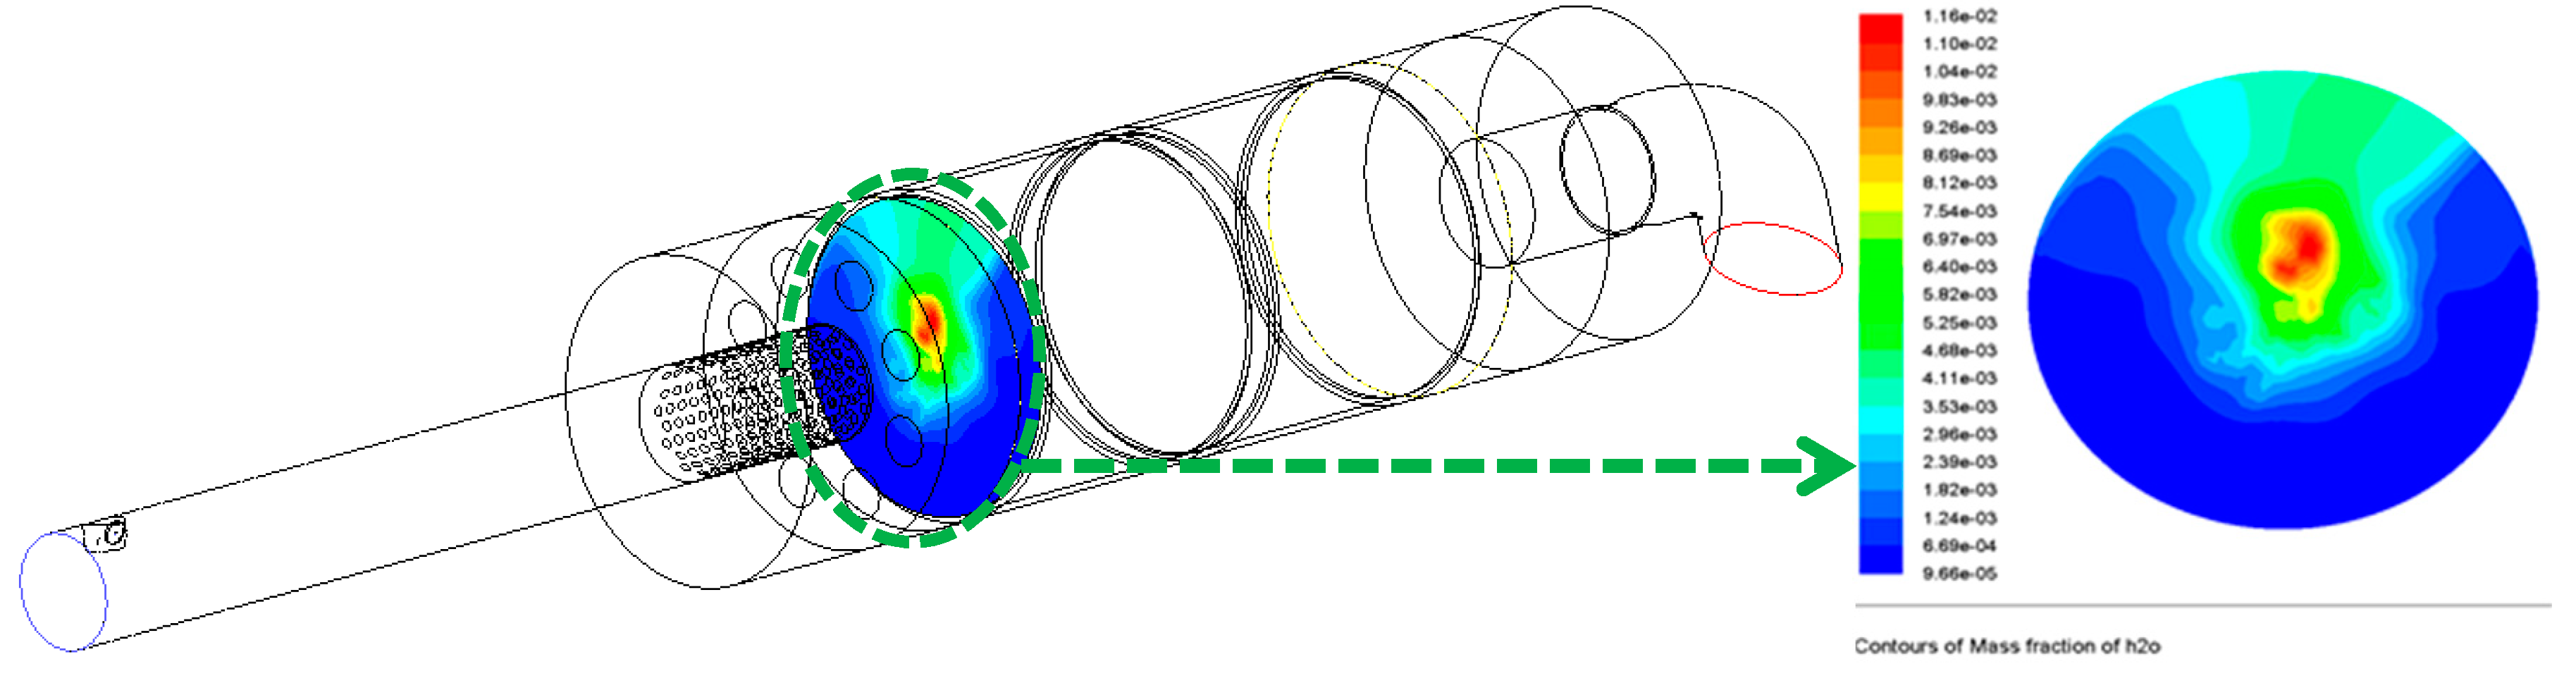
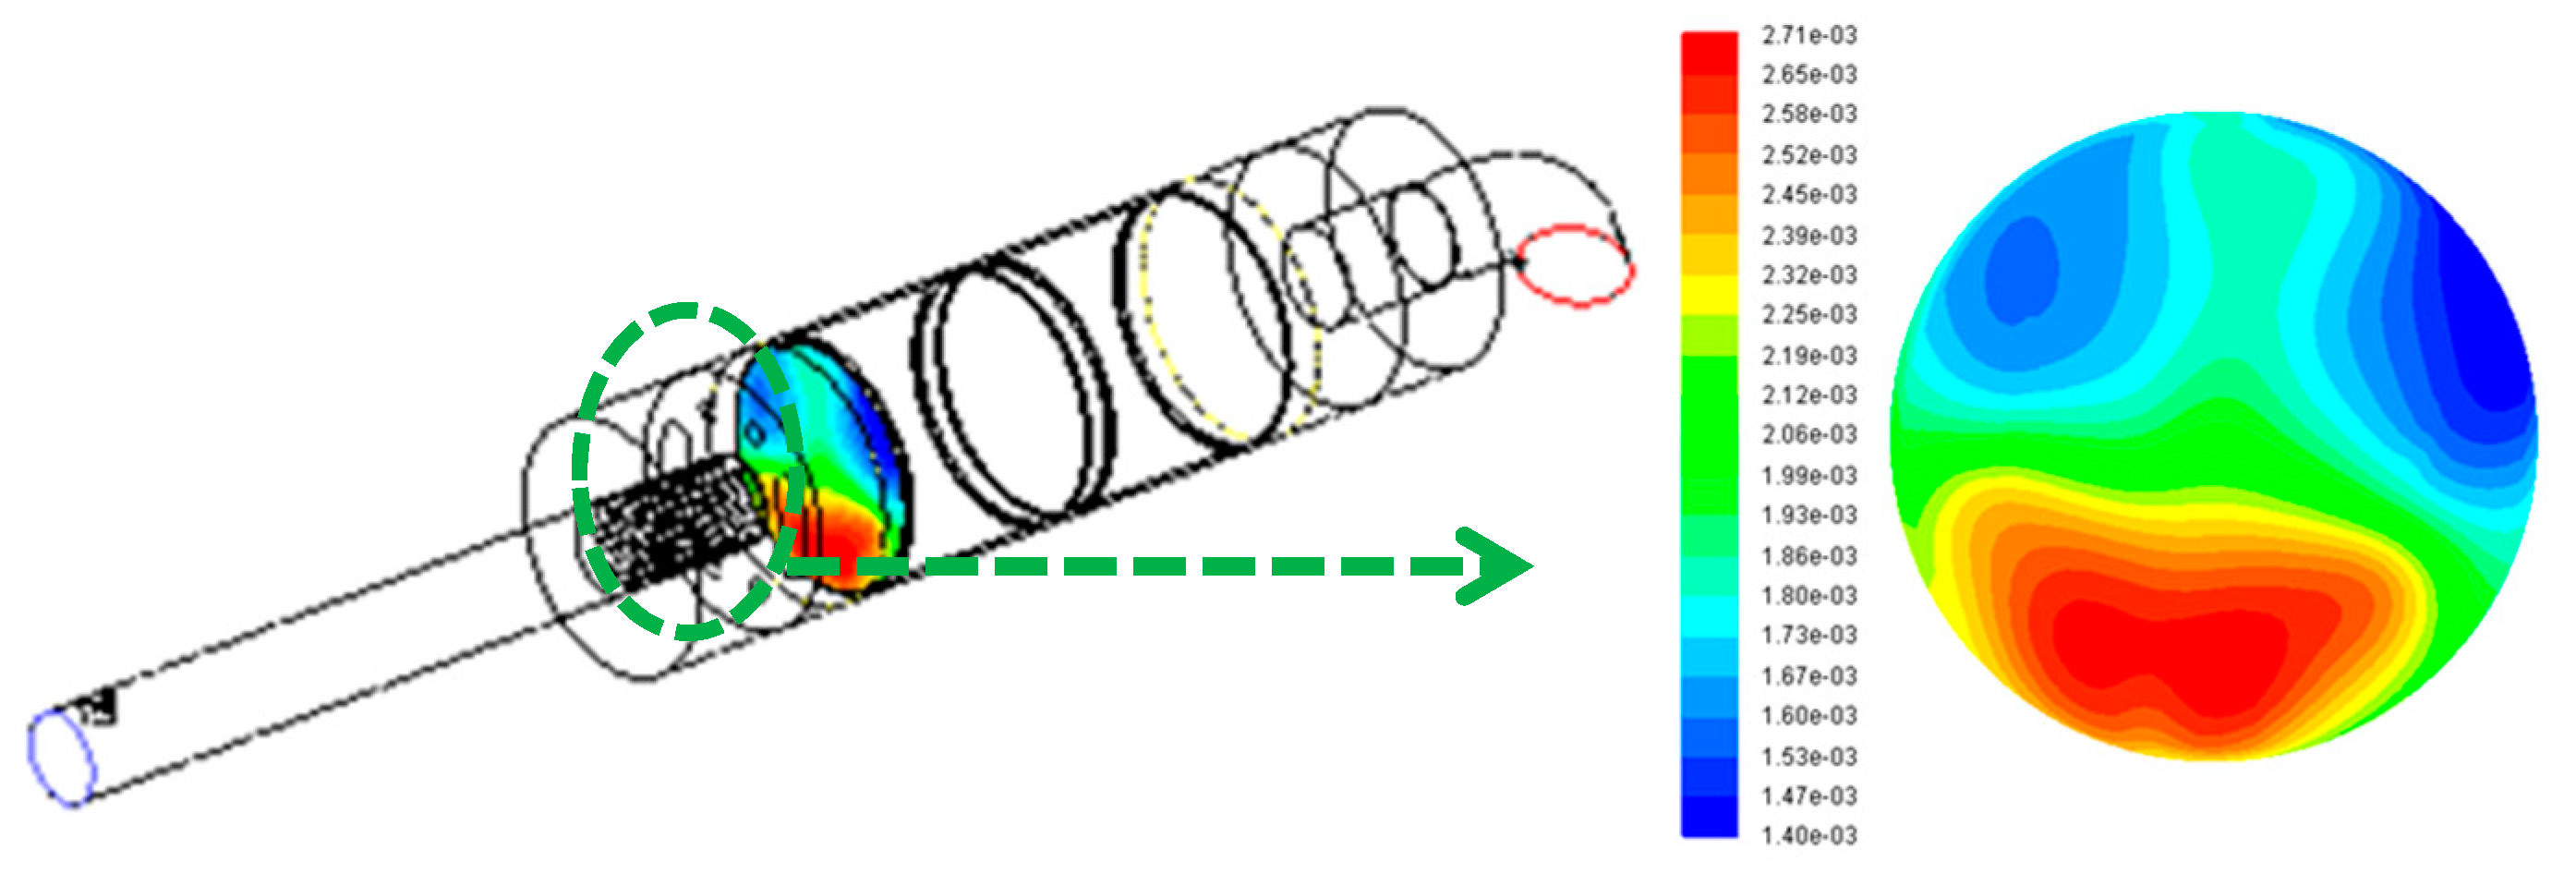
Figure 6 shows the simulation results of the NH3 distribution uniformity on the inlet face of the catalyst. From the results, the NH3 distribution was uneven for all, and the NH3 uniformity at the front of the catalyst is only 0.58. This is far from the design requirement (0.9). This is due to the uneven spray of urea droplets and insufficient heat transfer between the urea droplet spray and exhaust gas. Consequently, the nozzle must be optimized to improve the uniformity of the droplets, which can play a key role in SCR conversion.
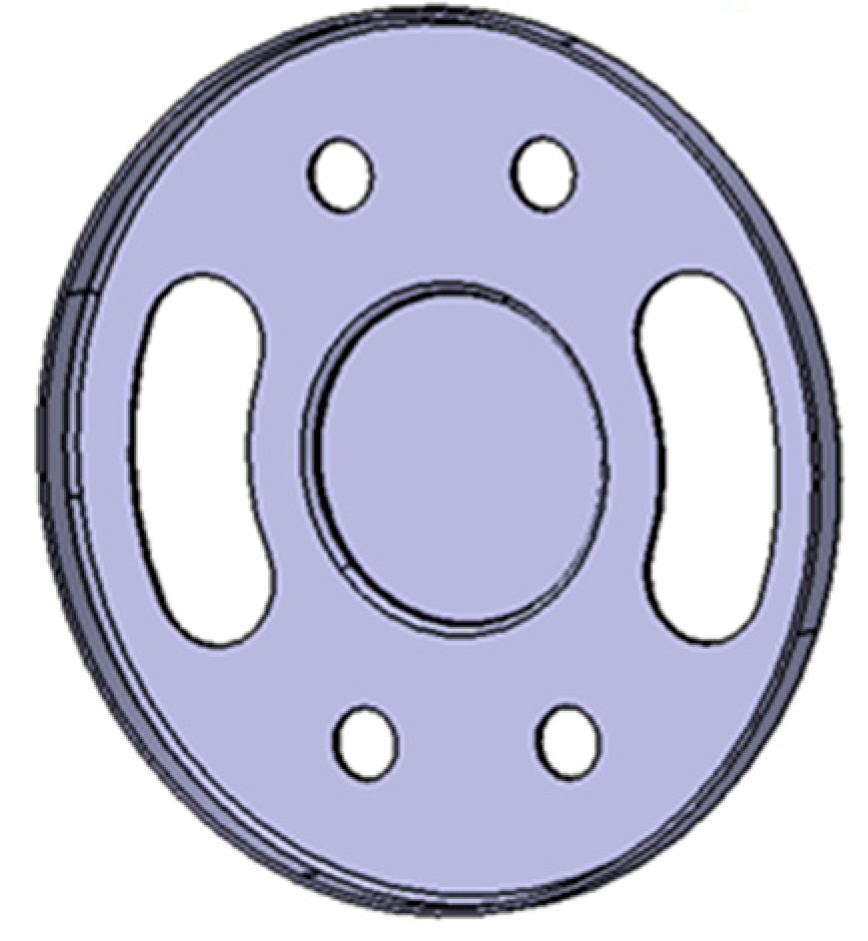
Aimed at this problem, this paper optimizes the nozzle structure to avoid the collision between the urea droplets and the wall surface of the exhaust pipe, to ensure that the exhaust gas and the urea droplets are in full contact as much as possible to guarantee a sufficient urea pyrolysis. Additionally, the new design is shown in Figure 7. Two large holes are arranged on the left and right sides, and four small holes are installed on the upper and lower sides. This design can reduce the penetration distance of the droplets and avoid the droplets colliding with the exhaust.
Figure 8 shows the droplet distributions results of the optimization nozzle. The simulation results show that the streamline distribution is more uniform, and the collision between the droplets and the exhaust wall are reduced. Consequently, the contact between the urea droplets and the exhaust gas is more comprehensive, which is helpful for increasing the pyrolysis rate of urea droplets.
Figure 9 shows the flow rate distribution results on the inlet face of the catalyst. The flow is uniformly 0.97. It is slightly improved when compared with the original nozzle. Additionally, it is far beyond the design target of 0.9. Consequently, it can meet the requirements.
Figure 10 shows the simulation results of the NH3 distribution uniformity on the inlet face of the catalyst. From the results, the NH3 uniformity of the front face of the catalyst reaches 0.92, which is quite improved when compared with the original structure. Furthermore, this is due to the better mixing of the urea droplets with the exhaust gas and the faster urea pyrolysis rate. Additionally, with the optimized nozzle, the NH3 uniformity can meet the target of 0.9.
Other operation points are simulated through the same CFD method. Additionally, the results show a good consistency in Table 3. With the optimized nozzle, the NH3 uniformity increased a lot for all typical operation points.
5. Test Verification of Optimized SCR Nozzle
5.1. Spray Particle Size Test
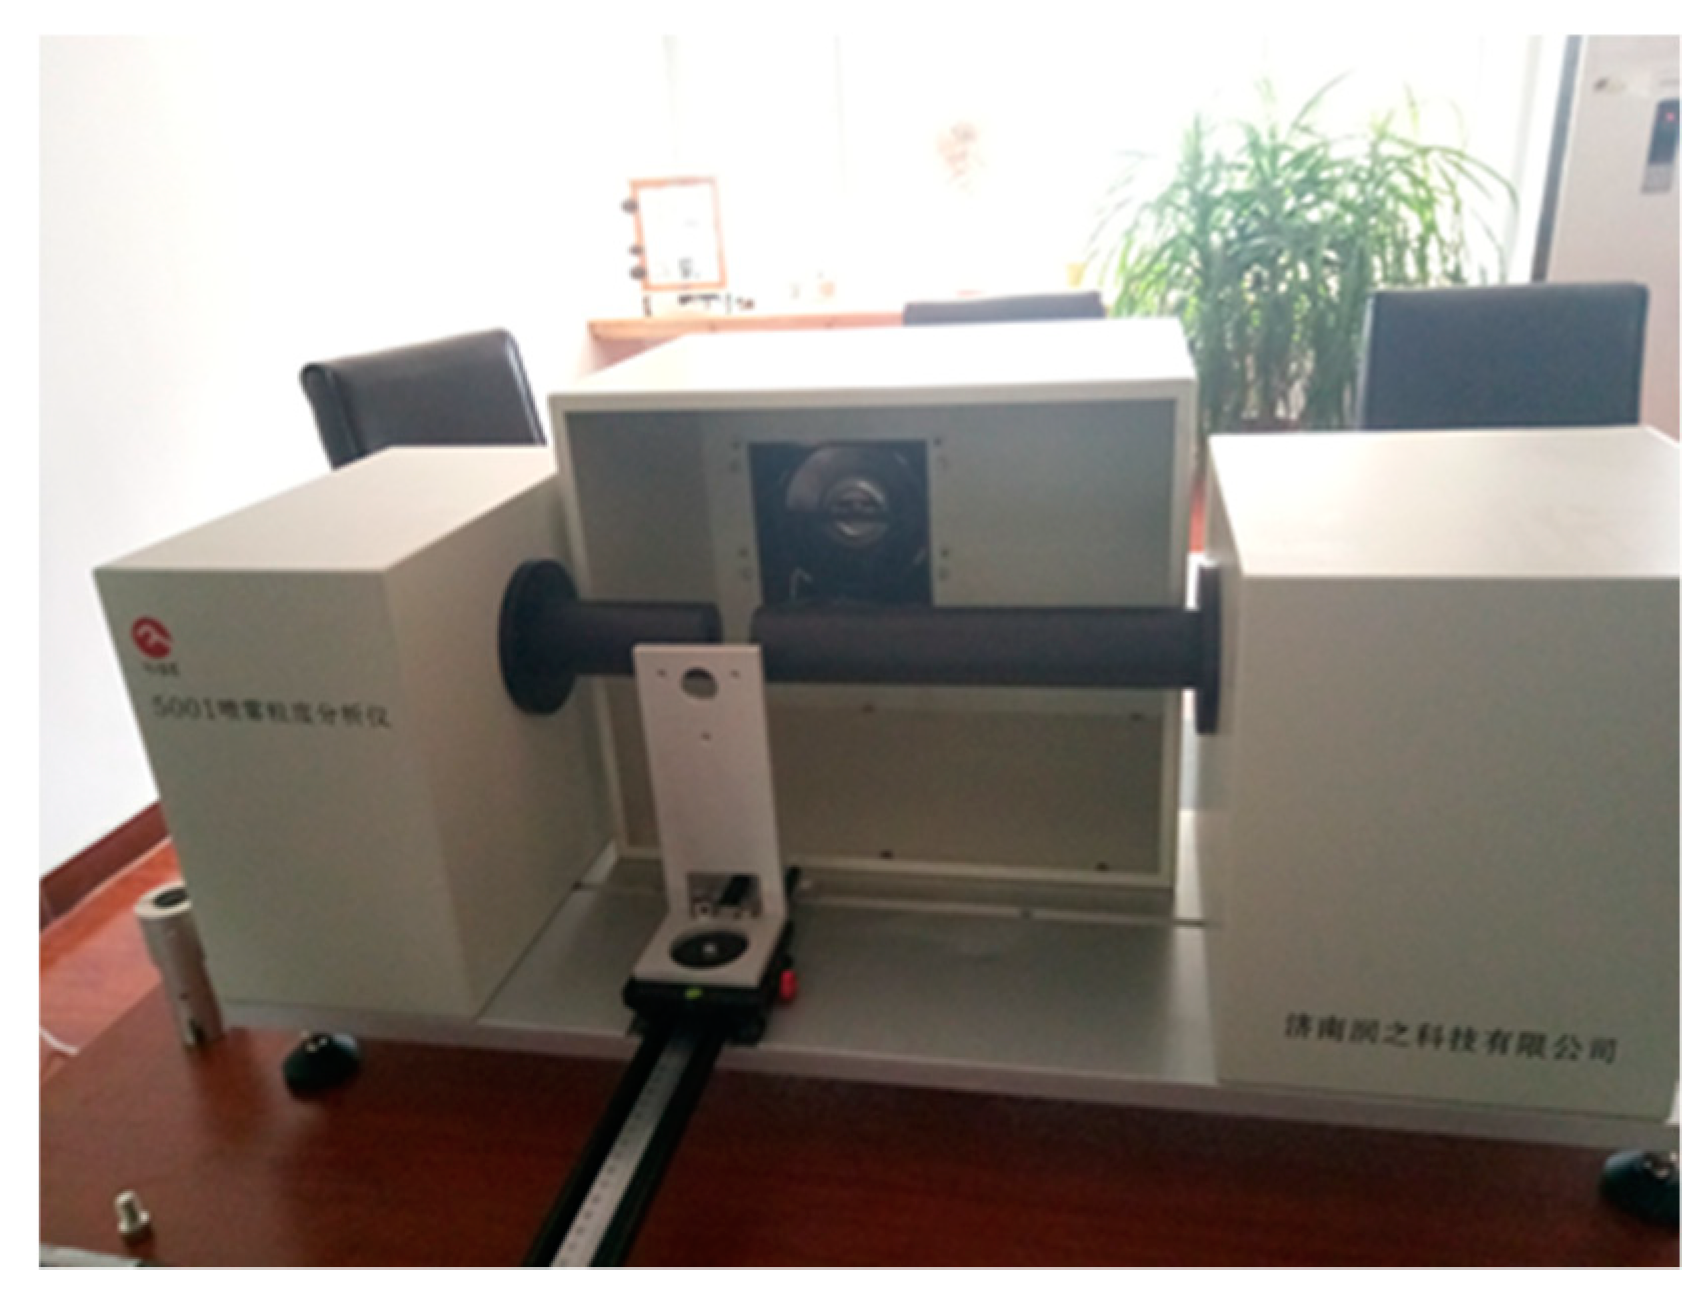
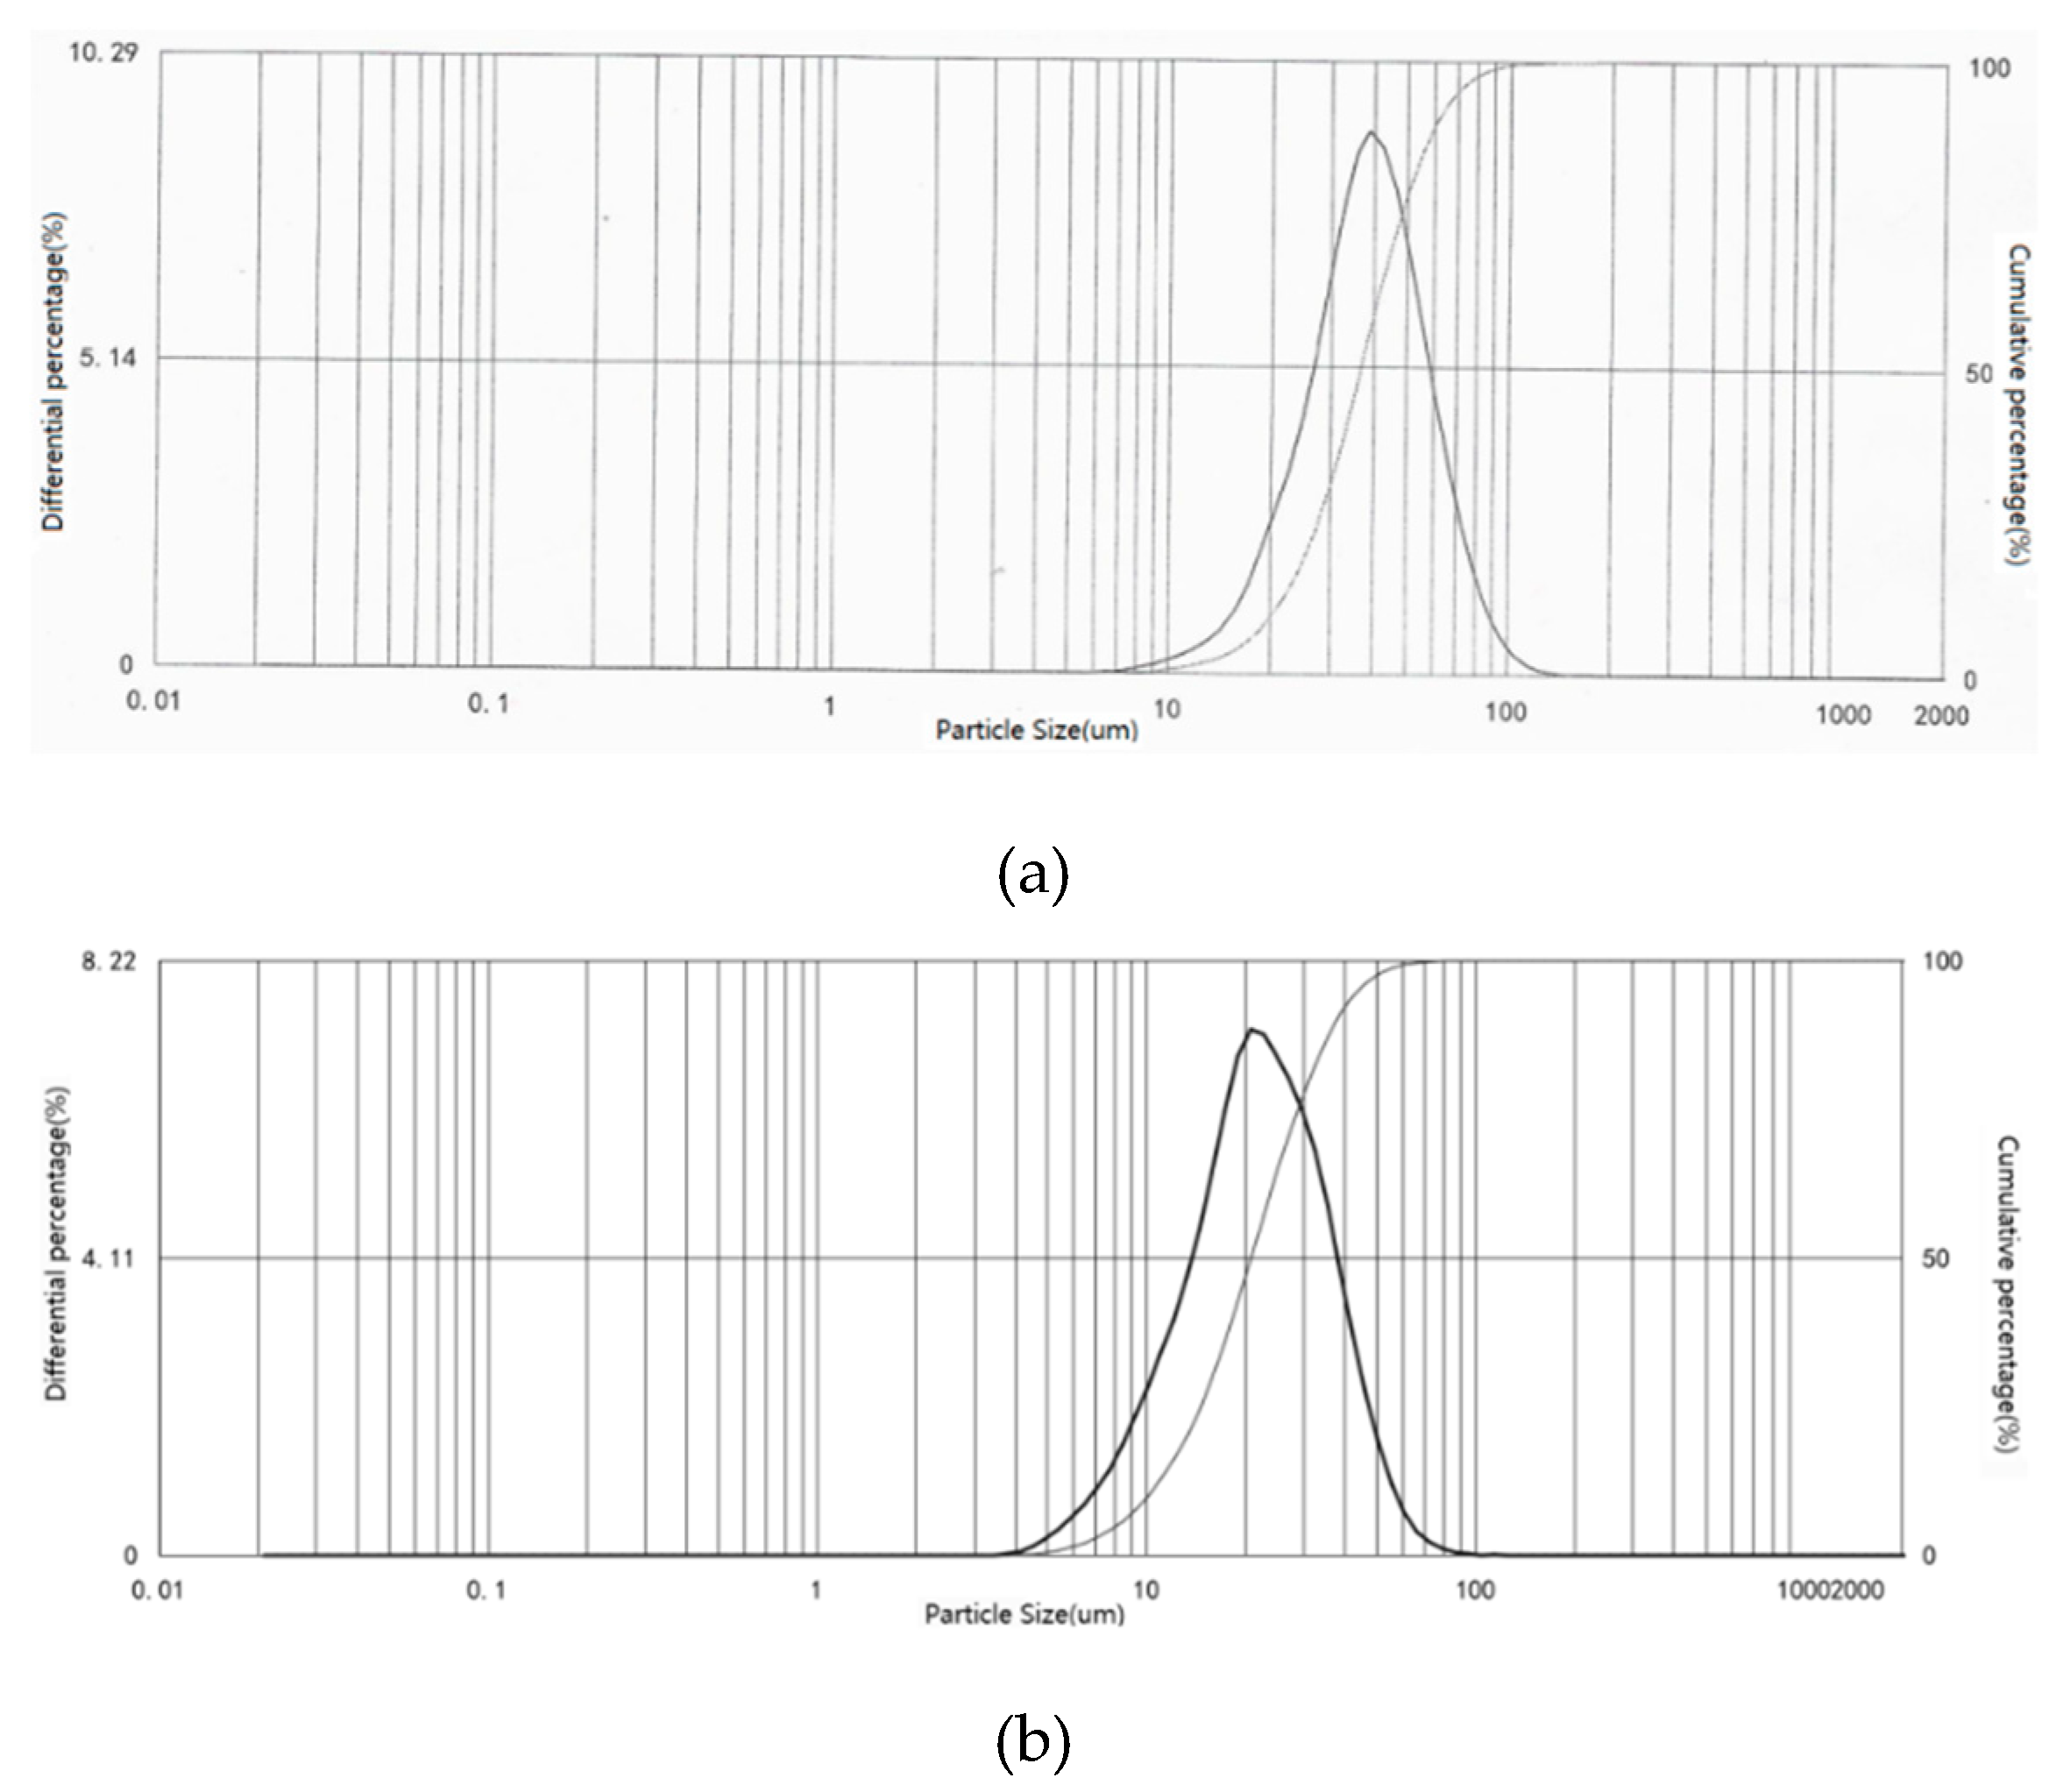
The optimized nozzles were tested for spray characteristics by the standard “Q/YC 1273.2—2014:5.3.4”. The test bench is shown in Figure 11. The test method is as follows: at 60% of the nominal flow rate, the injection port of the metering injection device is mounted downward on the fixed bracket of the laser particle size tester, the injection port of the metering injection device is adjusted to 75 mm from the test source, and the injection of the metering injection device is performed; The center distance from the mouth to the test source is 75 mm ± 1 mm; The spray particles of the spray liquid bundle were analyzed by a laser particle size tester. Additionally, the spray size distribution with the two different nozzles is shown in Figure 12. From the test results, the Sauter mean diameters (SMD) of both nozzles are less than 40 um, which meets the design requirements. Furthermore, the SMD of the optimized nozzle is a little smaller, which is good for the urea droplet pyrolysis. Compared with the simulation results, as shown in Figure 13, the simulation error of SMD is lower than 3 um, so the CFD simulation results are reasonable.
5.2. WHSC and WHTC Emission Certification
The original nozzle and the optimized nozzle were used to carry out the National VI emission test certification. The engine and measurement information is shown in Table 4 and Table 5. Additionally, the Europe VI diesel engine test cycles WHSC and WHTC are performed with different nozzles to validate the NOx conversion performance.
Table 6 shows the WHSC and WHTC emission certification results with different nozzles. Furthermore, with the optimized nozzle, the NOx conversion increased by nearly 3%, and the emission results can meet the National VI standard. Additionally, the NH3 leakage is lower as well.
5.3. Deposits
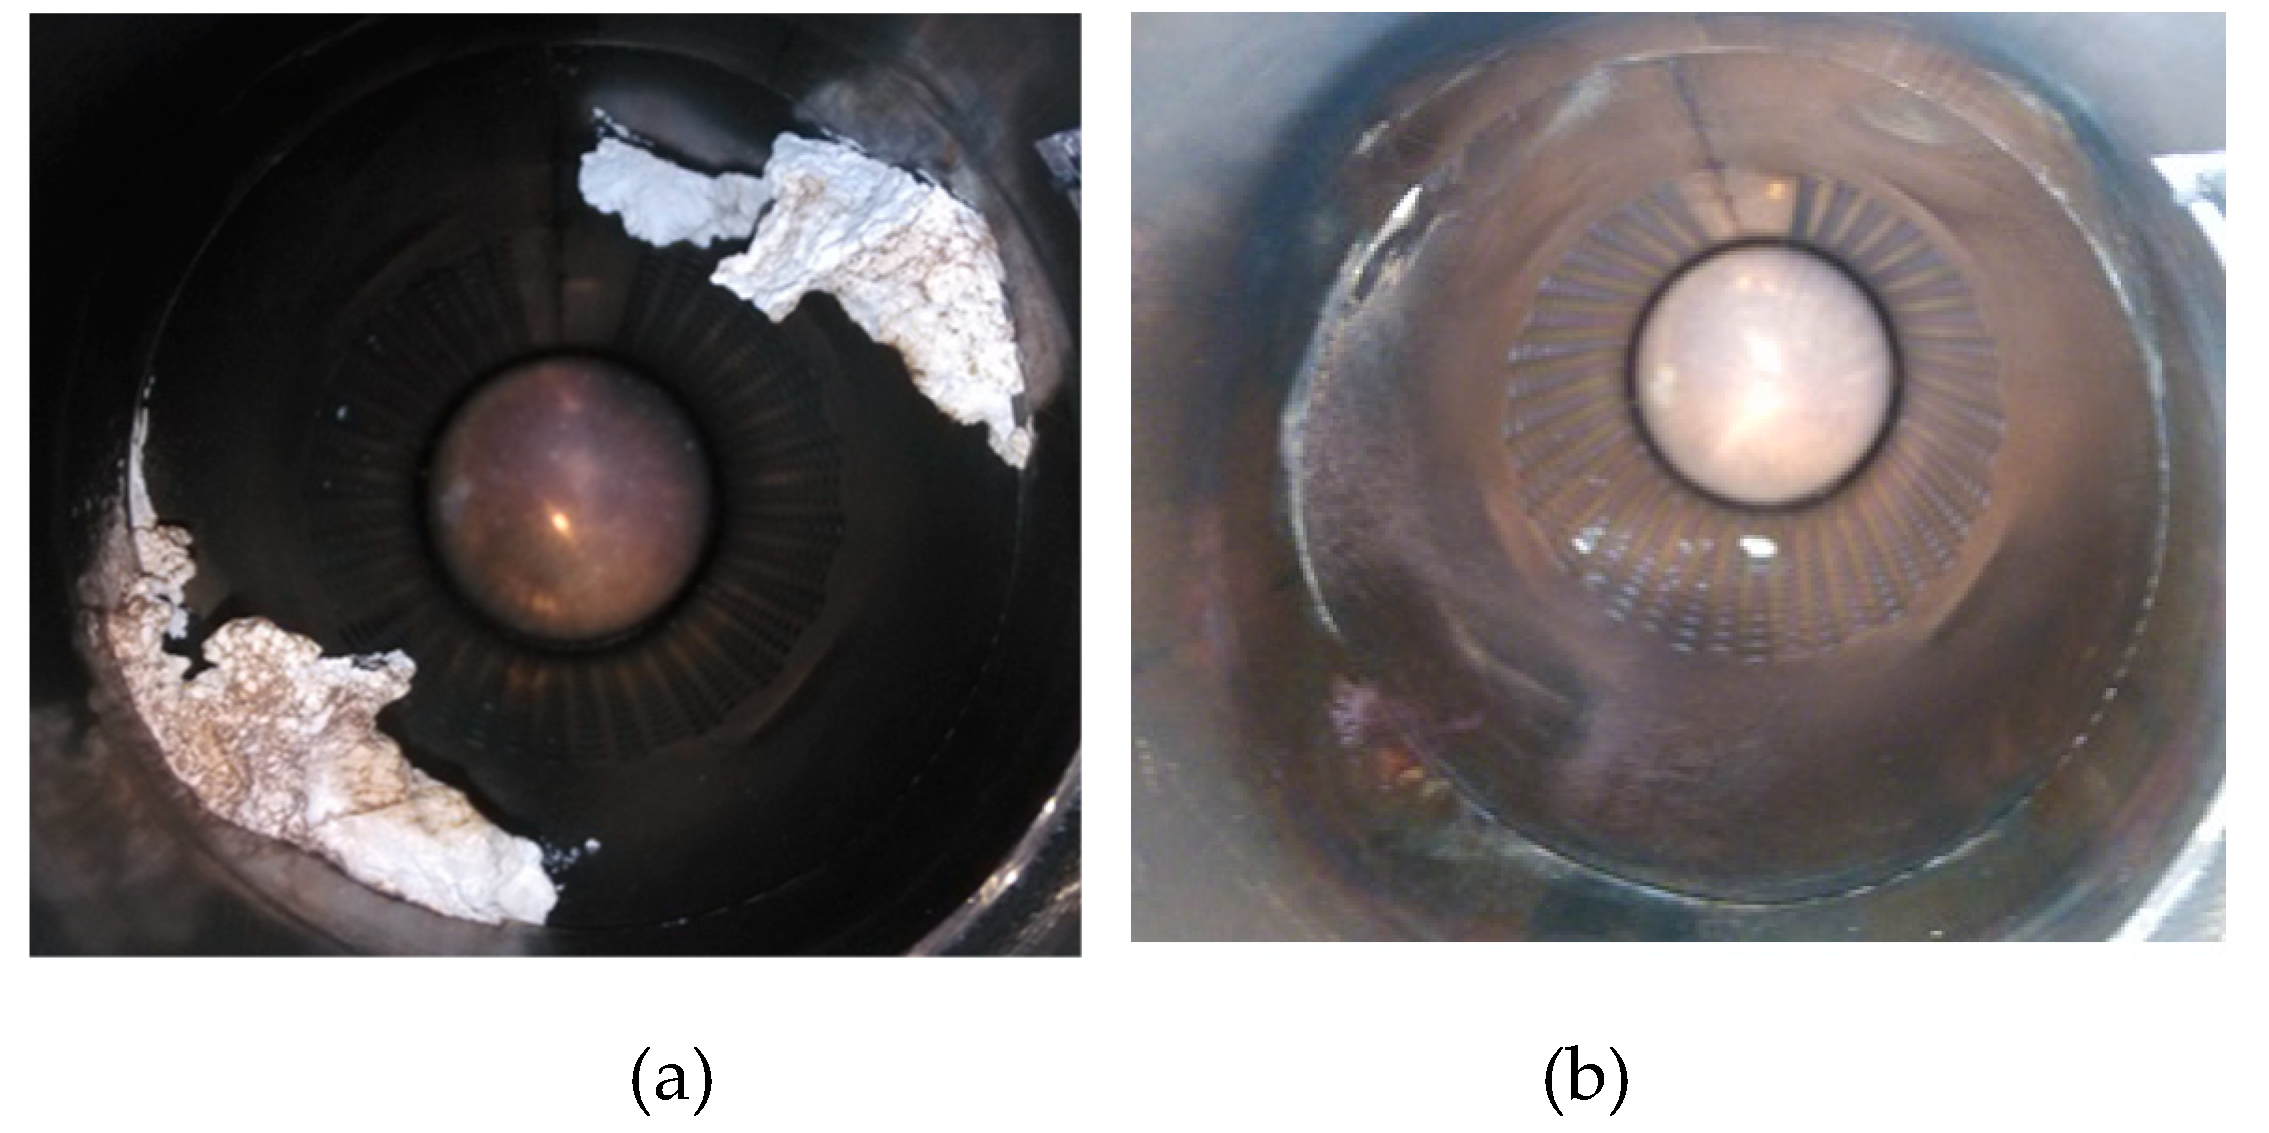
The optimized nozzle was also used to test whether it lends itself to deposit formation under low temperature conditions. Additionally, the engine and the measuring equipment is the same as in Table 4 and Table 5. The test procedure is to keep the engine running for 2 h at low temperature steady operation points (engine speed: 1000 rpm, torque: 50 Nm, exhaust temperature: 250 °C), and then to check the deposits in the exhaust pipe. The test results indicate that no obvious deposit was found with the optimized design nozzle, as shown in Figure 14. Consequently, it is clear to see that the optimized nozzle can avoid deposit when compared to the initial design, due to the faster urea pyrolysis rate.
6. Conclusions
In this paper, the SCR system nozzle is optimized by a CFD simulation method for the National VI diesel engine. With the optimized nozzle, the NH3 distribution uniformity of the inlet face of the SCR catalyst can increase from 0.58 to 0.92. Furthermore, test verifications are implemented based on a spray particle size test and the engine bench tests; the results show that the Sauter mean diameter of the optimized nozzle is more decreased than the initial nozzle and that the NOx conversion efficiency of the WHTC and WHSC cycle improves by nearly 3%; additionally, it can also avoid deposit formation, which meets engineering design requirements. This can provide guidance for the optimization design of the adblue injection system.
Author Contributions
Establish the CFD model and organize experiments, F.Q.; Calibrate and validate the model, D.M.; Process the test data, P.L.; Perform the experiment, N.Z.; Review the paper and put forward suggestions, X.X.
Funding
This research was funded by the National Key Research and Development Program of China (2017YFC0212100, 2016YFC0208000), National Natural Science Foundation of China (No. 51679176) and Hubei Provincial Department of Education Science and Technology Research (No. B2018003).
Acknowledgments
The author appreciates the support of School of automotive and transportation engineering (Wuhan University of Science and Technology).
Conflicts of Interest
The authors declare no conflict of interest.
References
- Seo, J. Aftertreatment Package Design for SCR Performance Optimization. SAE Paper 2011-01-1135. Available online: https://saemobilus.sae.org/content/2011-01-1135/ (accessed on 12 April 2011).
- Saito, S.; Shinozaki, R.; Suzuki, A.; Jyoutaki, H.; Takeda, Y. Development of Urea-SCR System for Commercial Vehicle-Basic Characteristics and Improvement of NOX Conversion at Low Load Operation. SAE Paper 2003-01-3248. Available online: https://saemobilus.sae.org/content/2003-01-3248/ (accessed on 27 October 2003).
- Needham, D.; Spadafora, P.; Schiffgens, H.J.; Kirwan, J.E.; Cabush, D.D.; Kalina, A. Delphi SCR Dosing System—An Alternative Approach for Close-Coupled SCR Catalyst Systems. In Proceedings of the 21st Aachen Colloquium Automobile and Engine Technology, Aachen, Germany, 8–10 October 2012. [Google Scholar]
- Denoxtronic 2.2—Urea Dosing System for SCR systems. Robert Bosch GmbH. 292000P18Z-C/CCA-201404-En. Available online: http://www.gonggui.com.cn/web/crs/dnox_2.2.jsp (accessed on 15 May 2012).
- EcoFitTM DEF Dosing System. Cummins Emission Solution (China) Co., Ltd. Bulletion 4973772-a Printed in China Rev 10/2011. Available online: http://www.evtimes.cn/html/201111/33702_3.html (accessed on 8 November 2011).
- Howard, L.F.; Herbert, F.M.D.C. Urea thermolysis and NOx reduction with and without SCR catalysts. Appl. Catal. B Environ. 2003, 46, 17–34. [Google Scholar]
- Zheng, G.; Fila, A.; Kotrba, A.; Floyd, R. Investigation of Urea Deposits in Urea SCR Systems for Medium and Heavy Duty Trucks. SAE Paper 2010-01-1941. Available online: https://saemobilus.sae.org/content/2010-01-1941/ (accessed on 5 October 2010).
- Zhang, J.; Li, G.; Sun, S.; Wang, Y.; Tao, J.; Zhao, Y. Experimental Study on Urea Deposits of Urea-SCR System for Heavy Duty Diesel Engines. Vehicle Engine. 2012, 4, 43–47. [Google Scholar]
- Zhao, Y. Experimental Study of Urea Solution Spray and Decomposition and Ammonia Storage in Selective Catalytic Reduction System for Diesel Engines. Ph.D. Thesis, Tsinghua University, Beijing, China, 2012. [Google Scholar]
- Chu, X. The Mechanism of Urea Deposits for Diesel SCR After-treatment. Master’s Thesis, Shanghai University of Engineering Science, Shanghai, China, 2013. [Google Scholar]
- Wang, J.; Zhao, C.; Dong, Y.; Zhao, C.; Zhu, L. A Research on the Influence of Structural Parameters on the Performance of Urea-SCR System. Vehicle Engine. 2019, 41, 29–35. [Google Scholar]
- Li, T.; Peng, F.; Shu, Y.; Yage, G.; Shao, L.; Zi, L. CFD studies on effects of SCR mixers on the performance of urea conversion and mixing of the reducing agent. Chem. Eng. Process. 2018, 123, 82–88. [Google Scholar]
- Birkhold, F.; Meingast, U.; Wassermann, P.; Deutschmann, O. Analysis of the Injection of Urea-water-solution for automotive SCR DeNOx-Systems: Modeling of Two-phase Flow and Spray/Wall0Interaction. SAE 2006-01-0643. Available online: https://saemobilus.sae.org/content/2006-01-0643/ (accessed on 3 April 2006).
- Edelbauer, W. Coupling of 3D Eulerian and Lagrangian Spray Approaches in Industrial Combustion Engine Simulations. In Proceedings of the 24th European Conference on Liquid Atomization and Spray Systems ILASS11, Estoril, Portugal, 5–7 September 2011. [Google Scholar]
- AVL. Eulerian_Multiphase. AVL FIRE VERSION 2013. Available online: https://altairhyperworks.com/partner/FIRE-M/Modules-and-Specifications# (accessed on 9 April 2014).
- Theofanus, T.G.; Sullivan, J.P. Turbulence in two-phase dispersed flows. J. Fluid Mech. 1982, 116, 343–362. [Google Scholar] [CrossRef]
- Tatschl, R.; v Künsberg-Sarre, C.; Alajbegovic, A.; Winklhofer, E. Diesel Spray Modeling Including Multidimensional Cavitation Nozzle Flow Effects. In Proceedings of the ILASS-Europe Conference, Darmstadt, Germany, 11–13 September 2000. [Google Scholar]
- Von Berg, E.; Edelbauer, W.; Alajbegovic, A.; Tatschl, R.; Volmajer, M.; Kegl, B.; Ganippa, L.C. Coupled Simulations of Nozzle Flow, Primary Fuel Jet Breakup, and Spray Formation. J. Eng. Gas Turbines Power. 2005, 127, 897–908. [Google Scholar] [CrossRef]
- Perman, E.P.; Lovett, T. Vapor pressure and heat of dilution of aqueous urea solutions. Trans. Faraday Soc. 1926, 22, 1–19. [Google Scholar] [CrossRef]
- Kim, J.Y.; Ryu, S.H.; Ha, J.S. Nμmerical prediction of the characteristics of spray-induced mixing and thermal decomposition of urea solution in SCRsystems. In Proceedings of the ICEF04, Long Beach, CA, USA, 24–27 October 2004. [Google Scholar]
- Chen, M.; Williams, S. Modelling and Optimization of SCR-Exhaust Aftertreatment Systems. SAE Paper 2005-01-0969. Available online: https://saemobilus.sae.org/content/2005-01-0969/ (accessed on 11 April 2005).
Figure 1.
(a) Schematic diagram of the nozzle structure; and (b) Nozzle installation position in the SCR system.
Figure 1.
(a) Schematic diagram of the nozzle structure; and (b) Nozzle installation position in the SCR system.

Figure 2.
Urea pyrolysis mechanism.

Figure 3.
Initial design.

Figure 4.
Particle traces and flow line distribution of the initial nozzle (Operation Points 1).

Figure 5.
Flow rate distribution uniformity of the inlet face of the SCR catalyst (Uniformity Index = 0.94, Operation Points 1).
Figure 5.
Flow rate distribution uniformity of the inlet face of the SCR catalyst (Uniformity Index = 0.94, Operation Points 1).

Figure 6.
NH3 distribution uniformity of the inlet face of the SCR catalyst (Uniformity Index = 0.58, Operation Points 1).
Figure 6.
NH3 distribution uniformity of the inlet face of the SCR catalyst (Uniformity Index = 0.58, Operation Points 1).

Figure 7.
Optimization design of the nozzle.

Figure 8.
Droplet distributions and streamline distribution of the optimized nozzle.

Figure 9.
Flow velocity distribution of the face of the catalyst with the optimized nozzle (UI = 0.97, Operation Points 1).
Figure 9.
Flow velocity distribution of the face of the catalyst with the optimized nozzle (UI = 0.97, Operation Points 1).

Figure 10.
NH3 distribution of the optimization nozzle (UI = 0.92, Operation Points 1).

Figure 11.
Spray particle size test bench.

Figure 12.
Spray particle size distribution test results with different nozzles. (a) Spray particle size distribution results of 3750 mL/h (Original Nozzle: SMD = 39.5 um); and (b) Spray particle size distribution results of 3750 mL/h (Optimized Nozzle: SMD = 35.2 um).
Figure 12.
Spray particle size distribution test results with different nozzles. (a) Spray particle size distribution results of 3750 mL/h (Original Nozzle: SMD = 39.5 um); and (b) Spray particle size distribution results of 3750 mL/h (Optimized Nozzle: SMD = 35.2 um).

Figure 13.
Simulation results of the spray particle size distribution with different nozzles. (a) Original Nozzle_3750 mL/h, SMD = 40.7 um; and (b) Optimized Nozzle_3750 mL/h, SMD = 37.1 um.
Figure 13.
Simulation results of the spray particle size distribution with different nozzles. (a) Original Nozzle_3750 mL/h, SMD = 40.7 um; and (b) Optimized Nozzle_3750 mL/h, SMD = 37.1 um.

Figure 14.
Deposit formation after a 2 h operation at low temperature operation points, (a) initial design, and (b) optimized design.
Figure 14.
Deposit formation after a 2 h operation at low temperature operation points, (a) initial design, and (b) optimized design.


Table 1.
Urea pyrolysis kinetic parameters (Kim).
| Activation Energy Ea | Frequency Factor A | Wall Film Temperature T |
|---|---|---|
| J/mol | kg/s·m2 | K |
| 55000 | 900 | Calculated wall film temperature |
Table 2.
Simulation calculation boundary conditions.
| Parameter | Operating Point1 | Operating Point2 | Operating Point3 | Unit |
|---|---|---|---|---|
| Engine Speed | 1500 | 2000 | 1000 | rpm |
| Torque | 125 | 150 | 80 | Nm |
| Adblue injection rate | 1200 | 1800 | 700 | mL/h |
| Exhaust Temperature | 425 | 450 | 330 | °C |
| Exhaust Mass flow rate | 460 | 580 | 360 | Kg/h |
Table 3.
Simulation Results of Different Operating Points.
| Parameter | Operating Point1 | Operating Point2 | Operating Point3 |
|---|---|---|---|
| Original/Optimized | Original/Optimized | Original/Optimized | |
| Flow Uniformity | 0.94/0.97 | 0.95/0.97 | 0.95/0.96 |
| NH3 Uniformity | 0.58/0.92 | 0.65/0.94 | 0.55/0.91 |
Table 4.
Engine Setup.
| Parameter | Value |
|---|---|
| Intake form | Turbocharged |
| Number of cylinders | 4 |
| Displacement/L | 3.1 |
| Maximum output power/kW | 125 |
| Rated speed/(r·min−1) | 2600 |
| Maximum Torque/(N·m) | 603.8 |
Table 5.
Measurement Equipment.
| Device Name | Model | Manufacturer |
|---|---|---|
| Dynamometer | AVL220 | AVL List Company |
| Fuel consumption meter | AVL735 | AVL List Company |
| Air flow meter | FMT700-P | Asea Brown Boveri Ltd. |
| Gas analyzer | HORIBA7500 | HORIBA Instruments Incorporated |
Table 6.
WHSC and WHTC emission certification results.
| Nozzle | Emission Cycle | NOx Emission | Average NH3 Leakage |
|---|---|---|---|
| Initial Design | WHTC | 0.356 g/kWh | 1.2 ppm |
| WHSC | 0.209 g/kWh | 0.2 ppm | |
| Optimized Design | WHTC | 0.201 g/kWh | 0.8 ppm |
| WHSC | 0.145 g/kWh | 0.1 ppm |
© 2019 by the authors. Licensee MDPI, Basel, Switzerland. This article is an open access article distributed under the terms and conditions of the Creative Commons Attribution (CC BY) license (http://creativecommons.org/licenses/by/4.0/).
Share and Cite
MDPI and ACS Style
Qian, F.; Ma, D.; Zhu, N.; Li, P.; Xu, X. Research on Optimization Design of SCR Nozzle for National VI Heavy Duty Diesel Engine. Catalysts 2019, 9, 452. https://doi.org/10.3390/catal9050452
AMA Style
Qian F, Ma D, Zhu N, Li P, Xu X. Research on Optimization Design of SCR Nozzle for National VI Heavy Duty Diesel Engine. Catalysts. 2019; 9(5):452. https://doi.org/10.3390/catal9050452
Chicago/Turabian StyleQian, Feng, Dong Ma, Neng Zhu, Peng Li, and Xiaowei Xu. 2019. "Research on Optimization Design of SCR Nozzle for National VI Heavy Duty Diesel Engine" Catalysts 9, no. 5: 452. https://doi.org/10.3390/catal9050452
Note that from the first issue of 2016, this journal uses article numbers instead of page numbers. See further details here.