Article

Photoelectrocatalytic H2 and H2O2 Production Using Visible-Light-Absorbing Photoanodes

by
Ioannis Papagiannis
1,
Elias Doukas
1,
Alexandros Kalarakis
2,
George Avgouropoulos
1 and
Panagiotis Lianos
3,*
1
Department of Materials Science, University of Patras, 26500 Patras, Greece
2
Mechanical Engineering Department, Technological-Educational Institute of Western Greece, 26334 Patras, Greece
3
Department of Chemical Engineering, University of Patras, 26500 Patras, Greece
*
Author to whom correspondence should be addressed.
Catalysts 2019, 9(3), 243; https://doi.org/10.3390/catal9030243
Submission received: 24 January 2019 / Revised: 19 February 2019 / Accepted: 27 February 2019 / Published: 6 March 2019
(This article belongs to the Special Issue Catalysts for Solar Fuels)

Abstract

:
Hydrogen and hydrogen peroxide have been photoelectrocatalytically produced by electrocatalytic reduction using simple carbon electrodes made by depositing a mesoporous carbon film on carbon cloth. Visible-light-absorbing photoanodes have been constructed by depositing mesoporous CdS/TiO2 or WO3 films on transparent fluorine-doped tin oxide (FTO) electrodes. Both produced substantial photocurrents of up to 50 mA in the case of CdS/TiO2 and 25 mA in the case of WO3 photoanodes, and resulting in the production of substantial quantities of H2 gas or aqueous H2O2. Maximum hydrogen production rate was 7.8 µmol/min, and maximum hydrogen peroxide production rate was equivalent, i.e., 7.5 µmol/min. The same reactor was employed for the production of both solar fuels, with the difference being that hydrogen was produced under anaerobic and hydrogen peroxide under aerated conditions. The present data promote the photoelectrochemical production of solar fuels by using simple inexpensive materials for the synthesis of catalysts and the construction of electrodes.

Graphical Abstract

1. Introduction

Hydrogen and hydrogen peroxide are two very important fuels. Hydrogen offers the highest gravimetric heat of combustion, ~286 kJ/mol (143 MJ/kg), and it is the most benign of all standard fuels, since its combustion simply produces water. Hydrogen peroxide is also an energy storage material, and it has the advantage of being easily handled, since it can be stored as a water solution. The energy density of H2O2 then depends on water solution concentration. The most realistic route for energy production using H2O2 as fuel is via hydrogen peroxide fuel cells. Oxidation and reduction of H2O2 in a fuel cell can be represented by the following reactions [1,2]:
( 1 ) Anode   ( oxidation ) : H 2 O 2 O 2   +   2 H +   +   2 e + 0.68   V   vs .   NHE ( 2 ) Cathode   ( reduction ) : H 2 O 2   +   2 H +   +   2 e 2 H 2 O + 1.76   V   vs .   NHE ( 3 ) Overall   reaction : 2 H 2 O 2 O 2   +   2 H 2 O Δ V   =   1.09   V
The total energy generated by means of reactions (1–3) corresponds to 117 kJ/mol H2O2 [2,3]. Obviously, hydrogen peroxide is an interesting energy storage material, and its consumption is also benign, since it results in the release of only oxygen and water. In order to compare these data with corresponding values for fossil fuels, it is noted that the combustion of methane approximately amounts to 889 kJ/mol (55.6 MJ/kg), and to 2220 kJ/mol (50.5 MJ/kg) of propane, while that of hydrogen peroxide is only 3.4 MJ/kg. The low gravimetric energy density of hydrogen peroxide is however, not a serious problem in view of the advantages that are offered by its convenient handling as aqueous solution. Hydrogen on the other hand, needless to say, in addition to all other applications, can also be used as a fuel to feed the well-known hydrogen fuel cells [4,5].
Both H2 and H2O2 can be produced as solar fuels in a sustainable manner by converting solar energy. In the present work, the production of both these solar fuels has been studied by the means of photoelectrocatalysis. Photoelectrocatalytic hydrogen production can be obtained by water splitting, as first attempted in the seminal work of Fujishima and Honda more than 40 years ago [6]. However, water oxidation is less efficient than the oxidation of organic sacrificial agents [7]. Therefore, photoelectrocatalytic hydrogen production has been achieved on several occasions by the oxidation of organic compounds [7,8,9,10,11,12], which may as well be wastes, thus offering an additional environmental benefit. In a typical procedure, a photoelectrochemical cell comprising a photoanode and a dark cathode is used [7]. The anode electrode carries a nanoparticulate semiconductor photocatalyst or a combination of semiconductors; for example, TiO2-CdS [7,10]. Photons that are absorbed by the photocatalyst generate electrons and holes. Holes are consumed for the oxidation of the fuel [8], while the electrons flow through an external circuit to the cathode electrode, where they assist reduction reactions. Reduction reactions can produce hydrogen under anaerobic conditions by the following equations [7]:
( 4 ) 2 H +   +   2 e H 2 ( acidic   environment ,   0.0   V   vs .   NHE ) ( 5 ) or 2 H 2 O   +   2 e 2 O H   +   H 2 ( alkaline   environment ,   0.83   V   vs .   NHE )
Both reduction reactions are 2-electron processes. In the presence of oxygen, no more hydrogen is expected. The reduction of oxygen can lead to the formation of hydrogen peroxide according to the following reactions, which are also 2-electron processes [1,2,13,14,15]:
( 6 ) O 2   +   2 H +   +   2 e H 2 O 2 ( acidic   environment ,   + 0.68   vs .   NHE ) ( 7 ) or 2 H 2 O   +   O 2   +   2 e H 2 O 2   +   2 O H ( alkaline   environment ,   0.15   V   vs .   NHE )
Reduction of oxygen may, however, be carried out by the following 4-electron processes [8]:
( 8 ) O 2   +   4 H +   +   4 e 2 H 2 O ( acidic   environment ,   + 1.23   vs .   NHE ) ( 9 ) or 2 H 2 O   +   O 2   +   4 e 4 O H ( alkaline   environment ,   + 0.40   V   vs .   NHE )
Four-electron processes are less probable and they necessitate efficient electocatalysts, like noble metals. Therefore, the production of hydrogen peroxide is more probable and is less demanding of the presence of electrocatalysts. This matter will be critically examined presently.
The above introductory remarks show that it is possible to produce hydrogen or hydrogen peroxide by similar photoelectrochemical processes. Hydrogen may be produced under anaerobic conditions and hydrogen peroxide in the presence of oxygen. Both may be produced at the cathode electrode, provided that an electric current flows in an external circuit that connects the two electrodes. Overall, an organic fuel is consumed by photocatalytic oxidation at the anode electrode, providing electrons that drive the production of hydrogen or hydrogen peroxide at the cathode electrode. This process is schematically represented by Figure 1. The flow of electrons in the external circuit may be unassisted [1], or may be facilitated by externally applying a forward bias. The electrochemical potential levels of hydrogen and hydrogen peroxide production are 0.0 V and 0.68 V vs. NHE, respectively [7,16]. The conduction band levels of, for example, nanoparticulate TiO2 and WO3 oxide photocatalysts are located at approximately −0.2 and +0.2 V vs. NHE [17]. The potential difference driving electrons from photoanodes loaded with those photocatalysts is equal to the corresponding level differences. Thus for hydrogen production, titania photoanode provides a difference ΔV of 0.2 V, which is eliminated by inevitable losses. The situation is even worse with WO3 photoanodes, which create a reverse bias. Both photoanodes then necessitate a forward bias for hydrogen production. In the case of hydrogen peroxide, a titania photoanode provides a difference of ~0.88 V, which is sufficient for the unassisted flow of electrons, but in the case of WO3, a forward bias may be practically necessary to produce hydrogen peroxide. In the present work, these photocatalysts will play a protagonist role, and therefore, the above considerations are necessary.
The present work targets the employment of visible-light-absorbing photocatalysts for the broader exploitation of solar radiation. Thus, WO3, which absorbs visible light, has indeed been used as a photocatalyst. In addition, titania has been combined with CdS nanoparticulate sensitizers to also expand its absorption into the visible range. Both have been employed to construct photoanodes that function in the presence of ethanol as sacrificial organic agents (i.e., fuel to be consumed). Ethanol has been repeatedly used in the past as a model fuel, and it works equally well with TiO2/CdS, as with WO3 photoanodes [7,9]. These photoanodes have been used to run a photoelectrochemical cell and produce hydrogen or hydrogen peroxide, thus promoting a simple system that may be used to produce solar fuels by the conversion of solar radiation and the consumption of organic wastes.

2. Results and Discussion

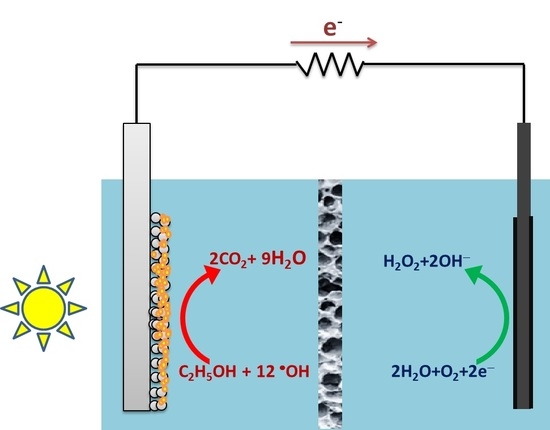
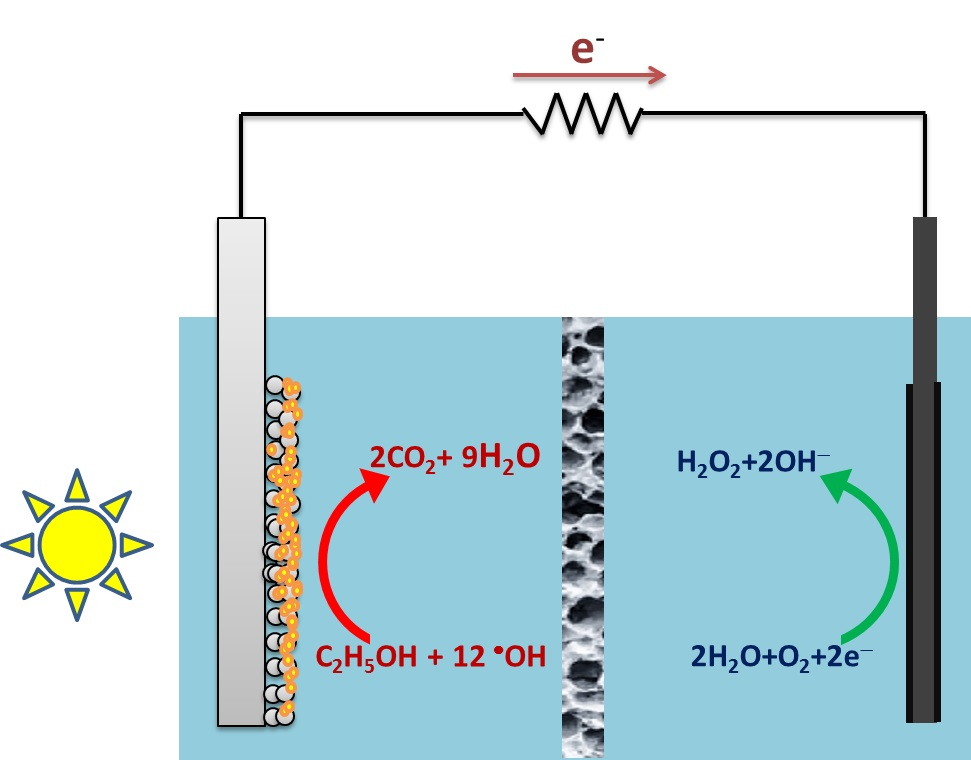
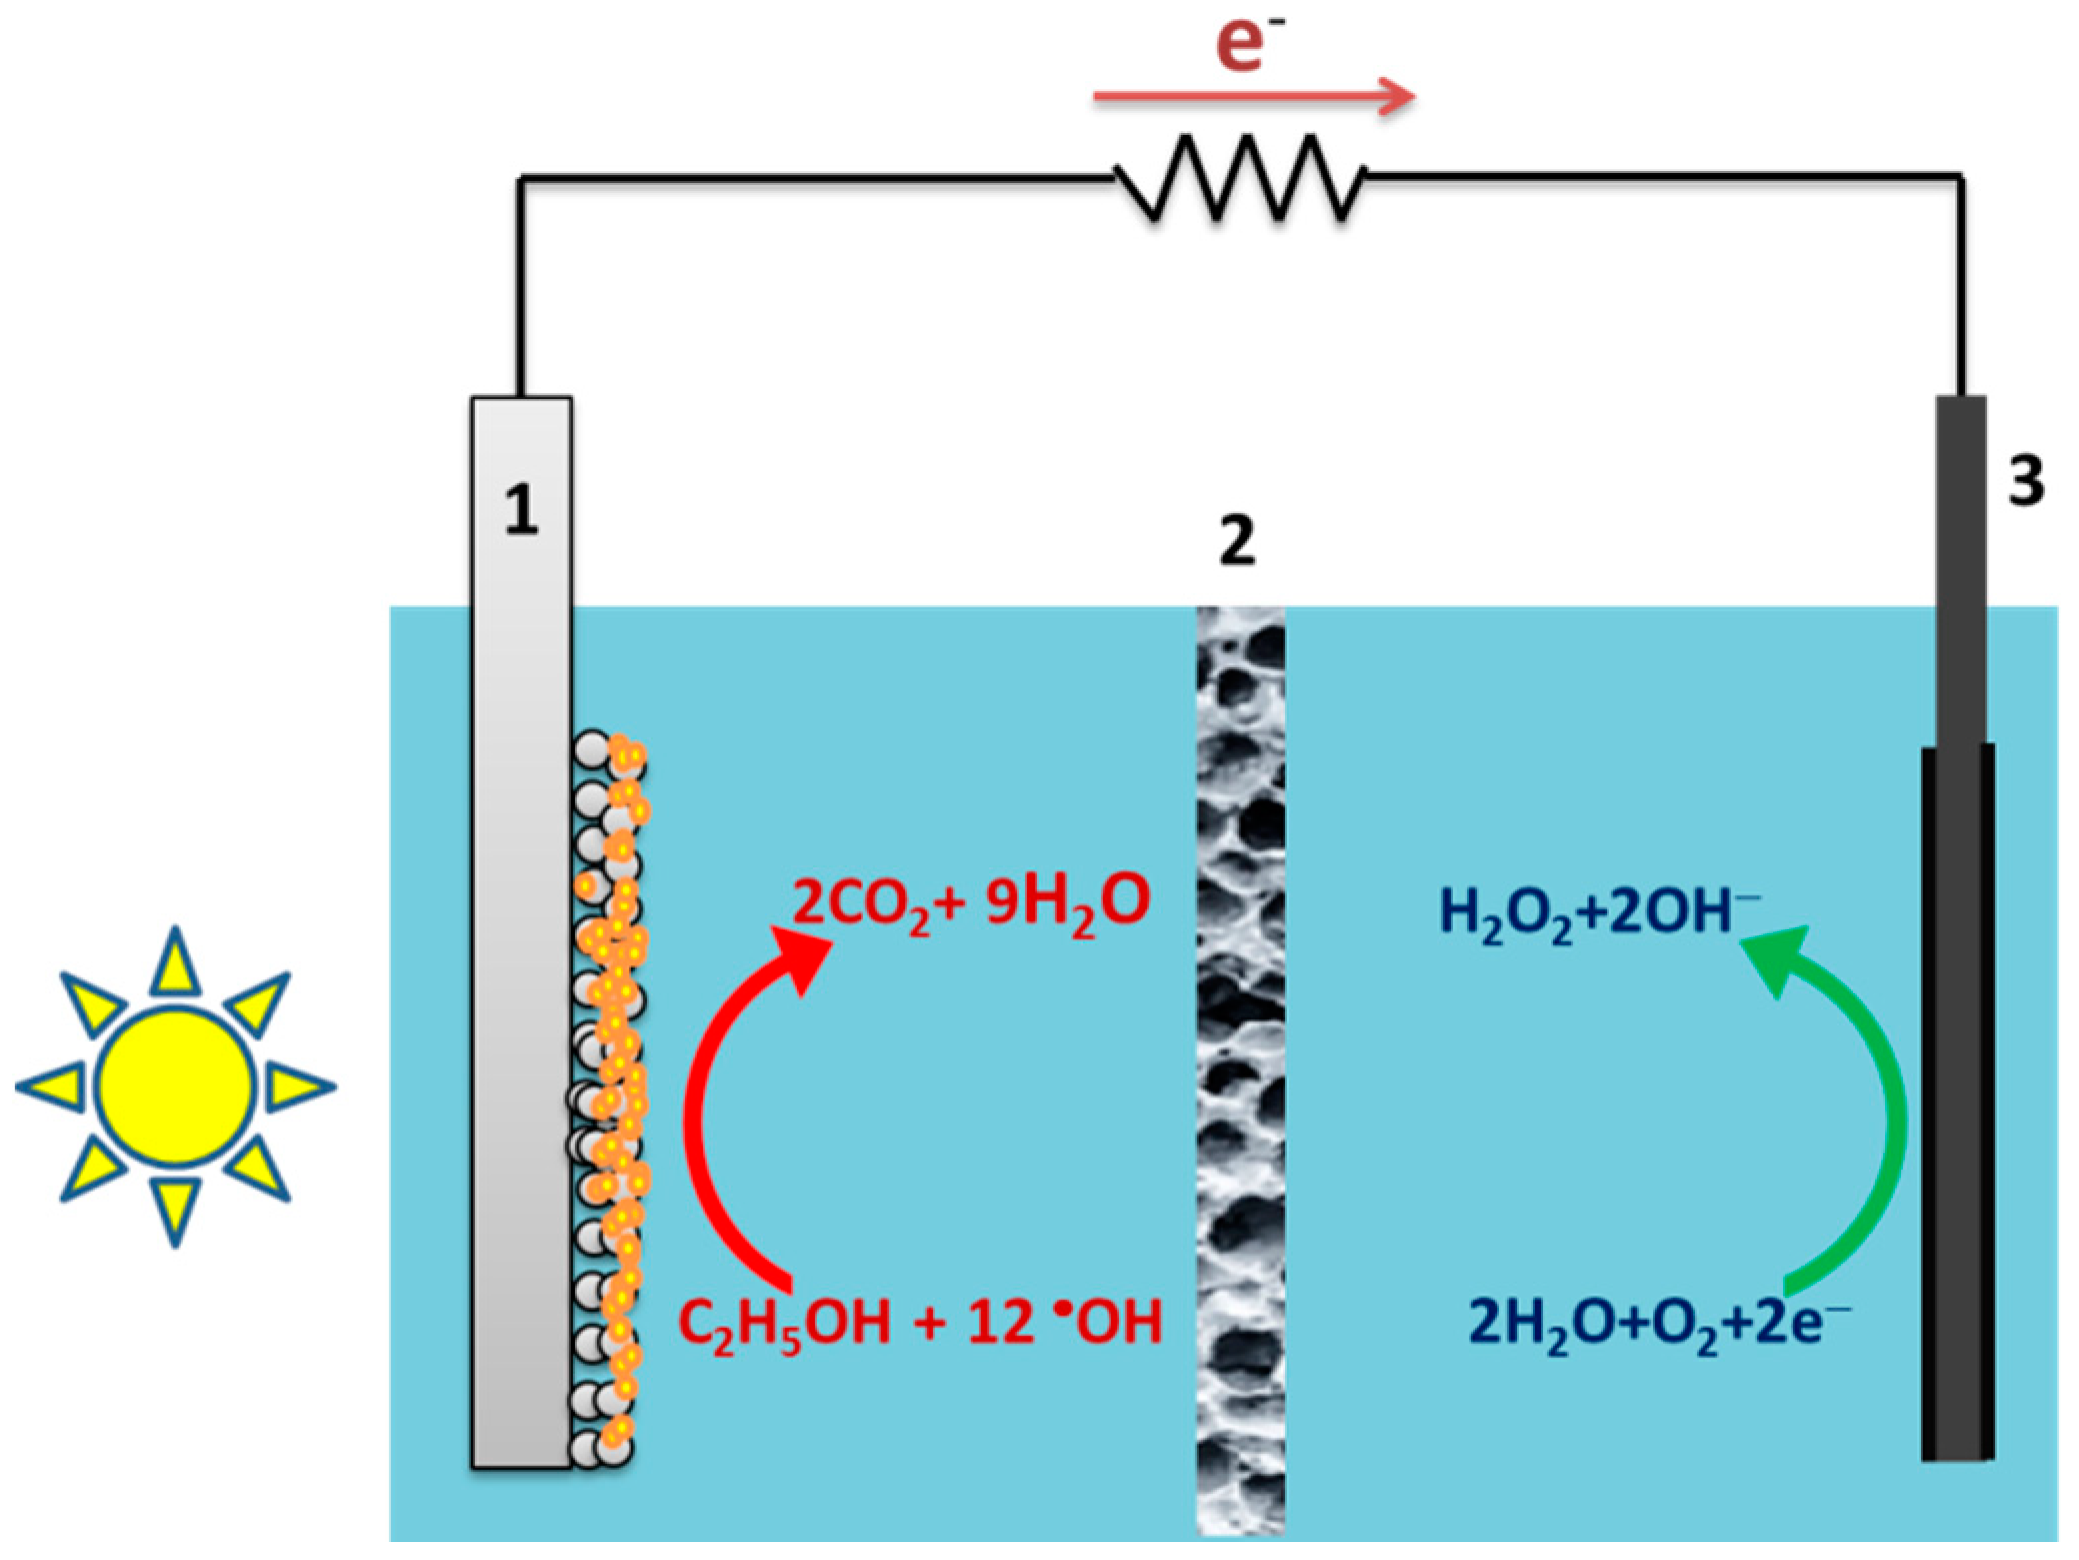
2.1. Design of the Reactor

The reactor, which was employed to study photoelectrocatalytic hydrogen and hydrogen peroxide production is schematically illustrated in Figure 2. It is an H-shaped reactor that consists of two compartments communicating through an ion transfer membrane. The cathode compartment can be isolated from the ambient environment by appropriate fittings when an anaerobic environment is necessary. The reference electrode was placed in the anode compartment next to the anode (working) electrode. Photoanodes were constructed using a Fluorine doped Tin Oxide (FTO) electrode, on which a mesoporous photocatalyst film was deposited. Two cases have been examined. In the first case, a nanoparticulate titania film was first deposited, and it was sensitized by CdS deposited by the SILAR method (Successive ionic layer adsorption and reaction) [18,19]. Details are provided in the Experimental section. In the second case, a nanoparticulate WO3 film alone has been deposited. Both these photoanodes absorb visible light. Indeed, as seen in Figure 3 showing diffuse-reflection absorption spectra of the corresponding mesoporous films, while titania alone absorbs only ultraviolet (UV) radiation, WO3 absorbs light up to 470 nm and CdS/TiO2 up to 550 nm. Since the functioning of the cathode depends on the flow of electrons and the number of photogenerated electrons depends on the number of photons absorbed by the semiconductors, it is then expected that both these photoanodes will generate enough current to run the cell.
The cathode (counter) electrode employed in the present work was a carbon cloth covered on one side with a layer of carbon black. Carbon black is not as efficient an electrocatalyst as, for example, a Pt-enriched layer. Nevertheless, in order to limit costs, the present system was run in the absence of Pt in an effort to quantify its limitations, and to possibly come up with a system of satisfactory efficiency and low cost.

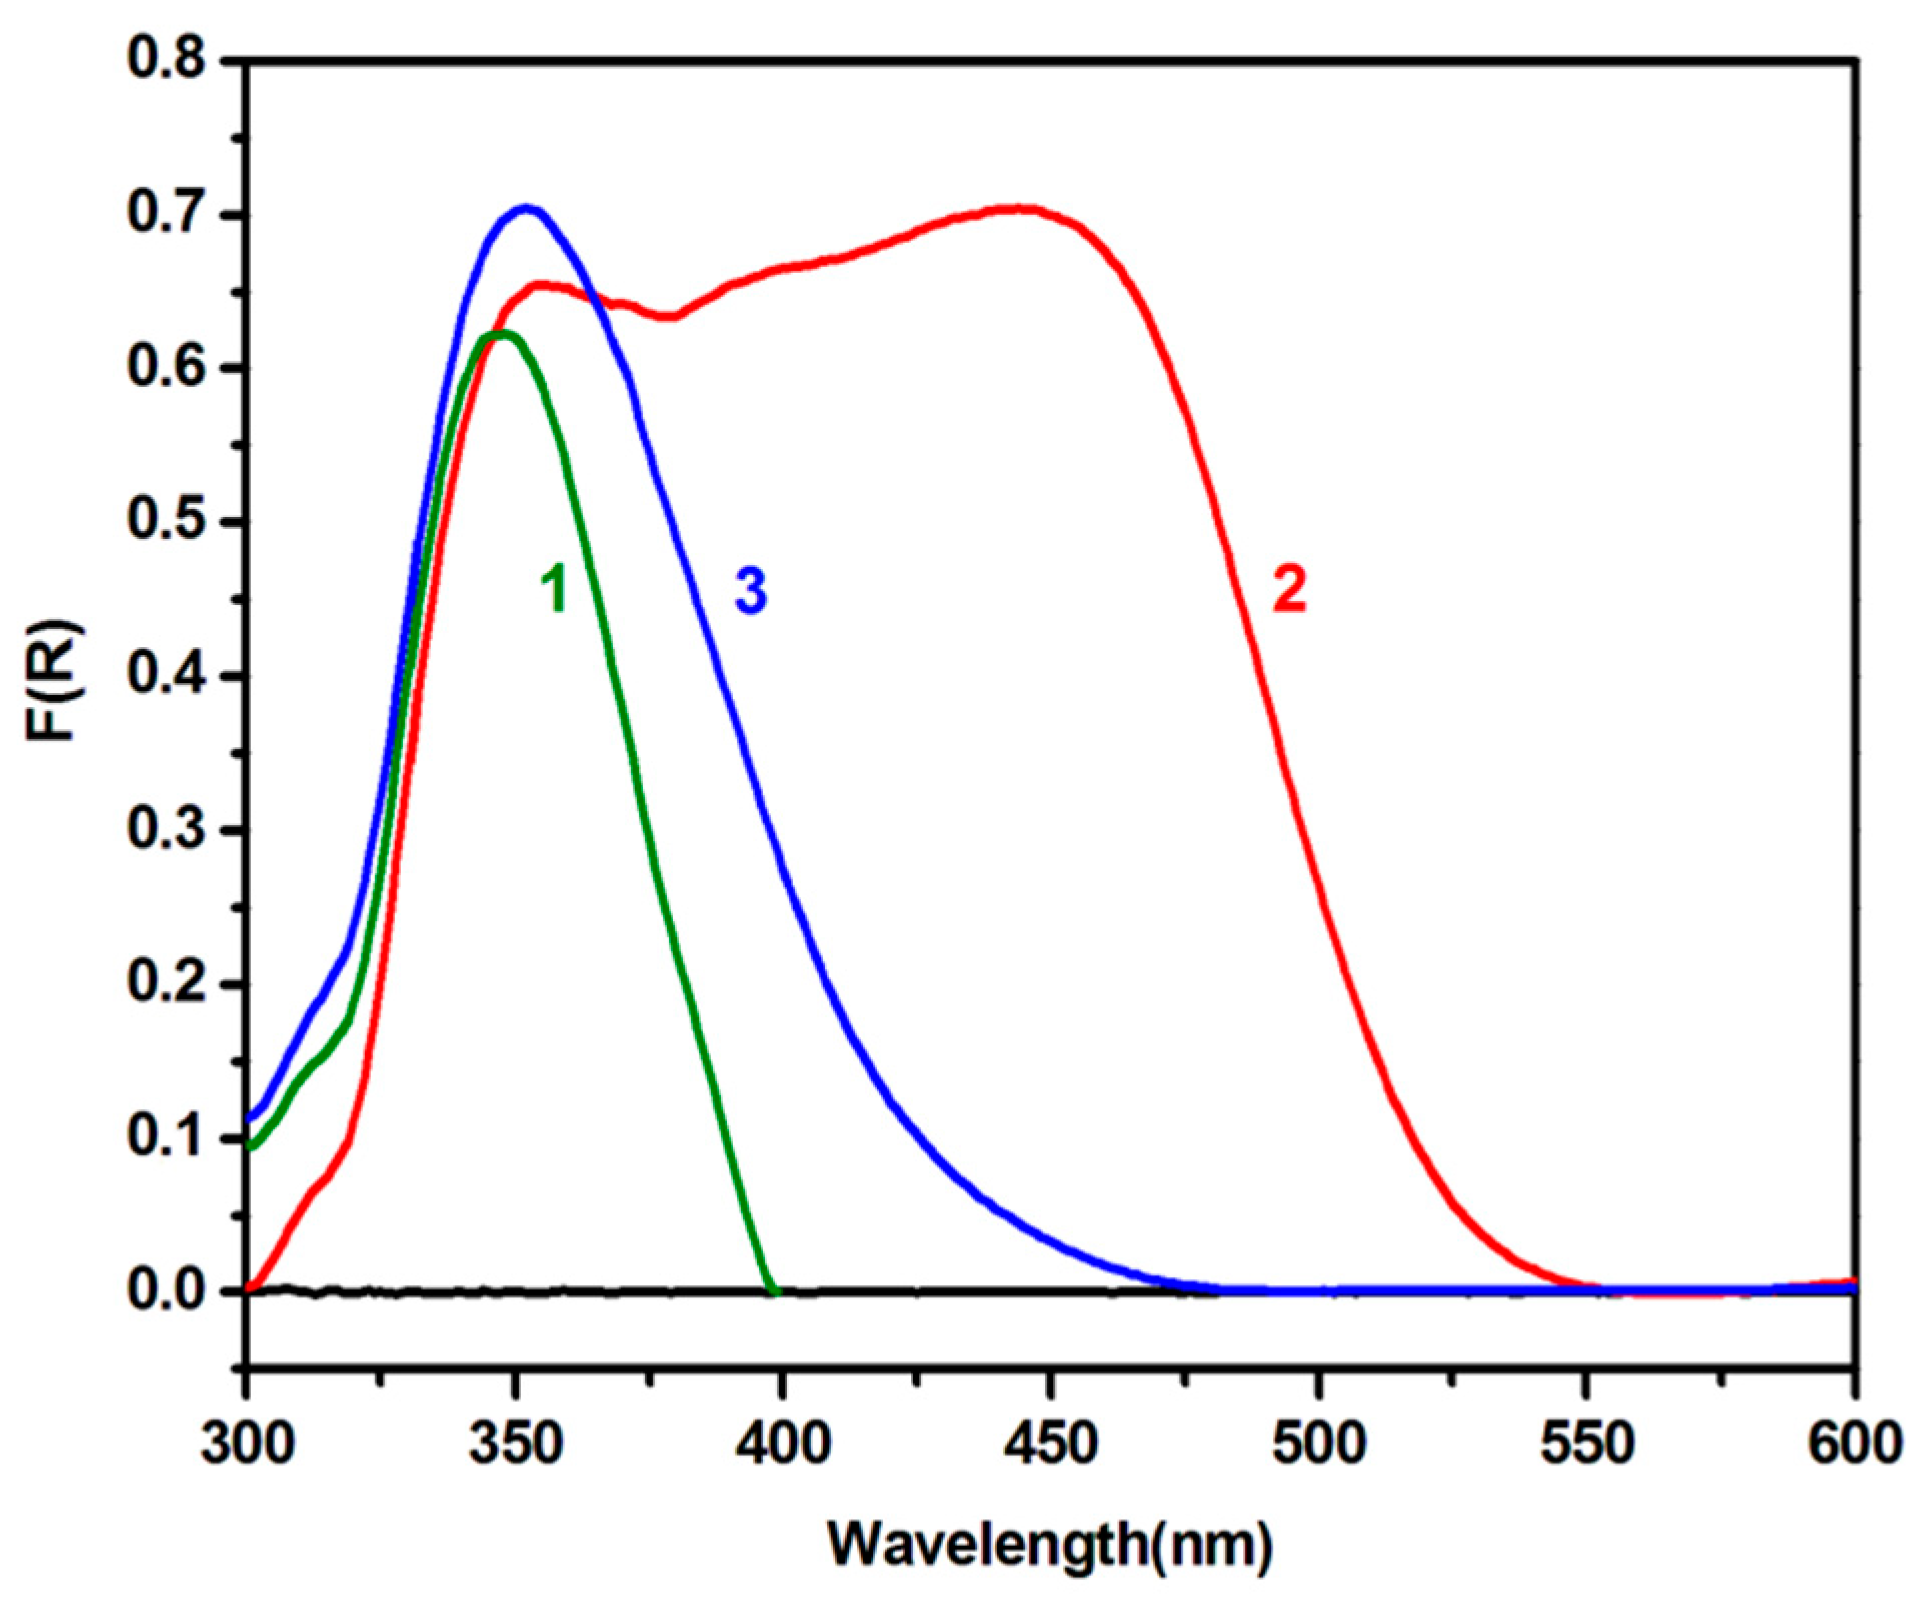
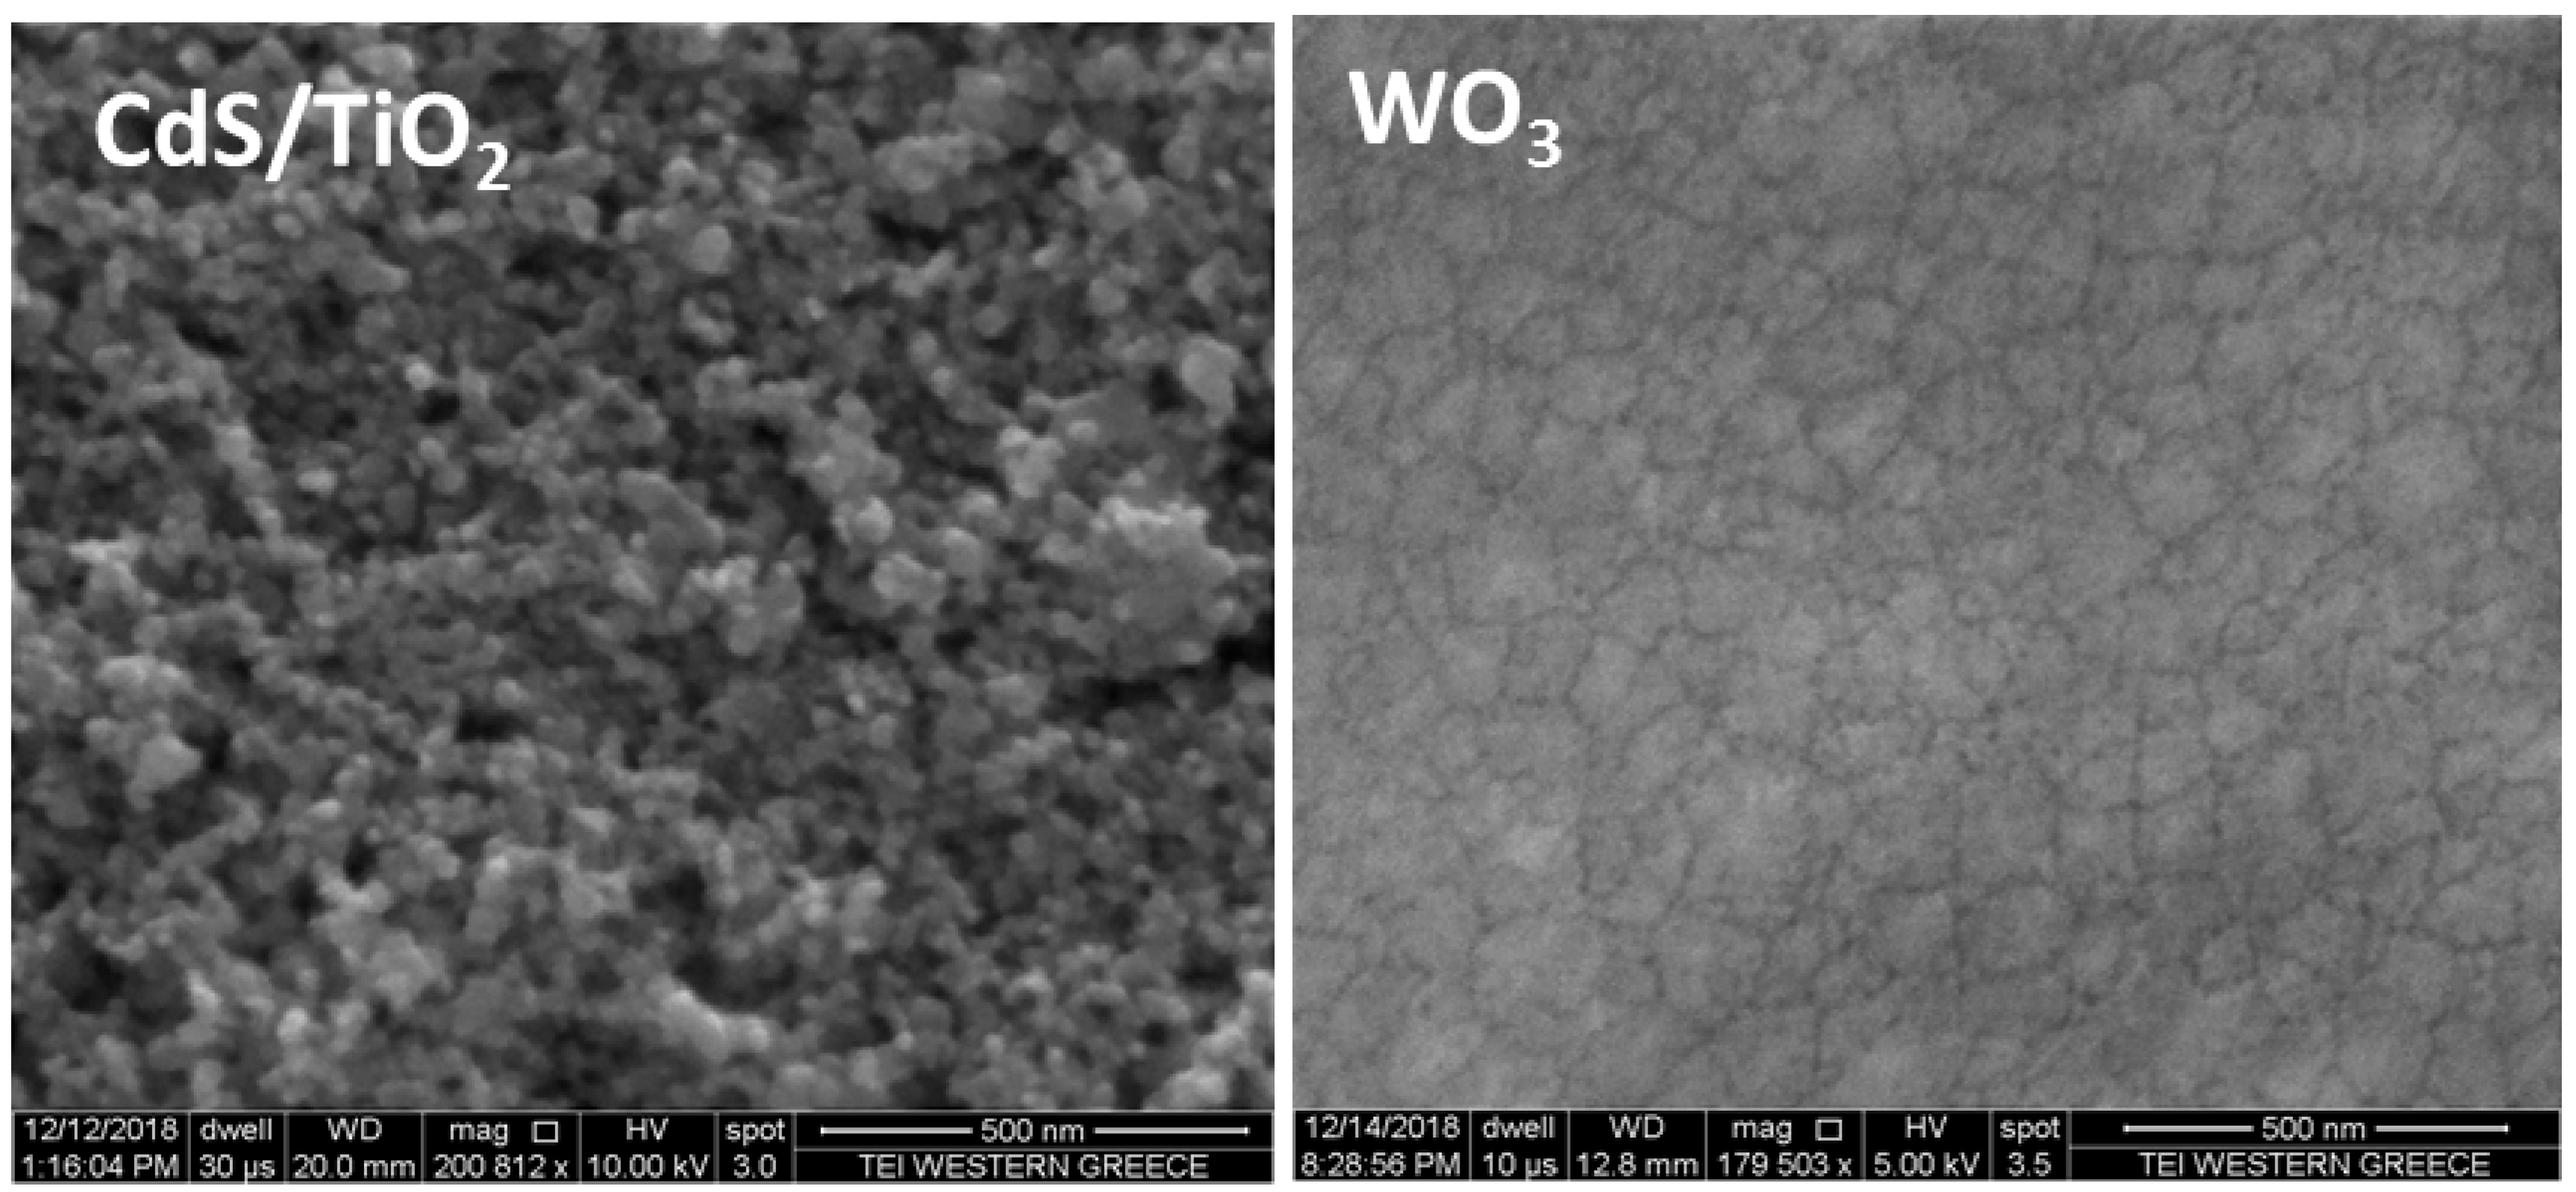
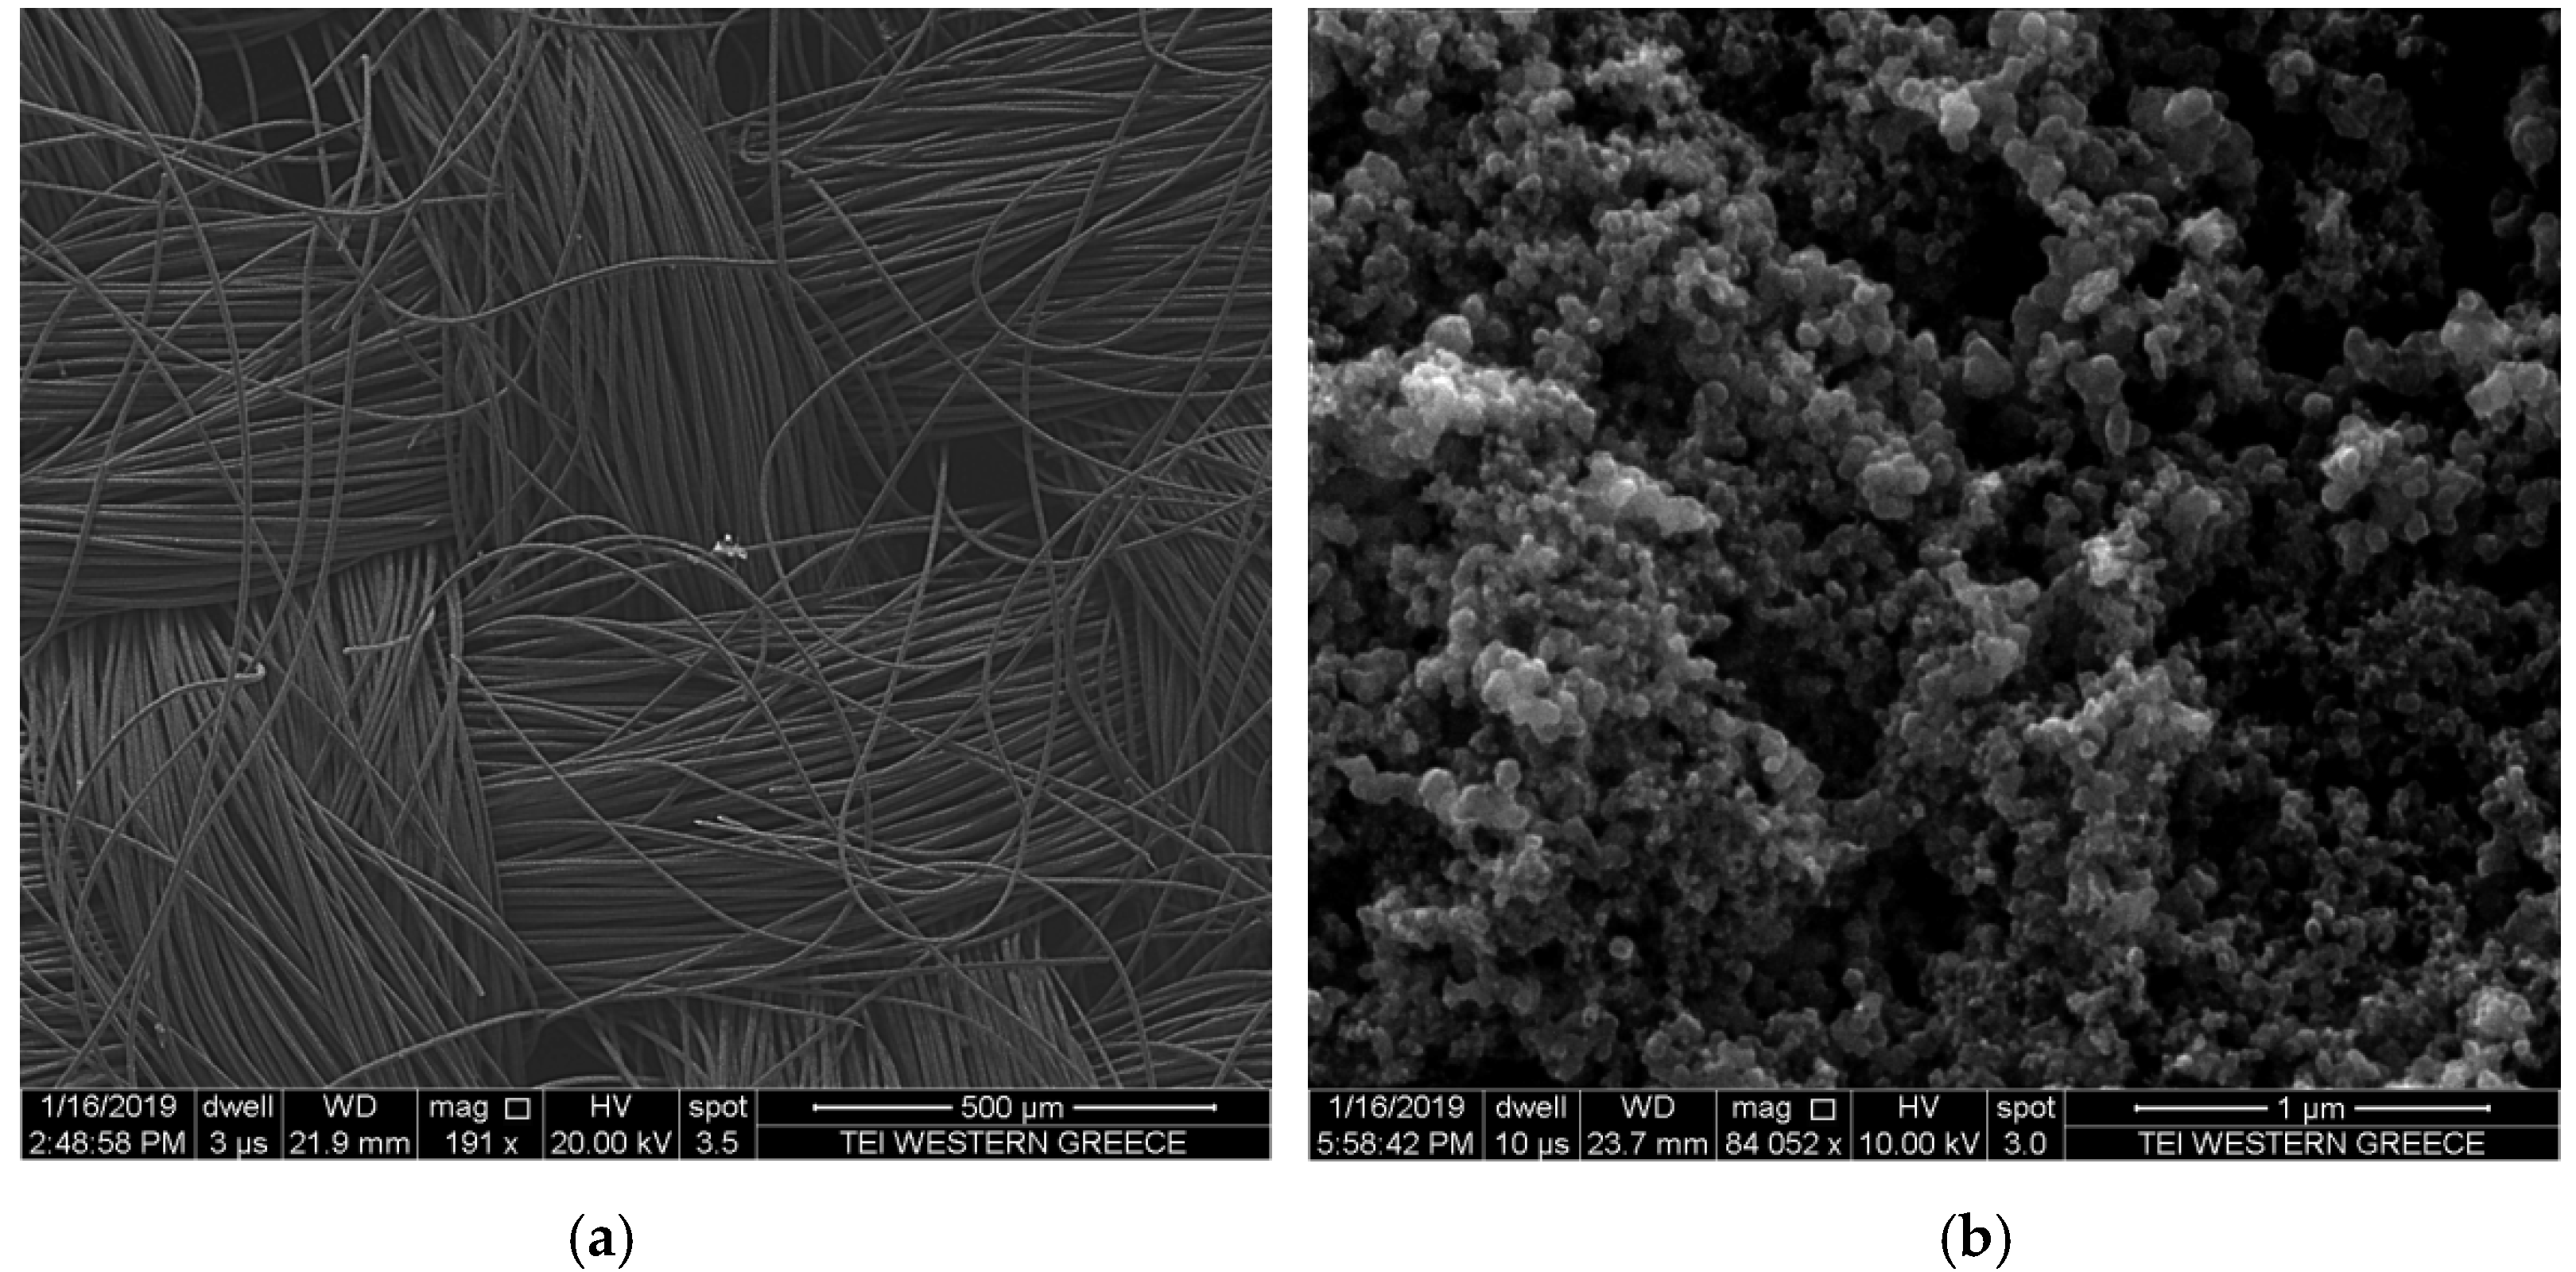
2.2. Characterization of the Photoanode and the Counter-Electrode

Reference has been made above with regard to the diffuse-reflection absorption of the photoanodes shown in Figure 3. As already said, both WO3 and the combined CdS/TiO2 semiconductor allow for substantial visible light absorption. CdS/TiO2 absorbs in a broader part of the spectrum; therefore, it absorbs more photons than WO3, and this is reflected onto the photogenerated current, as will be seen and discussed below.
An idea about the structure of the mesoporous photocatalyst film has been obtained by studying the corresponding Scanning Electron Microscopy (SEM) images shown in Figure 4. In the image corresponding to the CdS/TiO2 film, one distinguishes the typical nanostructure of TiO2 made by P25 nanoparticles, while the SILAR-deposited CdS forms an uneven dispersion of material of obviously much smaller nanoparticles that are not resolved by the present method. The size of the CdS nanoparticles formed by the SILAR method on a mesoporous titania substrate may range around 5 nm [18], while the TiO2 nanoparticles seen in Figure 4 are around 30 nm. TiO2 formed a rough surface, while the thickness of the film, as measured by the SEM image of a cross-section, was approximately 5 μm. The WO3 film obtained a much smoother surface and was much thinner (approximately 0.3 μm), with a more compact structure. The differences in their mesoporous structure and their thicknesses were due to the different film deposition methods, as described in the Experimental section. In fact, such a situation is desirable, since the optoelectronic properties of the two semiconductors are very different. Thus the hole-diffusion length, for example, in titania was 104 nm, while it was only 150 nm in WO3 [8]. It is then advisable to use thinner and more compact films in the case of WO3, in order to assure that the photogenerated charge carriers will reach the anode electrode or the film surface, while in the case of titania a more porous structure may be allowed, thus increasing the interface with the electrolyte. Nevertheless, both of the photoanodes obtained by depositing the presently described CdS/TiO2 or WO3 films produced substantial photocurrents, as will be discussed later.
SEM images were also recorded with the carbon electrodes used as counter electrodes in the present work and are shown in Figure 5. Carbon cloth was used as electrode and its structure is presented in Figure 5a. It is made by weaving carbon filaments. On the top of the carbon paper is deposited a mesoporous carbon film the structure of which is presented in Figure 5b. The mesoporous carbon layer in Fuel Cells terminology is most frequently referred as the hydrophobic gas diffusion layer because it used for the construction of electrodes in hydrogen fuel cells.

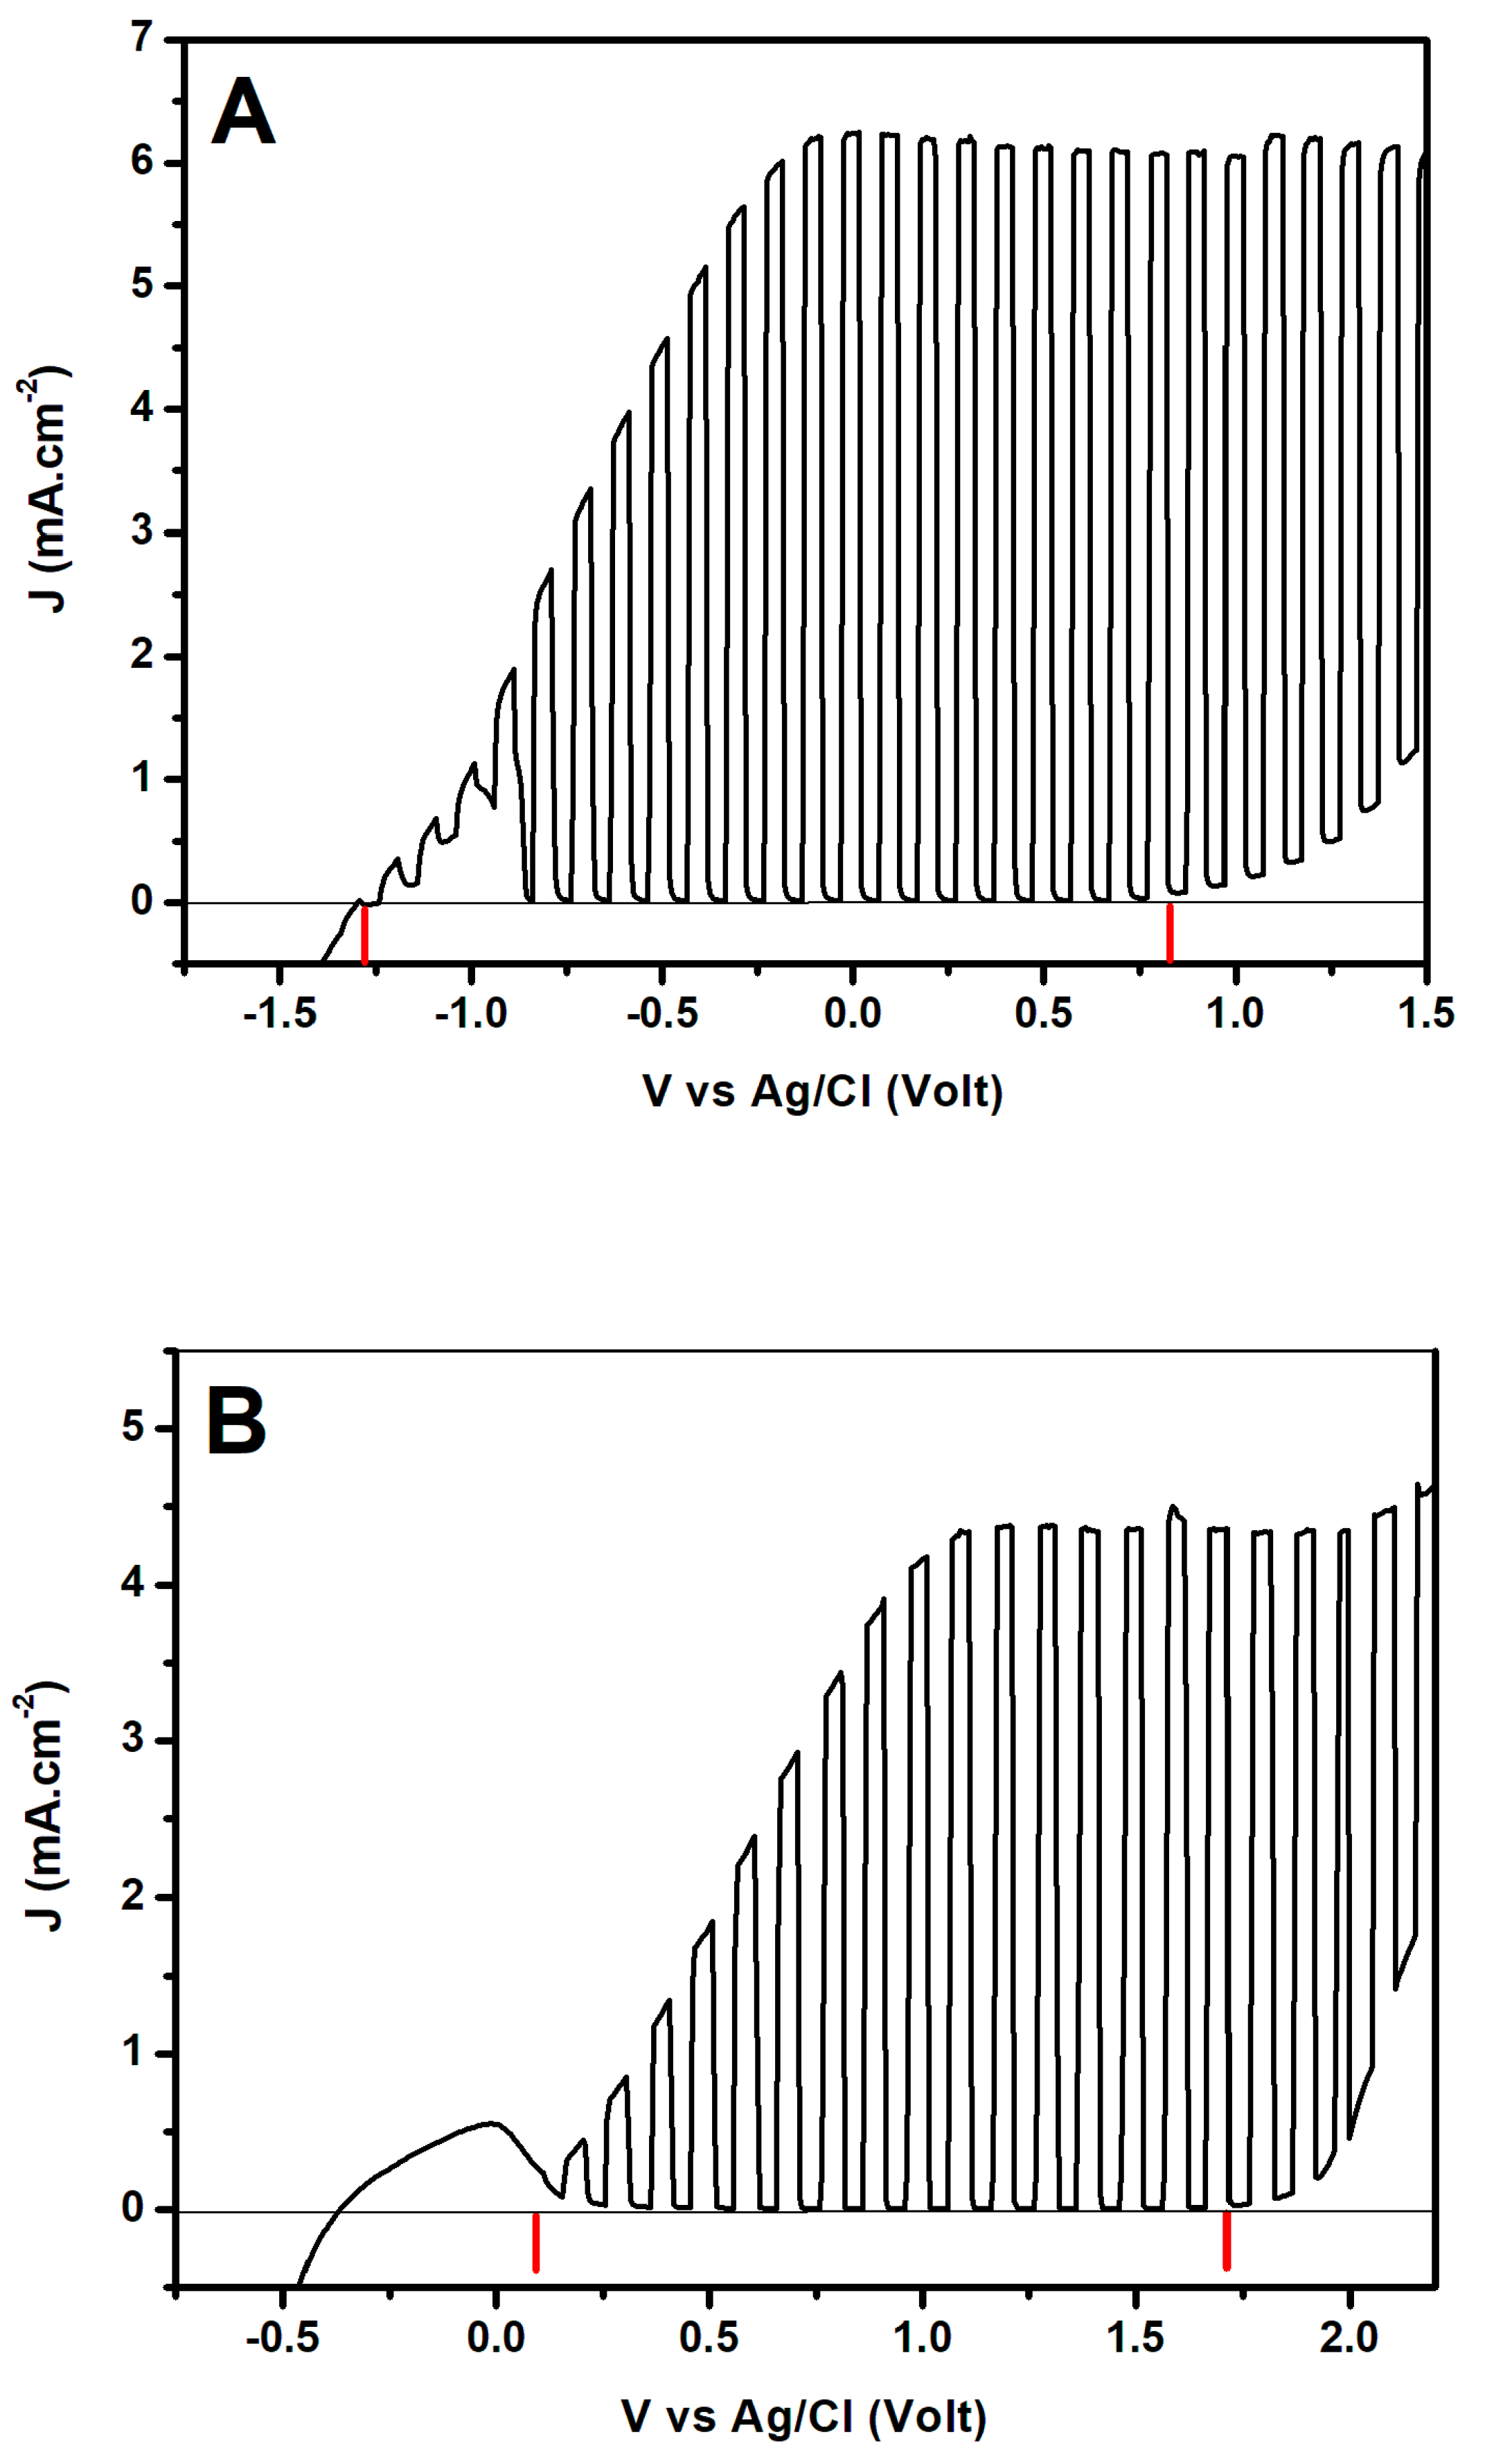
2.3. Photocurrents Generated by the Presently Used Photoanodes and Counter-Electrodes

By employing the above described reactor, photoanodes and counter-electrodes, the following photocurrents were obtained, and are presented in Figure 6. Both photoanodes gave a substantial photocurrent. Thus the current density was around 6 mA m−2 in the case of CdS/TiO2, and around 4 mA cm−2 in the case of WO3. These current densities were obtained by using 0.5 M NaOH as electrolyte in the case of CdS/TiO2, and 0.5 M Na2SO4 in the case of WO3. Ethanol at 5% (v/v) was added into the electrolyte of the anode compartment, in both cases. The difference in the current is due to two main reasons. First, the spectral response of the CdS/TiO2 photoanode was broader than WO3, as seen in Figure 3, therefore, higher current is expected in the case when more photons are absorbed. Second, as already stated, the better optoelectronic properties of titania allow for a thicker film deposition, for a more powerful photon pump, and thus for a better photocurrent generator. The maximum photocurrent density expected for the above CdS/TiO2 photoanode, which absorbs light up to 550 nm, is around 10 mA cm−2 while for WO3 (470 nm), it is around 5 mA cm−2 [20]. Both photocurrents in Figure 6 were smaller than the theoretical maximum, but this was expected, due to losses.
The data of Figure 6 were recorded in a light-chopping mode to reveal the range of photocurrent production. Thus, in the case of the CdS/TiO2 photoanode, photocurrent began below −1.0 V vs. the Ag/AgCl electrode, while at above 0.7 V vs. Ag/AgCl, electrolysis began. These limits of voltage are marked with (red) vertical lines. The maximum photocurrent was established at about 0.0 V vs. Ag/AgCl, and remained practically constant thereafter. In the case of WO3, the photocurrent started at around 0.1 V vs. Ag/AgCl while electrolysis in that case was detected at above 1.4 V vs. Ag/AgCl. A current density plateau was then detected at between 1.0 and 1.5 V vs. Ag/AgCl. The difference between the onset of the photocurrent in the two photoanodes was first of all, due to the different electrolytes used, i.e., NaOH and Na2SO4, and thus to different pH values established in the two cases. The potential was positively shifted by 0.059 × ΔpH volts when the pH decreased. The employment of an alkaline electrolyte was preferred in the case of titania photoanodes, but WO3 is unstable in alkaline electrolytes. Hence, neutral or acidic electrolytes were employed in that case [21,22,23]. Furthermore, the electrochemical potential of n-type oxide semiconductors is close to the level of their conduction band. Titania and WO3 conduction bands, as already stated, are approximately located at −0.2 V and +0.2 V vs. NHE, respectively [17]. This difference is also partly responsible for the shift of the anodic photocurrent to more positive voltages in the case of WO3. It must be clarified at this point, the conduction band level of CdS was not taken into account, since CdS acts as a sensitizer of titania; therefore, the titania conduction band is the recipient of all of the electrons photogenerated in CdS.
One characteristic of Figure 6B that is worth commenting on is that in previous works [9,21], there was a continuous increase of the photocurrent with the applied bias, when a WO3 photoanode was employed. In the present case, a plateau was observed. This difference may be explained by the type of W particles that are used to make WO3. As stated in the Experimental section, the sizes of W particles were 12 µm, i.e., larger than in the above works, where the size was smaller than 10 µm. This matter is beyond the scope of the present work, but it is worth examining on another occasion. It is finally also worth mentioning that the anodic peaks observed between approximately −1.3 and −0.8 V vs. Ag/AgCl in the case of CdS/TiO2, and between −0.4 and +0.2 V vs. Ag/AgCl in the case of WO3 derive from the adsorption of cations from the electrolyte; they are systematically observed [7,9,21], and are without importance for the present application.

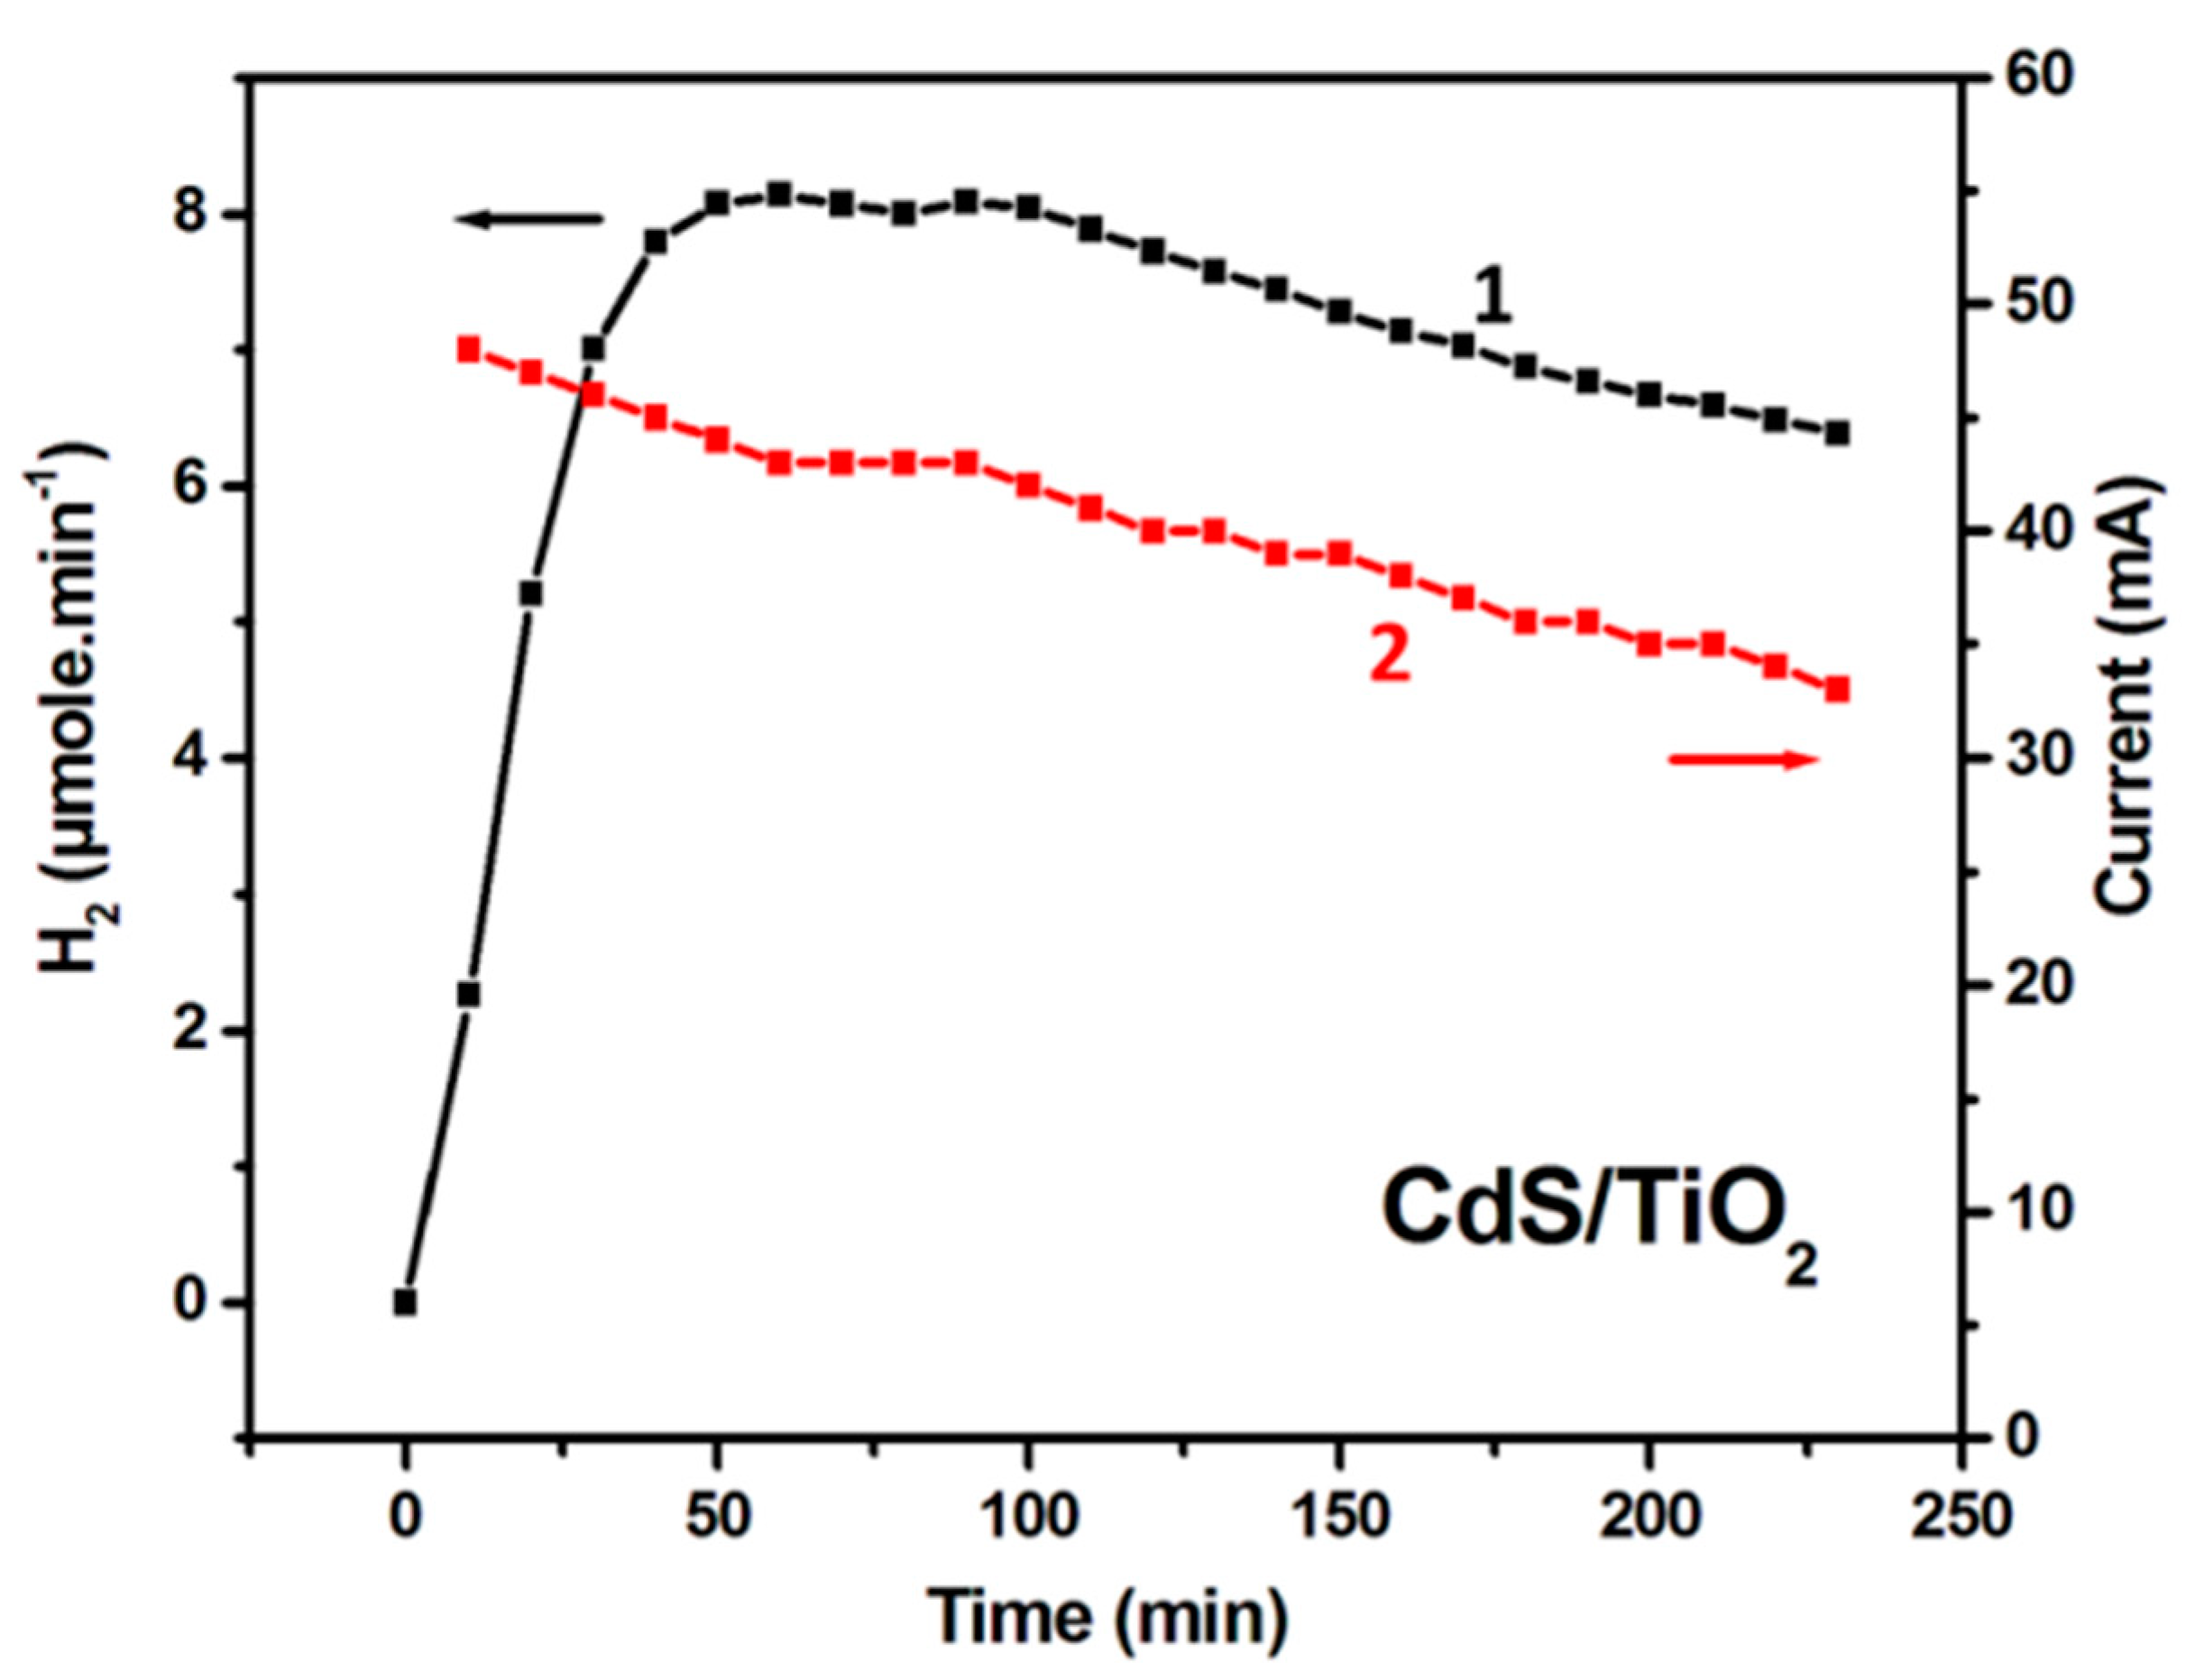
2.4. Examples of Photoelectrocatalytic Hydrogen Production by Using CdS/TiO2 or WO3 Photoanodes

Photoelectrocatalytic hydrogen production has been monitored by using the reactor of Figure 2. The counter-electrode was the same in all cases (carbon cloth covered on one side with a mesoporous carbon film). Two photoanodes have been employed with an active area of 15 cm2, one made with CdS/TiO2 and the other with WO3. Hydrogen was produced under forward bias. Based on the data of Figure 6, the maximum photocurrent was observed for a bias ≥ 0 V vs. Ag/AgCl in the case of CdS/TiO2, and ≥ 1 V vs. Ag/AgCl in the case of WO3. For this reason, the applied bias was 0 and 1 V, respectively, in order to obtain a maximum current with a minimum possible bias. The current recorded with the CdS/TiO2 photoanode, using 0.5 M NaOH as an electrolyte with 5% v/v ethanol added into the electrolyte of the anode compartment, was almost 50 mA at the beginning, but progressively decreased during the experiment, as seen in Figure 7. The decrease of the current was expected, due to ethanol consumption during the experiment, and some deterioration of the quality of the photoanode. As a consequence, the hydrogen production rate, which is proportional to the flowing current, also decreased in the course of the experiment. Interestingly, the current curve and the hydrogen production rate curve in Figure 7 evolved in parallel. The current recorded with the WO3 photoanode, with 0.5 M Na2SO4 as the electrolyte and 5% (v/v) ethanol added into the anode compartment, was about 25 mA at the beginning, and also decreased in the course of the experiment, as in the previous case. Again, the current and hydrogen production rate evolved in parallel. Both currents were not a multiple of the active area of the photoanode multiplied by the current densities recorded in Figure 6. The current collection was not as efficient in large as in small surfaces, and this is a well-known problem that is observed in the absence of a current collection grid, as in the present case. Nevertheless, both photoanodes produced substantial photocurrents, and resulted in the production of substantial quantities of hydrogen gas.
Photoelectrocatalytic hydrogen production relates gas production rate to the flowing electric current. In the ideal case, formation of one H2 molecule corresponds to a current of two electrons, according to reactions (4) or (5). A formula of practical use may then be introduced by the following equivalent: One µmol/min H2 corresponds to 2 × 10−6 × 6.022 × 1023× 1.6 × 10−19 C/60 s, which is equal to 3.21 mA. The recorded current is usually higher than the above relation depicts. The Faradaic efficiency for hydrogen production in each recorded case is the ratio of the corresponding ideal current over the actual measured current. The Faradaic efficiencies for photoelectrocatalytic hydrogen production were calculated, and are recorded in Table 1. For both photoanodes, the efficiency was around 60%, which was an improvement for results that are obtained in a previous work [7], using the same type of counter-electrode. The Faradaic efficiency was practically the same for both photoanodes. This was expected, since it depends not on the type of the photoanode, but on the structure of the reactor and the efficiency of the counter electrode, and of the electrocatalyst that decorates it. The latter was the same in both cases. Thus the photoanode affected the intensity of the current, and thus the quantity of the produced gas, but the Faradaic efficiency was the same.

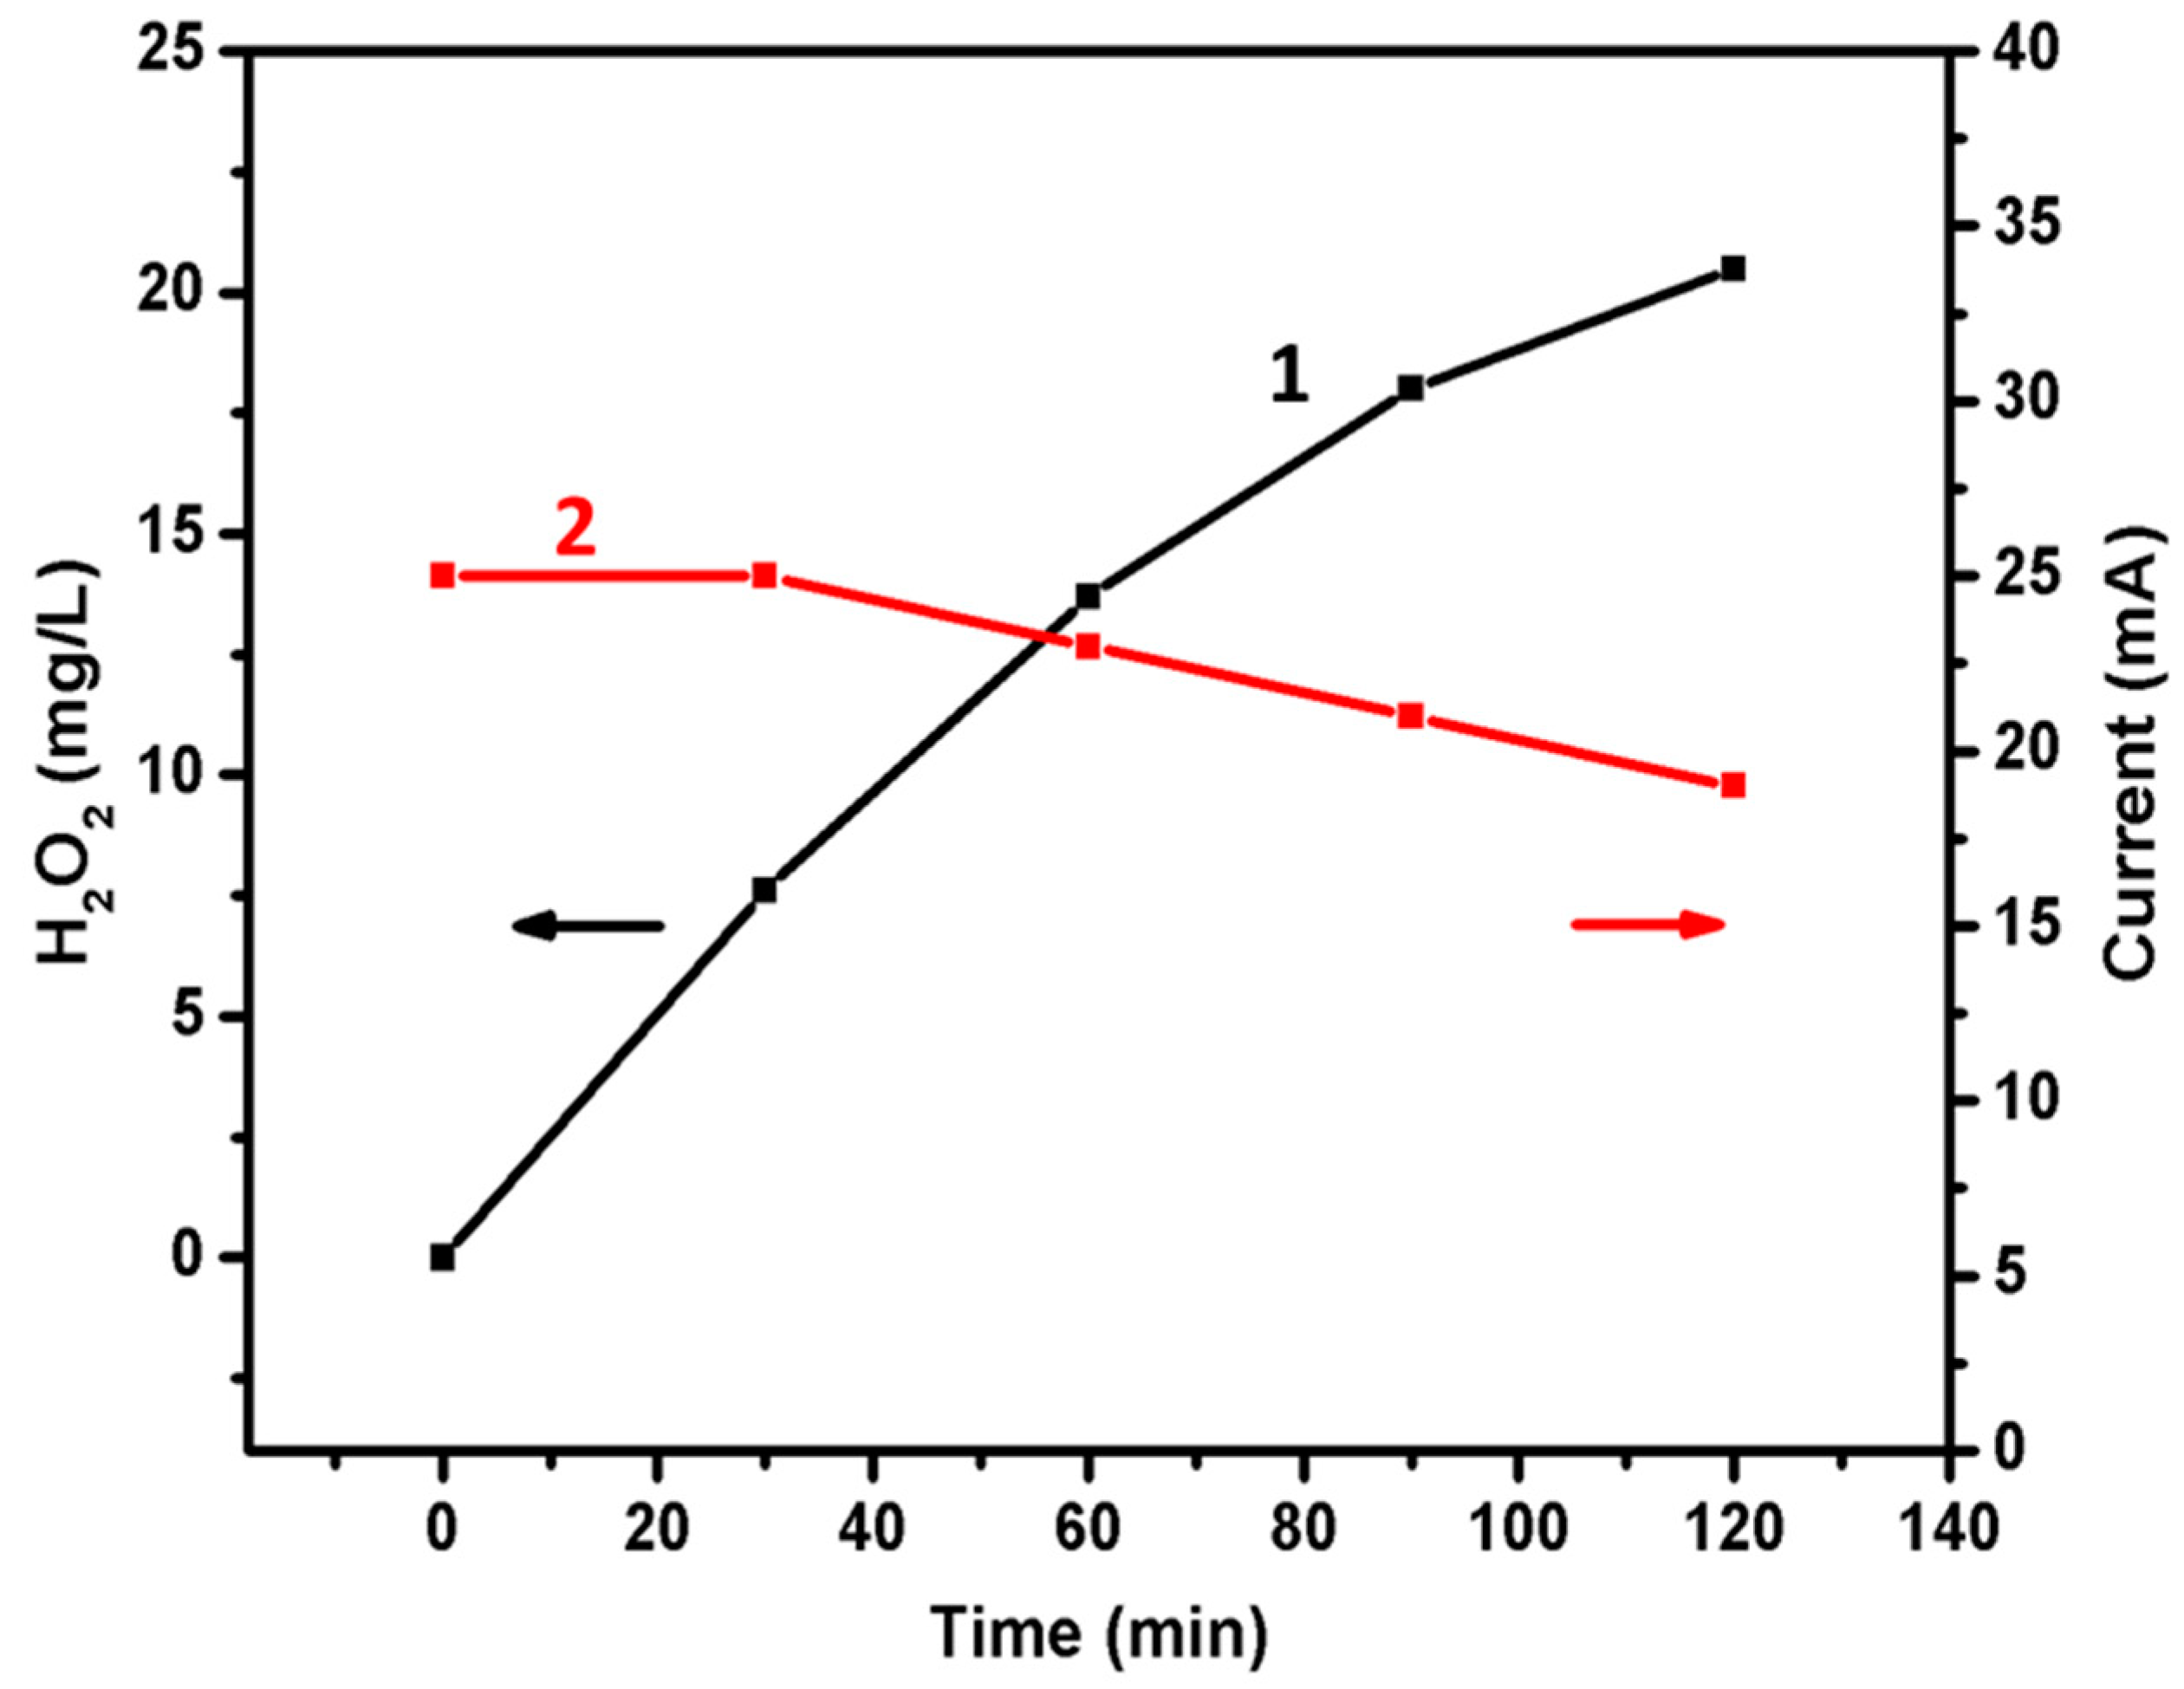
2.5. Photoelectrocatalytic Hydrogen Peroxide Production

The same system used for hydrogen production was also employed for production of hydrogen peroxide. The only difference was that hydrogen was obtained by establishing an anaerobic environment in the cathode compartment, and by deoxygenating the electrolyte by the Ar flow. The opposite was applied in the case of hydrogen peroxide. The electrolyte was aerated by blowing air, and it was thus enriched with oxygen. Otherwise, the counter-electrode remained the same, and the whole set-up also stayed the same. In both of the photo-anode cases, hydrogen peroxide was detected in the electrolyte of the cathode compartment a few minutes, after the beginning of the photocurrent; however, because H2O2 is unstable in strongly alkaline environments, data have been systematically recorded only by employing a WO3 photoanode and a Na2SO4 electrolyte. The applied bias was the same as in the case of hydrogen, i.e., 1 V vs. Ag/AgCl. The current produced was approximately the same, as in the case of H2. This is not a surprise, since the biased electrochemical system was apparently at current saturation, as revealed by the current plateau of Figure 6B. The quantity of the electrocatalytically produced hydrogen peroxide was monitored by measuring the quantity detected in the aqueous electrolyte solution of the cathode compartment by titration with permanganate. A rough estimation of the quantity of hydrogen peroxide in solution was made by using hydrogen peroxide test sticks. Figure 8 shows that the accumulated quantity of dissolved H2O2 increased with time, tending to a saturation. As seen in Table 1, the average H2O2 production rate after 120 min of device operation was 5.0 µmol/min corresponding to an average current of 22 mA. According to reactions (6) and (7), similar to the case of hydrogen, two electrons must flow for each H2O2 molecule produced. Therefore, similarly to the equivalent of the previous section, 1 µmol/min of electrochemically produced H2O2 corresponds, in the ideal case, to a current of 3.21 mA. Consequently, the Faradaic efficiency was 73% (Table 1). Indeed, the Faradaic efficiency was higher in the case of hydrogen peroxide, than in the case of hydrogen gas production. It was even higher when measured at shorter periods of times. For example, in the first 30 min, the quantity of dissolved hydrogen peroxide was found to be equal to 7.6 mg/L. This corresponds to an average of 7.5 µmol/min, and for a current of 25 mA, it corresponds to a Faradaic efficiency of 96%. These numbers are subject to substantial error; however, they do show that photoelectrocatalysis is a very efficient method for hydrogen peroxide production, using simple carbon black as an electrocatalyst. In this respect, it is worth comparing the above data with previously published results. For example, in a recent publication [1] studying photoelectrocatalytic hydrogen peroxide formation simultaneously by oxidation and reduction, the H2O2 yield was 0.48 µmol min−1 cm−2. In our case, for a counter-electrode of an active surface of 15 cm2, the corresponding values were 0.50 µmol min−1 cm−2 over short time periods, and 0.33 µmol min−1 cm−2 over long time periods. The two results are then in agreement, and this provides further support for photoelectrocatalysis as a means for hydrogen peroxide production. Finally, the fact that the hydrogen peroxide production rate decreased with time, may reveal an instability of this material, as well as the occurrence of parallel reactions involving non-identified hydroxyl species. It must be noted that permanganate titration cannot exclusively detect H2O2, but it may respond to other species in solution, which are also oxidized by permanganate. This makes it an interesting matter for further future work.

3. Materials and Methods

3.1. Materials

Unless otherwise specified, the reagents were obtained from Sigma Aldrich (Taufkirchen, Germany), and they were used as received. Millipore water was used in all experiments. SnO2:F transparent conductive electrodes (FTO, Resistance: 8 Ohms/square) were purchased from Pilkington (Saint Helens, UK) and carbon cloth from Fuel Cell-Earth (Woburn, MA, USA).

3.2. Preparation of Photoanode Electrodes

CdS/TiO2/FTO photoanode electrodes were constructed by the following protocols established by previous publications [18,24]. Briefly, nanoparticulate titania films were deposited on FTO transparent electrodes by the following procedure. A FTO glass was cut in the appropriate dimensions, and it was carefully cleaned first with soap, and then by sonication in isopropanol, water, and acetone. A thin layer of compact titania was first sprayed over a patterned area by using 0.2 M diisopropoxytitanium bis(acetylacetonate) solution in ethanol and was calcined at 500 °C. The deposition of this bottom compact layer is a common practice with nanocrystalline titania photoanodes, since it enhances the attachment of the top thick film, prevents short circuits, and facilitates electron flow towards the electrode. On the top of this compact film, we applied a titania paste made of P25 nanoparticles by doctor blading. The film was calcined up to 550 °C, at a rate of 20 °C/min. The final thickness of the film, as measured by SEM, was approximately 5 µm. The active geometrical area of the film was 1 cm2 (1 cm × 1 cm) in the cases where the current–voltage curves were plotted, but it increased to 5 cm × 3 cm for hydrogen or hydrogen peroxide production measurements.
CdS was deposited on TiO2 films by 10 SILAR cycles [18,19], using Cd(NO3)2 as Cd2+ and Na2S as the S2− precursor. We used 0.1 M aqueous solutions for both cations and anions. After SILAR deposition and final washing with 3D water, the films were dried in an oven at 100 °C, and were subsequently ready for use.
High-purity tungsten powder with an average particle size of 12 microns (0.4 g, 99.99%) reacted with aqueous hydrogen peroxide (3 mL, 30%) [25] under sonication for 2–3 hours, until a transparent colorless solution was obtained. Sonication decreases reaction time to 2–3 hr while magnetic stirring necessitates 12–16 hr. The excess of H2O2 was catalytically decomposed overnight, using a Pt foil [26], by keeping the mixture at 10 °C using a water bath. Then, 3 mL ethanol and 0.3 g of surfactant Triton X-100 were added to the solution. An FTO glass was cut in the appropriate dimensions, and it was carefully cleaned first with soap, and then by sonication in acetone, ethanol, and water. The WO3 film was prepared by coating the FTO electrode with the above solution, by spin-coating at 2000 rpm for 20 s. The films were sintered for 10 minutes at 500 °C (heating rate of 20 °C/min). The obtained WO3 film had a pale yellow color. This deposition–annealing procedure was repeated several times to obtain a homogeneous film. The active area was 1 cm × 1 cm in the case of photoanodes used for current-voltage (I-V) measurements and 3 cm × 5 cm, for the films that were used for hydrogen or hydrogen peroxide production. The final film thickness, as measured by SEM using a cross-section was 0.3 μm.

3.3. Construction of the Counter-Electrode

Carbon cloth was cut in pieces of 6 cm × 3 cm. A band of 1 cm × 3 cm was left clear to make electric contact and the rest (5 cm × 3 cm) was covered (only one side) with an electrocatalyst. For this purpose, we prepared the following paste based on carbon black (Vulcan XC72, Cabot Corp., Boston, MA, USA): 0.246 g of carbon black was mixed with 8 mL of distilled water by vigorous mixing in a mixer (about 2400 rpm) until it became a viscous paste. This paste was further mixed with 0.088 mL polytetrafluorethylene (TeflonTM, Wilmington, DE, USA, 60 wt % dispersion in water) and then applied on the carbon cloth. This has been achieved by first spreading the paste with a spatula, preheating for a few minutes at 80 °C, and finally heating this for a few minutes in an oven at 340 °C. The total quantity of the deposited carbon black was 0.5 mg per cm2.

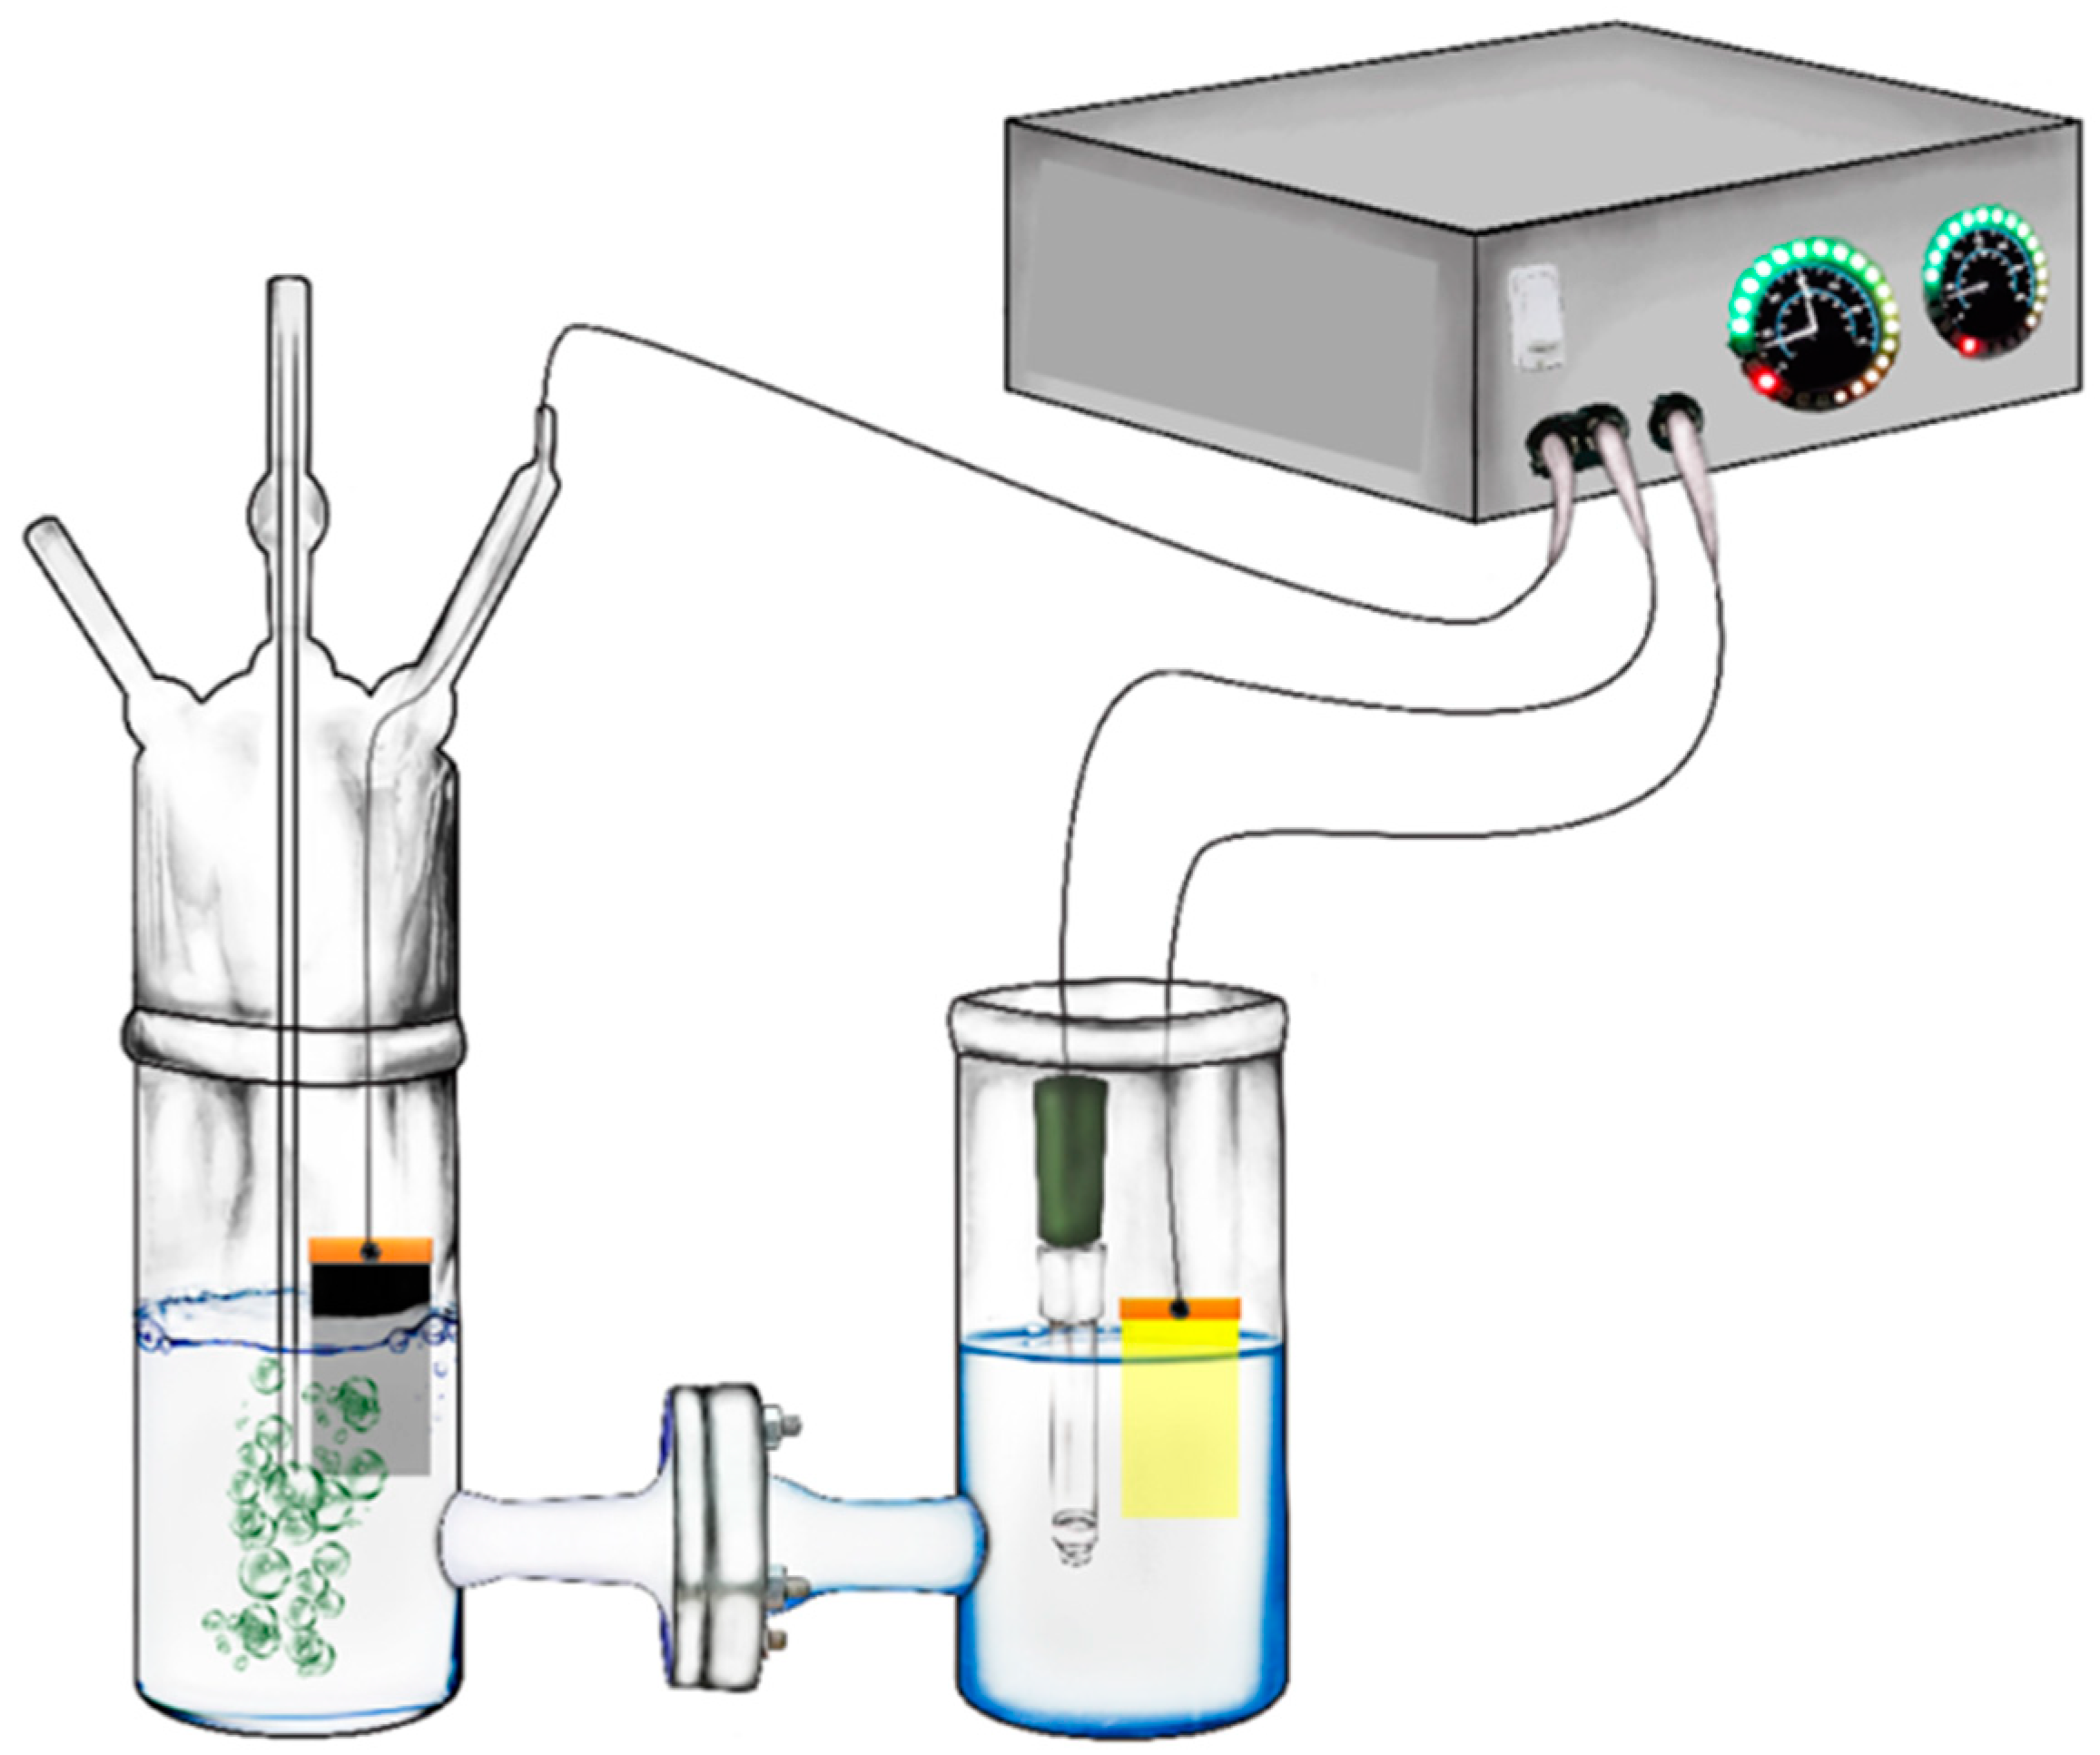
3.4. Description of the Reactor

An H-shaped reactor made of Pyrex glass has been used, as schematically represented by Figure 2. As already said, the electrodes used for hydrogen or hydrogen peroxide production had an active area of 3 cm × 5 cm but when current–voltage curves were recorded, the photoanode active area was only 1 cm2. Each compartment contained 150 mL of aqueous electrolyte. In all cases, the same electrolyte was used in both compartments, i.e., 0.5 M NaOH in the case of the CdS/TiO2 photoanode and 0.5 M Na2SO4, in the case of the WO3 photoanode. In the anode compartment we have also added 5% (v/v) ethanol. The two compartments were separated by a silica frit (ROBU, Hattert, Germany, porosity SGQ 5, diameter: 25 mm, thickness: 2 mm). Illumination was made in all cases, using a Xe lamp providing an intensity of 100 mW·cm−2 at the position of the photoanode.

3.5. Measurements and Characterizations

Hydrogen was monitored online, by using Ar as a carrier inert gas, and by applying a bias measured vs. Ag/AgCl. The reference electrode was accommodated in the anode compartment, which was exposed to the ambient, while the cathode compartment was sealed, and it allowed for the flow of Ar, using appropriate fittings (Figure 2, cf. Ref [9]). Hydrogen was detected by using an SRI 8610C gas chromatograph. Calibration of the chromatograph signal was accomplished by comparison with a standard of 0.25% H2 in Ar.
Hydrogen peroxide was monitored by titrating the electrolyte solution of the cathode compartment with permanganate after several minutes of running the device. The solution was poured in a conic flask and we added about 5 mL of pure sulfuric acid to acidify it. Then, a permanganate solution was slowly added until a persistent pink color was obtained. The experiment was repeated several times, each time with progressively increasing duration. A rough estimation of the quantity of dissolved hydrogen peroxide was made with test sticks (Quntofix, Aldrich). As in the case of hydrogen, a bias was applied and measured vs. Ag/AgCl.
The application of electric bias and current–voltage curves were traced with the help of an Autolab potentiostat (PGSTAT128N, Herisau, Switzerland). Diffuse reflectance absorption spectra were recorded with a Shimadzu UV-2600 (Kyoto, Japan) spectrophotometer equipped with an integration sphere, and SEM images were obtained with Field Emission Scanning Electron Microscopy (FE-SEM, FEITM Inspect F50, Waltham, MA, USA), using a ET-SE detector.

4. Conclusions

The present work has shown that it is possible to produce hydrogen gas or aqueous hydrogen peroxide by photoelectrocatalysis, using simple photocatalysts to construct visible light-absorbing photoanodes, and simple carbon-black electrocatalyst. Hydrogen production was realized with substantial Faradaic efficiency, mounting to 60%, and it was more than 73% in the case of H2O2 production. Combined CdS/TiO2 or WO3 have been used as visible light-absorbing photocatalysts, which gave photoanodes that produced substantial photocurrents under biased operation. The data of this work have built the basis for further studies on the photoelectrocatalytic production of solar fuels, using devices that were operated with cost-effective materials and procedures.

Author Contributions

I.P. and E.D. Investigation; A.K. and G.A. Formal Analysis; P.L. Conceptualization.

Funding

This research received no external funding.

Acknowledgments

We thank E.Stathatos for the SEM measurements and his whole support for this work.

Conflicts of Interest

The authors declare no conflict of interest.

References

  1. Shi, X.; Zhang, Y.; Siahrostami, S.; Zheng, X. Light-Driven BiVO4–C Fuel Cell with Simultaneous Production of H2O2. Adv. Energy Mater. 2018, 8, 1801158. [Google Scholar] [CrossRef]
  2. McDonnell-Worth, C.J.; MacFarlane, D.R. Progress Towards Direct Hydrogen Peroxide Fuel Cells (DHPFCs) as an Energy Storage Concept. Aust. J. Chem. 2018, 71, 781–788. [Google Scholar] [CrossRef]
  3. Disselkamp, R.S. Can aqueous hydrogen peroxide be used as a stand-alone energy source? Int. J. Hydrogen Energy 2010, 35, 1049–1053. [Google Scholar] [CrossRef]
  4. Prater, K.B. Polymer electrolyte fuel cells: A review of recent developments. J. Power Sources 1994, 51, 129–144. [Google Scholar] [CrossRef]
  5. Zhang, S.; Yuan, X.Z.; Hin, J.N.C.; Wang, H.; Friedrich, K.A.; Schulze, M. A review of platinum-based catalyst layer degradation in proton exchange membrane fuel cells. J. Power Sources 2009, 194, 588–600. [Google Scholar] [CrossRef]
  6. Fujishima, A.; Honda, K. Electrochemical Photolysis of Water at a Semiconductor Electrode. Nature 1972, 238, 37–38. [Google Scholar] [CrossRef] [PubMed]
  7. Doukas, E.; Balta, P.; Raptis, D.; Avgouropoulos, G.; Lianos, P. A Realistic Approach for Photoelectrochemical Hydrogen Production. Materials 2018, 11, 1269. [Google Scholar] [CrossRef] [PubMed]
  8. Lianos, P. Review of recent trends in photoelectrocatalytic conversion of solar energy to electricity and hydrogen. Appl. Catal. Environ. 2017, 210, 235–254. [Google Scholar] [CrossRef]
  9. Raptis, D.; Dracopoulos, V.; Lianos, P. Renewable energy production by photoelectrochemical oxidation of organic wastes using WO3 photoanodes. J. Hazard. Mater. 2017, 333, 259–264. [Google Scholar] [CrossRef] [PubMed]
  10. Kozlova, E.A.; Kozhevnikova, N.S.; Cherepanova, S.V.; Lyubina, T.P.; Gerasimov, E.Y.; Kaichev, V.V.; Vorontsov, A.V.; Tsybulya, S.V.; Rempel, A.A.; Parmon, V.N. Photocatalytic oxidation of ethanol vapors under visible light on CdS-TiO2 nanocatalyst. J. Photochem. Photobiol. A 2012, 250, 103–109. [Google Scholar] [CrossRef]
  11. Liao, Q.; Li, L.; Chen, R.; Zhu, X.; Wang, H.; Ye, D.; Cheng, X.; Zhang, M.; Zhou, Y. Respective electrode potential characteristics of photocatalytic fuel cell with visible-light responsive photoanode and air-breathing cathode. Int. J. Hydrogen Energy 2015, 40, 16547–16555. [Google Scholar] [CrossRef]
  12. Li, L.; Xue, S.; Chen, R.; Liao, Q.; Zhu, X.; Wang, Z.; He, X.; Feng, H.; Cheng, X. Performance characteristics of a membraneless solar responsive photocatalytic fuel cell with an air-breathing cathode under different fuels and electrolytes and air conditions. Electrochim. Acta 2015, 182, 280–288. [Google Scholar] [CrossRef]
  13. Mase, K.; Yoneda, M.; Yamada, Y.; Fukuzumi, S. Efficient Photocatalytic Production of Hydrogen Peroxide from Water and Dioxygen with Bismuth Vanadate and a Cobalt(II) Chlorin Complex. ACS Energy Lett. 2016, 1, 913–919. [Google Scholar] [CrossRef]
  14. Lianos, P. Production of electricity and hydrogen by photocatalytic degradation of organic wastes in a photoelectrochemical cell: The concept of the Photofuelcell: A review of a re-emerging research field. J. Hazard. Mater. 2011, 185, 575–590. [Google Scholar] [CrossRef] [PubMed]
  15. Leng, W.H.; Zhu, W.C.; Ni, J.; Zhang, Z.; Zhang, J.Q.; Cao, C.N. Photoelectrocatalytic destruction of organics using TiO2 as photoanode with simultaneous production of H2O2 at the cathode. Appl. Catal. A Gen. 2006, 300, 24–35. [Google Scholar] [CrossRef]
  16. Ueno, H.; Nemoto, J.; Ohnuki, K.; Horikawa, M.; Hoshino, M.; Kaneko, M. Photoelectrochemical reaction of biomass-related compounds in a biophotochemical cell comprising a nanoporous TiO2 film photoanode and an O2-reducing cathode. J. Appl. Electrochem. 2009, 39, 1897–1905. [Google Scholar] [CrossRef]
  17. Grätzel, M. Photoelectrochemical cells. Nature 2001, 414, 338–344. [Google Scholar] [CrossRef] [PubMed]
  18. Sfaelou, S.; Syggelou, L.; Dracopoulos, V.; Travlos, A.; Lianos, P. Effect of the Nature of Cadmium Salts on the Effectiveness of CdS SILAR Deposition and Its Consequences on the Performance of Sensitized Solar Cells. J. Phys. Chem. 2014, 118, 22873–22880. [Google Scholar] [CrossRef]
  19. Nicolau, Y.F. Solution deposition of thin solid compound films by a successive ionic-layer adsorption and reaction process. Appl. Surf. Sci. 1985, 22/23, 1061–1074. [Google Scholar] [CrossRef]
  20. Li, Z.; Luo, W.; Zhang, M.; Feng, J.; Zou, Z. Photoelectrochemical cells for solar hydrogen production: Current state of promising photoelectrodes, methods to improve their properties, and outlook. Energy Environ. Sci. 2013, 6, 347–370. [Google Scholar] [CrossRef]
  21. Sfaelou, S.; Pop, L.C.; Monfort, O.; Dracopoulos, V.; Lianos, P. Mesoporous WO3 photoanodes for hydrogen production by water splitting and PhotoFuelCell operation. Int. J. Hydrogen Energy 2016, 41, 5902–5907. [Google Scholar] [CrossRef]
  22. Hodes, G.; Cahen, D.; Manassen, J. Tungsten trioxide as a photoanode for a photoelectrochemical cell (PEC). Nature 1976, 260, 312–313. [Google Scholar] [CrossRef]
  23. Soltani, T.; Tayyebi, T.; Hong, H.; Mirfasih, M.H.; Lee, B.K. A novel growth control of nanoplates WO3 photoanodes with dual oxygen and tungsten vacancies for efficient photoelectrochemical water splitting performance. Sol. Energy Mater. Sol. Cells 2019, 191, 39–49. [Google Scholar] [CrossRef]
  24. Kalamaras, E.; Lianos, P. Current Doubling effect revisited: Current multiplication in a PhotoFuelCell. J. Electroanal. Chem. 2015, 751, 37–42. [Google Scholar] [CrossRef]
  25. Murau, P.C. Dissolution of Tungsten by Hydrogen Peroxide. Anal. Chem. 1961, 33, 1125–1126. [Google Scholar] [CrossRef]
  26. Orel, B.; Krasovec, U.O.; Groselj, N.; Kosec, M.; Drazi, G.; Reisfeld, R. Gasochromic Behavior of Sol-Gel Derived Pd Doped Peroxopolytungstic Acid (W-PTA) Nano-Composite Films. J. Sol. Gel. Sci. Technol. 1999, 14, 291–308. [Google Scholar] [CrossRef]
Figure 1. Schematic illustration of the photoelectrocatalytic production of a solar fuel by the consumption of an organic sacrificial agent: (1) photoanode carrying a mesoporous semiconductor photocatalyst; (2) ion transfer membrane separating the photoanode from cathode compartment; and (3) cathode electrode carrying an electrocatalyst. Examples of an oxidation and a reduction reaction in an alkaline environment are also illustrated. Ethanol is oxidized at the photoanode, while hydrogen peroxide is produced by the reduction of oxygen at the cathode.
Catalysts 09 00243 g001
Figure 2. Graphical design of the employed reactor showing connections with a potentiostat. The reactor consists of two compartments separated by an ion transfer membrane. The compartment on the left accommodates the counter electrode and the one on the right the working and the reference electrode.
Catalysts 09 00243 g002
Figure 3. Diffuse-reflection absorption spectra of mesoporous films deposited on FTO electrodes: (1) TiO2; (2) CdS/TiO2; and (3) WO3. The peaks at around 350 nm are not real. They are an artifact of the apparatus because of the large absorption at short wavelengths and the ensuing imbalance.
Catalysts 09 00243 g003
Figure 4. SEM images of the photocatalyst films used to construct photoanodes in the present work.
Catalysts 09 00243 g004
Figure 5. SEM images of the structure of the carbon cloth electrode (a) and the mesoporous carbon film (b).
Catalysts 09 00243 g005
Figure 6. Photocurrent production using a CdS/TiO2 (A) or a WO3 (B) photoanode. The active area of both photoanodes was 1 cm2. The counter-electrode was a carbon cloth covered on one side by mesoporous carbon, with an active area of 15 cm2 (3 cm × 5 cm). The electrolyte was 0.5 M NaOH in the case of CdS/TiO2, and 0.5 M Na2SO4 in the case of WO3. Ethanol at 5% (v/v) was added in the electrolyte of the anode compartment.
Catalysts 09 00243 g006
Figure 7. Photoelectrocatalytic hydrogen production using the reactor of Figure 2, equipped with either a CdS/TiO2 or a WO3 photoanode. The counter-electrode was a carbon cloth covered (one side) with mesoporous carbon. The active area of both the photoanodes and counter-electrode was 15 cm2 (3 cm × 5 cm). The electrolyte was 0.5 M NaOH in the case of CdS/TiO2, and 0.5 M Na2SO4 in the case of WO3. The same electrolyte filled both reactor compartments; however, 5% v/v ethanol was added into the electrolyte of the anode compartment. Curve 1 gives the hydrogen production rate, and curve 2 the corresponding photocurrent as a function of time. The applied bias was 0.0 V vs. Ag/AgCl in the case of CdS/TiO2 and 1.0 V vs. Ag/AgCl in the case of WO3. All data of have been recorded with 2% error.
Catalysts 09 00243 g007aCatalysts 09 00243 g007b
Figure 8. Photoelectrocatalytic hydrogen peroxide production using the reactor of Figure 2, equipped with a WO3 photoanode. The counter electrode was a carbon cloth covered (one side) with mesoporous carbon. The active area of the photoanode and the counter electrode was 15 cm2 (3 cm × 5 cm). The electrolyte was 0.5 M Na2SO4. The same electrolyte filled both reactor compartments; however, 5% v/v ethanol was added into the electrolyte of the anode compartment. Curve 1 displays hydrogen peroxide cumulative production, and curve 2, the corresponding photocurrent as a function of time. The applied bias was 1.0 V vs. Ag/AgCl. All of the data have been recorded with 2% error.
Catalysts 09 00243 g008
Table 1. Photocurrent values and Faradaic efficiencies for photoelectrocatalytic hydrogen or hydrogen peroxide production by reduction reactions at the counter-electrode.
Type of PhotoanodePhotocurrent (mA)Fuel Production Rate (μmole min−1)Faradaic Efficiency (%)
H2H2O2
CdS/TiO2427.860-
WO3183.459-
WO3225.0-73

