Duality in the Mechanism of Hexagonal ZnO/CuxO Nanowires Inducing Sulfamethazine Degradation under Solar or Visible Light


1
Ecole Polytechnique Fédérale de Lausanne, EPFL-SB-ISIC-GPAO, Station 6, 1015 Lausanne, Switzerland
2
Chemicobiology and Functional Materials Institute, Nanjing University of Science and Technology, Nanjing 210094, China
*
Author to whom correspondence should be addressed.
Catalysts 2019, 9(11), 916; https://doi.org/10.3390/catal9110916
Submission received: 11 October 2019
/
Revised: 29 October 2019
/
Accepted: 1 November 2019
/
Published: 2 November 2019
(This article belongs to the Special Issue Photocatalysis and Environment)
Abstract
:This study presents the first evidence for the photocatalytic performance of ZnO/CuxO hexagonal nanowires leading to sulfamethazine (SMT) degradation. The chemical composition of the nanowires was determined by X-ray fluorescence (XRF). The sample with the composition ZnO/Cux=1.25O led to faster SMT-degradation kinetics. The SMT-degradation kinetics were monitored by high performance liquid chromatography (HPLC). The morphology of the hexagonal nanowires was determined by scanning electron microscopy (SEM) and mapped by EDX. The redox reactions during SMT degradation were followed by X-ray photoelectron spectroscopy (XPS). The interfacial potential between the catalyst surface and SMT was followed in situ under solar and indoor visible light irradiation. SMT-degradation was mediated by reactive oxidative species (ROS). The interfacial charge transfer (IFCT) between ZnO and CuxO is shown to depend on the type of light used (solar or visible light). This later process was found to be iso-energetic due to the potential energy positions of ZnO and CuxO conduction bands (cb). The intervention of surface plasmon resonance (LSPR) species in the SMT degradation is discussed.
1. Introduction
Sulfamethazine (SMT) is one of the most important members in the family of sulfonamide antimicrobials and has been widely used in pharmaceuticals to protect animals against bacterial infections [1,2,3,4]. SMT is a persistent non-biodegradable environmental pollutant [5,6]. Residual SMT is excreted by animals to the surroundings and found in soils, food crops and drinking water [7,8,9,10], posing a threat to human health and the ecological system [11].
Several methods have been developed to remove SMT such as adsorption [12,13,14], biodegradation [15,16,17], advanced oxidation processes (AOPs) [18,19,20,21,22], and photocatalytic degradation [23,24]. It has also been reported that SMT is not completely eliminated by adsorption. Biodegradation by active sludge [15], Microbacterium sp. [16] and Achromobacter denitrificans PR1 [17] is possible, but requires long time periods and is restricted to low concentrations of SMT. Advanced oxidation processes (AOPs) such as Fenton and Fenton-like [18], photo-Fenton [19], electro-Fenton [20], ozonation [21], and gamma irradiation [22] have been reported to lead to SMT degradation. However, they need a high reagent concentration. Photocatalytic degradation of SMT mediated by Bi2MoO6 was recently reported by C. Guo et al., [23] with AgI/Bi12O17Cl2 s in aqueous solution [24]. The present study reports novel a semiconductor-oxide nanowire leading to SMT degradation. This study describes the catalyst preparation, the SMT degradation kinetics and the nanowire surface properties. A reaction mechanism is suggested based on the experimental data found during the course of this work.
ZnO is a widely studied photocatalyst for environmental remediation. Some recent reviews reflect the interest of ZnO in the field of applied photochemistry [25]. The solar light utilization of ZnO is limited due to the low absorption in the visible region < 4–5%. By coupling ZnO with oxide semiconductors with CuxO, the light absorption of the double-oxide reaches 800 nm [25]. Catalysts presenting optical absorption into the visible region for environmental applications is a subject of topical interest [26,27]. Depending on nanoparticle size and the preparation, ZnO presents a conduction band (cb) at 0.1–0.2 V (SHE) and a valence band (vb) positioned at ∼3.4 (SHE) [28]. Cu–oxide has been chosen to decorate the ZnO to extend its spectral absorption into the visible range. For this objective, low amounts of Cu–oxide are needed compared to Mn and Fe [25] doping of ZnO. The use of CuxO is also an alternative to the addition of Ag and Pt to ZnO. This avoids the use of higher cost noble metals. ZnO is an inexpensive semiconductor widely used in the electronic industry due to its high electrical conductivity. At pH 1, the ZnO band gap (bg) is 3.2–3.4 eV depending on the preparation route used.
The notation CuxO is used for Cu–oxide since two oxidation states are present: CuO and Cu2O. CuO presents typically a band gap of 1.7 eV and a conduction band at −0.4 V, and Cu2O a band gap of 2.2 eV and a conduction band of −0.20 or −0.25 V [29]. Both Cu–oxides present visible light absorption [30,31].
This study presents the preparation of ZnO/CuxO hexagonal nanowires enhancing the SMT degradation with respect to bare ZnO. Evidence for two different interfacial charge transfer (IFCT) mechanisms between CuxO and ZnO under solar or visible light are reported. The use of TiO2/CuxO leading to SMT degradation has been recently reported by our laboratory [32]. A dual mechanism was found to lead to SMT degradation under visible or sunlight irradiation. The surface properties of the ZnO/CuxO nanowires are reported in this study.
2. Results and Discussion
2.1. Description of the ZnO/CuxO (5%) Surface by Physical Methods
Figure 1 shows the images and morphology of the optimized ZnO/Cux=1.25O nanowire samples. Figure 1a shows the hexagonal nanowires with a media diameter of 1 to 2 microns and a length of 6–8 μm. The image was referenced in a 2 micron scale. Figure 1b shows the SEM imaging of ZnO/Cux=1.25O nanowires in a 2 micron scale. The arrows in Figure 1b indicate the presence of CuxO NPs that tend to aggregate. Using imageJ software, the particles size distribution of CuxO–NPs is in the range 18 to 28 nm as presented in Figure 1c. The values presented are the average of two distinct measurements (two big aggregates were left aside). Figure 1d–f show the EDX mapping of Zn, O and Cu, respectively.
Cu nanoparticles contain plasmons with free moving electrons presenting a collective oscillation and generating a local electromagnetic field. This affects the electronic states of the surrounding molecules. The plasmons transfer their energy into the nanowire-activating regions away from the excitation spot. The optical activity of NPs is determined by the wavelength of the plasmon resonance. This is a function of the particle size, shape and surrounding environment [33]. Plasmon studies have been widely reported for silver, with a peak around 400 nm [34]. Cu is an abundant and low-cost material compared to noble metals presenting inter-band transitions between 350 nm and 600 nm [35] with a plasmonic peak/doublet around 500 nm [36]. Figure 1 shows Cu–NPs of 25–45 nm decorating the ZnO nanowires. Light absorbers like STM interact with the plasmon nanowires. This probably involves electron tunneling between both oxides.
The XRD diffractogram of ZnO/CuxO (5%) is presented below in Figure 2. The XRD diffractogram shows a structure typical of wurtzite hexagonal high crystallinity ZnO (JCPDS card No.36-1451) [37] with lattice parameters of a = 0.325 nm and c = 0.521 nm. The peaks centered at 35.4°, 38.7° and 48.7° were assigned to CuO (JCPDS card No. 45-0937). The crystallite sizes for ZnO and CuO were estimated by means of the Scherrer equation from the strongest peak signal:
where D stands for the crystal size in nm, K is the shape factor which is usually fixed as 0.89, λ is the wavelength which is taken as 0.154 nm, β is the full width at half maximum for the prominent peak, and θ is the Bragg’s diffraction angle in radians. The values found were 40.24 nm for ZnO and 22.18 nm nm for CuxO. In Figure 2, the characteristic peaks of ZnO and CuO overlap as the ZnO and CuO appear at the same positions in the diffractogram. The system could be estimated to consist of CuxO decorating the ZnO crystallites since ZnO is the major component and CuO is present at a very low concentration.
2.2. Redox Catalysis and Interfacial Potential during SMT Degradation
The surface atomic concentration percentages and the change in Cu valence states in the ZnO/CuxO were determined by XPS. The results are shown in Figure 3a–d. No other elements besides Cu, O and Zn were detected except C. The latter element appears due to the sample exposure to air contamination. Figure 3b shows a shift for the Zn2p peaks from 1022.2 eV to 1021.6 eV during SMT photodegradation. This is evidence for the generation of Zn+ species during SMT degradation. ZnO corrosion is due to the pH decrease produced by acids formation as intermediate species during SMT degradation (please see Figure 4). The observed reduction of Zn2+ to Zn+ is similar to the reduction of TiO2 to Ti3+ reported during the degradation of several pollutants [38]. This shows redox reactions occurring at the interface of ZnO nanowires during SMT degradation. The corrosion of ZnO is further confirmed by the data presented in Figure 4. The pH of the solution shifts from 7.2 to ~6.4 during the photocatalytic degradation of SMT under solar-simulated light. This is due to ZnO corrosion at pH < 6.5. This last pH value depends on the make-up and chemical species present in the suspension.
The BE peak shifts observed in the deconvolution of Cu2p illustrated in Figure 3c presents the evidence for redox reactions occurring during the SMT photocatalytic degradation. The peaks at 935.4 eV and 956.2 eV correspond to Cu2+, with typical CuO. The satellite peaks appear at 941.2 eV and 943.4 [39,40,41]. XPS shows that Cu2O oxide was the predominant Cu species on the ZnO/Cux=1.25O. After SMT degradation as shown in Figure 3c, the Cu2O peak (net Cu+) decreases. This occurs on localized surface plasmon resonance (LSPR) present on the nanowire surface. The LSPR contribution to the SMT degradation will be further discussed in the section below. The surface atomic percentage of Cu in the ZnO/Cux=1.25O sample is seen to be 7.32% in Table 1.
The O1s deconvolution in Figure 3d shows the presence of three peaks located at 532.0 eV, 530.3 eV and 528.5 eV and assigned to the O2- deficient regions of Zn–O and Cu–O [39,40]. Table 1 presents the atomic surface percentage concentration of the elements in the ZnO/Cux=1.25O sample before and after SMT degradation. The C1s percentage on the initial sample is due to C residues from the air and from the residual C in the solutions used to prepare the samples. The C content slightly increases after the SMT degradation due to the non-mineralized SMT species (see equation 1 below). The O1s and Cu2p percentage decrease due to the C1s being deposited on the sample during SMT degradation. The small increase in the Zn2p percentage observed after SMT degradation is due to the destruction of impurities present on the initial pristine ZnO by oxidative radical species (see below Section 3.4).
Figure 4a,b show the surface potential and local pH of the ZnO/Cux=1.25O nanowires under: (a) simulated solar light and (b) visible light irradiation. Figure 4a shows that the initial potential increases up to 170 min and increases again due to the presence of the SMT intermediates generated during the SMT degradation. Figure 5 shows that the SMT degradation reaches ~75% after 170 min (trace g). A similar pattern was seen for the surface potential variation in Figure 4b for the SMT degradation under visible light. In both cases, the initial potentials (Eigenvalues) were seen to be different. The changes in the interfacial potential during SMT photodegradation in Figure 4b present a trend similar to the one shown in Figure 4a. This suggests in both cases a similar mechanism.
The variation of the initial pH 7 during SMT degradation is shown in Figure 4a,b (right-hand axes). This variation was due to the organic acids (branched or not) generated during SMT degradation. Additional cationic species contribute to the pH drop as the degradation time progresses. The production of organic acid intermediates was reported by Kraeutler and Bard [42] due to the photo-Kolbe reaction as shown in Equation (1) below
A pH decrease from 7.2 down to 6.4 was observed for the SMT degradation under solar light in Figure 4a,b. This is equivalent to an eight-fold increase in the concentrations of H+ in the solution. Short-chain carboxylic acids (C1–C4) with pKa values around ∼3.0 [38] are generated in the solution and account for the pH drop. The SMT follows the sequence: sulfanilic acid → benzoquinone → maleic/fumaric acid → acetic/oxalic/formic acid → CO2 as reported in references [20,21,22,23,24,25]. The intermediate carboxylic acids are subsequently eliminated in the last step of the SMT degradation as CO2. Supplementary Tables S1 and S2 provide the values for the pH decreases.
2.3. SMT-Degradation on ZnO/CuxO: Effect of Light Intensity
Figure 5 and Figure 6 present the degradation of SMT on ZnO/CuO under solar-simulated and visible light irradiation in a solution with initial pH 7, respectively. The SMT degradation kinetics are slower for the sample ZnO/CuxO (10%) in Figure 6 (trace f) compared to the ZnO/CuO(5%) sample in (trace g). CuO doping has been reported to decrease the ZnO band gap.
The effects of SMT and of ZnO/CuxO concentrations on the degradation kinetics are shown in the Supplementary Figures S1 and S2. The single HPLC peaks during the SMT degradation on ZnO/Cux=1.25O samples is shown in Figure 7.
SMT presents two pKa values at 2.8 and 7.4 giving rise to SMT+, SMT and SMT- species [43]. Sulfamethazine is a weak acid due to the strong electron attraction of the -SO2 substituent and the resonance stabilization of the sulfamethazine anion [44]. SMT degradation runs at different pH values are reported in Supplementary Figure S4. Figure S4 shows that the fastest degradation takes place at pH values of 3. At pH 3, ZnO corrosion lead to the release of Zn2+-ions in the solution since ZnO is stable at pH > 6.5. These Zn2+-ions catalyze the SMT degradation via Fenton-like reactions [45,46].
The ZnO presents an isoelectric point (IEP) of ~9.3, and the value for CuO is ~9.5 [47]. The two oxides are positively charged at pH values ~7. The negatively-charged groups of SMT and the positive ZnO/CuO interface lead to an electrostatic interaction between both components. The SMT equilibria as a function of the solution pH is shown in Scheme 1. At pH 7, an SMT-zwitterion is present since this solution pH is positioned between pKa1 and pKa2.
Figure 8 presents the effect of light intensity on the SMT degradation kinetics on ZnO/Cux=1.25O %) under solar light and visible light. The SMT degradation efficiency increased with the applied light intensity. This is evidence that the photocatalyst presents semiconductor behavior during SMT degradation under band-gap irradiation. A larger amount of photogenerated charges is generated by a semiconductor at higher light doses leading to a faster SMT degradation. This is shown in Figure 8a,b.
The optical absorption of CuxO occurs between 300 nm and 800 nm [42] and the SPR absorption peaks were reported at 390, 570, and 590 nm depending on the CuxO size [48,49]. When Cu–oxide is exposed to light, the conduction electrons in the nanoparticle oscillate coherently due to the electromagnetic field associated with the incoming light. The electric field associated with the incident light excites the CuxO upper electron shells. This increases the electron oscillations, inducing a CuxO electric field on the surface of the CuxO nanocrystals [50,51].
2.4. Determination of the ROS-Species during SMT-Degradation
To understand the photocatalytic mechanism of SMT degradation, the determination of the ROS species was carried using the appropriate radical scavengers: methanol (⦁OH scavenger); p-benzoquinone (⦁O2− scavenger); NaN3 (1O2 scavenger); and disodium ethylene-diamine-tetra-acetate dehydrate (EDTA-2Na), a hole scavenger. A scavenger concentration of 0.5 mM reagent was used in all cases. Figure 9 shows that the SMT degradation under visible light was decreased by 60% and 58% when EDTA-2Na and methanol were added to the solution. In this way, vbh+ and ⦁OH-radicals were found as the two main radicals leading to SMT degradation. The SMT degradation was reduced by 20% when benzoquinone as an HO2/⦁O2− scavenger was added to the solution. The unambiguous determination by NaN3 of 1O2 and CH3OH of ⦁OH-radicals was not possible. NaN3 also scavenges the ⦁OH radicals. Possibly, 1O2 and ⦁OH-radicals intervene jointly in SMT degradation. The ⦁OH radical intervention (⦁OH/HO− −1.90–2.20 V vs NHE) [52] predominates, leading to SMT-oxidation. The 1O2/O2− potential of +0.08V NHE [53] is much lower compared to the ⦁OH/HO− reaction. The identification of ROS radicals followed the approach used in TiO2 photocatalysis when investigating the ROS intervention, leading to pollutant degradation. However, ZnO/CuxO-mediated photocatalysis may not follow the pattern valid for TiO2 photocatalysis [54]. Figure 10 shows the data for scavenging of ROS carried under visible light.
2.5. IFCT Mechanisms Suggested under Solar and Visible Light: Involvement of the LSPR
Figure 11a presents the IFCT for reactions photocatalyzed by ZnO/Cux=1.25O under low-intensity solar-simulated light. The ZnO in Figure 11a generates the holes leading to the SMT degradation [55]. During the IFCT, the ZnOvb transfers holes (h+) to the CuxOvb, increasing the carrier lifetime. This partially hinders the charge-pair recombination in CuxOvb.
Figure 11b presents the visible light irradiation of the ZnO/CuO samples where CuxO absorbs the visible light > 410 nm. The absorber reacts by the build-up of surface plasmon resonance species (LSPR). In this case, charge recombination occurs on the CuxO surface due to: (a) the close proximity of the photo-generated charges on the CuxO surface facilitating the charge recombination and precluding charge diffusion to the non-absorbing ZnO component. The higher recombination rate limits the amount of free charges leading to SMT degradation. The SMT degradation under visible light irradiation does not involve reactions on the ZnO valence band (see Figure 11a)
Scheme 2 shows the SMT functional group coordination with ZnO and ZnO/CuO. Low potential (or sub-potential) photoinduces holes/mid-gap states in the ZnO/Cux=1.25O samples. In the presence of SMT, these mid-gap holes would photo-induce 1O2 through the oxidation of O2−⦁ in a thermodynamically allowed reaction [29,42]. Photo-induced holes that have a lower oxidation potential would oxidize O2−⦁ (+0.34 V vs NHE). The O2−⦁ occurs due to the reduction of molecular oxygen by cb electrons as shown above in Figure 11. The oxidation of superoxide radicals (see Section 3.4) by photoinduced vb holes may also lead to the singlet oxygen/hydroxyl radicals (⦁OH) [52,53].
A mechanism for SMT degradation is suggested in Equations (2)–(7) as outlined in Figure 11a for SMT degradation under solar-simulated light:
ZnO/CuxO + solar light → ZnOcbe− + ZnOvbh+ + CuOcbe− + CuxOvbh+
ZnOcbe− + O2 → O2− + H+ → HO2⦁
HO2⦁ + SMT → CO2 + H2O,N,S
The crucial step under solar irradiation in Figure 11a is the electron injection from ZnOcbe- into the minority component CuxO in the ZnO/Cux=1.25O. The heterojunction between ZnO and CuxO has been reported [56,57] for the detection of H2S [58] and for the monitoring of H2 production [59]. Another mechanism to consider besides the one suggested in Equations (2)–(7) involves photosensitization of ZnO/Cux=1.25O during SMT degradation. This would be more important during the initial stages of the STM degradation.
A mechanism for SMT degradation under visible light is suggested in Figure 11b as:
CuxO + visible light → CuxOcbe− + CuxOvbh+
CuxOcbe− + O2 → O2− + H+ → HO2⦁ → HO2⦁−
HO2⦁ + SMT → CO2 + H2O,N,S
Different SMT degradation mechanisms are suggested for pollutants’ degradation under solar or visible light as noted in Figure 11a,b.
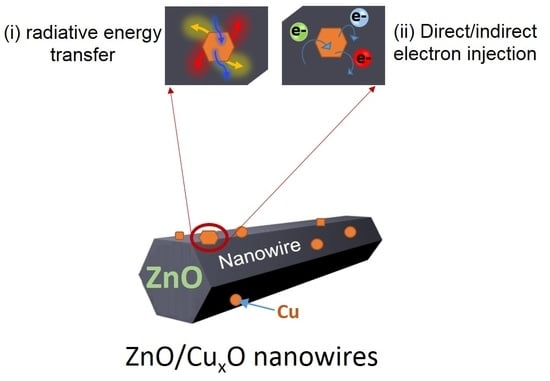
The reduction of the Cu2O shown in Figure 3 may proceed by two mechanisms: (i) radiative energy transfer from Cu-plasmon state to CuxO enhancing the electrons’ transition from the bonding orbitals in the valence band to the anti-bonding orbitals in the conduction band. This would weaken the Cu–O bonding leading to Cu2O reduction, and (ii) electronic states of ZnO or CuO excited by the type of light used interacting with CuxO LSPR. In the latter case, the electron injection can be direct or indirect depending on the Cu oxidation state during SMT degradation. The plasmons interact with the anti-bonding CuxO states. However, in the indirect process, Landau damping takes place involving plasmon decay and leading to hot electrons. These electrons are subsequently transferred to Cu2O. Scheme 3 below suggests two LSPR mechanisms for ZnO/CuxO surface under light. Scheme 3 suggests the direct electron injection into CuxO during SMT degradation. This is favored by the increase in the dielectric function on the photocatalyst surface. Under solar light, the latter process may proceed faster compared to visible light illumination. Both mechanisms suggested above for the photocatalytic degradation of SMT are not completely understood at the present time and more work is needed in this direction.
3. Materials and Methods
3.1. Preparation of ZnO/CuxO Hexagonal Wurtzite Nanowires
The synthesis of ZnO hexagonal nanowires decorated with CuxO was carried out aiming at fast STM degradation [60]. A solution of 200 mL of 0.1 M zinc nitrate containing Cu(NO3)2 and 200 mL of 0.1 M hexa-methylene-tetramine (HMT) was mixed under stirring. This solution was transferred to a 500-mL flask and refluxed at 90 °C for 3 days. The final suspension was filtered, washed with de-ionized water and ethanol, and later oven-dried in air atmosphere. The resulting powders were calcined at 500 °C for 1 h with a heating rate of 5 °C/min. Calcination of ZnO/CuxO nanowires: In separate experiments, CuxO were prepared by heating a Cu(NO3)2 aqueous solution to dryness at 110 °C followed by calcination at 500 °C for 1h. A long series of experiments with various ZnO:CuO ratios were run to optimize the ratio of the ZnO to CuO leading to the fastest SMT photodegradation. The sample leading to the fastest SMT degradation was prepared by mixing solutions of ZnO and CuO in the ratio of 20:1. This ratio can also be formulated as ZnO/CuxO (5%).
3.2. Nanowires Properties Determined by Surface Physical Methods
The composition of the optimized photocatalyst ZnO/CuxO(5%) was determined by X-ray fluorescence (XRF) and found the present composition of ZnO/Cux=1.25O. The XRD unit used was an Oribs PC Micro EDXRF analyzer (Shanghai, China) with a Rh source (20 kV, 1 mA) and an Apollo XRF-ML50 Silicon Drift Detector (Shanghai, China) with an energy resolution lower than 135 eV at the MnKa. The elementary crystal sizes for ZnO and CuxO were estimated by the Scherrer equation from the strongest peak signal.
SEM imaging was carried out in a field-emission scanning electron microscopy (FESEM, Hitachi S4800, Shanghai, China) operated at 20 kV. The images were mapped by EDXS. Particle size distribution assessment of the CuxO NPs were carried out by means of Image J software 1.50i (Wayne Rasband, National Institutes of Health, Maryland, USA).
3.3. X-ray Photoelectron Spectroscopy and Interfacial “In Situ” Potentials Determination
The atomic surface concentration percentage and chemical state of Zn and Cu of the ZnO/Cux=1.25O were determined by X-ray photoelectron spectroscopy (XPS) in an AXIS NOVA X-ray photoelectron spectrometer from Kratos Analytical, Manchester, UK provided for with a monochromatic AlK (hν = 1486.6 eV) anode. The binding energies (BE) were calibrated against the standard C1s binding energy at 284.8 eV. The spectra were deconvoluted by means of a Multipak (version 9 software) using 50:50 Gaussian-Laurentzian. Background subtraction correction was Shirley [61]. At this level, it is worth reminding the surface percentage calculation/estimation method. To estimate the surface atomic percentage of the elements of the peaks of interest, first, one should divide the intensity by the X-ray flux, then by the photoionization cross-section for the core level. This allows estimating the probability that a photoelectron will be emitted. This emission is different for each atomic core level at each photon energy. After normalizing these results, the ratio of the elemental percentages can be found.
The in situ interfacial potential during the SMT-degradation was monitored as a function of time in a pH/mV/Temp meter (Jenco 6230N, San Diego, USA) equipped with a microprocessor and a RS-232-C IBM interface.
3.4. Irradiation Procedures and ROS Analysis.
The photodegradation of SMT was carried out in the cavity of a Suntest solar simulator CPS (Atlas GmbH, Hanau, Germany). In a typical run, 25 mg of the selected photocatalyst was placed in a 50-mL photochemical reactor with 2.5 mg/L SMT. The pH of the pollutant solution was adjusted by 0.1 M NaOH or 0.1 M HCl solutions. Prior to irradiation, the samples were equilibrated in the dark for 30 min. At preselected times, 2 mL aliquots were withdrawn to evaluate the SMT degradation kinetics. For runs in the visible light range, a cut-off filter (λ > 410 nm) was inserted during the irradiation runs in the solar simulator.
The amount of SMT was determined by high performance liquid chromatography in an HPLC Agilent 1100 instrument (Waldbronn, Germany) equipped with a C18 column (Supercosil LC-18, 5 µm particle size, length 15 cm, id. 3mm) and a UV detector (λ = 270 nm). SMT aliquots of 20 µL were injected into the HPLC acetonitrile with 0.1% formic acid solution mobile phase (40:60) and a flow rate of 0.85 mL/min. The effect of the light intensity was monitored in the Suntest simulator by varying the applied power to the Xe-light source. Scavenging experiments were carried out to determine the reactive oxygen species (ROS) using: p-benzoquninone as the HO2⦁− radical scavenger, NaN3 as the singlet oxygen 1O2 scavenger, methanol as the ⦁OH-radical scavenger and EDTA-2Na as the hole (vbh+) scavenger [30].
The sulfamethazine structural formula is shown next in Scheme 4.
The results deviation was estimated using the ANOVA statistical method. All the kinetic experiments reported in this study were carried out in triplicates.
4. Conclusions
Two mechanisms are suggested for ZnO/CuxO leading to SMT degradation under solar or visible light. The ZnO/Cux=1.25O sample led to the fastest SMT degradation. CuO was the predominant form of the Cu–oxide species as detected by XPS. When CuxO is irradiated under visible light, the SMT degradation kinetics are slower compared to the kinetics attained under solar irradiation. The SEM/EDXS images for ZnO/Cux=1.25O provide evidence for nanowires with a hexagonal structure. The solution parameters intervening in the SMT degradation kinetics were investigated in detail as well as the properties of the photocatalyst surface. This study provides the first evidence for ZnO/CuxO iso-energetic electron transfer between CuxO to ZnO, leading to the degradation of SMT. There are some initial reports about ZnO/CuxO nanowires photoelectrochemical-mediated H2 production activated by visible light due to the extended visible light absorption spectrum of CuxO. This is an advance with respect to ZnO-mediated generation of H2 that proceeds with a low efficiency using a costly UV-light. Some preliminary studies reported on ZnO/CuxO nanowires as humidity and pH sensors, but no commercial devices have been developed and commercialized until now. Further work to exploit the practical potential of the ZnO/CuO nanowires is warranted at this time. Several studies in scientific journals have reported on ZnO/CuxO nanowires addressing the degradation of cationic and anionic dyes. However, no flow reactors leading to photoelectrochemical dye degradation-mediated ZnO/CuxO nanowires have been reported so far.
Supplementary Materials
The following are available online at https://www.mdpi.com/2073-4344/9/11/916/s1, Figure S1: Effect of SMT-concentration on the degradation kinetics under (a) simulated solar light and (b) visible light irradiation. Solution parameters: [catalyst]=500 mg/L, initial pH 7.0, solar light intensity 50.1 mW/cm2 and visible light intensity 38.9 mW/cm2, Figure S2: Effect of ZnO/Cux=1.25O concentration on the SMT-degradation kinetics under (a) simulated solar light and (b) visible light irradiation. Solution parameters: [SMT]=2.5 mg/L, initial pH 7.0, solar light intensity 50.1 mW/cm2 and visible light intensity 38.9 mW/cm2, Figure S3: HPLC spectra of 2.5 mg/L sulfamethazine in the presence of (a) no NaN3, (b) 0.01 mM NaN3, (c) 0.1 mM NaN3 and (d) 0.5 mM NaN3. Note that the peak areas of (a), (b), (c) and (d) are 122.7, 131.5, 163.0 and 184.1, Figure S4. Effect of solution pH on the SMT-degradation kinetics by ZnO/Cux=1.25O under (a) simulated solar light and (b) visible light irradiation. Solution parameters: [catalyst]=500 mg/L, [SMT]=2.5 mg/L, solar light intensity 50.1 mW/cm2 and visible light intensity 38.9 mW/cm2, Table S1: The pH value of SMT solution after photodegradation by ZnO/Cux=1.25O under simulated solar light for a certain time, Table S2. The pH value of SMT solution after photodegradation by ZnO/Cux=1.25O under visible light for a certain time.
Author Contributions
Conceptualization: S.R. and J.K.; Methodology: S.R. and J.Y.; Investigation and Experimental: J.Y.; Resources: C.P. and T.W.; Supervision: S.R.; Writing—original draft preparation: J.K. and S.R.; Final draft: S.R.
Funding
This work did not receive direct funding.
Acknowledgments
Jiajie Yu from Nanjing University of Science and Technology, thanks the Research Plan for the Chinese CSC Scholarship Program that enabled him to work for one year at the EPFL in Switzerland.
Conflicts of Interest
The authors declare no conflict of interest.
References
- Tolls, J. Sorption of veterinary pharmaceuticals in soils: A review. Environ. Sci. Technol. 2001, 35, 3397–3406. [Google Scholar] [CrossRef] [PubMed]
- Poirier, A.; Doerge, R.; Gaylor, W.; Miller, A.; Lorentzen, J.; Casciano, A.; Kadlubar, F.; Schwetz, A. An FDA Review of Sulfamethazine Toxicity. Regul. Toxicol. Pharmacol. 1999, 30, 217–222. [Google Scholar] [CrossRef] [PubMed]
- De Liguoro, M.; Fioretto, B.; Poltronieri, C.; Gallina, G. The toxicity of sulfamethazine to Daphnia magna and its additivity to other veterinary sulfonamides and trimethoprim. Chemosphere 2009, 75, 1519–1524. [Google Scholar] [CrossRef] [PubMed]
- Teixidó, M.; Pignatello, J.; Beltrán, L.; Granados, M.; Peccia, J. Speciation of the ionizable antibiotic sulfamethazine on black carbon (biochar). Environ. Sci. Technol. 2011, 45, 10020–10027. [Google Scholar] [CrossRef] [PubMed]
- Wegst-Uhrich, R.; Navarro, A.; Zimmerman, L.; Aga, S. Assessing antibiotic sorption in soil: A literature review and new case studies on sulfonamides and macrolides. Chem. Cent. J. 2014, 8, 5–20. [Google Scholar] [CrossRef]
- Ingerslev, F.; Halling-Sørensen, B. Biodegradability properties of sulfonamides in activated sludge. Environ. Toxicol. Chem. 2000, 19, 2467–2473. [Google Scholar] [CrossRef]
- Göbel, A.; Thomsen, A.; McArdell, S.; Alder, C.; Giger, W.; Theiß, N.; Löffler, D.; Ternes, D.A. Extraction and determination of sulfonamides, macrolides, and trimethoprim in sewage sludge. J. Chromatogr. A 2005, 1085, 179–189. [Google Scholar] [CrossRef]
- Dolliver, H.; Kumar, K.; Gupta, S. Sulfamethazine uptake by plants from manure-amended soil. J. Eviron. Qual. 2007, 36, 1224–1230. [Google Scholar] [CrossRef]
- Kemper, N. Veterinary antibiotics in the aquatic and terrestrial environment. Ecol. Ind. 2008, 8, 1–13. [Google Scholar] [CrossRef]
- Boxall, B.; Johnson, P.; Smith, J.; Sinclair, J.; Stutt, E.; Levy, S. Uptake of veterinary medicines from soils into plants. J. Agric. Food Chem. 2006, 54, 2288–2297. [Google Scholar] [CrossRef]
- Wan, Z.; Wang, J. Degradation of sulfamethazine using Fe3O4-Mn3O4/reduced graphene oxide hybrid as Fenton-like catalyst. J. Hazard. Mater. 2017, 324, 653–664. [Google Scholar] [CrossRef] [PubMed]
- Qiang, Z.; Xiaolei, B.; Weiwei, B. MCM-48 modified magnetic mesoporous nanocomposite as an attractive adsorbent for the removal of sulfamethazine from water. Water Res. 2013, 47, 4107–4114. [Google Scholar] [CrossRef] [PubMed]
- Braschi, I.; Blasioli, S.; Gigli, L.; Gessa, E.; Alberti, A.; Martucci, A.J. Removal of sulfonamide antibiotics from water: Evidence of adsorption into an organophilic zeolite Y by its structural modifications. Hazard. Mater. 2010, 178, 218–225. [Google Scholar] [CrossRef] [PubMed]
- Zhang, C.; Lai, C.; Zeng, G.; Huang, D.; Yang, C.; Wang, Y.; Zhou, Y.; Cheng, M. Efficacy of carbonaceous nanocomposites for sorbing ionizable antibiotic sulfamethazine from aqueous solution. Water Res. 2016, 95, 103–112. [Google Scholar] [CrossRef] [PubMed]
- Xu, J.; Sheng, P.; Ma, Y.; Wang, F.; Yu, Q. Roles of extracellular polymeric substances (EPS) in the migration and removal of sulfamethazine in activated sludge system. Water Res. 2013, 47, 5298–5306. [Google Scholar] [CrossRef] [PubMed]
- Topp, E.; Chapman, R.; Devers-Lamrani, M.; Hartmann, A.; Marti, R.; Martin-Laurent, F.; Sabourin, L.; Scott, A.; Sumarah, M.J. Accelerated biodegradation of veterinary antibiotics in agricultural soil following long-term exposure, and isolation of a sulfamethazine-degrading Microbacterium sp. Environ. Qual. 2014, 42, 173–178. [Google Scholar] [CrossRef]
- Reis, J.; Reis, C.; Ricken, C.; Kolvenbach, B.; Manaia, M.; Corvini, F.; Nunes, C.J. Biodegradation of sulfamethoxazole and other sulfonamides by Achromobacter denitrificans PR1. Hazard. Mater. 2014, 280, 741–749. [Google Scholar] [CrossRef]
- Zhou, T.; Wu, X.; Zhang, Y.; Li, J.; Lim, T. Synergistic catalytic degradation of antibiotic sulfamethazine in a heterogeneous sonophotolytic goethite/oxalate Fenton-like system. Appl. Catal. B Environ. 2013, 136, 294–301. [Google Scholar] [CrossRef]
- Pérez-Moya, M.; Graells, M.; Castells, G.; Amigó, J.; Ortega, E.; Buhigas, G.; Pérez, M.; Mansilla, H. Characterization of the degradation performance of the sulfamethazine antibiotic by photo-Fenton process. Water Res. 2010, 44, 2533–2540. [Google Scholar] [CrossRef]
- Sopaj, F.; Oturan, N.; Pinson, J.; Podvorica, F.; Oturan, A. Effect of the anode materials on the efficiency of the electro-Fenton process for the mineralization of the antibiotic sulfamethazine. Appl. Catal. B Environ. 2016, 199, 331–341. [Google Scholar] [CrossRef]
- Garoma, T.; Umamaheshwar, K.; Mumper, A. Removal of sulfadiazine, sulfamethizole, sulfamethoxazole, and sulfathiazole from aqueous solution by ozonation. Chemosphere 2010, 79, 814–820. [Google Scholar] [CrossRef] [PubMed]
- Liu, Y.; Wang, J.J. Degradation of sulfamethazine by gamma irradiation in the presence of hydrogen peroxide. Hazard. Mater. 2013, 250, 99–105. [Google Scholar] [CrossRef] [PubMed]
- Guo, C.; Xu, J.; Wang, S.; Zhang, Y.; He, Y.; Li, X. Photodegradation of sulfamethazine in an aqueous solution by a bismuth molybdate photocatalyst. Catal. Sci. Technol. 2013, 3, 1603–1611. [Google Scholar] [CrossRef]
- Zhou, C.; Lai, C.; Xu, P.; Zeng, G.; Huang, D.; Zhang, C.; Cheng, M.; Hu, L.; Wan, J.; Liu, Y.; et al. In Situ Grown AgI/Bi12O17Cl2 Heterojunction Photocatalysts for Visible Light Degradation of Sulfamethazine: Efficiency, Pathway, and Mechanism. ACS Sustain. Chem. Eng. 2018, 6, 4174–4184. [Google Scholar] [CrossRef]
- Kolodziejczak-Radzimska, A.; Jesionowski, T. Zinc oxide—From synthesis to application: A review. Materials 2014, 7, 2833–2881. [Google Scholar] [CrossRef] [PubMed]
- Pelaez, M.; Nolan, N.T.; Pillai, S.C.; Seery, M.K.; Falaras, P.; Kontos, A.G.; Dunlop, P.S.; Hamilton, J.W.; Byrne, J.A.; O’shea, K.; et al. A review on the visible light active titanium dioxide photocatalysts for environmental applications. Appl. Catal. B 2012, 125, 331–349. [Google Scholar] [CrossRef] [Green Version]
- Banerjee, S.; Pillai, S.C.; Falaras, P.; O’Shea, K.; Byrne, J.; Dionysiou, D.J. New insights into the mechanism of visible light photocatalysis. Phys. Chem. Lett. 2014, 5, 2543–2554. [Google Scholar] [CrossRef]
- Etacheri, V.; Di Valentin, C.; Schneider, J.; Bahnemann, D.; Pillai, S.C. Visible-light activation of TiO2 photocatalysts: Advances in theory and experiments. J. Photochem. Photobiol. C Photochem. Rev. 2015, 25, 1–29. [Google Scholar] [CrossRef] [Green Version]
- Nozik, A. Photoelectrochemistry: Applications to solar energy conversion. Annu. Rev. Phys. Chem. 1978, 29, 189–222. [Google Scholar] [CrossRef]
- Mamba, G.; Kiwi, J.; Pulgarin, C.; Sanjines, R.; Giannakis, S.; Rtimi, S. Evidence for the degradation of an emerging pollutant by a mechanism involving iso-energetic charge transfer under visible light. Appl. Catal. B Environ. 2018, 233, 175–183. [Google Scholar] [CrossRef]
- Kung, Y.; Cai, L.; Pan, F.; Shen, W.; Su, H. Photonic Fano Resonance of Multishaped Cu2O Nanoparticles on ZnO Nanowires Modulating Efficiency of Hydrogen Generation in Water Splitting Cell. ACS Sustain. Chem. Eng. 2018, 6, 6590–6598. [Google Scholar] [CrossRef]
- Yu, J.; Kiwi, J.; Wang, T.; Pulgarin, C.; Rtimi, S. Evidence for a dual mechanism in the TiO2/CuxO photocatalyst during the degradation of sulfamethazine under solar or visible light: Critical issues. J. Photochem. Photobiol. A 2019, 375, 270–279. [Google Scholar] [CrossRef]
- Niedziolka-Jonsson, J.; Mackowski, S. Plasmonics with Metallic Nanowires. Materials 2019, 12, 1418–1432. [Google Scholar]
- Hou, W.; Cronin, S.B. A review of surface plasmon resonance-enhanced photocatalysis. Adv. Funct. Mater. 2013, 12, 1612–1619. [Google Scholar] [CrossRef]
- Qiu, X.; Miyauchi, M.; Sunada, K.; Minoshima, M.; Liu, M.; Lu, Y.; Li, D.; Shimodaira, Y.; Hosogi, Y.; Kuroda, Y.; et al. Hybrid CuxO/TiO2 nanocomposites as risk-reduction materials in indoor environments. Acs Nano 2012, 6, 1609–1618. [Google Scholar] [CrossRef]
- Wang, H.; Tam, F.; Grady, N.K.; Halas, N.J. Cu nanoshells: Effects of interband transitions on the nanoparticle plasmon resonance. J. Phys. Chem. B 2005, 109, 18218–18222. [Google Scholar] [CrossRef]
- Singhal, S.; Kaur, J.; Namgyal, T.; Sharma, R. Cu-doped ZnO nanoparticles: Synthesis, structural and electrical properties. Phys. B Condens. Mater 2012, 407, 1223–1229. [Google Scholar] [CrossRef]
- Fujishima, A.; Zhang, X.; Tryk, D. TiO2 photocatalysis and related surface phenomena. Surf. Sci. Rep. 2008, 63, 515–582. [Google Scholar] [CrossRef]
- Vuong, M.; Chinh, D.; Huy, T.; Lee, I. CuO-Decorated ZnO Hierarchical Nanostructures as Efficient and Established Sensing Materials for H2S Gas Sensors. Sci. Rep. 2016, 6, 26736. [Google Scholar]
- Ahmad, R.; Tripathy, N.; Ahn, S.; Bhat, S.; Mahmoudi, T.; Wang, Y.; Yoo, Y.; Kwon, W.; Yang, H.; Hahn, B.Y. Highly Efficient Non-Enzymatic Glucose Sensor Based on CuO Modified Vertically-Grown ZnO Nanorods on Electrode. Sci. Rep. 2017, 7, 5715–5718. [Google Scholar] [CrossRef]
- Skårman, B.; Grandjean, D.; Benfield, E.; Hinz, A.; Andersson, A.; Wallenberg, R.J. Carbon monoxide oxidation on nanostructured CuOx/CeO2 composite particles characterized by HREM, XPS, XAS, and high-energy diffraction. Catalysis 2002, 211, 119–133. [Google Scholar] [CrossRef]
- Kraeutler, B.; Bard, A.J. Heterogeneous photocatalytic synthesis of methane from acetic acid-new Kolbe reaction pathway. Am. Chem. Soc. 1978, 100, 2239–2240. [Google Scholar] [CrossRef]
- Fan, Y.; Ji, Y.; Kong, D.; Lu, J.; Zhou, Q. Kinetic and mechanistic investigations of the degradation of sulfamethazine in heat-activated persulfate oxidation process. J. Hazard. Mater. 2015, 300, 39–47. [Google Scholar] [CrossRef] [PubMed]
- Cairns, D. Essentials of Pharmaceutical Chemistry, 3rd ed.; Pharmaceutical Press: London, UK; Chicago, IL, USA, 2008; p. 69. [Google Scholar]
- Fernandez, J.; Nadtochenko, V.; Kiwi, J. Photobleaching of Orange II within seconds using the oxone/Co 2+ reagent through Fenton-like chemistry. Chem. Commum. 2003, 18, 2382–2383. [Google Scholar] [CrossRef] [PubMed]
- Parks, G. The isoelectric points of solid oxides, solid hydroxides, and aqueous hydroxo complex systems. Chem. Rev. 1965, 65, 177–198. [Google Scholar] [CrossRef]
- Tacic, A.; Nicolic, V.; Nicolic, L.; Savic, I. Antimicrobial sulfonamide drugs. Adv. Technol. 2017, 6, 58–71. [Google Scholar] [CrossRef] [Green Version]
- Hu, J.; Liu, P.; Chen, L. Comparison of surface plasmon resonance responses to dry/wet air for Ag, Cu, and Au/SiO2. Appl. Opt. 2012, 51, 1357–1360. [Google Scholar] [CrossRef]
- Khanehzaeri, H.; Ahmad, M.; Shameli, K.; Ajdari, Z. Synthesis and characterization of Cu@ Cu2O core shell nanoparticles prepared in seaweed Kappaphycus alvarezii Media. J. Electrochem. Sci. 2014, 9, 8189–8198. [Google Scholar]
- Liu, X.; Swihart, M. Heavily-doped colloidal semiconductor and metal oxide nanocrystals: An emerging new class of plasmonic nanomaterials. Chem. Soc. Rev. 2014, 43, 3908–3920. [Google Scholar] [CrossRef]
- Mendelsberg, J.; McBride, M.; Duong, T.; Bailey, M.; Llordes, A.; Milliron, J.; Helms, A. Dispersible Plasmonic Doped Metal Oxide Nanocrystal Sensors that Optically Track Redox Reactions in Aqueous Media with Single-Electron Sensitivity. Adv. Opt. Mater. 2015, 3, 1293–1300. [Google Scholar] [CrossRef]
- Sulzberger, B.; Canonica, S.; Egli, T.; Giger, W.; Klausen, J.; von Gunten, U. Oxidative transformations of contaminants in natural and in technical systems. Chimia 1997, 51, 900–907. [Google Scholar]
- Wardman, P.J. Reduction potentials of one-electron couples involving free radicals in aqueous solution. Phys. Chem. Ref. Data 1989, 18, 1637–1755. [Google Scholar] [CrossRef]
- Mills, A. An overview of the methylene blue ISO test for assessing the activities of photocatalytic films. Appl. Catal. B 2012, 128, 144–149. [Google Scholar] [CrossRef]
- Jing, L.; Zhou, W.; Tian, G.; Fu, H. Surface tuning for oxide-based nanomaterials as efficient photocatalysts. Chem. Soc. Rev. 2013, 42, 9509–9549. [Google Scholar] [CrossRef]
- Yu, J.; Kiwi, J.; Zivkovic, I.; Rønnow, H.M.; Wang, T.; Rtimi, S. Quantification of the local magnetized nanotube domains accelerating the photocatalytic removal of the emerging pollutant tetracycline. Appl. Cat. B Environm. 2019, 248, 450–458. [Google Scholar] [CrossRef]
- Tamaekong, N.; Phanichphant, S.; Wisitsoraat, A.; Liewhiran, C. Core/Shell of p-CuxO/n-ZnO Nanowire Arrays for H2S Gas Sensor. Solid. State Phenom. 2018, 283, 7–15. [Google Scholar] [CrossRef]
- Elfadill, N.; hashim, M.; Saron, K.; Charour, K.; Qaeed, M.; Bououdina, M. Ultraviolet–visible photo-response of p-Cu2O/n-ZnO heterojunction prepared on flexible (PET) substrate. Mater. Chem. Phys. 2015, 156, 54–60. [Google Scholar] [CrossRef]
- Maccato, C.; Berreca, D.; Carraro, G.; Gasparotto, A.; Gombac, V.; Fornasiero, P. CuOx-TiO2 Photocatalysts for H2 Production from Ethanol and Glycerol Solutions. Surf. Coat. Technol. 2013, 230, 219–222. [Google Scholar] [CrossRef]
- Zhang, Y.; Stefanakos, M.R.E.; Goswami, D. Synthesis, characterization, and applications of ZnO nanowires. J. Nanomater. 2012, 2012, 624520. [Google Scholar] [CrossRef]
- Shirley, D.A. High-resolution X-ray photoemission spectrum of the valence bands of gold. Phys. Rev. B 1972, 5, 4709–4714. [Google Scholar] [CrossRef]
Figure 1.
Scanning electron microscopy (SEM) imaging of ZnO and ZnO/Cux=1.25O samples: (a) image of the hexagonal ZnO nanowires in a 2 micron scale, (b) image of the ZnO/Cux=1.25O showing the CuxO NPs, and (c) size distribution of CuxO NPs using imageJ. The mapping by electron dispersive spectroscopy (EDX) shows the atomic distribution of (d) Zn, (e) O and (f) Cu.


Figure 2.
X-ray diffraction (XRD) pattern of ZnO/Cux=1.25O photocatalyst powder. For further details, see text.
Figure 2.
X-ray diffraction (XRD) pattern of ZnO/Cux=1.25O photocatalyst powder. For further details, see text.

Figure 3.
(a) X-ray photoelectron spectroscopy (XPS) survey spectra of ZnO/Cux=1.25O; (b) Zn2p peak shifts during SMT degradation; (c) Cu2p shifts during SMT degradation; and (d) O1s shift observed during SMT degradation.
Figure 3.
(a) X-ray photoelectron spectroscopy (XPS) survey spectra of ZnO/Cux=1.25O; (b) Zn2p peak shifts during SMT degradation; (c) Cu2p shifts during SMT degradation; and (d) O1s shift observed during SMT degradation.

Figure 4.
Surface potential and local pH of the ZnO/Cux=1.25O nanowires under: (a) simulated solar light and (b) visible light irradiation during SMT degradation. Solution parameters: [catalyst] = 500 mg/L, [SMT] = 2.5 mg/L and initial pH 7.0.
Figure 4.
Surface potential and local pH of the ZnO/Cux=1.25O nanowires under: (a) simulated solar light and (b) visible light irradiation during SMT degradation. Solution parameters: [catalyst] = 500 mg/L, [SMT] = 2.5 mg/L and initial pH 7.0.

Figure 5.
Degradation of sulfamethazine (SMT) on: (a) ZnO/CuxO (5%) in the dark, (b) CuxO, (c) ZnO/CuxO (1%), (d) ZnO, (e) ZnO/CuxO (2.5%), (f) ZnO/CuxO (10%), and (g) ZnO/CuxO (5%) under simulated solar light (310 nm–800 nm). Solution parameters: [catalyst] = 500 mg/L, [SMT] = 2.5 mg/L, initial pH 7.0, and solar light intensity 50.1 mW/cm2.

Figure 6.
Degradation of sulfamethazine (SMT) on: (a) ZnO/CuxO (5%) in the dark, (b) CuxO, (c) ZnO/CuxO (1%), (d) ZnO, (e) ZnO/CuxO (2.5%), (f) ZnO/CuxO (10%), and (g) ZnO/CuO (5%) under visible light (> 410 nm). Solution parameters: [catalyst] = 500 mg/L, [SMT] = 2.5 mg/L, initial pH 7.0, and visible light intensity 38.9 mW/cm2.

Figure 7.
SMT degradation peaks obtained by high pressure liquid chromatography (HPLC) mediated by ZnO/Cux=1.25O %) nanowires under (a) simulated solar light irradiation and (b) visible light irradiation. Solution parameters: Solution parameters: [catalyst] = 500 mg/L, [SMT] = 2.5 mg/L, initial pH 7.0.

Scheme 1.
SMT equilibria showing their negative, zwitterion and positively-charged functionalities as a function of the solution pH.
Scheme 1.
SMT equilibria showing their negative, zwitterion and positively-charged functionalities as a function of the solution pH.

Figure 8.
Effect of light intensity on the SMT degradation kinetics by ZnO/Cux=1.25O under (a) simulated solar light and (b) visible light. Solution parameters: [catalyst] = 500 mg/L, [SMT] = 2.5 mg/L and initial pH 7.0.
Figure 8.
Effect of light intensity on the SMT degradation kinetics by ZnO/Cux=1.25O under (a) simulated solar light and (b) visible light. Solution parameters: [catalyst] = 500 mg/L, [SMT] = 2.5 mg/L and initial pH 7.0.

Figure 9.
Intervention of ROS scavengers during SMT degradation by ZnO/Cux=1.25O %) under simulated solar light on the following: (a) 0.01 mM NaN3, (b) no scavenger, (c) 0.5 mM p-benzoquinone, (d) 0.5 mM methanol, and (e) 0.5 mM EDTA-2Na. The light intensity under visible light irradiation was 50.1 mW/cm2.

Figure 10.
Intervention of ROS scavengers during SMT degradation by ZnO/Cux=1.25O %) under visible light on the following: (a) 0.01 mM NaN3, (b) no scavenger, (c) 0.5 mM p-benzoquinone, (d) 0.5 mM EDTA-2Na, and (e) 0.01 mM methanol. Solution parameters: [catalyst] = 500 mg/L, [SMT] = 2.5 mg/L, initial pH 7.0. The light intensity under visible light irradiation was 38.9 mW/cm2.

Figure 11.
Suggested interfacial charge transfer mechanism (IFCT) during the SMT degradation on ZnO/Cux=1.25O under (a) simulated solar light and (b) visible light at pH 6.5.
Figure 11.
Suggested interfacial charge transfer mechanism (IFCT) during the SMT degradation on ZnO/Cux=1.25O under (a) simulated solar light and (b) visible light at pH 6.5.

Scheme 2.
Sulfamethazine functional group coordination with ZnO and ZnO/CuxO.

Scheme 3.
Schematic illustration of the LSPR suggested at the interface of ZnO/CuxO nanowires.

Scheme 4.
Structural formula of sulfamethazine (SMT.).


Table 1.
Surface atomic percentage concentration of the elements determined by X-ray photoelectron spectroscopy (XPS) in the ZnO/Cux=1.25O sample.
Table 1.
Surface atomic percentage concentration of the elements determined by X-ray photoelectron spectroscopy (XPS) in the ZnO/Cux=1.25O sample.
| C1s | N1s | O1s | Na1s | Cu2p | Zn2p | |
|---|---|---|---|---|---|---|
| Before SMT degradation | 13.78 | 0.00 | 42.58 | 0.00 | 7.32 | 36.32 |
| After SMT degradation | 14.02 | 0.00 | 41.99 | 0.00 | 6.92 | 37.06 |
© 2019 by the authors. Licensee MDPI, Basel, Switzerland. This article is an open access article distributed under the terms and conditions of the Creative Commons Attribution (CC BY) license (http://creativecommons.org/licenses/by/4.0/).
Share and Cite
MDPI and ACS Style
Yu, J.; Kiwi, J.; Wang, T.; Pulgarin, C.; Rtimi, S. Duality in the Mechanism of Hexagonal ZnO/CuxO Nanowires Inducing Sulfamethazine Degradation under Solar or Visible Light. Catalysts 2019, 9, 916. https://doi.org/10.3390/catal9110916
AMA Style
Yu J, Kiwi J, Wang T, Pulgarin C, Rtimi S. Duality in the Mechanism of Hexagonal ZnO/CuxO Nanowires Inducing Sulfamethazine Degradation under Solar or Visible Light. Catalysts. 2019; 9(11):916. https://doi.org/10.3390/catal9110916
Chicago/Turabian StyleYu, Jiajie, John Kiwi, Tianhe Wang, Cesar Pulgarin, and Sami Rtimi. 2019. "Duality in the Mechanism of Hexagonal ZnO/CuxO Nanowires Inducing Sulfamethazine Degradation under Solar or Visible Light" Catalysts 9, no. 11: 916. https://doi.org/10.3390/catal9110916
Note that from the first issue of 2016, this journal uses article numbers instead of page numbers. See further details here.