Article

Chemical and Electronic Changes of the CeO2 Support during CO Oxidation on Au/CeO2 Catalysts: Time-Resolved Operando XAS at the Ce LIII Edge

Institute of Surface Chemistry and Catalysis, Ulm University, Albert-Einstein-Allee 47, D-89081 Ulm, Germany
*
Authors to whom correspondence should be addressed.
Catalysts 2019, 9(10), 785; https://doi.org/10.3390/catal9100785
Submission received: 1 September 2019 / Revised: 12 September 2019 / Accepted: 17 September 2019 / Published: 20 September 2019
(This article belongs to the Special Issue Spectroscopy in Catalysis)

Abstract

:
While being highly active for the CO oxidation reaction already at low temperatures, Au/CeO2 catalysts suffer from continuous deactivation with time on stream, with the activity and deactivation depending on the initial catalyst activation procedure. In previous X-ray absorption measurements at the Au LIII edge, which focused on changes in the electronic and geometric changes of Au, we found a modest increase of the Au particle size during reaction, with the Au nanoparticles (NPs) present in a dominantly metallic state during reaction, regardless of the pretreatment. Here we aim at expanding on these insights by examining the changes in electronic and chemical composition of the CeO2 support induced by different pretreatment procedures and during subsequent CO oxidation at 80 °C, by following changes at the Ce LIII near edge region in time-resolved operando X-ray absorption measurements. The results indicate a strong dependence of the initial concentration of Ce3+ ions on the pretreatment, while during subsequent reaction this rapidly approaches a steady-state value which depends on the oxidative/reductive character of the reaction gas mixture, but is largely independent of the pretreatment. These results are discussed and related to earlier finding on the electronic properties of Au nanoparticles under identical reaction conditions.

Graphical Abstract

1. Introduction

For over 3 decades, the intriguing catalytic properties of supported gold catalysts have inspired a large number of scientists, both from a fundamental and application-oriented points-of-view [1,2,3]. The number of studies on Au based catalysts is still increasing rapidly, not only because of their exceptionally high catalytic activity for a variety of very different reactions such as CO oxidation [4], methane activation [5], (reverse) water gas shift (R)WGS reaction [6,7], anaerobic oxidation of alcohol [8], propene oxidation [9,10], or CO/CO2 reduction to methanol [11,12,13,14], but also since they can be considered as attractive model systems for studies of fundamental reaction mechanisms. Metal oxide supported Au nanoparticles, in particular, have been found very promising as heterogeneous catalysts. The activity of these catalysts was found to rely decisively on the nature of oxide support, specifically the support reducibility. According to an early systematic study of this parameter by Schubert et al., these oxides were classified as inert and active supports [4]. The first type was identified as non-reducible oxides, inert toward oxygen activation, while the latter type of active supports are reducible oxides (e.g., Fe2O3, TiO2, NiOx, and CoOx), which are able to actively adsorb, dissociate, and store oxygen, and then re-supply active oxygen species for oxidation reactions. Among these, CeO2 is considered as one of the most important oxides in catalysis due to its remarkable oxidation/reduction characteristics related to the facile transfer of electrons from O2− ions to the two adjacent Ce4+ atoms, forming Ce3+ species [15,16,17,18], which make ceria an ideal oxygen storage material.
Gold nanoparticles (NPs) were proposed to strongly modify the surface properties of the ceria support by electronic interactions between support and Au NPs, allowing facile removal of lattice oxygen already at temperatures around ambient temperature [19]. Furthermore, Au NPs in close contact with (surface) O-vacancy defects were proposed to act as active sites in the (R)WGS reaction [19]. The participation of O-vacancy defects in the ceria support in contact with the Au NPs in the reaction, most likely via formation and re-oxidation of these sites, was derived later also from dynamic measurements in a temporal analysis of products (TAP) reactor [20,21]. Finally, the important role of O-vacancies in this reaction was also verified in recent operando Raman spectroscopy [22,23] and X-ray absorption spectroscopy (XAS) [24] studies.
Focusing on the CO oxidation reaction, where Au/CeO2 catalysts are also known to be very active [25,26,27,28,29,30]. Metal-support interactions (MSIs) between Au nanoparticles and CeO2 support [31,32] and the dynamic formation and replenishment of O-vacancy defects [27,33] were proposed to play a decisive role in the reaction. Furthermore, the nature of the active Au species, in particular, their size and oxidation state [34,35], or the presence and nature of adsorbed surface carbon-containing species [36,37,38] were claimed to affect the performance of these catalysts, and thus also the deactivation behavior in different ways. While there is ample evidence that each of these effects somehow affects the reaction, direct correlations between the temporal development of these features and of the activity of Au/CeO2 catalysts in the CO oxidation reaction, under working conditions, have rarely been established [33,39]. This is the topic of the present contribution, where we report results of a time-resolved operando XAS study at the Ce LIII near edge region on the oxidation state of the ceria support during the CO oxidation reaction in different gas mixtures. Considering that previous studies had demonstrated considerable effects of the pretreatment procedure [24,30], we applied different oxidative and reductive pretreatment procedures. This study follows a recent report of similar XAS measurements at the Au LIII edge, and additional in situ FTIR measurements, focusing on the electronic, chemical, and structural properties of the Au nanoparticles on an Au/CeO2 catalyst. Those measurements indicated that under present reaction conditions the deactivation of the Au/CeO2 catalysts originates from a modest growth of Au nanoparticles during reaction and, tentatively, from a slow bulk reduction of the CeO2 support, where the latter was concluded indirectly from activity differences between differently pretreated catalysts [30,35]. Neither the accumulation of carbon-containing species nor a change of the oxidation state of Au were held responsible for the long-term deactivation. The influence of the oxidation state of the ceria support was demonstrated also for the closely related PROX (preferential oxidation of CO) reaction, where Hernandez et al. reported a significant decrease in the ceria band gap, from 3.09 to 2.82 eV, during the reaction, and where the change in ceria band gap with time on stream followed the deactivation of the low-Au-content catalyst [40]. Therefore, direct probing of the oxidation state of the CeO2 support during the CO oxidation reaction would be highly desirable for a better understanding of the impact of the CeO2 oxidation state on the activity and its correlation with the observed deactivation of the catalyst. Since ex situ X-ray photoelectron spectroscopy (XPS) measurements performed under ultrahigh vacuum (UHV) conditions may not reflect the true oxidation state of ceria, due to loss of surface oxygen when being irradiated with Al Kα radiation [41], this requires in situ/operando measurements when using X-rays for spectroscopy, or other techniques sensitive to the ceria oxidation state such as Raman spectroscopy [19,22,23,33,34,39,42,43]. Here it should be noted that, in contrast to Raman spectroscopy, XAS measurements in the near edge region (XANES) allow the ability to quantitatively determine the relative content of Ce3+ species and thus of O-vacancies, while Raman spectroscopy is more sensitive to details of the nature of the O-vacancy defect.
In the following, we will first present and discuss XANES data on the state of the catalyst after different oxidative and reductive pretreatment procedures and compare these with data obtained for reference materials (Section 2.1). Subsequently we will follow the oxidation state of the catalysts and the activity of the catalysts by operando XANES measurements, after different initial catalyst pretreatments (Section 2.2). This will include also transient changes of the reaction gas mixture, using a standard reaction gas mixture (CO:O2 = 1:1) as well as CO-rich and O2-rich mixtures with CO:O2 = 5:1) and CO:O2 =1:5, respectively. Finally, we discuss the role of Ce3+ species/O-vacancies in the CO oxidation reaction in a comprehensive picture (Section 2.3). Abrief description of the experimental set-up and procedures is given in Section 3, which is followed by the conclusions (Section 4).

2. Results and Discussion

2.1. State of the Au/CeO2 Catalysts after Different Pretreatment Procedures

We will start with the pure ceria support and the Ce reference samples, which were used to evaluate the ceria oxidation state and thus quantify the amount of Ce3+ species in the Au/CeO2 catalysts. To obtain well defined reference spectra we recorded X-ray absorption spectra of cerium (III) carbonate hydrate and cerium (IV) oxide at the Ce LIII edge without further pretreatment (measured at 80 °C in N2, see Figure 1). The two references showed significant differences in the onset of the absorption edge, as illustrated by the red and blue solid lines in Figure 1a and in Figure 1b, respectively.
For comparison with our data recorded on CeO2 we also included a XANES spectrum by Auffan and Ravel [44] (orange lines in Figure 1b), which agrees rather well with our data, except for slightly higher intensities in the two main Ce peaks. The spectrum of the Ce(III) species (Figure 1a) is characterized by a pronounced white line peak directly at the edge, whereas the Ce(IV) reference spectrum shows a double peak with lower intensities at the Ce LIII edge. Furthermore, the inflection point of the spectrum of Ce(IV) is located at about 1.0 eV higher energy compared to that of the reduced Ce(III) species (5725.6 eV). The main contributions to the respective XANES spectra, which are indicated as dashed and dotted lines in the spectra shown in Figure 1 [45], are summarized in Table 1. A detailed discussion of the respective electronic states and transitions contributing to the spectra was given by Yoshida et al. [45]. The solid black lines represent the fits based on these components to our reference spectra.
The spectra recorded from our Ce references (red and blue lines) agree well with the fit based on the components reported by Yoshida et al. [45] (black curves in both panels of Figure 1). Note that contribution of the electronic transition B0 (Ce(III) white line marked in red in the Ce(IV) reference spectrum) is higher than in the data reported by Yoshida et al., which denotes a higher amount of oxygen vacancies (Ce3+ species) in our Ce(IV) reference than in their sample.
The Ce(III) reference spectrum is characterized by a single Lorentzian peak B0 plus the transition into the continuum state (Figure 1a), whereas six Lorentzian peaks (see Table 1; in Figure 1b only the four main components B0–B2 and C2 are shown) plus the contribution to the continuum states, where the latter is usually characterized by an arc tangent function, are required to fit the Ce(IV) spectrum. This includes the Ce(III) related peak (red), indicating that there is a small persisting fraction of Ce(III) ions. The presence of six individual Lorentzian peaks in the region close to the Ce LIII edge renders a complete quantitative analysis of the electronic state of the ceria nanoparticles complex. To simplify the fitting scenario, we chose the linear combination analysis (LCA) technique, varying only the ratio of Ce(III) and Ce(IV) contributions. Although this analysis might not reproduce the absolute value of the oxidation state with highest accuracy, it is very sensitive to small changes in the oxidation state (see the small contribution of Ce(III) in the Ce(IV) spectrum indicated by the red peak in Figure 1b).
Next, we explored the effect of the catalyst pretreatment on the pure CeO2 support. Figure 2 shows XANES spectra of the pure ceria support recorded in N2 at 80 °C after an oxidative (O400: blue solid line) and after a reductive (CO400: red solid line) pretreatment, respectively. The spectra exhibit distinct differences, mainly at the onset of the Ce LIII absorption edge, but to a lower extent also in the intensity of the two dominant features characteristic of Ce(IV). For comparison, we added the spectra from the two references as dashed curves in this figure.
After oxidative pretreatment (O400), the main features of the spectrum resemble those of the fully oxidized Ce(IV) reference (blue dashed line), only the intensity in the peaks at 5730 eV (B2, see Table 1) and 5738 eV (C2) is lower than in the reference spectrum. The small peak at 5720 eV is related to Ce(IV) species (peak A, see Table 1) and has roughly the same intensity as for the Ce(IV) reference. A reductive pretreatment (CO400) on the other hand leads to an absorption spectrum with a higher intensity directly at the absorption edge (photon energy range: 5720–5730 eV), which reflects a higher contribution of the white line of reduced ceria species (cf. Ce(III) reference spectrum, with a peak at 5726 eV (B0) in Figure 2, dashed line). Quantitative evaluation yields a negligible contribution (1.7%) from Ce3+ for the O400 pretreated support, while for the CO400 pretreated support it is about 18%.
Similar XAS spectra recorded on Au/CeO2 catalysts at the Ce LIII absorption edge are presented in Figure 3. On the first view, these spectra closely resemble those obtained on the pure CeO2 support (see Figure 2). Reductive pretreatments (H400 and CO400) lead to pronounced contributions from the Ce LIII absorption edge, whereas this feature is missing after an oxidative pretreatment (all measurements after pretreatment were performed under a continuous flow of N2 at 80 °C). The black dash-dotted line, which displays the corresponding XANES measurement from the Ce(IV) reference, largely coincides with the spectrum obtained after the oxidative pretreatment.
The appearance of the shoulder around 5726 eV at the CO400 pretreated support (indicated by an arrow) is indicative of the presence of Ce3+ species. Based on a Linear Combination Analysis (see Section 3.2), it corresponds to a Ce3+ contribution of about 6% for the CO400 and 10% for the H400 pre-treated catalysts, whereas this was only about 0.4% after oxidative pretreatment (cf. also Figure 4, Figure 5 and Figure 6).
In the inset we additionally show XANES date collected at the Au LIII edge at (11919 eV) after oxidative (O400—blue spectrum) and reductive (H400—red spectrum) pretreatments, which were taken from [30,35], respectively, together with spectra from Au2O3 and a Au foil (dashed line: Au2O3, dashed dotted line: Au metal foil) used as reference materials. Note that a different catalyst was used in these measurements, with a Au loading of 2.5 wt.%, but otherwise rather similar properties as in the present study. The red spectrum of the H400 pretreated sample looks very similar to that of the Au foil and indicates an essentially metallic state of Au in the catalyst, indicative of metallic Au nanoparticles. The blue spectrum, in contrast, shows a contribution of about 40% from the white line, indicative of contributions from an oxidized state of Au [46]. The trend in the chemical state of the Au NPs fits well to that of the ceria support, with a highly oxidized Ce(IV) state after O400 pretreatment and a partly reduced ceria support after (reductive) H400 pretreatment. For a more detailed discussion on the nature of the Au species in the Au/CeO2 catalysts upon different pretreatments we refer to our previous publications [30,35,46].

2.2. Operando X-Ray Absorption Spectroscopy during CO Oxidation

The chemical composition and the catalytic activity of the differently pretreated Au/CeO2 catalysts during the CO oxidation reaction were characterized as a function of reaction time by recording the CO2 formation (see Section 3.2) during the XAS experiments. Figure 4 displays a combination of CO2 formation rates (black empty symbols) and XAS data (colored symbols) as a function of time on stream after an oxidative pretreatment (O400), where the concentration of Ce3+ species (Ce3+/(Ce3+ + Ce4+)) during the reaction was evaluated from the XANES spectra (blue, green, and red symbols). The measurements were performed at 80 °C in a reaction gas mixture of 1% CO, 1% O2 (balance N2), interrupted by periods in O2-rich (5% O2 and 1% CO) and CO-rich reaction gas mixtures (5% CO and 1% O2). It should also be noted that the XANES measurements shown in Figure 4 require a time of about 30 min per spectrum for acceptable statistics, which limits the time resolution. The CO2 formation rate shown in Figure 4 starts at a value of slightly less than 0.15 µmolCO2 s−1 and decays to about 0.13 µmolCO2 s−1 within 1 h on stream in the standard reaction gas mixture (1% CO, 1% O2, and balance N2). Then the rate decays only very slowly for the next three hours. The Ce3+ concentration after the O400 pretreatment was about 0.4% ± 0.2% and vanished completely (below the detection limit of about 0.2%) within 1.5 h. After approximately 4 h, the gas mixture was changed to an O2-rich mixture (5% O2 and 1% CO). Here the CO2 formation rate increased slightly from 0.125 to 0.14 µmolCO2 s−1, followed by a similar slow decrease as before in the standard mixture. During this period and also when returning to the standard reaction gas mixture, where the CO2 formation rate returned from below slightly below 0.135 to 0.125 µmolCO2 s−1, we could not detect any significant variation in the amount of Ce3+ species, staying close to zero, as expected for the more oxidative nature of this reaction mixture compared to the standard mixture. This is different when switching to a CO-rich mixture (5% CO and 1% O2), where both the CO2 formation rate and the Ce3+ concentration increased significantly (CO2 formation: from 0.12 µmolCO2 s−1 to about 0.33 µmolCO2 s−1; Ce3+ ratio: from close to 0% to about 2.5%). Both CO2 formation and Ce3+ concentration steadily decay with time for about 210 min. Compared to the standard gas mixture the decay in CO2 formation is about three times faster. The Ce3+ concentration seems to follow the CO2 formation, with the Ce3+ concentration decreasing from 2.5% to 1.7% after 210 min on-stream and the CO2 formation from 0.33 µmolCO2 s−1 to 0.29 µmolCO2 s−1. Obviously, changing to the CO-rich mixture induces a significant change in the oxidation state of the support, leading to a measurable concentration of Ce3+ sites as a result of the formation of O-vacancy defects. The correlation between the concentration of Ce3+ ions and thus of O-vacancy sites and the activity for CO oxidation indicates a pivotal role of these sites for the reaction, possibly controlling the activation of molecular oxygen species during reaction. These findings are in good agreement with earlier findings for Au/CeO2 and Au/TiO2, which revealed a correlation between CO oxidation activity and the presence of O-vacancy sites [27,47,48].
In the next step, when the reaction gas mixture was returned to the standard composition (1% CO, 1% O2), the CO2 formation immediately went down to 0.11 µmolCO2 s−1 and the Ce3+ species vanished again completely (within the detection limit) within a short time.
Finally, we ‘re-activated’ and fully oxidized the catalyst again by a second O400 treatment. After this treatment the CO2 formation in the standard gas mixture was in the same range as after the initial O400 treatment, actually it was even slightly higher. Furthermore, similar as after the initial O400 treatment, the CO2 formation decreased rapidly, with most of the decay occurring during the first 10-15 min. The concentration of Ce3+ is below the detection limit, and stays at this level during reaction in the standard reaction gas mixture.
The CO2 formation rates and the ceria oxidation state can be compared with results of a recent study using the same 4.5 wt.% Au/CeO2 catalyst, where we performed a rather similar experiment in the same gas mixtures, following in addition the oxidation state of the Au NPs by XANES measurements at the Au LIII edge [30]. While in that case similar trends were obtained for the reactivity in standard and O2-rich gas mixtures, they differed somewhat for the CO-rich gas mixture. In that case the catalyst showed a rather strong deactivation once the reaction in the CO-rich gas mixture commenced, while it increased in the present case. After careful examination of the data we think that this discrepancy is at least partly due to differences in the experimental procedure, and that the present reaction data are correct. This is discussed in more detail in the Supporting Information. Looking at the oxidation state of the catalyst, the previous experiments at the Au LIII edge had shown that the oxidation state of the Au NPs is partly oxidic after the second O400 treatment [30,46], though with a slightly smaller extent than after the first treatment.
To summarize the findings for the O400 pretreated catalyst, the concentration of Ce3+ species is very low and at/below the detection limit both after pretreatment and during reaction in a standard or in an O2-rich gas mixture, while in the more reductive CO-rich reaction gas mixture it is in the range of 2–3%. The significantly higher Ce3+ content goes along with a higher CO2 formation rate (roughly by a factor of 2.3), and also with a more pronounced deactivation with time on stream. Formally, without considering changes in the reaction constant and the rather high conversion, the higher CO2 formation rate would correspond to a reaction order in CO of about 0.5, while for O2 it is about zero. This will be discussed in more detail later. Furthermore, our observations indicated also that the changes in the formation of O-vacancies and the changes in activity as well as the strong dependence of the O-vacancy formation on the partial pressure of CO in the reaction gas are reversible.
Results of a similar experiment performed on a reductively pretreated catalyst, after H400 pretreatment, are presented in Figure 5. In general, the trends are rather similar to those observed after oxidative O400 pretreatment, although the absolute values are different. E.g., the CO2 formation rate is generally about 40% lower than after oxidative pretreatment, but with similar trends in O2-rich and CO-rich reaction atmospheres as after O400 pretreatment. Although it may look different because of the different time scales in Figure 4 and Figure 5, the deactivation rate is nearly identical in all reaction gas mixtures. Only in the first hour after H400 pretreatment the decrease in the CO2 formation rate is less pronounced than after O400 pretreatment. Differences appear, however, in the Ce3+ concentration. It starts with a rather high value of 11%, meaning that pretreatment in the reducing gas mixture (10% H2 in N2) at 400 °C results in a considerable formation of O-vacancies/Ce3+ species, which is more than one order of magnitude higher than observed during reaction of the O400 pretreated catalyst in the CO-rich gas mixture. During operation in the standard gas mixture, this value decreases rapidly to a concentration of about 1%. Though rather low, this is nevertheless higher than during reaction after O400 pretreatment, where after an initial phase the Ce3+ concentration was negligible. Reasons for this discrepancy will be discussed after the next change in gas mixture.
Changing to an O2-rich gas mixture, the Ce3+ concentration quickly decreases to values around 0.5 ± 0.1%, except for an initial small drop to slightly lower values. This level is maintained also when returning to the standard gas mixture. We explain this remaining fraction of measurable Ce3+ species, which is still present after reaction in O2-rich mixture, by deeper lying O-vacancy defects, which could be generated during pretreatment at 400 °C, due to the higher mobility of these vacancy defects at elevated temperatures, but not be replenished during reaction at 80 °C, not even in O2-rich atmosphere (see below). In the initial phases in standard mixture and again in the O2-rich gas mixture the accessible O-vacancies were replenished by surface reaction, which required that they could diffuse to the ceria surface. From the fact that there is (i) only little change in Ce3+ content when changing from the initial reaction in standard reaction gas to the O2-rich mixture and (ii) no significant change in Ce3+ content when changing from O2-rich to standard reaction mixture we conclude that the standard gas mixture is sufficiently oxidative to replenish most of the surface near O-vacancy defects.
When changing to the CO-rich reaction atmosphere, the difference between the differently pretreated catalysts (O400 and H400) seems to disappear, in both cases the Ce3+ ratio is about 1.4–2.5%, with decreasing Ce3+ content during reaction. However, when changing again to the standard mixture, we again see a residual Ce3+ content of about 0.5%, which is on a similar level as in the previous phases on this catalyst (except for reaction in the CO-rich gas mixture). Obviously, the residual amount of deeper lying O-vacancies created during H400 pretreatment is still present. Interestingly, similar as after O400 pretreatment, the Ce3+ content shoots up when changing to the CO-rich mixture, and then decays again. This is very different from the behavior expected intuitively, namely an exponential increase of the Ce3+ concentration to a new steady-state value. We speculate that this behavior may be related to the simultaneous formation of carbonate species, but cannot provide a more detailed picture at present.
After the second H400 treatment the resulting Ce3+ content is even slightly higher than after the initial H400 pretreatment, but subsequent reaction in the standard mixture causes this to quickly return to the value of about 1.0%, which is similar to that observed after the first pretreatment.
In total, these results seem to indicate that upon reaction most of the O-vacancies in the surface region are replenished, independent of pretreatment (O400 or H400), and that only a small fraction of deeper lying O-vacancies and Ce3+ species are metastable on the time scale of these experiments at 80 °C, which had been generated during the reductive H400 pretreatment.
Finally, we performed a similar reaction sequence after another reductive pretreatment in 10% CO in N2 (CO400). The resulting CO2 formation rate and Ce3+ concentrations are displayed in Figure 6. These data differ significantly from the trends in Figure 4 and Figure 5. Here, the CO2 formation rate is close to zero after the CO400 pretreatment and increases steadily with time on stream. This general trend is qualitatively similar for the different reaction atmospheres. Even after almost 1000 min on stream in different reaction atmospheres the reaction has not yet reached steady-state conditions. At this point the CO2 formation rate in a standard gas mixture is only about 0.03 µmolCO2 s−1, which is much lower than the values obtained for the H400 (O400) pretreated catalysts of about 0.06 µmolCO2 s−1 (0.11 µmolCO2 s−1).
The observation of an initially almost inactive catalyst and subsequent slow activation resembles recent findings for CO oxidation on Au/TiO2 catalysts after a CO400 pretreatment, which was explained by a very low CO adsorption energy and hence a very low COad coverage on the negatively charged Au NPs in the initial reaction phase [49]. Only with increasing re-oxidation, i.e., upon increasing replenishment of the O-vacancies during reaction CO adsorption on the Au NPs and CO oxidation rate increased. For the Au/CeO2 catalysts, one may expect similar effects, i.e., an over-reduction of the Au/CeO2 catalyst by the CO400 pretreatment, which strongly reduces the activity of that catalyst. This does not fit, however, to the fact that the content of Ce3+ is lower after CO400 than after H400 pretreatment, and also not to the fact that the Ce3+ that the XANES detected Ce3+ concentration rapidly decays to a value of about 1%, which is unlikely to represent an over-reduction of the catalyst. In that case we tentatively assign the distinctly lower activity of the CO400 pretreated catalyst to a pronounced blocking of the catalyst surface by carbonate species formed during/after CO400 pretreatment. A high tendency for surface carbonate formation during CO400 pretreatment was indeed observed in [30]. In that case the slowly increasing activity would reflect a slow decomposition of the surface carbonates.
It should be noted that on a first view this slow activation seems to be in contrast to earlier experiments, where the CO reaction rate was found to decrease continuously, similar to that after O400 and the H400 pretreatments [30,35]. The apparent difference results, however, from the different CO concentrations in the pretreatment process, which was 2% in the earlier experiments published in [30], but 10% in the present experiments and also in those performed on an Au/TiO2 catalyst [49]. A test measurement performed after CO400 pretreatment in 2% CO in N2 confirmed our previous results (see Figure S2, Supporting Information). Thus, the CO concentration in the pretreatment gas mixture has a pronounced effect on the CO oxidation activity of the resulting catalyst; a lower concentration of CO (e.g., 2% CO in N2) in the pretreatment gas mixture results in a much higher CO2 formation at present pretreatment and reaction conditions. Arguing along the lines above this can be explained by a lower amount of site blocking surface species such as surface carbonates.
The slope of the activity vs. time curve and also the absolute value of the CO2 formation rate change little when switching to O2-rich reaction gas, while after returning to the standard reaction mixture the slope is somewhat lower than initially. Even at the end of the second reaction phase in the standard mixture, the CO2 formation rate reaches only about 0.024 µmolCO2 s−1, which is significantly less than that obtained for the H400 pretreated catalyst at this stage (~0.06 µmolCO2 s−1). Interestingly, for reaction in the CO-rich mixture we not only find a significantly higher CO2 formation rate, but also an increase with time on stream. The latter is opposite to the decrease in CO2 formation rate observed for the O400 and H400 pretreated catalysts. In contrast, the significant decrease in the Ce3+ concentration during time on stream in CO-rich gas mixture from 2.0% to 1.7%, similar, resembles the trend for the O400/H400 pretreated catalysts. One may speculate that in the present case the activation due to carbonate decomposition overcompensates the competing deactivation as observed for the other catalysts.
The second CO400 treatment leads again to a significant increase in the Ce3+ content, reaching 13.0%, which is significantly higher than after the first CO400 pretreatment procedure and comparable to that after H400 pretreatment. During subsequent reaction in a standard reaction mixture the CO2 formation rate is significantly higher than after the first CO400 pretreatment, where it was negligible, but still only about half of that obtained directly after H400 pretreatment. We assume that the higher Ce3+ content obtained after the second CO400 treatment is more typical and that the lower value obtained after the first CO400 period was still kinetically limited.
In total, these data indicate that the two reductive pretreatment procedures, H400 and CO400, result in very different catalysts, both in terms of their catalytic activity and their (de)activation behavior. The fraction of Ce3+ species in the whole reaction period (in the different reaction atmospheres) is approximately identical after CO400 and H400 pretreatments, therefore the distinctly lower initial activity of the CO400 pretreated catalyst cannot be explained over-reduction effects. Moreover, this value (Ce3+ concentration) is nearly constant in the standard reaction gas mixtures, while the reaction rate continuously increases with time on stream. The slow activation during time on stream is therefore mainly assigned to the decomposition of by-products formed during the CO400 pretreatment such as surface carbonate species.

2.3. Role of Ce3+ Species/O-Vacancies in the CO Oxidation Reaction

Finally, in Figure 7 we provide an overview on the Ce3+ concentrations in the different reaction gas mixtures for the three differently pretreated catalysts. For these values we took the average of the last 3–5 individual Ce3+ concentrations obtained for each gas mixture. The data illustrate the distinct differences in the Ce3+ concentration after the different pretreatment procedures, and the generally similar trends in the Ce3+ concentrations during reaction, independent of the initial pretreatment. This means that concentration of Ce3+ species and thus of O-vacancies in the surface region equilibrates rather quickly. Except for reaction in the CO-rich gas mixture, the activity of the catalysts closely follows this for the O400 and H400 pretreated catalysts, where the activities are rather stable with time on stream. This seems to indicate that the oxidation state of the ceria has a decisive influence on the reactivity of the Au/CeO2 catalyst. It should be kept in mind, however, that the differences in the CO2 formation rate can also be explained by differences in the coverage of adsorbed species (COad, reactive oxygen). Formally, the first explanation would be reflected by a change in the rate constant, while the latter would be represented by a change in reactant coverages. From the present data we cannot discriminate between these two possibilities.
The data furthermore demonstrate that, in good agreement with the previous Raman spectroscopy data [22,33,39], there are (at least) two different types of O-vacancies/Ce3+ species, one which is in the surface region and can easily be formed and replenished at 80 °C, and another one which is formed only at higher temperatures (400 °C) and cannot be replenished upon exposure to CO/O2 mixtures at 80 °C, at least not on the time scale of these experiments.
Overall, the data presented above and considering also results of previous in situ/operando XANES [24,30,35,46] and Raman studies [22,23,33,34,39,43] result in the following picture on the role of Ce3+ species/O-vacancies in the CO oxidation reaction on Au/CeO2 catalysts:
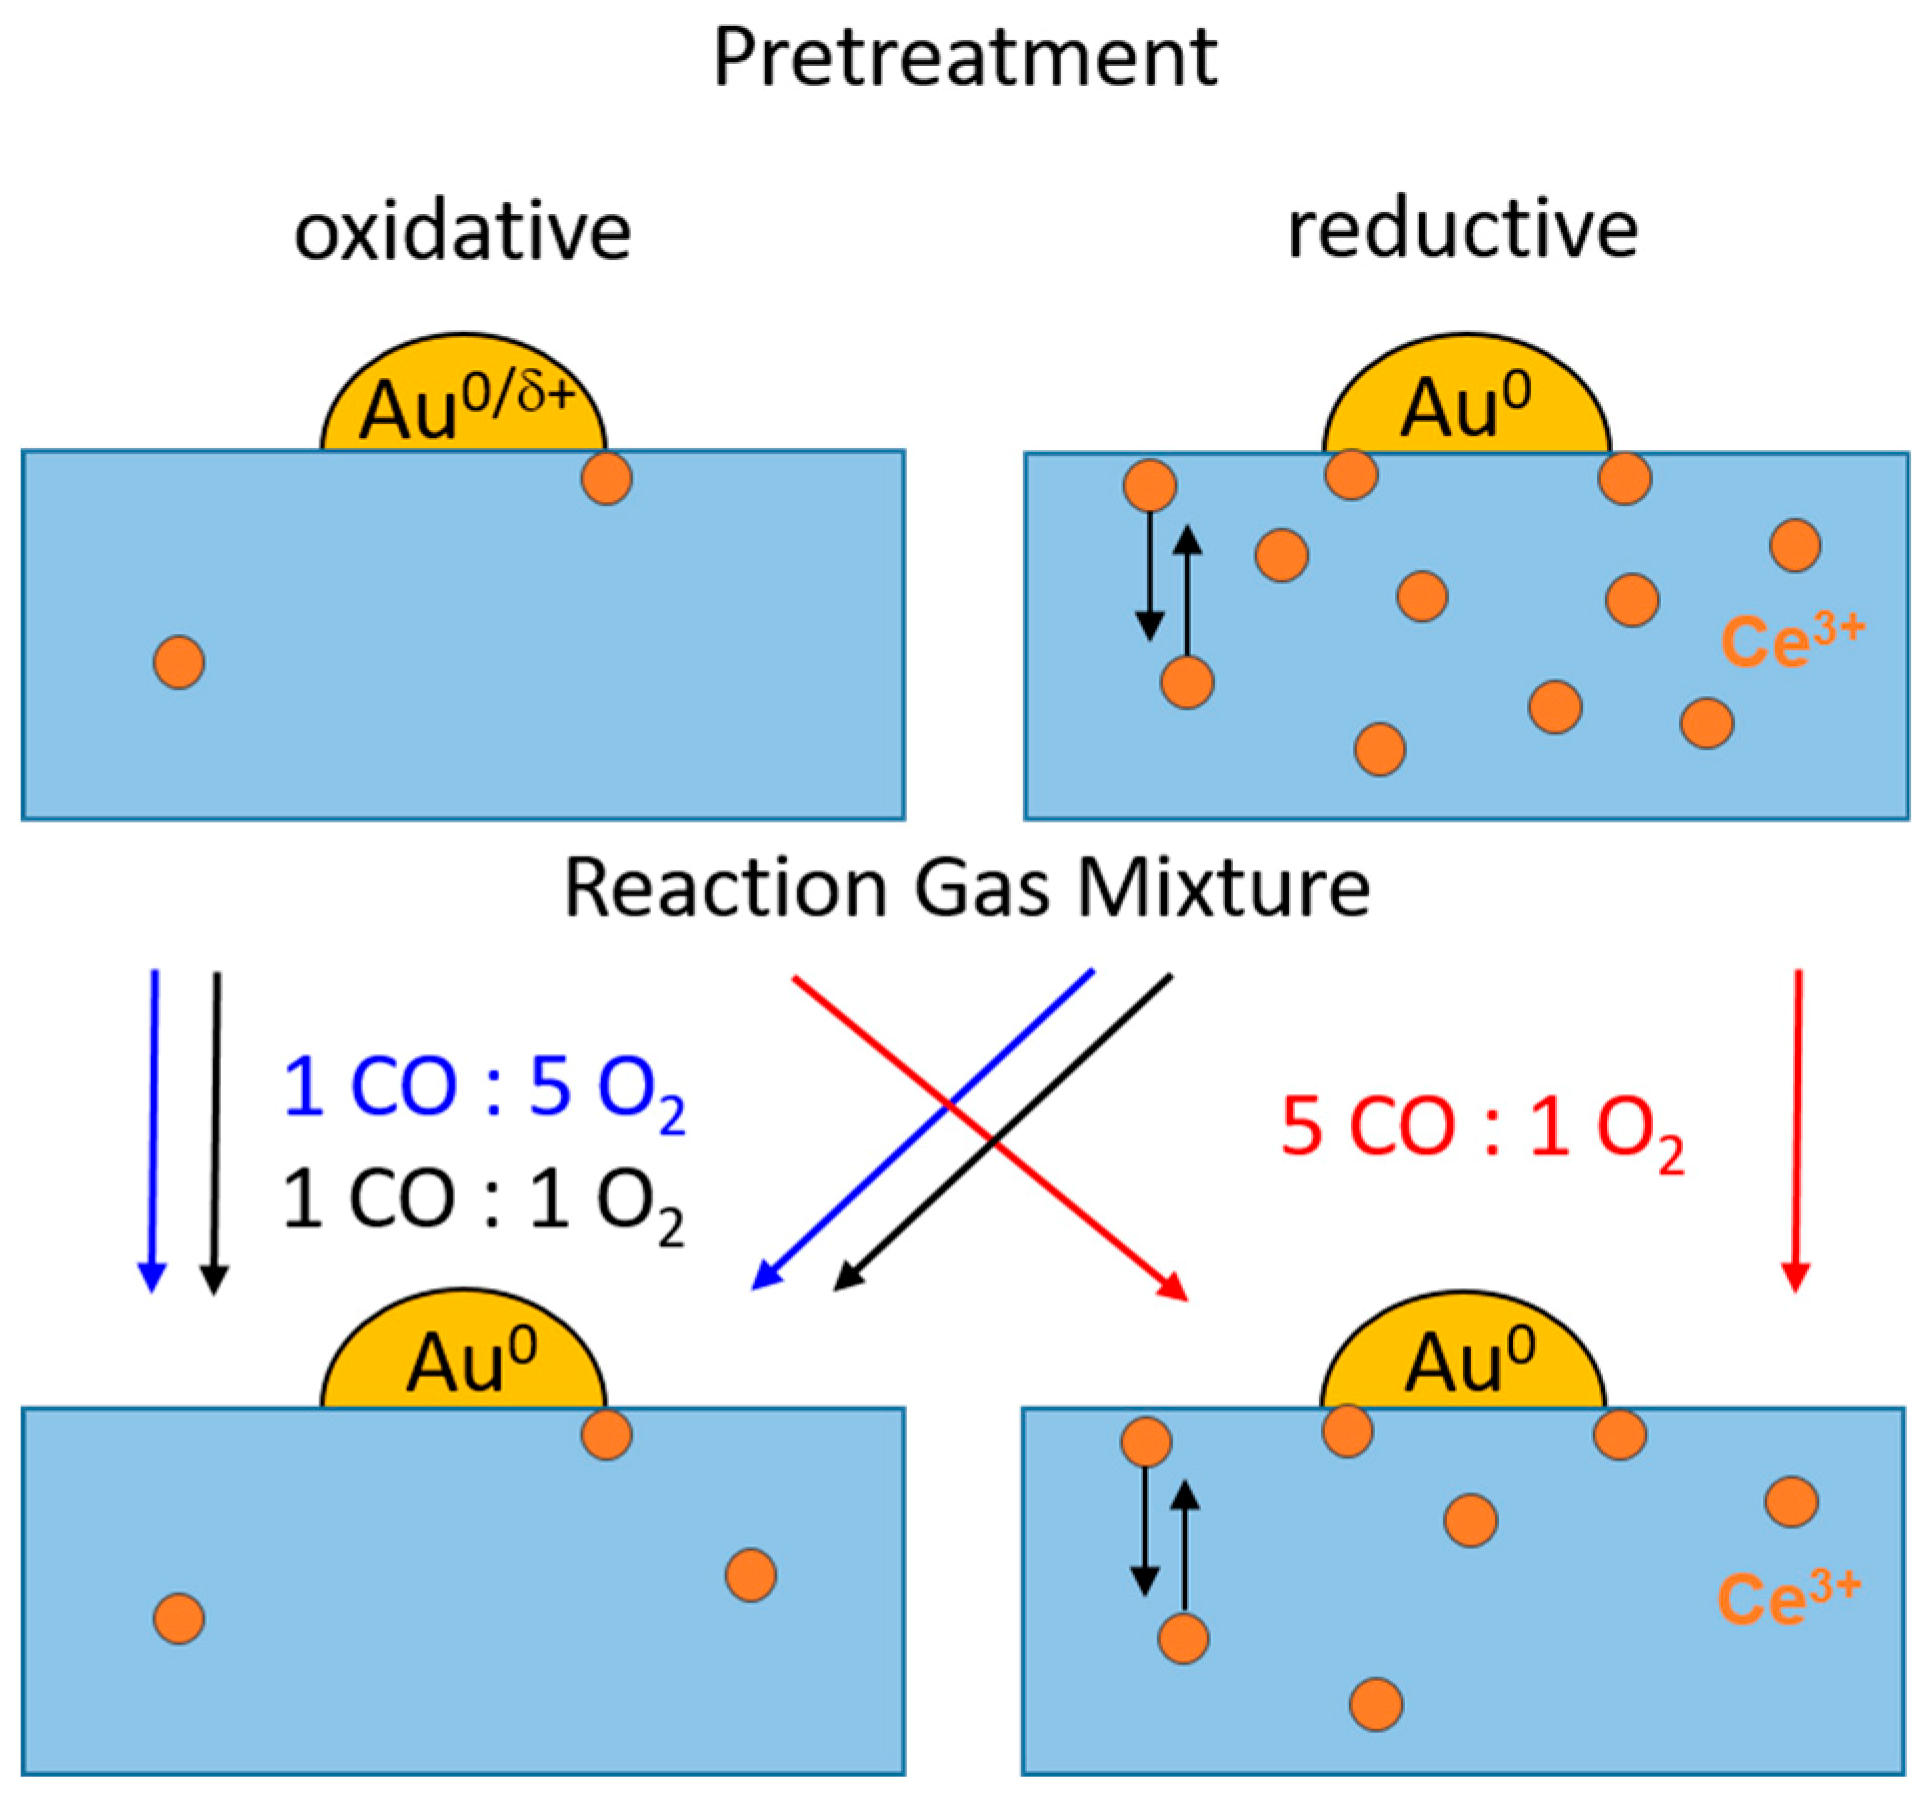
  • While oxidative O400 pretreatment results in a fully oxidized CeO2 support with negligible Ce3+ contents, reductive H400 or CO400 pretreatment leads to the significant formation of Ce3+ species, between 6% and 10% in the catalyst region accessible by XANES under present conditions, and hence formation of O-vacancies (cf. upper panel of Figure 8). At the same time, Au species are fully reduced after reductive pretreatment, while the formation of oxidic Au species was reported after oxidative O400 pretreatment [30,46];
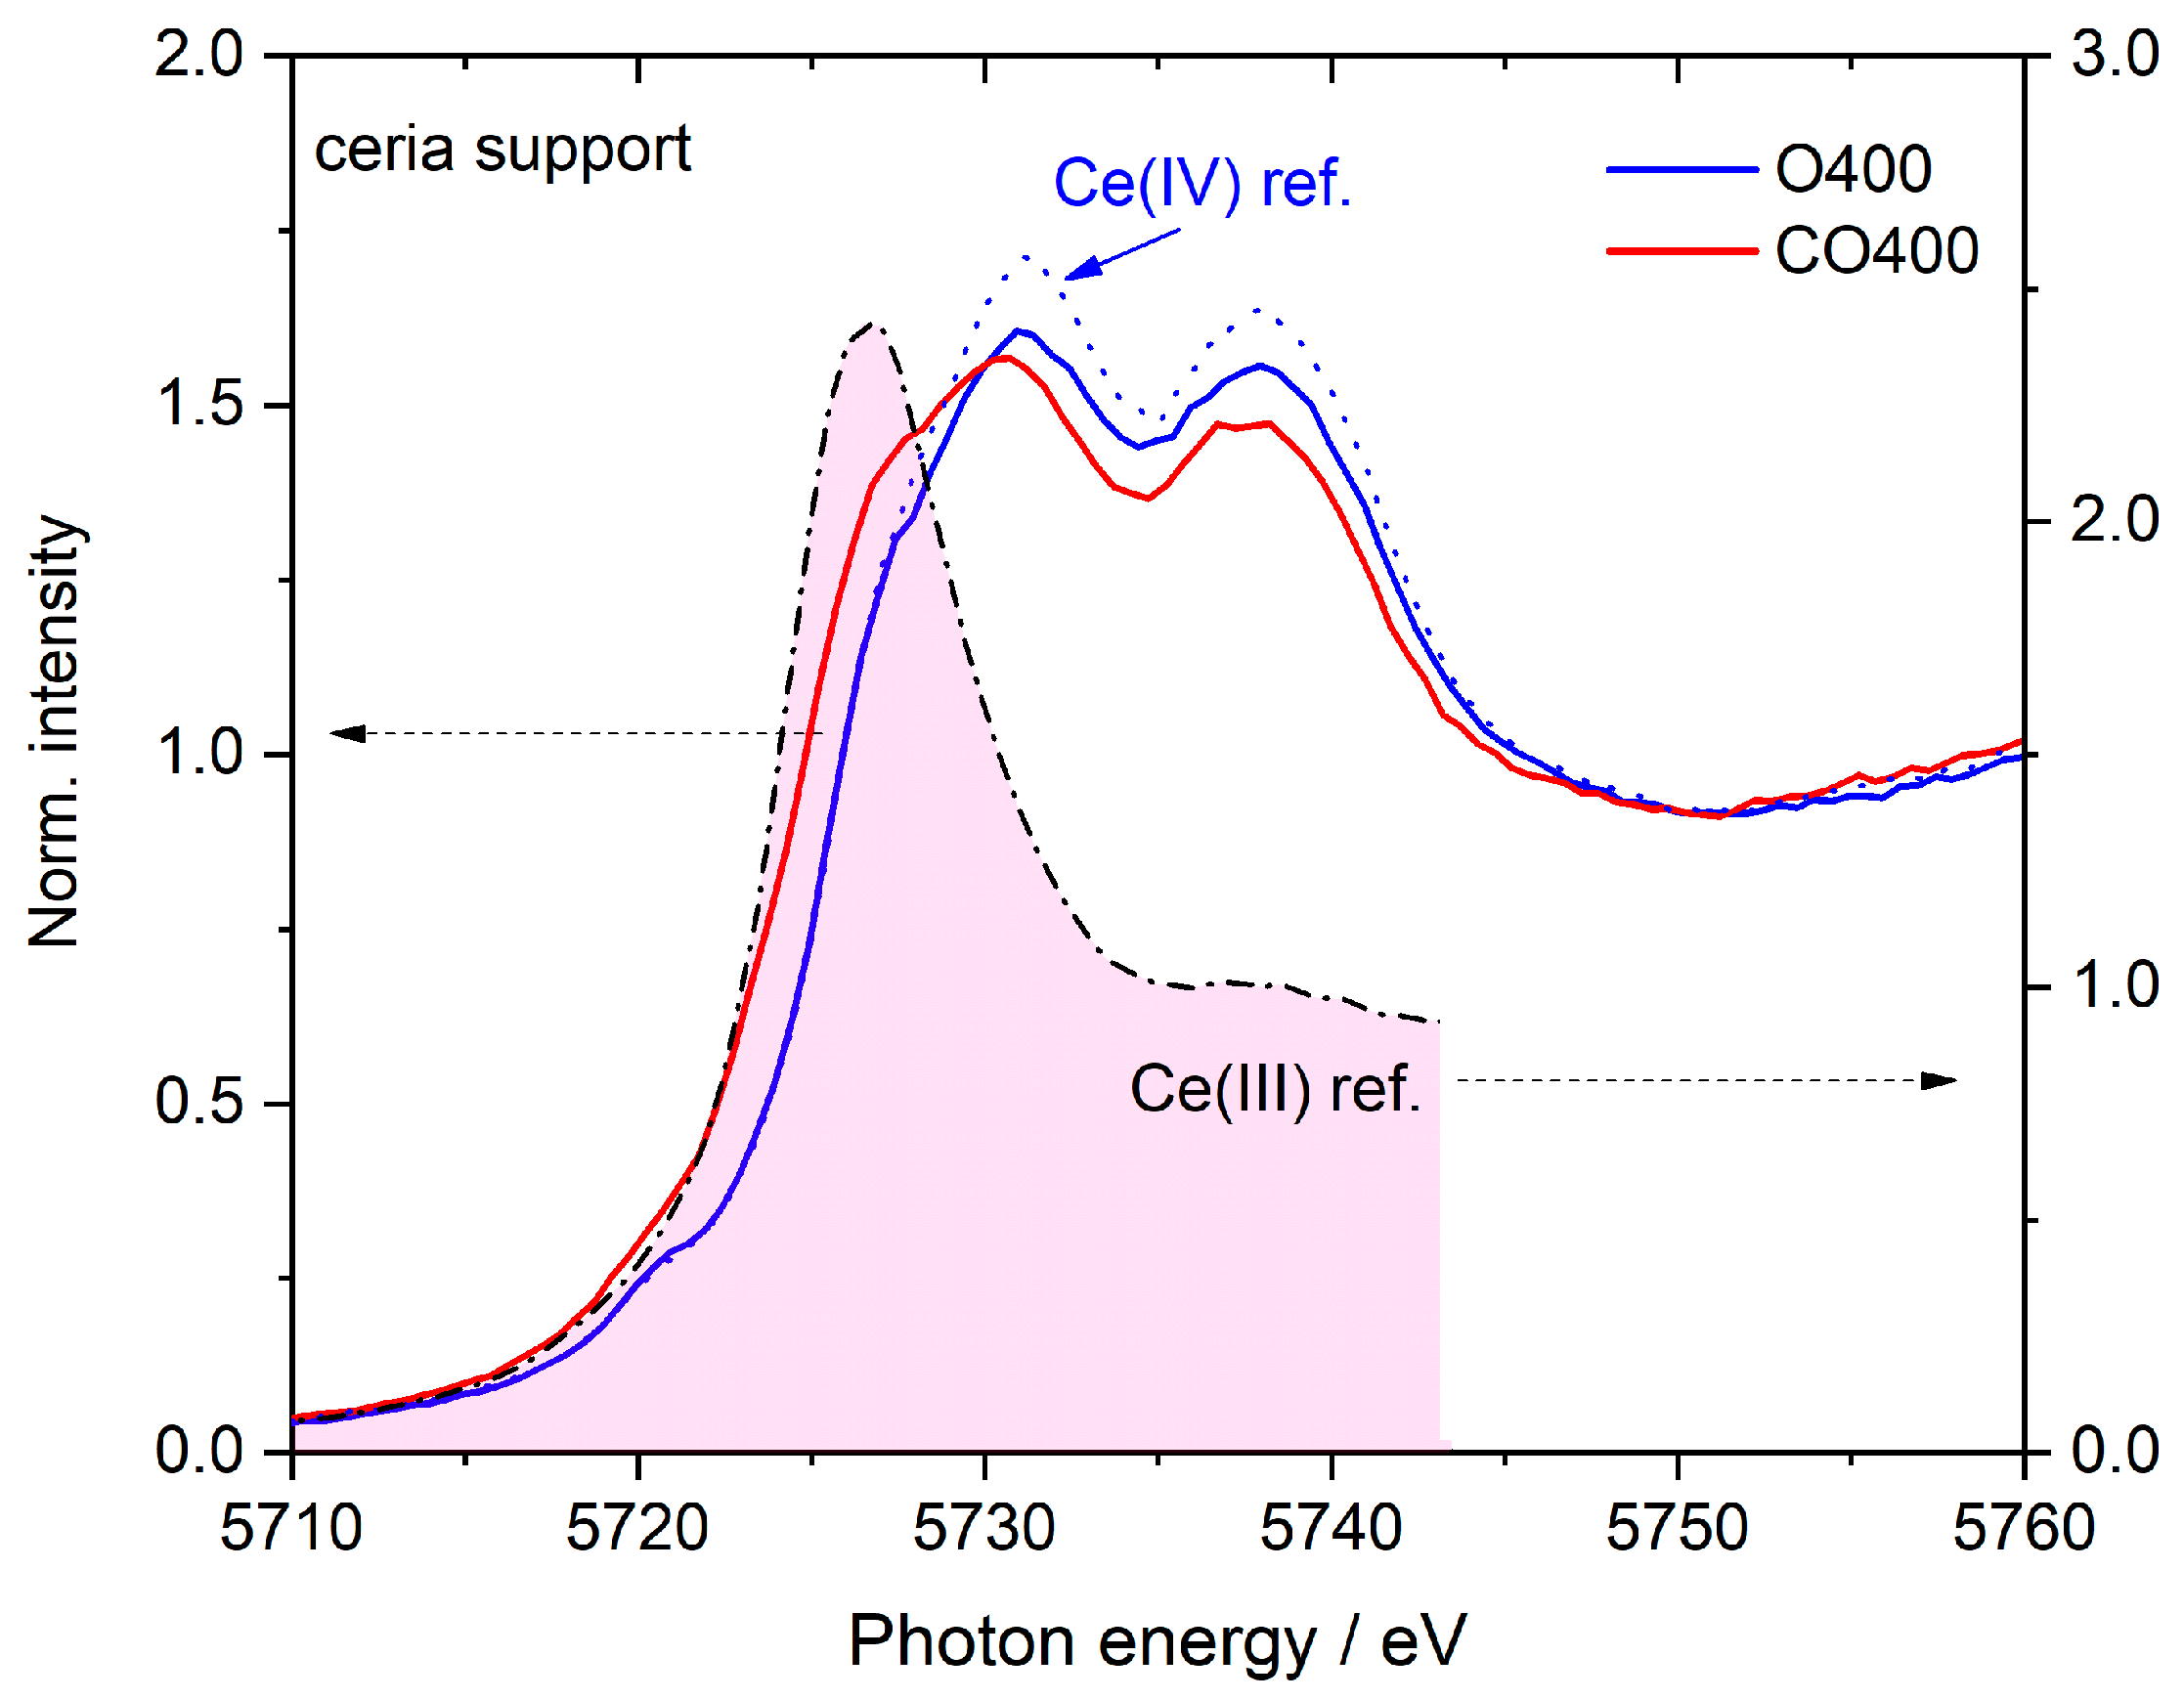
  • The concentration of Ce3+ species on the pure CeO2 support (without Au NPs) seems to be slightly higher than on the Au/CeO2 catalyst, with 1.7% and 17% Ce3+ species after O400 and CO400 treatment, respectively. The higher Ce3+ content compared to those obtained on the Au/CeO2 catalysts seems to contradict earlier claims that the presence of the Au NPs enhances the formation of O vacancies [19,27,48]. This apparent contradiction may arise from the rather high temperature of the reductive pretreatment, where ceria reduction is facile also without additional enhancement by Au NPs;
  • During the reaction in formally oxidative gas mixtures (standard gas mixture and O2-rich gas mixture), most of the Ce3+ species are rapidly re-oxidized. Due to the high mobility of O-vacancies, the bulk O-vacancies are essentially in equilibrium with those in the surface near region. In the O400 pretreated sample, this leads to complete removal of Ce3+ species/O-vacancies, while on the reductively pretreated samples a small fraction of Ce3+ species/O-vacancies (~0.5%) remains, which cannot be re-oxidized under present reaction conditions. They are attributed to deeper lying defects, which can be created during pretreatment at 400 °C, but are metastable during reaction at 80 °C due to the limited mobility of O-vacancy defects under these conditions. This agrees fully with findings from operando Raman studies, which also identified surface and bulk type defects and could discriminate between them [22,33,39,43];
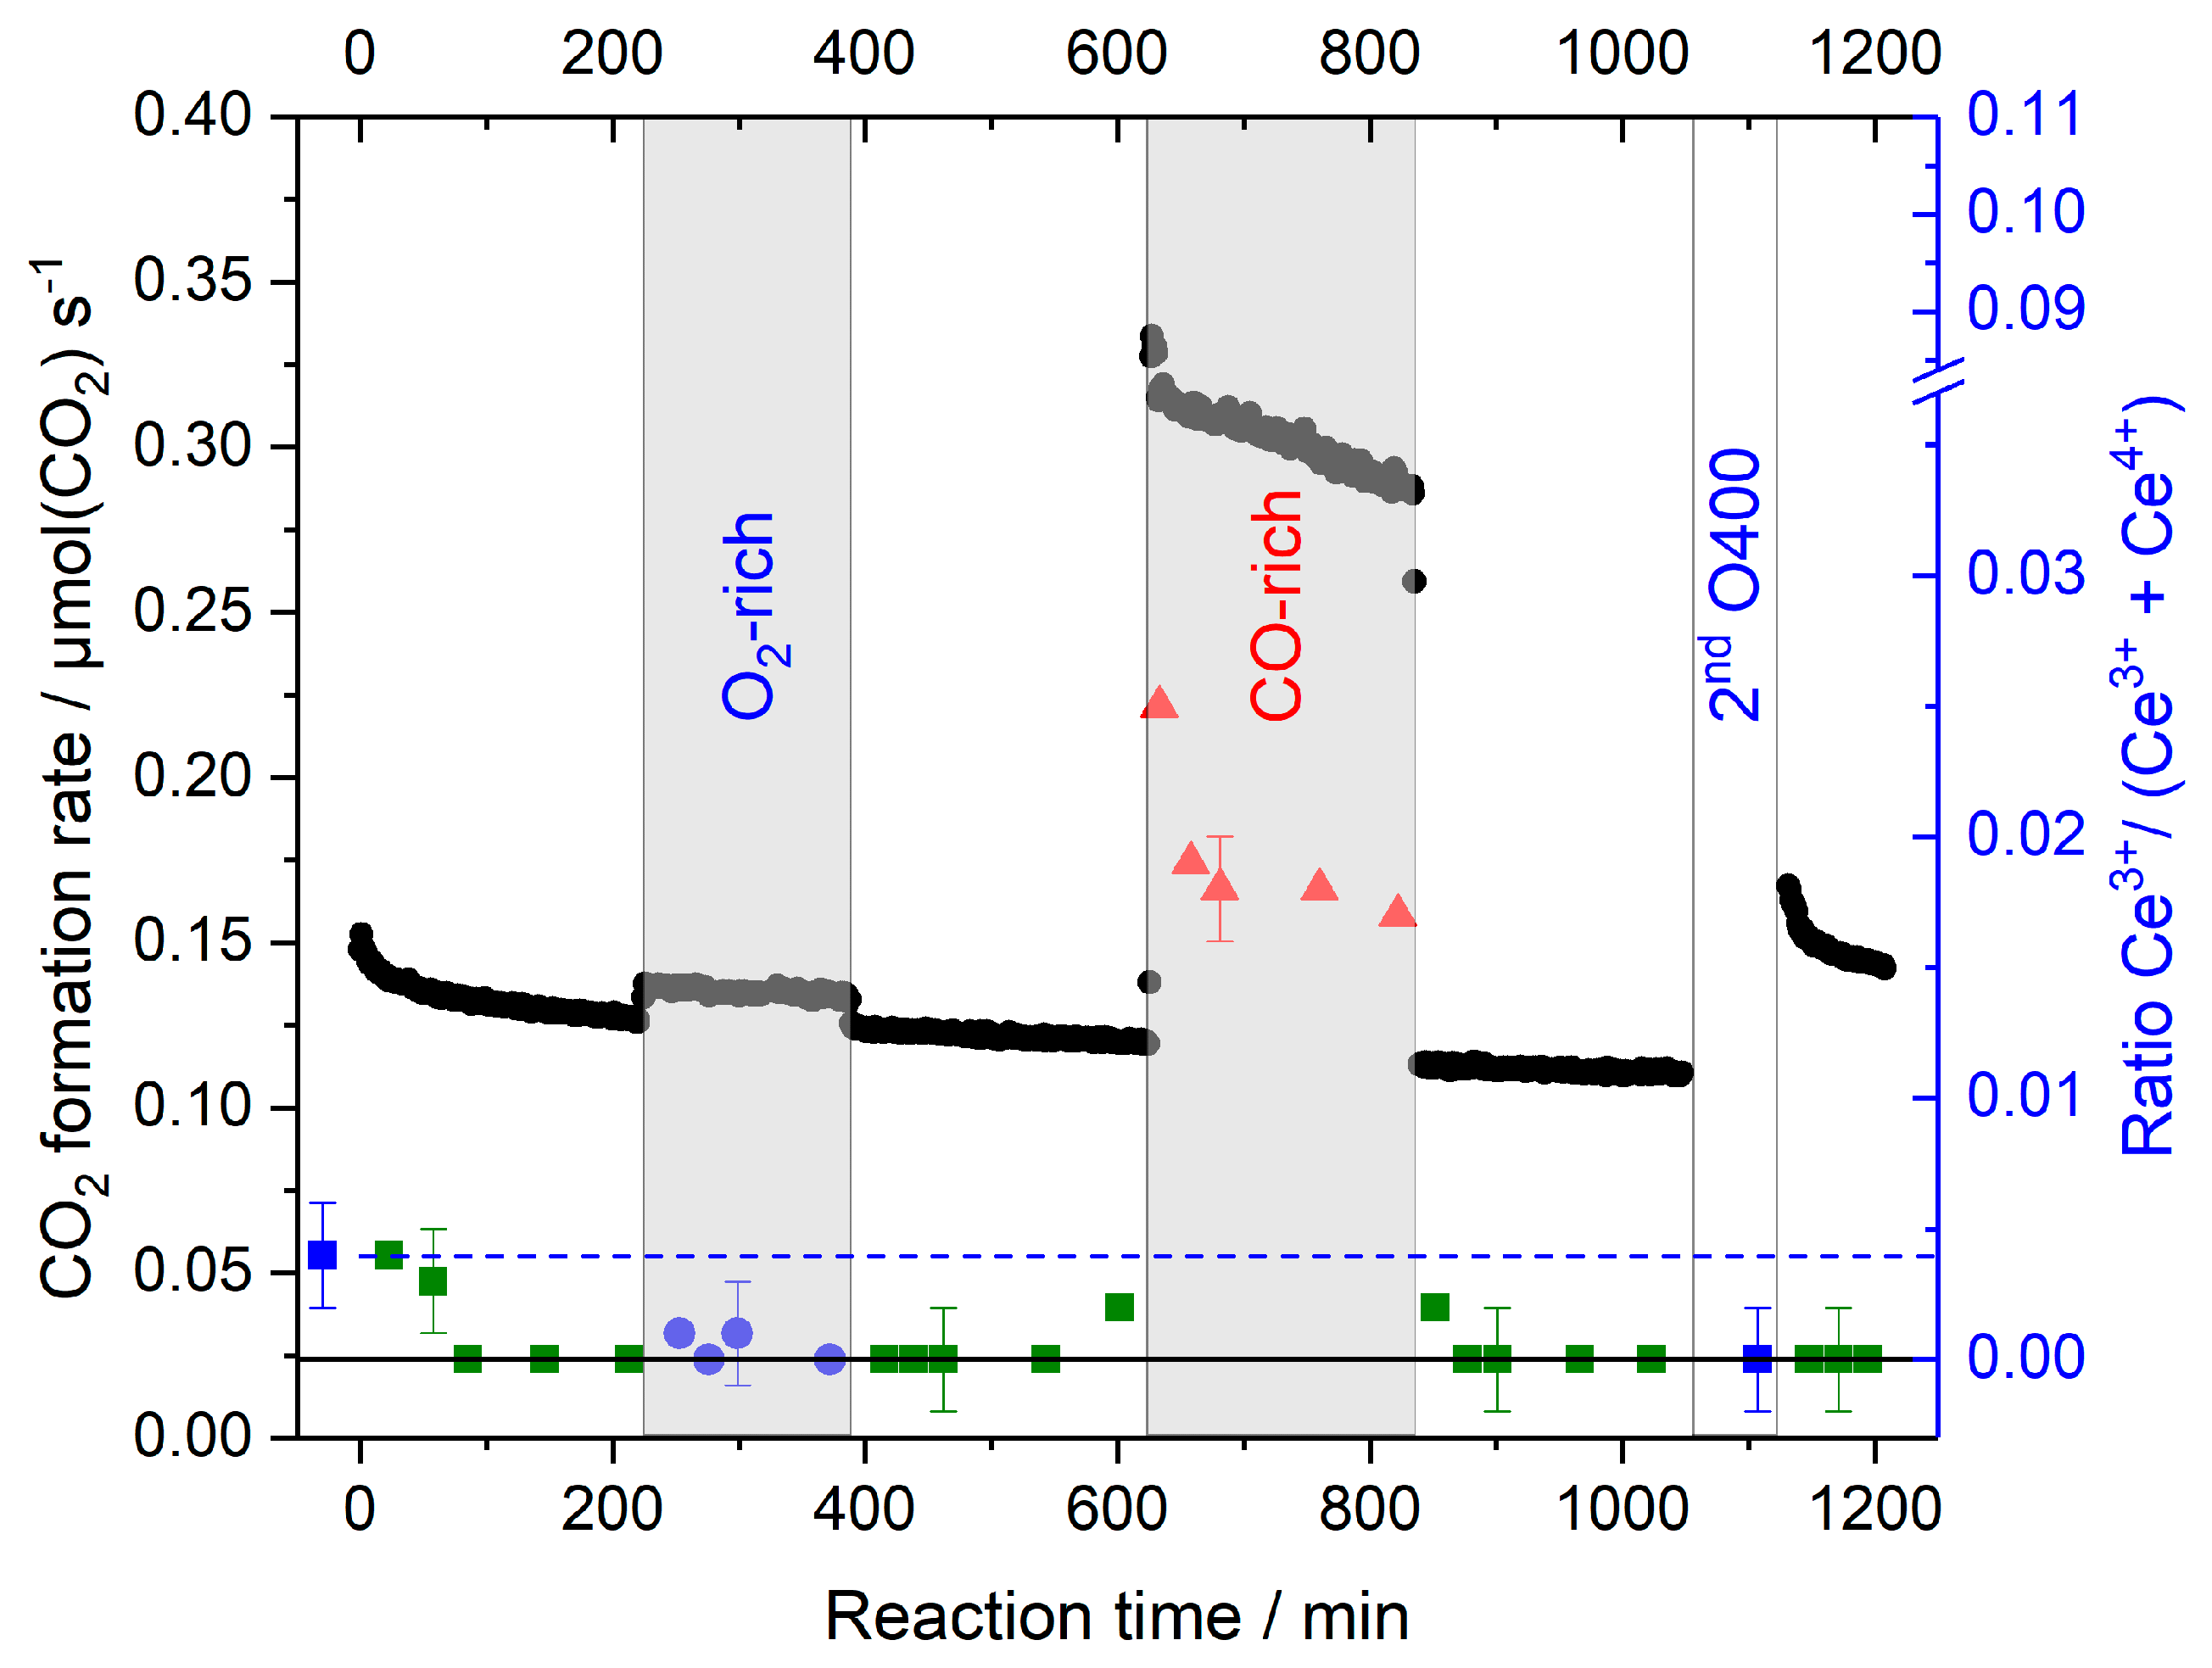
  • On the Au/CeO2 catalysts the steady-state concentration of Ce3+ species/O-vacancies in the surface region is determined by the reaction gas composition, it is negligible in the standard and O2-rich gas mixtures, and in the range of 1%–2% in the CO-rich mixture, independent of the pretreatment (cf. lower panel in Figure 8);
  • Based on the rapid re-oxidation of Ce3+ species/surface vacancies during reaction at 80 °C in oxidative gas mixtures and their stable concentration at longer reaction times we can exclude that the slow deactivation of the catalysts under these conditions is mainly related to an over-reduction of the catalyst support, in the sense that a reduced catalyst state is generated which is less active. Considering also previous reports this seems to be related to the slow build-up of site blocking surface species, mainly surface carbonates;
  • The build-up of such surface species during pretreatment in CO rather than over-reduction is also proposed as main reason for the very low initial activity of the CO400 pretreated sample and the very slow increase in activity during time on stream, considering that the concentration of Ce3+ species/O vacancies is similarly high after pretreatment in H2 (H400), where such effects were not observed, as in CO (CO400). This is supported also by the fact that the concentration of Ce3+ species/O vacancies decreases rapidly during the time on stream, while the increase in activity during the reaction is very slow. We attribute this to a slow, possibly oxygen-induced decomposition of site blocking surface species;
  • Considering that reduction/re-oxidation of the surface region is rather fast on the time scale of these measurements, it is not possible to decide from these measurements whether changes in the CO2 formation rate upon changing the composition of the reaction gas atmosphere are (mainly) caused by changes in the support oxidation state, leading to a modification of the rate constant, or by changes in the adsorbate coverages. This is mainly relevant when going to CO-rich gas mixtures with their higher CO2 formation rate, while increasing the O2 content has little effect on the CO2 formation rate.

3. Experimental

3.1. Catalyst Preparation and Characterization

The Au/CeO2 catalysts were prepared by a deposition–precipitation procedure described in detail earlier [26]. In brief, the supporting CeO2 material (HSA 15, Rhodia, calcined in air at 400 °C for 4 h) was dispersed in water at 60 °C, then an aqueous solution of the gold precursor (HAuCl4·3H2O, 99.5%, Merck) was added drop-wise, while adjusting the pH to ~6 by addition of 0.16 M Na2CO3 (Aldrich) solution. Then the as-prepared Au/CeO2 catalyst was filtered, washed three times with deionized water, and dried at room temperature (25 °C) overnight. Finally, the catalyst was collected and stored in a fridge to reduce ageing effects. This resulted in a Au loading of 4.5 wt.%, as determined by inductively coupled plasma atom emission spectroscopy (ICP-AES, Spectro ICP Modula S). The specific surface area of the catalyst of 188 m2·g−1 was determined via N2 adsorption measurements (Porotec Sorptomatic 1990 system). For the CO2 formation measurements, we used about 60 mg of the diluted catalyst powder, with the Au/CeO2 catalyst diluted with SiO2 at a ratio of 1:3. This resulted in a catalyst bed length of about 1 cm. Note that the SiO2 (calcined at 1200 °C for 24 h) is chemically and catalytically inert under present reaction conditions. Prior to the CO oxidation measurements, the diluted catalyst was pretreated in situ, either in an oxidative or in a reductive atmosphere. This involved first heating to 400 °C (10 K·min−1) in a flow of 20 Nml·min−1 N2, then the respective pretreatment gas mixture (O400: 10% O2/N2, H400: 10% H2/N2, or CO400: 10% CO/N2, 20 Nml·min−1) was introduced for 30 min at 400 °C. Finally, the catalyst was cooled down in 20 Nml·min−1 N2 to the reaction temperature (80 °C).

3.2. Operando Catalyst Characterization

Operando X-ray absorption spectroscopy (XAS) measurements were performed at the XAFS beamline of the electron storage ring Elettra in Trieste (Italy), using a Si(111) double crystal monochromatic; details regarding the beamline can be found in [50]. The cross sectional size of the beam was roughly 6 mm horizontally and 1 mm vertically. For the measurements, we used a home-made stainless-steel tube flow reactor with a cylindrical channel (i.d. 2 mm) along the axis of the tube. The catalyst was packed such that it results in a bed size of ca. 10 mm (length) × 2 mm × 2 mm, at 45° with respect to the detector. Under reaction conditions, the cell was closed on the top by a catalytically inactive Kapton window. Heating of the cell was achieved using resistive heating elements, which were placed in bore holes in the reactor body. This allowed homogeneous heating of the reactor. The XAS spectra at the Ce LIII-edge (5723 eV) were collected in fluorescence mode, using a Si drift diode detector (Ketek GmbH, AXAS-M, München, Germany). X-ray absorption spectra from cerium oxide references were collected both in transmission and fluorescence mode on standard compounds (cerium(IV) oxide (CeO2) as well as cerium(III) carbonate hydrate (Ce2(CO3)3 × H2O, both Alfa Aesar, Karlsruhe, Germany). While the reaction measurements were performed under operando conditions, this was not possible for the pure supports and Au/CeO2 catalysts during pretreatment. From experimental reasons, these measurements were carried out in a flow of N2 at 80 °C (30 Nml min−1, without further pretreatment) after annealing in the respective pretreatment gas mixtures.
For data evaluation, we used the free XAS data processing software Athena 0.9.26 [44], especially the Linear Combination Analysis (LCA) module for XANES spectra. This method, which involves a fit to the experimental data by summing over-weighted contributions of reference spectra of the different components, in the present case of Ce3+ and Ce4+, allows a straightforward analysis of the material as long as there are no additional types of that species involved.
Operando XAS measurements include a simultaneous analysis of the gas outlet from the XAS cell during CO oxidation. In the present case, the gas phase signals of CO and CO2 were monitored by a home-built analysis system consisting of a Bruker Alpha single-beam transmission IR-spectrometer (Ettlingen, Germany) and a substrate-integrated hollow waveguide (iHWG) device for signal enhancement [51]. In all measurements the signals of CO2 and CO were calibrated using standard test gas mixtures (1% CO, 1% O2, 0.5% CH4, balance N2) to quantify the CO conversion and CO2 formation. The calculated overall CO2 formation rates are based on the formation of CO2, where the detection is more sensitive than for CO (larger IR absorption cross-section for CO2). Note that because of the relative amounts of catalyst required for the spectroscopic measurements the resulting conversions were up to 80%, which is well above the limits of differential reaction conditions. Therefore, we could not calculate Au-mass normalized reaction rates.
For the CO oxidation measurements, we used three different gas mixtures, (i) a close-to-stoichiometric ‘standard’ reaction gas mixture (1% CO, 1% O2, and 98% N2), (ii) an O2-rich gas mixture (1% CO, 5% O2, and 94% N2), and (iii) a CO-rich gas mixture (5% CO, 1% O2, and 94% N2), respectively. All gas mixtures were prepared using mass flow controllers from Hastings (HFC-202) at a total flow rate of 60 Nml·min−1 using high-purity gases (CO 5.0, O2 5.0, N2 6.0, Westfalen AG).

4. Conclusions

Based on results of in situ/operando XANES measurements on the oxidation state of the CeO2 support (ratio of Ce3+ to Ce4+ species) after different oxidative and reductive pretreatment procedures and during reaction in different atmospheres, at 80 °C and 1 bar, we could derive a detailed, quantitative picture of the influence of the pretreatment procedure and the composition of the reaction gas mixture on the oxidation state of the Au/CeO2 catalyst support and its influence on the CO oxidation activity. Overall, the data indicate that under most reaction conditions Ce3+ species/O-vacancies in the surface region have little effect on the CO reaction, as they are rapidly re-oxidized by the reaction gas mixture. Only in strongly reducing CO-rich gas mixtures they are present under steady-state conditions in measurable amounts and may affect the reaction over longer times. Furthermore, the study illustrates the benefit of quantitative operando spectroscopy data for solving issues that have been debated controversially over long periods such as the role of catalyst over-reduction in this reaction.

Supplementary Materials

The following are available online at https://www.mdpi.com/2073-4344/9/10/785/s1, Figure S1: CO2 formation rate upon reaction gas exchange on an O400 pretreated (10% O2, balance N2) commercial 1 wt.% Au/CeO2 catalyst (Haruta Gold Inc.), Figure S2: CO2 formation rate after a CO400 pretreatment in 2% CO (balance N2) on a commercial 1wt.% Au/CeO2 catalyst in a standard reaction gas mixture: 1% CO, 1% O2, balance N2 at 80 °C, Figure S3: CO2 formation rate on a commercial 1 wt.% Au/CeO2 catalyst in different reaction gas atmospheres after a O400 pretreatment in 10% O2 (balance N2), Figure S4: CO2 formation rate after an O400 pretreatment in 10% O2 (balance N2) on a commercial 1wt.% Au/CeO2 catalyst in different reaction gas atmospheres at 80 °C, Figure S5: CO2 formation rate after a CO400 pretreatment in 10% CO (balance N2) on a commercial 1 wt.% Au/CeO2 catalyst in different reaction gas atmospheres at 80 °C, Table S1: Relative content of Ce3+ species on a commercial 1 wt.% Au/CeO2 catalyst after oxidative (O400) and reductive (CO400) pretreatment and during subsequent reaction in different reaction gas mixtures at 80 °C.

Author Contributions

Conceptualization, J.B., A.M.A.-M., and R.J.B.; methodology, J.B., A.M.A.-M., and R.J.B.; investigation, J.B., A.M.A.-M., S.C., T.H., G.K., Y.W, and C.F.; formal analysis, J.B., A.M.A.-M., S.C., and C.F.; validation, J.B., A.M.A.-M., S.C., and R.J.B.; writing—original draft preparation, J.B.; writing—review and editing, J.B., A.M.A.-M., S.C., and R.J.B; visualization, J.B. and S.C.; supervision, R.J.B.; project administration, R.J.B.

Funding

This research received no external funding except travel support by European Union / Elettra via the CALIPSO program (see acknowledgements).

Acknowledgments

GK gratefully acknowledges support by a fellowship from the Brigitte Schlieben-Lange program of the State of Baden-Württemberg. AMA, JB, and GK furthermore acknowledge financial support by Elettra (Trieste, Italy), the European CALIPSO program as well as the support by Luca Olivi (XAFS beamline, Elettra).

Conflicts of Interest

The authors declare no conflict of interest.

References

  1. Hutchings, G.J.; Joffe, R. A Novel Process for the Co-Synthesis of Vinyl Chloride Monomer and Sodium Carbonate Using a Gold Catalyst. Appl. Catal. 1986, 20, 215–218. [Google Scholar] [CrossRef]
  2. Haruta, M.; Kobayashi, T.; Sano, H.; Yamada, N. Novel Gold Catalysts for the Oxidation of Carbon Monoxide. Chem. Lett. 1987, 16, 405–408. [Google Scholar] [CrossRef]
  3. Bond, G.C.; Thompson, D.T. Catalysis by Gold. Catal. Rev. Sci. Eng. 1999, 41, 319–388. [Google Scholar] [CrossRef]
  4. Schubert, M.M.; Hackenberg, S.; van Veen, A.C.; Muhler, M.; Plzak, V.; Behm, R.J. CO Oxidation over Supported Gold Catalysts—“Inert” and “Active” Support Materials and their Role for the Oxygen Supply during Reaction. J. Catal. 2001, 197, 113–122. [Google Scholar] [CrossRef]
  5. Ab Rahim, M.H.; Forde, M.M.; Hammond, C.; Jenkins, R.L.; Dimitratos, N.; Lopez-Sanchez, J.A.; Carley, A.F.; Taylor, S.H.; Willock, D.J.; Hutchings, G.J. Systematic Study of the Oxidation of Methane Using Supported Gold Palladium Nanoparticles Under Mild Aqueous Conditions. Top. Catal. 2013, 56, 1843–1857. [Google Scholar] [CrossRef]
  6. Burch, R. Gold Catalysts for Pure Hydrogen Production in the Water–Gas Shift Reaction: Activity, Structure and Reaction Mechanism. Phys. Chem. Chem. Phys. 2006, 8, 5483–5500. [Google Scholar] [CrossRef]
  7. Flytzani-Stephanopoulos, M. Gold Atoms Stabilized on Various Supports Catalyze the Water-Gas Shift Reaction. Acc. Chem. Res. 2014, 47, 783–792. [Google Scholar] [CrossRef] [PubMed]
  8. Enache, D.I.; Edwards, J.K.; Landon, P.; Solsona-Espriu, B.; Carley, A.F.; Herzing, A.A.; Watanabe, M.; Kiely, C.; Knight, D.W.; Hutchings, G.J. Solvent-Free Oxidation of Primary Alcohols to Aldehydes Using Au-Pd/TiO2 Catalysts. Science 2011, 311, 362–365. [Google Scholar] [CrossRef]
  9. Min, B.K.; Friend, C.M. Heterogeneous Gold-Based Catalysis for Green Chemistry: Low-Temperature CO Oxidation and Propene Oxidation. Chem. Rev. 2007, 107, 2709–2724. [Google Scholar] [CrossRef]
  10. Chen, S.; Zhang, B.; Su, D.; Huang, W. Titania Morphology-Dependent Gold-Titania Interaction, Structure, and Catalytic Performance of Gold/Titania Catalysts. ChemCatChem 2015, 7, 3290–3298. [Google Scholar] [CrossRef]
  11. Sakurai, H.; Haruta, M. Carbon Dioxide and Carbon Monoxide Hydrogenation Over Gold Supported on Titanium, Iron and Zinc Oxides. Appl. Catal. A 1995, 127, 93–105. [Google Scholar] [CrossRef]
  12. Sakurai, H.; Haruta, M. Synergism in Methanol Synthesis from Carbon Dioxide over Gold Catalysts Supported on Metal Oxides. Catal. Today 1996, 29, 361–365. [Google Scholar] [CrossRef]
  13. Hartadi, Y.; Widmann, D.; Behm, R.J. CO2 Hydrogenation to Methanol on Supported Au Catalysts under Moderate Reaction Conditions: Support and Particle Size Effects. ChemSusChem 2015, 8, 456–465. [Google Scholar] [CrossRef]
  14. Abdel-Mageed, A.M.; Klyushin, A.Y.; Knop-Gericke, A.; Schlögl, R.; Behm, R.J. Negative Charging of Au Nanoparticles during Methanol Synthesis from CO2/H2 on a Au/ZnO Catalyst: Insights from Operando Infrared and Near-ambient Pressure XPS and XAS. Angew. Chem. Int. Ed. 2018, 58, 10325–10329. [Google Scholar] [CrossRef]
  15. Trovarelli, A. Catalytic Properties of Ceria and CeO2-Containing Materials. Catal. Rev. Sci. Eng. 1996, 38, 439–520. [Google Scholar] [CrossRef]
  16. Dutta, P.; Pal, S.; Seehra, M.S.; Shi, Y.; Eyring, E.M.; Ernst, R.D. Concentration of Ce3+ and Oxygen Vacancies in Cerium Oxide Nanoparticles. Chem. Mater. 2006, 18, 5144–5146. [Google Scholar] [CrossRef]
  17. Zhang, C.; Michaelides, A.; King, D.A.; Jenkins, S.J. Oxygen Vacancy Clusters on Ceria: Decisive Role of Cerium f Electrons. Phys. Rev. B 2009, 79, 075433. [Google Scholar] [CrossRef]
  18. Mullins, D.R. The Surface Chemistry of Cerium Oxide. Surf. Sci. Rep. 2015, 70, 42–85. [Google Scholar] [CrossRef]
  19. Tabakova, T.; Boccuzzi, F.; Manzoli, M.; Andreeva, D. FTIR Study of Low-Temperature Water-Gas Shift Reaction on Gold/Ceria Catalyst. Appl. Catal. A 2003, 252, 385–397. [Google Scholar] [CrossRef]
  20. Wang, L.C.; Tahvildar Khazaneh, M.; Widmann, D.; Behm, R.J. Dynamic TAP Reactor Studies of the Oxidizing Capability of CO2 on a Au/CeO2 Catalyst—A First Step Toward Identifying a Redox Mechanism in the Reverse Water-Gas Shift Reaction. J. Catal. 2013, 302, 20–30. [Google Scholar] [CrossRef]
  21. Wang, F.; Li, C.; Zhang, X.; Wei, M.; Evans, D.G.; Duan, X. Catalytic Behavior of Supported Ru Nanoparticles on the {100},{110}, and {111} Facet of CeO2. J. Catal. 2015, 329, 177–186. [Google Scholar] [CrossRef]
  22. Vindigni, F.; Manzoli, M.; Damin, A.; Tabakova, T.; Zecchina, A. Surface and Inner Defects in Au/CeO2 WGS Catalysts: Relation between Raman Properties, Reactivity and Morphology. Chem. Eur. J. 2011, 17, 4356–4361. [Google Scholar] [CrossRef]
  23. Schilling, C.; Hess, C. Elucidating the Role of Support Oxygen in the Water-Gas Shift Reaction over Ceria-Supported Gold Catalysts Using Operando Spectroscopy. ACS Catal. 2019, 9, 1159–1171. [Google Scholar] [CrossRef]
  24. Abdel-Mageed, A.M.; Kucèrová, G.; Bansmann, J.; Behm, R.J. Active Au Species During the Low-Temperature Water Gas Shift Reaction on Au/CeO2: A Time Resolved Operando XAS and DRIFTS Study. ACS Catal. 2017, 17, 6471–6484. [Google Scholar] [CrossRef]
  25. Liu, W.; Flytzani-Stephanopoulos, M. Total Oxidation of Carbon Monoxide and Methane over Transition Metal-Fluorite Oxide Composite Catalysis. II. Catalyst Characterization and Reaction Kinetics. J. Catal. 1995, 153, 317–332. [Google Scholar] [CrossRef]
  26. Plzak, V.; Garche, J.; Behm, R.J. Au/MeOx Catalysts in Gas Processing for PEM Fuel Cells: An Overview of the Results at ZSW-Uni Ulm—Part 2: Low Temperature PROX Yeaction over New Highly Active Au/TiO2 and Au/CeO2 Catalysts. Eur. Fuel Cell News 2003, 10, 16–20. [Google Scholar]
  27. Widmann, D.; Leppelt, R.; Behm, R.J. Activation of Au/CeO2 Catalyst for the CO Oxidation Reaction by Surface Oxygen Removal/Oxygen Vacancy Formation. J. Catal. 2007, 251, 437–442. [Google Scholar] [CrossRef]
  28. Camellone, M.F.; Fabris, S. Reaction Mechanisms for the CO Oxidation on Au/CeO2 Catalysts: Activity of Substitutional Au3+/Au+ Cations and Deactivation of Supported Au+ Adatoms. J. Am. Chem. Soc. 2009, 131, 10473–10483. [Google Scholar] [CrossRef]
  29. Zhang, R.-R.; Ren, L.-H.; Lu, A.-H.; Li, W.-C. Influence of Pretreatment Atmospheres on the Activity of Au/CeO2 Catalyst for Low-Temperature CO Oxidation. Catal. Commun. 2011, 13, 18–21. [Google Scholar] [CrossRef]
  30. Abd El-Moemen, A.; Abdel-Mageed, A.M.; Bansmann, J.; Parlinska-Wojtan, M.; Behm, R.J.; Kucèrová, G. Deactivation of Au/CeO2 Catalysts in the CO Oxidation Reaction: Influence of Pretreatment and Reaction Conditions. J. Catal. 2016, 341, 160–179. [Google Scholar] [CrossRef]
  31. Longo, A.; Liotta, L.F.; Pantaleo, G.; Giannici, F.; Venezia, A.M.; Martorana, A. Structure of the Metal-Support Interface and Oxidation State of Gold Nanoparticles Supported on Ceria. J. Phys. Chem. C 2012, 116, 2960–2966. [Google Scholar] [CrossRef]
  32. Wang, Y.-G.; Mei, D.; Glezakou, V.A.; Li, J.; Rousseau, R. Dynamic Formation of Single-atom Catalytic Active sites on Ceria-supported Gold Nanoparticles. Nat. Commun. 2015, 6, 1–7. [Google Scholar] [CrossRef]
  33. Schilling, C.; Hess, C. Real-Time Observation of the Defect Dynamics in Working Au/CeO2 Catalysts by Combined Operando Raman/UV-Vis Spectroscopy. J. Phys. Chem. C 2018, 122, 2909–2917. [Google Scholar] [CrossRef]
  34. Guzman, J.; Carrettin, S.; Corma, A. Spectroscopic Evidence for the Supply of Reactive Oxygen during CO Oxidation Catalyzed by Gold Supported on Nanocrystalline CeO2. J. Am. Chem. Soc. 2005, 127, 3286–3287. [Google Scholar] [CrossRef]
  35. Abdel-Mageed, A.M.; Kucèrová, G.; Abd El-Moemen, A.; Bansmann, J.; Widmann, D.; Behm, R.J. Geometric and Electronic Structure of Au on Au/CeO2 Catalysts During the CO Oxidation: Deactivation by Reaction Induced Particle Growth. J. Phys. Conf. Ser. 2015, 712, 012044. [Google Scholar] [CrossRef]
  36. Romero-Sarria, F.; Martínez, T.; Centeno, M.A.; Odriozola, J.A. Surface Dynamics of Au/CeO2 Catalysts during CO Oxidation. J. Phys. Chem. C 2007, 111, 14469–14475. [Google Scholar] [CrossRef]
  37. Chen, S.; Luo, L.; Jiang, Z.; Huang, W. Size-Dependent Reaction Pathways of Low-Temperature CO Oxidation on Au/CeO2 Catalysts. ACS Catal. 2015, 5, 1653–1662. [Google Scholar] [CrossRef]
  38. Sun, Y.; Liu, W.; Tian, M.; Wang, L.; Wang, Z. A Rational Design of the Sintering-Resistant Au-CeO2 Nanoparticles Catalysts for CO Oxidation: The Influence of H2 Pretreatments. Materials 2018, 11, 1952. [Google Scholar] [CrossRef]
  39. Schilling, C.; Hess, C. CO Oxidation on Ceria Supported Gold Catalysts Studied by Combined Operando Raman/UV-Vis and IR Spectroscopy. Top. Catal. 2017, 60, 131–140. [Google Scholar] [CrossRef]
  40. Hernández, J.A.; Gómez, S.A.; Zepeda, T.A.; Fierro-González, J.C.; Fuentes, G.A. Insight into the Deactivation of Au/CeO2 Catalysts Studied by In Situ Spectroscopy during the CO-PROX Reaction. ACS Catal. 2015, 5, 4003–4012. [Google Scholar] [CrossRef]
  41. Zhang, F.; Wang, P.; Koberstein, J.; Khalid, S.; Chan, S.-W. Cerium Oxidation State in Ceria Nanoparticles Studied with X-ray Photoelecton Spectroscopy and Absorption Near Edge Spectroscopy. Surf. Sci. 2004, 563, 74–82. [Google Scholar] [CrossRef]
  42. McBride, J.R.; Hass, K.C.; Poindexter, B.D.; Weber, W.H. Raman and X-ray Studies of Ce1-xRexO2-y, where RE=La, Pr, Nd, Eu, Gd, and Tb. J. Appl. Phys. 1994, 76, 2435–2441. [Google Scholar] [CrossRef]
  43. Lee, Y.; He, G.; Akey, A.J.; Si, R.; Flytzani-Stephanopoulos, M.; Herman, I.P. Raman Analysis of Mode Softening in Nanoparticle CeO2-d and Au-CeO2-d during CO Oxidation. J. Am. Chem. Soc. 2011, 133, 12952–12955. [Google Scholar] [CrossRef]
  44. Ravel, B.; Newville, M. ATHENA, ARTEMIS, HEPHAESTUS: Data Analysis for X-ray Absorption Spectroscopy using IFEFFIT. J. Synchrotron Rad. 2005, 12, 537–541. [Google Scholar] [CrossRef]
  45. Yoshida, H.; Yuliati, L.; Hamajima, T.; Hattori, T. Valence of Highly Dispersed Cerium Oxide Species on Silica Quantitatively Estimated by Ce LIII-edge XANES. Mater. Transact. 2004, 45, 2062–2067. [Google Scholar] [CrossRef]
  46. Bansmann, J.; Kucèrová, G.; Abdel-Mageed, A.M.; Abd El-Moemen, A.; Behm, R.J. Influence of Re-Activation and Ongoing CO Oxidation Reaction on the Chemical and Electronic Properties of Au on a Au/CeO2 Catalyst: A XANES Study at the Au LIII edge. J. Electron Spectrosc. Relat. Phenom. 2017, 220, 86–90. [Google Scholar] [CrossRef]
  47. Widmann, D.; Liu, Y.; Schüth, F.; Behm, R.J. Support Effects in the Au Catalyzed CO Oxidation—Correlation Between Activity, Oxygen Storage capacity and Support Reducibility. J. Catal. 2010, 276, 292–305. [Google Scholar] [CrossRef]
  48. Widmann, D.; Behm, R.J. Activation of Molecular Oxygen and the Nature of theActive Oxygen Species for CO Oxidation on Oxide Supported Au Catalysts. Acc. Chem. Res. 2014, 47, 740–749. [Google Scholar] [CrossRef]
  49. Wang, Y.; Widmann, D.; Behm, R.J. Influence of TiO2 Bulk Defects on CO Adsorption and CO Oxidation on Au/TiO2: Electronic Metal-Support Interactions (EMSIs) in Supported Au Catalysts. ACS Catal. 2017, 7, 2339–2345. [Google Scholar] [CrossRef]
  50. Di Cicco, A.; Aquilanti, G.; Minicucci, M.; Principi, E.; Novello, N.; Cognigni, A.; Olivi, L. Novel XAFS Capabilities at ELETTRA Synchrotron Light Source. J. Phys. Conf. Ser. 2009, 190, 012043. [Google Scholar] [CrossRef]
  51. Kokoric, V.; Widmann, D.; Wittmann, M.; Behm, R.J.; Mizaikoff, B. Infrared Spectroscopy via Substrate-Integrated Hollow Waveguides: A Powerful Tool in Catalysis Research. Analyst 2016, 141, 5990–5995. [Google Scholar] [CrossRef] [PubMed]
Figure 1. X-ray absorption spectroscopy (XAS) measurements in the near edge region (XANES) spectra recorded at the Ce LIII edge (measured at 80 °C in N2): (a) of the Ce (III) reference (Ce2(CO3)3 × H2O, red line); (b) of the Ce(IV) reference (CeO2) (blue line) and reference data published by Ravel and co-workers (orange lines) [44]. The dashed curves represent the main individual components of Ce as published by Yoshida et al. [45], the solid black lines denote a fit based on these components to our data. For an acceptable agreement with our Ce(IV) reference (blue) the component marked in red, which represents the white line in Ce (III), had to be increased in intensity compared to the fit to Ce(IV) data published by Yoshida (black).
Catalysts 09 00785 g001
Figure 2. Spectra of the high-surface-area CeO2 support recorded after an O400 (blue solid line) and a CO400 (red solid line) pretreatment. Dashed lines denote the respective data from the Ce references; black: Ce(III), blue: Ce(IV). Note that the Ce(III) reference (black dashed line) has been re-scaled in intensity for similar height as in the other spectra (scale on the right side).
Catalysts 09 00785 g002
Figure 3. Spectra recorded on the Au/CeO2 catalyst at the Ce LIII edge after different pre-treatment procedures: H400 (red solid line), O400 (blue solid line), and CO400 (orange solid line). The black dash-dotted line denotes the Ce(IV) reference. The inset (lower right part) displays the respective spectra recorded in transmission at the Au LIII edge, together with a spectra of the Au references (dashed line: Au2O3, dashed dotted line: Au foil).
Catalysts 09 00785 g003
Figure 4. Formation rate during CO oxidation in different reaction atmospheres (standard, O2-rich, and CO-rich) at 80 °C on a Au/CeO2 catalyst after oxidative (O400) pretreatment in 10% O2 in N2 at 400 °C (black circles) and the relative Ce3+ content during time on stream as extracted from LCA analysis of operando X-ray absorption spectra recorded in fluorescence mode during reaction (blue, green, and red symbols). The dashed blue line denotes the initial Ce3+ ratio (right scale). Representative error bars are shown for each sequence.
Catalysts 09 00785 g004
Figure 5. Formation rate during CO oxidation in different reaction atmospheres (standard, O2-rich, CO-rich) at 80 °C on a Au/CeO2 catalyst after reductive (H400) pretreatment in 10% H2 in N2 at 400 °C (black circles) and the relative Ce3+ content during time on stream as extracted from LCA analysis of operando X-ray absorption spectra recorded in fluorescence mode during reaction (blue, green, and red symbols). Representative error bars are shown for each sequence.
Catalysts 09 00785 g005
Figure 6. Formation rate during CO oxidation in different reaction atmospheres (standard, O2-rich, CO-rich) at 80 °C on a Au/CeO2 catalyst after reductive (CO400) pretreatment in 10% CO in N2 at 400 °C (black circles) and the relative Ce3+ content during time on stream as extracted from linear combination analysis (LCA) analysis of operando X-ray absorption spectra recorded in fluorescence mode during reaction (blue, green, and red symbols). Representative error bars are shown for each sequence.
Catalysts 09 00785 g006
Figure 7. Overview about changes in the Ce3+ concentration in Au/CeO2 catalysts during CO oxidation (a) after CO400 pretreatment, (b) after O400 pretreatment, and (c) after H400 pretreatment in a sequence of varying reaction gas atmospheres. The left and right parts refer to the reaction in standard reaction gas mixture following the first and the second treatment.
Catalysts 09 00785 g007
Figure 8. Schematic overview illustrating the O-vacancy and Ce3+ concentration in Au/CeO2 catalysts after oxidative (top left) and reductive pretreatments (top right) and during CO oxidation (bottom) in the different reaction gas mixtures used in this study (left: O2 rich or standard reaction gas mixture, right: CO rich gas mixture).
Catalysts 09 00785 g008
Table 1. Overview of the individual contributions (peak heights and energy of Lorentzian) to the normalized XANES spectra of our references at the Ce LIII absorption edge, with the peaks and peak positions taken from [45]. The respective initial and final states are discussed in that reference.
PeakAB0B1B2C1C2
Binding energy/eV5720.25726.15727.85730.25736.05738.1
Ce(III) reference01.870000
Ce(IV) reference0.020.20.60.810.020.62

