Design of Specific Acid-Base-Properties in CeO2-ZrO2-Mixed Oxides via Templating and Au Modification

1
Technische Universität Dresden, Chair of Technical Thermodynamics, Helmholtzstr. 14, 01062 Dresden, Germany
2
German Institute of Science and Technology-TUM Asia Pte Ltd, SIT@SP Building 510 Dover Road #05-01, Singapore 139660, Singapore
*
Author to whom correspondence should be addressed.
Catalysts 2018, 8(9), 358; https://doi.org/10.3390/catal8090358
Submission received: 9 August 2018
/
Revised: 23 August 2018
/
Accepted: 24 August 2018
/
Published: 27 August 2018
(This article belongs to the Special Issue Active Sites in Catalytic Reaction)
Abstract
:Ceria-zirconia mixed oxides and gold supported oxides exhibit very good thermal stability and catalytic activity, as well as great selectivity. This work has been focused on the controlled synthesis and characterization of cationic- and amphiphilic-templated ceria, zirconia, and ceria-zirconia mixed oxides from nitrate and iso-propoxide precursors, and ceria-zirconia mixed oxides modified with gold via the deposition precipitation method with urea. The characterization of the acidic and basic properties was carried out through two test reactions. A complete chemical and structural characterization of the materials was done using Atomic Absorption Spectroscopy (AAS), Brunauer-Emmet-Teller Surface Analysis (N2-BET), X-Ray Diffraction (XRD), NH3- Temperature Programmed Desorption (TPD)/CO2-TPD, and Fourier Transform Infrared Spectroscopy (FTIR). Template techniques led to the formation of high surface area mesoporous materials with high activity and thermal stability. In general, the acid sites density was decreased, whereas the basic site density was increased by modification with Au or incorporation of zirconia in case of mixed oxides.
1. Introduction
Ceria (CeO2) based materials have been widely investigated, and are attracting a considerable interest, due to their application in several fields such as catalysis, electrochemistry, photochemistry, and materials science. Ceria is a component of three-way catalysts (TWC) [1], andis used as a base material for electrolytes and electrodes in solid oxide fuel cells (SOFCs) [2]. It is also widely used as support material in transition metal or noble metal catalysis, due to its outstanding properties [3,4,5,6,7]. Ceria has the advantages (a) to stabilize the metal dispersion on the carrier; (b) to improve the oxidation and reduction of the noble metal; and (c) to enhance oxygen storage and release by shifting between CeO2 under oxidizing conditions and Ce2O3 under reducing conditions [8,9].
Zirconia has attracted wide interest from scientists, technologists, and researchers, due to its remarkable properties [10]. It is one of the most studied materials with respect to its mechanical, structural, and electrical properties. Properties of zirconia are good wear resistance, chemical inertness, low thermal conductivity, and a high melting temperature, that makes it attractive as an engineering material. Based on the previously mentioned properties, zirconia is used for extrusion dies, machinery wear parts, and piston caps. Furthermore, it is utilized in electrochemical cells, fuel cells, and oxygen sensors, due to its high oxygen-ion conductivity. Its low thermal conductivity encourages its use as a thermal barrier coating for aerospace engine components.
Ceria-zirconia mixed oxides have attracted a lot of attention in recent years, due to their mechanical and electrical properties, and good stability and redox properties in various applications as catalysts [8,11,12,13,14,15,16,17,18,19].
Furthermore, ceria-zirconia is industrially relevant and exhibits improved OSC (oxygen storage capacity) properties, thermal stability, and catalytic activity, when compared to ceria [20,21]. One reason for the propagation of CexZr1-xO2 mixed oxides is the ease of Zr4+ incorporation. To achieve a solid solution consisting of ceria and zirconia in the cubic crystal structure, an appropriate preparation method and eligible pretreatment temperatures must be used [16]. In comparison to CeO2, zirconia mixed oxides are much more stable to sintering and loss of surface area at high temperatures. The stability of oxygen defects is enhanced, due to the incorporation of the smaller Zr4+ atoms in the ceria lattice structure [22]. The phase composition strongly influences the redox properties of cerium oxide. The insertion of smaller zirconia cations into the ceria lattice leads to structural modification of the cubic fluorite lattice, which enhances the oxygen storage capacity, thermal stability, and resistance to sintering.
The modification of the catalyst surfaces of ZrO2 and CeO2 with transition metal oxides, such as gold or platinum often leads to catalysts with higher activity and lower working temperatures. Heterogeneous, gold supported catalysts have been recognized as interesting catalytic materials, and have attracted wide interest in the last years, due to their applications in various chemical reactions. New applications of gold catalysts have been found in various fields, such as (i) pollution and emission control; (ii) chemical processing of a range of bulk and specialty chemicals; (iii) clean hydrogen production and fuel cell systems; and (iv) sensors [23]. The most common application of gold as catalyst is the selective hydrogenation of α,β-unsaturated compounds. Metal oxide-supported gold catalysts also exhibits great selectivity for the hydrogenation of the conjugated C=O bond and unsaturated alcohols [4]. Ceria-zirconia mixed oxides could be promising supports for Au nanoparticles in CO oxidation, and could lead to a better performance and a better stability of the WGS (water-gas-shift) reaction [5,24].
However, the origin of the catalytic activity of gold is not entirely understood. Especially the properties of the active centers have not been sufficiently investigated [25]. Conceptually, the influence of the catalytic activity of gold nanoparticles in various reactions can be classified as follows: (i) The influence of the preparation method; (ii) the particle size effect; (iii) the separate catalytic role of the support/additive; and (iv) the presence of ionic gold. Among a few other authors [3,4,6,7], Karpenko et al. [5] describe the conditioning procedure as a significant influencing factor on the catalytic activity, surface composition, and stability of Au/CeO2 catalysts for the water-gas-shift reaction. The high activity of gold-supported catalysts for the low temperature oxidation of CO is also influenced, and determined, by the surface of the catalysts and their structural properties [26,27,28].
Usually, noble-metal-based catalysts are prepared by impregnation. However, this method is not appropriate for gold because Au has a relatively low affinity for metal oxides and thus, the interaction with the support is very weak. During calcination of the material, the coagulation of Au particles is highly enhanced and results in an inactive Au-based catalyst. According to the “modified impregnation” method by Datye et al. [29], Au-based catalysts with an average particle size of around 2.4 nm could be obtained. However, the activity at room temperature of these catalysts in CO oxidation was comparable to those prepared by deposition-precipitation. Therefore, the most widely used method to prepare active Au-based catalysts with a homogeneous distribution throughout the entire support is the deposition-precipitation. Furthermore, the use of templates is also a widespread technique for preparing mesoporous materials with defined structures and pore size distributions. Cationic and non-ionic surfactants are most commonly used as such templates. Controlling the structure of mesoporous materials and understanding the mechanism of their formation is a challenge because of the difficulties to control Au particle size and acid-base properties of the bulk material.
Based on experimental experience, the objective of this study is to systematically improve the overall properties of ceria, ceria-zirconia, and gold supported catalysts. Structural, morphological, and acid-base properties as well as the catalytic performance with respect to alcohol decomposition test-reactions were compared for all newly prepared systems.
2. Results and Discussion
2.1. Catalyst Characterization
The catalysts have been synthesized using various preparation methods and have then been compared regarding their structure, surface properties, and catalytic activities. The catalysts are prepared using cationic (CTAB, Sigma Aldrich, Germany) or non-ionic (P-123®block copolymer and Brij® 56, Sigma Aldrich, Germany) templates, via co-precipitation with ammonia and through the deposition-precipitation method with urea (Au/CeO2, Au/ZrO2, and Au/CeO2-ZrO2). The properties and catalytic activities of all prepared catalysts were compared with a reference sample prepared from commercial ceria. Detailed information about the labeling of the samples can be found in chapter 3 (Materials and Methods).
2.1.1. Atomic Absorption Spectroscopy (AAS)
The weight percentages of gold for all evaluated catalysts were determined by AAS and are given in Table 1.
The Au-supported catalysts have been prepared via the deposition-precipitation method with urea (DPu) and 1 wt.% Au-loading. After the preparation, the catalysts have been washed with 350 mL deionized water. The existence of Au+ has been proved by testing the washing solution with NaBH4. For all samples, the Au+-tests were negative. Therefore, it is concluded that Au was successfully deposited on the catalyst surface. The final gold loadings for the Au-catalysts prepared were close to the nominal ones.
2.1.2. Brunauer-Emmet-Teller Surface Analysis (N2-BET)
In order to obtain detailed information about the pore size, the specific surface area, the mesopore volume, and the pore size distribution, adsorption and desorption experiments with nitrogen (N2) have been performed. The specific surface areas and pore volumes were determined using the Brunauer-Emmet-Teller (BET) method. The results for the synthesized supports and their corresponding calcination temperatures are summarized in Table 2.
The BET surface areas of CeO2-support samples were found to be 72 m2/g for the ammonia-precipitated non-templated sample, 65 m2/g for the templated sample and 6 m2/g for the commercial ceria, respectively. The micropore volumes ranged from 0.015 to 0.012 cm3/g. All samples were calcined at the same temperature of 600 °C and under the same conditions (100 mL min−1 syn. air). The specific surface areas for the templated ZrO2-support samples were in the range between 46 and 92 m2/g. The specific surface area of zirconia prepared from the nitrate precursor was found to be two times higher compared to that prepared from the iso-propoxide precursor. The micropore volume was found to be 0.015 and 0.0065 cm3/g for ZrO2-T (NO3) and ZrO2-T (propox.), respectively.
Surface areas of CeO2-ZrO2 synthesized with surfactants compare favorably with those samples prepared by the conventional co-precipitation method. Four different CeO2-ZrO2 samples were prepared and compared. Non-templated CeO2-ZrO2 synthesized by the co-precipitation method with ammonia only exhibits a surface area of 15 m2/g, whereas CeO2-ZrO2-T prepared with templates exhibits a surface area of 83 m2/g. Furthermore, the cumulative pore volume of the precipitated sample was two times smaller (0.08 g/cm3) than the cumulative pore volume of the templated ceria-zirconia mixed oxides (0.17 g/cm3). As expected, the samples calcined at lower temperatures (400 °C) show the highest surface area for this type of catalysts. The surface areas increase with an increase in zirconia content in the sample. However, the values for CeO2-ZrO2 (83 m2/g) are lower than those obtained for ZrO2 (92 m2/g), but higher than those characterizing CeO2 (65 m2/g). This indicates that the introduction of zirconia in the system stabilizes the surface area of ceria and inhibits the sintering process.
2.1.3. X-Ray Diffraction (XRD)
XRD analysis was used to determine the chemical composition and the crystallographic structure of the materials. Figure 1 shows the X-ray diffraction pattern for CeO2, ZrO2, and CeO2-ZrO2 materials prepared by different methods and calcined at 600 °C.
The main reflections at 28.6°, 33.1°, 47.5°, 56.4°, 59.1°, and 69.5° of 2θ can be assigned to the (111), (200), (220), (311), (222), and (400) planes in the XRD patterns of all the ceria and ceria-based samples corresponding to the cubic fluorite structure, typical for CeO2. This indicates that the zirconia dopant is contained within the CeO2-lattice to form a solid solution while maintaining the fluorite structure. Moreover, the (111) diffraction angle for all Ce/Zr-mixed oxides shifted from 28.6° to 28.8° indicating the formation of CeO2-ZrO2.
The CeO2-T sample has narrower reflections compared to the ones from the mixed oxides indicating an increase of the particle size. The wide-angle XRD pattern of the ZrO2 samples prepared by different templated techniques in Figure 1 reveals the occurrence of broad reflections corresponding well to the monoclinic zirconia as main phase.
The XRD patterns of three different gold supported CeO2-ZrO2 mixed oxides are shown in Figure 2.
After loading the catalysts with Au, no change was detected. This indicates that the structures of CeO2 were well preserved in the composites. The reflections for Au/CeO2-ZrO2 are identical to those of their supports CeO2-ZrO2. The peaks correspond to the cubic fluorite structure type. However, the expected peak for Au (111) at about 2θ = 38° is not present indicating that the amount of Au is very low.
2.1.4. Temperature Programmed Desorption (TPD)
The acidic and basic site concentrations of CeO2, ZrO2, CeO2-ZrO2 mixed oxides, as well as the gold supported samples were determined by conducting temperature programmed desorption experiments of ammonia (NH3) and carbon dioxide (CO2), respectively.
NH3-TPD
Figure 3 presents the NH3-TPD profiles of non-templated cerium oxide synthesized from the nitrate precursor by precipitation with ammonia and the gold supported catalysts with 1 and 2 wt.% gold loading (a) and of the CeO2-ZrO2-T mixed oxide and ZrO2-T, prepared from nitrate precursors and of the non-templated CeO2 (b). The samples were activated in vacuum at 500 °C for 2 h. The mass 16 (m/e = 16) is illustrated for ammonia-TPD profil.
CeO2 exhibits two broad desorption maxima at around 240 °C and 560 °C indicating two kinds of acidic sites with different strength. The peak at 240 °C represents acidic sites of medium strength, and the peak at 560 °C corresponds to NH3 released from strong acidic sites corresponding to the strongest Lewis acidic sites present on the catalyst surface. In contrast, the Au supported catalyst exhibits one narrow peak at 215 °C, and a broad desorption peak at 580 °C and 650 °C for 1 wt.% and 2 wt.% Au, respectively. The narrow peak at lower temperature corresponds to weak acid sites, and the broad peak at higher temperature is due to the strong Lewis acid sites. The huge desorption peak above 650 °C is probably caused by water desorbing from the sample, as the activation temperature was 500 °C. The amount of desorbing ammonia at temperatures in the range from 200–250 °C was increased with higher loading of gold indicating a slight increase in acidity, due to the Au+ species acting as weak Lewis acid sites. The mixed oxide (Figure 3b) exhibits a narrow peak at about 235 °C indicating the weak acidic sites of the sample, while for ZrO2-T a second peak at approximately 600 °C was observed indicating two kinds of acidic sites with different strength.
The calculated acid sites are shown in Table 3. The desorption profiles of ammonia for N600 and Au/N600 were of similar shape, however the maximum was shifted to lower temperatures after modification with gold. The density of acid sites was also decreased, from 13 to 8, and 12 µmol·g−1 for 1 and 2 wt.% Au, respectively. Compared to the non-templated, precipitated ceria (N600), the templated samples CeO2-ZrO2-T and ZrO2-T had more acid sites. The concentration of acidic sites was strongly increased in the order: Ceria (13 µmol·g−1) < ceria-zirconia (93 µmol·g−1) < zirconia (173 µmol·g−1). The acidity of the Au supported samples (desorption profiles not shown here) (values in Table 3) varies widely. The acid site concentration of ZrO2-T (59 µmol·g−1) was increased, due to the modification with Au (83 µmol·g−1), whereas the acid site concentration of Au/N600 (2.0) was slightly decreased from 21 to 19 µmol·g−1 due to the deposition of gold.
CO2-TPD
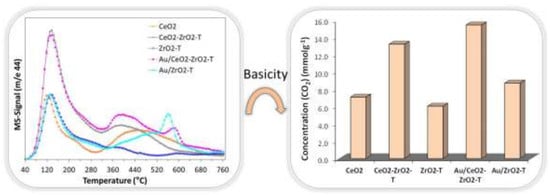
Figure 4 presents the CO2-TPD profiles of the templated gold supported catalysts Au/CeO2-ZrO2-T and Au/ZrO2-T (propox.) with 1 wt.% gold loading (Figure 4a) and of the supports (CeO2, CeO2-ZrO2 and ZrO2) and gold catalyst Au/CeO2-ZrO2-T (Figure 4b). The samples were ex-situ activated for 2 h at 300 °C in 100 mL min−1 hydrogen flow. The mass 44 (m/e = 44) is illustrated for CO2-TPD profiles.
Desorption profiles for Au/CeO2-ZrO2-T show three CO2 desorption peaks. Two narrow peaks at 144 °C and 580 °C and one broad peak at 405 °C indicating three kinds of basic sites with different strength, while Au/ZrO2-T (propox.) exhibits only two narrow peaks at 138 °C and 568 °C, however, with lower intensity. The high temperature peaks are correlated with carbon dioxide formed by strongly adsorbed carbonates, those as from the bulk.
N600 shows two main peaks, one narrow peak at 124 °C and one broad peak at about 450 °C. In contrast, zirconia exhibit only one narrow peak with similar intensity at 137 °C. However, the maxima of the desorption peaks for zirconia and ceria-zirconia mixed oxide were shifted to higher temperatures indicating stronger basic sites on the catalyst surface. CeO2-ZrO2 mixed oxide shows one narrow peak at 137 °C and one broad peak at 405 °C, while Au supported on ceria-zirconia exhibits an additional narrow peak at 581 °C indicating the presence of three kinds of basic sites with different strength.
Table 3 gives an overview of the resulting acid and basic properties determined by ammonia- and carbon dioxide-temperature programmed desorption measurements.
The basic site concentration of ceria (7 µmol·g−1) was increased by incorporation of zirconium (13 µmol·g−1). The modification with Au also increased the basicity of the mixed oxide to 15 µmol·g−1.
The reference Au/CeO2 shows the highest concentration of active sites, due to the very low surface area. The acid and base site concentration was increased due to the incorporation of zirconia in CeO2-ZrO2-mixed oxides. An increase of basicity was also observed for the samples prepared with templates and for the samples modified with Au via the DPu method.
2.2.1. Fourier Transform Infrared Spectroscopy (FTIR)
Catalyst Characterization
The catalysts were activated under vacuum at 500 °C for 2 h (a treatment that should only eliminate the physisorbed layer) strong absorptions remain in the νOH and νC-O/C-C spectral regions. Depending on the coordinative unsaturation of surface metal ions, three types of hydroxyl groups could be discerned—the terminal-OH (I), the bridging-OH (II), and multi-centered-OH (III). Following the usual convention, stretching frequencies (>3600 cm−1) of isolated OH-groups are designed type I (terminal –OH), II (bridging =OH), and III (multicentered, ≡OH).
For the activated samples CeO2-T, ZrO2-T, and CeO2-ZrO2-T synthesized from nitrate precursors shown in Figure 5, band frequencies in OH-, CO2- and CO32−- spectral regions are observed. An overview of the characteristic bands is given in Table 4. In addition, CeO2-ZrO2-T shows νOH band absorptions at frequencies between the two pure oxides ceria and zirconia, suggesting the formation of the mixed oxide. For all three samples, a strong adsorption band at 2300 cm−1 was observed and assigned to CO2, indicating the basic character of the materials. However, the intensity for this band was distinctively lower comparing to the bands representing carbonates in the region 1550–1075 cm−1. On basic oxygen ions, different kinds of carbonate species can be formed (bridged, bidentate, monodentate, polydentate).
Table 4 gives an overview of the characteristic IR bands of the activated ceria, zirconia, and ceria-zirconia mixed oxides.
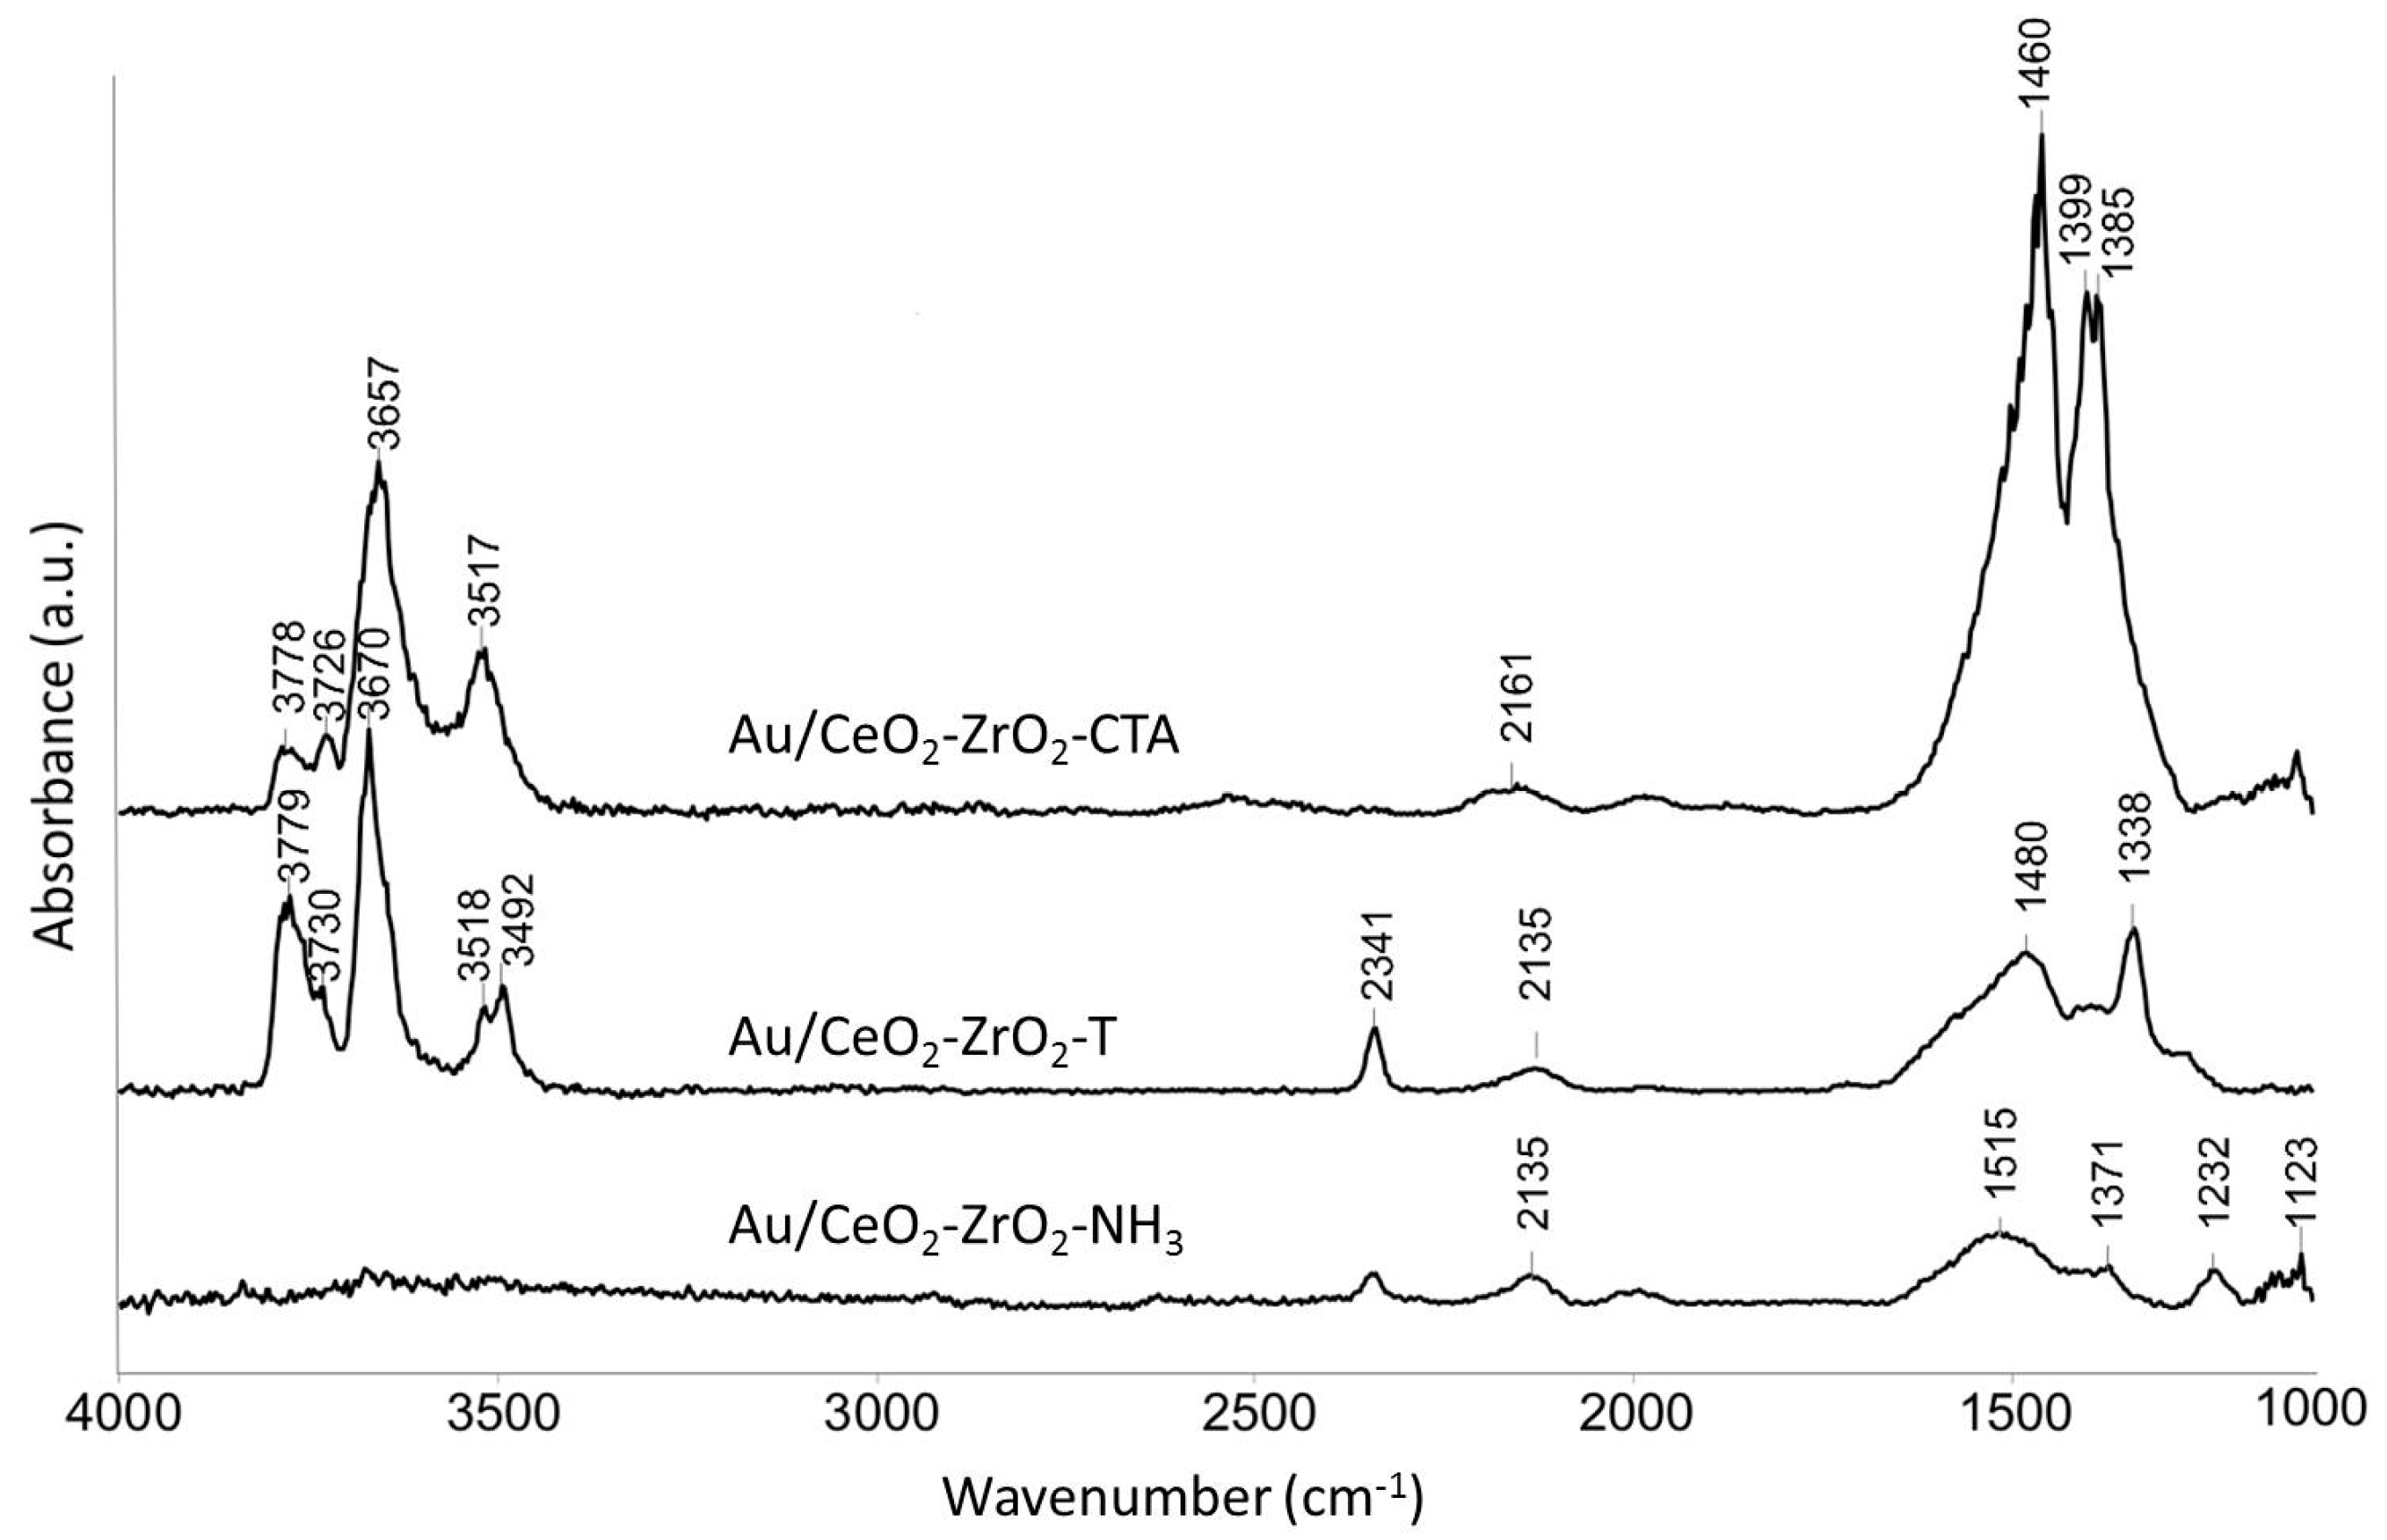
Figure 6 presents the IR spectra of different activated Au supported mixed oxides. The Au loaded samples were prepared by the deposition precipitation method with urea (DPu) and were in-situ activated under reduced pressure at 500 °C for 2 h.
Bands were observed at 3779, 3670, and 3518 cm−1 indicating the type I-, II-, and III- hydroxyls. However, in case of the Au catalysts these bands are slightly shifted to higher wavenumbers. Au/CeO2-ZrO2-T prepared with P-123® and Brij56® as templates shows a very strong band at 2341 cm−1 in comparison to the Au/CeO2-ZrO2_NH3 catalyst prepared by the co-precipitation method without templates. This band did not appear in case of Au/CeO2-ZrO2_CTAB, which indicates that this catalyst is a weak basic catalyst compared to Au/CeO2-ZrO2-T. In comparison to the CeO2-ZrO2 samples, Au supported mixed oxides show an additional band at 2135 cm−1 for Au/CeO2-ZrO2-T and Au/CeO2-ZrO2_NH3 and for Au/CeO2-ZrO2_CTAB an additional band at 2161 cm−1, respectively. The band is assigned to iso-cyanate ν(O-CO), due to the decomposition of urea used in the synthesis of the Au catalysts. Absorption bands in the carbonate region were still visible after activation at 500 °C as in the case for ceria, zirconia and ceria-zirconia mixed oxides.
Iso-Propanol Adsorption
In-situ IR spectroscopy of adsorbed iso-propanol on ceria, ceria-zirconia, and gold supported catalysts was used for better understanding of mechanistic aspects on the surface of the catalyst. After the activation of the reduced or oxidized catalysts, the samples were cooled to 50 °C, and 2-propanol was adsorbed at 0.1 mbar for 0.5 h, followed by an evacuation at different temperatures between 50 and 300 °C for 30 min.
The adsorption of 2-propanol most probably takes place via the formation of hydrogen-bonded and isopropoxide species. As the dehydrogenation of the 2-propanol reaction started, carboxylate species may be formed via an acetone-like intermediate.
IR spectra of gas phase molecules of 2-propanol display absorption bands over wavenumber frequency ranges of νOH (3650–3500 cm−1), νC-H (2965–2860 cm−1), νOOC (1460–1370 cm−1), and νC-O/C-C (1130–985 cm−1) band vibrations. After adsorption of 0.1 mbar 2-propanol, a broad band in the OH region is observed for the CeO2-T, ZrO2-T, and CeO2-ZrO2-T supports, giving evidence that the surface OH groups of the catalysts take part in the formation of hydrogen-bonded species (see Figure 7 and Figure 8). The characteristic pattern of absorptions in νCH range (2965, 2932, and 2865 cm−1), together with strong composite absorptions near 1133 and between 1024 and 985 cm−1 in the C-O stretching region, clearly show the presence of a considerable number of iso-propoxide groups. Additional absorptions at 1564, 1468 and 1383 cm−1 appear in the spectrum and these three absorptions can be assigned to a carboxylate surface species. In the carbonate region, one band with low intensity at 1330 cm−1 appears after adsorption.
The spectra of adsorbed 2-propanol on reduced (A) and oxidized (B) CeO2-ZrO2-T are shown in Figure 9. The reduced sample was ex-situ activated at 300 °C in a hydrogen flow of 100 mL min−1, and then again heated at 300 °C in the IR cell, while the oxidized sample was activated in-situ at 500 °C under reduced pressure.
In case of reduced ceria-zirconia, the bands were shifted to lower wavenumbers (2964, 2927, 2868 cm−1) indicating weaker adsorption of 2-propanol in comparison to the oxidized sample (2967, 2932, 2865 cm−1). In contrast to the reduced sample, the band at 1695 cm−1 did not appear for oxidized CeO2-ZrO2-T. This band can be attributed to C=O of acetone coordinated to Lewis acid sites on the surface. The band at 1332 cm−1 can be assigned to bicarbonates formed by the interaction of 2-propanol with surface hydroxyl carbonates.
The spectra of adsorbed 2-propanol on reduced (0.05 mbar) and oxidized (0.1 mbar) Au/CeO2-ZrO2-T show an adsorption band assigned to linearly adsorbed CO. Acetone was formed over these catalysts and oxidized to CO. However, the band for the reduced (1692 cm−1) Au catalyst is shifted to higher wavenumbers in comparison to the oxidized sample (1677 cm−1) indicating stronger adsorption of the alcohol. Furthermore, the intensities in the carboxylate and carbonate regions are much higher compared to the oxidized catalyst.
The assignments of the vibrational wavenumbers from the adsorption of 2-propanol on various catalysts are presented in Table 5.
It can be finally concluded that acetone was formed on reduced CeO2-ZrO2-T, oxidized ZrO2-T new and oxidized/reduced Au modified samples indicating the basic character of the catalysts. A stronger adsorption of 2-propanol was observed for the Au catalysts.
Pyridine Adsorption
In-situ IR spectroscopy of adsorbed pyridine was carried out to characterize the acid and base properties and to identify the type of acid sites on the catalyst surface. Pyridine acts as a strong Lewis base, due to the lone pair located on the N-atom in the ring. Therefore, pyridine has been preferred as an IR probe base molecule for surface acid properties of metal oxides. Due to the adsorption on the surface, four main vibrational modes are known–LPy (Lewis acid site), BPy (Brønsted acid site), HPy (H-bonded Py molecules), and PPy (physisorbed Py molecules).
The ring vibrational modes of adsorbed pyridine on Au-loaded ceria and ceria-zirconia samples are listed in Table 6.
Difference spectra of adsorbed pyridine on oxidized and reduced Au/CeO2-ZrO2-T are illustrated in Figure 10.
The oxidized sample was activated at 500 °C for 2 h under reduced pressure and the reduced sample was ex-situ activated at 300 °C for 2 h in an H2-atmosphere, to remove water and carbonates on the surface. In both cases, 0.1 mbar pyridine was adsorbed at 50 °C for 20 min. After adsorption of pyridine, the samples were degassed at different temperatures (100, 200, and 300 °C).
For oxidized Au/CeO2-ZrO2-T, bands of pyridine vibration appeared at 1625, 1596, 1573, 1484 and 1440 cm−1 (see Figure 10A). The occurrence of two different frequency values (1625 and 1596 cm−1) for the ring vibration may indicate that Lewis acid sites involved exhibit two different acidity strengths. These can be constituted by coordinatively unsaturated cerium cations in different oxidation states Ce(IV) and Ce(III). At higher wavenumbers (1548 cm−1), the vibrational mode of pyridine interacting with Brønsted acidic sites should appear. In our case, no Brønsted acidity was found. In comparison to the oxidized sample, the bands at 1484 (L-Py), 1597 (H-Py) and 1625 (L-Py) cm−1 were shifted to higher wavenumbers for the reduced sample (see Figure 10B), indicating stronger acid strength.
After evacuation at different temperatures, all bands are shifted to higher wavenumbers. The bands, due to H-bound pyridine progressively decreased while the bands assigned to pyridine coordinated on Lewis acidic sites almost disappeared. This confirms the presence of weak to stronger acidic sites.
For reduced Au/CeO2-ZrO2-T, bands of pyridine vibration at 1626, 1597, 1573, 1485, and 1440 cm−1 are found. All bands are attributed to pyridine coordinated to Lewis acid sites. After evacuation, weakly bound and physisorbed pyridine was removed and a new band appeared at 1511 cm−1. Only a small shift of the adsorption bands was observed in comparison to the oxidized sample.
For all samples, the adsorption of pyridine indicates the presence of two different acidity strengths and no Brønsted acidity. The ex-situ reduced samples showed a stronger acid strength.
2.3. Catalytic Test Reactions
The acid-base properties of metal oxides play an important role in catalysis. They can be characterized by test-reactions like 2-propanol or 2-butanol decomposition. The dehydration of the alcohols into propene and butene, respectively, proves the acid character of the catalyst, whereas their dehydrogenation to acetone or butanone proves the basic character of the catalyst.
2.3.1. Blind Test
Blind tests were carried out to ensure that no other influencing factors exist except for the catalyst converting 2-propanol.
The reactor was prepared and charged as described in the experimental section, but no catalyst was applied. The experiment was performed at 150, 175, 200, and 225 °C with a flow rate of 10 mL min−1 of He through the saturator filled with 2-propanol. The blind test showed that the conversion of 2-propanol at 225 °C took place also without addition of a catalyst. At temperatures less than 225 °C, no conversion of 2-propanol was observed. When the temperature was increased to 225 °C, 0.25% acetone and <0.1% propene is formed. However, this issue only needs to be considered in the evaluation of kinetics and does not influence the measurements with catalytic samples.
2.3.2. Conversion of 2-Propanol
The catalytic activity of various catalysts synthesized by co-precipitation using templates or impregnation methods was examined in a down-stream reactor described in the experimental section. The catalytic activities were compared at every temperature in terms of acetone, and propene production rates, 2-propanol conversion, activation energies Ea and selectivities for acetone.
Figure 11 shows the comparison on the dehydrogenation (acetone) (A), and dehydration (propene) (B) production rates of the catalysts as a function of the reaction temperature.
The results show a similar behavior with respect to the course of the reaction; the activity of all the samples increased with the rise of the reaction temperature measured in the down-stream reactor. For all samples, deactivation was not observed (even not during the reaction at 225 °C). CeO2 (N600) showed a high initial activity at 150 °C. The initial rates of acetone formation were similar for templated zirconia and CeO2-ZrO2 prepared by the co-precipitation method. A significant difference in the dehydrogenation rate was observed for the co-precipitated and templated ceria-zirconia mixed oxides. The rate of dehydrogenation for the templated CeO2-ZrO2-T catalyst at 225 °C was 62 µmol/g∙s and the rate of dehydration was only 2.39 µmol/g∙s. This indicates the presence of basic sites on the catalyst surface, whereas the rates of acetone and propene formation for the co-precipitated sample CeO2-ZrO2_NH3 were almost the same at 225 °C (15.7 µmol/g∙s for acetone and 14.16 µmol/g∙s for propene). The dehydrogenation rate was at least four times higher than the dehydrogenation rate of the co-precipitated catalyst. For all catalysts, no activity in dehydration was observed at temperatures lower than 200 °C.
Figure 12 presents the reaction rates of acetone for catalyst supports plotted against the reciprocal of the temperature.
Notably, templated CeO2-ZrO2-T and CeO2 (N600) have quite low apparent activation energies (Ea = 18 and 23 kJ/mol, respectively). The activation energies are half as small as the activation energies of templated zirconias (Ea = 68 and 53 kJ/mol) or co-precipitated ceria-zirconia (Ea = 58 kJ/mol).
In general, an increase in the conversion was observed with an increase of temperature. The activity of co-precipitated CeO2-ZrO2_NH3 (3.6% at 225 °C) was half as small as the activity of templated ceria-zirconia (8% at 225 °C). On the other hand, the newly synthesized templated zirconia exhibited a conversion of 0.17% at 150 °C, which increased to 7.36% at 225 °C. The increase in the conversion in case of the templated zirconia and ceria-zirconia may be due to the better balance of acid-base properties.
It is known that the activities of gold catalysts can be greatly influenced by the particle size of gold, the nature of the support, and the reaction conditions. However, there are general agreements that small gold particle sizes and redox interactions between gold and the reducible support are very important for its high catalytic activity.
The rates for acetone and propene formation in the conversion of 2-propanol for various gold supported catalysts at temperatures between 150 and 225 °C are shown in Figure 13A (acetone production) and B (propene production).
The comparison of the rates of acetone and propene formation for all of the prepared catalysts showed that the dehydrogenation was hundred orders of magnitude higher than that of the dehydration (see Figure 13A,B). At all temperatures, acetone was formed as main product. However, Au/CeO2_reference prepared from commercial ceria showed a significantly lower rate of acetone formation of 65 µmol/g∙s at 225 °C compared to the other self-prepared catalysts Au/CeO2-ZrO2-T (549 µmol/g∙s), Au/N600 (543 µmol/g∙s) and Au/ZrO2-T (424 µmol/g∙s).
The rates for dehydration were similar for Au loaded on ceria or ceria zirconia, whereas for Au/ZrO2-T the highest rate of propene formation (5 µmol/g∙s) was observed. Au/CeO2 reference prepared from commercial ceria was the only catalyst that showed deactivation with time on stream.
Assuming an Arrhenius type temperature dependence of the rate of acetone, the slope of the logarithm of the rate as a function of the inverse temperature provides the activation energy Ea. The activation energies for each gold catalyst were calculated, and are presented in Figure 14.
For the sample Au/CeO2_reference, an Ea of ∼22 kJ/mol was determined in this way. Nevertheless, the values of the measured activation energies were found to be at least three times higher in the range from 61 to 75 kJ/mol for self-prepared ceria, zirconia, and ceria-zirconia gold supported catalysts.
A comparison of the conversion of 2-propanol with other gold supported catalysts under the same conditions reveals that the Au/CeO2-ZrO2-T catalyst (69% conversion at 225 °C) appears to be the most active catalyst. Even though the sample Au/N600 exhibited similar activities (66% conversion at 225 °C) and higher conversions at lower temperatures, Au supported on ceria-zirconia forms barely any propene during the reaction, showing that almost only basic sites are involved in the reaction.
The sample Au/CeO2_reference shows a constant conversion of ∼5% at 150, 175, and 200 °C. The highest conversion for this catalyst at 225 °C was found to be 8.8%, which is only the tenth part of the conversion rate of the other synthesized gold catalysts.
A comparison of the activity of Au/CeO2-ZrO2 catalysts prepared by different methods shows lower conversion rates of the catalysts Au/CeO2-ZrO2-NH3 (35% at 225 °C) prepared by the co-precipitation method in comparison to the templated catalysts Au/CeO2-ZrO2-T (69% at 225 °C).
Au supported ceria-zirconia catalysts are highly coke-resistant and exhibit promising stable activities without deactivation during time-on-stream runs. This was mainly attributed to the availability of lattice oxygen, due to the ability of the ceria-based mixed oxides to store and release oxygen [30].
The selectivities of acetone in the conversion of 2-propanol at 225 °C and 10 mL min−1 helium gas flow for various catalysts are presented in Figure 15.
With regard to the selectivities, it can be noted that all catalysts tend to favor the formation of acetone with some traces of propene. Au/CeO2-ZrO2-T and Au/N600 showed the highest selectivity for acetone 99.7%.
2.3.3. Conversion of 2-Butanol
The decomposition of 2-butanol was carried out to test the catalytic activity and investigate the acid-base sites of the catalysts. Briefly, butane is formed on acid sites via dehydration and butanone is formed on dominating basic sites butanone via dehydrogenation of 2-butanol.
The catalytic activities were compared at every temperature in terms of butanone and butene production rates, 2-butanol conversion, and selectivities to butanone.
The rates of butanone and butene formation for various supports are shown in Figure 16A (butanone) and Figure 16B (butene).
CeO2-ZrO2-T shows a significant butanone formation at 225 °C with a rate of 79.9 µmol/g·s, whereas for the templated zirconias a maximal rate of butanone of 24.2 and 30 µmol/g·s was observed for ZrO2-T (NO3) and ZrO2-T (propox.), respectively. Non-templated CeO2 (N600) prepared by precipitation with ammonia exhibits a rate for butanone formation of 65 µmol/g·s at 225 °C and a rate of dehydration (butene formation) of 79 µmol/g·s. All catalysts show a slight deactivation during the reaction at each temperature. At temperatures higher than 200 °C, ZrO2-T (propox.) favors the formation of butene with a rate of 70.5 µmol/g·s, while ZrO2 (NO3) had a selectivity of 100% for butanone at 150 °C. With increasing temperatures, the selectivity for butanone was decreased to 31% at 225 °C, whereas butene was formed as main product with a rate of formation of 41.3 µmol/g·s.
From all catalysts, the template mixed oxide CeO2-ZrO2-T was the only sample that showed a preferred formation of butanone. The other catalysts failed in the reaction of 2-butanol decomposition compared to the conversion of 2-propanol. The main product of these catalysts at temperatures higher than 200 °C was butene.
From all the measured supports, CeO2 (N600) showed the greatest conversion of 19.9% at 225 °C, whereas for ZrO2-T (NO3) only 9% of the 2-butanol introduced is being catalytically converted. At temperatures lower than 175 °C, zirconia prepared from the nitrate precursor showed almost no conversion of 2-butanol (0.39%).
The rates of butanone formation (A) and butene formation (B and C) for various gold supported catalysts between 150 and 225 °C are presented in Figure 17.
Au/CeO2-ZrO2-T, like its homologous support, yielded butanone as main product at all temperatures with 98.5% at 150 °C and 97.4% at 225 °C. The highest butanone formation (548 µmol/g·s) was observed for this catalyst at 225 °C.
In contrast to the 2-propanol decomposition reaction, all catalysts were subject to deactivation at each single temperature during the reaction. At 225 °C, Au supported on zirconia and ceria-zirconia, synthesized with CTAB template, shows a similar rate of butanone formation with 351 and 356 µmol/g·s, respectively. Au/CeO2 (N600) exhibits a constant rate of butanone formation of 220 µmol/g·s at 175 and 200 °C, while a significant decrease (61 µmol/g·s) was observed at 225 °C.
The non-templated samples Au/N600 and Au/CeO2_reference yield butene as main product at temperatures higher than 200 °C, with a rate of 785.5 and 528.5 µmol/g·s, whereas Au supported on zirconia and ceria-zirconia only show a rate of butene formation with a maximum value of 29.7 µmol/g·s.
For Au/N600, the conversion increased at each temperature step from 21.5% at the lowest temperature (150 °C) to 98.7% at the highest temperature (225 °C). In contrast to Au supported on ceria-zirconia, Au/ceria favors butene formation at temperatures higher than 175 °C. At 150 °C, the conversion of 2-propanol reaches up to 27% for the Au supported catalyst templated P-123® and Brij®56. Au/CeO2-ZrO2-T exhibits 65% conversion when the temperature is raised to 225 °C. The gold catalyst prepared by the co-precipitation method showed the lowest conversion when compared to the templated catalysts from 4% at 150 °C to 25% at 225 °C.
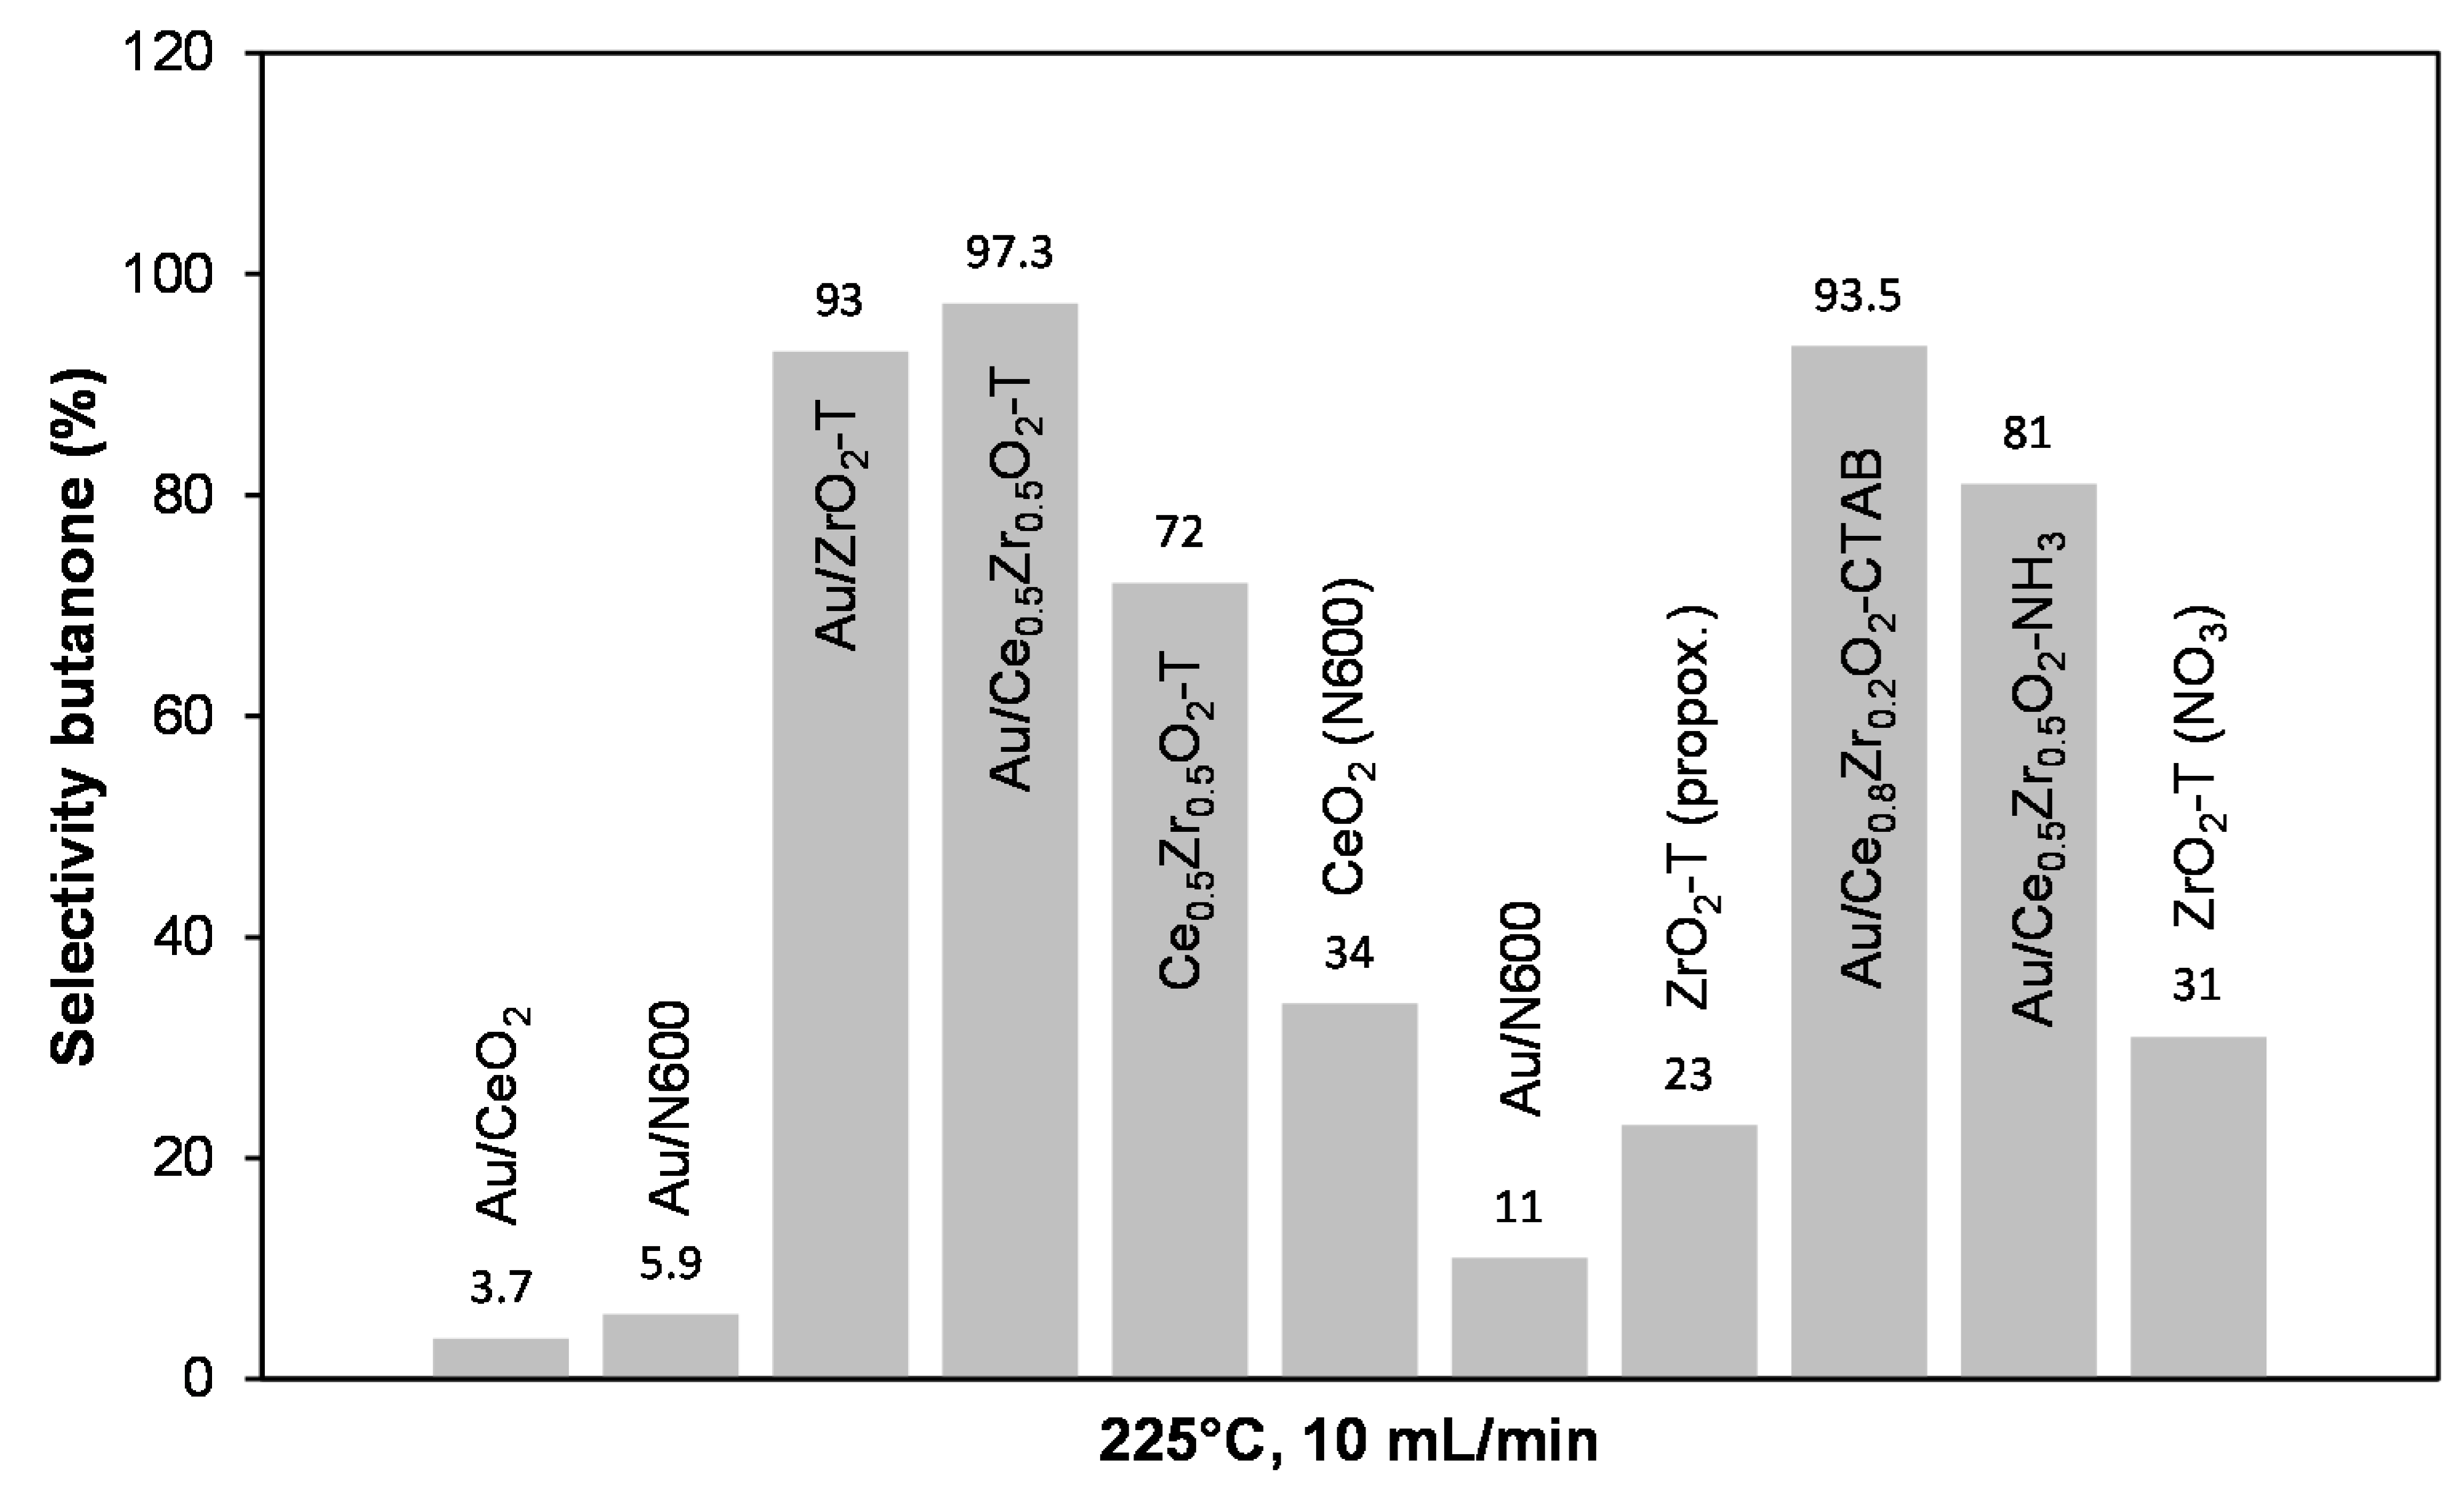
Figure 18 presents the calculated selectivities for butanone formation for the synthesized catalysts at 225 °C, and helium carrier-gas flow of 10 mL min−1.
In contrast to the 2-propanol decomposition, the selectivities for butanone are lower than those for acetone formation. More investigations are needed to clear the increased deactivation during the butanol conversion. In general, Au supported on ceria-zirconia and on templated zirconia showed high butanone selectivities up to 97%, while Au supported on ceria shows very low selectivities in the order Au/N600 (11%) < Au/N600 (6%) < Au/CeO2 reference (3.7%).
3. Materials and Methods
3.1. Catalyst Preparation
Different preparation methods have been applied. To prepare micro-/macro- and mesoporous compounds, cationic (CTAB) or non-ionic (P-123®block copolymer and Brij® 56) templates were used [30]. The templated mixed oxides were compared to those prepared via the co-precipitation method with ammonia [30]. Au-supported catalysts were also synthesized (Au/ceria, Au/zirconia and Au/ceria-zirconia (1.0 wt.%) through the deposition-precipitation method with urea. Their properties and catalytic activities were compared with a reference sample prepared from commercial ceria [26].
3.1.1. Ceria, Zirconia and Ceria-Zirconia Mixed Oxides
Precipitation with Ammonia
0.2 M Ce(NO3)3·6H2O aqueous precursor solution was mixed with ca. 40 mL of a 3 M ammonia solution until the pH was 11 and stirred at RT for 24 h. The precipitate was centrifuged and washed with a mixture of water/ethanol (1:1) until the pH was 7. The precipitate was dried at 60 °C for 8 h and calcined in a flow of synthetic air of 100 mL min−1 by increasing the temperature from ambient temperature to 600 °C at 10 K min−1 for 8 h.
Ceria prepared by this method was labeled CeO2 (N600).
Co-Precipitation Method with Ammonia
6.9 mmol of a 0.1 M Ce(NO3)3·6H2O aqueous precursor solution was mixed with 6.9 mmol of a 0.1 M ZrO(NO3)2·xH2O aqueous precursor solution and stirred at RT for 1 h. The molar ratio of Ce:Zr was 1:1. The solution of aqueous ammonia solution (25%) was dropped into the mixed salt solution under continuous stirring and the pH value was controlled to be 9.5. After aging at room temperature for 20 h, the precipitate was filtered and washed with bidistilled water (350 mL) until no pH change could be detected. Finally, the precipitate was dried at 60 °C for 1 h and at 120 °C overnight and calcined at 600 °C for 4 h in an air flow of synthetic air of 100 mL min−1.
The sample was labeled CeO2-ZrO2 (1:1).
Surfactant-Assisted Method Using CTAB (Cetyltrimethylammonium Bromide)
At room temperature, 6 mmol of cetyltrimethylammonium bromide (CTAB) was dissolved into 200 mL distilled water under ultrasound irradiation for 15 min, then 8 mmol of Ce(NO3)3·6H2O and 2 mmol of ZrO(NO3)2·xH2O were added under vigorous stirring. The molar ratio of Ce:Zr was 4:1. After stirring for 0.5 h, 25% ammonia solution was gradually added into the solution until the pH value of the mixed solution was 9.5, and then further stirred for about 20 h. The final suspended solution was aged at 90 °C for 3 h. The precipitate was filtered and washed with hot water, dried in the oven at 110 °C for 6 h, and then milled and calcined in a flow of synthetic air of 100 mL min−1 at 400 °C for 4 h.
The sample was labeled CeO2-ZrO2_CTAB.
Combined Use of Surfactant Brij-56® and Triblock-Copolymer Pluronic®123
1.66 g of Pluronic123® and 3 g of Brij®-56 were dissolved at 50 °C in 60 mL of distilled water and stirred at room temperature for 3 h. Afterwards, 20 g of zirconium(IV)-propoxide were added dropwise and the mixture was further stirred for 2 h. Subsequently, the solution was transferred to the oven in Teflon tubes for 48 h at 90 °C. After removal from the oven, the material was left for aging at room temperature for 72 h, washed with distilled water and dried at 120 °C. Finally, the sample was calcined in a stream of synthetic air of 100 mL min−1 at 600 °C for 5 h with a heating ramp of 2 K/min.
The sample was labeled ZrO2-T (propox.).
Combined Use of Surfactant Brij-56® and Triblock-Copolymer Pluronic®123 and Precipitation with Ammonia
1.83 g. of Pluronic123®and 1.5 g of Brij®-56 were dissolved in 30 mL of distilled water and stirred at room temperature for 3 h. Afterwards, 0.03 mol of Ce(NO3)3·6H2O aqueous solution were added dropwise and the solution was precipitated with 25% ammonia solution. The mixture was further stirred for 2 h. Subsequently, the solution was transferred to the oven and autoclaved for 48 h at 90 °C. After removal from the oven, the material was left for aging at room temperature for 72 h, washed with distilled water, and dried at 120 °C. Finally, the sample was calcined in a stream of synthetic air of 30 mL min−1 at 600 °C for 5 h with a heating ramp of 2 K/min.
The sample was labeled CeO2-T.
The same procedure was done with 0.03 mol of ZrO(NO3)2·xH2O aqueous solution. The sample was labeled ZrO2-T. The same was also done for 0.015 mol of Ce(NO3)3·6H2O and 0.015 mol of ZrO(NO3)2·xH2O aqueous solution. The sample was labeled CeO2-ZrO2-T.Synthesis of Mesoporous CexZr1-xO2
1 g of Pluronic P123 was dissolved in 20 mL of ethanol at room temperature (RT). Then, 5 mmol (2.17 g) Ce(NO3)3·6H2O and 5 mmol (1.61 g) ZrOCl2 ·8H2O were added to the above solution under vigorous stirring. The mixture was covered with a PE film. After being stirred for at least 3 h at room temperature, the homogeneous solution was transferred to an oven and underwent solvent evaporation. After 2 days of aging under the desired temperature (40 °C), the gel product was dried in an oven at 100 °C for 1 day. Calcination was carried out by slowly increasing the temperature from RT to 400 °C (1 K/min ramping rate) and holding at 400 °C for 4 h in 100 mL min−1 synthetic air.
The sample was labeled CeO2-ZrO2-T_EtOH.
3.1.2. Au/CeO2, Au/ZrO2 and Au/CeO2-ZrO2 (1 wt.%)
For preparation of gold supported catalysts, the deposition-precipitation method with urea (DPu) was used [18,30]. The Au precursor was prepared by dissolving HAuCl4·3H2O (1 g, 2.54 mmol) in 100 mL of deionized water (0.0254 M). The pre-treated calcined supports (3 g) were suspended in 300 mL deionized water, and heated at 80 °C. Au loading (1.0%) was generated by adding 6 mL of the precursor solution, followed by adding 0.9 g urea immediately. The suspension was stirred at 80 °C to decompose urea and obtain a pH equal to 7. The solution was maintained at the value of 7 during 2 h to obtain high dispersion of fine gold particles on the oxide support. Afterwards, the material was centrifuged and washed with bidistilled water. Washing was repeated with 350 mL (with centrifugation after each step) until the pH of the solution was 7 and neither Au+ nor Cl− were verified by testing with NaBH4 (in case of gold) or AgNO3 (in case of chloride). The samples were dried in vacuum at ambient temperature for 20 h.
The samples were labeled Au/CeO2, Au/ZrO2, and Au/CeO2-ZrO2.
3.2. Catalyst Characterization
Dealing with investigation of the relations between the kinetics of sorption and transport, a complete chemical and structural characterization of the materials including sorption capacity, hydroxyl site density and strength, as well as particle size and morphology is mandatory. The following methods have been used: AAS, N2-BET, XRD, NH3-/CO2-TPD, and FTIR/Py-FTIR.
3.2.1. AAS (Atomic Absorption Spectroscopy)
The Au-content was analyzed by atomic absorption spectroscopy (AAS) carried out with a UNICAM 939 AA-Spectrometer. The solids (10–50 mg) were dissolved in a boiling mixture of hydrofluoric acid (HF 48%, 0.1 mL) and nitrohydrochloric acid to ensure complete dissolution of the sample.
3.2.2. N2-BET (Brunauer-Emmet-Teller Surface Analysis)
Specific surface area, pore diameters, and pore size distributions were determined by physisorption of N2. Measurements were carried out in PMI automatic BET-Sorptometer operating at liquid-nitrogen temperature (77 K), after outgassing under vacuum. The apparent specific surface area was calculated by applying the Brunauer-Emmet-Teller (BET) equation to the adsorption isotherms over a relative pressure range. The pore size distribution was obtained by applying the Barret-Joyner-Halena (BJH) method on the adsorption branch [31].
3.2.3. XRD (X-Ray Diffraction)
The crystalline structure of all materials was analyzed by XRD using a Philips X´Pert Pro System (CuKα1-radiaton, 0.154056 nm) at 40 kV/40 mA.
3.2.4. NH3- and CO2-TPD (Temperature Programmed Desorption)
Temperature programmed desorption of ammonia (NH3-TPD) and carbon dioxide (CO2-TPD) were used to determine acidic and basic properties. As standard materials for referencing the NH3-TPD and CO2-TPD, an H-MFI 240 zeolite and a mixture of NaHCO3/Al2O3 (1/4) were used, respectively. Analysis was done with a Pfeifer Vacuum Mass Spectrum (MS). The catalysts were sieved to get particle sizes between 0.7 and 0.5 mm and were weighed into TPD tubes. Catalyst samples were either activated for 2 h at 500 °C in vacuum or ex-situ activated at 300 °C in a hydrogen flow of 100 mL min−1 and activated at 300 °C in vacuum for 2 h.
For NH3-TPD measurements, 150 mg samples and 50 mg standard were loaded into quartz tubes. After activation at a pressure of 10−3 mbar, 0.1 mbar of ammonia was adsorbed and equilibrated for 1 h at 100 °C. To remove gaseous and physisorbed ammonia, the pressure was reduced to 10−3 mbar for 2 h. The temperature was then increased at a rate of 10 K min−1 to 770 °C and the masses 15, 16, 17, 18, 28 and 44 were recorded by the mass spectrometer.
For CO2-TPD measurements, 150 mg samples and 25 mg standard were weighed in the quartz tubes. The catalysts were ex-situ activated at 300 °C in 100 mL min−1 hydrogen flow for 2 h and then activated at 300 °C at a pressure of 10−3 mbar. Subsequently, 0.1 mbar of carbon dioxide was adsorbed and equilibrated for 1 h at 40 °C. To remove gaseous and physisorbed carbon dioxide, the pressure was reduced to 10−3 mbar for 2 h. The temperature was then increased at a rate of 10 K min−1 to 770 °C and the masses 15, 16, 17, 18, 28, and 44 were recorded by the mass spectrometer.
Acidity and basicity are the values corresponding to the areas under TPD curves. The integration values were compared with acidity or basicity of the standard material. Using BET results and quantitative values for acidity and basicity, the number of active sites per unit of surface could be calculated.
3.2.5. FTIR (Fourier Transform Infrared Spectroscopy)
Infrared spectroscopy was carried out with a Perkin-Elmer 2000 spectrometer coupled with a MCT detector, a Bruker IFS 88 spectrometer (for 2-propanol adsorption), or a Nicolet spectrometer (for pyridine adsorption). The background of the empty cell was recorded at 10−7 mbar and RT and subtracted from all following spectra. Samples were pressed into self-supporting wafers and activated in vacuum at elevated temperatures for 2 h or ex-situ activated at 300 °C in a 100 mL min−1 hydrogen flow for 2 h (heating rate 10 K min−1), followed by cooling to 50 °C. A spectrum of the activated sample was measured. Then, 2-propanol or pyridine was adsorbed at a pressure of 0.1 mbar until the intensity of the spectra remained constant. After adsorption, the samples were evacuated and heated again to 300 °C for one hour, so that physisorbed 2-propanol was removed. At 100, 200, and 300 °C, a spectrum of the desorbed sample was taken. The spectra were recorded in transmission mode at a resolution of 4 cm−1 in the region from 4000 to 780 cm−1.
3.3. Catalytic Tests
The catalytic activity of all materials was tested for the conversion of propan-2-ol or butan-2-ol. It is known that kinetic analysis of the decomposition of alcohols is an informative test-reaction providing insight into the nature of active sites. Therefore, acetone or butanone is formed on basic sites upon dehydrogenation of 2-propanol and 2-butanol, respectively; and propene or butene is formed on acidic sites upon dehydration of the alcohols.
The set-up is equipped with a single down-stream reactor connected to a Hewlett Packard GC outfitted with a flame ionization detector. The reactor comprises a quartz-tube with 4 mm diameter and an oven. The catalyst with arbitrary particle size (0.02 g diluted in 0.13 g SiC) was fixed with quartz wool in the quartz-tube. Four different mass flow controllers save the gas-supply with helium, synthetic air, or hydrogen. In general, the catalyst was heated in a flow of 20 mL min−1 of hydrogen (MFC1) from ambient to elevated temperature of activation (300 °C) for 2 h. After reaching the reaction temperature, MFC1 was switched off and helium was led by MFC2 through the saturator. The saturator was filled with 2-propanol or butan-2-ol and cooled permanently to 13 °C and 8 °C respectively. The helium/propan-2-ol (or butan-2-ol) gas mixture was directed over the fixed bed reactor. Unreacted propan-2-ol (or butan-2-ol), dehydrogenation and dehydration products were analyzed by a GC. Separation of various components was done by a Supelco® wax-column.
All catalytic experiments have been done three times to check reproducibility. Catalyst stability as long term experiment and possible reuse after activation was not checked here explicitely.
4. Conclusions
The nanoscience and nanotechniques have brought new applications for CeO2-based materials, which are of great interest, due to their wide applications. In particular, these materials can be used as redox or oxygen storage promoters in the three-way catalysts, catalysts for H2 production from fuels, and solid state conductors for fuel cells [32].
This work has been focused on the controlled synthesis and characterization of cationic (CTAB)- and amphiphilic (P-123® block copolymer and Brij® 56)-templated ceria, zirconia, and ceria-zirconia mixed oxides from nitrate and iso-propoxide precursors, as basic heterogeneous catalysts. The results were compared with the samples prepared by the non-templated co-precipitation method. The modification of the samples with gold was carried out by the deposition precipitation method with urea.
Two test reactions were performed to verify their suitability for characterization of acidic and basic properties. The test reactions investigated in this work were 2-propanol and 2-butanol conversions in the gas phase. To evaluate the classification of catalysts, additional characterization methods applied to structural and morphological properties were explored. Specific surface area of the mixed metal oxides were determined by nitrogen physisorption (BET) analysis. Structural characterization was performed by powder X-ray diffraction (XRD). Other characterization methods, such as FTIR spectroscopy of adsorbed 2-propanol and pyridine as well as ammonia (NH3) and carbon dioxide (CO2) temperature programmed desorption (TPD), have been considered in order to study the types, strengths, and amounts of acid and base sites. The Au-amount of the gold supported catalyst was measured by atomic absorption spectroscopy (AAS).
As can be seen from N2-BET measurements, templated techniques led to the formation of high surface area mesoporous materials with unusually high activity and thermal stability. The surface areas of ceria-zirconia obtained by the conventional co-precipitation method are in the range of 15 m2/g. Surface areas of 65–125 m2/g were found for the materials obtained with templates. It was observed that the Au on the support does not influence the specific surface area. The pore structure is dominated by mesopores with pore-size distributions centered between about 3–7 nm for the samples prepared from the nitrate precursor and 5–15 nm for zirconia synthesized from the propoxide precursor. The contingent of mesopores was larger for the templated oxides in the order ZrO2-T < CeO2-ZrO2-T < CeO2-T < CeO2-ZrO2-NH3. The oxides prepared show unusually good thermal stability as a consequence of the maintained mesostructures after 6 h calcination at 600 °C. The method produces catalysts of known composition directly from solution with a high degree of phase homogeneity as demonstrated by XRD. Ceria and ceria-based materials correspond to the cubic fluorite structure, whereas the templated zirconia reveals the monocline structure. The formation of the mixed oxide was supported by the observed shift of the (111) diffraction angle. The acid site and basic site concentrations were calculated by analyzing the data of the TPD. The acidic site concentration was highly increased in the order ceria (13 µmol/g) < ceria-zirconia (93 µmol/g) < zirconia (173 µmol/g). ZrO2-T(propox.) only exhibits weak acidic sites with 59 µmol/g. The basic site concentration of ceria (7 µmol/g) was increased by incorporation of zirconium (13 µmol/g) and by deposition of Au with urea (15 µmol/g). IR experiments of adsorbed iso-propanol were used to investigate the interaction with the samples. Acetone was formed over reduced CeO2-ZrO2-T, oxidized ZrO2-T-new, and oxidized/reduced Au modified samples indicating the basic character of the catalysts. A stronger adsorption of 2-propanol was observed for the Au catalysts. Adsorption of pyridine indicates the presence of two different acidity strengths and no Brønsted acidity. The ex-situ reduced samples showed a stronger acid strength.
The highest conversion of 2-propanol to acetone and propene (69%) was achieved for Au/CeO2-ZrO2-T, which is a synthesized catalyst prepared with templates. The other gold catalysts Au/ZrO2-T and Au/CeO2-ZrO2-NH3 have shown lower conversions (54% and 35%, respectively). For the templated CeO2-ZrO2-T and co- precipitated CeO2-ZrO2-NH3, the conversion decreased from 8% to 4%, respectively. The selectivity for acetone decreased at the same time from 95.9% to 53%. By deposition of Au onto ceria-zirconia, the conversion increased from 8 to 69% with a selectivity of almost 100%. In contrast to 2-propanol conversion, the selectivities for butanone are lower than those for acetone formation. The templated samples showed high butanone selectivities up to 97% with 65% conversion for Au/CeO2-ZrO2-T, whereas the non-templated materials reveal low selectivities in the range Au/N600 (11%) < Au/CeO2 (3.7%). The reproducibility of the catalysts was verified and clearly showed the same activity.
However, when analyzing the acid-base properties different densities of acid and base sites have been found. Furthermore, catalytic performances in the conversion of 2-propanol and 2-butanol resulted in different activities and selectivities. In general, the density of acid sites was decreased, whereas the density of basic site was increased by modification with Au or incorporation of zirconia in case of mixed oxides.
Author Contributions
Conceptualization, M.A.C.M.; Data curation, M.A.C.M.; Investigation, M.A.C.M.; Methodology, M.A.C.M.; Project administration, C.B.; Supervision, C.B.; Writing–review & editing, M.G.
Funding
This research received no external funding.
Acknowledgments
The authors acknowledge support by the Open Access Publication Funds of the TU Dresden.
Conflicts of Interest
The authors declare no conflict of interest.
References
- Trovarelli, A. Catalytic Properties of Ceria and CeO2-Containing Materials. Catal. Rev. 1996, 38, 439–520. [Google Scholar] [CrossRef]
- Minh, N.Q.; Takahashi, T. Science and Technology of Ceramic Fuel Cells. Available online: http://www.123library.org/book_details/?id=39537 (accessed on 27 August 2018).
- Abdel-Mageed, A.M.; Kučerová, G.; Bansmann, J.; Behm, R.J. Active Au Species During the Low-Temperature Water Gas Shift Reaction on Au/CeO2: A Time-Resolved Operando XAS and DRIFTS Study. ACS Catal. 2017, 7, 6471–6484. [Google Scholar] [CrossRef]
- Campo, B.; Santori, G.; Petit, C.; Volpe, M. Liquid phase hydrogenation of crotonaldehyde over Au/CeO2 catalysts. Appl. Catal. Gen. 2009, 359, 79–83. [Google Scholar] [CrossRef]
- Karpenko, A.; Denkwitz, Y.; Plzak, V.; Cai, J.; Leppelt, R.; Schumacher, B.; Behm, R.J. Low-temperature water-gas shift reaction on Au/CeO2 catalysts—The influence of catalyst pre-treatment on the activity and deactivation in idealized reformate. Catal. Lett. 2007, 116, 105–115. [Google Scholar] [CrossRef]
- Meunier, F.C.; Reid, D.; Goguet, A.; Shekhtman, S.; Hardacre, C.; Burch, R.; Deng, W.; Flytzani-Stephanopoulos, M. Quantitative analysis of the reactivity of formate species seen by DRIFTS over a Au/Ce(La)O2 water–gas shift catalyst: First unambiguous evidence of the minority role of formates as reaction intermediates. J. Catal. 2007, 247, 277–287. [Google Scholar] [CrossRef] [Green Version]
- Rodriguez, J.A.; Hanson, J.C.; Stacchiola, D.; Senanayake, S.D. In situ/operando studies for the production of hydrogen through the water-gas shift on metal oxide catalysts. Phys. Chem. Chem. Phys. 2013, 15, 12004–12025. [Google Scholar] [CrossRef] [PubMed]
- Damyanova, S.; Pawelec, B.; Arishtirova, K.; Huerta, M.V.M.; Fierro, J.L.G. Study of the surface and redox properties of ceria–zirconia oxides. Appl. Catal. Gen. 2008, 337, 86–96. [Google Scholar] [CrossRef]
- Mori, K.; Miyauchi, Y.; Kuwahara, Y.; Yamashita, H. Shape Effect of MnOx-Decorated CeO2 Catalyst in Diesel Soot Oxidation. Bull. Chem. Soc. Jpn. 2017, 90, 556–564. [Google Scholar] [CrossRef]
- Pol, V.G.; Pol, S.V.; Gedanken, A.; Kessler, V.G.; Seisenbaeva, G.A.; Sung, M.-G.; Asai, S. Applied Magnetic Field Rejects the Coating of Ferromagnetic Carbon from the Surface of Ferromagnetic Cobalt: RAPET of CoZr2(acac)2(OiPr)8. J. Phys. Chem. B 2005, 109, 6121–6125. [Google Scholar] [CrossRef] [PubMed]
- Shanmugam, V.; Zapf, R.; Neuberg, S.; Hessel, V.; Kolb, G. Effect of ceria and zirconia promotors on Ni/SBA-15 catalysts for coking and sintering resistant steam reforming of propylene glycol in microreactors. Appl. Catal. B Environ. 2017, 203, 859–869. [Google Scholar] [CrossRef]
- Kubo, H.; Ohshima, Y.; Yamashita, T.; Kikuhara, S.; Saitoh, N.; Yoshizawa, N.; Nakagoe, O.; Tanabe, S. Mechanism of Soot Oxidation over CeO2–ZrO2 under O2 Flow. Bull. Chem. Soc. Jpn. 2017, 91, 437–443. [Google Scholar] [CrossRef]
- Dong, Y.; Wang, H.; Chen, I.-W. Electrical and hydrogen reduction enhances kinetics in doped zirconia and ceria: I. grain growth study. J. Am. Ceram. Soc. 2016, 100, 876–886. [Google Scholar] [CrossRef]
- Azambre, B.; Atribak, I.; Bueno-López, A.; García-García, A. Probing the Surface of Ceria−Zirconia Catalysts Using NOx Adsorption/Desorption: A First Step Toward the Investigation of Crystallite Heterogeneity. J. Phys. Chem. C 2010, 114, 13300–13312. [Google Scholar] [CrossRef]
- de Rivas, B.; López-Fonseca, R.; González-Velasco, J.R.; Gutiérrez-Ortiz, J.I. On the mechanism of the catalytic destruction of 1,2-dichloroethane over Ce/Zr mixed oxide catalysts. J. Mol. Catal. Chem. 2007, 278, 181–188. [Google Scholar] [CrossRef]
- Monte, R.D.; Kašpar, J. Nanostructured CeO2–ZrO2 mixed oxides. J. Mater. Chem. 2005, 15, 633–648. [Google Scholar] [CrossRef]
- Moretti, E.; Storaro, L.; Talon, A.; Chitsazan, S.; Garbarino, G.; Busca, G.; Finocchio, E. Ceria-zirconia based catalysts for ethanol steam reforming. Fuel 2015, 153, 166–175. [Google Scholar] [CrossRef]
- Reddy, B.M.; Reddy, G.K.; Katta, L. Structural characterization and dehydration activity of CeO2–SiO2 and CeO2–ZrO2 mixed oxides prepared by a rapid microwave-assisted combustion synthesis method. J. Mol. Catal. Chem. 2010, 319, 52–57. [Google Scholar] [CrossRef]
- Wang, B.; Wu, X.; Ran, R.; Si, Z.; Weng, D. IR characterization of propane oxidation on Pt/CeO2–ZrO2: The reaction mechanism and the role of Pt. J. Mol. Catal. Chem. 2012, 356, 100–105. [Google Scholar] [CrossRef]
- Sugiura, M.; Ozawa, M.; Suda, A.; Suzuki, T.; Kanazawa, T. Development of Innovative Three-Way Catalysts Containing Ceria–Zirconia Solid Solutions with High Oxygen Storage/Release Capacity. Bull. Chem. Soc. Jpn. 2005, 78, 752–767. [Google Scholar] [CrossRef]
- Kaspar, J.; Fornasiero, P. Structural properties and thermal stability of ceria-zirconia and related materials. In Catalysis by Ceria and Related Materials; Catalytic Science Series; Imperial College Press (distributed by World Scientific Publishing Co.): London, UK, 2002; pp. 217–241. [Google Scholar]
- Mamontov, E.; Egami, T.; Brezny, R.; Koranne, M.; Tyagi, S. Lattice Defects and Oxygen Storage Capacity of Nanocrystalline Ceria and Ceria-Zirconia. J. Phys. Chem. B 2000, 104, 11110–11116. [Google Scholar] [CrossRef]
- Corti, C.W.; Holliday, R.J.; Thompson, D.T. Commercial aspects of gold catalysis. Catal. Gold 2005, 291, 253–261. [Google Scholar] [CrossRef]
- Rynkowski, J.M.; Dobrosz-Gomez, I. Ceria -zirconia supported gold catalysts. In Annales Universitatis Marie Curie-Sklodowska Lublin; vol. LXIV, 14 Sectio AA; Maria Curie Sklodowska University: Lublin, Poland, 2009. [Google Scholar]
- Grünert, W. Oxidation Catalysis over Gold–New Insight into Active Sites and Reaction Mechanisms. In 47. Jahrestreffen Deutscher Katalytiker; Weimar, Germany, 2014. [Google Scholar]
- Grunwaldt, J.-D.; Baiker, A. Gold/Titania interfaces and their role in carbon monoxide oxidation. J. Phys. Chem. B 1999, 103, 1002–1012. [Google Scholar] [CrossRef]
- Wang, Y.; Widmann, D.; Lehnert, F.; Gu, D.; Schüth, F.; Behm, R.J. Avoiding Self-Poisoning: A Key Feature for the High Activity of Au/Mg(OH)2 Catalysts in Continuous Low-Temperature CO Oxidation. Angew. Chem. Int. Ed. 2017, 56, 9597–9602. [Google Scholar] [CrossRef] [PubMed]
- Smit, G.; Lazar, K.; Craje, M.W.J. Influence of water vapour on low-temperature CO oxidation over Au/Fe2O3 catalyst. Croat. Chem. Acta 2007, 80, 141–145. [Google Scholar]
- Xu, Q.; Kharas, K.C.C.; Datye, A.K. The Preparation of Highly Dispersed Au/Al2O3 by Aqueous Impregnation. Catal. Lett. 2003, 85, 229–235. [Google Scholar] [CrossRef]
- Pop, M. Variation of acid-base- and redoxproperties in CeO2-ZrO2- mixed oxides. Master’s Thesis, Technische Universität München, Munich, Germany, 2010. [Google Scholar]
- Brunauer, S.; Emmett, P.H.; Teller, E. Adsorption of Gases in Multimolecular Layers. J. Am. Chem. Soc. 1938, 60, 309–319. [Google Scholar] [CrossRef]
- Yuan, Q.; Duan, H.-H.; Li, L.-L.; Sun, L.-D.; Zhang, Y.-W.; Yan, C.-H. Controlled synthesis and assembly of ceria-based nanomaterials. J. Colloid Interface Sci. 2009, 335, 151–167. [Google Scholar] [CrossRef] [PubMed]
Figure 1.
X-ray-diffractograms of ceria, zirconia, and ceria-zirconia mixed oxides prepared by different methods.
Figure 1.
X-ray-diffractograms of ceria, zirconia, and ceria-zirconia mixed oxides prepared by different methods.
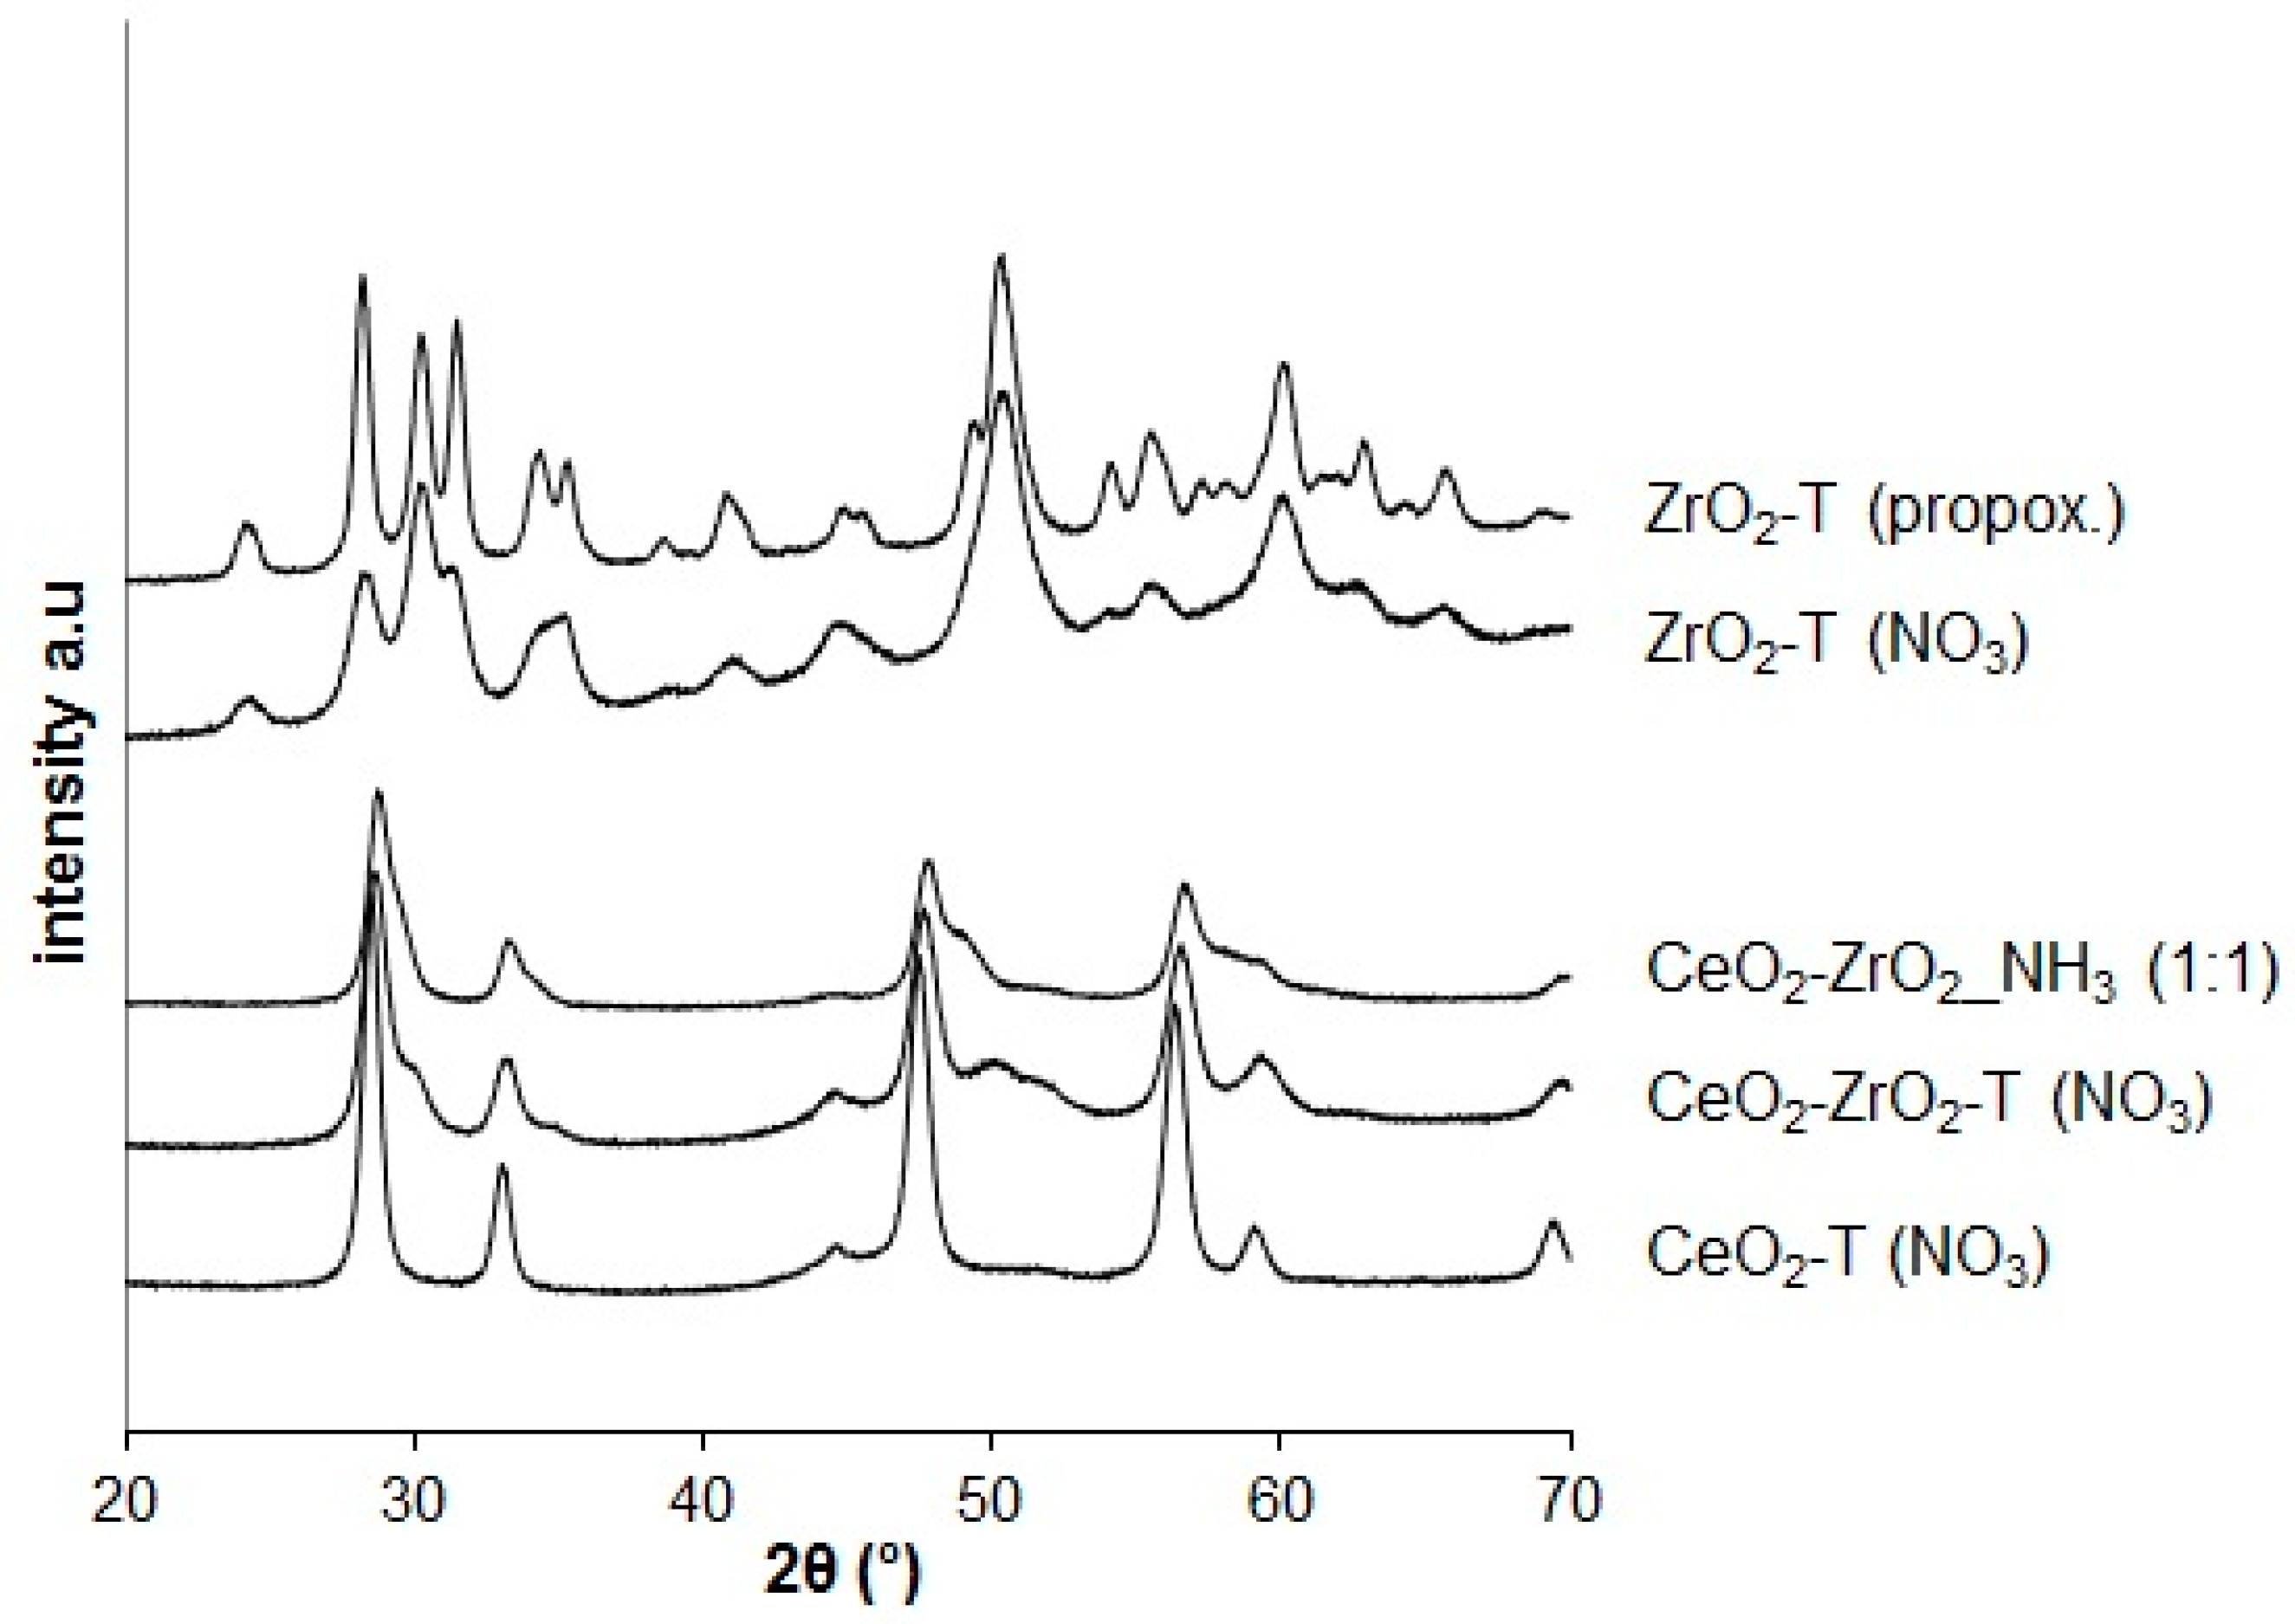
Figure 2.
X-Ray Diffraction (XRD) of Au-supported samples.
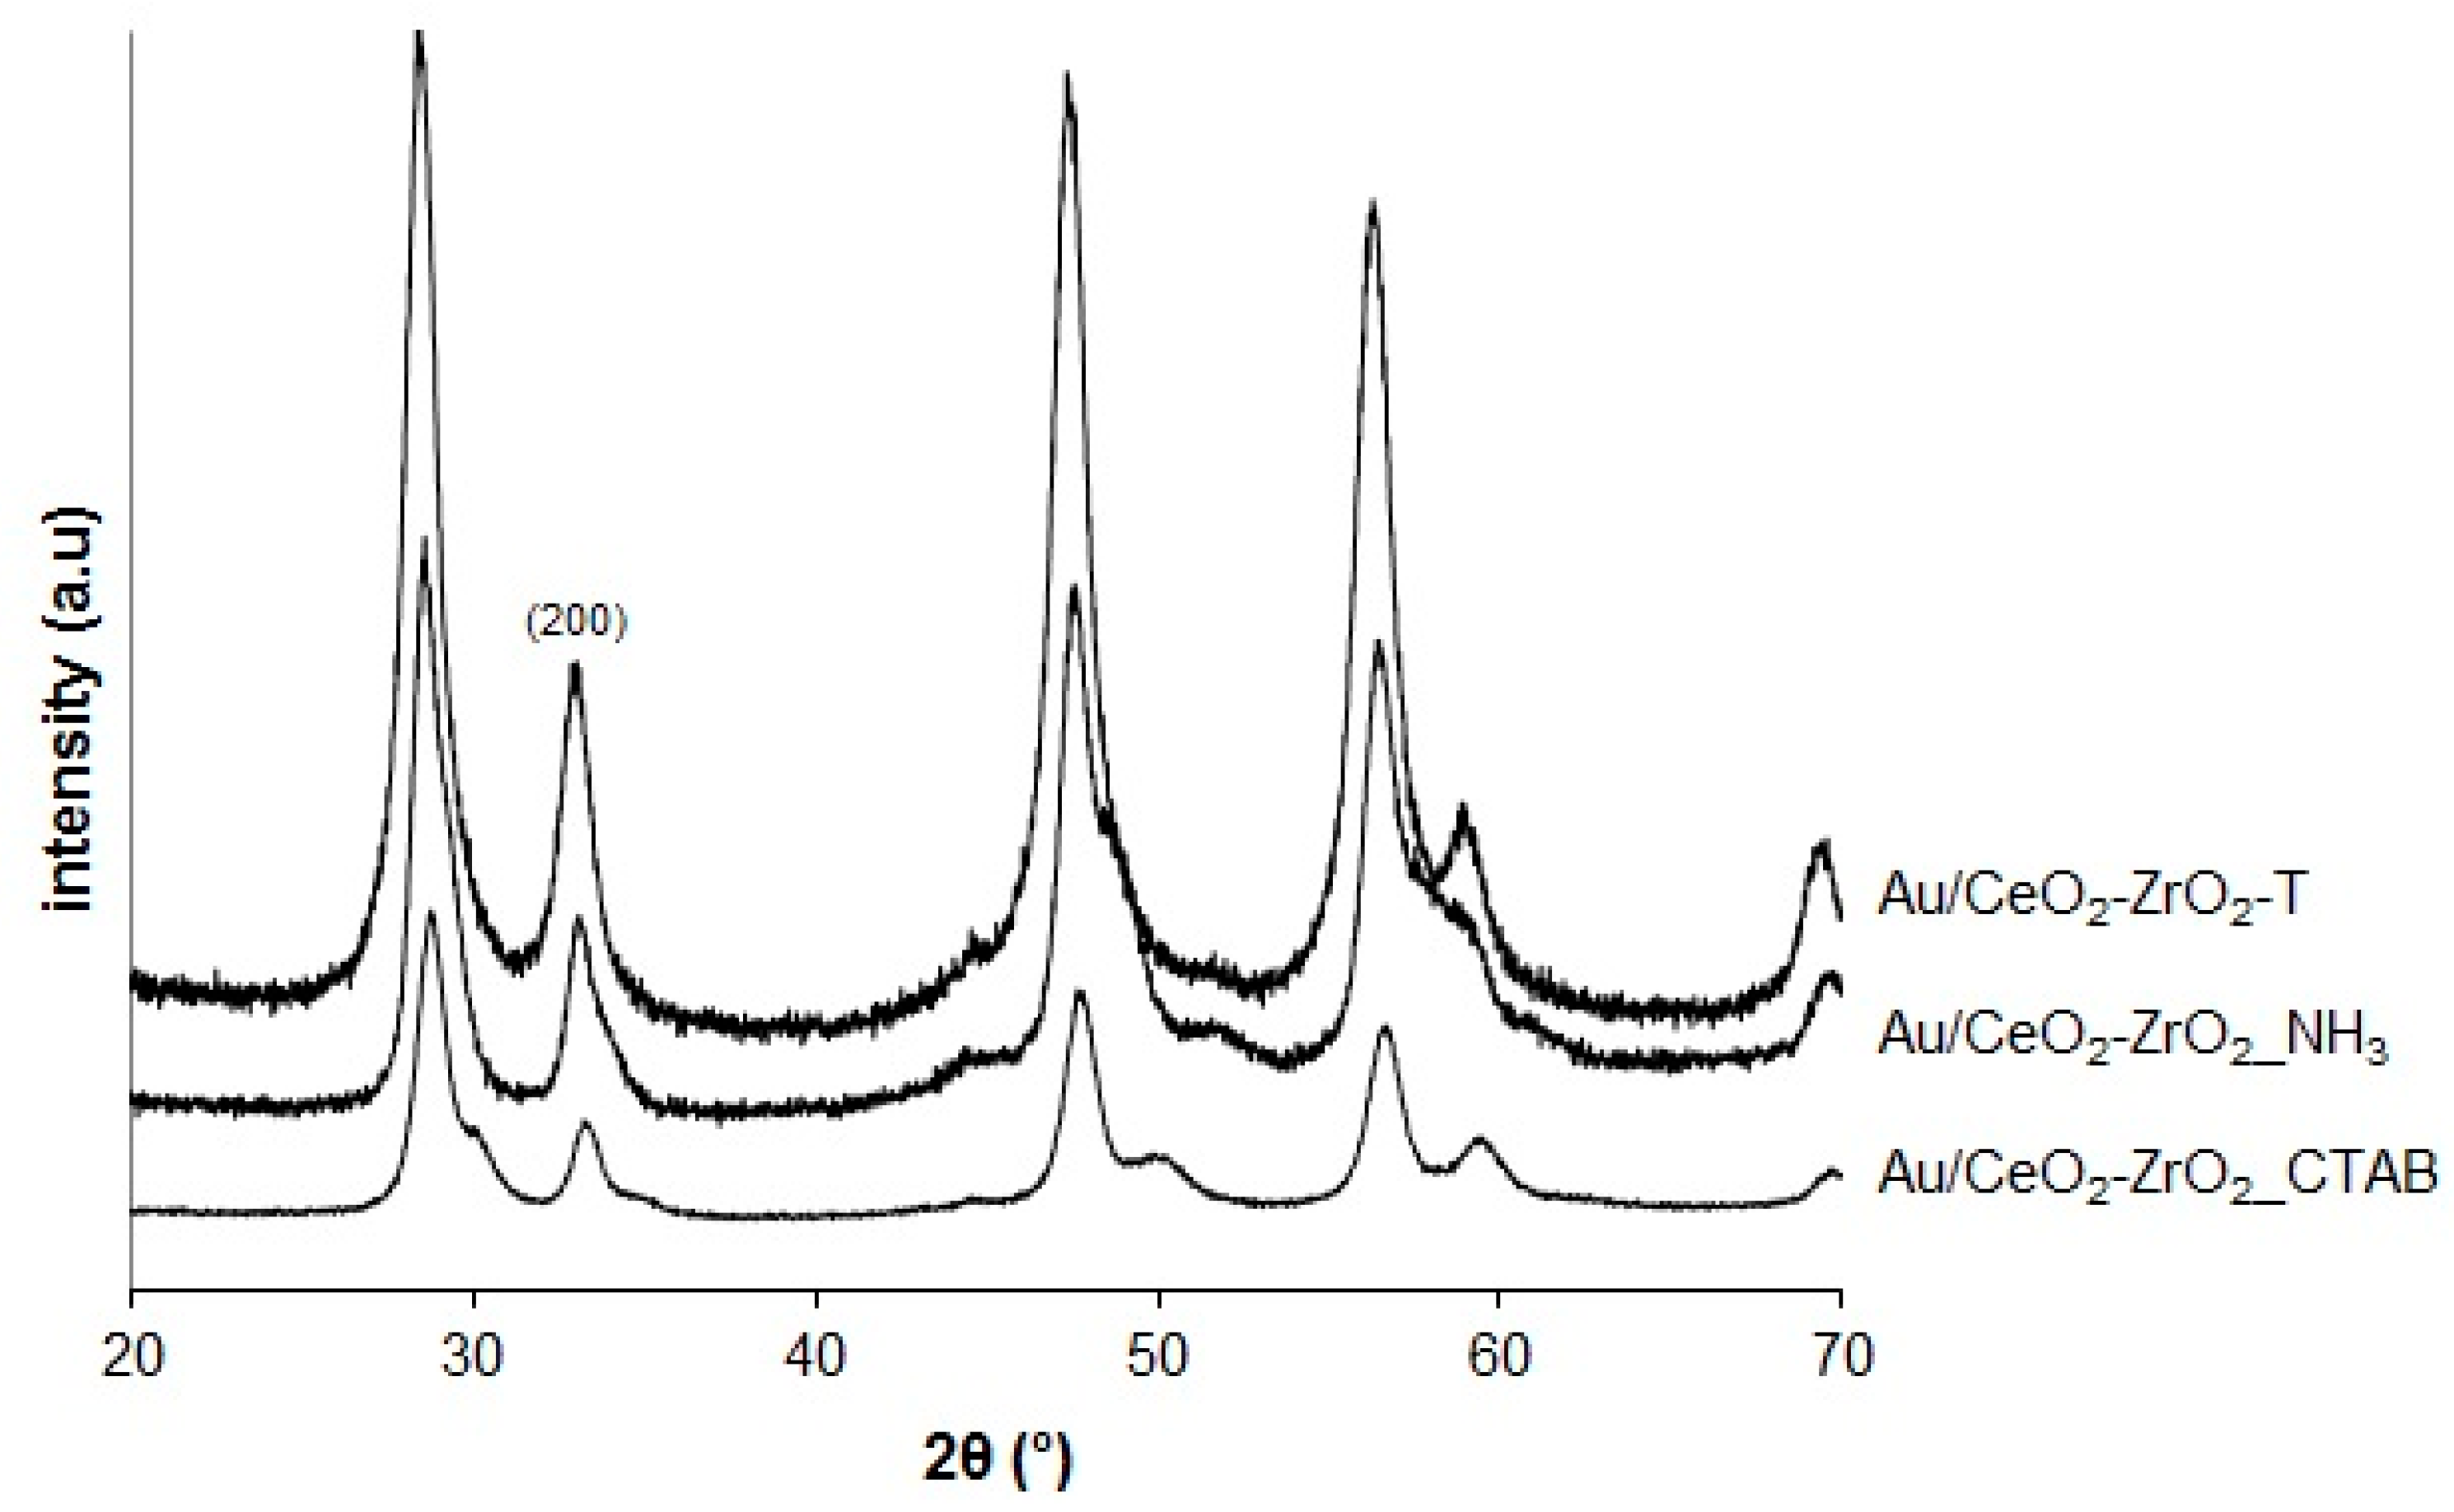
Figure 3.
NH3- Temperature Programmed Desorption (TPD) profiles of ceria and Au deposited on ceria (a) and of the supports (b).
Figure 3.
NH3- Temperature Programmed Desorption (TPD) profiles of ceria and Au deposited on ceria (a) and of the supports (b).
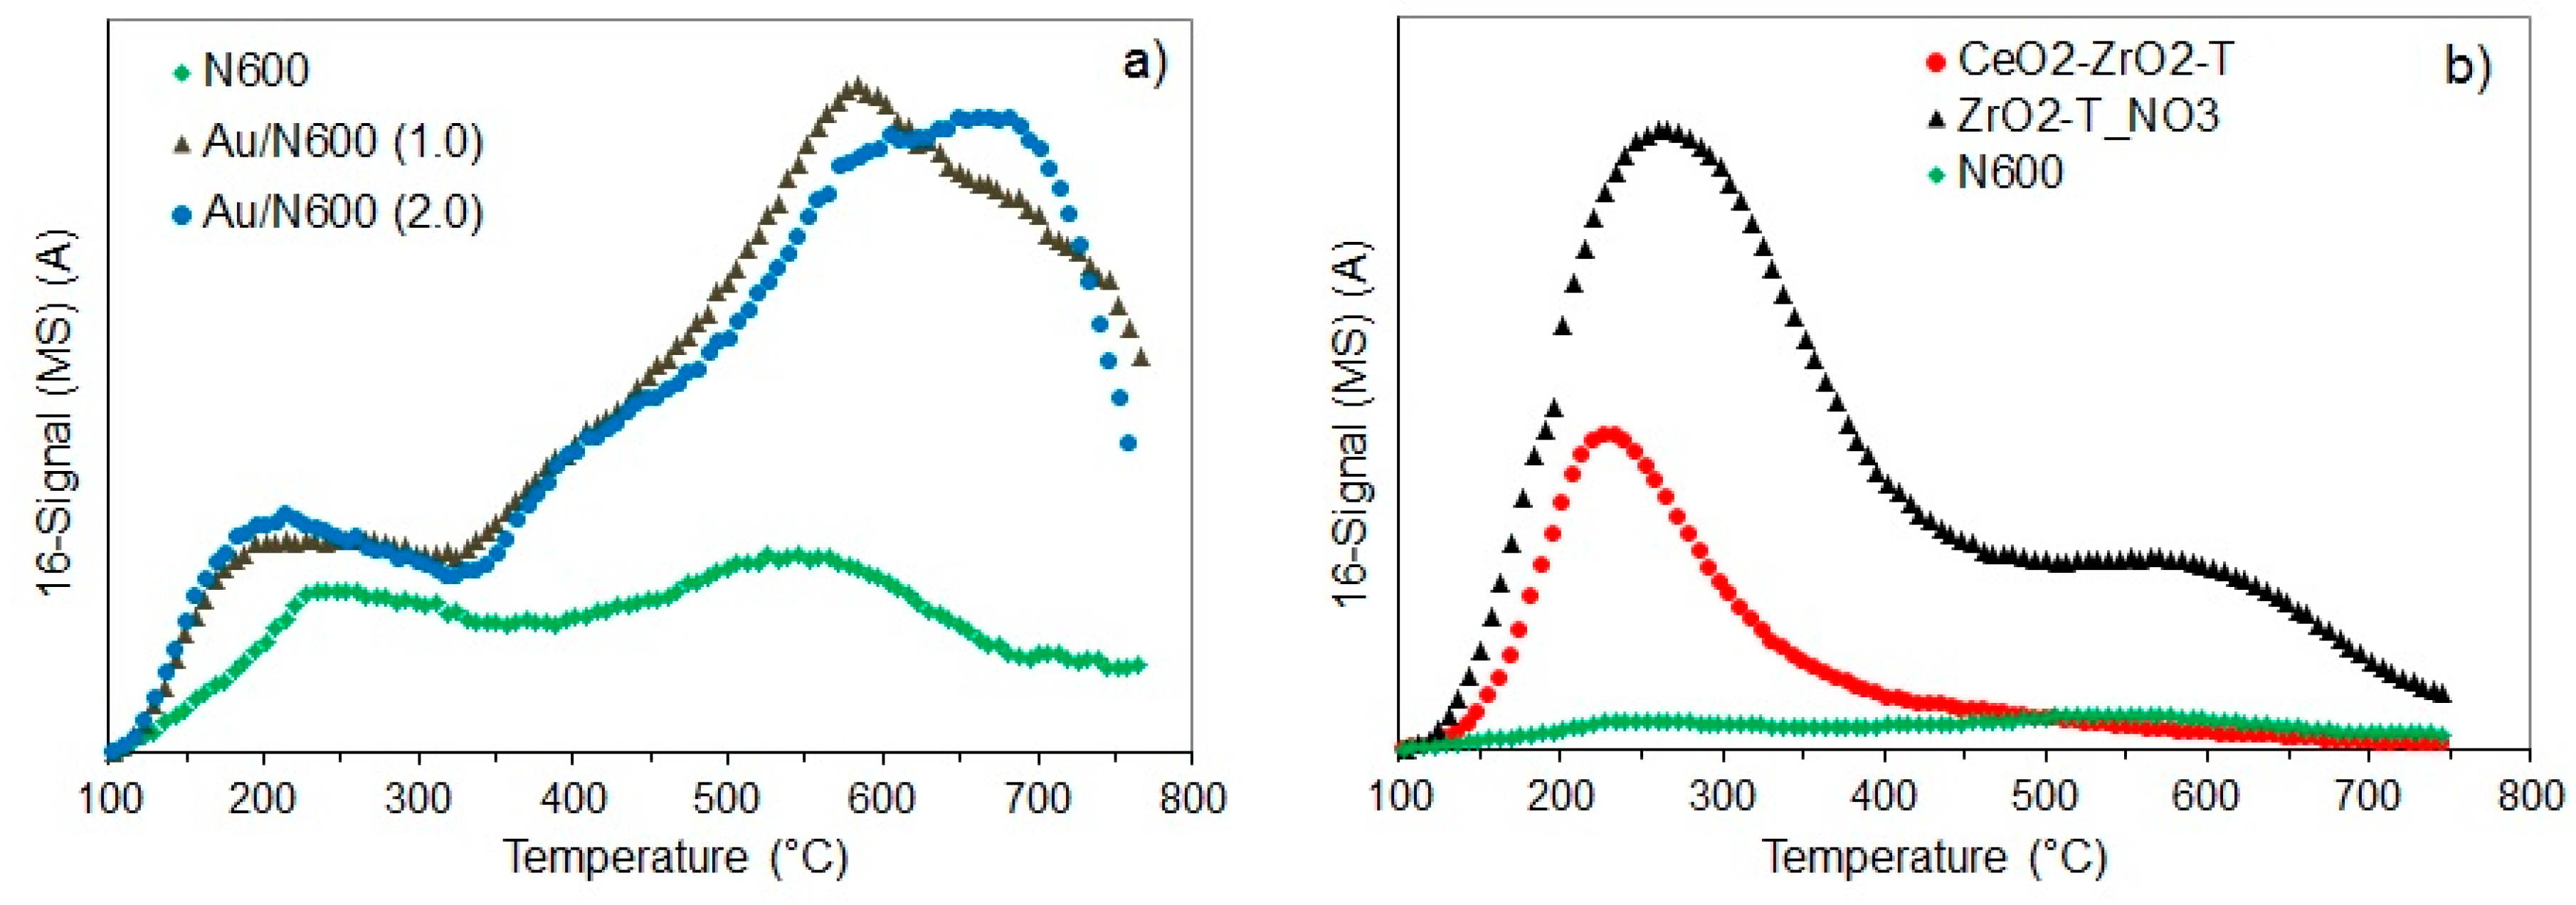
Figure 4.
CO2-TPD profiles of Au-supported catalysts (a) and supports (b) activated ex-situ at 300 °C in 100 mL/min H2.
Figure 4.
CO2-TPD profiles of Au-supported catalysts (a) and supports (b) activated ex-situ at 300 °C in 100 mL/min H2.
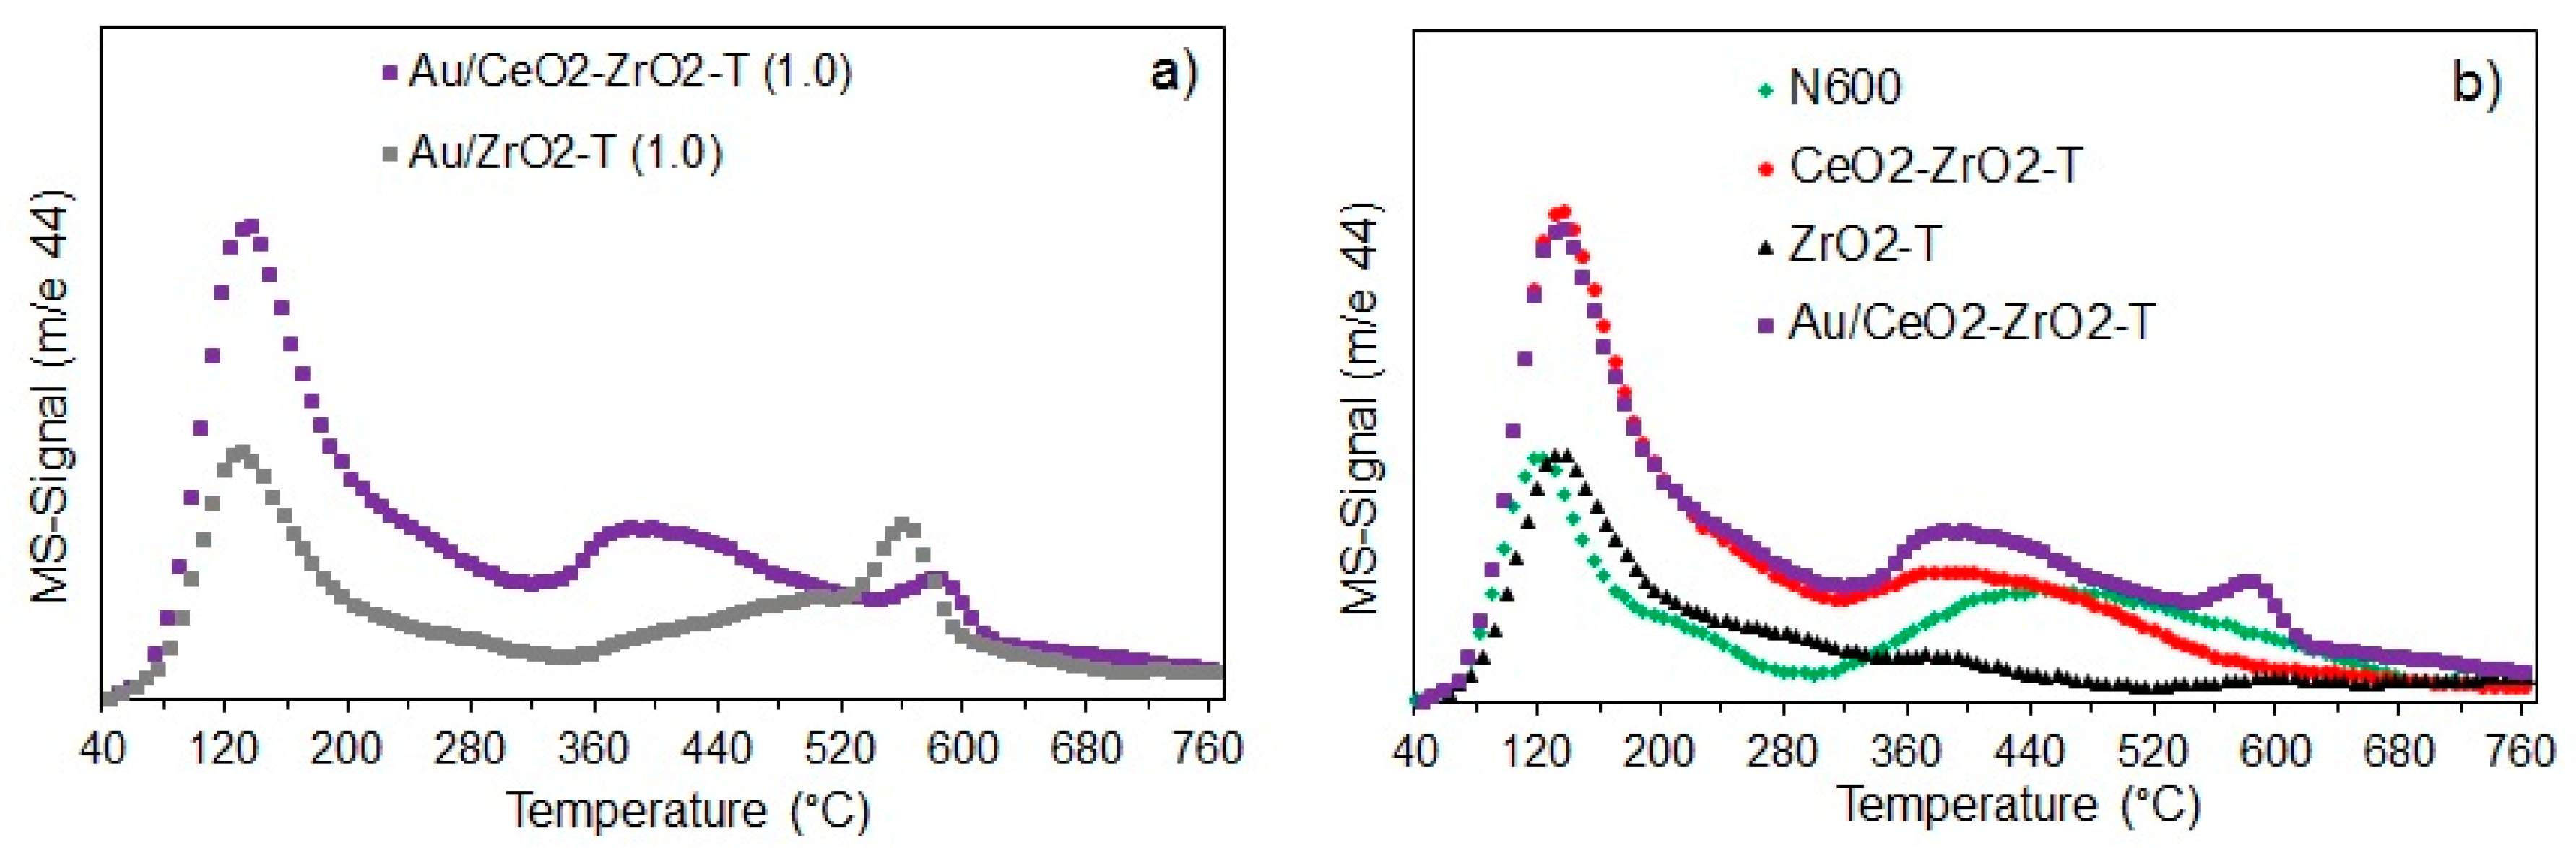
Figure 5.
IR spectra of activated (500 °C, 2 h, vacuum) oxidized CeO2-, ZrO2- and CeO2-ZrO2-catalysts at 50 °C.
Figure 5.
IR spectra of activated (500 °C, 2 h, vacuum) oxidized CeO2-, ZrO2- and CeO2-ZrO2-catalysts at 50 °C.
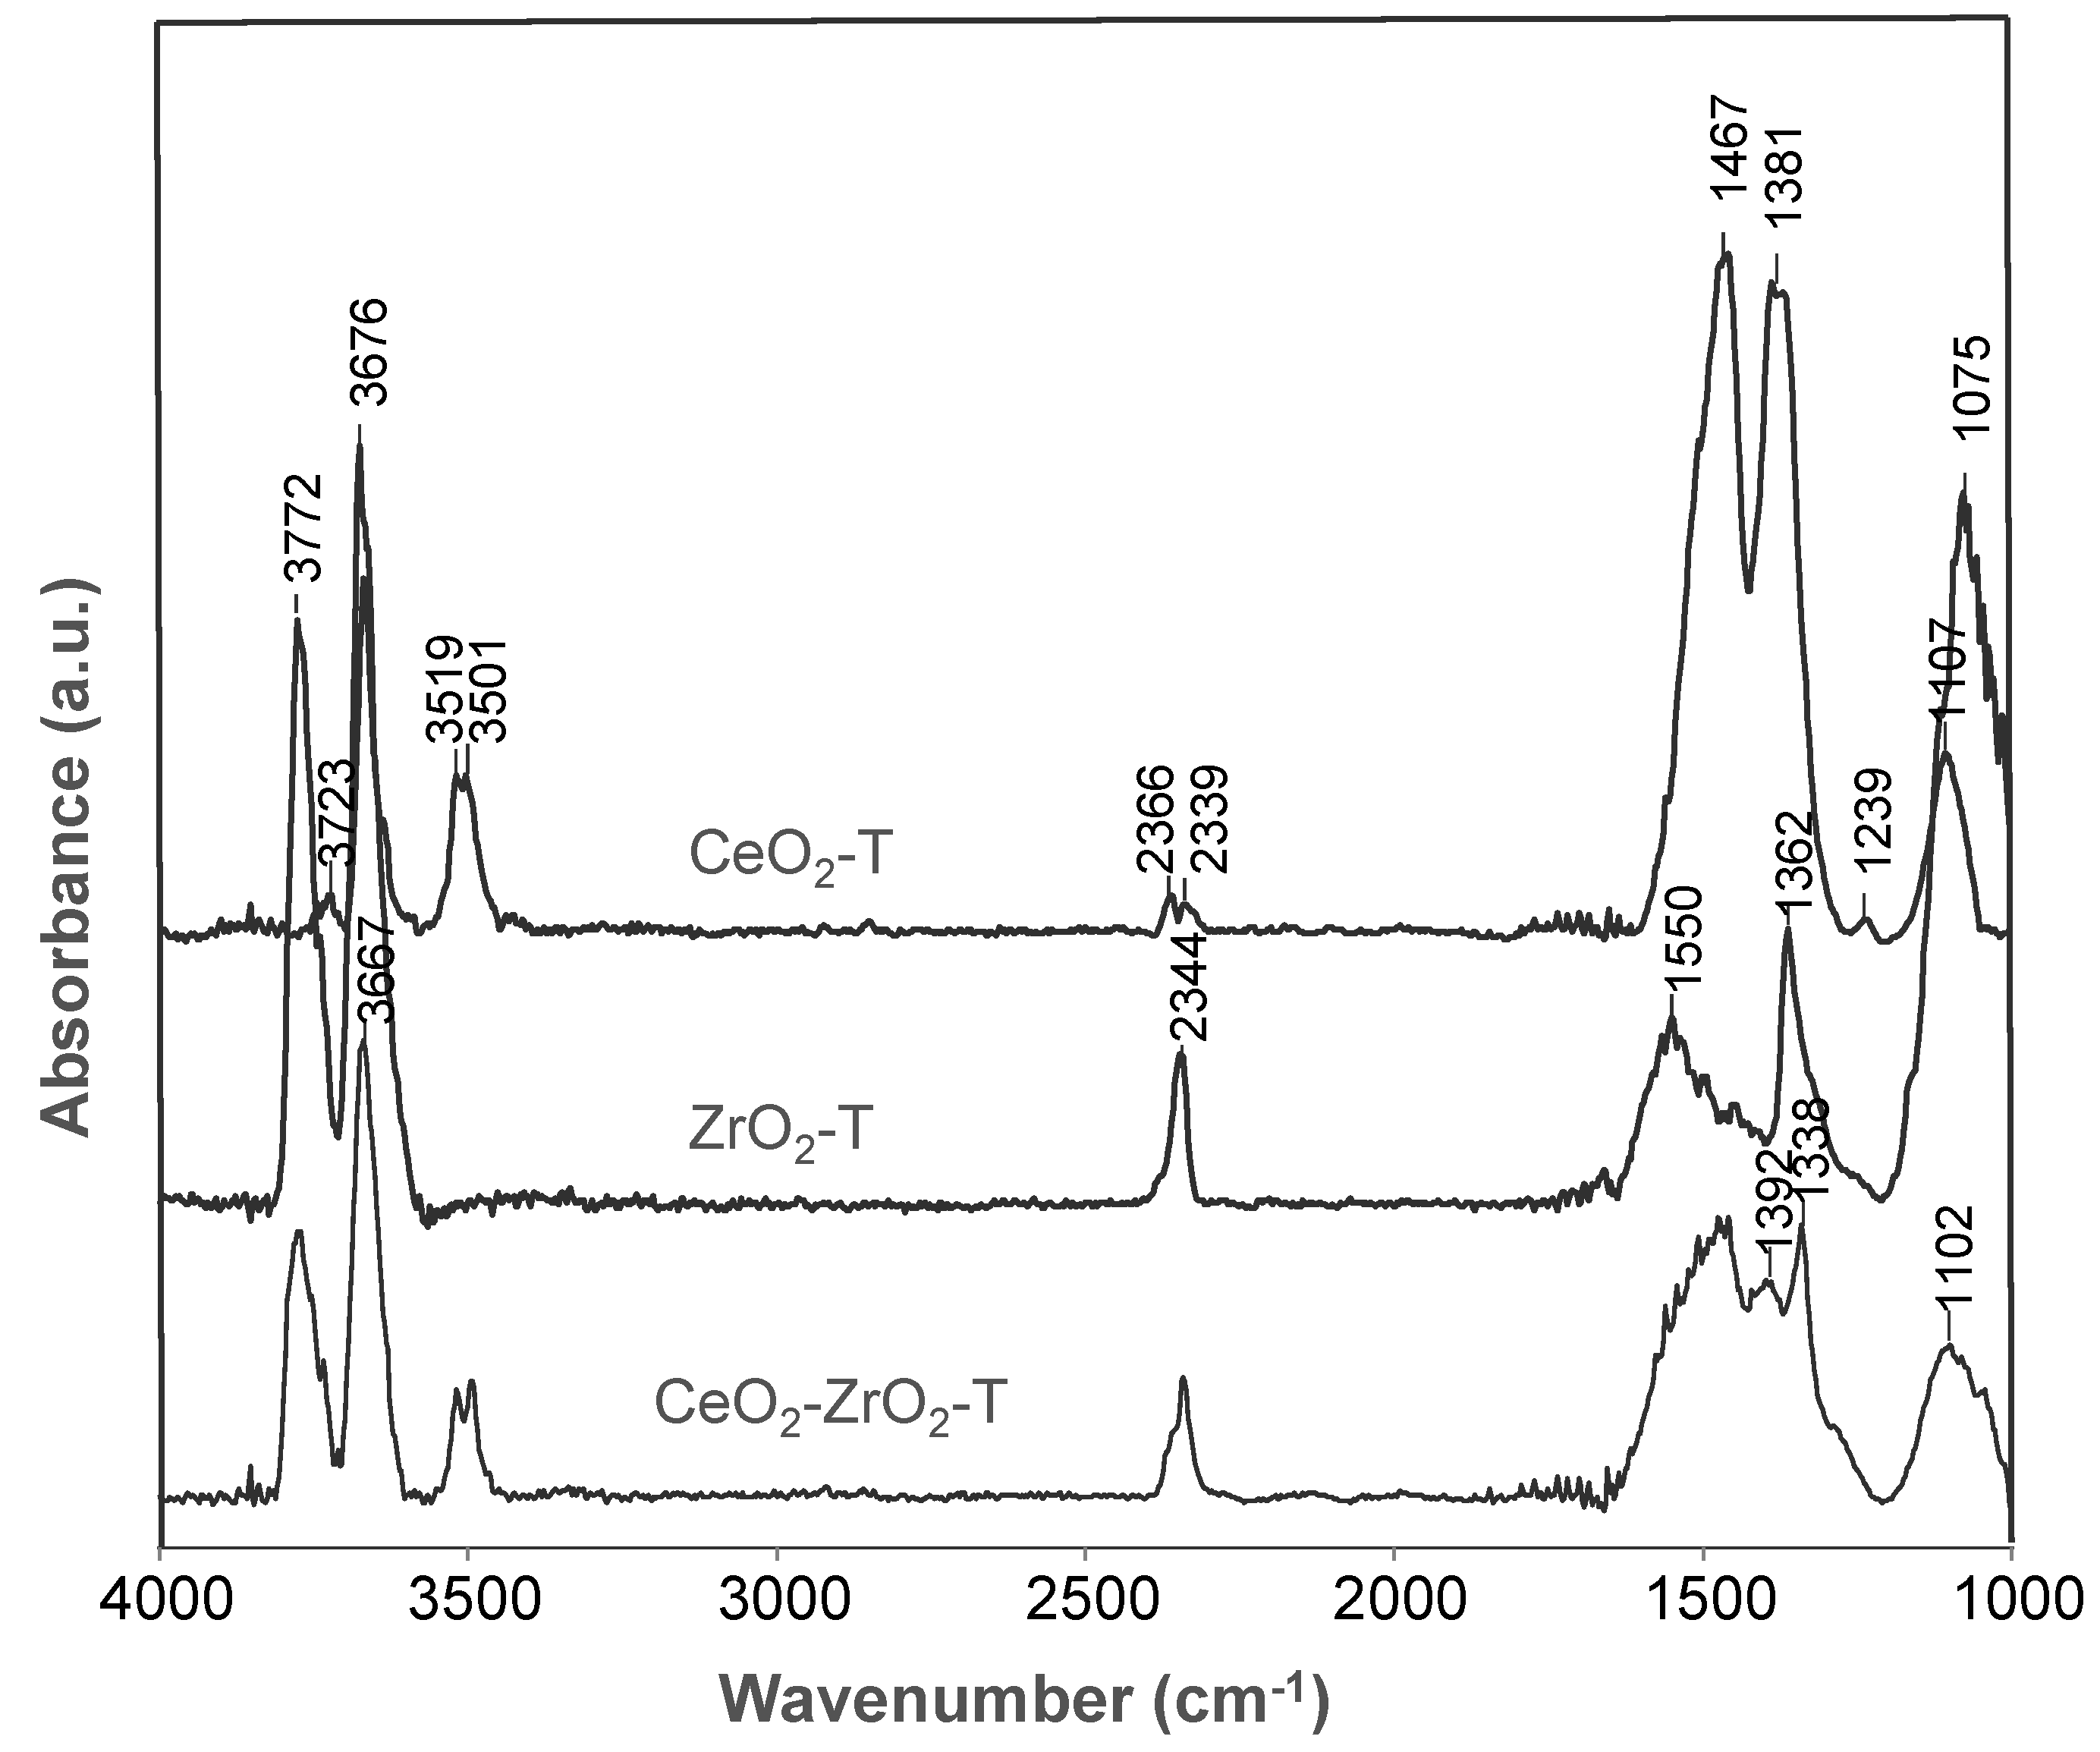
Figure 6.
IR spectra of activated (500 °C, 2 h, vacuum) oxidized Au/CeO2-ZrO2-catalysts at 50 °C.
Figure 7.
IR spectra of adsorbed iso-propanol on CeO2-T (A) and ZrO2-T (B).
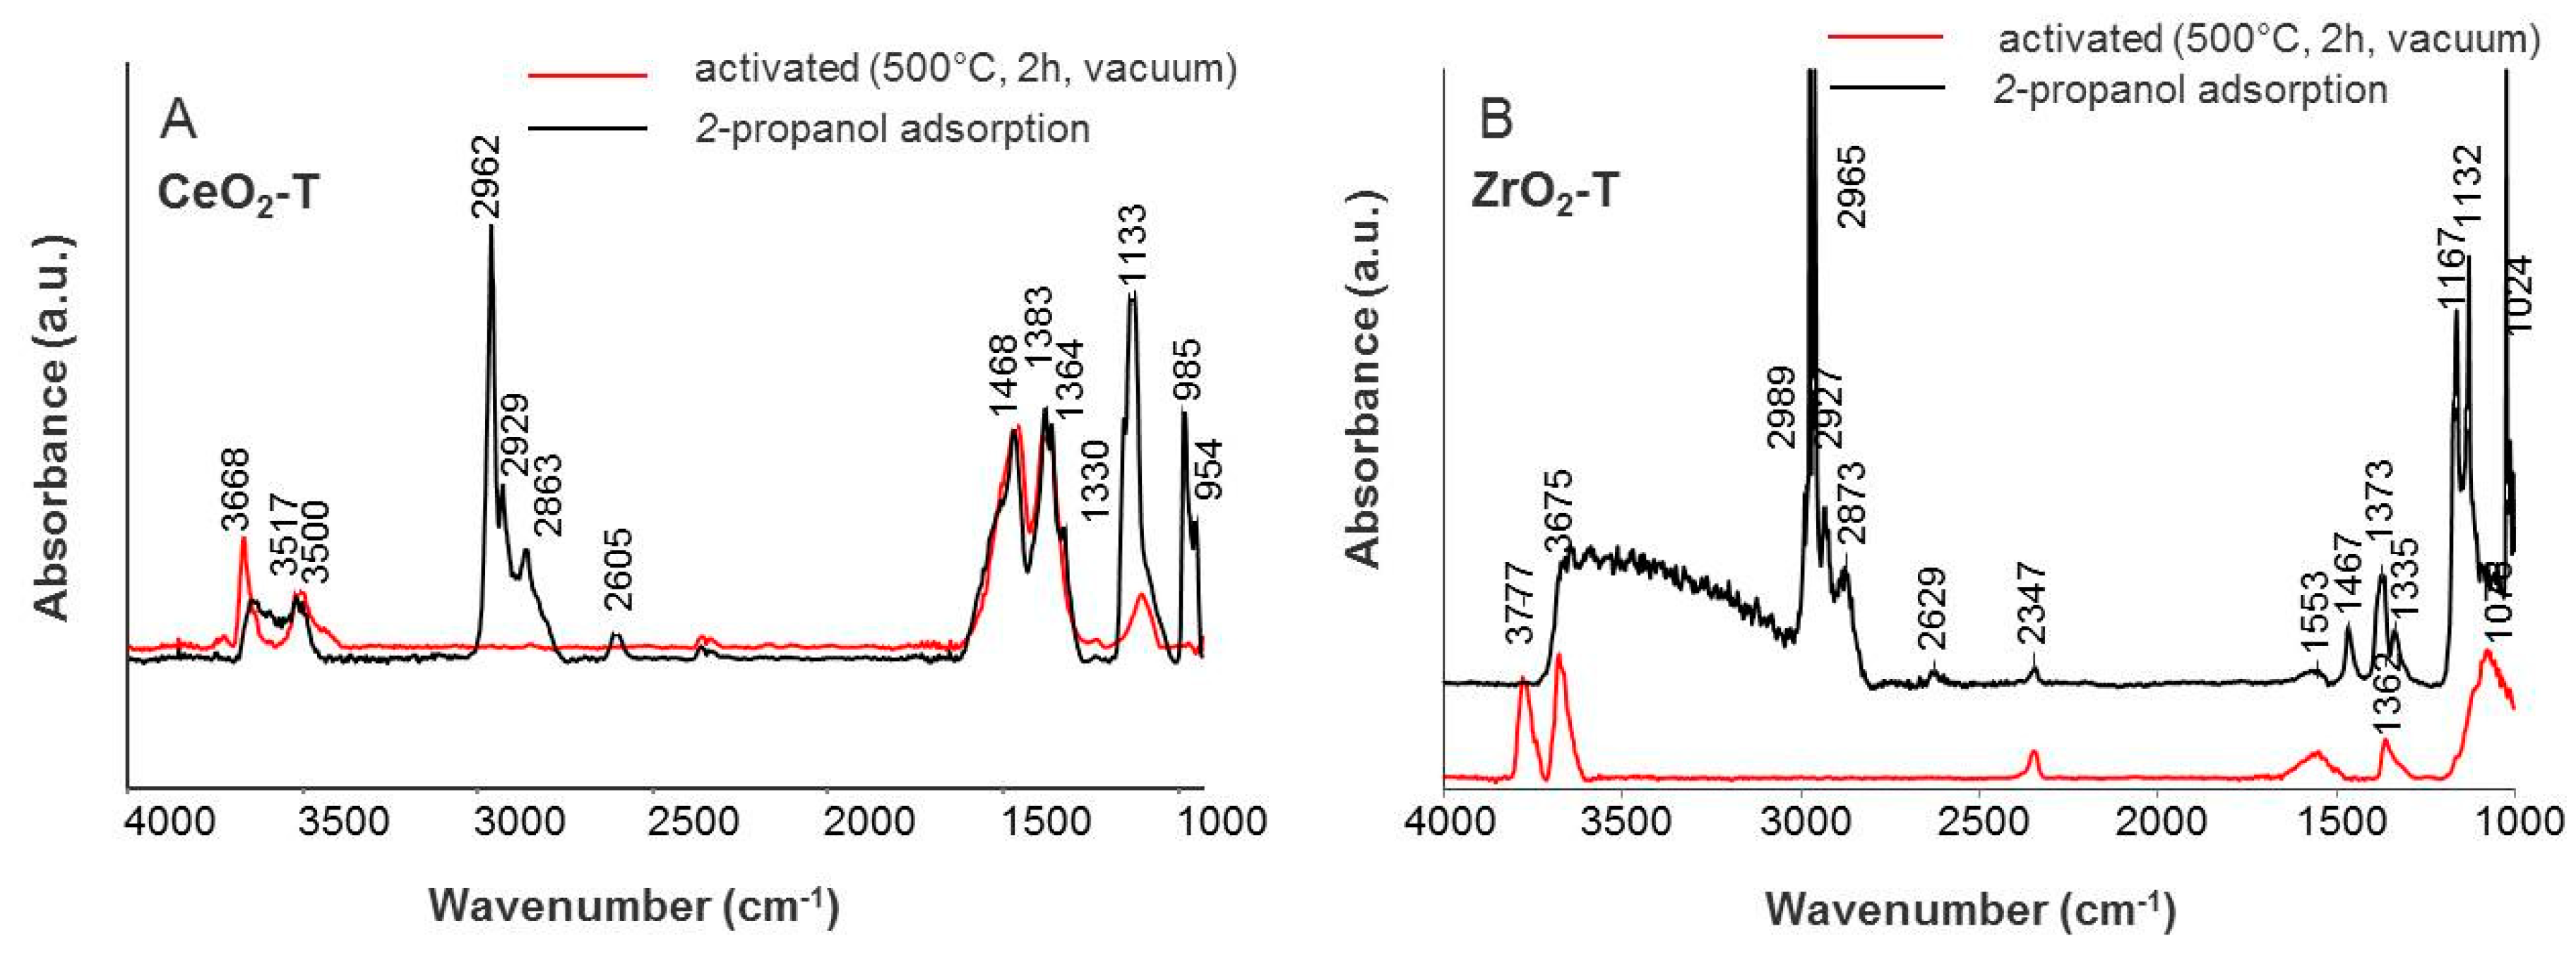
Figure 8.
IR spectra of adsorbed iso-propanol on CeO2–ZrO2-T.
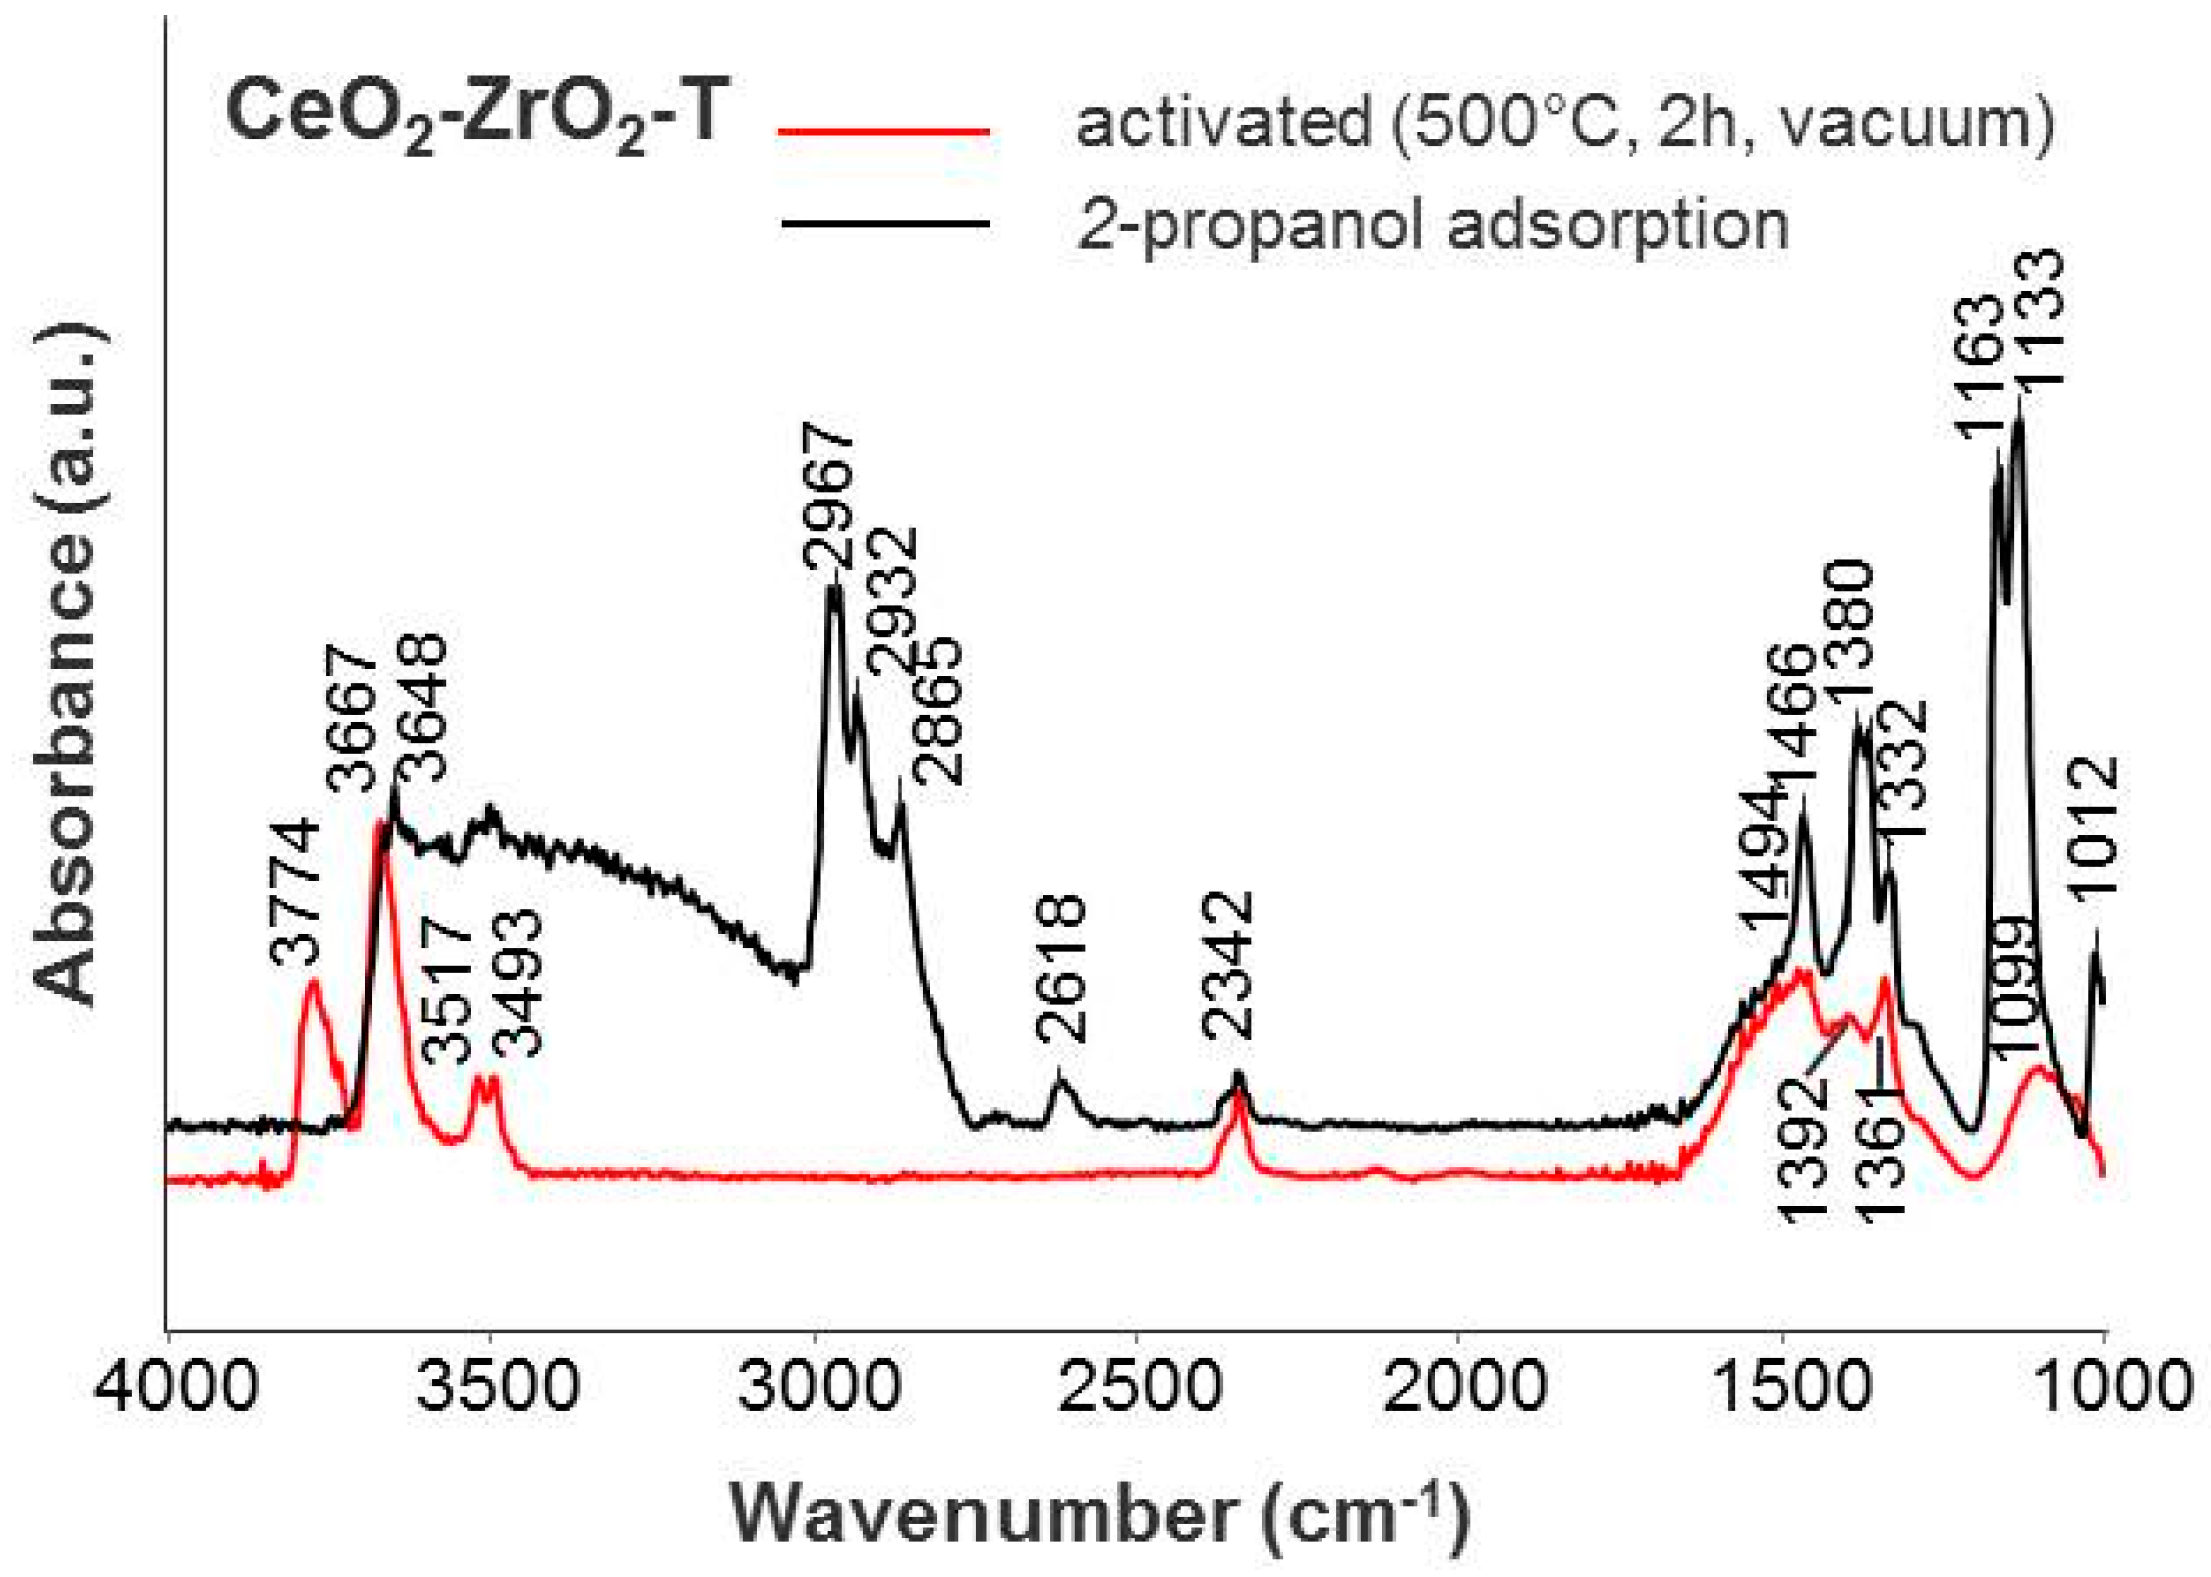
Figure 9.
IR spectra of adsorbed iso-propanol on (A) reduced, and (B) oxidized CeO2-ZrO2-T.
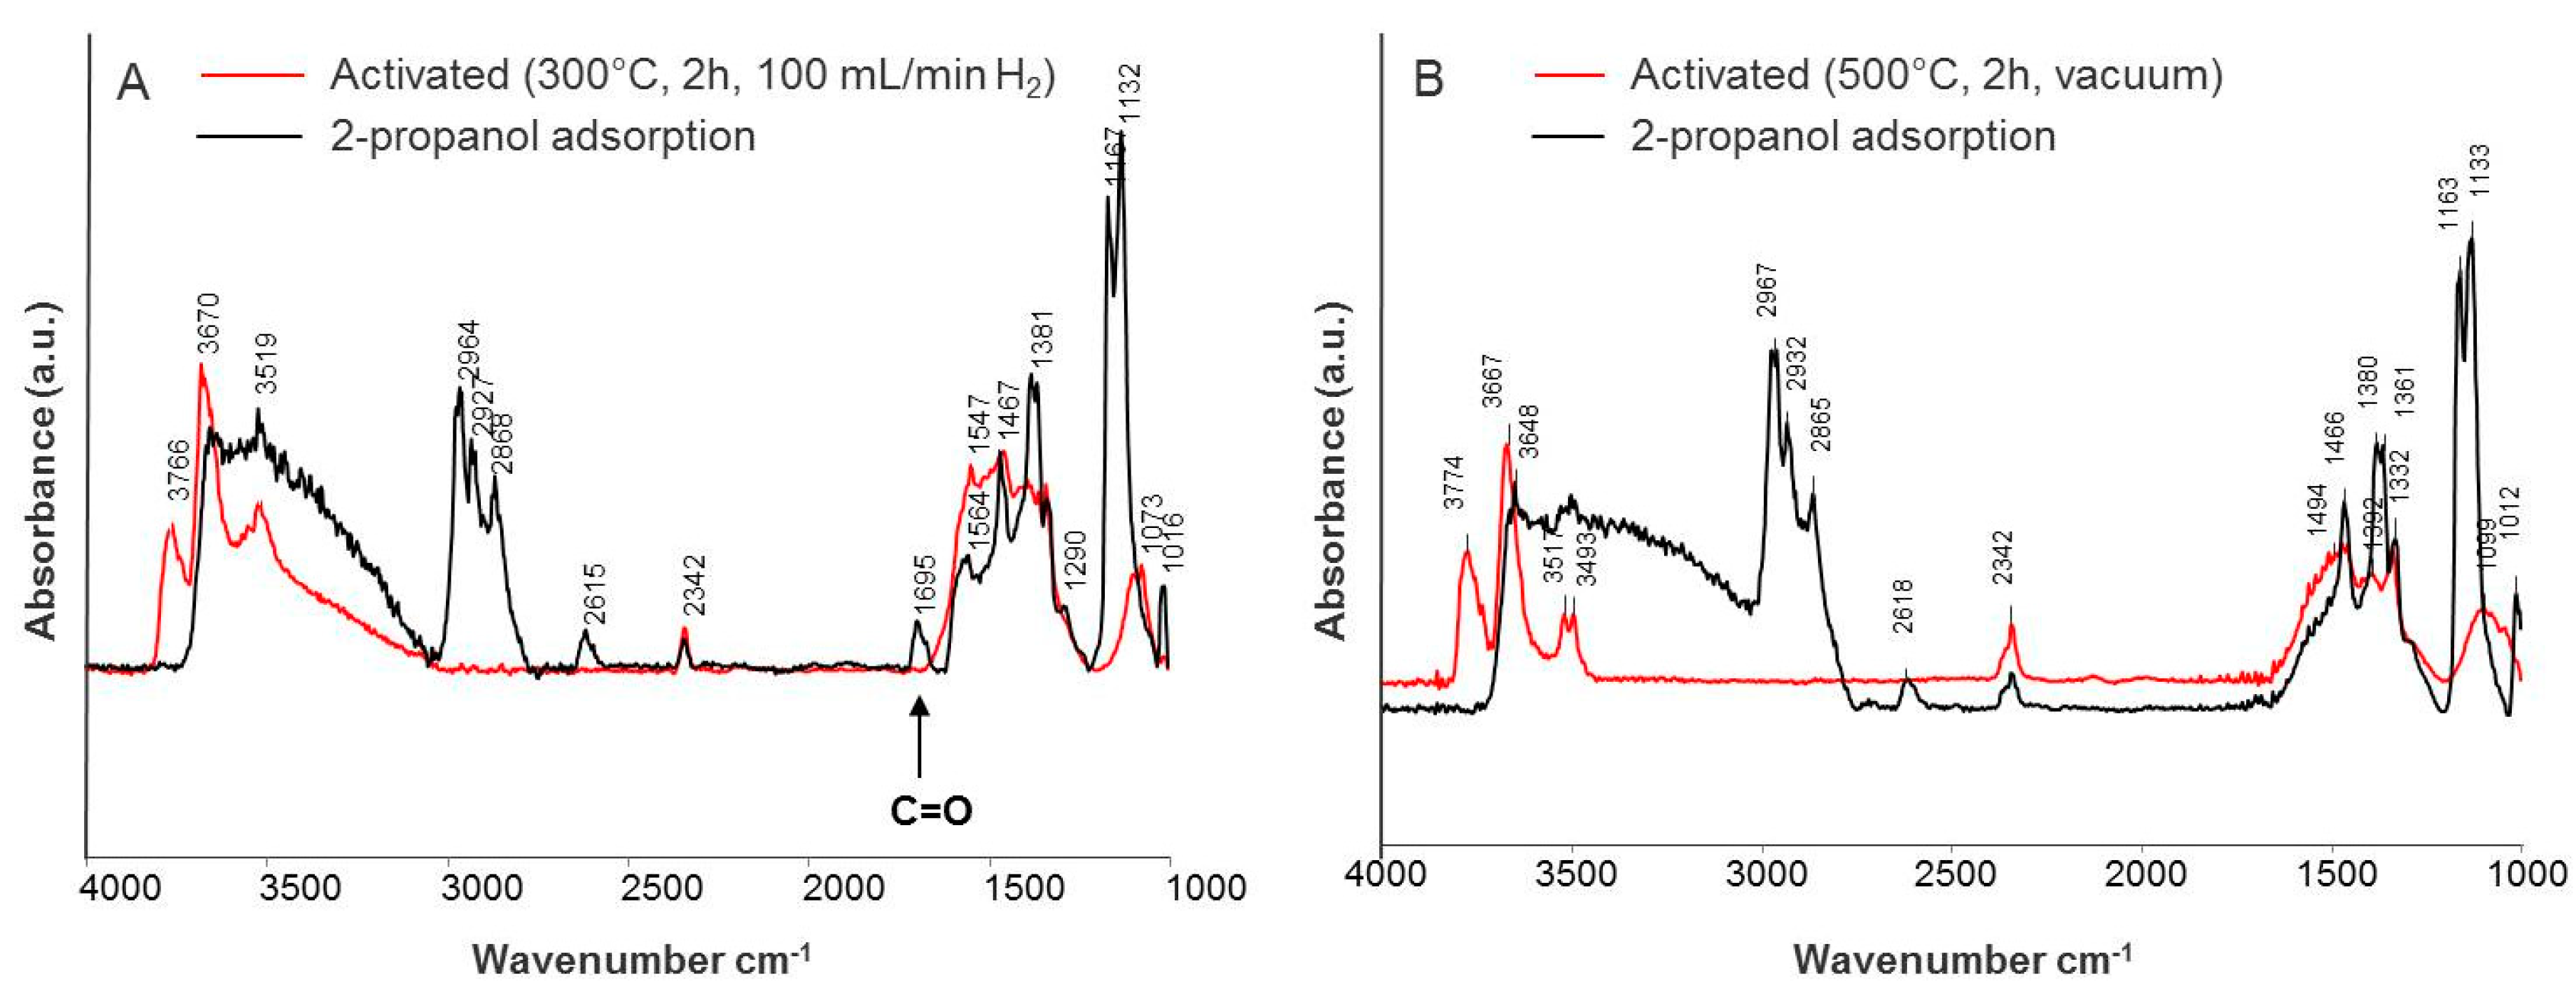
Figure 10.
Difference spectra of adsorbed pyridine at 100, 200, and 300 °C for oxidized (A) and reduced (B) Au/CeO2-ZrO2-T sample.
Figure 10.
Difference spectra of adsorbed pyridine at 100, 200, and 300 °C for oxidized (A) and reduced (B) Au/CeO2-ZrO2-T sample.
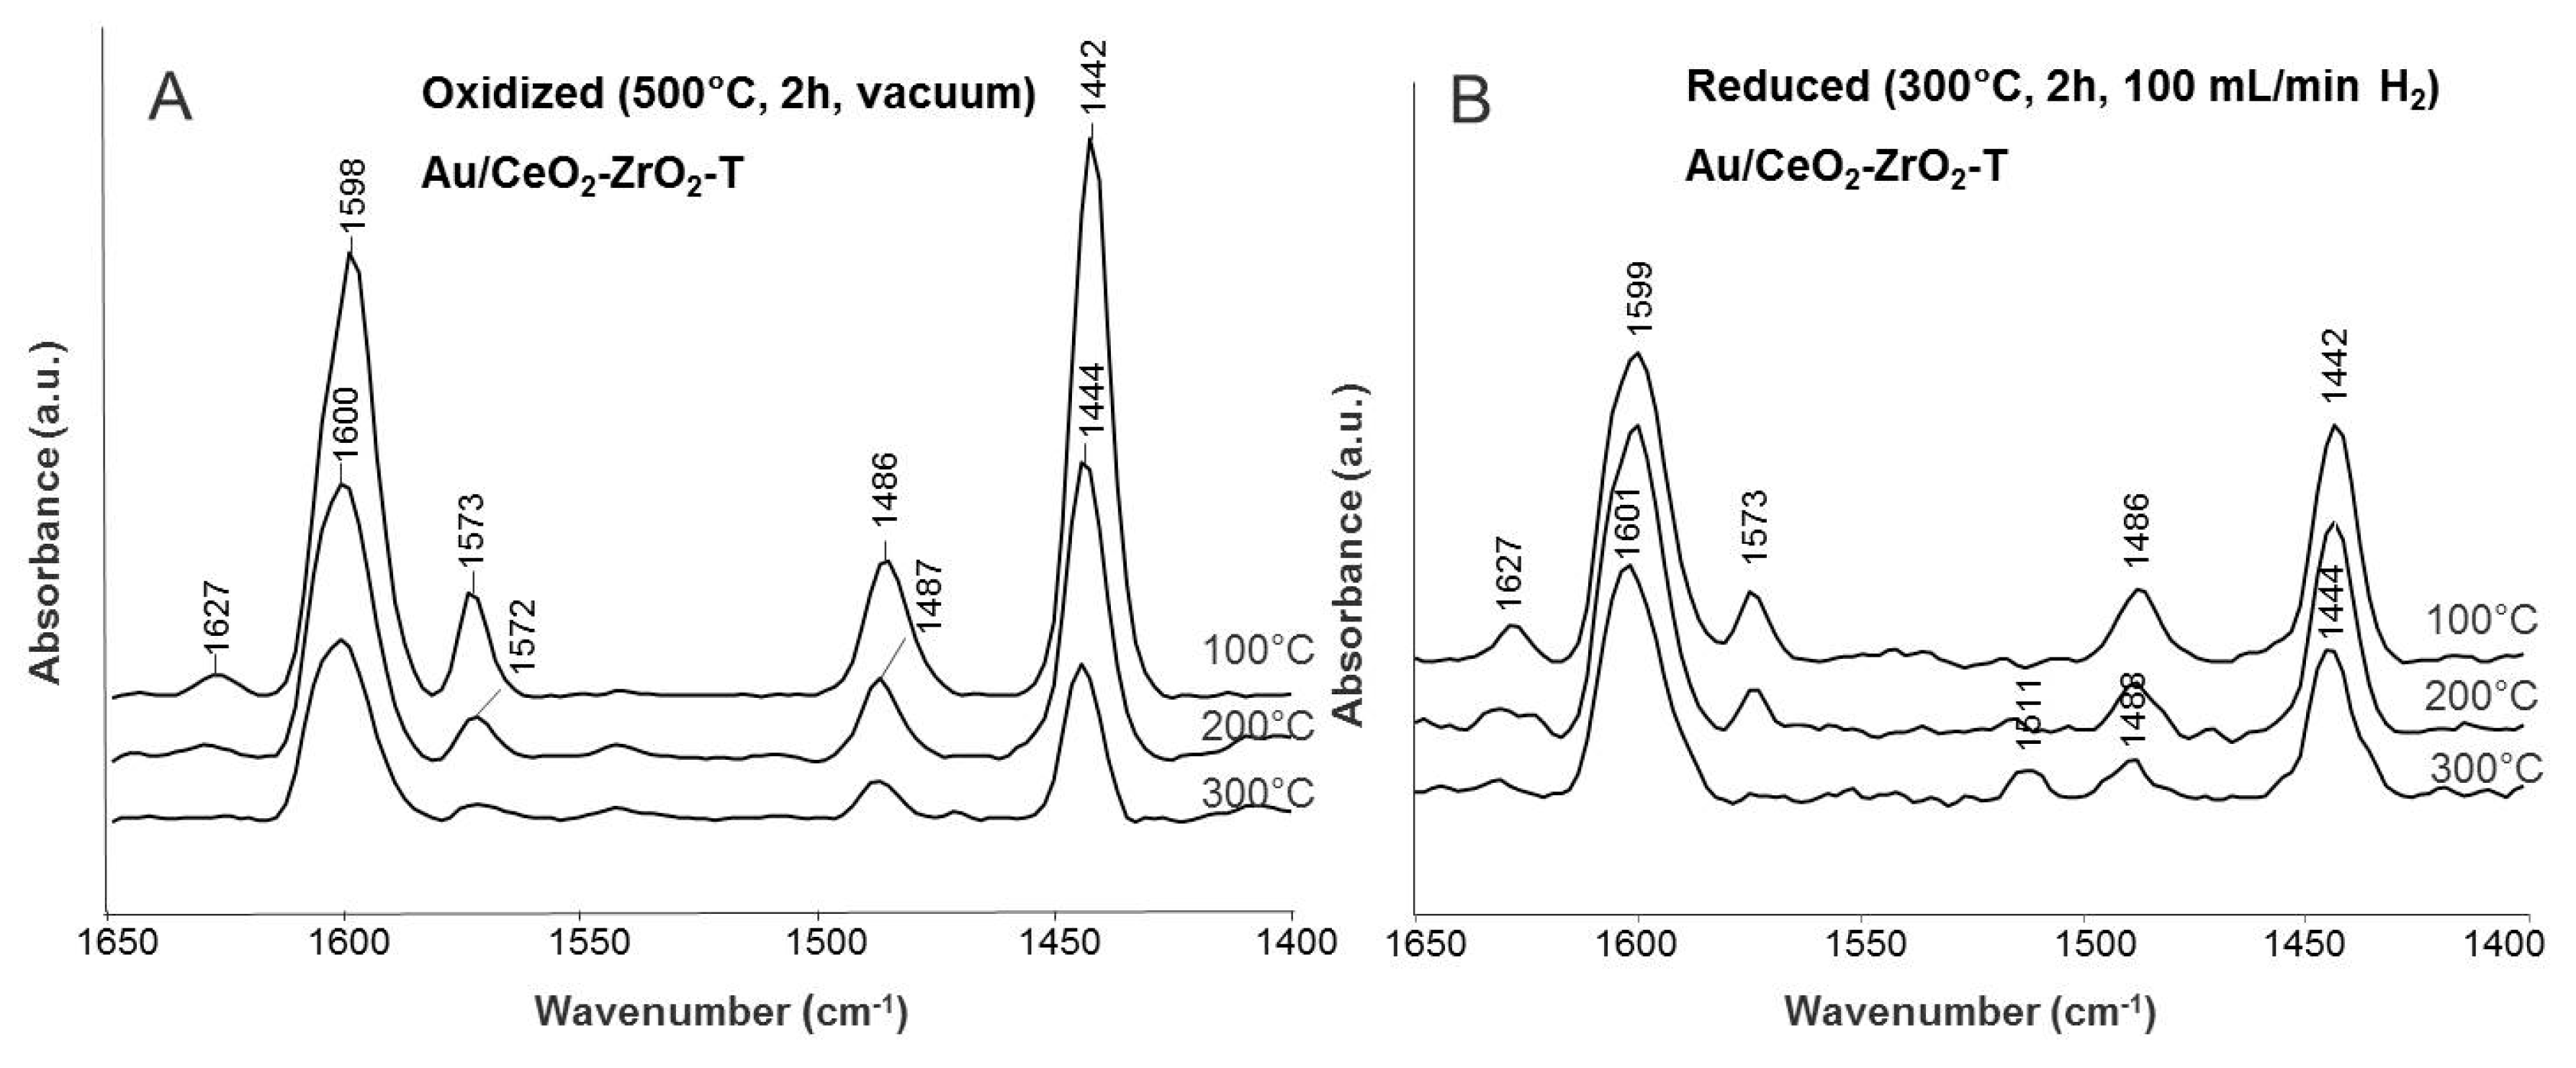
Figure 11.
Rates of acetone production (A) and propene production (B) at 150 to 225 °C for various pre-treated catalysts.
Figure 11.
Rates of acetone production (A) and propene production (B) at 150 to 225 °C for various pre-treated catalysts.
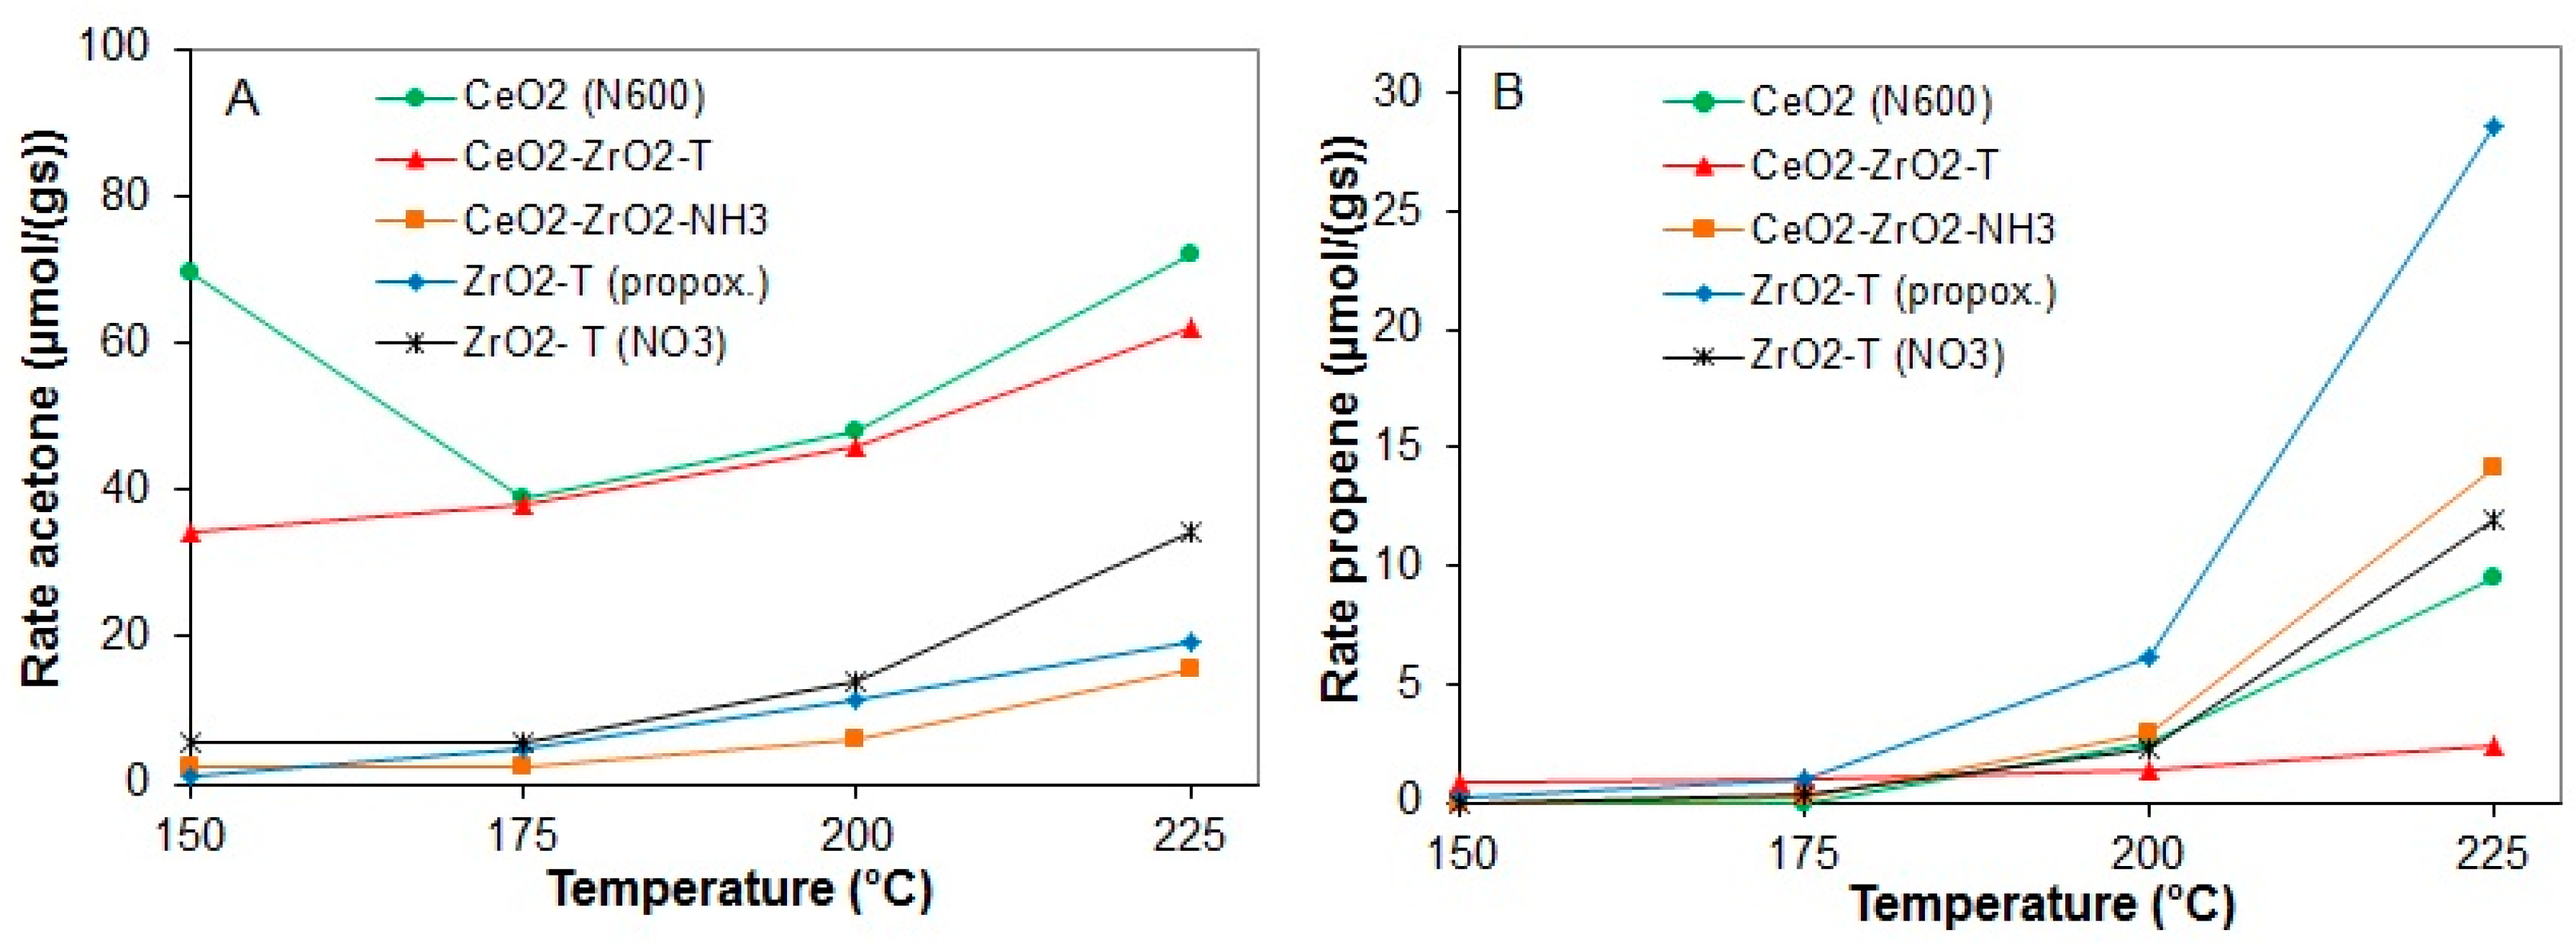
Figure 12.
Arrhenius plots of the reaction rates of acetone vs 1/T for 2-propanol decomposition reaction of various catalysts.
Figure 12.
Arrhenius plots of the reaction rates of acetone vs 1/T for 2-propanol decomposition reaction of various catalysts.
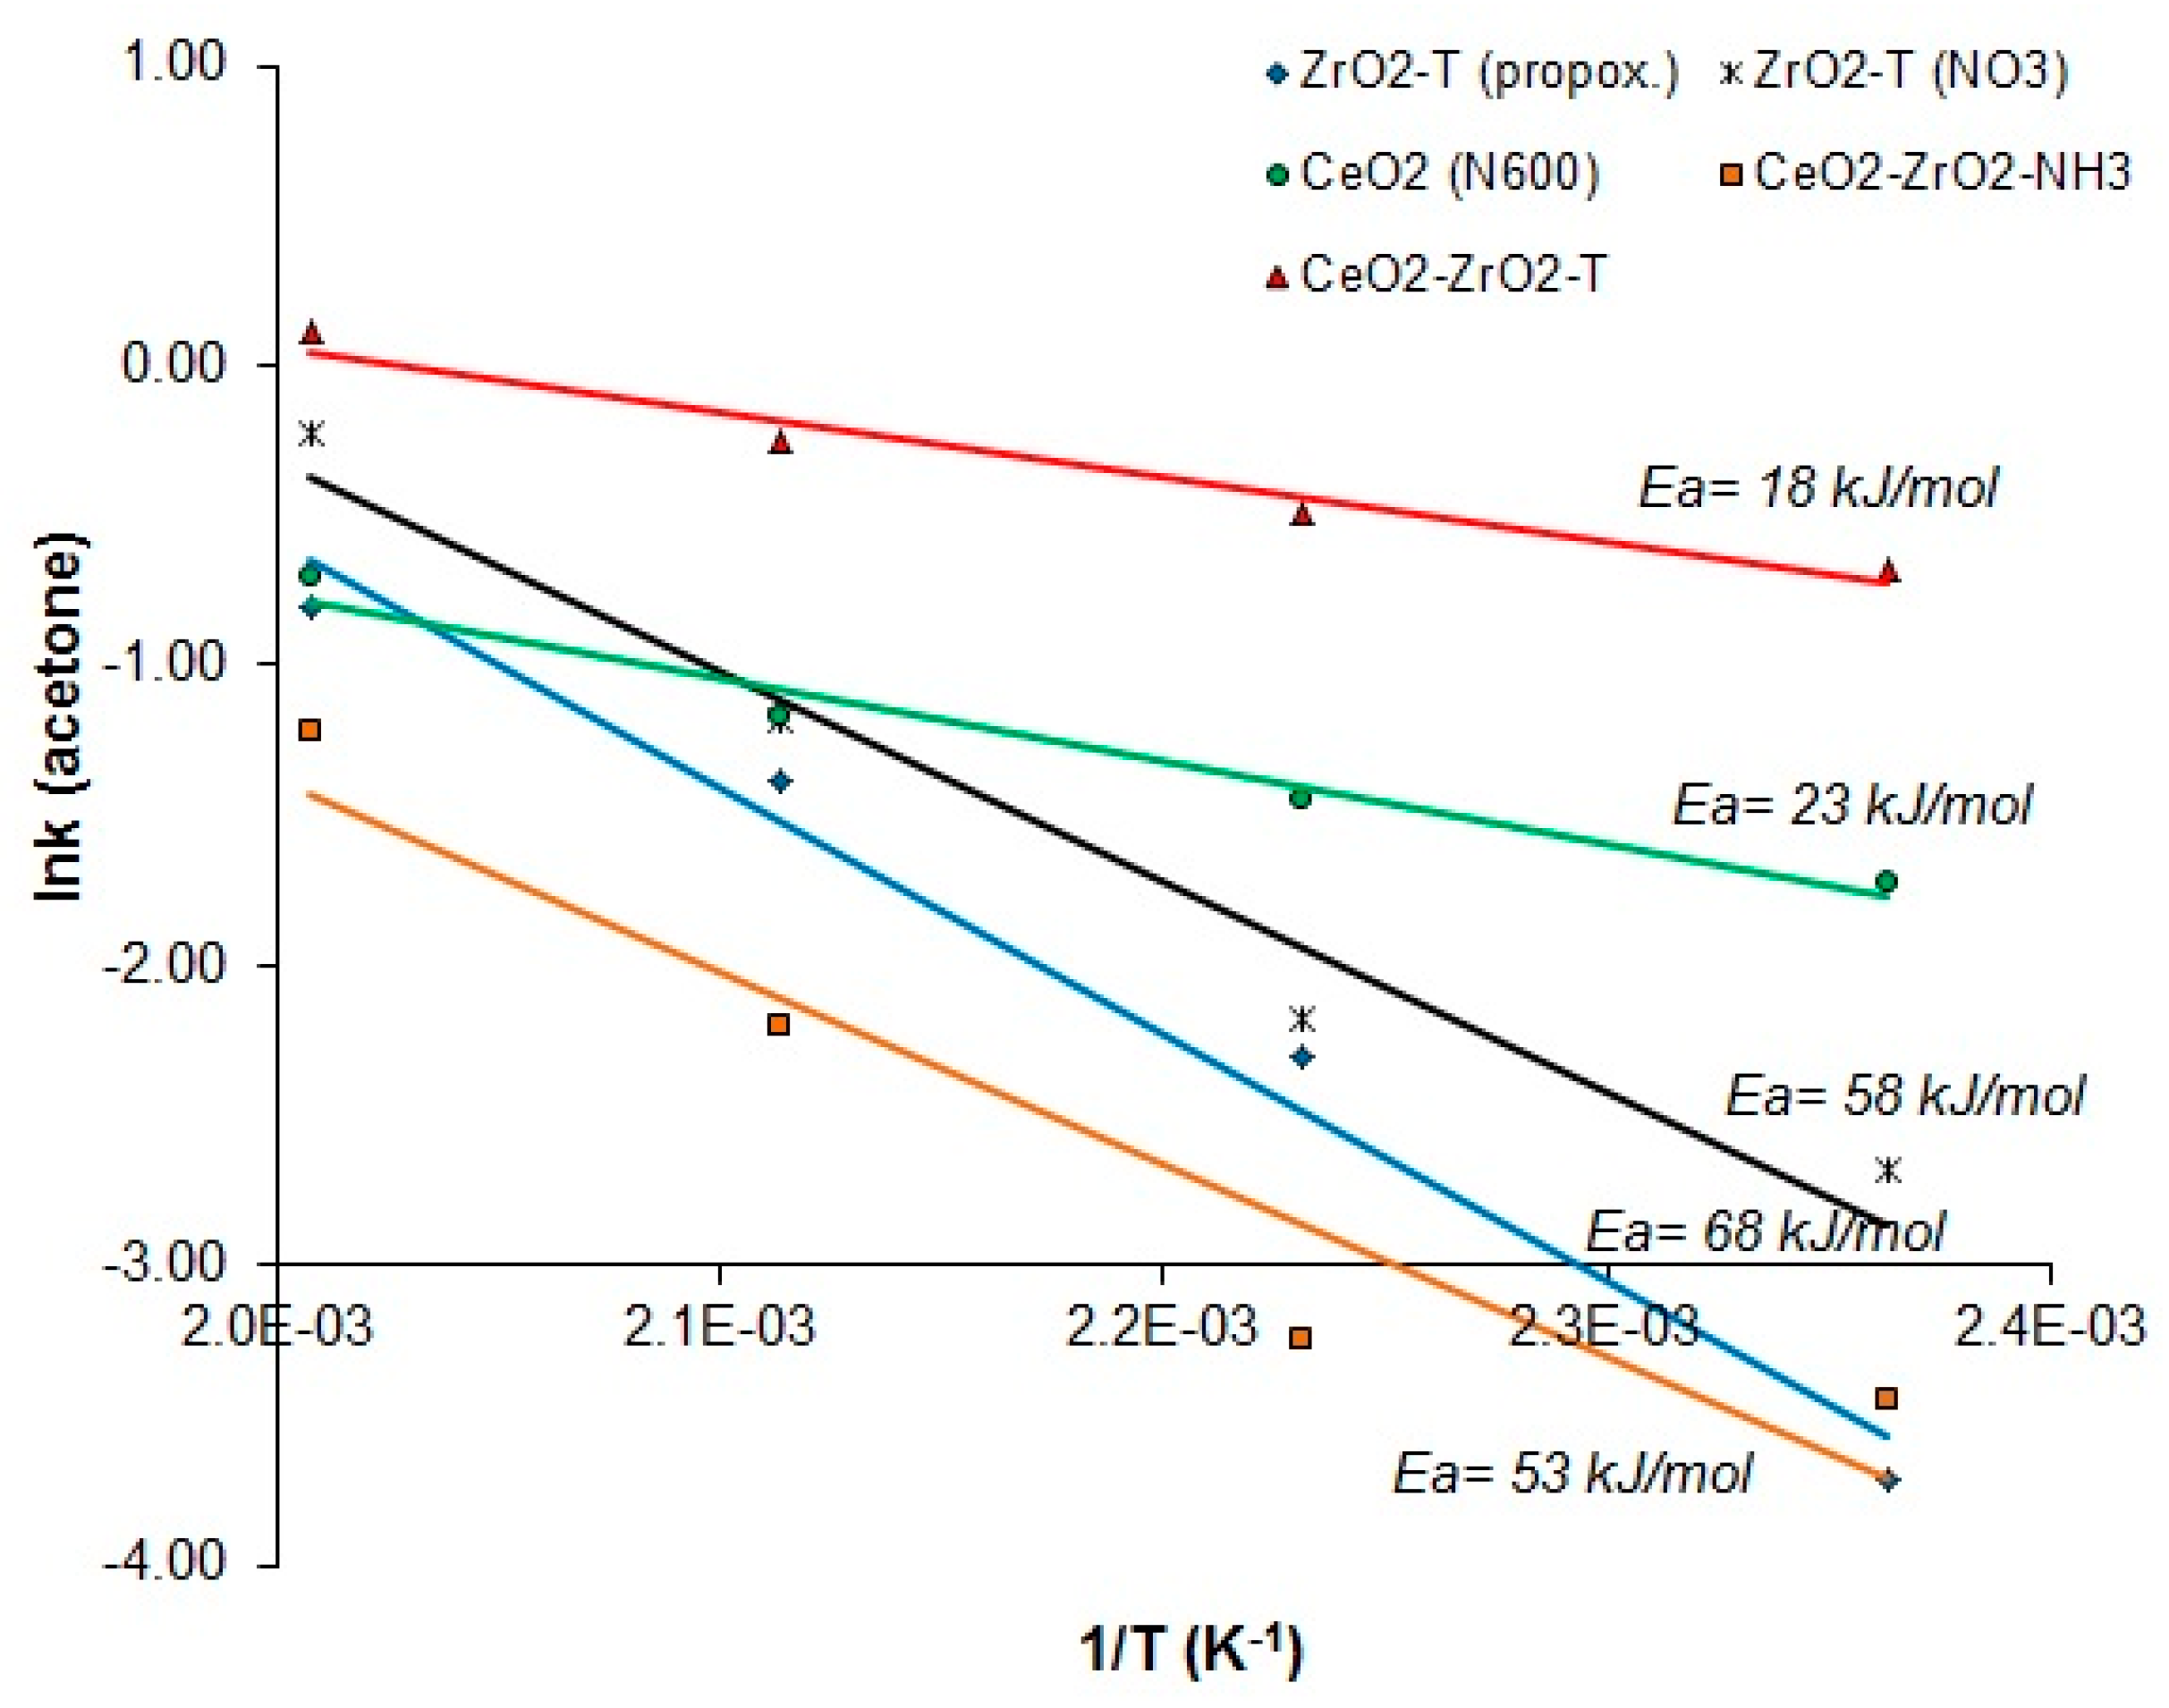
Figure 13.
Rates of acetone production (A) and propene production (B) at 150 to 225 °C for various pre-treated gold supported catalysts.
Figure 13.
Rates of acetone production (A) and propene production (B) at 150 to 225 °C for various pre-treated gold supported catalysts.

Figure 14.
Arrhenius plots of the reaction rates of acetone vs 1/T for the 2-propanol decomposition reaction of various gold supported catalysts.
Figure 14.
Arrhenius plots of the reaction rates of acetone vs 1/T for the 2-propanol decomposition reaction of various gold supported catalysts.
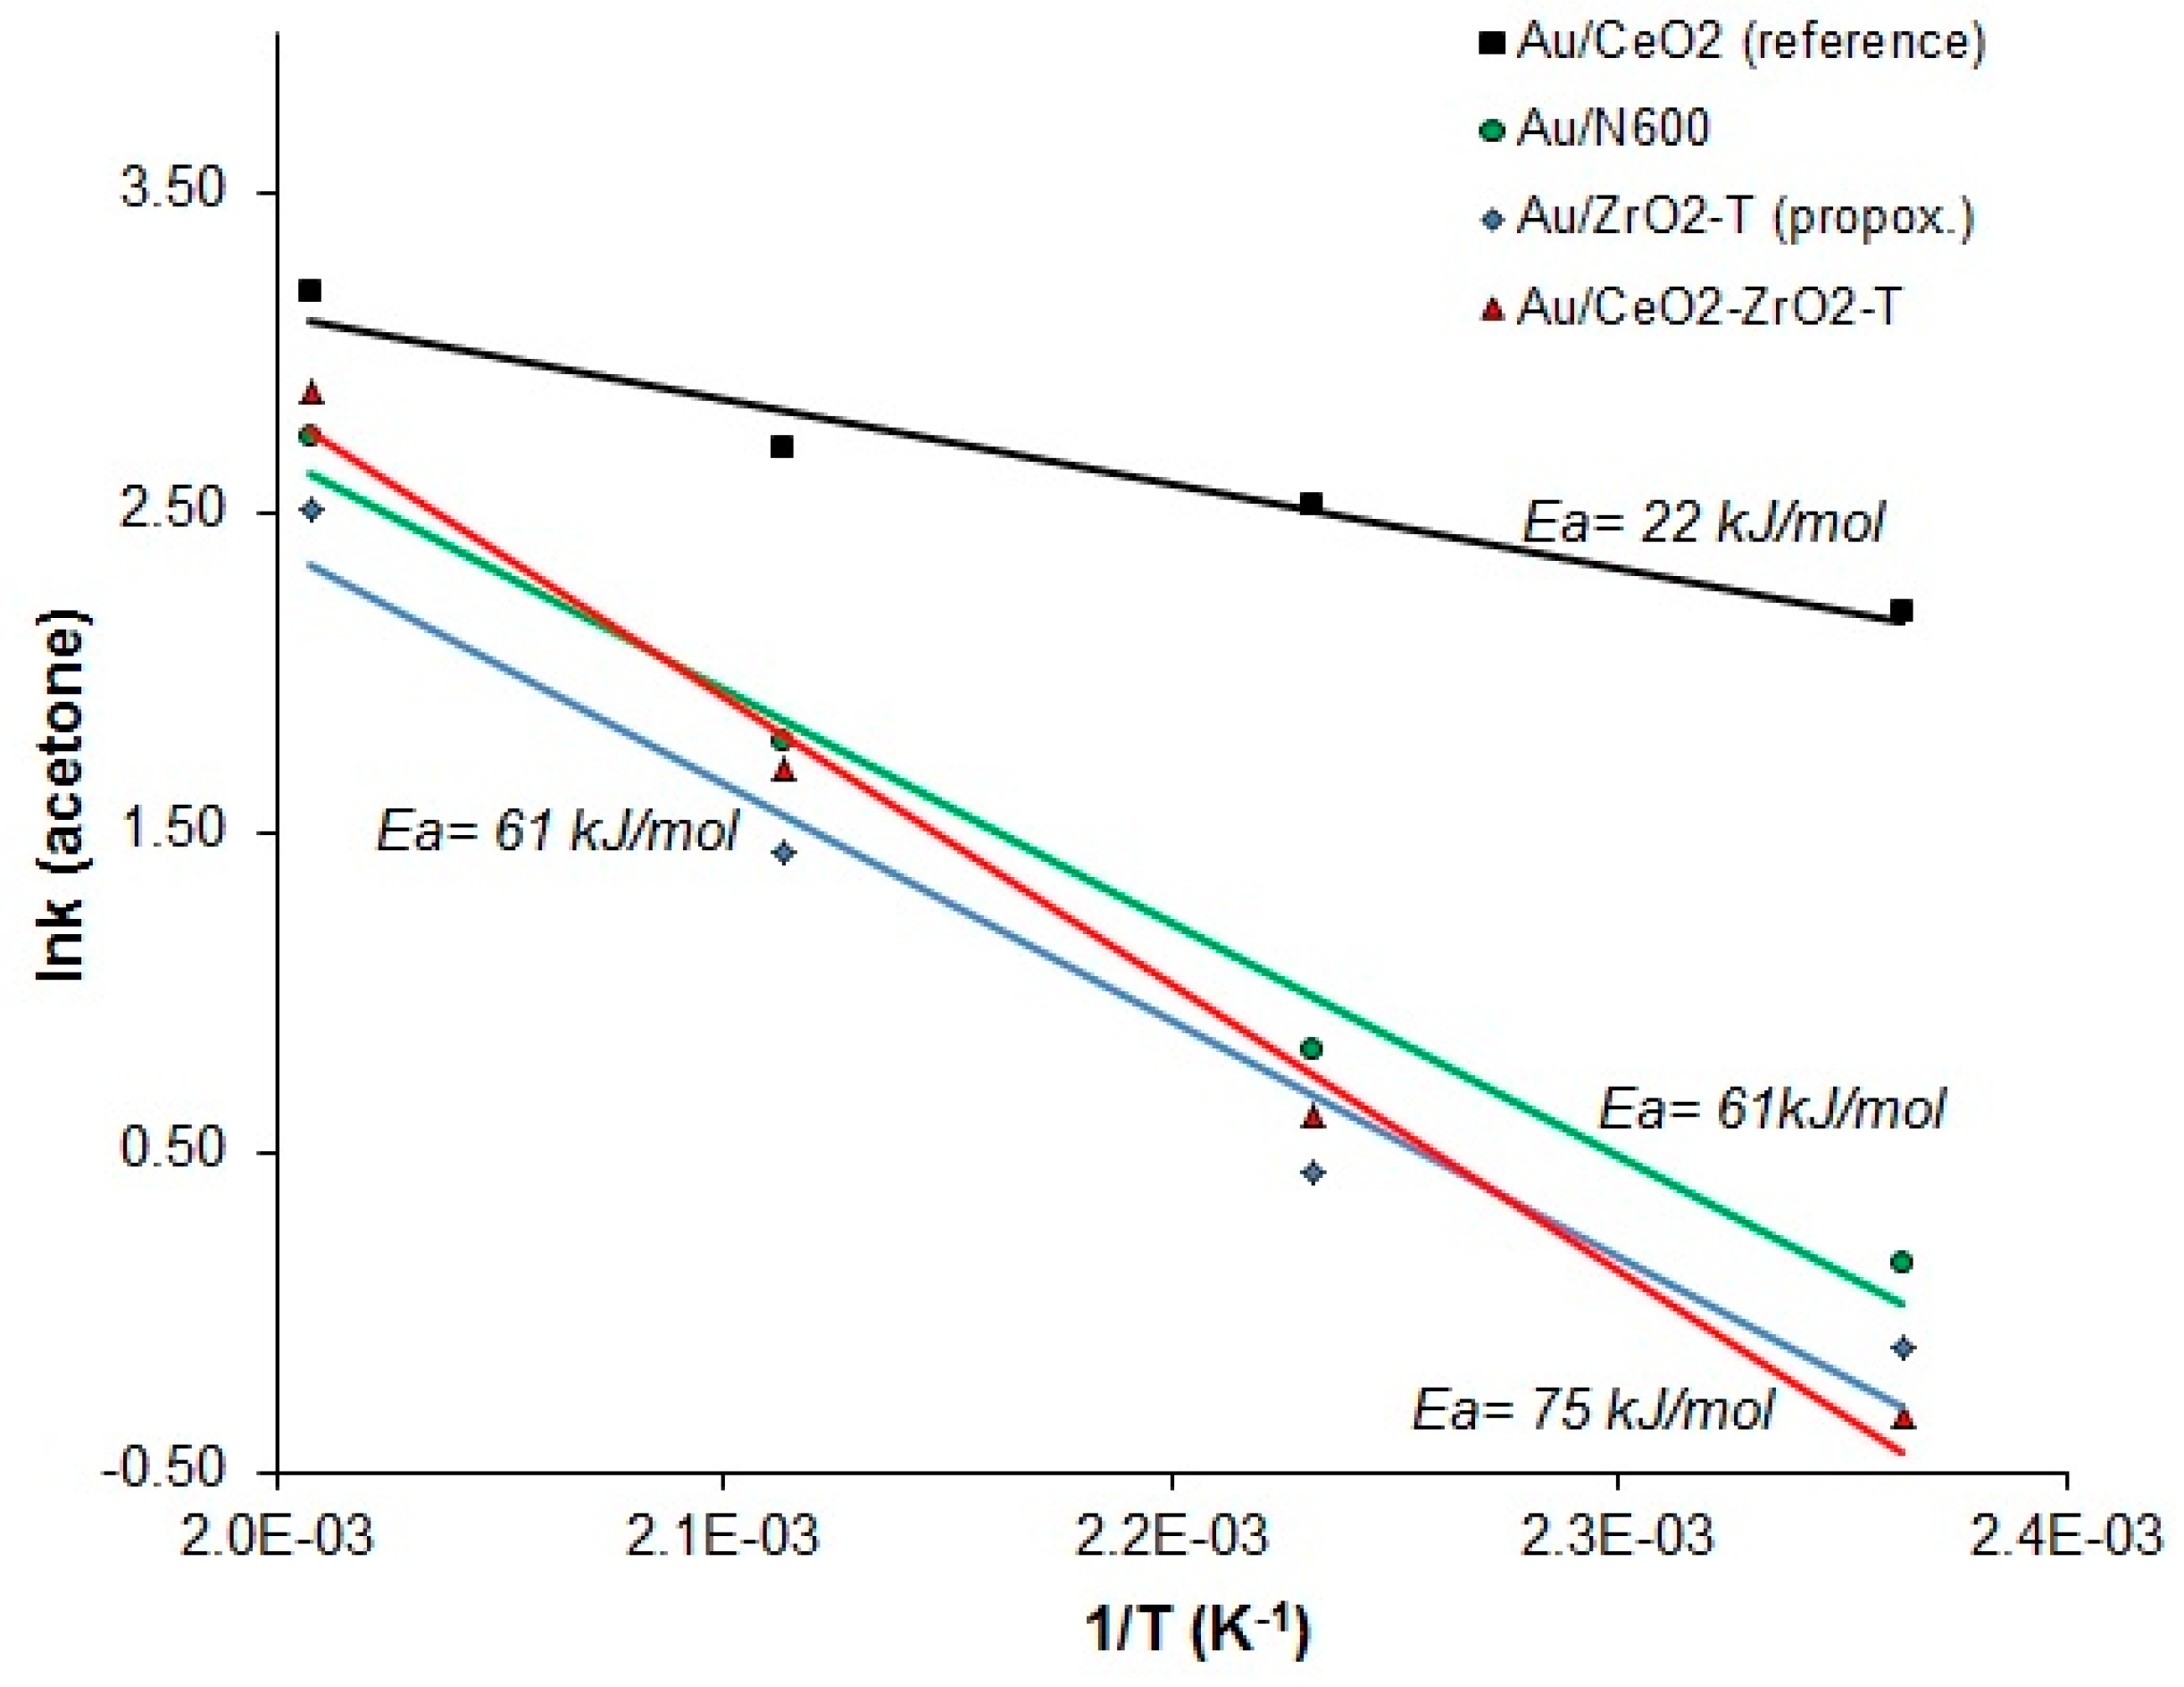
Figure 15.
Acetone selectivities for various catalysts at 225 °C, 10 mL/min He through 2-propanol.
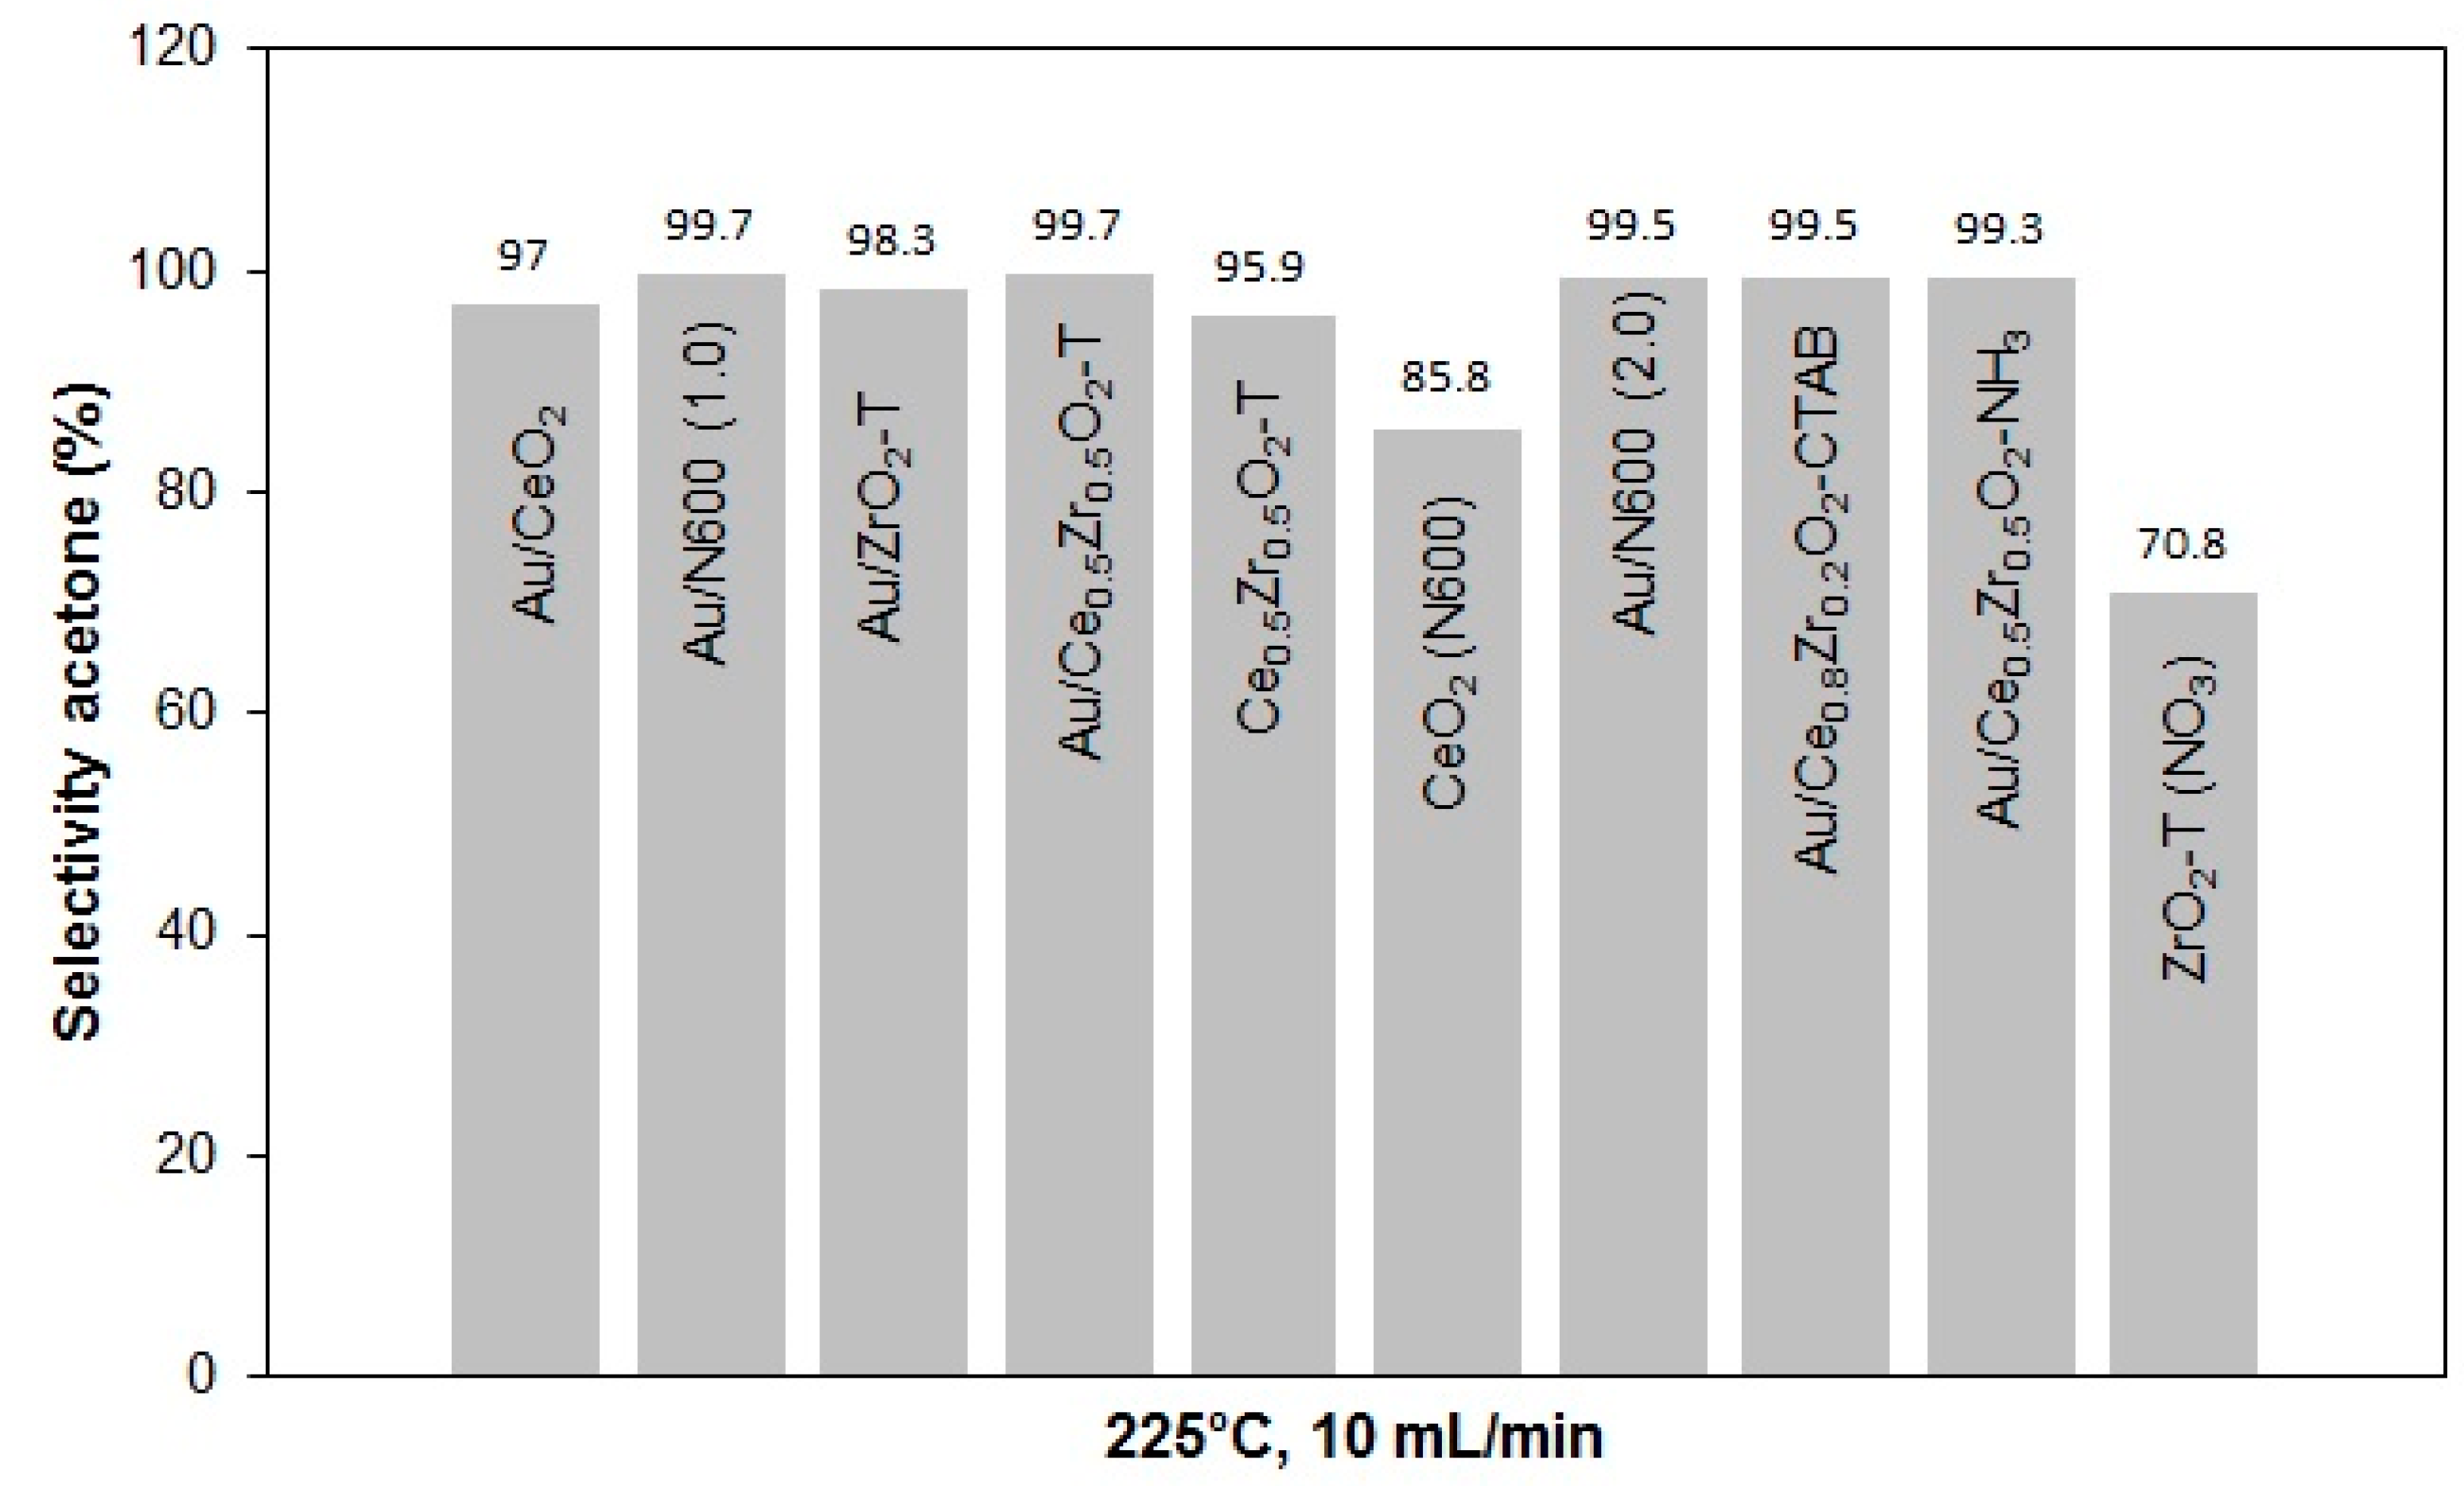
Figure 16.
Rates of butanone (A) and butene (B) from 2-butanol conversion at 150 to 225 °C for various pre-treated catalysts.
Figure 16.
Rates of butanone (A) and butene (B) from 2-butanol conversion at 150 to 225 °C for various pre-treated catalysts.
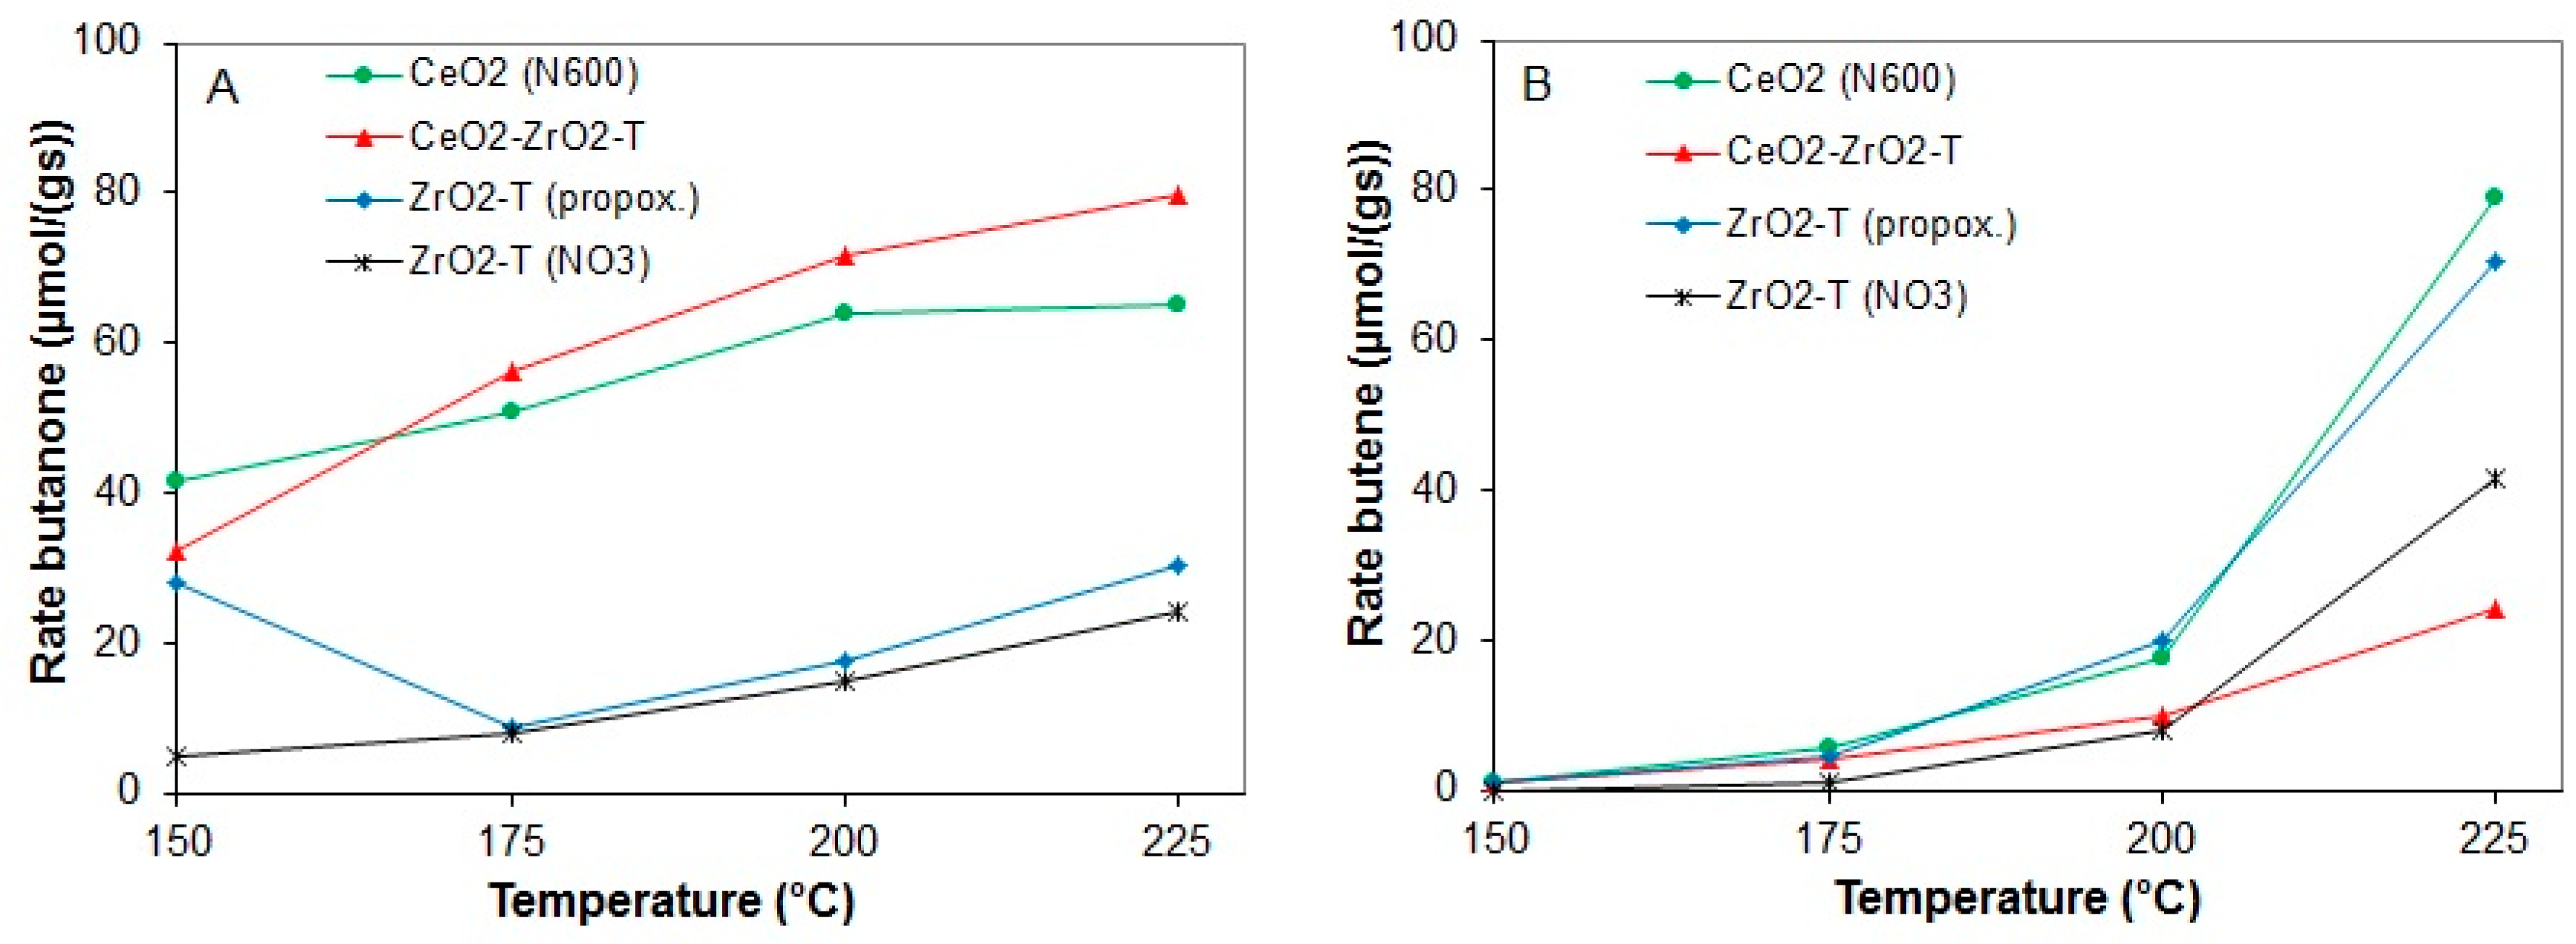
Figure 17.
Rates of butanone (A) and butene (B,C) from 2-butanol conversion at 150 to 225 °C for various pre-treated gold supported catalysts.
Figure 17.
Rates of butanone (A) and butene (B,C) from 2-butanol conversion at 150 to 225 °C for various pre-treated gold supported catalysts.
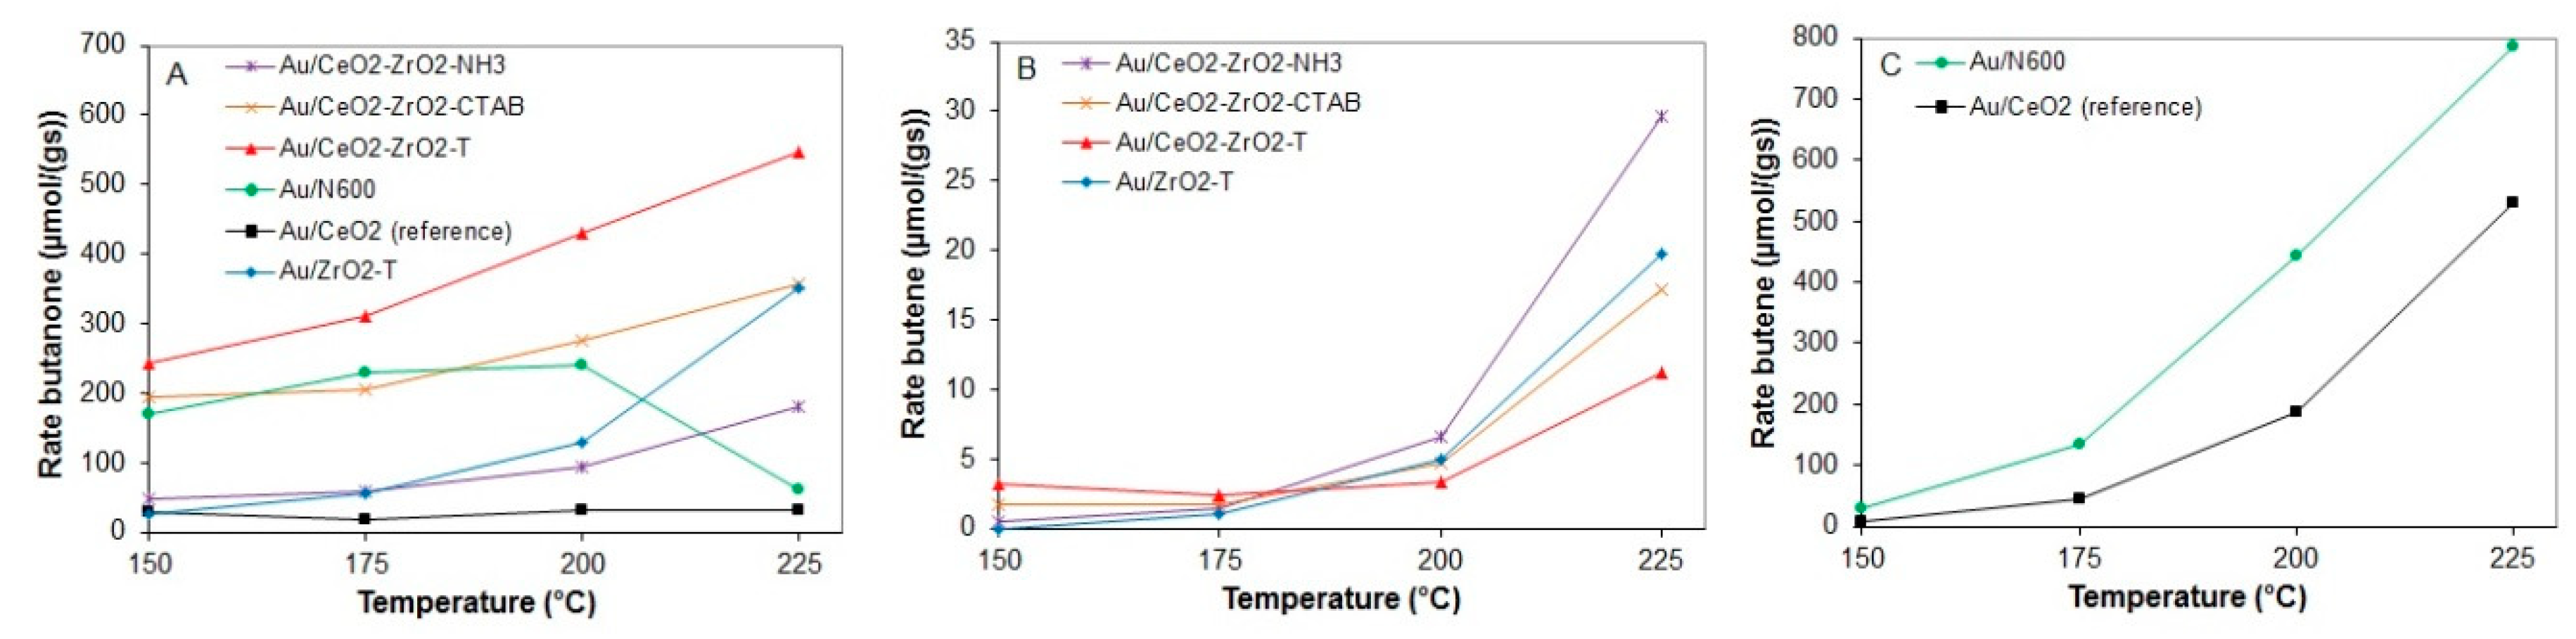
Figure 18.
Butanone selectivities for various catalysts at 225 °C, 10 mL/min He through 2-butanol.

Table 1.
Weight percentages of gold in Au/ceria, Au/zirconia, and Au/ceria-zirconia mixed oxides.
| Sample | Weight | Au-Amount | Au-Content |
|---|---|---|---|
| [mg] | [mg] | [wt.%] | |
| reference Au/CeO2 | - | - | 0.84 |
| Au/N600 | 101.7 | 0.979 | 0.96 |
| Au/N600 | 181.7 | 3.18 | 1.75 |
| Au/CeO2-T | - | - | 0.01 |
| Au/ZrO2-T | 171.2 | 2.0 | 1.17 |
| Au/CeO2-ZrO2-T | 121.5 | 1.17 | 0.97 |
| Au/CeO2-ZrO2_NH3 | 152 | 1.43 | 0.94 |
| Au/CeO2-ZrO2_CTAB | 163.8 | 2.03 | 1.24 |
Table 2.
Physicochemical properties measured by nitrogen sorption for all synthesized samples.
| Sample | Specific Surface | Calcination | Micropore | Cummulative |
|---|---|---|---|---|
| Area | Temperature | Volume | Pore Volume | |
| [m2/g] | [°C] | [cm3/g] | [cm3/g] | |
| reference CeO2 | 6 | 600 | - | - |
| CeO2-T | 65 | 600 | 0.012 | 0.12 |
| CeO2 (N600) | 72 | 600 | 0.015 | 0.15 |
| ZrO2-T (propox.) | 46 | 600 | 0.0065 | 0.13 |
| ZrO2-T (NO3) | 92 | 600 | 0.015 | 0.18 |
| CeO2-ZrO2_CTAB | 125 | 400 | 0.02 | 0.16 |
| CeO2-ZrO2-T | 83 | 600 | 0.014 | 0.17 |
| CeO2-ZrO2-T_EtOH | 102 | 400 | 0.013 | 0.11 |
| CeO2-ZrO2_NH3 | 15 | 600 | - | 0.08 |
Table 3.
Acid and basic properties of samples determined by NH3- and CO2-TPD.
| Sample | Specific Surface | Acid Sites | Basic Sites | Basicity | Active Sites |
|---|---|---|---|---|---|
| Area [m2/g] | [mol/g] | [mol/g] | [%] | [mol/m2] | |
| commercial CeO2 | 6 | 7 | 0.5 | 7 | 1.25 |
| CeO2 (N600) | 72 | 13; 21 (H2) | 7 | 25 | 0.38 |
| ZrO2-T (propox.) | 46 | 59 (H2) | 6 | 9 | 1.41 |
| ZrO2-T (NO3) | 92 | 173 | - | - | - |
| CeO2-ZrO2-T | 83 | 93 | 13 | 12 | 1.28 |
| reference Au/CeO2 | 6 | 13 | 0.9 | 6 | 2.32 |
| Au/N600 (1.0) | 72 | 8 | - | - | - |
| Au/N600 (2.0) | 72 | 12; 19 (H2) | - | - | - |
| Au/ZrO2-T (propox) | 43 | 83 (H2) | 9 | 10 | 2.14 |
| Au/CeO2-ZrO2-T | 83 | 59 (H2) | 15 | 20 | 0.89 |
Table 4.
Characterization of IR bands of the activated supports.
| Species | Frequencies (cm−1) | ||
|---|---|---|---|
| CeO2-T | ZrO2-T | CeO2-ZrO2-T | |
| ν (OH) Type I | 3723 | 3772 | 3772 |
| ν (OH) Type II | 3667 | 3676 | 3667 |
| ν (OH) Type III | 3519 | - | 3519 |
| ν (CO2) | 2366 | 2344 | 2344 |
| ν (CO32−) bidentate | 1467 | 1550 | 1467 |
| monodentate | 1381 | 1362 | 1392, 1338 |
| bridged | 1107 | 1075 | 1102 |
Table 5.
IR vibrational wavenumbers from the adsorption of 2-propanol on various catalysts.
| Species | Frequencies (cm−1) | |||||
|---|---|---|---|---|---|---|
| CeO2-T | ZrO2-T | CeO2-ZrO2-T | CeO2-ZrO2-T | Au/CeO2-ZrO2-T | Au/CeO2-ZrO2-T | |
| Oxidized | Oxidized | Oxidized | Reduced | Oxidized | Reduced | |
| ν(CH3) | 2962 | 2965 | 2967 | 2964 | 2962 | 2961 |
| ν (CH2) | 2929 | 2927 | 2932 | 2927 | 2926 | 2926 |
| ν (CH) | 2863 | 2873 | 2865 | 2868 | 2866 | 2866 |
| ν (C=O) | - | - | - | 1695 | 1677 | 1692 |
| ν (OOC) | 1468 | 1467 | 1466 | 1564 | 1550 | |
| 1383 | 1373 | 1380 | 1467, 1381 | 1466, 1362 | 1464, 1381 | |
| ν (CO32-) | 1330 | 1335 | 1332 | 1332 | 1332 | 1332 |
| ν (C-O) | 1163 | 1167 | 1163 | 1167 | 1157 | 1166 |
| 1133 | 1132 | 1133 | 1132 | 1131 | 1129 | |
| ν (C-C) | 985 | 1024 | 1012 | 1016 | 1012 | 1012 |
Table 6.
Ring vibrational modes of adsorbed pyridine on Au- loaded CeO2-and CeO2-ZrO2-T samples.
| Ring Vibration ν(CCN) | Frequency (cm−1) | |||
|---|---|---|---|---|
| CeO2 (N600) | Au/N600 | CeO2-ZrO2-T | Au/CeO2-ZrO2-T | |
| Oxidized | Oxidized | Reduced | Oxidized | |
| L-Pyd | 1621, 1573, 1483 | 1621, 1573, 1483 | 1625, 1573, 1484 | 1626, 1573, 1485 |
| H-Pyd | 1595, 1440 | 1595, 1440, 1405 | 1596, 1440 | 1597, 1440 |
| B-Pyd | - | - | - | - |
© 2018 by the authors. Licensee MDPI, Basel, Switzerland. This article is an open access article distributed under the terms and conditions of the Creative Commons Attribution (CC BY) license (http://creativecommons.org/licenses/by/4.0/).
Share and Cite
MDPI and ACS Style
Glorius, M.; Markovits, M.A.C.; Breitkopf, C. Design of Specific Acid-Base-Properties in CeO2-ZrO2-Mixed Oxides via Templating and Au Modification. Catalysts 2018, 8, 358. https://doi.org/10.3390/catal8090358
AMA Style
Glorius M, Markovits MAC, Breitkopf C. Design of Specific Acid-Base-Properties in CeO2-ZrO2-Mixed Oxides via Templating and Au Modification. Catalysts. 2018; 8(9):358. https://doi.org/10.3390/catal8090358
Chicago/Turabian StyleGlorius, Maja, Monica A. C. Markovits, and Cornelia Breitkopf. 2018. "Design of Specific Acid-Base-Properties in CeO2-ZrO2-Mixed Oxides via Templating and Au Modification" Catalysts 8, no. 9: 358. https://doi.org/10.3390/catal8090358
Note that from the first issue of 2016, this journal uses article numbers instead of page numbers. See further details here.