Flame-Sprayed Pure and Ce-Doped TiO2 Photocatalysts


1
Department of Materials Science and Engineering, The Ohio State University, Columbus, OH 43210, USA
2
Department of Materials Science and Engineering, State University of New York at Stony Brook, Stony Brook, NY 11794, USA
*
Author to whom correspondence should be addressed.
Catalysts 2018, 8(9), 342; https://doi.org/10.3390/catal8090342
Submission received: 18 July 2018
/
Revised: 15 August 2018
/
Accepted: 17 August 2018
/
Published: 22 August 2018
(This article belongs to the Special Issue State-of-the-Art Photocatalytical Technology in North America)
Abstract
:Pure and Ce-doped TiO2 nanoparticles were successfully synthesized in one step by means of the scalable flame spray pyrolysis (FSP) process. Complete structural and chemical characterization of these materials revealed that the majority of the nanoparticles are crystalline and spherical, ranging from 5 to 45 nm in diameter. The band gap of TiO2 was reduced by doping with Ce from 2.43 to 3.06 eV and the Ce–TiO2 nanoparticles exhibit a strong photoelectrical response to visible light illumination. Ce–TiO2 nanoparticles obtained with this scalable method are trivially scalable to industrial level manufacturing, granting and enabling additional approaches for the actual application of ceramic oxide nanomaterials to combat challenges such as environmental cleanup and energy production from the visible part of solar inputs.
1. Introduction
Titanium dioxide (TiO2) has been extensively studied due to its high photocatalytic activity and non-toxicity. To improve the properties of TiO2, structure modifications are explored by doping TiO2 with other elements, such as Ce [1,2,3]. Uniform distribution of the dopant is challenging and a key requirement which controls the properties of a doped material. Nanoscale processing can help achieve high surface areas and uniform dopant distributions. This chapter addresses the use of an aerosol process, similar to the one used to produce P25 Degussa TiO2, for the effective doping of TiO2.
Flame spray pyrolysis (FSP) is a scalable nanomanufacturing technique used to produce a wide range of products at a low cost [4,5]. This technique enables the production of unique oxide nanoparticles in one step, and it has been used to produce oxides for sensors [6,7] and industrial catalysts [8]. In this technique, liquid or solid precursor compounds are rapidly evaporated by high temperature flame exposure, resulting in vapors that transform into clusters by quickly growing into nanometer-sized particles by coagulation [9]. According to published work, materials synthesized by FSP often provide high surface area and thermal stability [10,11], both of which are required for efficient heterogeneous catalysts.
Kho et al. [12] reported on the control of anatase and rutile compositions in TiO2 processed by FSP. Elidrissi et al. [13] also studied the synthesis of a CeO2 thin film by FSP with close control of the structure, morphology, and optical properties. The synthesis of a Ce–TiO2 nanoparticle through FSP was studied before by Chaisuk et al. [14]. They reported obtaining powders consisting of single crystal spherical nanoparticles of 10–13 nm with a Ce concentration of 5–50 wt%. The authors did not specify the phase distribution or other changes of the material as an effect of increasing Ce concentration. The same authors claimed that increasing Ce content in TiO2 resulted in the insertion of Ce+3/+4 in the TiO2 matrix, which generated an n-type impurity band [14].
Thus, flame-made Ce–TiO2 nanostructures have not been widely studied in terms of their photocatalytic degradation properties and especially photoelectrochemical properties. In this article, one-step flame-sprayed processed pure TiO2 and Ce–TiO2 nanostructures were synthesized and then characterized by their morphology, structure, optical properties, and photoelectrochemical properties.
2. Results and Discussion
Figure 1 shows the X-ray diffraction (XRD) analysis of as-received pure TiO2 and Ce–TiO2 nanoparticles. XRD peaks of pure TiO2 are indexed to the (101), (103), (004), (112), (200), (105), (211), (204), and (116) crystal planes of anatase phase of TiO2 (JCPDS #21-1272) and (110), (101), and (111) crystal planes of rutile phase TiO2 (JCPDS#21-1276). XRD of Ce–TiO2 samples displays the anatase and rutile phases and CeO2 fluoride structure (JCPDS #34-indexing) (394) (111) (311) reflections. The coherently reflecting domain (CDD) size, also famously known as the crystallite size, of the phases was obtained by using the Scherrer’s equation and the results are summarized in Table 1. The phase content of TiO2-FSP is 92% anatase and 8% rutile and for CE–TiO2-FSP it is 86% anatase, 12% rutile, and 4% CeO2 (summarized in Table 1).
It can be seen from Table 1 and the XRD analysis that in the Ce–TiO2, the anatase phase content decreased and the rutile phase amount is increased; therefore, in the FSP method, the addition of a Ce atom accelerates the rutile phase transformation as suggested in ref. [15]. The same effect is observed in Cu-doped Titania [16] and Fe-Doped Titania [17] synthesized through FSP. This effect is explained by suggesting that the defects created when a second element is introduced, which is most likely Oxygen vacancies inside the TiO2 crystal, favors the anatase to rutile transition [14].
The morphology and structural properties of the nanostructures were studied by using SEM as shown in Figure 2, which compares the FSP-TiO2 and FSP Ce–TiO2 samples. Particles were found to be regular in shape and there is no major change in morphology after doping the TiO2 sample with Ce.
The TEM micrographs of TiO2 and Ce–TiO2 particles and their selected area electron diffraction (SAED) patterns are shown in Figure 3a,c, respectively. In order to obtain the particle size distribution of grains visible in Figure 4 for the Ce–TiO2 sample, MIPAR image analysis was performed and the size distribution histogram is provided in Figure 4. The pareto diagram depicted in Figure 4c shows that more than 92 percent of the particles have a diameter between 5 and 45 nm. Input data analysis was performed on the collected data to determine the underlying probability distribution of the samples. After statistical goodness-of-fit testing (Anderson–Darling), it was found that a Weibull distribution can represent the pattern of particle diameters distribution. In addition, a log Normal distribution was also fit to the data; however, it has a lower statistical fitness score compared to Weibull. Comparison of the fitting curves can be seen in Figure 4d. The particle size distribution for flame-made materials originates from the nature of the method [17,18,19]. FSP particles are formed by droplet evaporation, combustion, aerosol formation, coagulation, and sintering [5,9] and product vapor condenses into small particles and starts to grow into bigger particles by colliding and coalescing. In other words, the formation of nanoparticles by FSP is considered to follow these steps: the sprayed droplets of precursor solution are evaporated and combusted as soon as they meet the flame and release the metal atoms, then nucleation and growth of particles by coagulation and condensation occurr along the axial direction of the flame [9]. The appearance of some large crystals in the TEM may indicate that two particle formation mechanisms are present independently. Large particles may be formed directly from precursor droplets that were not completely evaporated, such as the particles depicted in the yellow region in Figure 4. The second mechanism includes particles with smaller sizes that could have been formed by precursor evaporation and subsequent gas-phase reaction, nucleation, surface growth, coagulation, and sintering [20]. There is also a possibility that the broad size distribution of the nanoparticles results from the variation of spray droplets in size as discussed by Tian et al. [10]. They have argued that the particles attained from small spray droplets would show a longer residence time in the flame compared with the droplets obtained from large spray droplets. Since it is clear that increasing the residence time results in larger particles, it could be concluded that small spray droplets increase the chance of having bigger particle sizes.
TiO2 in Figure 3b was indexed and identified as the crystal structure corresponding to the (101), (103), and (200) crystal planes of anatase phases of pure TiO2. The SAED patterns are consistent with XRD results in which Ce–TiO2 rings are assigned to the anatase TiO2 (101), (004), (200) planes and rutile (211) plane (Figure 3d).
The grain size and phase content measured for the FSP-processed samples confirmed the size dependence of the anatase–rutile transformation. The larger grain size particles are rutile. Particle size is one of the important factors for controlling phase stability. Zhang and Bandfiled [21] reported that if the particle sizes of the three nanocrystalline phases are equal, rutile has the most stable sizes greater than 35 nm. Gouma [22] had already confirmed this finding using in-situ high TEM analysis of the anatase to rutile transformation in nanocrystals and showed the critical particle size for the onset of rutile nucleation to be close to 30 nm. This explains the stability of small particles of Anatase in high temperature evident in the earlier XRD analysis.
To characterize the morphology and crystallinity of the nanostructure, HRTEM images were obtained. Figure 5 shows the interplanar spacing of 0.35 nm related to (101) planes of anatase TiO2 (JCPDS #21-1272) and the spacing of 0.32 nm belonging to the (110) planes of rutile TiO2 (JCPDS #21-1276) The corresponding regions are indicated with a higher magnification on the images represented in Figure 5.
EDX results provide both qualitative and quantitative information about elemental and atomic percentages between TiO2 and CeO2, respectively. The Figure 6a–d shows the elemental energy dispersive X-ray (EDX) mapping analysis of Ce–TiO2 samples. It could be clearly seen from elemental mapping that Ce, O, and Ti exists in the sample. As the color distribution indicated, Ti and Ce elements were uniformly distributed over the particles. Ce is relatively more difficult to see due to the difference in concentration, but the red color throughout the sample in Figure 6d indicates the uniform presence of Cerium. The EDX pattern of Ce–TiO2 also shows (Figure 6e) the presence of Cu and Fe in addition to Ce and Ti, which come from the Cu grid substrate and the sample holder, respectively.
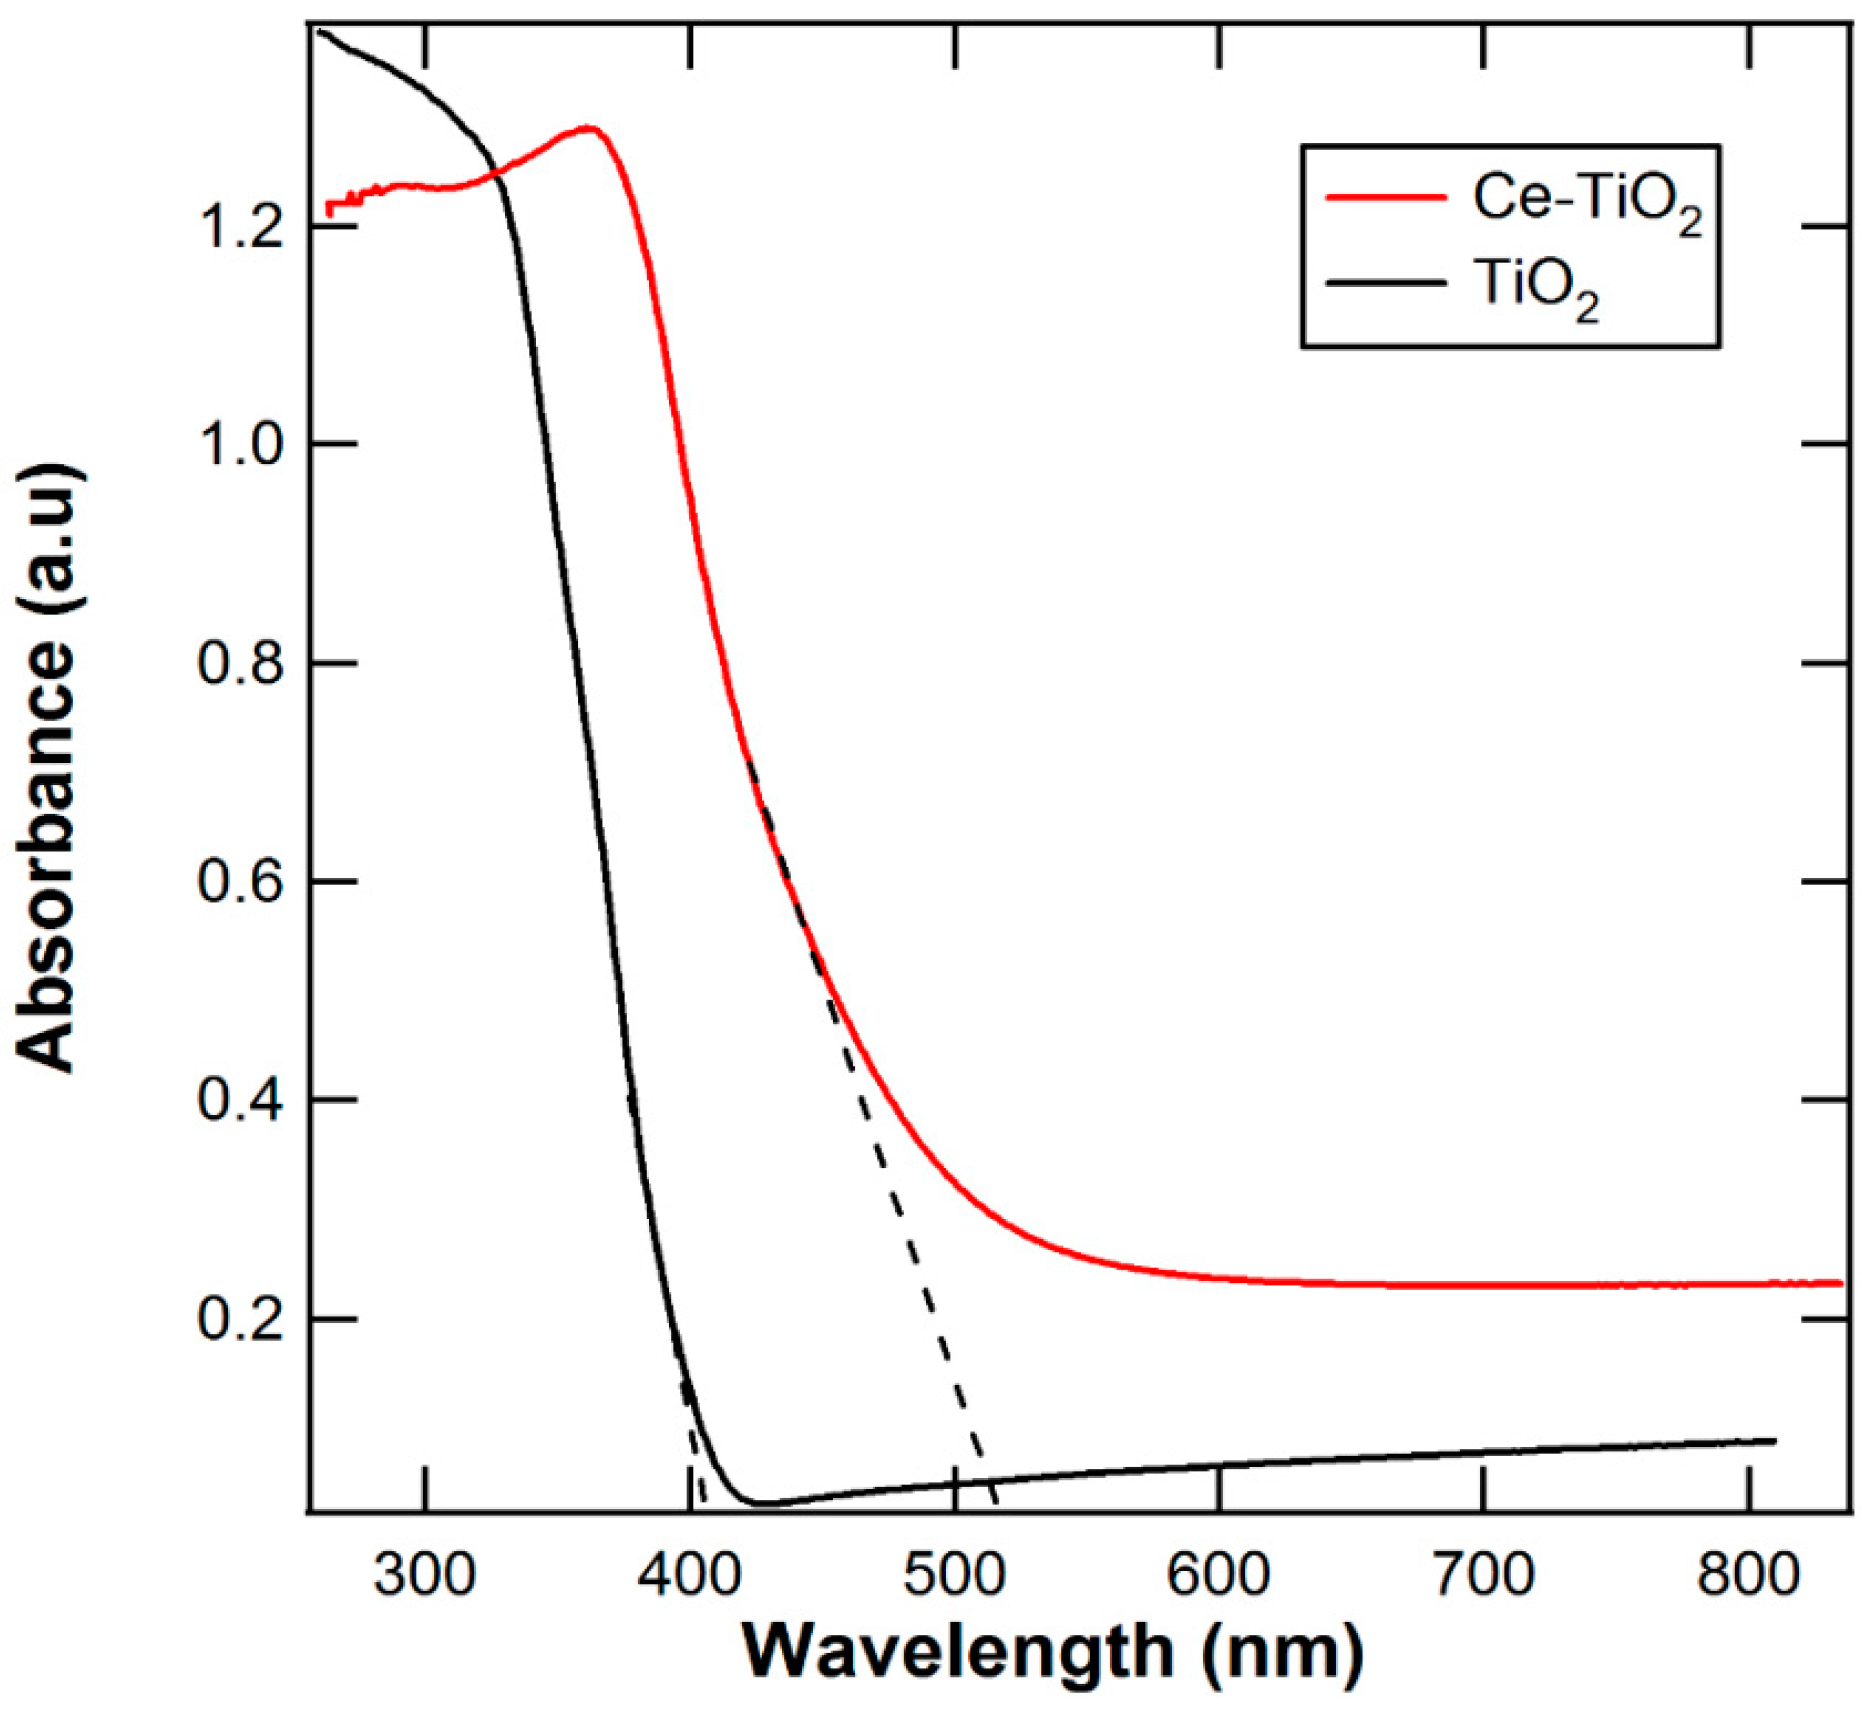
The UV-Vis Spectroscopy measurement was performed at Lambda 950 at the Brookhaven National Laboratory (BNL-CFN). Using the Kubelka–Munk function, the band gap of the samples can be calculated by the absorption edge position according to the formula: Eg = 1240/λ, in which λ is the wavelength of the absorption edge in the spectra [23]. Figure 7 shows the UV spectra of TiO2 and Ce–TiO2. The absorption spectrum of the pure TiO2 nanoparticle was cut off at ~405 nm, from which the band gap of the pure TiO2 was around 3.06 eV, which did not have any absorption in the visible range. For the Ce–TiO2 nanoparticles, the cut-off edge of the absorption spectrum shifted to 510 nm and the calculated band gap was 2.43 eV. The presence of CeO2 on the TiO2 enhanced the absorption in the visible range significantly. F.Li et al. explained that the 4f orbital energy level of Ce is below the conduction band of TiO2, the electrons of the valence band of Ce–TiO2 and the ground state of Ce2O3 can be excited into the Ce 4f energy level under visible light irradiation, leading to light absorption wavelength red shift [24].
Figure 8 shows the photodegradation of methylene blue (MB), which was carried out under a UV-Vis spectrophotometer 50W Xenon light source with Air Mass Coefficient (AM) of 1.5 and 400 nm cut-on filters. The degradation of MB was monitored by measuring the absorbance at the 665-nm wavelength. An amount of 0.018 g of the catalyst was mixed with the 50-ppm aqueous MB solution and then stirred in the dark for a day to attain adsorption-desorption equilibrium. The data displayed in Figure 8 indicated that Ce–TiO2 had higher photocatalytic activity under visible light irradiation than pure TiO2. This behavior might be associated with the separation of photo-induced electron–hole pairs. Ce traps electrons and prevents the electron–hole recombination. It enhances the photocatalytic activity of the TiO2 with increasing superoxide anion radicals and hydroxyl radical generation [25], which is beneficial for reacting with organic contaminants according to the following equations:
When a photocatalytic reaction is conducted in an aqueous medium, the holes were effectively scavenged and generated hydroxyl radicals OH•, which are strong oxidant species with respect to very oxidative degradation for organic substrates. Both holes and hydroxyl radicals have been proposed as the oxidizing species responsible for the degradation (mineralization) of the organic substrates.
The charge transfer dynamics were also investigated by the photocurrent measurements in which the generation and the transfer of the photo-excited charge carriers in the photocatalytic process is monitored by the photocurrent generation. Generally, a higher photocurrent means a higher electrons and holes separation efficiency [26]. The photoelectrochemical experiment was examined in a three-electrode configuration with the catalyst as a working electrode, an Ag/AgCl reference electrode, and a platinum wire counter electrode. Figure 9 shows current-potential curves for Ce–TiO2 particles in the dark and under simulated AM 1.5 illuminations. The electrolyte was a 0.1 M KOH solution. The photocurrent under dark conditions is around 34 µA/cm2 and the photocurrent under light illumination increased to 290 µA/cm2. These results show that Ce–TiO2 possesses high separation efficiency of charge carriers and is a promising improvement for photocatalyst applications.
3. Materials and Methods
3.1. Synthesis of Pure TiO2 and Ce–TiO2
In this work, Metal alkoxide precursors were used thanks to the chemical homogeneity of the various elements, which can be controlled down to the atomic level. To prepare the CeO2–TiO2 precursor solution, 0.6 M of Titanium (IV) isopropoxide (Sigma-Aldrich, St. Louis, MO, USA) dissolved in ethanol and 0.19 M of cerium (III) nitrate hexahydrate (Ce(NO3)3·6H2O, Aldrich Sigma-Aldrich, St. Louis, MO, USA) were mixed within a N2-filled glove box. This solution was supplied at a rate of 5 mL/min through the FSP nozzle and dispersed to a fine spray together with 5 L/min oxygen gas. The fine spray was ignited by a supporting gas rate (CH4: 1.5 L/min and O2: 3.2 L/min). At the nozzle, the pressure was kept constant at 2.5 bar. The synthesized powder was deposited on a glass fiber filter. The turnkey bench-top flame spray pyrolysis unit (NanoPowder Synthesizer nps 10TM by TETHIS, Milan, Italy) was used to synthesize nanoparticles. This system was designed to accelerate nanomaterial production, and it provides the production of mixed and complex oxide nanomaterials.
3.2. Characterization
The nanoparticles synthesized through FSP were characterized by X-ray diffraction (XRD), transmission electron microscopy (TEM, JEOL 1400), and field emission scanning electron microscopy (SEM, LEO 1550 ZEISS, Oberkochen, Germany). The optical absorption of these nanoparticles were examined through UV-Vis spectroscopy (UV-Vis, Jasco J-815, Easton, MD, USA).
3.3. Photocatalytic Degradation of Methylene Blue (MB)
First, a 50-ppm methylene blue (MB) dye solution was prepared and mixed with 0.0017 g of the photocatalyst. This mixture was then kept in the dark for 1 hour to achieve adsorption-desorption equilibrium. A light source, a 150 W Xenon lamp (Newport, Irvine, CA, USA) with an AM 1.5 G filter, was used as the source for UV-visible light and visible light with a 400 nm cut-on filter in the same setup. Before the solution was placed under UV or visible light, about 2 mL of the sample was pipetted out for an optical absorption measurement, which was recorded as 0-minute absorbance. The solution was then kept under visible light for 3 h. For every 30 min, 1.7 mL of the solution was taken out to measure its absorbance value, which was transferred back to the reaction vessel after each measurement. The degradation of methylene blue was evaluated by studying the changes in the strongest absorbance band at the wavelength of 665 nm using UV-Vis spectrophotometer (HR 4000, Ocean Optic, Seminole, FL, USA) with halogen and deuterium lamps as light sources.
3.4. Photoelectrochemical Characterization
Photoelectrochemical measurements were performed on a measurement station equipped with a VersaStat potentiostat (Princeton Applied Research, Oak Ridge, TN, USA) three-electrode, single-compartment glass cell fitted with a quartz window. Working electrodes were prepared by mixing prepared catalyst with PVP in isopropanol alcohol and drop casting onto an ITO glass substrate (illumination area of 1.0 cm2 (Sigma-Aldrich, St. Louis, MO, USA) to form a thin film and then the films were annealed at 500 °C for 10 min with a rapid thermal processor (RTP). We used a 0.1 M KOH solution as the electrolyte. A platinum wire was used as a counter electrode. We used an Ag/AgCl (3 M KCl) electrode as the reference electrode. The potentiostat was employed for the chronoamperometry measurements. The surface of the working electrode was illuminated with a 150 W Xenon lamp (Newport, Irvine, CA, USA) equipped with an AM 1.5 G (Newport, Irvine, CA, USA) giving 113.0 mW/cm2 light intensity.
4. Conclusions
TiO2 and Ce–TiO2 nanoparticles have been successfully prepared by the one-step flame-sprayed process and were characterized to determine their morphology, structure, optical properties, and photoelectrochemical properties. Resulting pure TiO2 and Ce–TiO2 nanostructures were composed of crystalline spherical particles with the majority of particles having the size range of 5–45 nm. The absorption band of samples shifted to visible range when Ce was added. This scalable technique might be easily transferred to industrial scale manufacturing, which offers new solutions to problems such as environmental cleanup and energy production from solar input. The present results herein could also provide a beneficial outcome for the design of high-performance semiconductor photocatalysts.
Author Contributions
Conceptualization, P.-I.G., F.M., S.T., and, G.J.; Validation, F.M. and G.J.; Analysis, Tests, and Characterization S.T., G.J., and, F.M.; Writing (Original Draft Preparation), S.T. and, G.J., and F.M.; Writing (Review & Editing), F.M. and G.J., and P.-I.G.; Supervision, P.-I.G.; Project Administration, P.-I.G.; Funding Acquisition, P.-I.G.
Funding
This work has been partially supported by the NSF DMR 1106168 and CMMI 1724342. Research carried out in part at the Center for Functional Nanomaterials, Brookhaven National Laboratory, which is supported by the U.S. Department of Energy, Office of Basic Energy Sciences, under Contract No. DE-AC02-98CH10886.
Conflicts of Interest
The authors declare no conflict of interest.
References
- Ohno, T.; Akiyoshi, M.; Umebayashi, T.; Asai, K.; Mitsui, T.; Matsumura, M. Preparation of S-doped TiO2 photocatalysts and their photocatalytic activities under visible light. Appl. Catal. A 2004, 265, 115–121. [Google Scholar] [CrossRef]
- Xu, A.-W.; Gao, Y.; Liu, H.-Q. The preparation, characterization, and their photocatalytic activities of rare-earth-doped TiO2 nanoparticles. J. Catal. 2002, 207, 151–157. [Google Scholar] [CrossRef]
- Cong, Y.; Zhang, J.; Chen, F.; Anpo, M. Synthesis and characterization of nitrogen-doped TiO2 nanophotocatalyst with high visible light activity. J. Phys. Chem. C 2007, 111, 6976–6982. [Google Scholar] [CrossRef]
- Teoh, W.Y.; Amal, R.; Madler, L. Flame spray pyrolysis: An enabling technology for nanoparticles design and fabrication. Nanoscale 2010, 2, 1324–1347. [Google Scholar] [CrossRef] [PubMed]
- Teoh, W.Y. A perspective on the flame spray synthesis of photocatalyst nanoparticles. Materials 2013, 6, 3194–3212. [Google Scholar] [CrossRef] [PubMed]
- Kemmler, J.A.; Pokhrel, S.; Mädler, L.; Weimar, U.; Barsan, N. Flame spray pyrolysis for sensing at the nanoscale. Nanotechnology 2013, 24, 442001. [Google Scholar] [CrossRef] [PubMed]
- Sahm, T.; Mädler, L.; Gurlo, A.; Barsan, N.; Pratsinis, S.E.; Weimar, U. Flame spray synthesis of tin dioxide nanoparticles for gas sensing. Sensors Actuators B Chem. 2004, 98, 148–153. [Google Scholar] [CrossRef]
- Schimmoeller, B.; Pratsinis, S.E.; Baiker, A. Flame aerosol synthesis of metal oxide catalysts with unprecedented structural and catalytic Properties. ChemCatChem 2011, 3, 1234–1256. [Google Scholar] [CrossRef]
- Pratsinis, S.E. Flame aerosol synthesis of ceramic powders. Prog. Energy Combust. Sci. 1998, 24, 197–219. [Google Scholar] [CrossRef]
- Tian, B.; Li, C.; Gu, F.; Jiang, H.; Hu, Y.; Zhang, J. Flame sprayed V-doped TiO2 nanoparticles with enhanced photocatalytic activity under visible light irradiation. Chem. Eng. J. 2009, 151, 220–227. [Google Scholar] [CrossRef]
- Stark, W.J.; Maciejewski, M.; Mädler, L.; Pratsinis, S.E.; Baiker, A. Flame-made nanocrystalline ceria/zirconia: Structural properties and dynamic oxygen exchange capacity. J. Catal. 2003, 220, 35–43. [Google Scholar] [CrossRef]
- Kho, Y.K.; Teoh, W.Y.; Mädler, L.; Amal, R. Dopant-free, polymorphic design of TiO2 nanocrystals by flame aerosol synthesis. Chem. Eng. Sci. 2011, 66, 2409–2416. [Google Scholar] [CrossRef]
- Elidrissi, B.; Addou, M.; Regragui, M.; Monty, C.; Bougrine, A.; Kachouane, A. Structural and optical properties of CeO2 thin films prepared by spray pyrolysis. Thin Solid Films 2000, 379, 23–27. [Google Scholar] [CrossRef]
- Chaisuk, C.; Wehatoranawee, A.; Preampiyawat, S.; Netiphat, S.; Shotipruk, A.; Mekasuwandumrong, O. Preparation and characterization of CeO2/TiO2 nanoparticles by flame spray pyrolysis. Ceram. Int. 2011, 37, 1459–1463. [Google Scholar] [CrossRef]
- Liu, Z.; Guo, B.; Hong, L.; Jiang, H. Preparation and characterization of cerium oxide doped TiO2 nanoparticles. J. Phys. Chem. Solids 2005, 66, 161–167. [Google Scholar] [CrossRef]
- Teleki, A.; Bjelobrk, N.; Pratsinis, S.E. Flame-made Nb-and Cu-doped TiO2 sensors for CO and ethanol. Sensor. Actuat. B Chem. 2008, 130, 449–457. [Google Scholar] [CrossRef]
- Teoh, W.Y.; Amal, R.; Mädler, L.; Pratsinis, S.E. Flame sprayed visible light-active Fe-TiO2 for photomineralisation of oxalic acid. Catal. Today 2007, 120, 203–213. [Google Scholar] [CrossRef]
- Michalow-Mauke, K.A.; Lu, Y.; Kowalski, K.; Graule, T.; Nachtegaal, M.; Kröcher, O.; Ferri, D. Flame-Made WO3/CeOx−TiO2 catalysts for selective catalytic reduction of NOx by NH3. ACS Catal. 2015, 5, 5657–5672. [Google Scholar] [CrossRef]
- Lee, W.; Do, Y.R.; Dwight, K.; Wold, A. Enhancement of photocatalytic activity of titanium(IV) oxide with molybdenum(VI) oxide. Mater. Res. Bull. 1993, 28, 1127–1134. [Google Scholar] [CrossRef]
- Mädler, L.; Stark, W.J.; Pratsinis, S.E. Flame-made ceria nanoparticles. J. Mater. Res. 2011, 17, 1356–1362. [Google Scholar] [CrossRef]
- Zhang, H.; Banfield, J.F. Understanding polymorphic phase transformation behavior during growth of nanocrystalline aggregates: Insights from TiO2. J. Phys. Chem. B 2000, 104, 3481–3487. [Google Scholar] [CrossRef]
- Gouma, P.I.; Dutta, P.K.; Mills, M.J. Structural stability of titania thin films. Nanostruct. Mater. 1999, 11, 1231–1237. [Google Scholar] [CrossRef]
- Zhao, W.; Ma, W.; Chen, C.; Zhao, J.; Shuai, Z. Efficient degradation of Toxic Organic Pollutants with Ni2O3/TiO2−xBx under Visible Irradiation. J. Am. Chem. Soc. 2004, 126, 4782–4783. [Google Scholar] [CrossRef] [PubMed]
- Li, F.B.; Li, X.Z.; Hou, M.F.; Cheah, K.W.; Choy, W.C.H. Enhanced photocatalytic activity of Ce3+–TiO2 for 2-mercaptobenzothiazole degradation in aqueous suspension for odour control. Appl. Catal. A Gen. 2005, 285, 181–189. [Google Scholar] [CrossRef] [Green Version]
- Ismail, A.A.; Bouzid, H. Synthesis of mesoporous ceria/titania thin films for self-cleaning applications. J. Colloid Interface Sci. 2013, 404, 127–134. [Google Scholar] [CrossRef] [PubMed]
- Huang, H.; He, Y.; Lin, Z.; Kang, L.; Zhang, Y. Two novel Bi-based borate photocatalysts: Crystal structure, electronic structure, photoelectrochemical properties, and photocatalytic activity under simulated solar light irradiation. J. Phys. Chem. C 2013, 117, 22986–22994. [Google Scholar] [CrossRef]
Figure 1.
Results of XRD analysis of pure TiO2 and Ce–TiO2 (A: anatase, R: rutile, C: CeO2).

Figure 2.
SEM images of (a) TiO2 and (b) Ce–TiO2.

Figure 3.
Results of TEM images of (a) pure TiO2 and (c) Ce–TiO2 and the selected area electron diffraction (SAED) pattern of (b) pure TiO2 and (d) Ce–TiO2.
Figure 3.
Results of TEM images of (a) pure TiO2 and (c) Ce–TiO2 and the selected area electron diffraction (SAED) pattern of (b) pure TiO2 and (d) Ce–TiO2.

Figure 4.
(a) Thresholding of the TEM micrographs of Ce–TiO2; (b) Histogram of the size distribution of the particles; (c) Pareto Diagram of the distribution of the particles; (d) Lognormal and Weibull distribution curves.
Figure 4.
(a) Thresholding of the TEM micrographs of Ce–TiO2; (b) Histogram of the size distribution of the particles; (c) Pareto Diagram of the distribution of the particles; (d) Lognormal and Weibull distribution curves.

Figure 5.
HRTEM images of Ce–TiO2 showing phases marked by arrow heads.

Figure 6.
The STEM images of Ce–TiO2 mapping (a) TEM image; (b) O (K) blue color); (c) Ti (K) green color; (d) Ce (L) red color; (e) EDX (Energy-dispersive X-ray) result of selected area.
Figure 6.
The STEM images of Ce–TiO2 mapping (a) TEM image; (b) O (K) blue color); (c) Ti (K) green color; (d) Ce (L) red color; (e) EDX (Energy-dispersive X-ray) result of selected area.

Figure 7.
UV-Vis Spectra of TiO2 and Ce–TiO2.

Figure 8.
Plot for the photocatalytic test of the as-sprayed nanoparticles; time-concentration chart of methylene blue degradation using nanoparticles under visible spectrum (k > 400 nm).
Figure 8.
Plot for the photocatalytic test of the as-sprayed nanoparticles; time-concentration chart of methylene blue degradation using nanoparticles under visible spectrum (k > 400 nm).

Figure 9.
Current density (j)-potential curve of simulated Air Mass Coefficient (AM) 1.5 illumination for as-sprayed Ce–TiO2. FSP, flame spray pyrolysis.
Figure 9.
Current density (j)-potential curve of simulated Air Mass Coefficient (AM) 1.5 illumination for as-sprayed Ce–TiO2. FSP, flame spray pyrolysis.


Table 1.
The size and structure of TiO2 and Ce–TiO2.
| Sample | Crystallite Size, nm | Phase Content, % | ||||
|---|---|---|---|---|---|---|
| Anatase | Rutile | CeO2 | Anatase | Rutile | CeO2 | |
| TiO2 | 27 | 28 | - | 92 | 8 | - |
| Ce–TiO2 | 25 | 32 | 18 | 84 | 12 | 4 |
| P25 | 24 | 35 | 75 | 25 | ||
© 2018 by the authors. Licensee MDPI, Basel, Switzerland. This article is an open access article distributed under the terms and conditions of the Creative Commons Attribution (CC BY) license (http://creativecommons.org/licenses/by/4.0/).
Share and Cite
MDPI and ACS Style
Mikaeili, F.; Topcu, S.; Jodhani, G.; Gouma, P.-I. Flame-Sprayed Pure and Ce-Doped TiO2 Photocatalysts. Catalysts 2018, 8, 342. https://doi.org/10.3390/catal8090342
AMA Style
Mikaeili F, Topcu S, Jodhani G, Gouma P-I. Flame-Sprayed Pure and Ce-Doped TiO2 Photocatalysts. Catalysts. 2018; 8(9):342. https://doi.org/10.3390/catal8090342
Chicago/Turabian StyleMikaeili, Fateh, Selda Topcu, Gagan Jodhani, and Pelagia-Irene Gouma. 2018. "Flame-Sprayed Pure and Ce-Doped TiO2 Photocatalysts" Catalysts 8, no. 9: 342. https://doi.org/10.3390/catal8090342
Note that from the first issue of 2016, this journal uses article numbers instead of page numbers. See further details here.