1. Introduction
Me-N-C catalysts play an emerging role as possible catalyst materials for the oxygen reduction reaction in fuel cells. It is clear that they can be prepared from any kind of metal, nitrogen and carbon precursor, but that the overall achievable activity will be strongly related to the optimization of the mixtures. In the first approaches, macrocycles were supported on a carbon black and then pyrolysed at temperatures above 600 °C to form significantly more active catalysts in comparison to the non-pyrolysed macrocycles [
1,
2]. To enable cheaper preparation and independent optimization of metal and nitrogen content in the synthesis, alternative preparation approaches had to be established. In 1989, Gupta et al. showed that the combination of metal acetate with polyacrylonitrile and carbon black leads to the formation of active materials when pyrolysed at temperatures >600 °C [
3]. Main efforts to find suitable nitrogen and metal precursors were made by Dodelet’s group and others [
4,
5,
6,
7]. These early approaches were strongly limited in the density of active sites, as the carbon black always displays a relative mass in the final catalyst that is not contributing in terms of active sites [
8,
9,
10,
11].
To overcome this limitation, the first method that enabled the preparation of Me-N-C catalysts without additional carbon support, is the oxalate-supported pyrolysis of porphyrins [
12]. In this approach oxalate works as a structure-forming agent (SFA) as the final catalyst resembles its morphology [
13,
14,
15]. In addition to this, the use of sulfur strongly affected the morphology and performance of the catalysts [
16,
17]. Sulfur usually enables a higher porosity and lower graphitization [
16,
18], but more important it was found to prevent carbide formation that was assigned to active site destruction by works of us and of others [
17,
19,
20]. That indeed excess iron was at the origin of active site destruction was further confirmed through an alternative strategy to prevent active site destruction [
21]. Namely, instead of following the state-of-the art preparation protocol (pyrolysis plus acid leaching), the pyrolysis was interrupted at 550 °C (a temperature below the temperature limit for iron carbide formation), excess iron was removed by an acid leaching. Afterwards the synthesis was continued up to the usual end temperature followed by an additional acid-leaching. Indeed, such catalysts prepared with intermediate acid leaching (IAL) reach the same activities as the original sulfur-added catalysts.
Motivated by these findings, we started to develop a new synthesis route in our group that uses dicyandiamide (DCDA) as a structure-forming agent in combination with a nitrogen and iron precursor. In recent studies we varied the amount of sulfur within this synthesis [
22]. The trends in kinetic current density as a function of S/Me ratio were similar to trends observed previously for the combination of iron oxalate with CoTMPP [
23], with a maximum in ORR activity at S/Fe = 0.8. However, in contrast to these earlier finding, our new catalysts still contained considerable fractions of iron carbide in the optimum of ORR activity. Only for the highest S/Me ratios iron carbide formation was inhibited but iron sulfide species were formed [
22]. This showed us, that while sulfur-addition strongly affects the achievable ORR activity, sulfur itself helps not to prevent iron carbide formation in our selected system.
In order to get more insights on the missing parameter that is required for further optimization, we focused on a molar ratio of S/Fe = 0.8 in this work and stepwise exchanged the DCDA with oxalic acid as alternative a structure-forming agent with strong similarities to the metal oxalates used within the oxalate-supported pyrolysis of porphyrins [
14]. The results show that by tuning the composition of the SFAs the activity and morphology is changing considerably.
2. Results and Discussion
In the following chapter, the composition of the precursor is expressed as the relative oxalate content which is the molar fraction of oxalic acid in the overall sum of structure-forming agent (SFA = oxalic acid and DCDA). In
Figure 1a,b the yield and the BET surface area; respectively, are given as a function of the relative oxalate content within the SFA.
The values plotted as squares in
Figure 1a were all obtained after pyrolysis and acid leaching; the yields after the pyrolysis only are shown as triangles. Due to strong gas evolution, the pyrolysis product of the catalyst with only DCDA as SFA was transferred out of the quartz boat. Therefore, no yield without acid leaching is given for this catalyst (and for all other syntheses it was taken care that sufficiently large boats were used). In general, the yields of final catalysts are larger when DCDA is used as SFA in comparison to oxalic acid. One important aspect can be noted from the comparison of the yields after pyrolysis and after pyrolysis plus acid-leaching: In all cases, the as-obtained yield after pyrolysis was larger compared to the yield after pyrolysis plus acid leaching. This is expected, as it is supposed that during the acid-leaching, inorganic iron species which were formed during the pyrolysis are leached [
24,
25]. However, for the sample prepared with 80% oxalic acid in the SFA the yield increases during acid leaching. This illustrates, that beside a possible removal of some species, the implementation of additional ones must have appeared so that the yield could increase. From the ratio of the yield after pyrolysis and acid leaching in relation to the yield just after pyrolysis the values as plotted in
Figure 1b are obtained. The observed trend for this curve, is almost opposite with respect to the trend observed for the BET surface area. Hence, it can be concluded, that a not successful leaching (or change from an anhydrous iron species to a hydrated one) is at the origin of the low surface area observed for this catalyst.
The data for the catalyst at 80% oxalic acid as SFA is highlighted in both graphs of
Figure 1. Initially, we assumed that these out-of-trend values of yield and BET surface area were due to failures during the synthesis of this catalyst. However, repeating the synthesis confirmed the reproducibility in all respects. This catalyst (80% oxalic acid in SFA) will therefore not be included in detail in the following discussion, as it seems that the precursor combination leads to undesired reactions, most probably already in the precursor stage. This is shortly addressed in
Section 3.1.
The results of N
2 sorption measurements are summarized in
Table 1. As indicated, only some of the catalysts contain surface areas within the micropore regime (<20 nm); most of the samples are basically mesoporous.
It becomes clear that in order to obtain a significant fraction of micropores, both nitrogen and oxygen-containing SFAs should be used at the same time. In order to be able to verify to what extent it is the microporosity that is of importance for the high activity, further experiments are required.
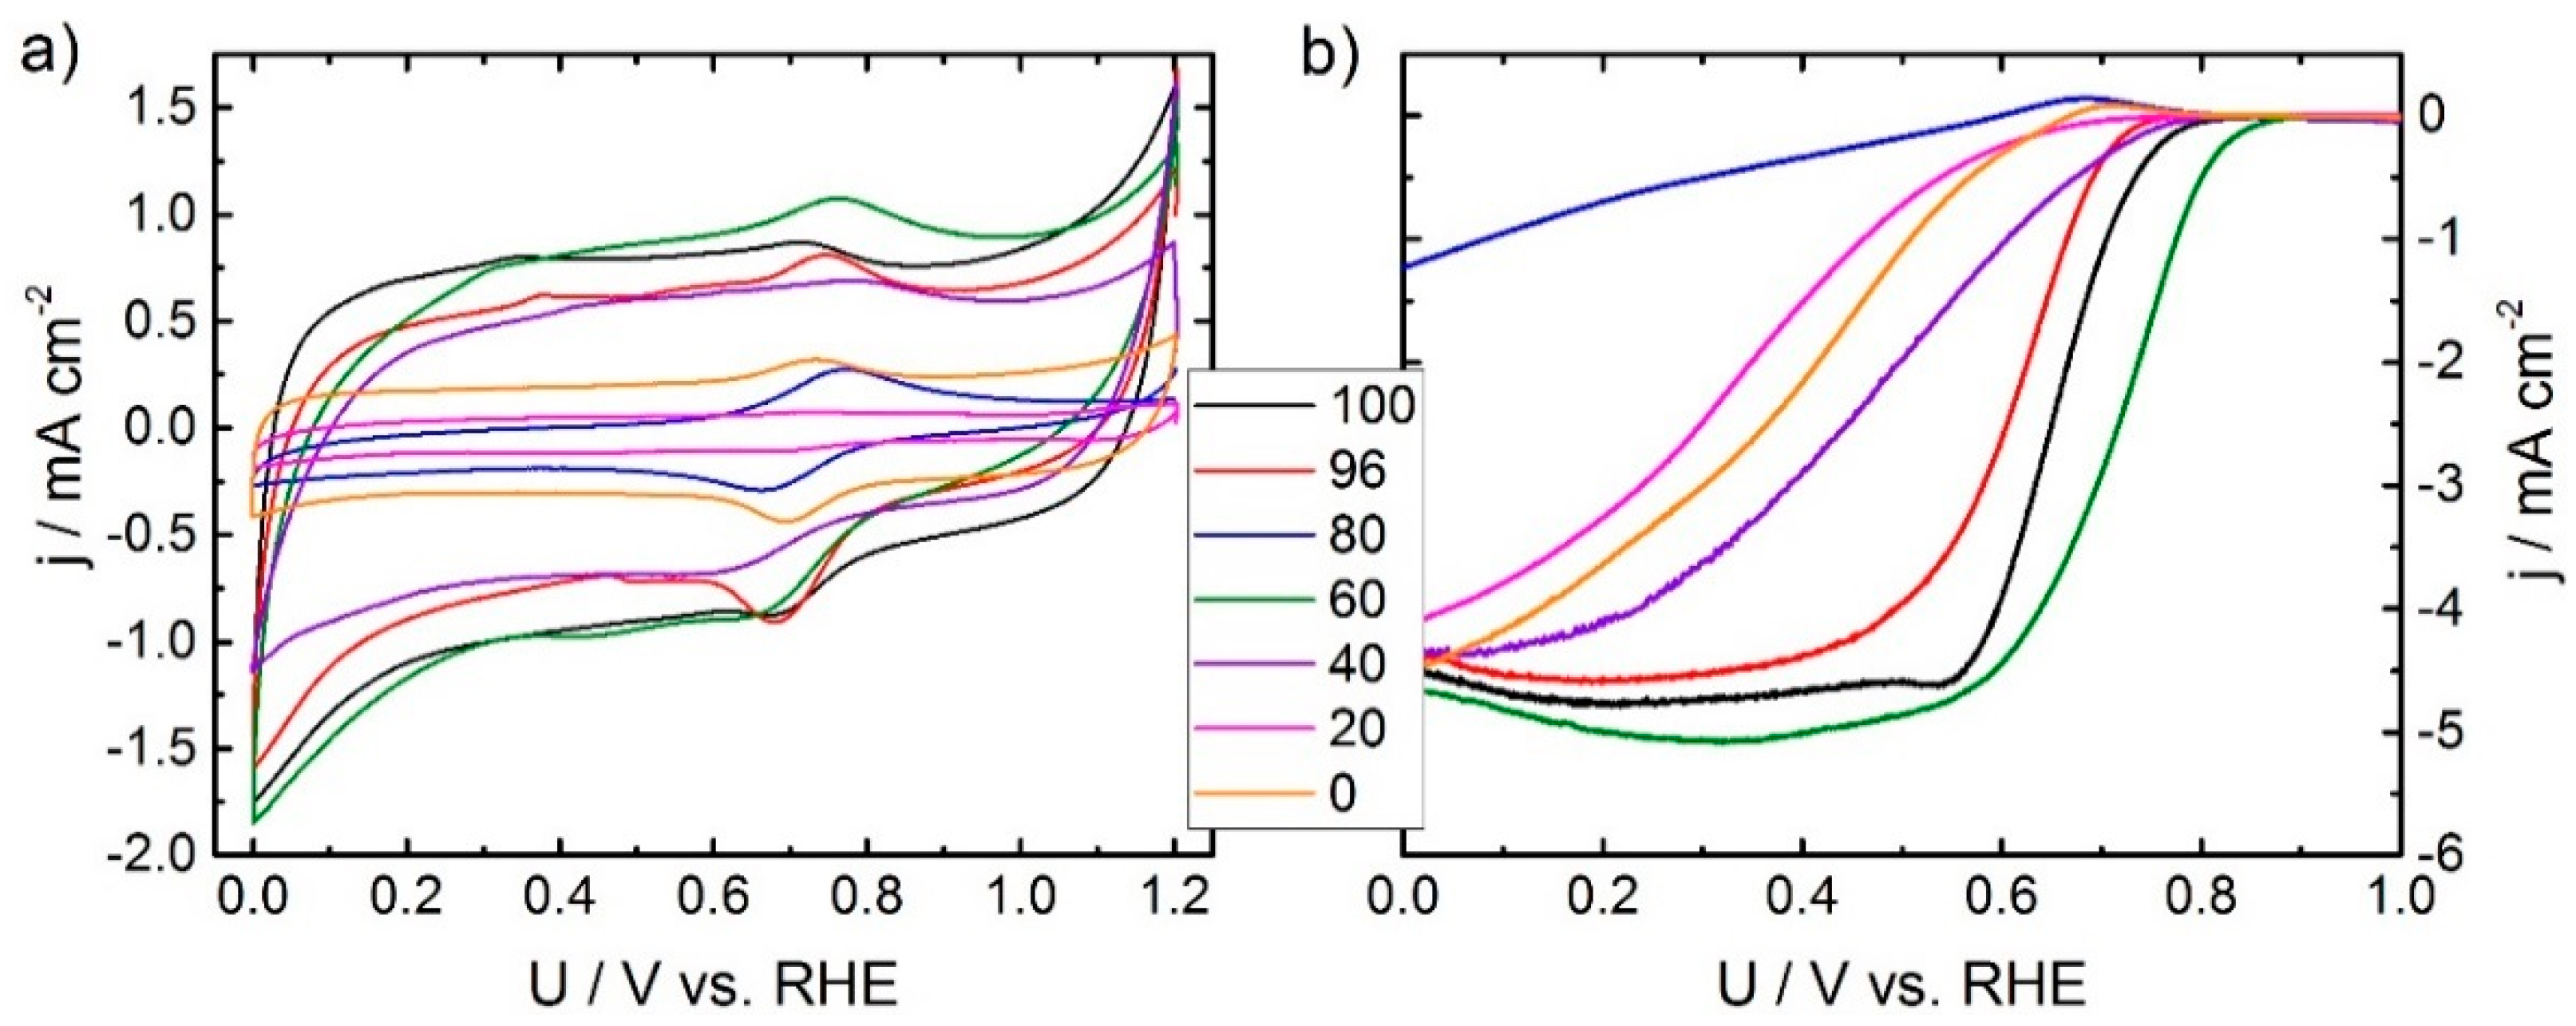
In order to see the impact of the synthesis on the electrochemical performance, cyclic voltammetry and RDE experiments were performed in N
2 saturated and O
2 saturated electrolytes, respectively. The results are given in
Figure 2. It becomes clear that there is a strong impact of the SFA-ratio on the capacitive current density. Interestingly, all catalysts exhibit a redox peak at about 0.7 V. Furthermore, for some catalysts a peak in the anodic sweep is visible between 0.3 and 0.4 V. This peak was also previously observed for phenanthroline-based catalysts but usually vanishes upon cycling. So far, we were not able to make a final assignment. For the intense redox peak at ~0.7 V it might be assigned either to Fe
2+/Fe
3+ couple or quinone/hydroquine [
11]. Considering the double layer capacity, it roughly seems to increase with an increasing ratio of oxalic acid (maximum for the sample with a ratio of 60%) and then to drop down (see discussion below).
During RDE experiments it is again the 60% sample that gives the highest onset potential and largest kinetic current density in comparison to all other samples. Most of the samples give the usual shape of RDE curves, but at lower fractions of oxalic acid, the curves indicate some kinetic hindrance. It should be noted that none of the catalysts reach the expected diffusion limiting current density for a four electron reduction (expected value 5.9 mA cm
−2) [
26]. There are two different explanations possible: First, the selectivity is changing according to the observed value of maximum current density. To further verify this, it would be important to perform experiments with the Rotating Ring Disc Electrode (RRDE) and to have a more detailed analysis of the composition of the catalysts by ideally X-ray induced photoelectron spectroscopy and Mößbauer spectroscopy. Unfortunately, this is beyond the scope of this publication but might be addressed in a future work. Second, it is well known for Me-N-C catalysts that the observable diffusion limiting current density is depending on the loading. This might be due to a 2 × 2 electron mechanism, where the probability of re-adsorbing and further reducing any of the formed hydrogen peroxide increases with catalyst film thickness on the electrode [
27,
28]. Also here, RRDE experiments at different loadings would assist in answering this question. Both, the cyclic voltammogram (CV) and RDE curves of the outlier related to 80% look pretty much like iron oxide species.
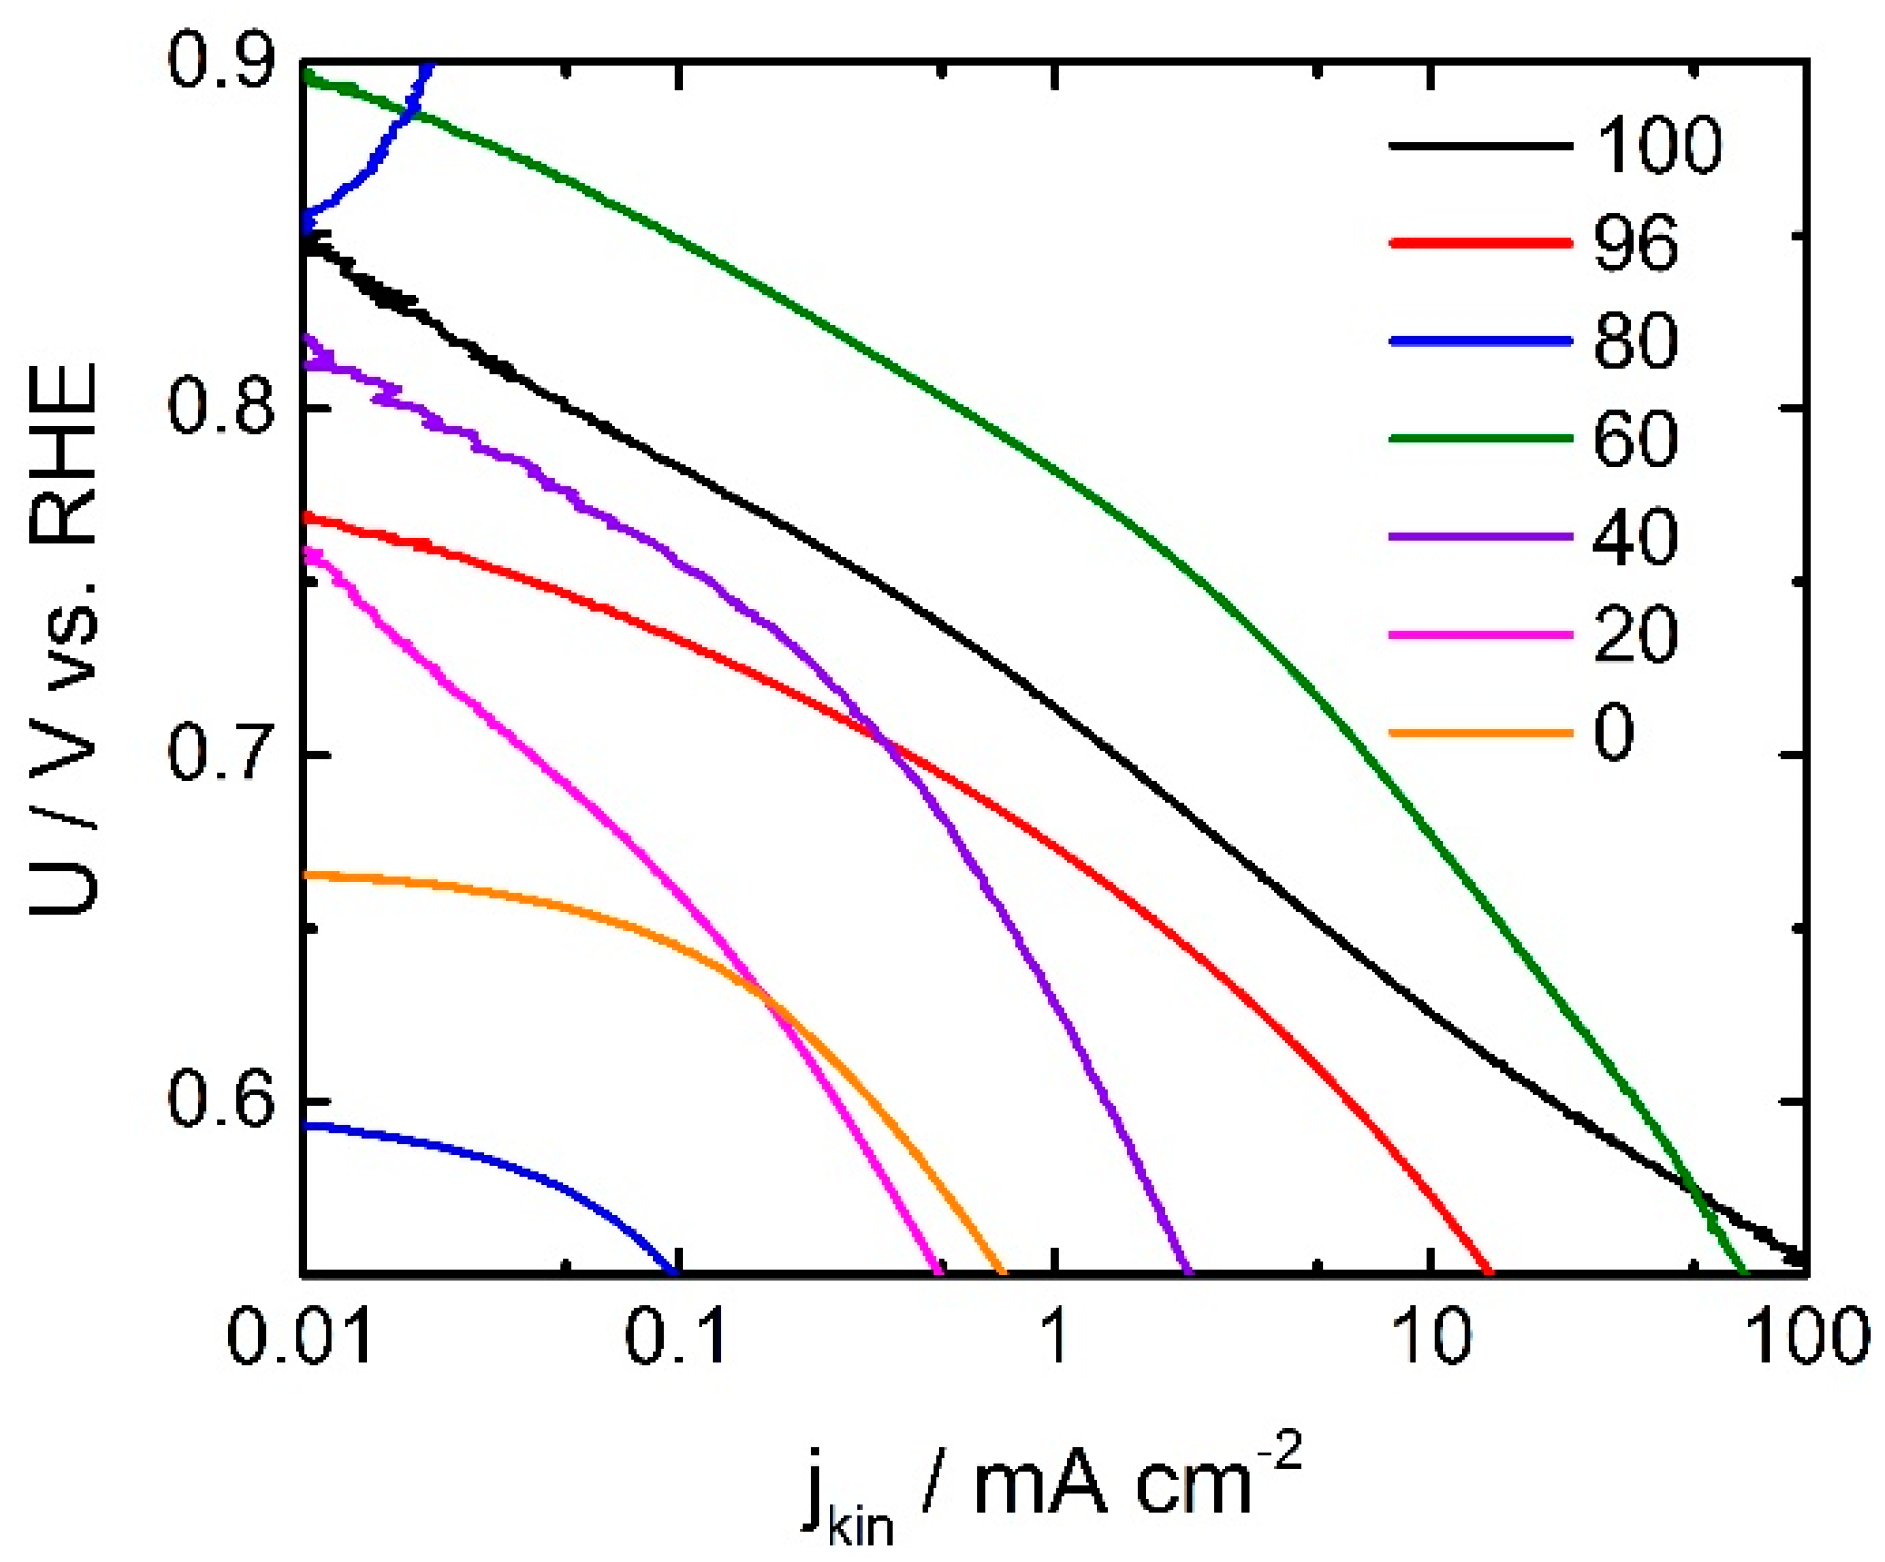
In
Figure 3 the Tafel plots of all investigated catalysts are shown. It becomes apparent that the ORR activity in terms of kinetic current density changes drastically with the ratio of oxalic acid in the SFA. The Tafel slopes of the more-active catalysts show values of about 70 mV dec
−1. This value is in good agreement with the values that were observed for other catalysts prepared by the (oxalate supported) pyrolysis of porphyrins [
15,
24,
29] as well as alternatively prepared catalysts (without the use of a reactive gas heat-treatment) [
19]. When the fraction of oxalic acid goes down the Tafel slope increases, getting closer to 100 mV dec
−1. While not intended, this might be related to an interaction of the catalyst with ammonia (from DCDA decomposition) during the heat-treatment. A larger Tafel slope value for catalysts that involve ammonia in their preparation was also previously observed [
19]. The lowest value of 64 mV dec
−1 is obtained for the catalyst with exclusively oxalic acid as SFA. It might illustrate slightly better kinetics that might result in a higher turn-over frequency (TOF). If a change in the TOF is also at the origin of the observed changes in Tafel slope, in this work, it might be concluded that the catalyst with 60% oxalic acid in the SFA need to have a significant higher number of ORR active sites. This will be discussed below with respect to the data from combustion analysis.
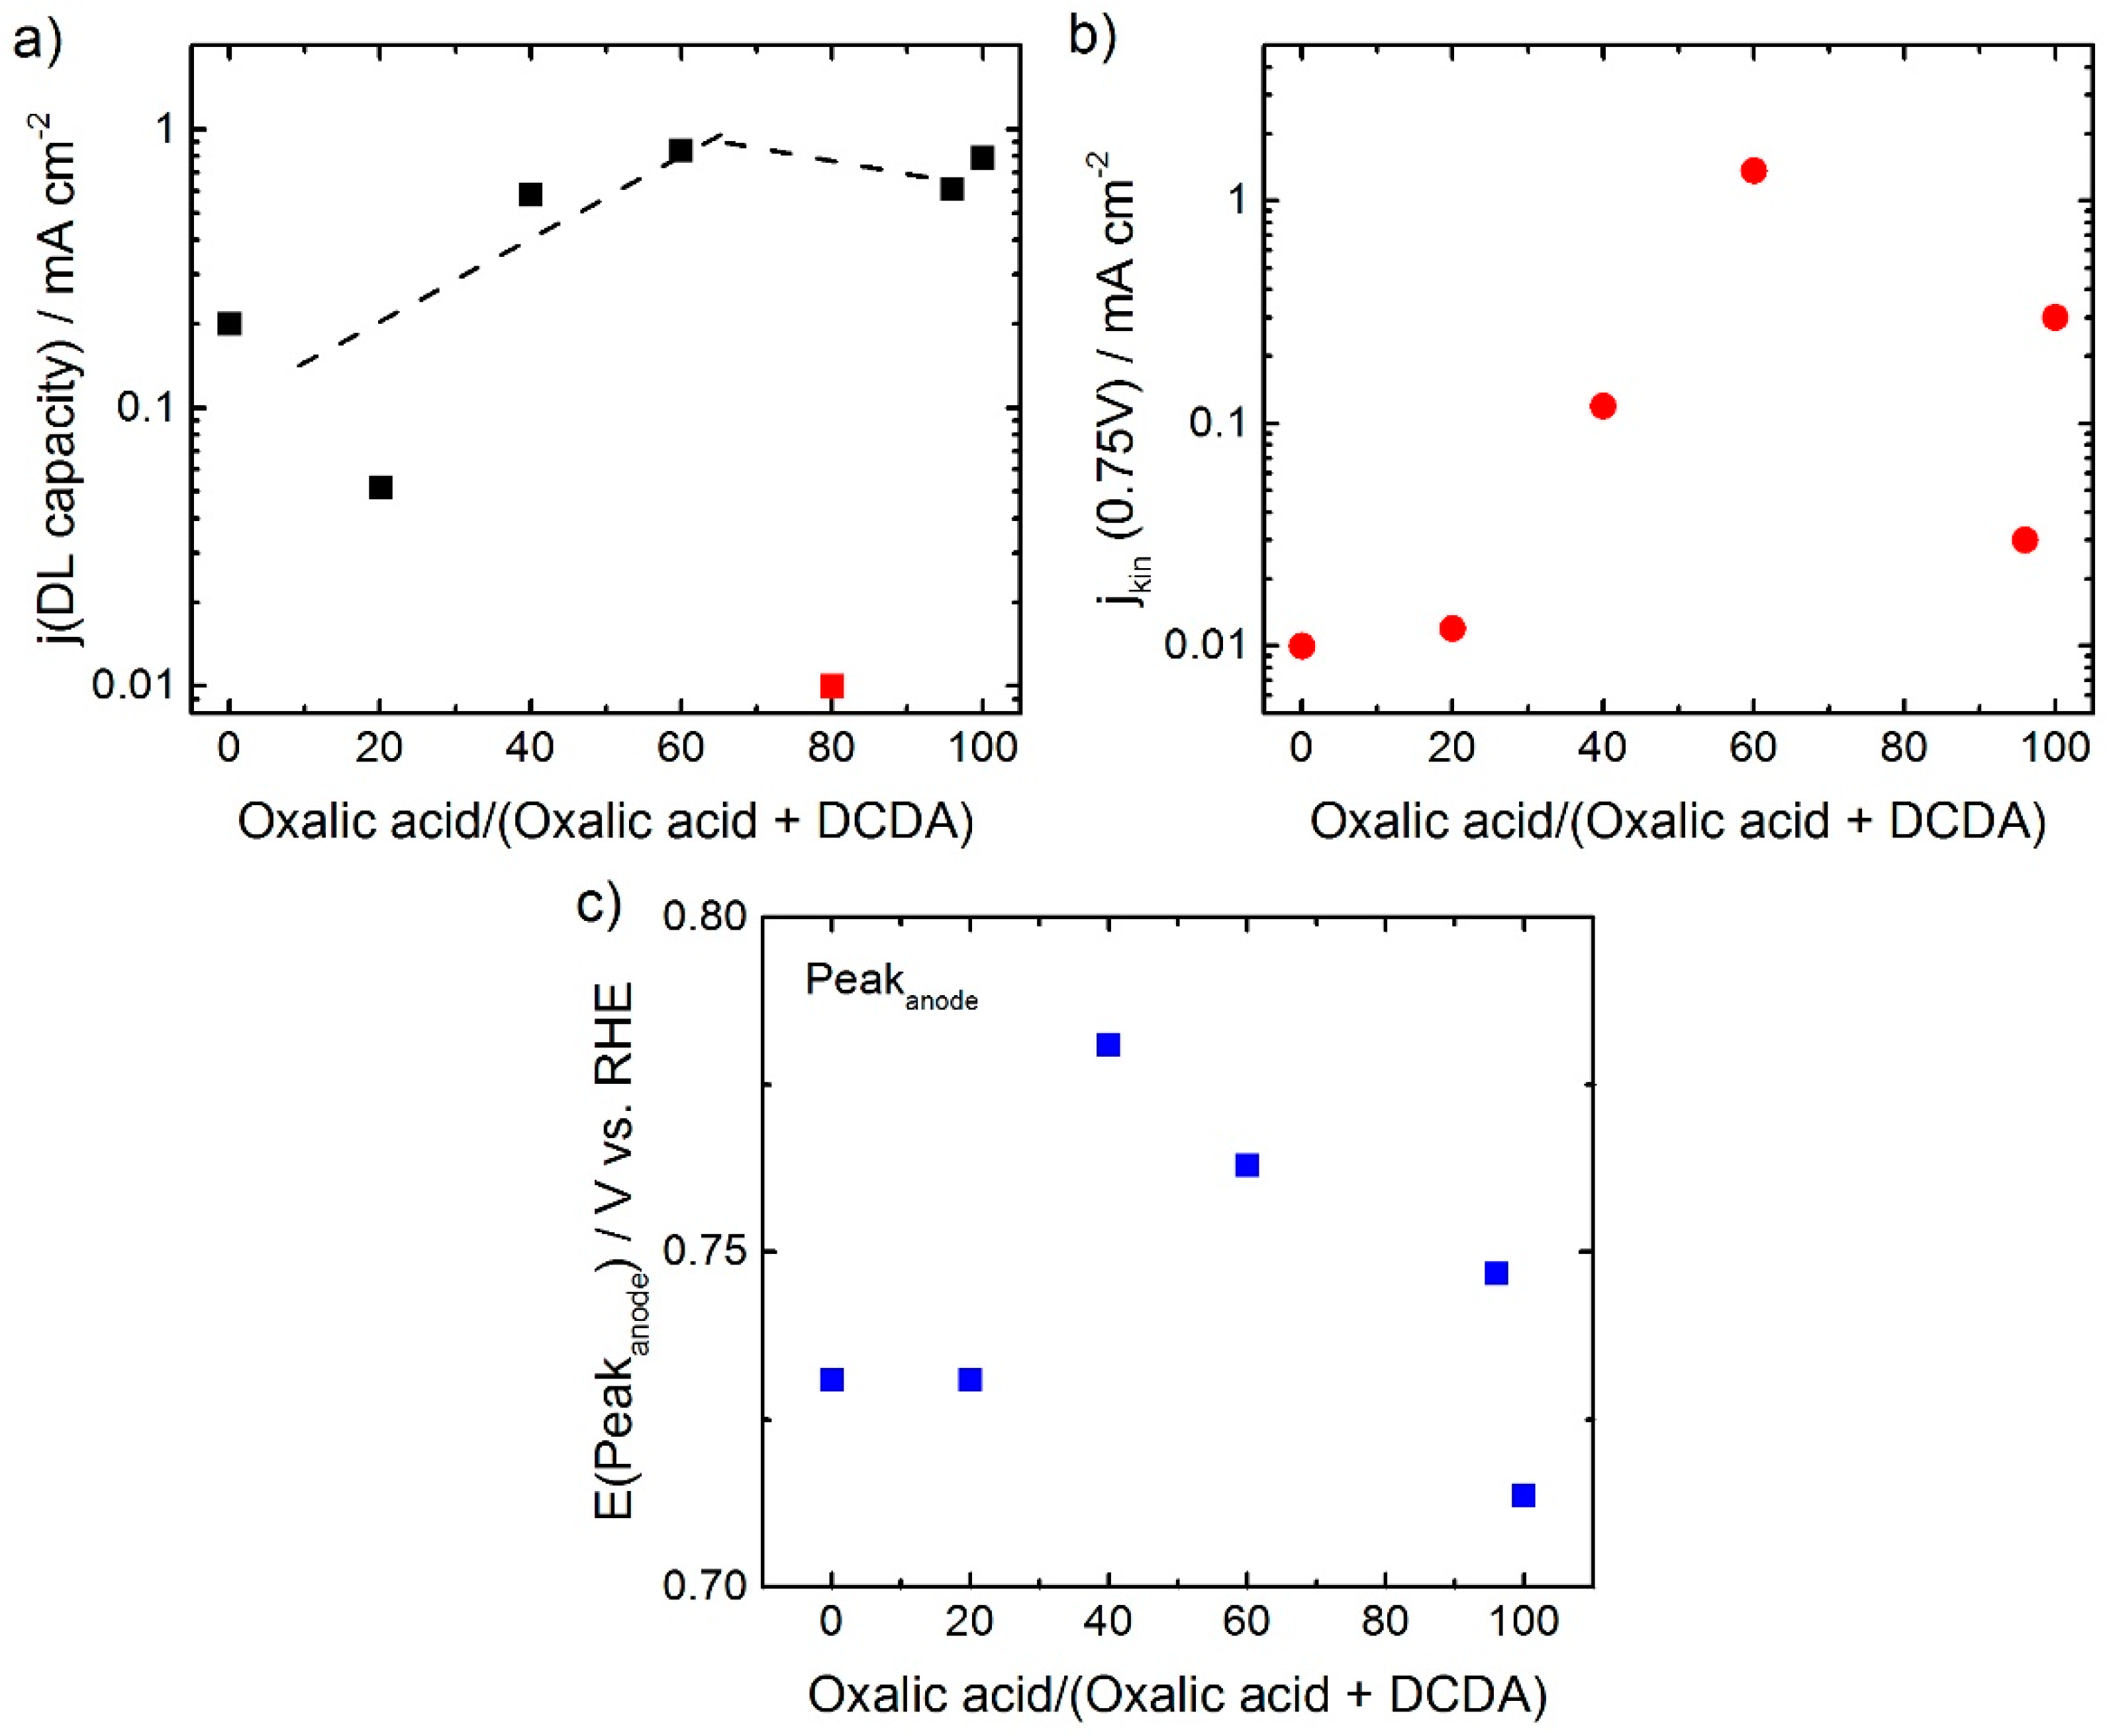
As mentioned above, the capacity of the different catalysts seems to be affected by the ratio of oxalic acid in the SFA. A plot of the related current density in the double layer region of the CVs (named as j(DL capacity)) vs ratio of oxalic acid in SFA shows that there is a maximum in capacity current for 60% oxalic acid in the SFA and then the capacitive current remains constant or slightly decreases, this is shown in
Figure 4a. In contrast to this a clear maximum is visible for the ORR activity in
Figure 4b.
In
Figure 4c the potentials related to the peak maxima in the anodic sweep of the cyclic voltammograms are given as a function of the ratio of oxalic acid in the SFA. Roughly, the trend is similar as for the kinetic current density: The resulting kinetic current density was getting as higher as more positive the anodic peak position was, what is in agreement with previous reports [
30,
31,
32]. Nevertheless, it becomes clear, that E (Peak
anode) is only a weak activity descriptor for this group of catalysts. While the peak position might be an indicator for the turn-over frequency (TOF) on active sites, the charge under the redox peak might be related to the number of active sites (if assigned to Fe
2+/Fe
3+), or number of sites promoting the ORR (evtl. quinone/hydroquinone). As both (TOF and site density) will contribute to the kinetic current density, this might explain the only weak correlation. Furthermore, it should be noted, that the difference between the anodic and cathodic peak is not constant but increases from about 40 to 220 mV and then decreases to about 50 mV (not displayed). Further characterization will be required to fully understand this trend.
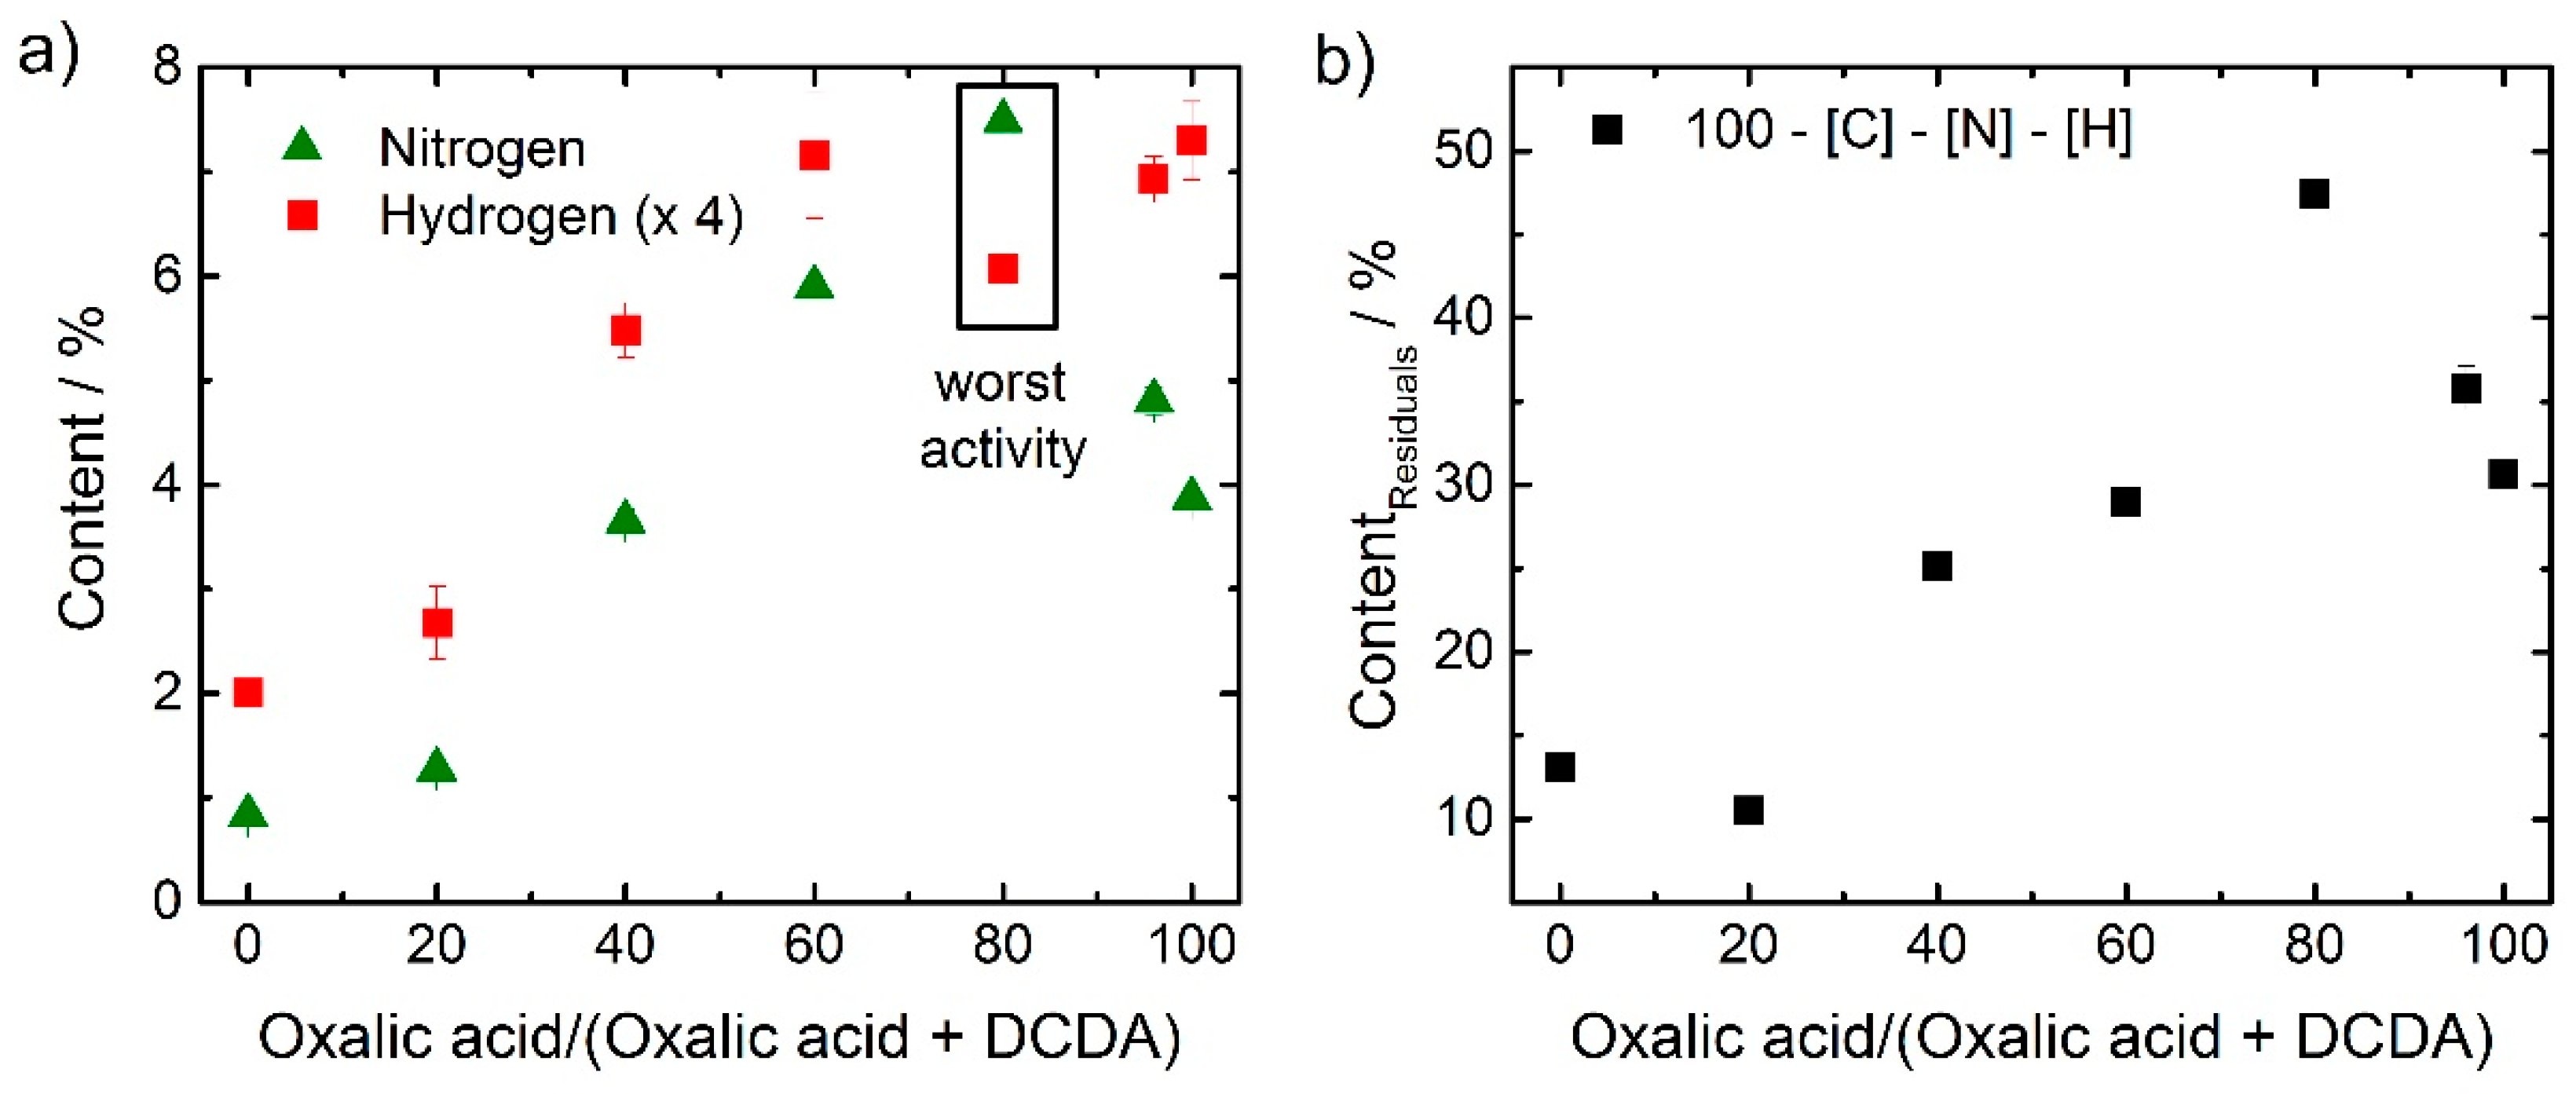
It is well known that the nitrogen content is an important parameter as it is required for the formation of active sites. In order to get further insights to what extend the SFA composition affects the composition of the final catalyst combustion analysis for CHN was performed. The nitrogen and hydrogen contents as a function of SFA composition are shown in
Figure 5a. Also, the amount of residuals was determined as difference between 100% minus nitrogen, carbon and hydrogen contents. The data are shown in
Figure 5b. The expected residuals were basically iron, sulfur and oxygen, and maybe some chlorine from the acid-leaching procedure.
Rather unexpected, the outlier at 80% with the worst activity yields the highest nitrogen content. A similar trend was observed for the amount of residuals. The very high value of residuals of almost 50% in this catalyst could be assigned (at least in parts) to iron oxide as indicated in the electrochemical measurements, but also in the Raman spectra (below).
If one has to identify a distinct difference between the outlier versus the others, it was the ratio between [H] and [N] that was changing, as visible from
Figure 5a.
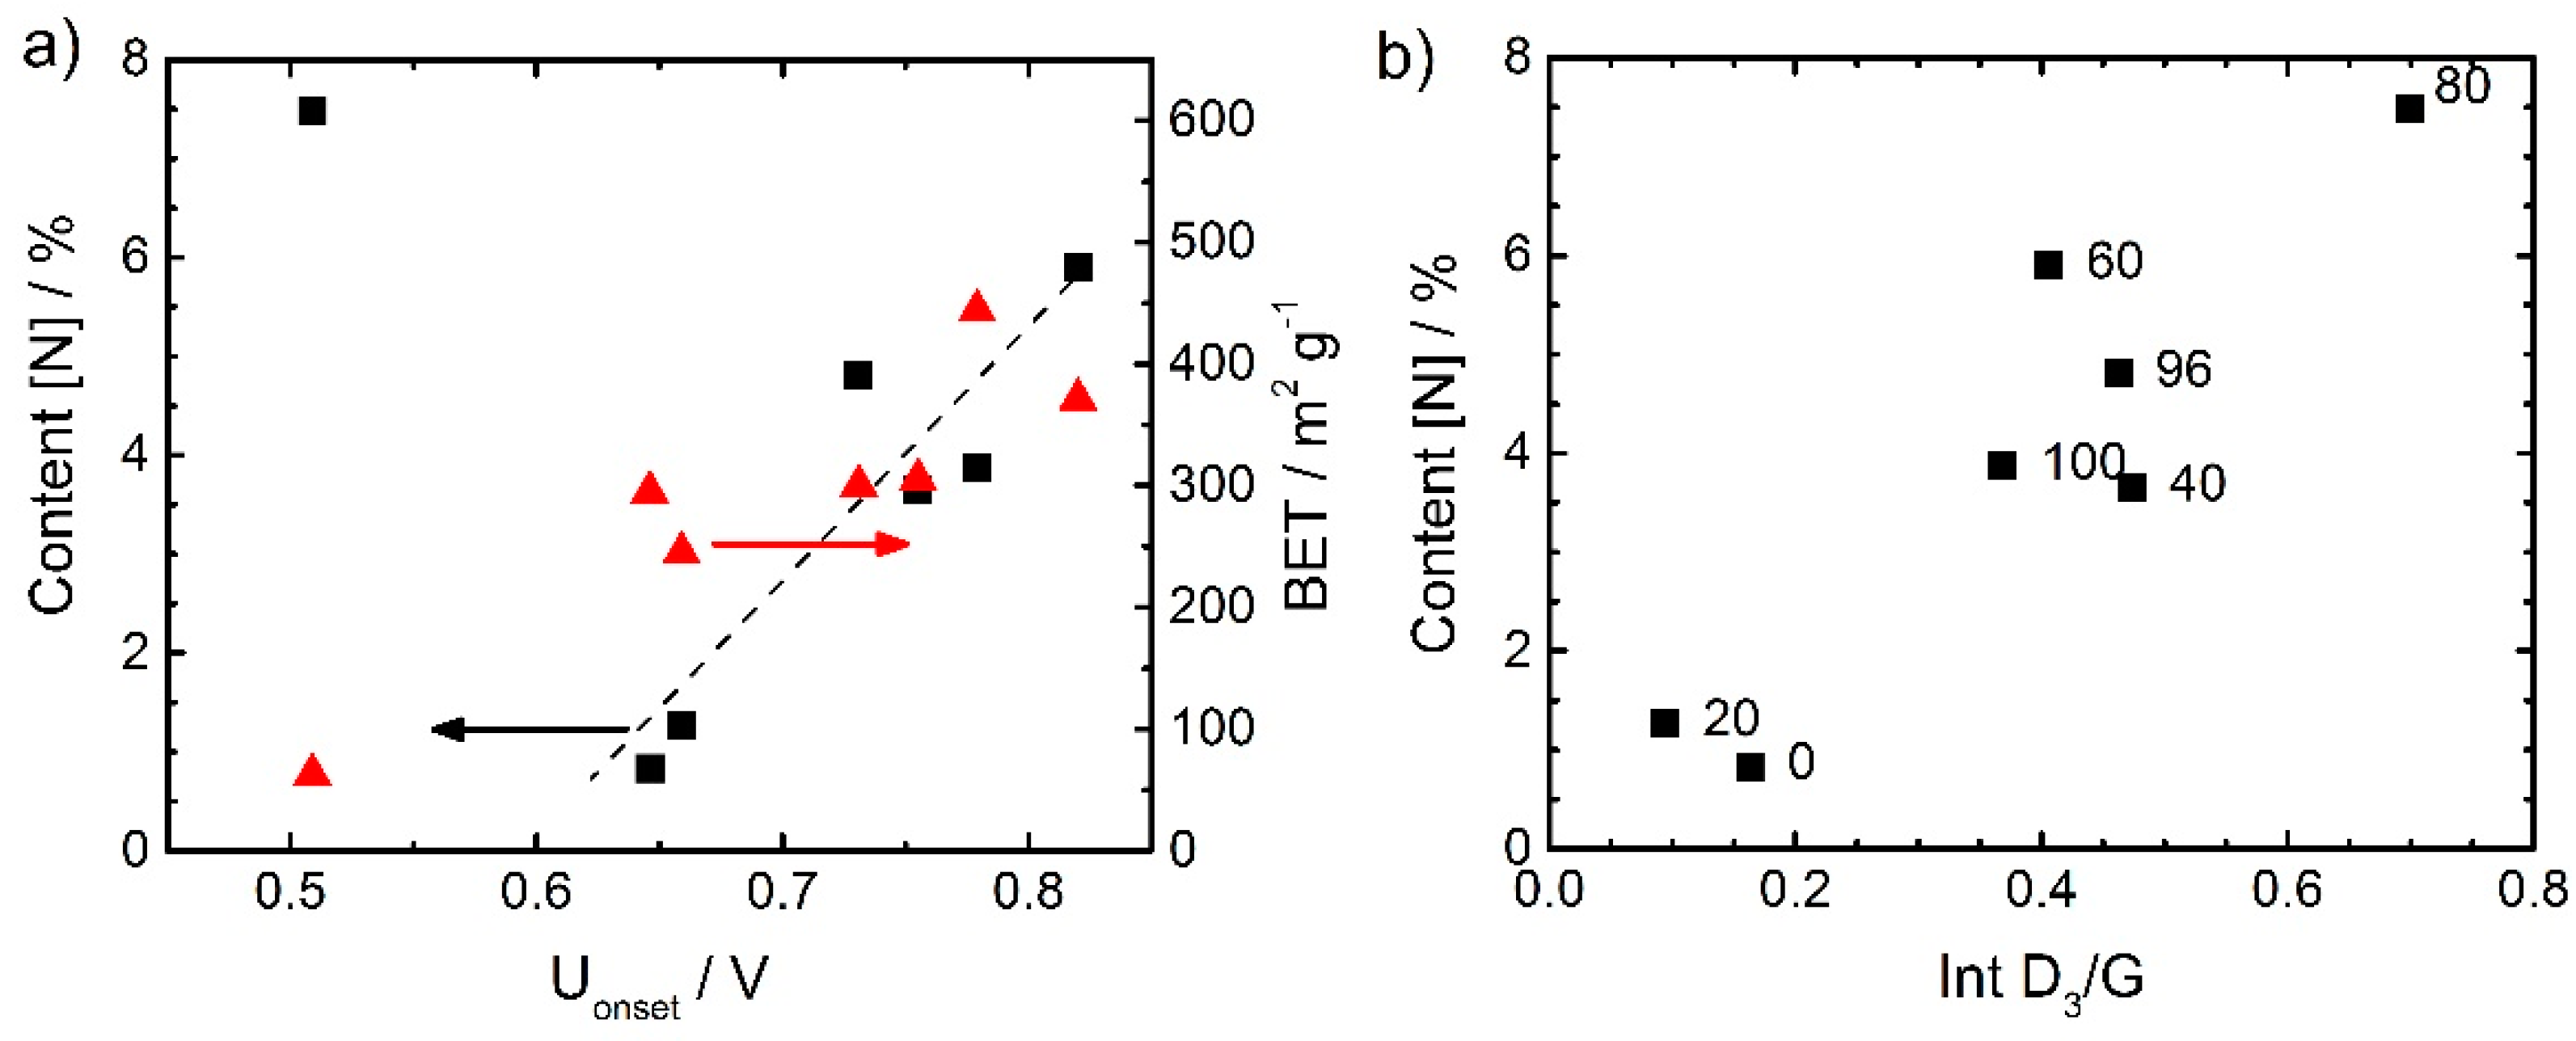
In general, there was a good correlation between the nitrogen content and the onset potential. This is visible from
Figure 6a. Also here, the worst performing catalyst gave an exception. It could have its origin in the very low surface area observed for this catalyst (right axis).
Figure 6b correlates the content of nitrogen with the intensity ratio of the D
3 band and G band, we will refer to it, below after discussing the Raman spectra.
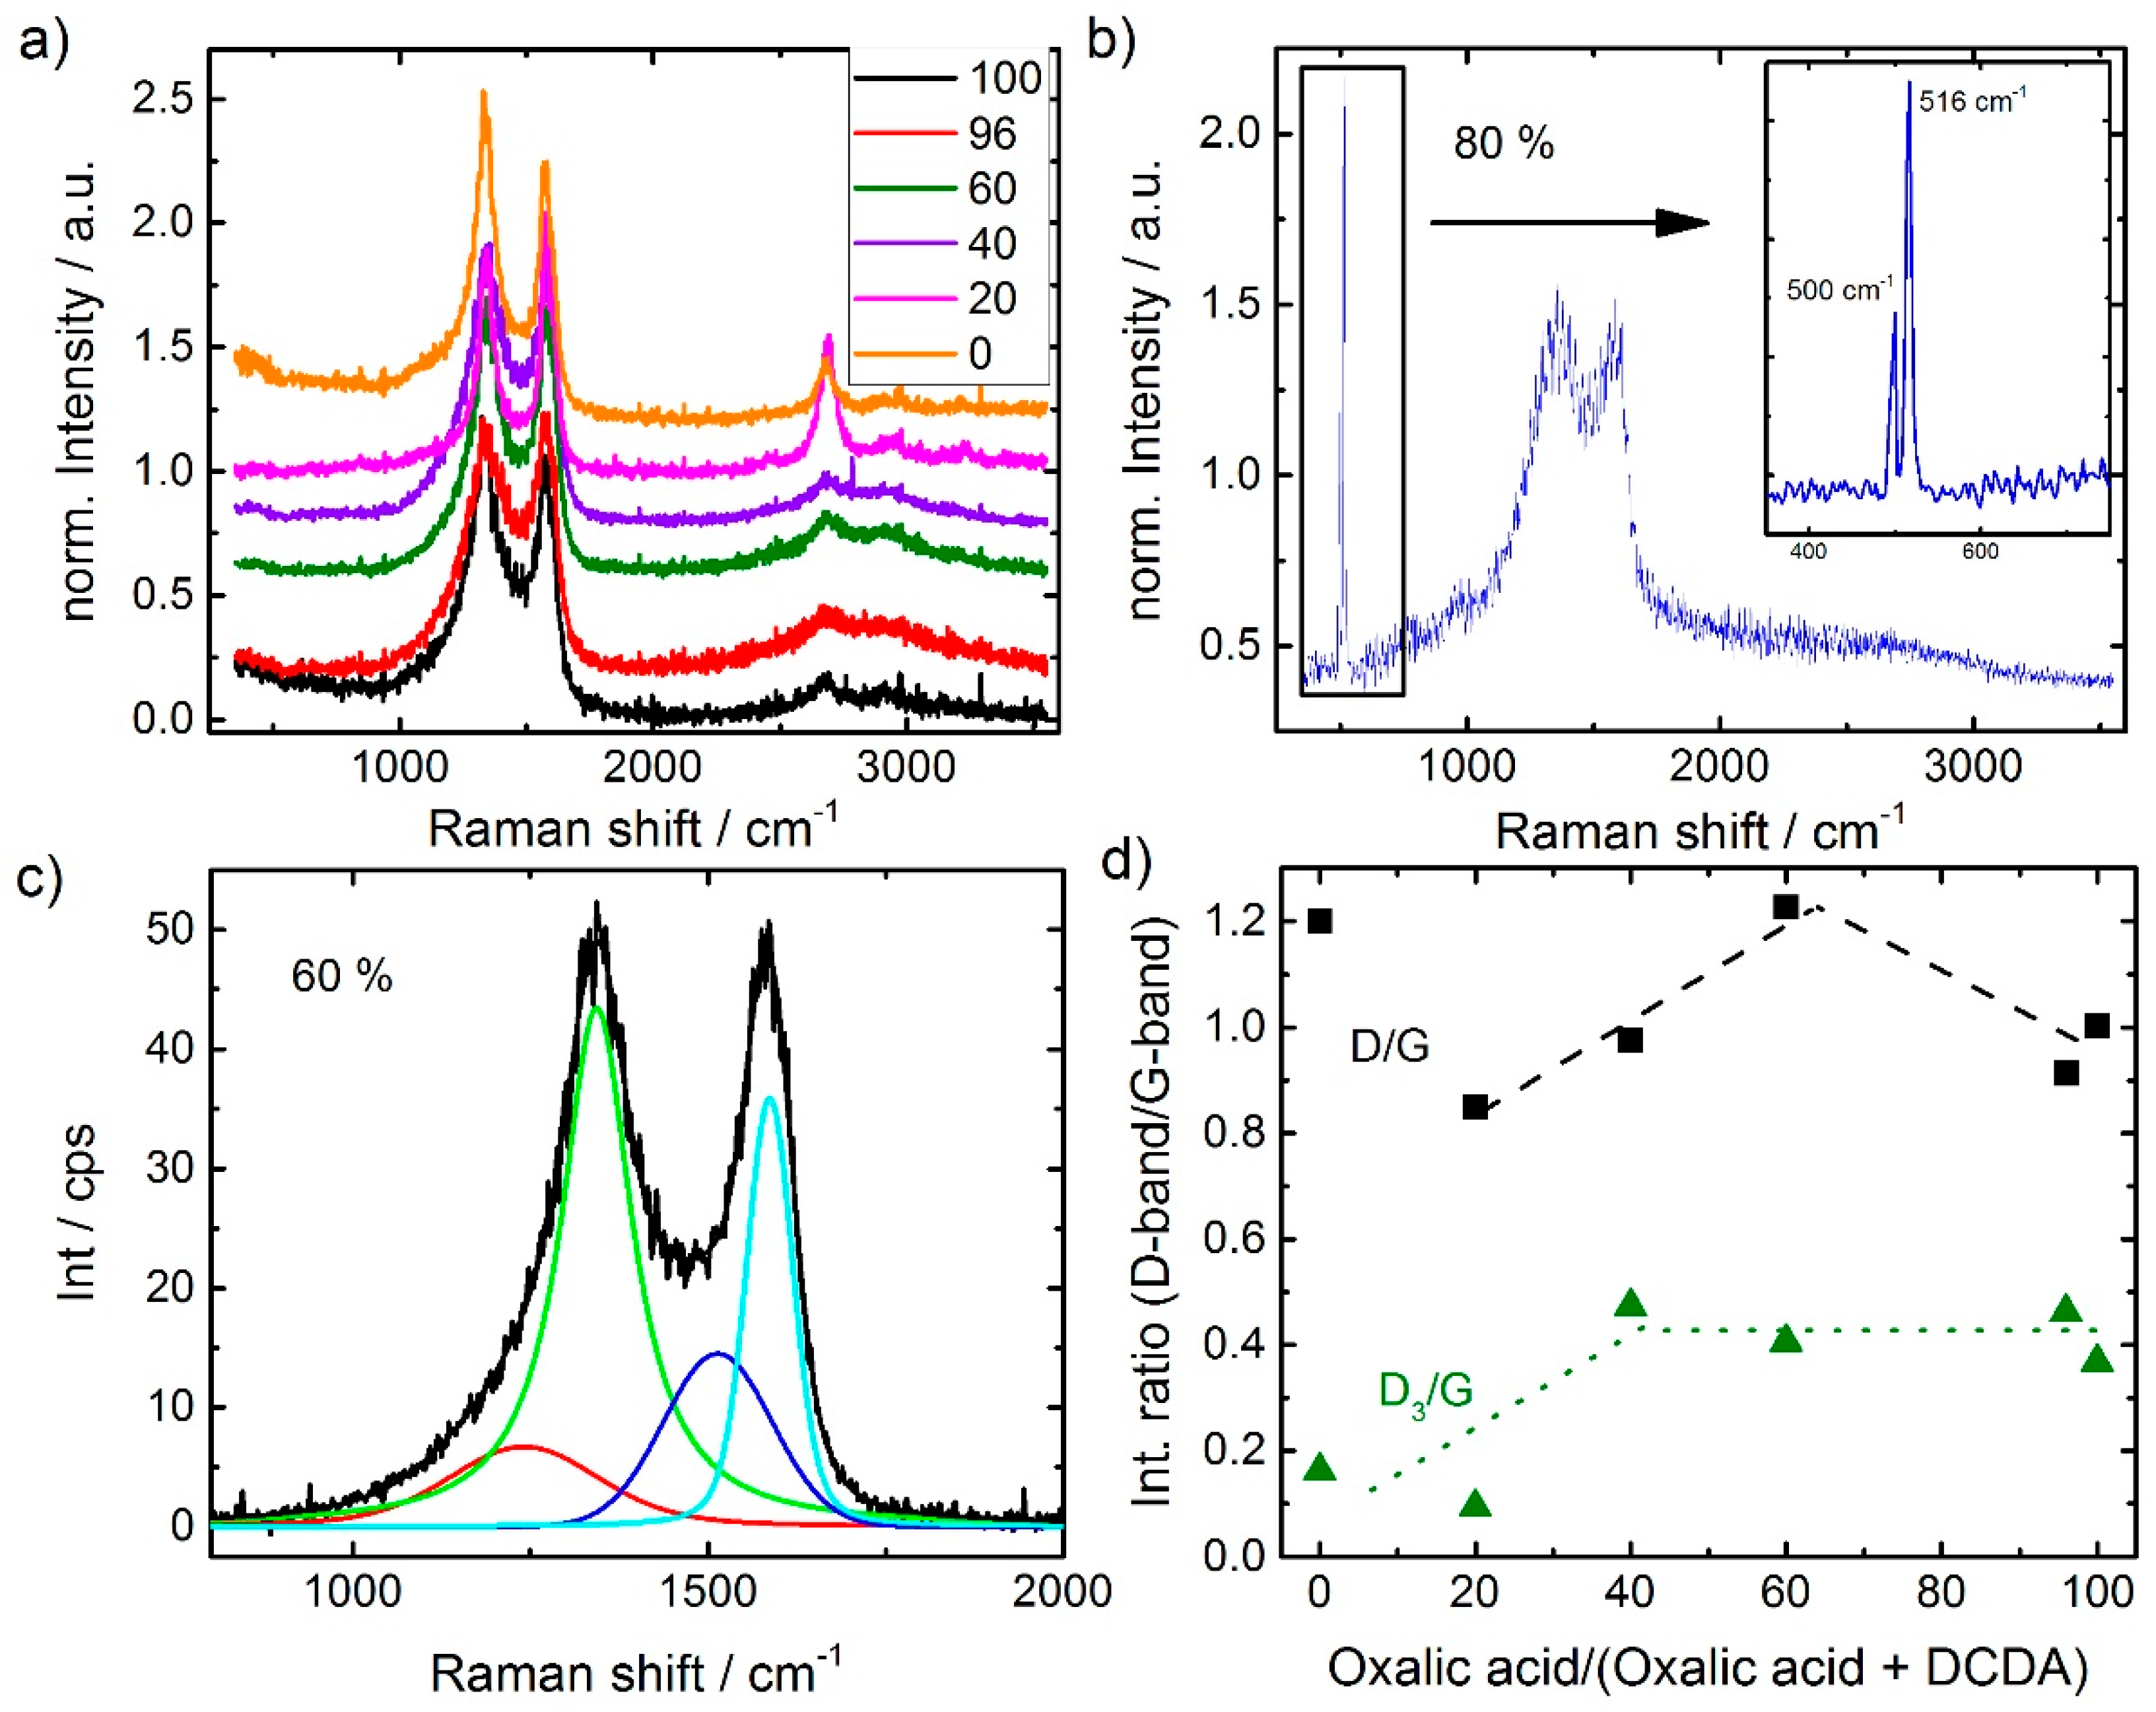
For characterization of the carbon morphology, Raman spectra were recorded for all catalysts (
Figure 7a,b). The analysis of the Raman spectra was made in relation to literature on carbon blacks [
33,
34]. All samples reveal the typical shape of carbon blacks with distinct D-band and G-band intensities. While the latter is related to in-plane vibration modes, the former is related to vibrations “at the edges” of the graphene layer [
35]. Hence, the intensity ratio D/G is inverse proportional to the graphene layer extension.
It is interesting to note, that for those samples with dominant ratios of DCDA in the SFA additional bands in the 2nd order region become pronounced. This band is related to the 2D band. In a recent work by Larouche et al. [
36] it was discussed that the ratio of 2D/D areas can be used to calculate a graphene layer extension labelled L
eq that also considers the curvature within graphene flakes [
36]. That is why in the paragraph above “at the edges” was written in quotation marks, because the D band will be formed when the vibrations occur at the edges, but also if the symmetry (e.g., by implementation of defects, five-ring groups, etc.) is broken.
Also, the 1st order region was analyzed in more detail by fitting the spectra assuming the presence of four bands: The aforementioned D and G bands and in addition a D
3 and a D
4 band. These are assigned to heteroatoms in carbon and polyaromatic hydrocarbons, respectively [
33,
34,
36]. As an example, the fit of the most active catalyst is provided in
Figure 7c.
In
Figure 7d the intensity ratios of D/G band and D
3/G band are shown as a function of oxalic acid in the SFA. Except for the sample prepared exclusively with DCDA, first an increase in D/G ratio and then a decrease (above 60% oxalic acid) is observed. Comparing the trends in
Figure 4a and
Figure 7d it seems that the intensity ratio D/G follows the trend in capacity. There is also a strong relation between the capacity and the BET surface area (not shown) underlining that in most of the cases indeed edges of graphene layers might contribute to the D-band intensity (rather than curvatures).
In a previous work, we were able to show by analyzing the Raman spectra of a group of Me-N-C catalysts before and after accelerated stress tests (AST), that a decrease in the D
3/G ratio correlated with the decrease in ORR activity observed during AST [
37]. As this loss in activity was also correlating with the displacement of metal out of the N
4 plane, we attributed a contribution of MeN
4 related vibrations to be located in the D
3 band region [
37]. As given in
Figure 7d, up to a ratio of 40% oxalic acid in the SFA the D
3/G band ratio is increasing and then does not change significantly (It should be noted that the worst performing catalyst reached a value of 0.7). On the basis of our previous work, this might be an indicator for a change of the relative amount of FeN
4 sites. The correlation between nitrogen content and the D
3/G band ratio in
Figure 6b pointed into this direction. However, it must be noted that a similar good correlation would be given for the content of residuals with Int D
3/G.
Nevertheless, as discussed above, the D3 band is assigned to vibrations at defects/ heteroatoms in the graphene sheets. Hence, most possibly all these heteroatoms contributed to some extend to the D3 band intensity.
Even though, it was already discussed above, the sample with 80% is out of trend, its Raman spectrum as displayed in
Figure 7b should be addressed, shortly. Distinct bands can be identified at 500 and 516 cm
−1. On first view, these bands were assigned to iron oxide vibrations [
38]. This is in agreement with the band at 500 cm
−1, but so far, we were not able to assign the band at 516 cm
−1. On the basis of the observations made so far for this sample, we believe that the formation of these two bands is in strong relation to its worse composition and activity.
Why does the activity increase so much by changing the fraction of oxalic acid in the SFA?
In our previous publication, iron acetate was the only source of oxygen within the synthesis. In this study we replaced the iron acetate by iron chloride which allowed us to systematically vary the content of oxygen in the overall precursor from zero to a maximum of 70 at % (hydrogen not considered). It is interesting to note, that the catalyst with the maximum activity in this work has a relative content of oxygen (44 at %) very similar to the one calculated for the precursor of the oxalate support pyrolysis of porphyrins (43 at %). This might be an indicator for its very good performance. Furthermore, the results indicate that only by using relative fractions of oxalic acid ≥40% in the SFA, a sufficiently amorphous carbon is formed that enables high kinetic current densities.
Nevertheless, it must be pointed out that further characterization including Mößbauer spectroscopy and X-ray induced photoelectron spectroscopy will be required to enable a conclusive interpretation on the role of oxygen in the precursors to obtain highly active Fe-N-C catalysts.
On the basis of the results provided in this work, we can conclude that both a high surface area and sufficient nitrogen content are required to achieve a good performing Fe-N-C catalyst.
3. Materials and Methods
3.1. Catalyst Preparation
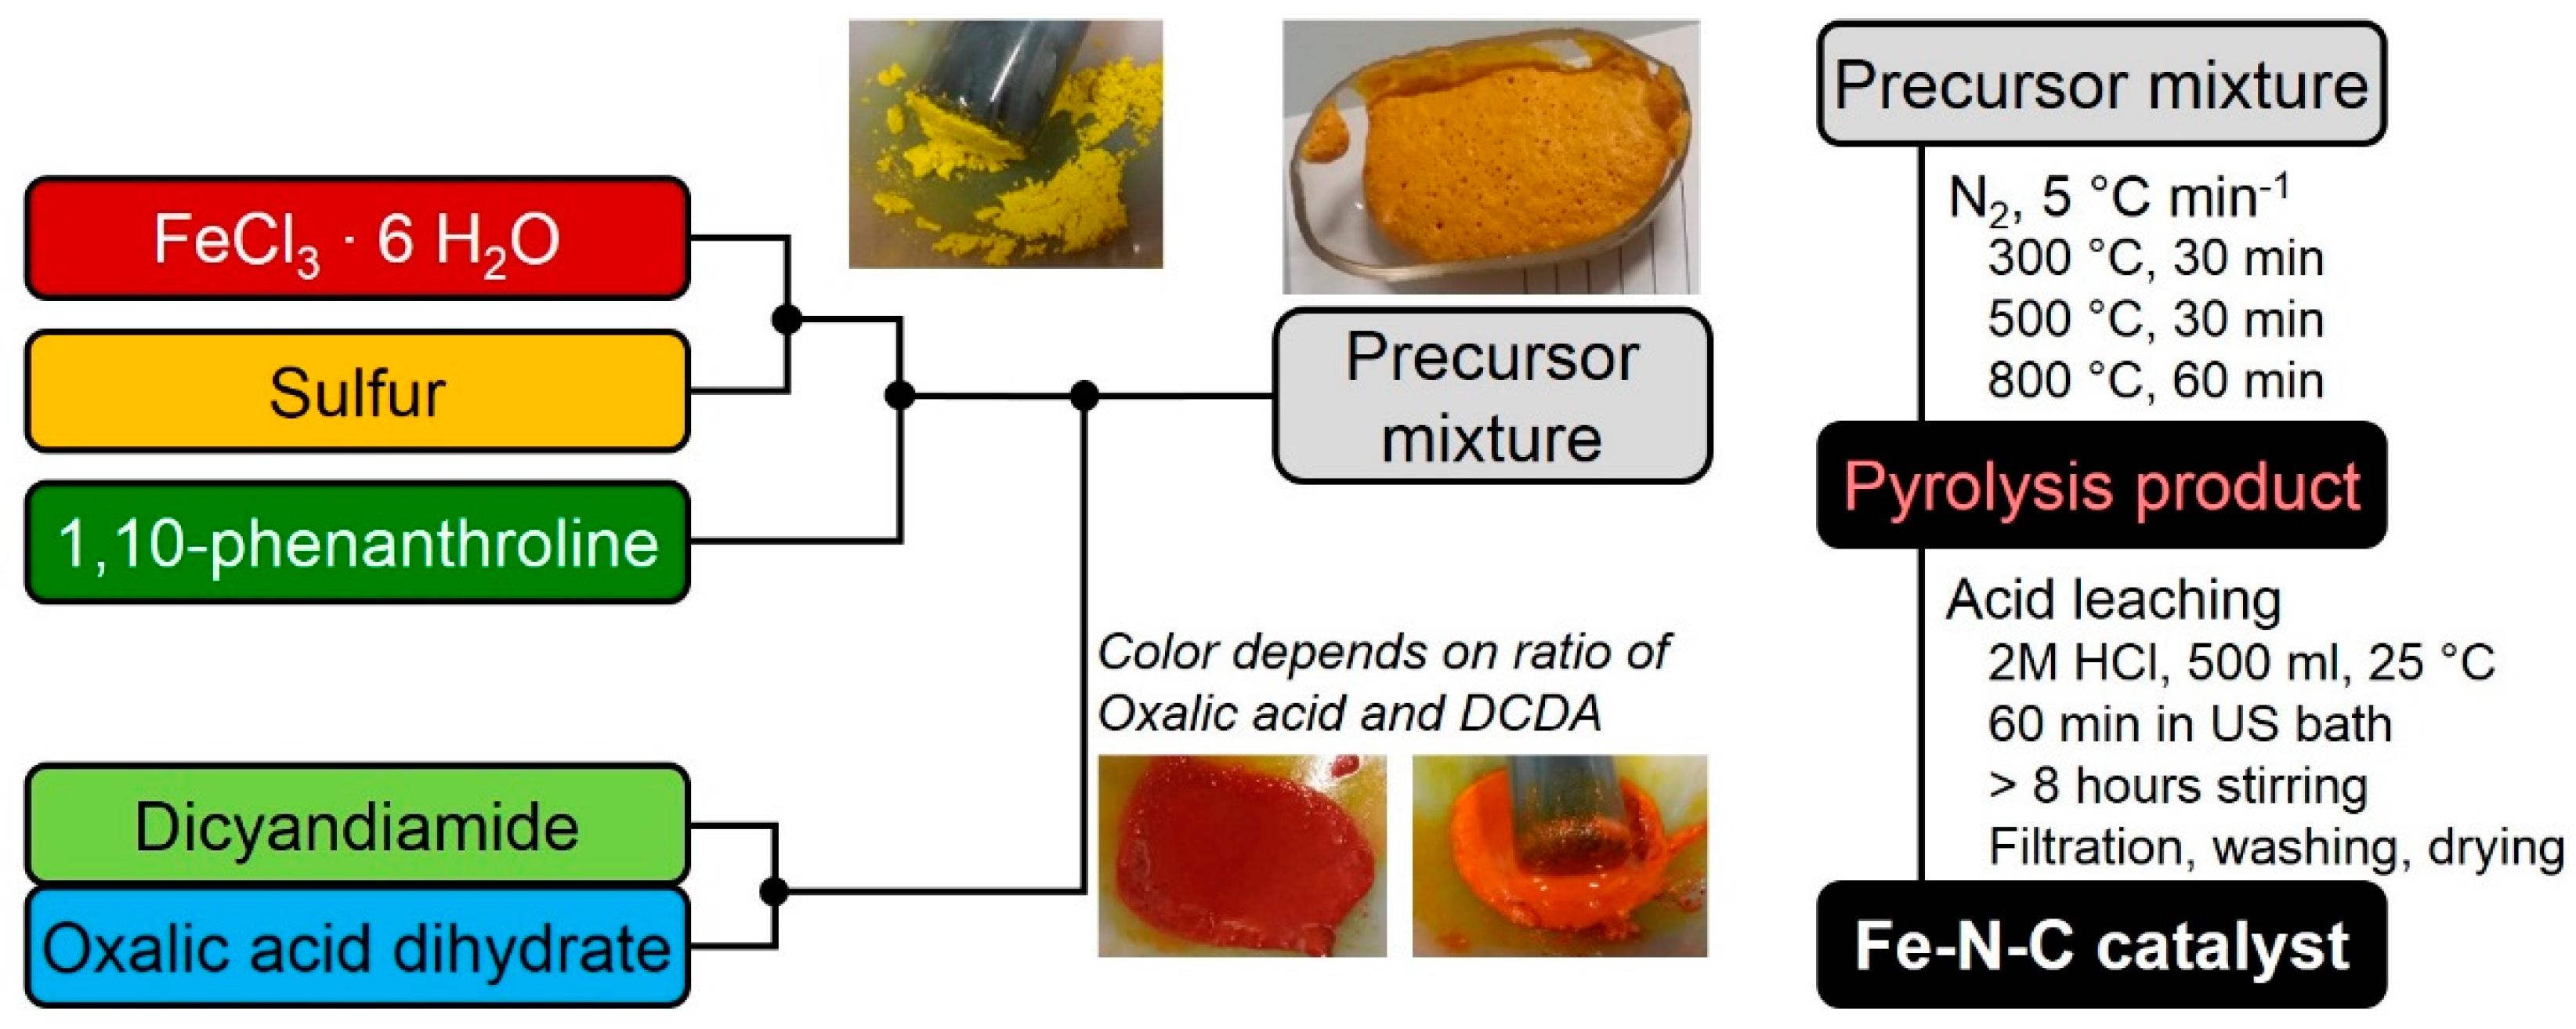
In order to prepare a precursor, first sulfur (0.78 mol eq) is grounded in a mortar together with iron chloride hexahydrate (1 mol eq). Then, 1,10-phenanthroline (0.48 mol eq) is added and mixed until a homogeneous mixture is obtained. Finally, the structure-forming agents (SFAs) (6.5 mol eq) are added and the mixture is grounded until homogeneous. The preparation is given as Scheme in
Figure 8, below.
As mentioned in the scheme, the color of the precursor changed upon addition of DCDA and/or oxalic acid. At the same time the initially solid precursor mixture turned into a viscose paste. While DCDA addition gave a distinct red color to this pulp (might be indicative of [Fe(CN)6]3+ formation), the addition of oxalic acid turned the color more orange/light brown. In addition, gas evolution took then place. If the precursor was then left in air, finally the precursor appeared like a meringue as visible in the picture. Regarding the precursor to obtain the 80% catalyst of this variation series, it contains the minimum amount of DCDA that had to be present to enable this gas evolution. Gas evolution and formation of this meringue-like morphology was not observed at higher oxalic acid contents. Except for this; however, the precursor of the 80% sample behaved rather similar during preparation compared to the other samples.
The as-obtained precursor mixture is filled in quartz boats and then subjected to a heat-treatment. For the pyrolysis a heating ramp of 5 °C min−1 is chosen. To allow the system to balance in-between there are two dwell times at 300 and 500 °C, each for 30 min, before heated to the final end temperature of 800 °C with a dwell time of 60 min.
After cooling down (<80 °C) the quartz boat with the main part of the pyrolysis product is transferred to 2 M HCl. The composition is first acid-leached for 1 h in an ultrasonic bath and then further stirred for additional 8 h (usually over-night). After filtration, washing with H2O and drying the final mass is obtained.
Note, for determining the yields the final catalyst mass (yield after pyrolysis and acid leaching) or the mass after pyrolysis was divided by the related precursor masses of iron chloride hexahydrate, 1,10-phenanthroline and sulfur, without considering the masses of DCDA and/or oxalic acid. This was applied, as otherwise, due to the different molar masses of DCDA and oxalic acid also the absolute mass of the precursor mixture would have changed.
3.2. Electrochemical Measurements
Electrochemistry is performed in 0.1 M H2SO4 with a conventional 3-electrode setup. The working electrode is a glassy carbon disc (0.196 cm2) coated with the catalyst ink. As counter and reference electrode; respectively, a glassy carbon rod and an Ag/AgCl were used. All given potentials refer to the reversible hydrogen electrode (RHE). In order to prepare the catalyst ink, 5 mg of catalyst powder were dispersed in a mixture of 25 µL Nafion (5 wt %), 83.3 µL H2O and 142 µL ethanol, hence the Nafion to catalyst ratio is 0.25. After 30 min of sonication the ink is homogenized with an ultrasound homogenizer. Then 5 µL of the ink are dropped on the GC disc and left to dry (catalyst loading: 0.5 mg cm−2).
First measurements are performed in N2 saturated electrolyte with a conditioning of the electrode (20 scans with 300 mV s−1, 0.0 to 1.2 V). Then a CV is measured with 100 mV s−1, this CV is used for evaluating the capacitive current density of our catalysts. In addition, one Linear Scan Voltammogram (LSV) is measured from 1.2 to 0.0 V for later background correction of the RDE data with 10 mV s−1.
After saturating the electrolyte for 15–20 min with oxygen, three LSVs are recorded in the same potential range with 0, 900 and 1500 rpm as rotation speed. After background correction, the kinetic current density j
kin is determined by Equation (1).
In this equation, jDiff,lim is the as-measured diffusion limiting current density. For those catalysts that do not display a pronounced diffusion plateau the current density at 0.0 V was chosen as jDiff,lim. The parameter j(U) is the as-measured current density.
3.3. Raman Spectroscopy
Raman spectroscopy was performed with an “alpha300 R” confocal Raman microscope (WITEC, Ulm, Germany) with a laser wavelength of 532.2 nm. Spectra were recorded in a range of 0 to 4000 cm−1 as overlay of ten scans each with 10 s of integration time. For the measurements, catalyst ink was dropped on a silicon disc and dried. For each sample measurements are performed at two to three different locations and the average graphs are plotted in this work.
For the fitting of the 1st order range typically found for carbon blacks (800–2000 cm−1) four bands were introduced with Voigt line shape.
3.4. N2 Sorption Measurements
In order to determine the BET surface area and micropore surface area (from V-t plots) of all catalysts, N2 sorption measurements were made with an Autosorb-3B (Quantachrome, Boynton Beach, FL, USA). Previous to the measurements, the samples (about 100 mg of the catalyst powders) were degassed at 200 °C over-night. Only for some of the catalysts a micropore surface area was obtained.
3.5. Combustion Analysis (CHN)
Combustion analysis was performed for the overall sample series with a VarioEL III instrument (Elementar Analysesysteme GmbH, Langenselbold, Germany). Each sample was measured two times, average values as well as the standard deviation were determined and are included in the plots. In all cases the sum of the three components did not count up to 100%, what shows that additional species are present within the catalysts. This might be iron, sulfur and oxygen and maybe chlorine from the acid leaching step.

 ,
, 


