Article

Structure–Activity Relationship Study of Mn/Fe Ratio Effects on Mn−Fe−Ce−Ox/γ-Al2O3 Nanocatalyst for NO Oxidation and Fast SCR Reaction

1
Department of Thermal Engineering, Shandong Jianzhu University, Jinan 250101, China
2
Key Laboratory of Renewable Energy Building Utilization Technology of Ministry of Education, Shandong Jianzhu University, Jinan 250101, China
3
Key Laboratory of Renewable Energy Building Application Technology of Shandong Province, Shandong Jianzhu University, Jinan 250101, China
4
Engineering Laboratory of Power Plant Thermal System Energy Saving of Shandong Province, Shandong University, Jinan 250061, China
*
Author to whom correspondence should be addressed.
Catalysts 2018, 8(12), 642; https://doi.org/10.3390/catal8120642
Submission received: 11 November 2018 / Revised: 2 December 2018 / Accepted: 7 December 2018 / Published: 9 December 2018
(This article belongs to the Special Issue Structure–Activity Relationships in Catalysis)

Abstract

:
A series of Mn−Fe−Ce−Ox/γ-Al2O3 nanocatalysts were synthesized with different Mn/Fe ratios for the catalytic oxidation of NO into NO2 and the catalytic elimination of NOx via fast selective catalytic reduction (SCR) reaction. The effects of Mn/Fe ratio on the physicochemical properties of the samples were analyzed by means of various techniques including N2 adsorption, scanning electron microscopy (SEM), transmission electron microscopy (TEM), X-ray diffraction (XRD), X-ray photoelectron spectroscopy (XPS), H2-temperature-programmed reduction (TPR), NH3-temperature-programmed desorption (TPD) and NO-TPD, meanwhile, their catalytic performance was also evaluated and compared. Multiple characterizations revealed that the catalytic performance was highly dependent on the phase composition. The Mn15Fe15−Ce/Al sample with the Mn/Fe molar ratio of 1.0 presented the optimal structure characteristic among all tested samples, with the largest surface area, increased active components distributions, the reduced crystallinity and diminished particle sizes. In the meantime, the ratios of Mn4+/Mnn+, Fe2+/Fen+ and Ce3+/Cen+ in Mn15Fe15−Ce/Al samples were improved, which could enhance the redox capacity and increase the quantity of chemisorbed oxygen and oxygen vacancy, thus facilitating NO oxidation into NO2 and eventually promoting the fast SCR reaction. In accord with the structure results, the Mn15Fe15−Ce/Al sample exhibited the highest NO oxidation rate of 64.2% at 350 °C and the broadest temperature window of 75–350 °C with the NOx conversion >90%. Based on the structure–activity relationship discussion, the catalytic mechanism over the Mn−Fe−Ce ternary components supported by γ-Al2O3 were proposed. Overall, it was believed that the optimization of Mn/Fe ratio in Mn−Fe−Ce/Al nanocatalyst was an extremely effective method to improve the structure–activity relationships for NO pre-oxidation and the fast SCR reaction.

Graphical Abstract

1. Introduction

Nitrogen oxides (NOx) are one of the strong contributing factors of air pollutants, which result in acid rain, global warming and ozone depletion via photochemical redox [1]. The selective catalytic reduction (SCR) of NOx by NH3 or urea over high efficient catalysts is the most economical and effective technology to eliminate the pollution of NOx [2,3]. The main SCR reaction involves the typical standard SCR reaction (1), the fast SCR reaction (2) and the NO2 SCR reaction (3) [4,5]:
4 NH 3 + 4 NO + O 2 4 N 2 + 6 H 2 O
2 NH 3 + NO + NO 2 2 N 2 + 3 H 2 O
4 NH 3 + 3 NO 2 3.5 N 2 + 6 H 2 O
The catalytic mechanism of the main SCR reaction has been systematically researched during the recent years, and the reaction processes of fast SCR have also been proposed in detail [4]. Koebel et al. [6] revealed the fast SCR reaction rate was decupled larger than that of standard SCR under 200 °C. However, the typically components of NOx were NO2 at ~5% and NO at ~95% [2], and thus the oxidation of NO into NO2 previous to the main SCR progress is noteworthy so as to increase the molar ratio of NO2/NO to 1.0 for facilitating fast SCR reaction artificially.
In the SCR reaction progress, the optimized catalyst takes an important role to the NOx removal with NH3. The V2O5/TiO2 catalyst, promoted with WO3 or MoO3 usually, is the most widely used commercial catalyst. The disadvantage of V2O5−WO3 (MoO3)/TiO2 is the strict temperature window limit [7]. These vanadium-based catalysts are not efficient enough to eliminate NOx as the catalytic temperature below 250 °C. In recent years, the catalysts suitable for the low temperature SCR have become required, and are appropriately installed in a downstream electrostatic precipitator and desulfurizer [8]. Many research groups dedicated to utilizing high efficient active elements and structure supports to optimize low-temperature SCR catalysts with super activities, excellent stabilities and wide-ranging temperature windows.
During the past few years, a large amount of low-temperature SCR catalysts making up of transition metal oxides on multifarious supports have been investigated. The Mn−Fe−Ox based catalysts, in particular, exhibited remarkable catalytic activities, such as Mn−Fe [9], Mn−Fe/TiO2 [10] and V2O5−Mn−Fe attapulgite [3]. Meanwhile, it was found that Mn−Fe−Ox based catalysts could induce the oxidation reaction of NO into NO2 during the NH3-SCR progress [11,12]. On this basis, some researchers have recently been absorbed oxidizing NO into NO2, due to the more high-efficiency reaction of NO2 with NH3 than NO [13]. Zhang et al. [13] proved the NO oxidation into NO2 or bidentate nitrite took place on the surface of FeMnOx/TiO2 via the adsorbed oxygen. Fang et al. [14] revealed the high density of lattice oxygen in the noncrystalline Mn−Fe−Ox played a leading and main role in NO oxidation. But Mn−Fe−Ox based catalysts usually needed other active elements to improve their catalytic selectivity and SO2 resistance [15]. Among various promoter, ceria performed extremely selectivity and SO2 resistance for the low-temperature SCR in Mn−Fe−Ox based catalysts [16]. At the same time, ceria as alkaline material with excellent redox abilities to adsorb and desorb active oxygen, also exhibited promoting effects on NO oxidization into NO2 and NO2 absorption into nitrites or nitrates [17]. However, the effects of Fe/Mn ratio on the activity of Mn−Fe−Ce−Ox catalyst for NO oxidation and the fast SCR reaction have not been intensive researched, especially the combined effects of γ-Al2O3 as carriers. The γ-Al2O3 is an outstanding support material for NO oxidation due to the Brönsted acid sites on its surface besides its prominent surface area [18], remarkable mechanical strength [19], great thermal stability [1] and low production cost [20].
In this research, we systematically manufactured a series of Mn−Fe−Ce−Ox/γ-Al2O3 nanocatalysts with a Mn atomic ratio (Fe balance) from 0% to 100%. Their catalytic abilities of NO oxidization and the fast SCR were researched to understand the Mn/Fe ratio effects on the reactions. The physicochemical characteristics of the nanocatalyst samples were analyzed by N2 adsorption, scanning electron microscopy (SEM) mapping, transmission electron microscopy (TEM), X-ray diffraction (XRD), X-ray photoelectron spectroscopy (XPS), H2-temperature-programmed reduction (H2-TPR), NH3-temperature-programmed desorption (NH3-TPD) and NO-TPD, in order to reveal the structure-activity relationship. The mechanism of Mn/Fe ratio influence on Mn−Fe−Ce−Ox/γ-Al2O3 nanocatalysts was also discussed. The purpose of this work was to clarify the nature of Mn−Fe−Ce based materials for catalytic performance and to explore the possibility of manufacturing nanocatalysts with outstanding capabilities in both the NO oxidization into NO2 and the fast SCR reaction progress.

2. Results and Discussion

2.1. Morphological Characterization

2.1.1. Brunauer-Emmett-Teller (BET) Measurements

In order to compare the change of physical properties of Mn−Fe−Ce−Ox/γ-Al2O3 nanocatalysts with different Mn/Fe ratios, the test data of BET specific surface areas, pore volumes and pore diameters were summarized in Table 1. The specific surface area and pore volume of Fe30−Ce/Al sample (Mn(x)Fe(y)−Ce/Al for short, x and y represented the mass percentage of Mn and Fe in the nanocatalysts, respectively) were originally 58.2 m2/g and 0.33 cm3/g, respectively. As the Mn/Fe molar ratio reached 0.5, the specific surface area rose to 77.4 m2/g and the pore volume rose to 0.56 cm3/g. The maximum specific surface area of 122.7 m2/g and the maximum pore volume of 0.73 cm3/g were both achieved over Mn15Fe15−Ce/Al with the Mn/Fe molar ratio of 1.0, which was possible due to manganese addition-enhancing active components better dispersing on the nano-Al2O3 support [18,21]. The manganese addition into Fe−Ce−Ox/γ-Al2O3 promoted mesoporosity formation and at the same time suppressed the macroporosity formation, which resulted in remarkable improvements in pore volumes [12]. Further increasing the Mn/Fe molar ratio, both the specific surface area and the pore volume started declining notably.

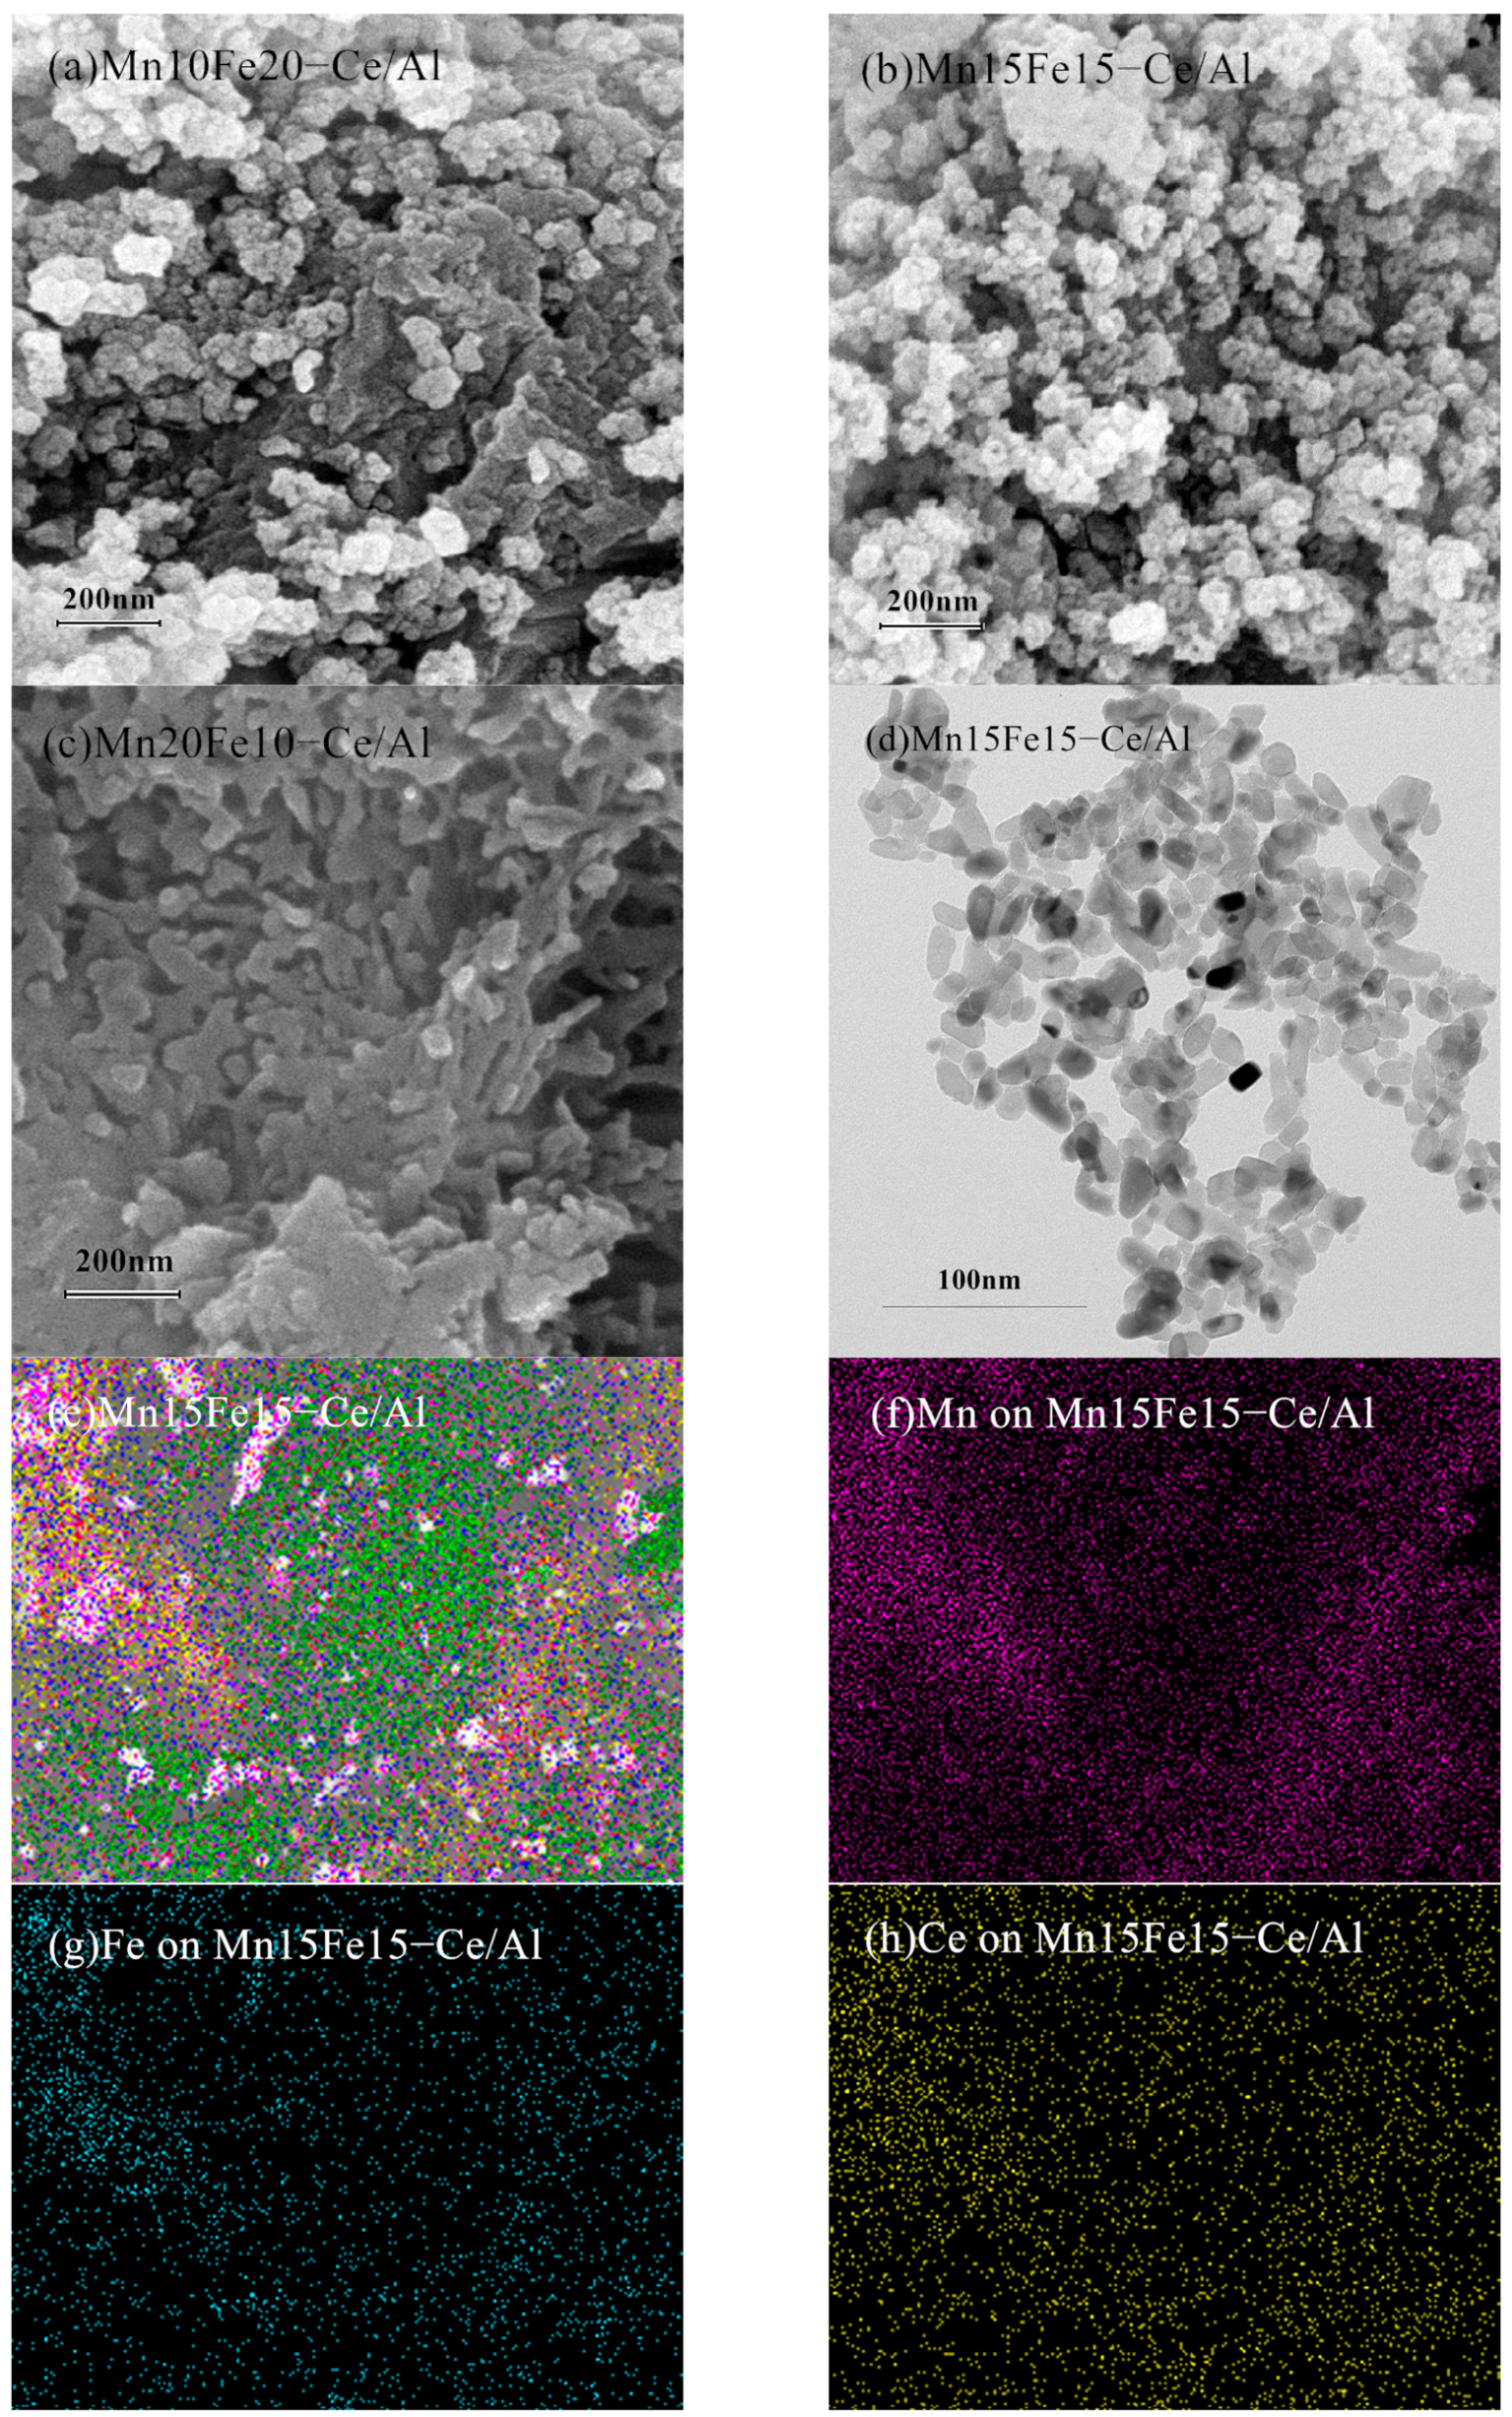
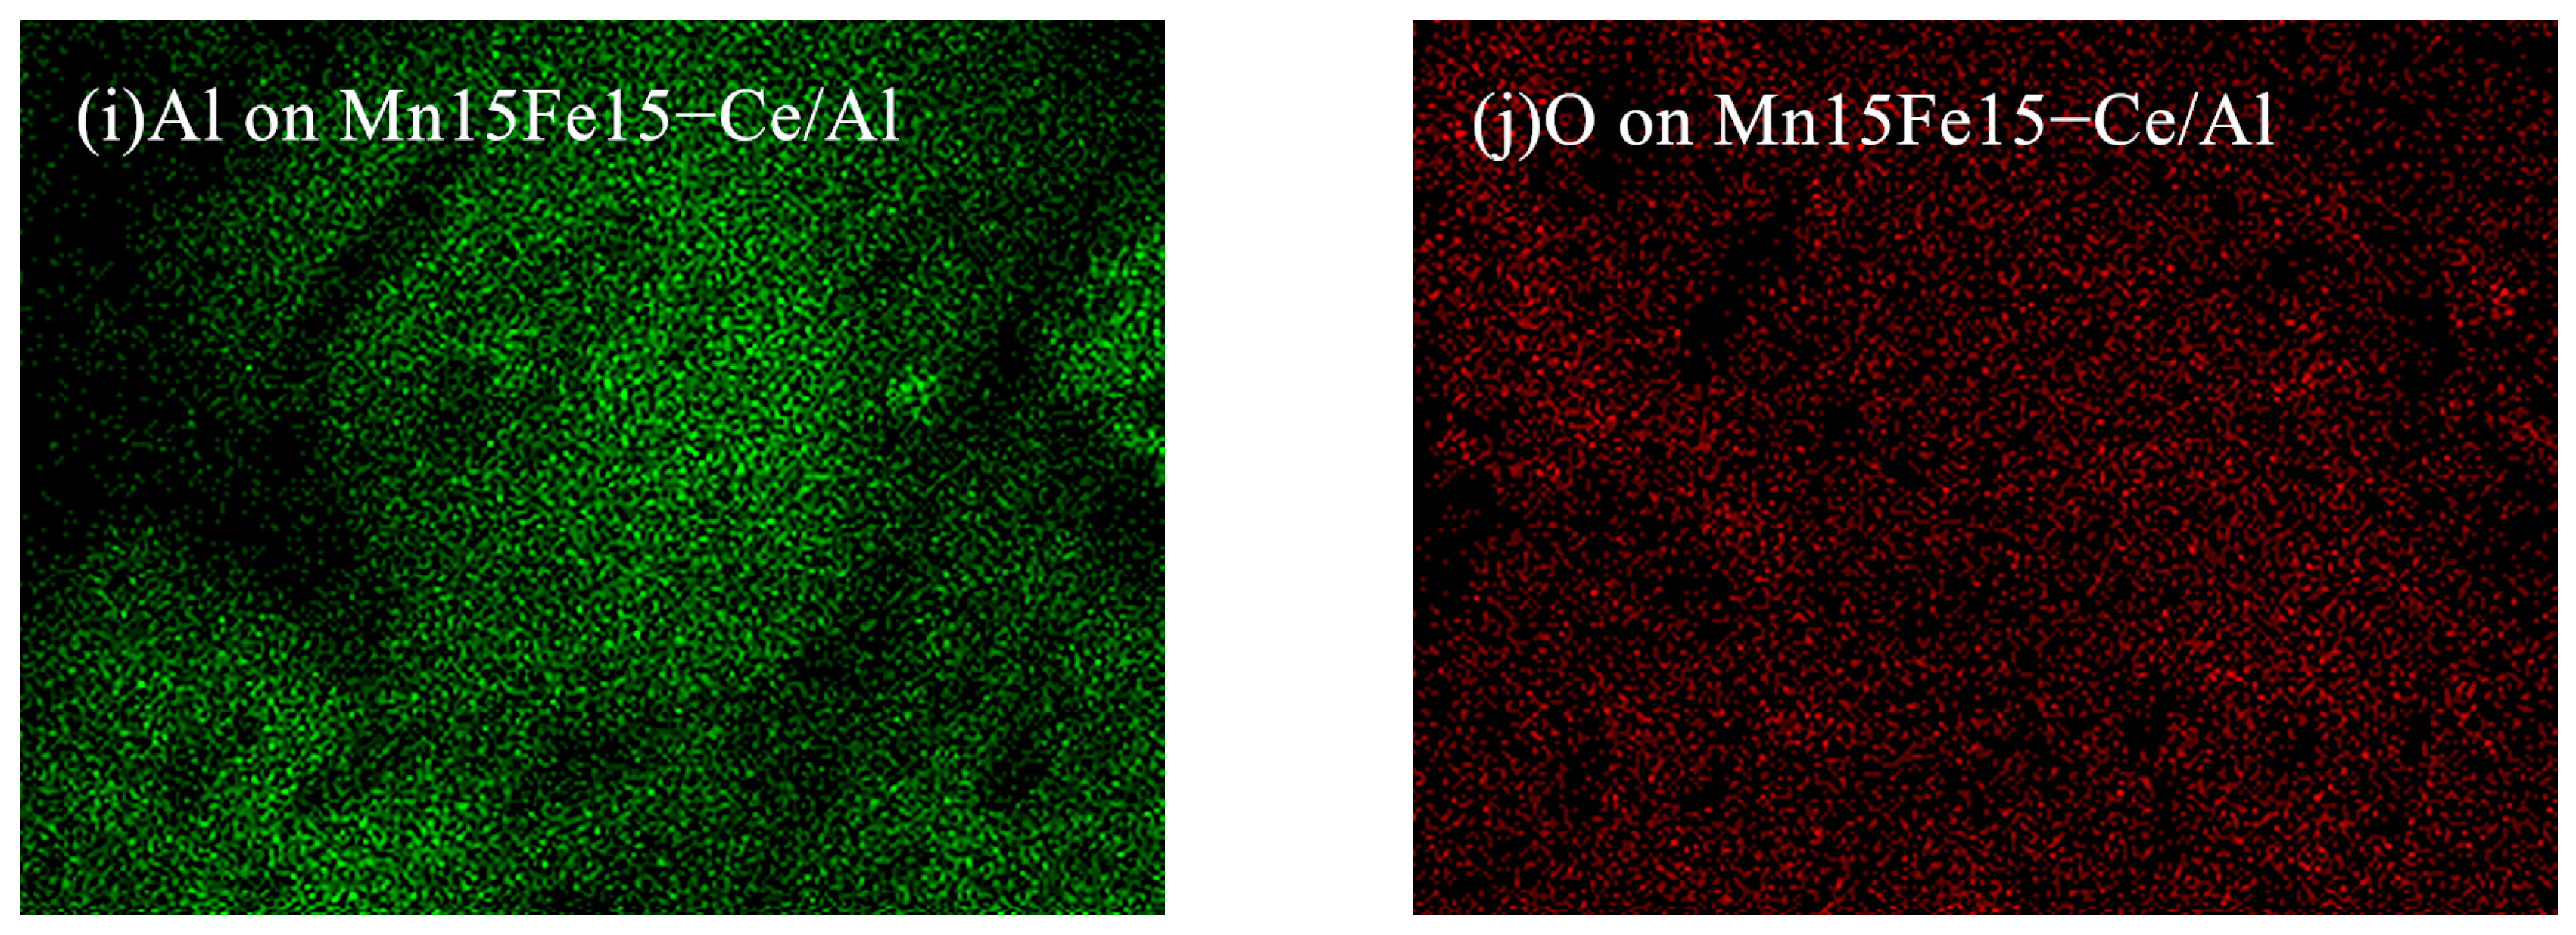
2.1.2. Scanning Electron Microscopy (SEM), Transmission Electron Microscopy (TEM) and Mapping Analysis

The typical micrographs of SEM, TEM and Mappings of the as-prepared Mn−Fe−Ce−Ox/γ-Al2O3 nanocatalysts with different Mn/Fe ratios were presented in Figure 1. In the SEM images shown in Figure 1a–c, the Mn10Fe20−Ce/Al sample particles were irregular. There were lots of stacking particles distributing on the catalyst surface with abundant pores collapsing produced by the fast evaporation of crystal water [22]. While the Mn15Fe15−Ce/Al sample shaped unbroken mesoporosity mesh structure on the catalyst surface. The detailed morphology structures of Mn15Fe15−Ce/Al nanoparticle were further analyzed by TEM, as revealed in Figure 1d. The Mn15Fe15−Ce/Al sample exhibited fine uniform elliptic particles with a narrow size distribution and without hard aggregate. As the Mn/Fe molar ratio rising to 2.0, the Mn20Fe10−Ce/Al sample exhibited spinel microstructure with the nanoparticle size increasing notably. According to the element mappings of the Mn15Fe15−Ce/Al sample as displayed in Figure 1e–j, it was obvious that the corresponding components of manganese, iron and cerium species were highly dispersive on the catalyst surface without regional accumulations or crystallizations.

2.2. Structural Characterization

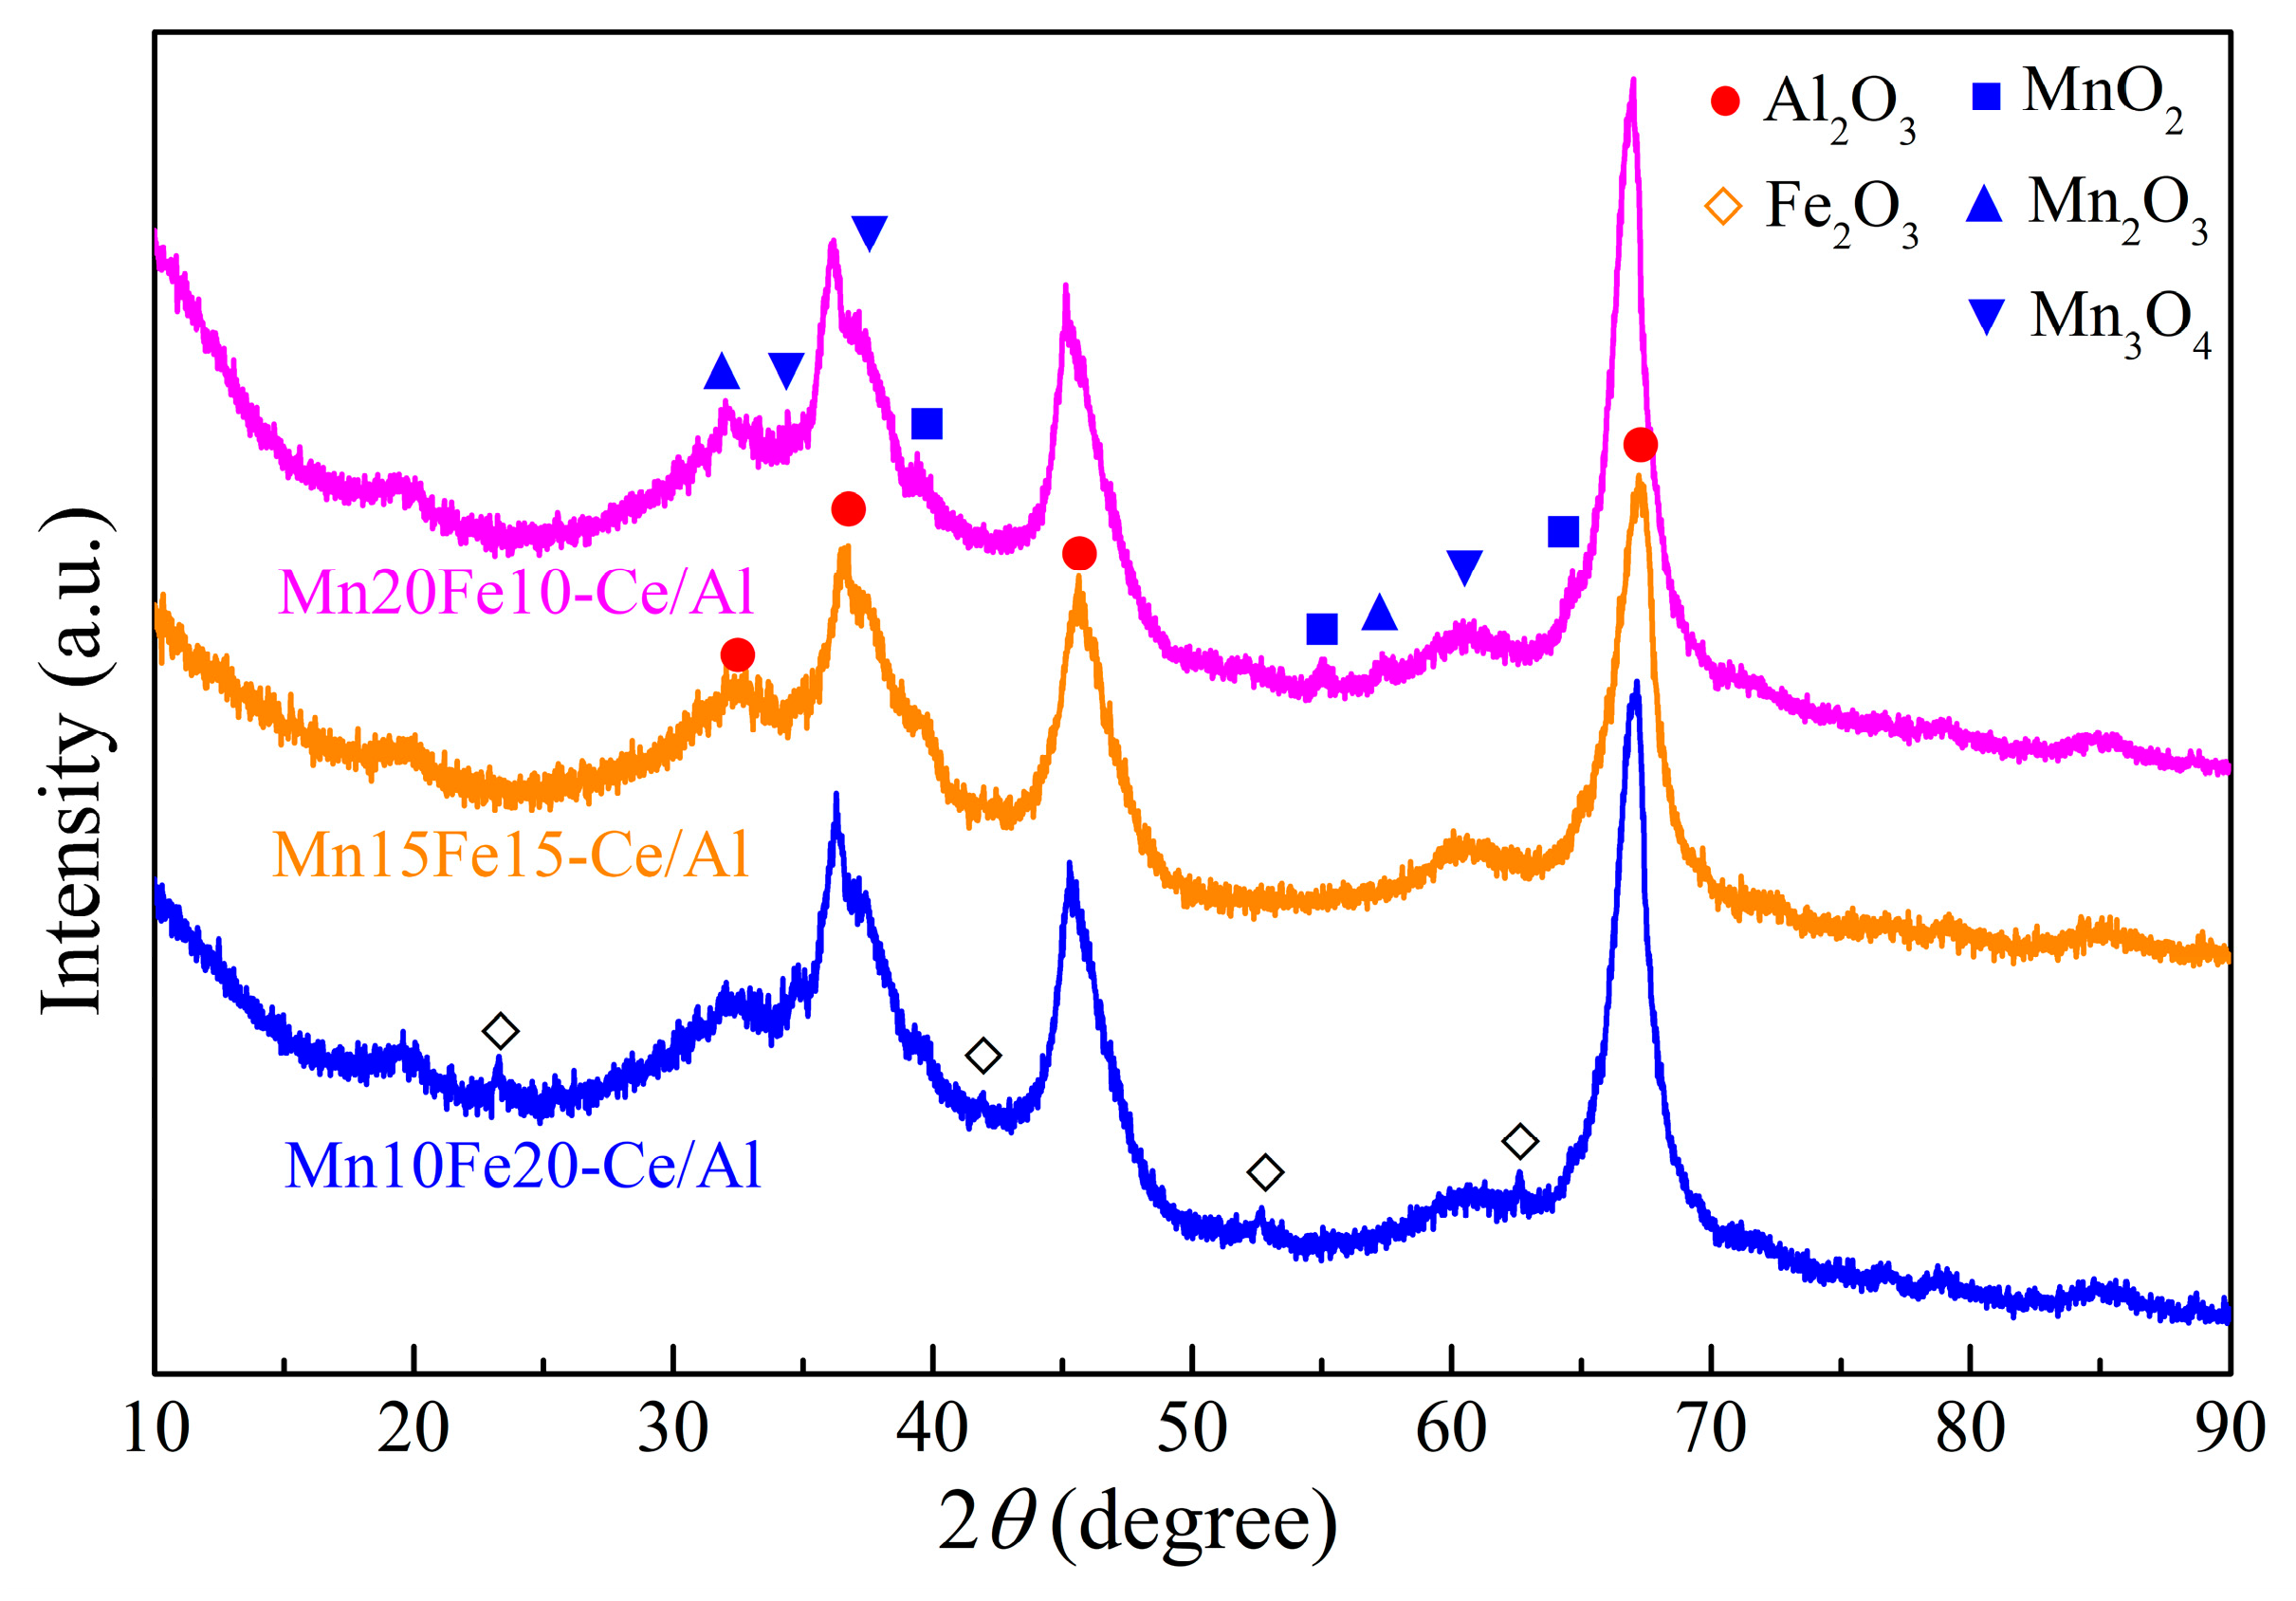
2.2.1. X-Ray Diffraction (XRD) Analysis

The XRD results of Mn−Fe−Ce−Ox/γ-Al2O3 nanocatalysts with different Mn/Fe ratios are exhibited in Figure 2. It was obvious that the diffraction peaks in XRD patterns matched γ-Al2O3 with several strong and distinguished peaks at 32.3°, 37.0°, 45.3°, and 67.0° (International Centre for Diffraction Data (ICDD) PDF card # 79-1558) [23]. Although the peaks for the structure of Al2O3 support remained complete with different Mn/Fe molar ratios, the diffraction angles of corresponding peaks shifted towards lower angles at varying degrees. Among all tested catalysts, the Mn15Fe15−Ce/Al sample obtained the lowest diffraction angles for each peak, which manifested the potential interaction among MnOx, FeOx, CeOx and Al2O3. For the curve of the Mn10Fe20−Ce/Al sample, the diffraction peaks coinciding with Fe2O3 at 2θ = 23.7°, 42.3°, 53.3°, and 63.0°, in accordance with (012), (020), (116) and (300) crystallographic plane reflections, respectively (ICDD PDF card # 88-2359) [24]. While the diffraction peaks of Fe3O4 or FeO were not found in the Mn10Fe20−Ce/Al sample. Comparing the curves of the Mn15Fe15−Ce/Al and Mn20Fe10−Ce/Al samples with that of Mn10Fe20−Ce/Al sample, it could be found that the diffraction peaks of Fe2O3 were lowered as the Mn/Fe molar ratio increased, which probably indicated the addition of manganese into Fe−Ce−Ox/γ-Al2O3 decreased the crystallization of Fe2O3. As for the Mn20Fe10−Ce/Al sample with Mn/Fe molar ratio of 2.0, the diffraction peaks coinciding with MnOx were very complex. The characteristic peaks at 37.5°, 42.5°, 53.8°, and 64.6° could be ascribed to MnO2 (ICDD PDF card # 89-5171), the peaks at 32.3° and 55.1° attributed to Mn2O3 (ICDD PDF card # 24-0508), and the peaks at 33.5°, 36.4° and 59.7° assigned to Mn3O4 (ICDD PDF card # 89-4837) [25]. At the same time, the peaks matched Fe2O3 remarkably weakened and no peaks of other FeOx appeared.
In the curve of Mn15Fe15−Ce/Al sample, there were no evident distinct diffraction peaks of FeOx or MnOx were detected. These indicated the appropriate Mn/Fe molar ratio not only facilitated the dispersion of FeOx entirely, but also enhanced the dispersion of MnOx completely on the catalyst surface. As a result, the coexistence of iron oxides and manganese oxides increased the active species distributions, minished the particle size and reduced the crystallinity. The smaller size particles of active element species were beneficial to the fast SCR reaction [26], but the larger oxide clusters promoted NH3 oxidation and restrained fast SCR efficiency [27]. So, the better distribution of FeOx and MnOx on the nanocatalyst surface had a significant impact on the fast SCR reaction. Furthermore, no evident peaks for crystalline of CeO2 or Ce2O3 were observed with Mn/Fe molar ratio of 0.5~2.0 in this work, which suggested the CeOx might be highly dispersed on the surface of Mn−Fe−Ce/Al or the crystal diameters of CeOx were too small (<5 nm) to be distinguished.

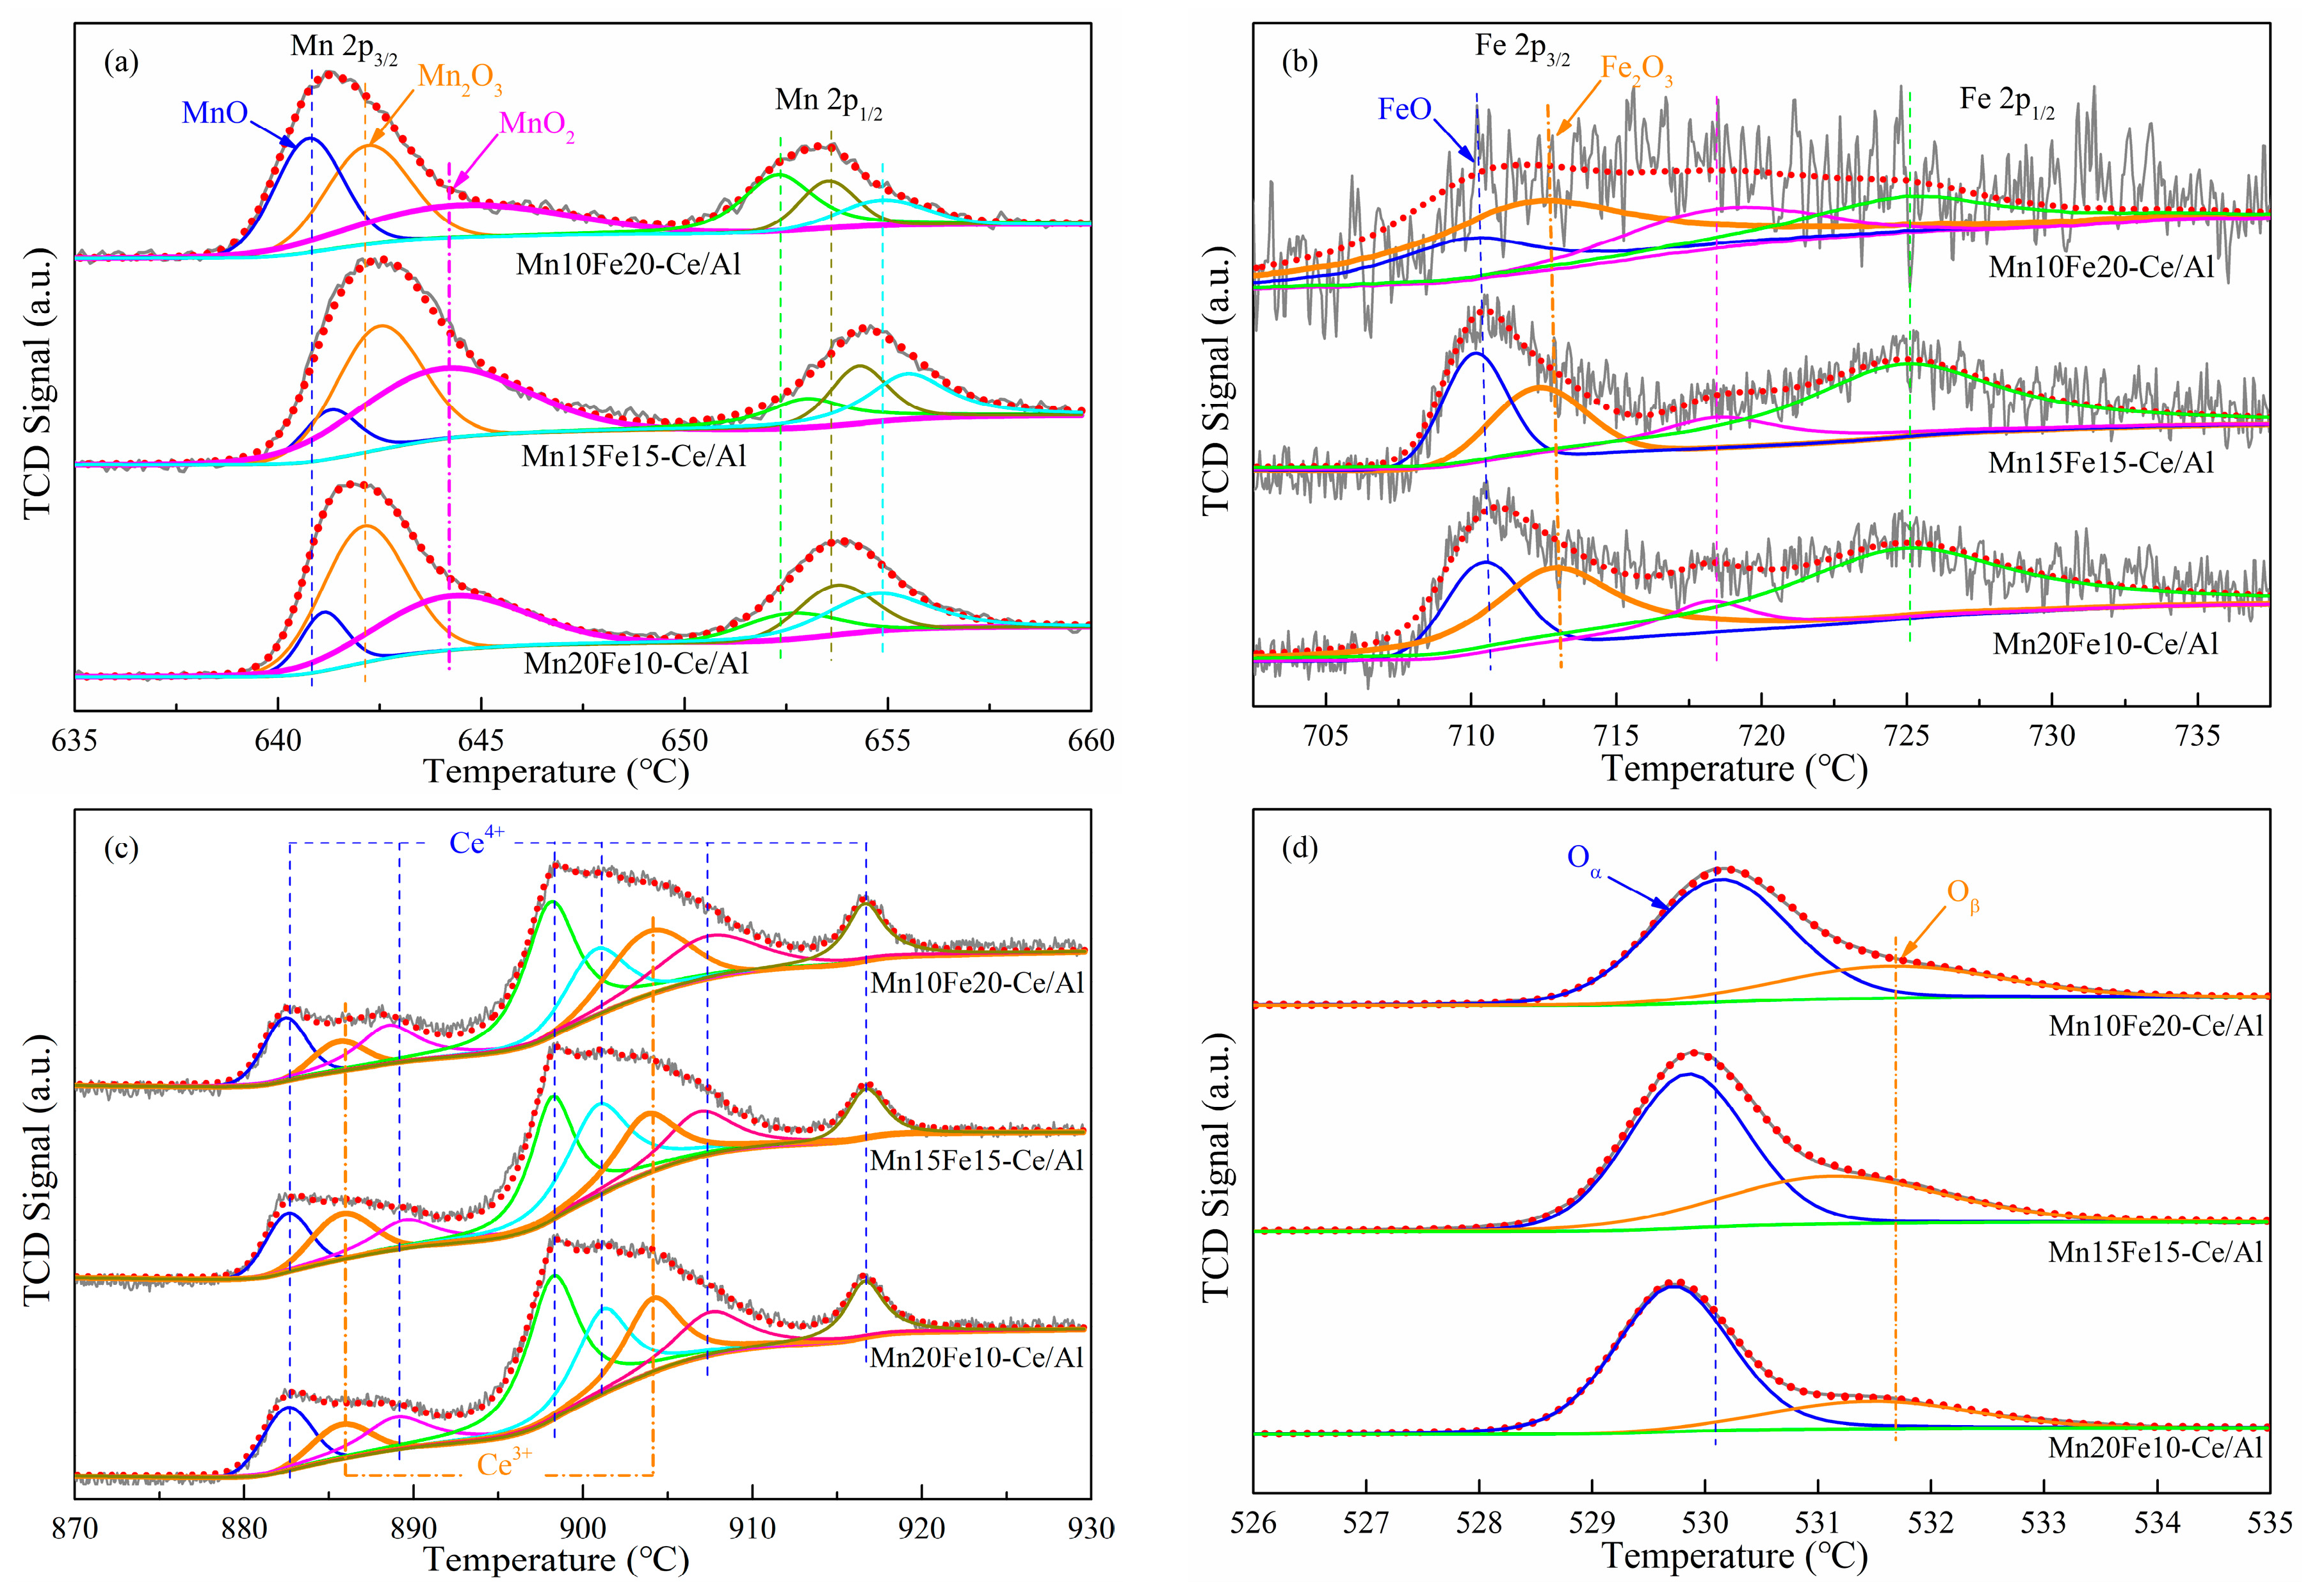
2.2.2. X-Ray Photoelectron Spectroscopy (XPS) Analysis

In fast SCR reaction, the components of catalyst surface and the oxidation states of active species had significant effects on the catalytic activity [5]. For the purpose of exploring the atomic chemical valences and revealing the element concentrations on the catalyst surface, XPS analysis of Mn−Fe−Ce−Ox/γ-Al2O3 nanocatalysts was undertaken. The XPS spectra of Mn 2p, Fe 2p, Ce 3d, and O 1s in the nanocatalysts were exhibited in Figure 3. The valence states of each element were confirmed numerically by Gaussian fitting, respectively. According to these fittings, the relevant binding energy and the respective atomic concentration of elements in diverse valence states on Mn−Fe−Ce−Ox/γ-Al2O3 surface are shown in Table 2.
It can be seen from Figure 3a that the XPS spectra of Mn 2p in the investigated nanocatalyst samples were matched with two constituents, attributed to Mn 2p3/2 (peak at around 642 eV) and Mn 2p1/2 (peak at about 653 eV) existing in MnOx simultaneously [28]. The dissymmetric peak of Mn 2p3/2 further confirmed the complex co-existence of manganese species in various states. The spectra of Mn 2p3/2 could be split into three peaks via the peak-fitting deconvolution. As reported in previous studies [22], the first peak at around 641.0 ± 0.3 eV associated with MnO, the second one at 642.2 ± 0.3 eV is consistent with Mn2O3, and the third one at 644.2 ± 0.3 eV was assigned to MnO2, respectively. It was apparent that the three valence states of MnOx were difficult to separate within the binding energy difference value of 3.3 eV. The surface atomic compositions and relative intensities of Mnn+ on the catalyst surface were calculated on account of the area covered under the separated peaks, as summarized in Table 2. With the Mn/Fe molar ratio increasing from 0.5 to 1.0, the Mn2+ concentration on the sample surface reduced obviously from 33.9% to 6.8%; by contrast, the concentration of Mn4+ rose significantly from 29.9% to 53.8% which became larger than that of Mn3+. From the above results, it was proposed that the principal phase of manganese species in the Mn−Fe−Ce−Ox/γ-Al2O3 nanocatalysts changed from Mn2O3 to MnO2. This was also possibly ascribed to the major amount of Mn mainly existing as +4 state covering dispersedly on the catalyst surface. Keeping on increasing the Mn/Fe molar ratio to 2.0, the percentage of Mn4+ in Mnn+ began to decline, at the same time the Mn3+/Mnn+ ratio increased remarkably. The NO catalytic activity of pure manganese oxides had been ranked as MnO2 > Mn2O3 > Mn3O4 [25]. Furthermore, there were studies revealed that the increased concentration of Mn4+ on the catalyst surface was beneficial to SCR reactions [29]. Consequently, it could be expected that the Mn15Fe15−Ce/Al nanocatalyst would provide a superior fast SCR activity compared to Mn10Fe20−Ce/Al and Mn20Fe10−Ce/Al samples.
The Fe 2p XPS spectra of Mn−Fe−Ce−Ox/γ-Al2O3 nanocatalysts are displayed in Figure 3b with two distinctive peaks presented for Fe 2p3/2 (709.1–712.0 eV) and Fe 2p1/2 (723.8–725.0 eV). The broad peak centered at 711.0 eV included two overlapped peaks, the first one at about 709.4 ± 0.4eV was related to Fe2+ and the second one at around 711.8 ± 0.5eV was ascribed to Fe3+. Meanwhile, a satellite peak of Fe3+ in Fe2O3 appeared at 718.4 eV [10]. The overlapping peaks manifested the coexistence of iron in +2 and +3 states on the catalyst surface, which were quantified in Table 2. With the Mn/Fe molar ratio increasing from 0.5 to 1.0, the percentage of Fe3+ in Fen+ decreased, while the Fe2+ concentration was improved. These could be attributed to the synergistic effects taking place in the redox equilibrium between Fe and Mn: Fe3+ + Mn3+ ↔ Fe2+ + Mn4+ [30].
Figure 3c showed the Ce 3d spectra results for Mn−Fe−Ce−Ox/γ-Al2O3 nanocatalysts. The Ce 3d curve contained u and v multiplets conforming to the spin orbit split 3d5/2 and 3d3/2 core holes, which were further split into eight peaks on the basis of binding energy, labeled as u0, u′, u″, u‴ and v0, v′, v″, v‴, respectively [31]. The two peaks labeled u′ and v′ were attributed to the 3d104f1 initial electronic state of Ce3+, and the other six bands corresponded to the 3d104f0 state of Ce4+ [32]. These indicated the species of Ce3+ and Ce4+ coexisted on the surface of Mn−Fe−Ce−Ox/γ-Al2O3 nanocatalysts. As shown in Table 2, it was obvious that the Ce3+/Cen+ ratio of Mn15Fe15−Ce/Al sample was 33.8%, as calculated by Equation (4) [33], which was greater than that of the other two catalyst samples. Therefore, the Mn/Fe molar ratio of 1.0 might be positive to the conversion from Ce4+ to Ce3+, which resulted in an improvement of Ce3+ species on its surface.
η Ce 3 + = u + v u 0 + u + u + u + v 0 + v + v + v × 100 %
The generated species of Ce3+ were significant inducements for the formation of electric charge balance, the generation of unsaturated chemical bonds, the improvement of surface oxygen vacancies, and the development of more chemisorbed oxygen, which would be advantageous to the activate reactants adsorption or intermediate species transformations [5]. As the temperature was under 200 °C, the main catalytic reactions followed the Eley–Rideal mechanism. NH3 absorbed on active sites to generate NH2 and −OH with oxygen. Subsequently, the achieved NH2 further reacted with NO forming intermediate NH2NO, and finally the intermediate species decomposed into N2 and H2O [34]. Thus, it was proposed that the quantity improvement of oxygen vacancies on the catalyst was conducive to facilitating the intermediate formation and enhancing catalytic performance in the fast SCR reaction. In the crystal lattice of Mn15Fe15−Ce/Al sample, the negative charge transferred from manganese to cerium intensifying the interaction between Mn and Ce: Mn2+ + Ce4+ ↔ Mn3+ + Ce3+ [16,35], Mn3+ + Ce4+ ↔ Mn4+ + Ce3+ [36,37]. The course of oxygen storage and release on the Ce3+/Ce4+ redox couple was brought forward: Ce2O3 + 1/2O2 → 2CeO2 and 2CeO2 → Ce2O3 + O* (adsorbed) [36]. Overall, it could be easier for the catalysts with more Ce3+ species on the surface to develop surface oxygen vacancies, which was beneficial to the oxygen adsorption to achieve chemisorbed oxygen [10].
The XPS spectra of O 1s for Mn−Fe−Ce−Ox/γ-Al2O3 nanocatalysts are illustrated in Figure 3d. According to the curve-fitting results, the O 1s spectra was split into two peaks: the first peak labeled by Oα was ascribed to lattice oxygen appearing at binding energy of 529.5–530.3 eV, the second peak denoted as Oβ was attributed to chemisorbed oxygen on the catalyst surface at the binding energy of 531–532 eV. Compared with the XPS spectra of the Mn10Fe20−Ce/Al sample, both binding energies of Oα and Oβ in the Mn15Fe15−Ce/Al and Mn20Fe10−Ce/Al samples shifted towards lower values, which might be caused by the existence of more Mn4+ species [9]. Furthermore, the surface concentration of chemisorbed oxygen of the Mn15Fe15−Ce/Al sample reached 37.4% as shown in Table 2, which was much larger than that of the Mn10Fe20−Ce/Al and Mn20Fe10−Ce/Al samples. The chemisorbed oxygen with high mobility was regard as the most active oxygen species in the SCR process, facilitating NO oxidation to NO2 and promoting the fast SCR reaction in the gas mixture: NO + NO2 + 2NH3 → 2N2 + 3H2O [4].

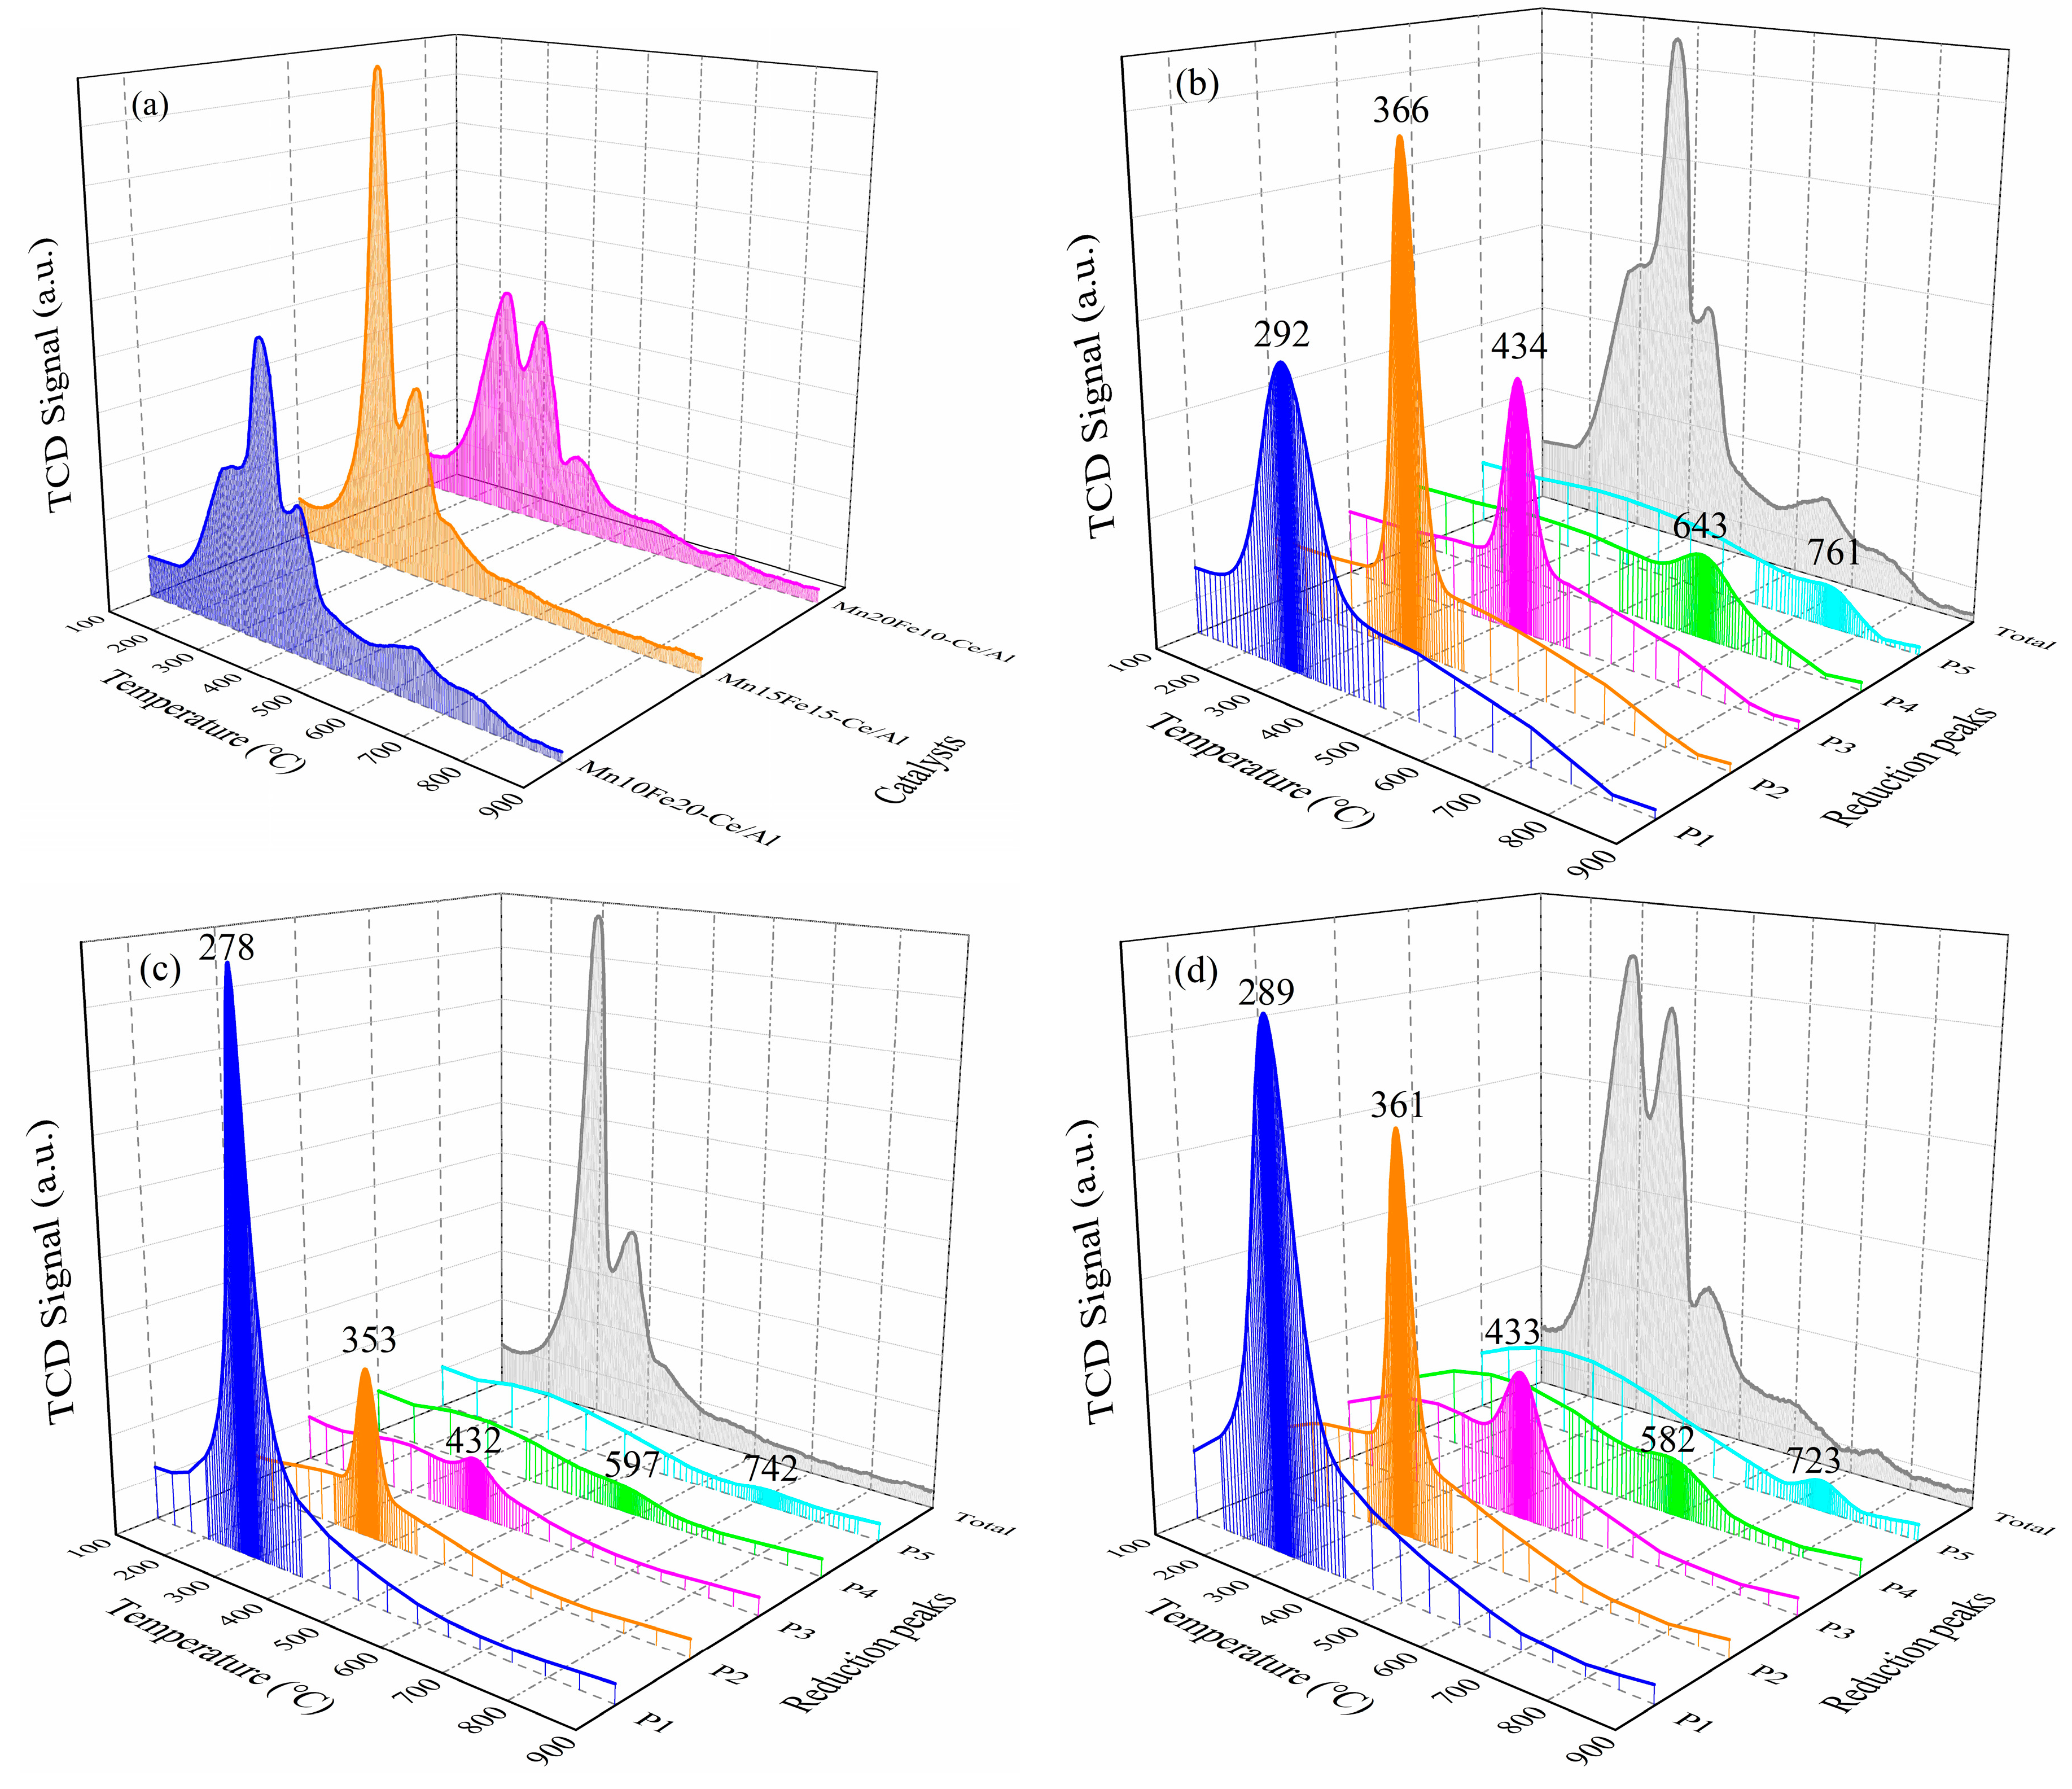
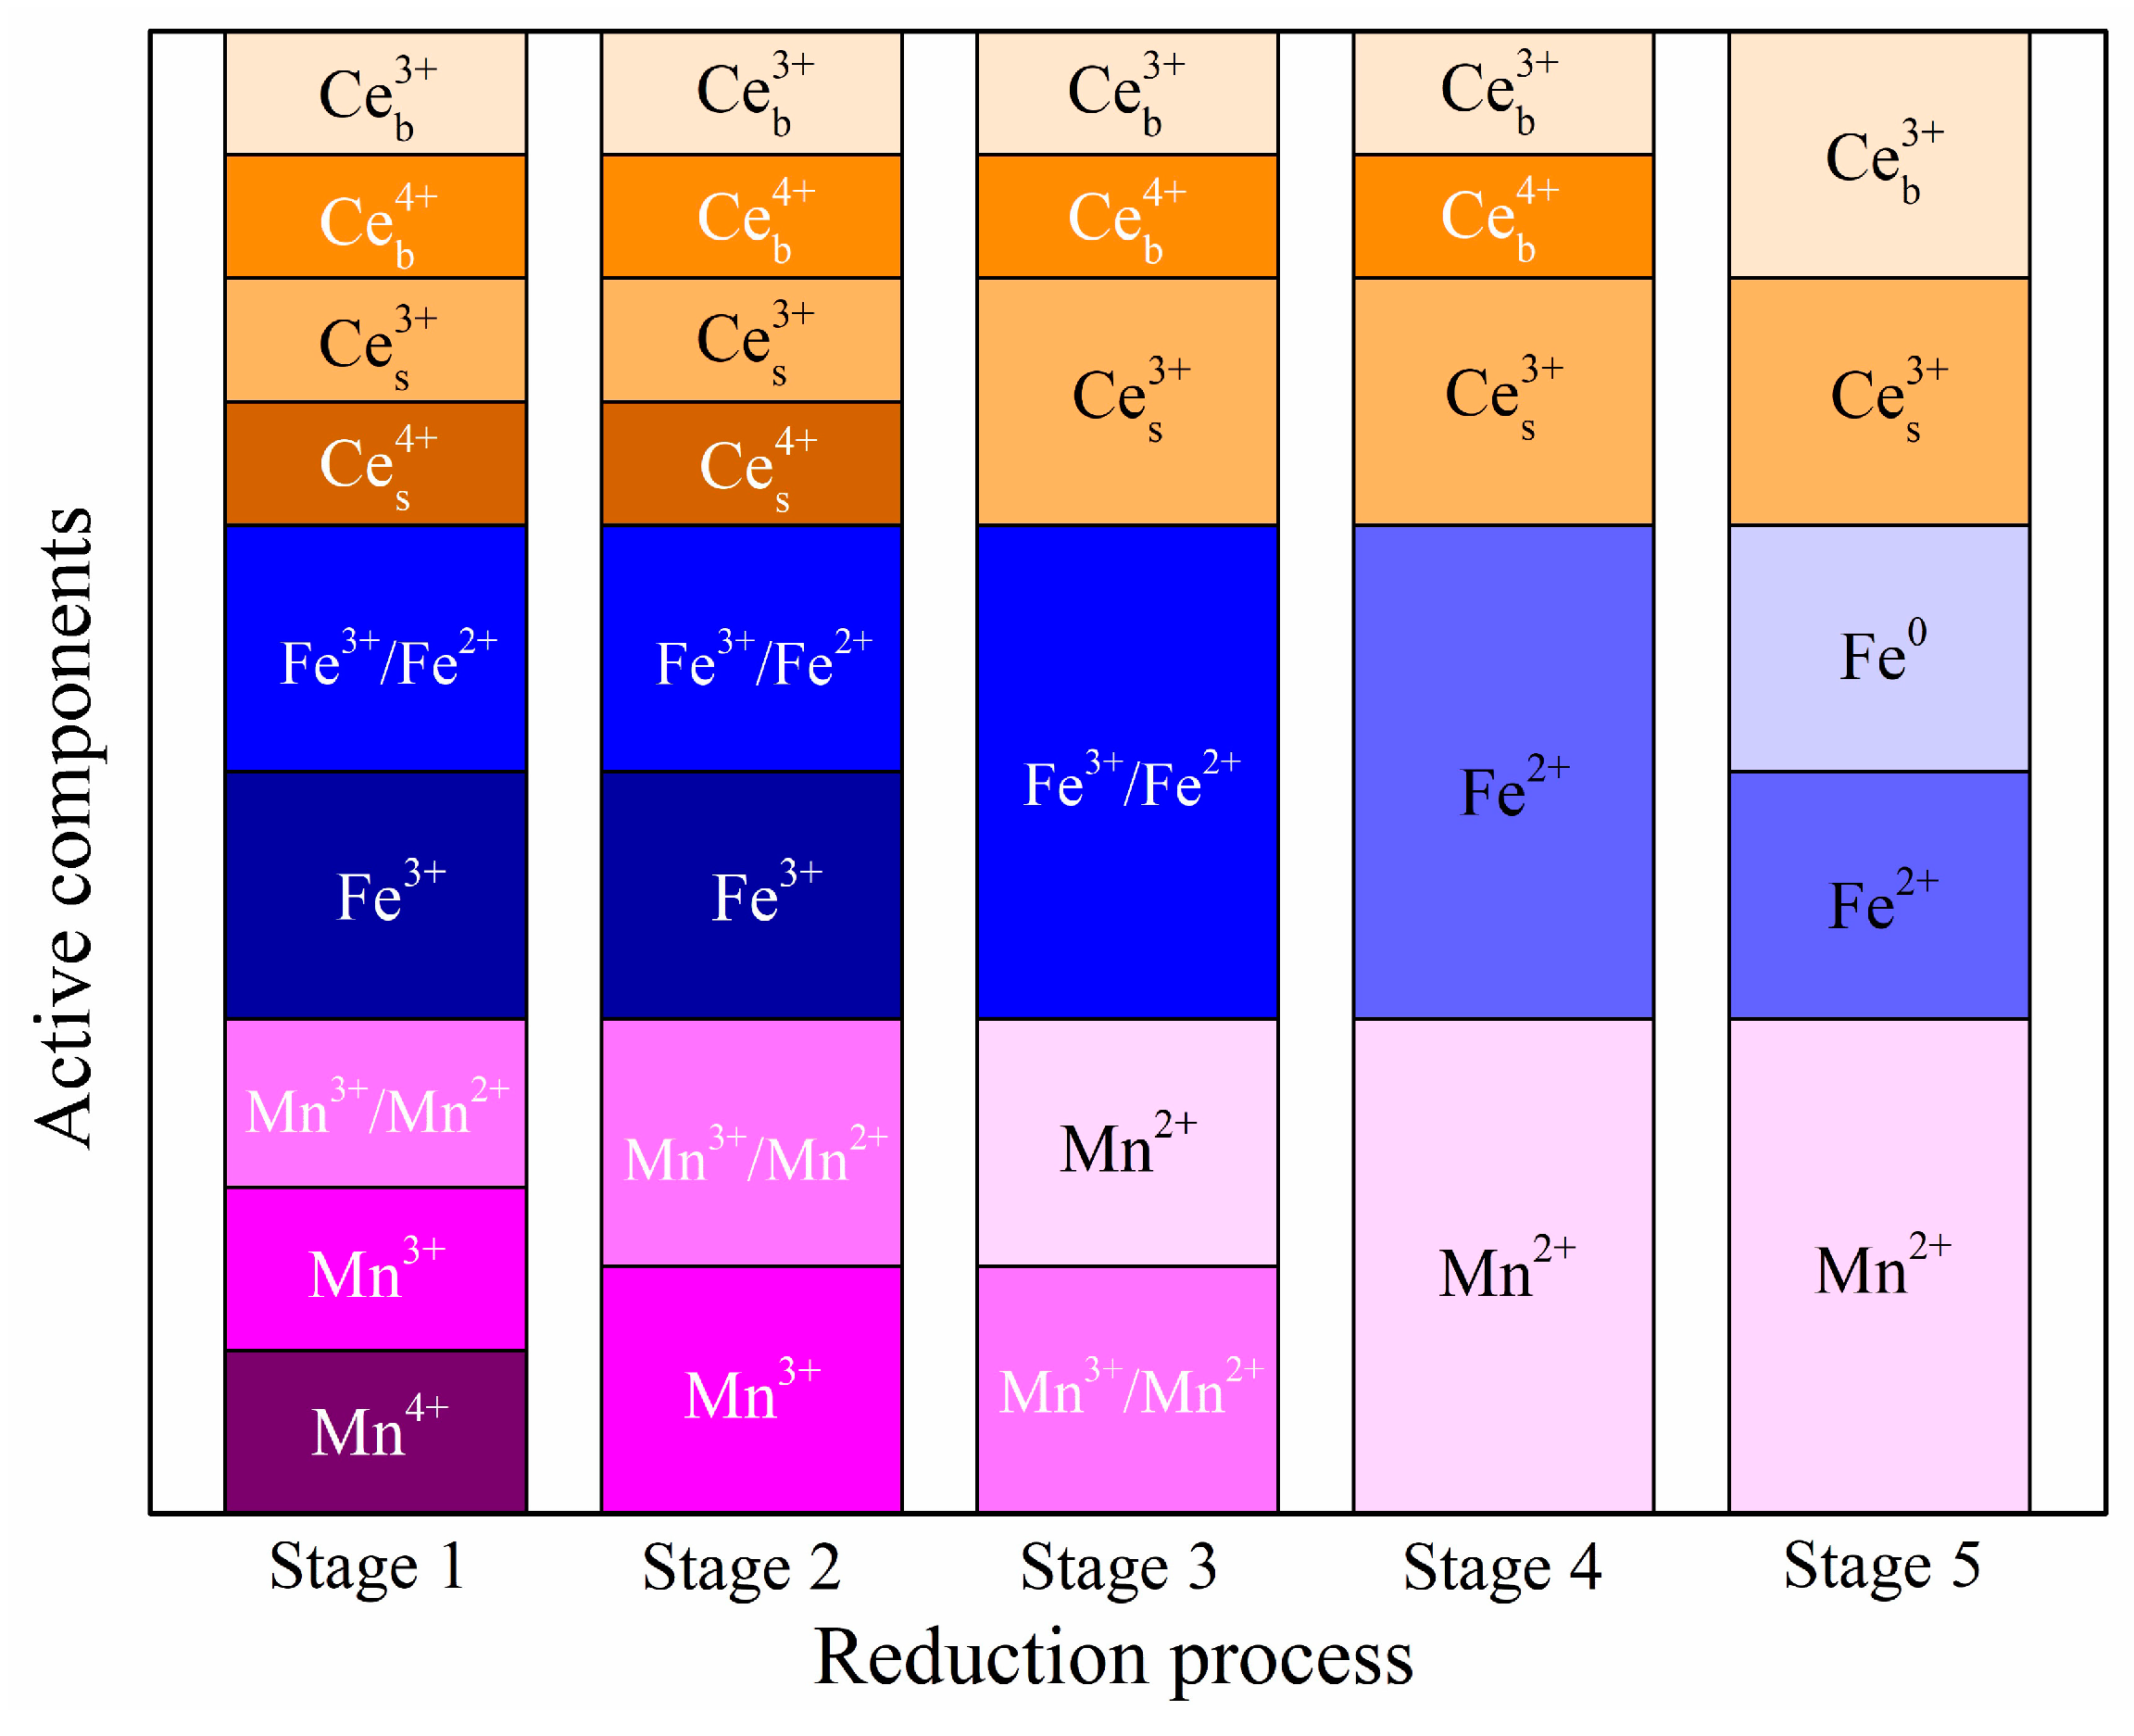
2.2.3. H2-Temperature-Programmed Reduction (H2-TPR) Analysis

The reduction behavior of Mn−Fe−Ce−Ox/γ-Al2O3 nanocatalysts were analyzed by H2-TPR and the curves were matched by Gaussian functions as shown in Figure 4. For each of the three nanocatalyst samples, there were five main hydrogen consumption peaks locating in the range from 100 to 900 °C. Since the support of alumina had no obvious H2 consumption peaks in the temperature range [38], all the peaks exhibited in Figure 4 could be associated with the reduction of different species of MnOx, FeOx and CeOx. For Mn10Fe20−Ce/Al sample, the initial wider reduction peak (P1) from 160 °C to 440 °C was assigned to the high oxidation state of manganese ion transformation from MnO2 reducing to Mn2O3 [15]. Considering the existence of Fe2O3 crystallization had been confirmed by XRD analysis, the second prominent reduction peak (P2) centered at 366 °C could be mainly attributed to Mn2O3 species combining with the majority of Fe2O3 to Fe3O4, where iron species were settled in easily reducible sites in the form of isolated ions, oligomeric clusters or nanoparticles [39]. According to a previous report [40], the Mn2O3 reduction consists of two processes, Mn2O3 to Mn3O4 and Mn2O3 to MnO. The reduction from Mn2O3 to Mn3O4 happened more easily on the initial amorphous Mn2O3, and the conversion from Mn2O3 to MnO occurred more easily at the higher temperature range. Therefore, the third reduction peak (P3) centered at 434 °C was due to the reduction process of Mn2O3 to MnO and the reduction of residual Fe2O3 to Fe3O4. Meanwhile, the fourth reduction peak (P4) at around 643 °C and the fifth one (P5) at approximately 761 °C were potentially associated with the reduction process of Fe3O4 to FeO and FeO to Fe0 in isolated ions, respectively [41].
In comparison, the redox characteristic of Mn15Fe15−Ce/Al sample was significantly different from that of Mn10Fe20−Ce/Al sample. The H2-TPR curve of Mn15Fe15−Ce/Al sample exhibited as a disequilibrium bimodal pattern, and the two main reduction peaks were at around 279 °C and 353 °C, respectively. It was rather remarkable that the MnO2 reduction peak and the Fe2O3 reduction peak varied drastically with the Mn/Fe molar ratio increasing from 0.5 to 1.0. As shown in Figure 4c, the increasing Mn/Fe molar ratio resulted in the significant promotion of reducibility at a low temperature range. The reduction peak P1 was much stronger and broader with the hydrogen consumption maximum obtained at a lower temperature region. Comparing the H2-TPR curves of Mn15Fe15−Ce/Al sample with that of Mn10Fe20−Ce/Al sample, it was noteworthy that all the reduction peaks of MnOx and FeOx shifted towards the lower temperature regions, signifying enhanced catalytic activities at lower temperature. Similar results were achieved by Wang et al. [12] that confirmed the Mn–Fe mixtures leading to lower temperature for Fe3O4 reducing to FeO and FeO converting to Fe0 at the same time. However, as the Mn/Fe molar ratio increased to 2.0 in the Mn20Fe10−Ce/Al sample, the reduction peaks involving MnOx and FeOx (P1, P2 and P3) moved to higher temperature section slightly, while the reduction peaks only containing FeOx (P4 and P5) still shifted towards lower temperature region. In consideration of the crystallization of MnO2, Mn2O3 and Mn3O4 observed in the XRD results as shown in Figure 2, it was supposed that the actual Mn/Fe molar ratio in the MnFeOx nano particle was reduced, and the dominant reduction peak P1 was mainly caused by the reduction of crystallographic MnO2 [11,30].
The redox ability of Mn−Fe−Ce−Ox/γ-Al2O3 nanocatalysts could be determined by the starting reduction peak temperature [42], which followed the order of Mn15Fe15−Ce/Al > Mn20Fe10−Ce/Al > Mn10Fe20−Ce/Al. This indicated that the suitable Mn/Fe molar ratio enhanced the redox activities of MnOx and FeOx, and was further confirmed by the total H2 consumption as shown in Table 3. As the Mn/Fe molar ratio increased from 0.5 to 2.0, the total H2 consumption rose from 4.93 mmol/g to 6.11 mmol/g, and then declined to 5.97 mmol/g. On account of the redox property being an important factor affecting the fast SCR reaction, it was reasonable that the Mn15Fe15−Ce/Al sample exhibited higher NO oxidation rate and fast SCR reaction activity than the Mn20Fe10−Ce/Al and Mn10Fe20−Ce/Al samples. Meanwhile, it could be noticed that there were no distinguishable reduction peaks corresponds to cerium species. According to previous research [43], the typical reduction peaks at around 450 °C and 740 °C could be associated with the surface Ce4+ converting to Ce3+ and the bulk Ce4+ transforming to Ce3+, respectively. In this work, the reduction peaks of cerium species were very weak due to the low-quality content of cerium. At the same time, the characteristic reduction peaks of cerium were overlapped with the reduction process of Mn2O3 to MnO and Fe2O3 to Fe3O4 at 380~500 °C (P3), and covered by the FeO to Fe0 reduction at 700~800 °C (P5). Figure 5 provides a graphical representation of the reduction process, in which each active component is embodied qualitatively.
Overall, on the basis of the reduction process analyzed above, the optimal Mn/Fe molar ratio for Mn−Fe−Ce−Ox/γ-Al2O3 nanocatalysts was 1.0 with increased H2 consumption and lower reduction peak temperature. This indicated that the reinforced reducibility in Mn15Fe15−Ce/Al sample was potentially due to the strong interaction between MnOx and FeOx with the best material proportion.

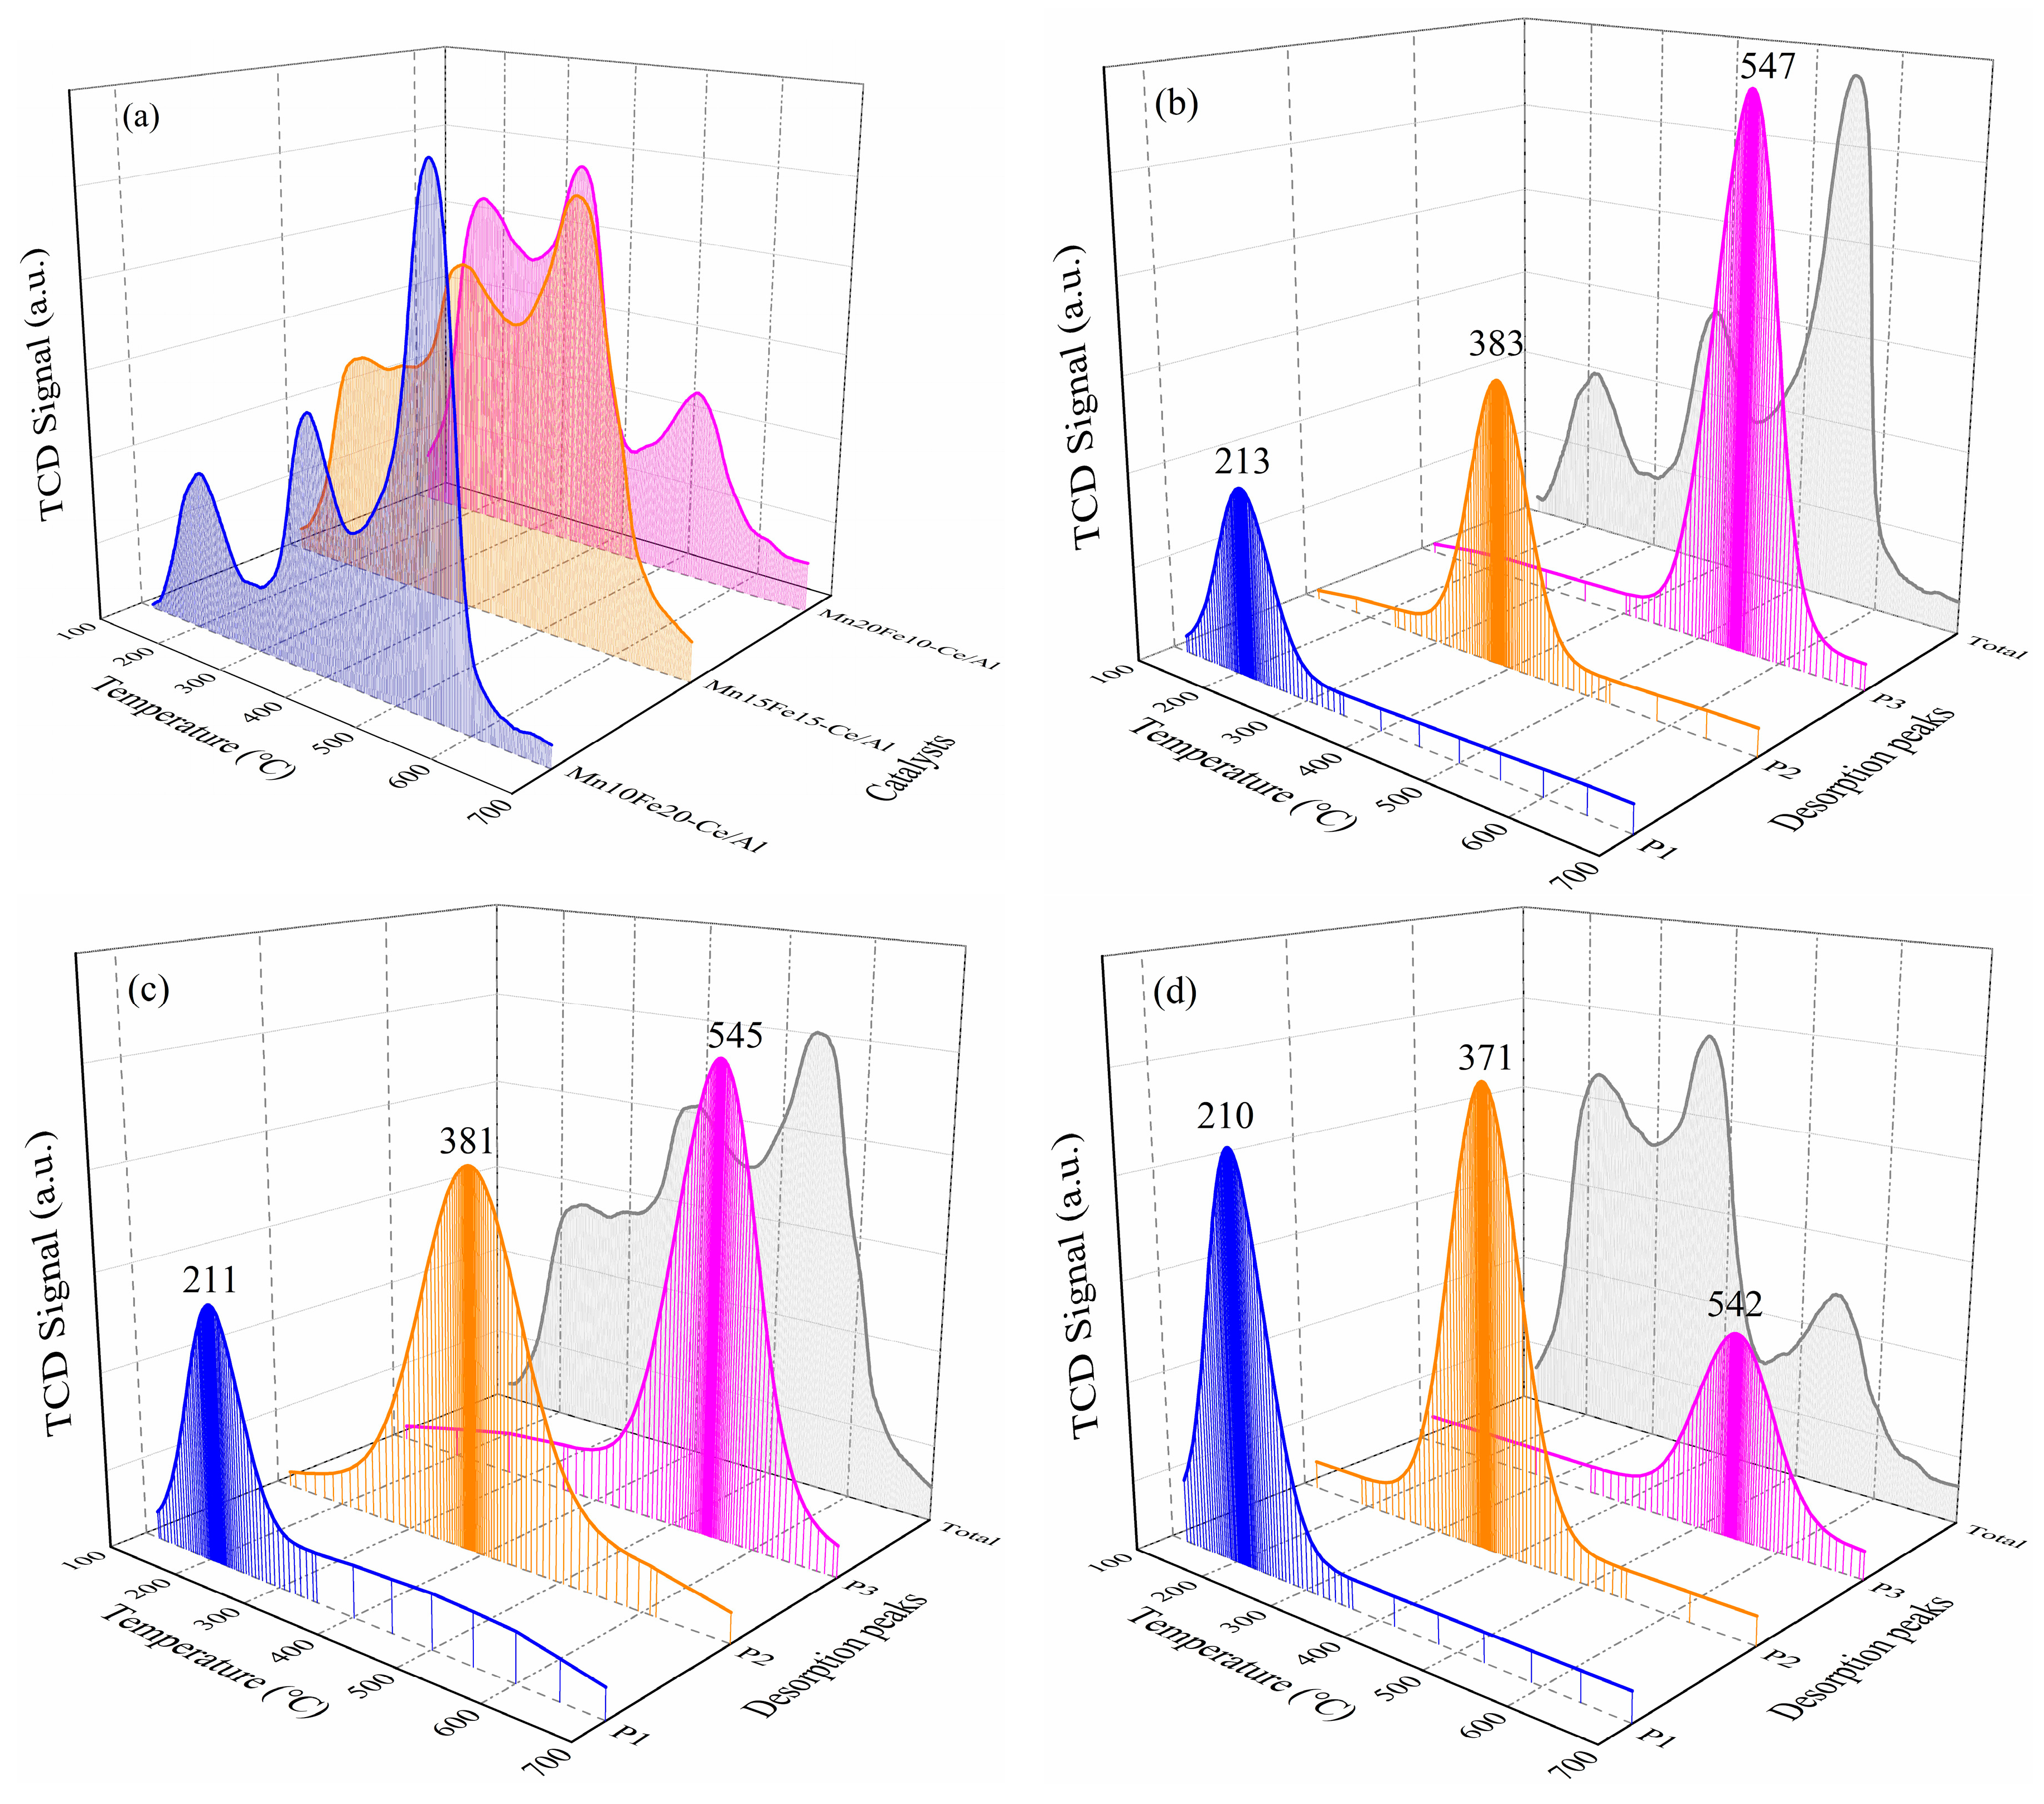
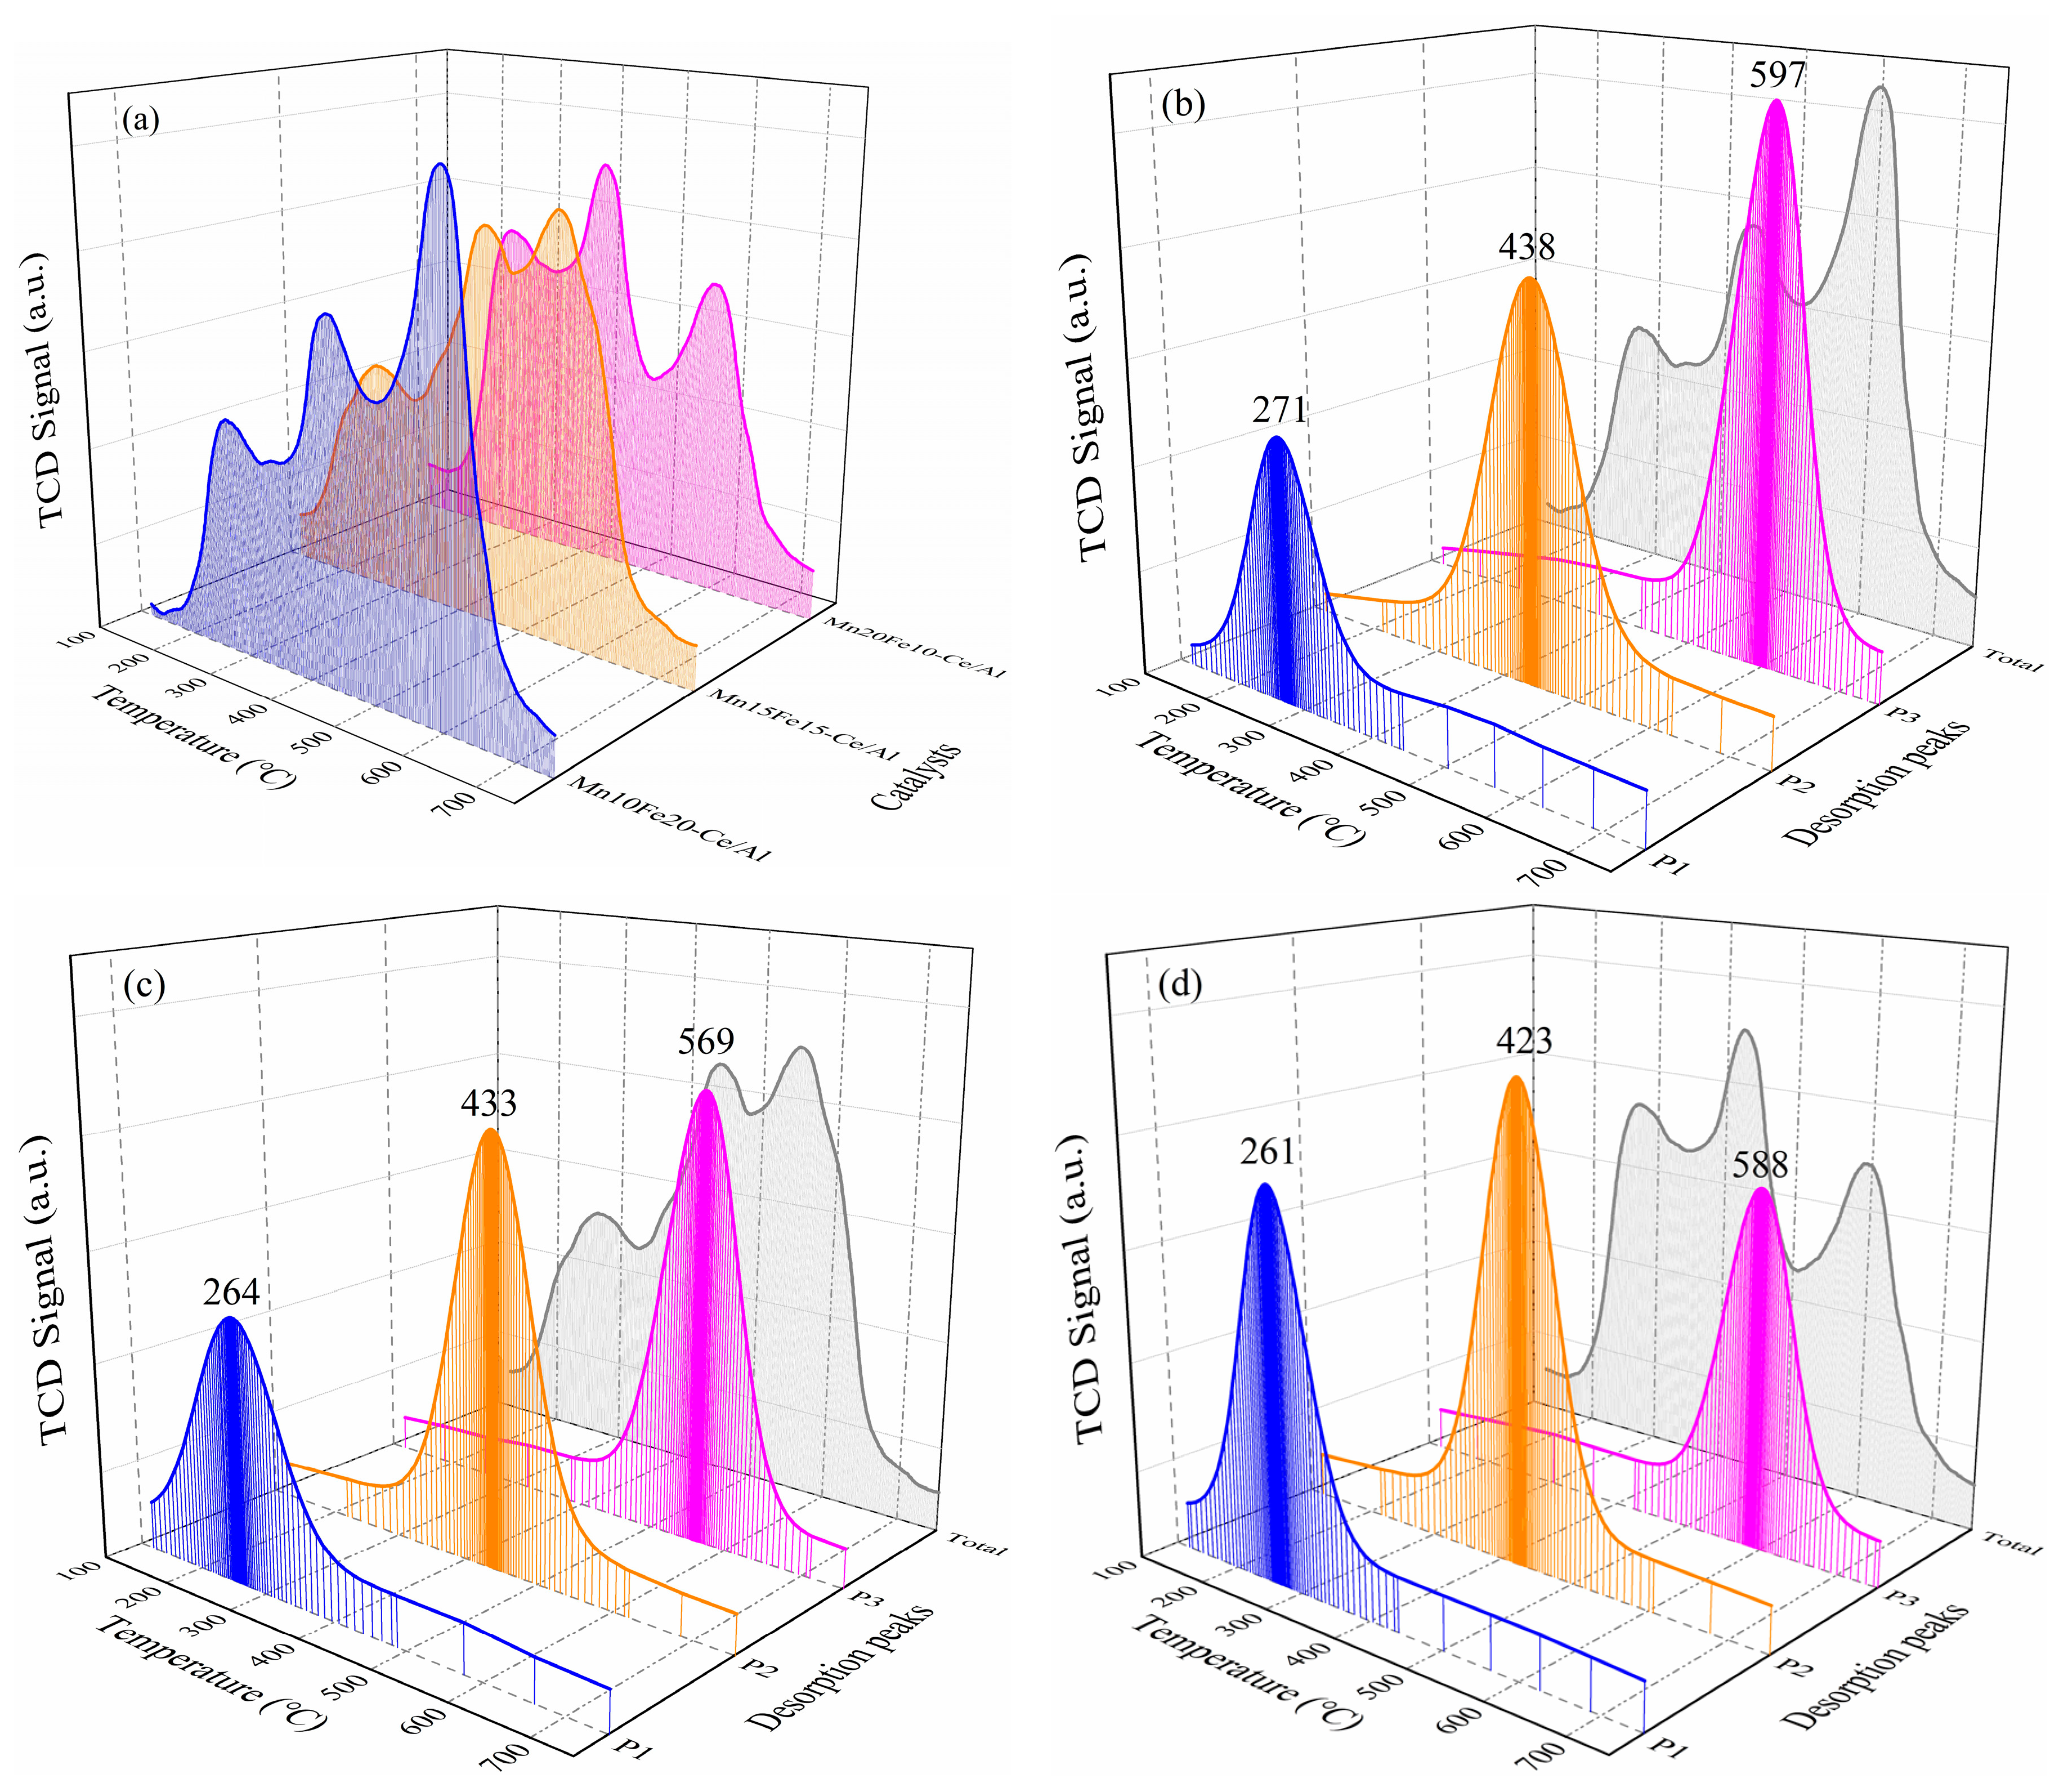
2.2.4. NH3-Temperature-Programmed Desorption (NH3-TPD) and NO-TPD Analysis

Except for the satisfactory redox behavior, it was another pivotal factor that the acid sites on the catalyst surface were sufficient to enhance the catalytic activities in the SCR reaction [9,17]. For the purpose of intensive investigation of the complicated relationship between the surface acidity and the activities, NH3-TPD and NO-TPD experiments were performed on Mn−Fe−Ce−Ox/γ-Al2O3 nanocatalysts and the corresponding curves according to data analysis were showed in Figure 6 and Figure 7, respectively. The NH3-TPD patterns for these catalysts were ascribed to three desorption peaks of chemisorbed NH3 in the temperature range from 120 to 700 °C. For the Mn10Fe20−Ce/Al sample, the first weak peak (P1) was ranged at around 213 °C, which was attributed to NH3 desorption from the weak acid sites. The second stronger peak (P2) positioned at about 383 °C approximately was ascribed to the medium-strong acid sites. The third dominating desorption peak (P3) at around 547 °C signified the distribution of strong acid sites, which exhibited a large amount of strong acid sites matching to the desorption of strongly bound ammonia on the potential Lewis acid sites [44]. Compared with the NH3-TPD pattern of the Mn10Fe20−Ce/Al sample, the Mn15Fe15−Ce/Al sample displayed superior acidity property at the medium- and low-temperature regions, where all the three desorption peaks shifted towards lower temperatures and converted to much wider spans. The enhancements of medium-strong acid sites and weak acid sites were positive to ammonia adsorption, which was proposed that NH3 probably adsorbed on both Lewis acid sites and Brönsted acid sites on the catalyst surface [12]. As the Mn/Fe molar ratio increased to 2.0 in the Mn20Fe10−Ce/Al sample, the NH3 desorption peaks moved further to the lower temperature region, and meanwhile the two strong peaks of medium-strong acid sites and weak acid sites became overlapped from 150 °C to 450 °C. The desorption peak of strong acid sites apparently reduced, which would be the reason for the decrease in fast SCR activity of Mn20Fe10−Ce/Al sample.
For the purpose of accurately analyzing the total surface acidity, the desorption peaks of the Mn10Fe20−Ce/Al, Mn15Fe15−Ce/Al and Mn20Fe10−Ce/Al samples were quantitatively analyzed and are summarized in Table 4. The total NH3 consumption grew from 1.24 mmol/g to 1.61 mmol/g with the Mn/Fe molar ratio increasing from 0.5 to 1.0, which further confirmed the promotion effects of the Mn/Fe molar ratio on the surface acidity of nanocatalyst samples. These could be explained by the creation of more Brönsted acid sites on the catalyst surface [16]. It was noteworthy that the Mn20Fe10−Ce/Al sample exhibited the best acidity properties at the low temperature, 0.56 mmol/g at 210 °C, which was beneficial to ammonia adsorption and advantageous to the low-temperature SCR reaction. However, it was found that the blocking effects of NH3 applied especially to the fast SCR reaction at low temperatures [45]. The inhibiting effects were probably due to a competition of NH3 with NO for adsorption and activation onto the metal oxidizing centers on the catalyst surface, and a disadvantageous electronic interaction between the adsorbed NH3 and the metal sites [46]. As such, the acidity property on the nanocatalyst surface was closely associated with the redox behavior. In order to obtain the optimal catalyst, it was desirable to seek an appropriate equilibrium among the surface components, the oxidation states of metal species and the acidity property.
It was obvious that the NO-TPD patterns of Mn−Fe−Ce−Ox/γ-Al2O3 nanocatalysts as shown in Figure 7 are quite similar to the NH3-TPD patterns discussed above. With temperature rising from 120 to 750 °C, each of the three catalyst samples exhibited three desorption peaks of chemisorbed NO. The dominating desorption peak of Mn10Fe20−Ce/Al sample was at about 597 °C attributed to the strong Lewis acid sites. While the main desorption peaks of Mn15Fe15−Ce/Al and Mn20Fe10−Ce/Al samples were settled at around 420~430 °C, which were ascribed to the overlapped peaks of Lewis acid sites and Brönsted acid sites. With the Mn/Fe molar ratio increasing from 0.5 to 2.0, the NO desorption at low temperature apparently augmented from 0.32 mmol/g to 0.59 mmol/g, while NO desorption in the high-temperature region declined from 0.70 mmol/g to 0.39 mmol/g, which was supposed to be conducive to fast SCR at low temperature [17].

2.3. Fast SCR Activity of Mn−Fe−Ce−Ox/γ-Al2O3

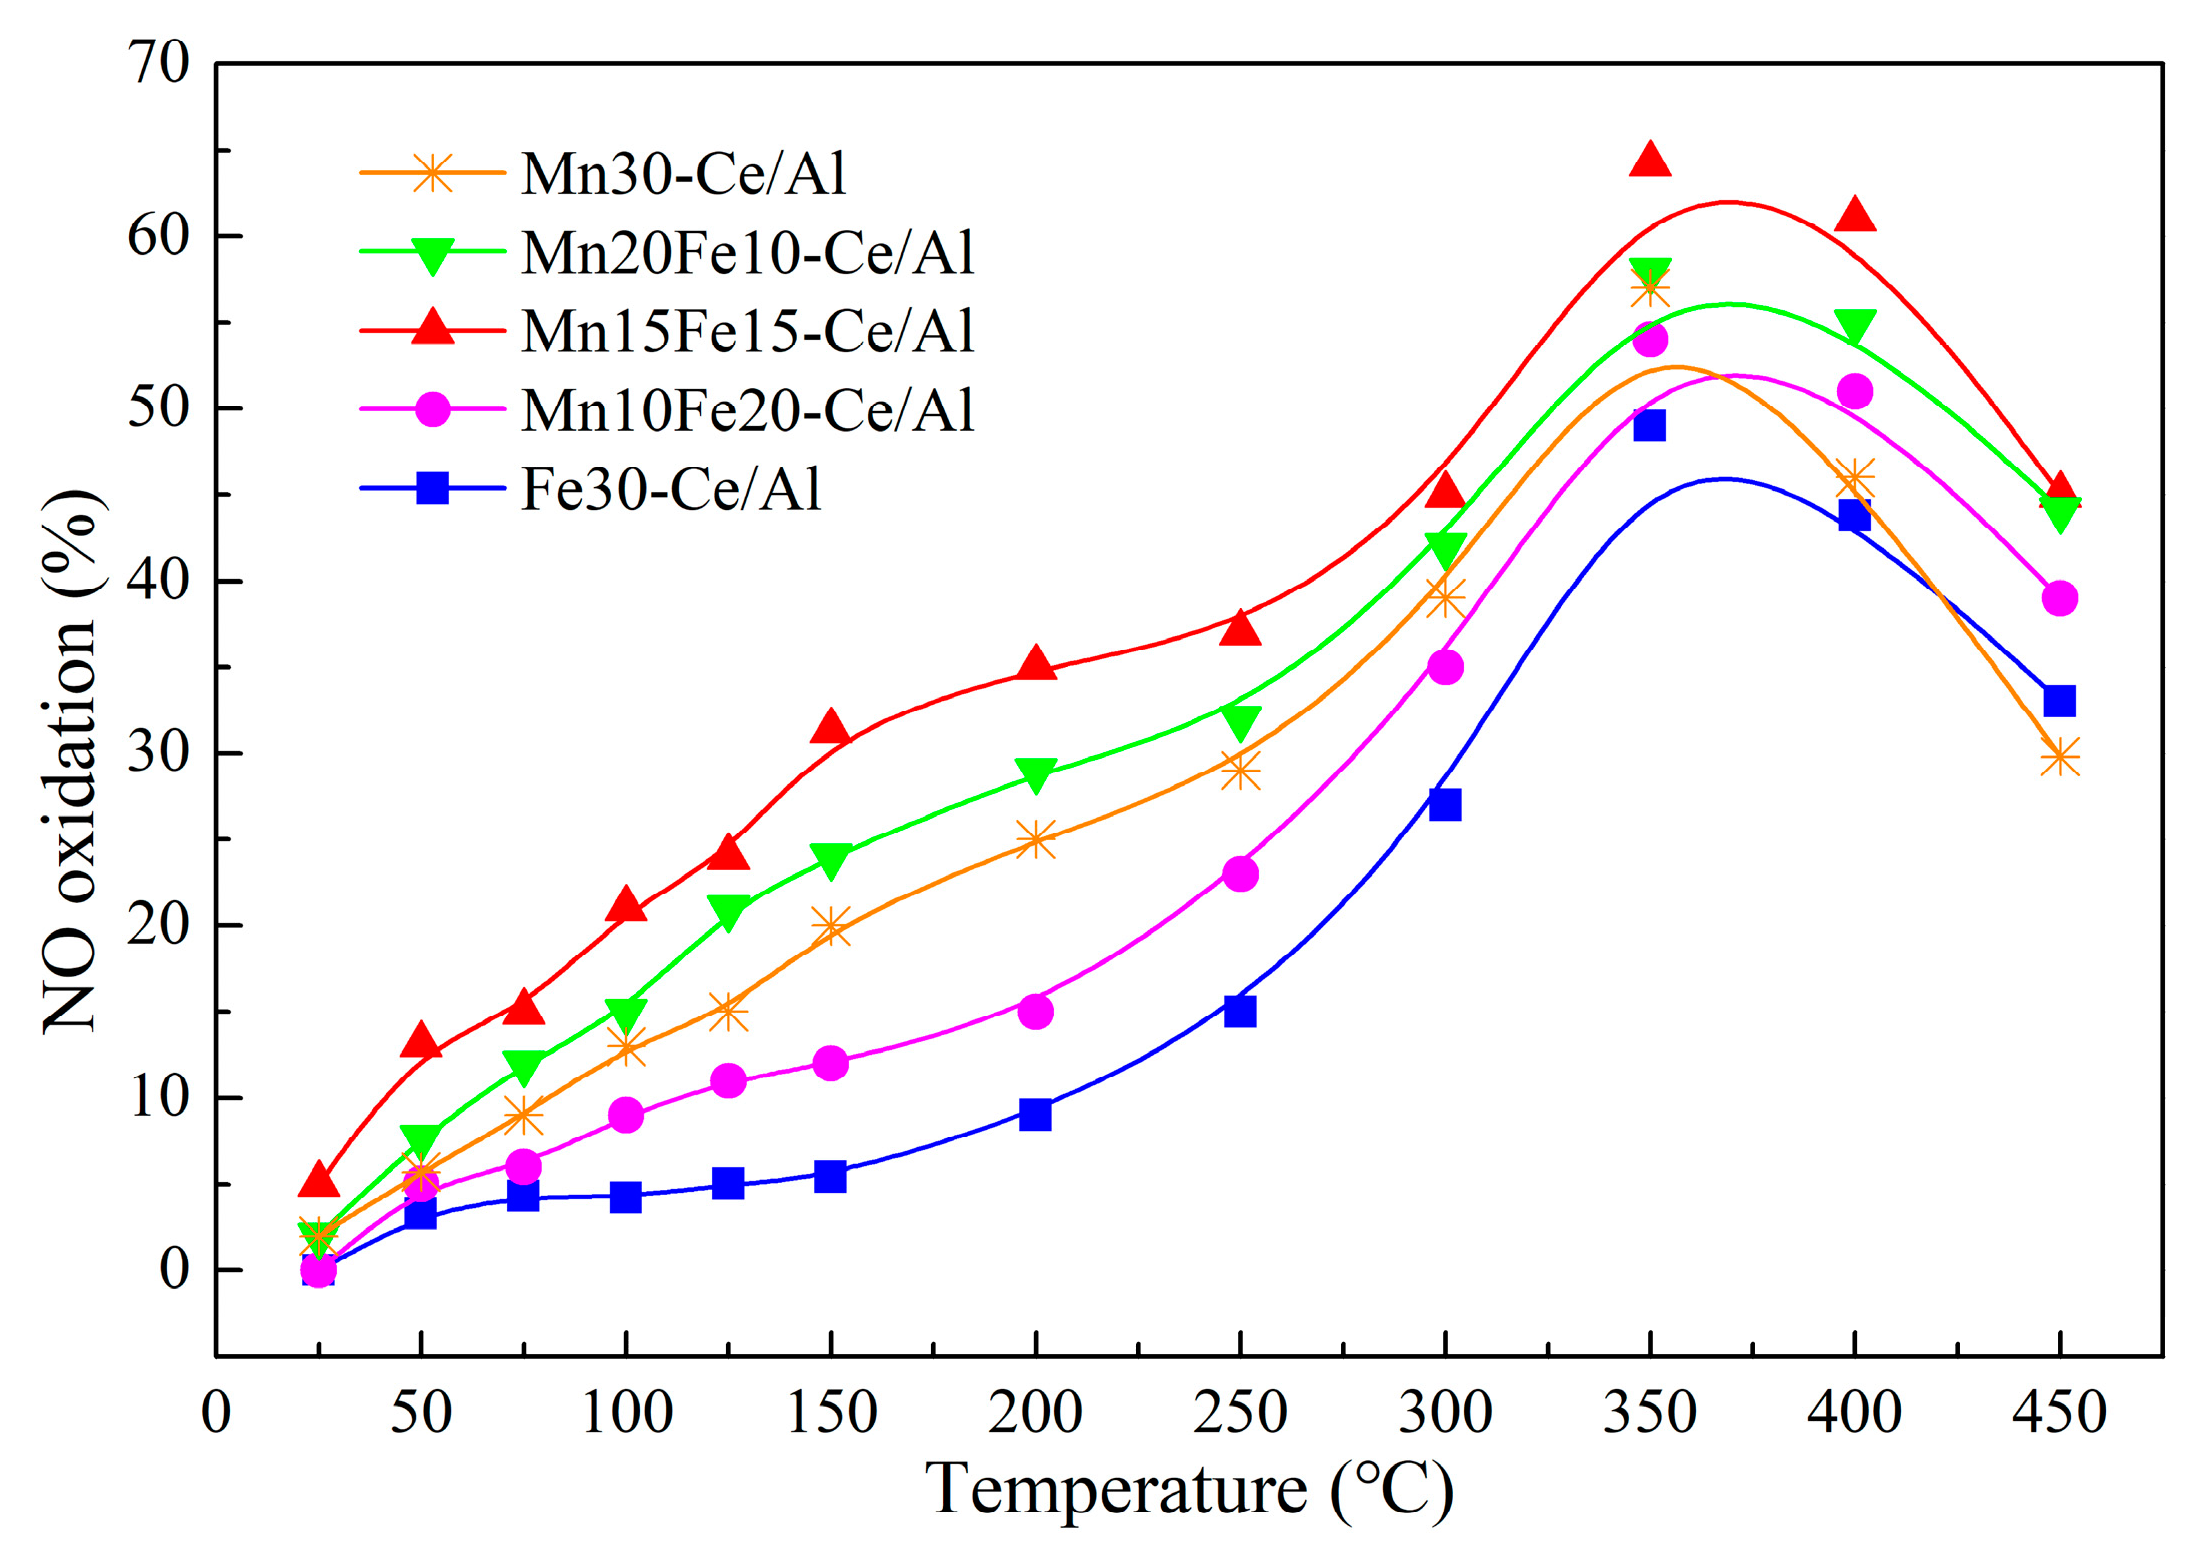
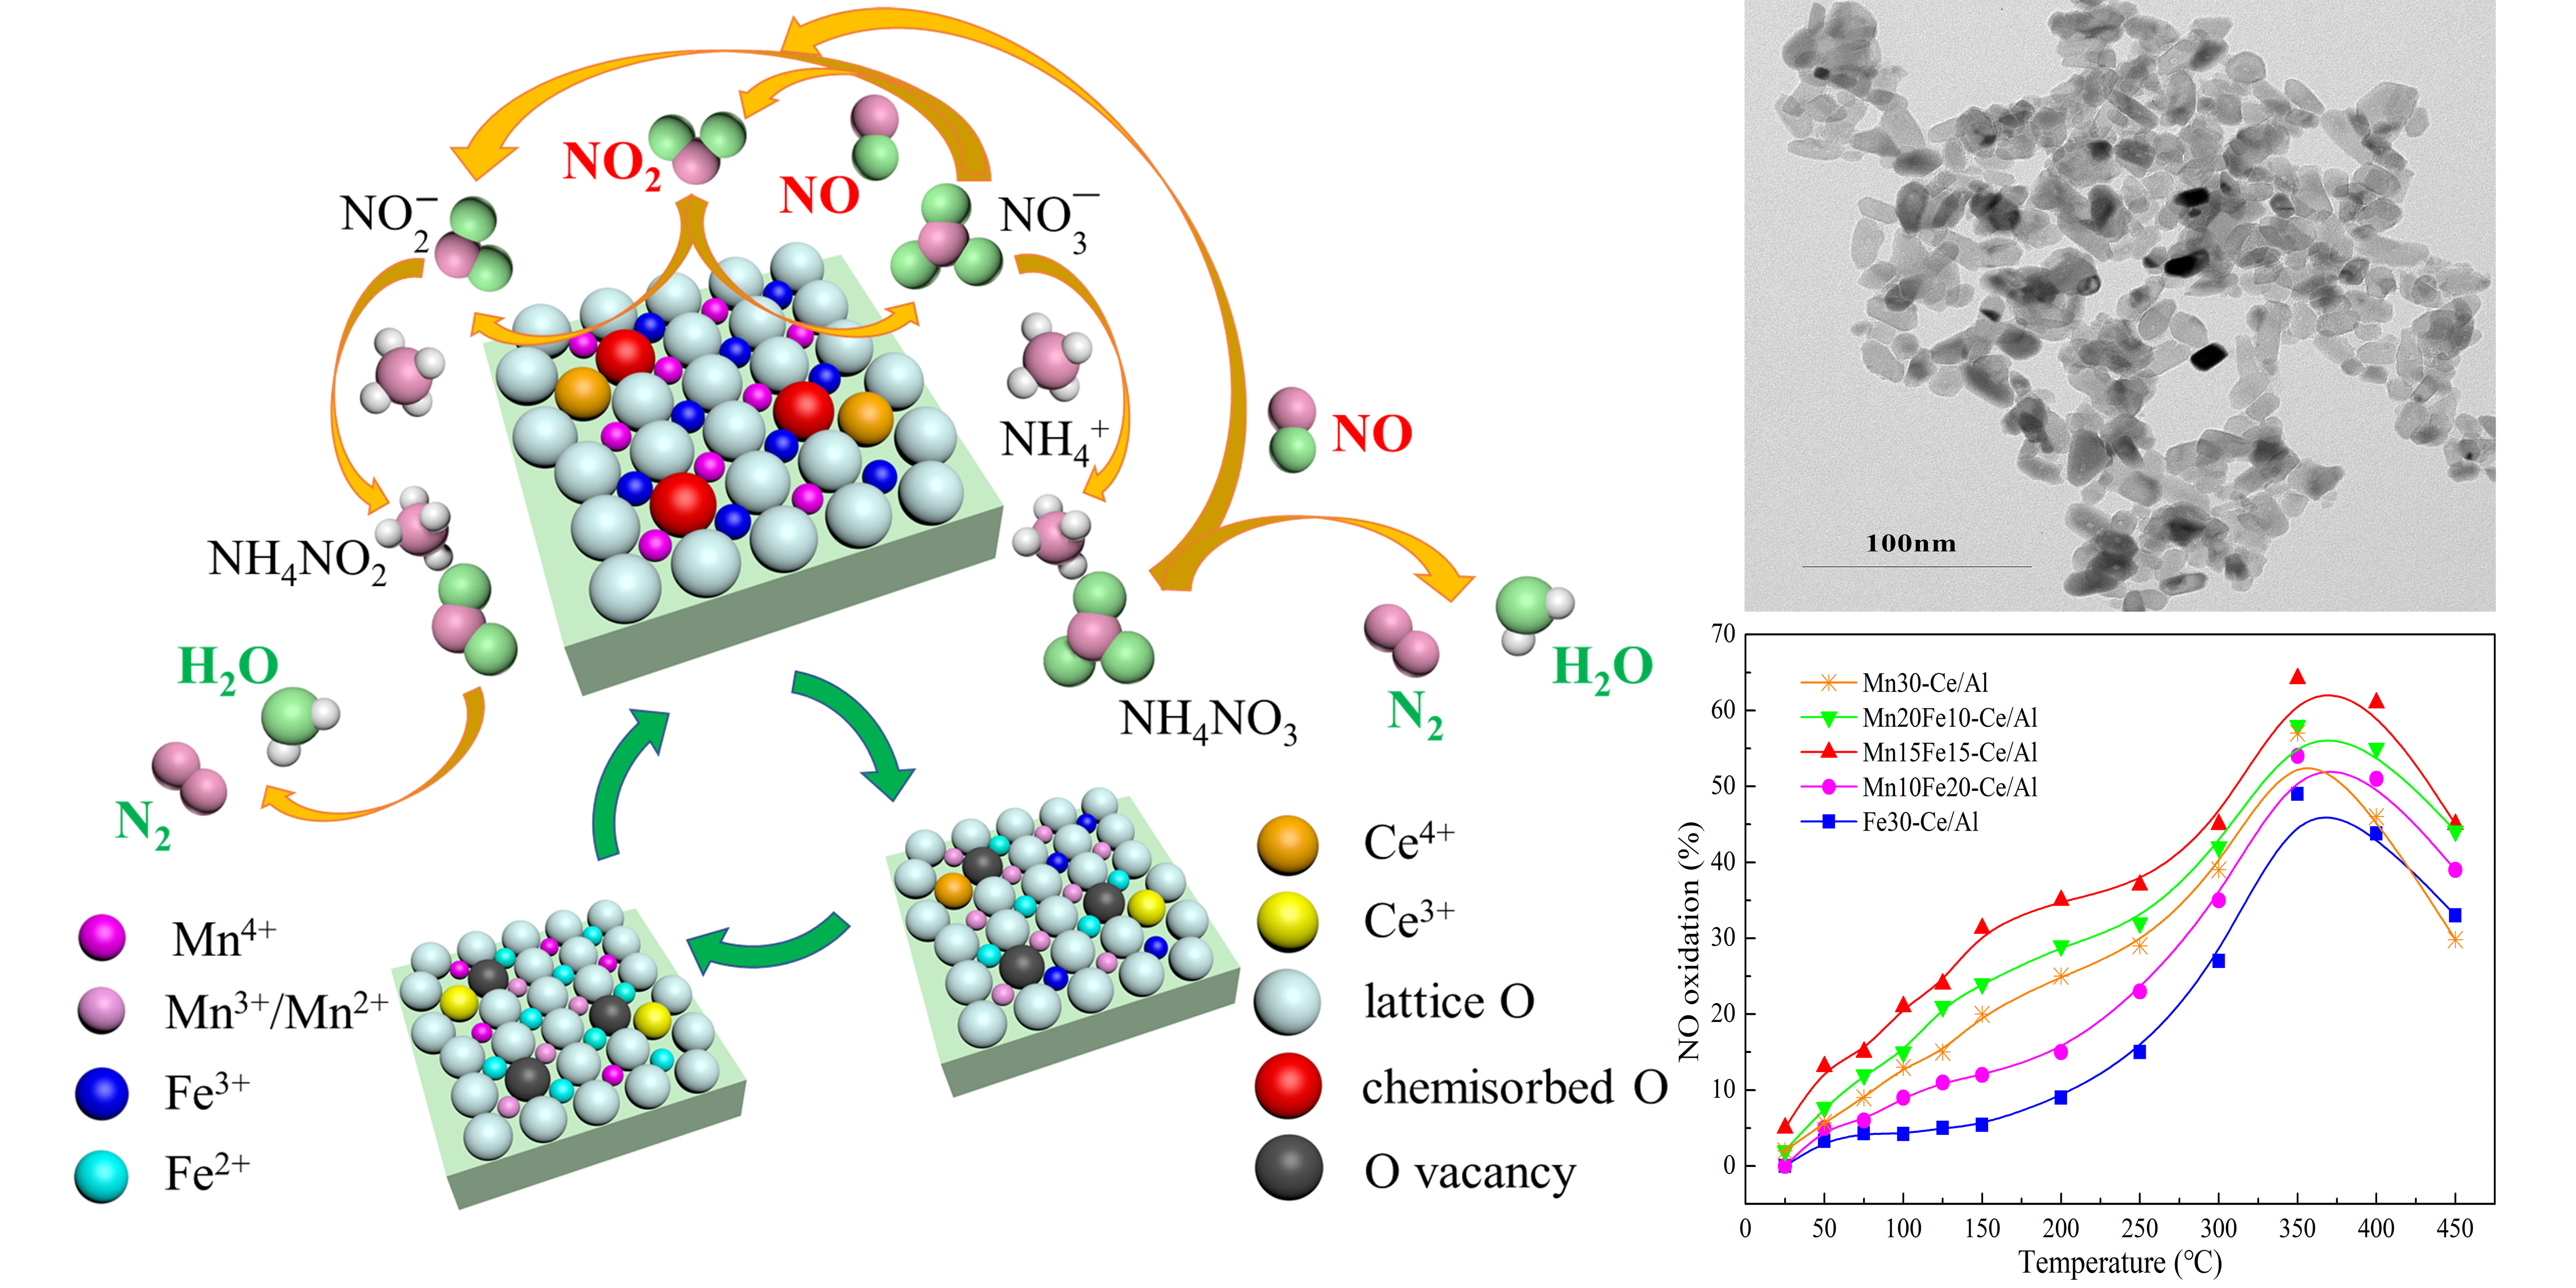
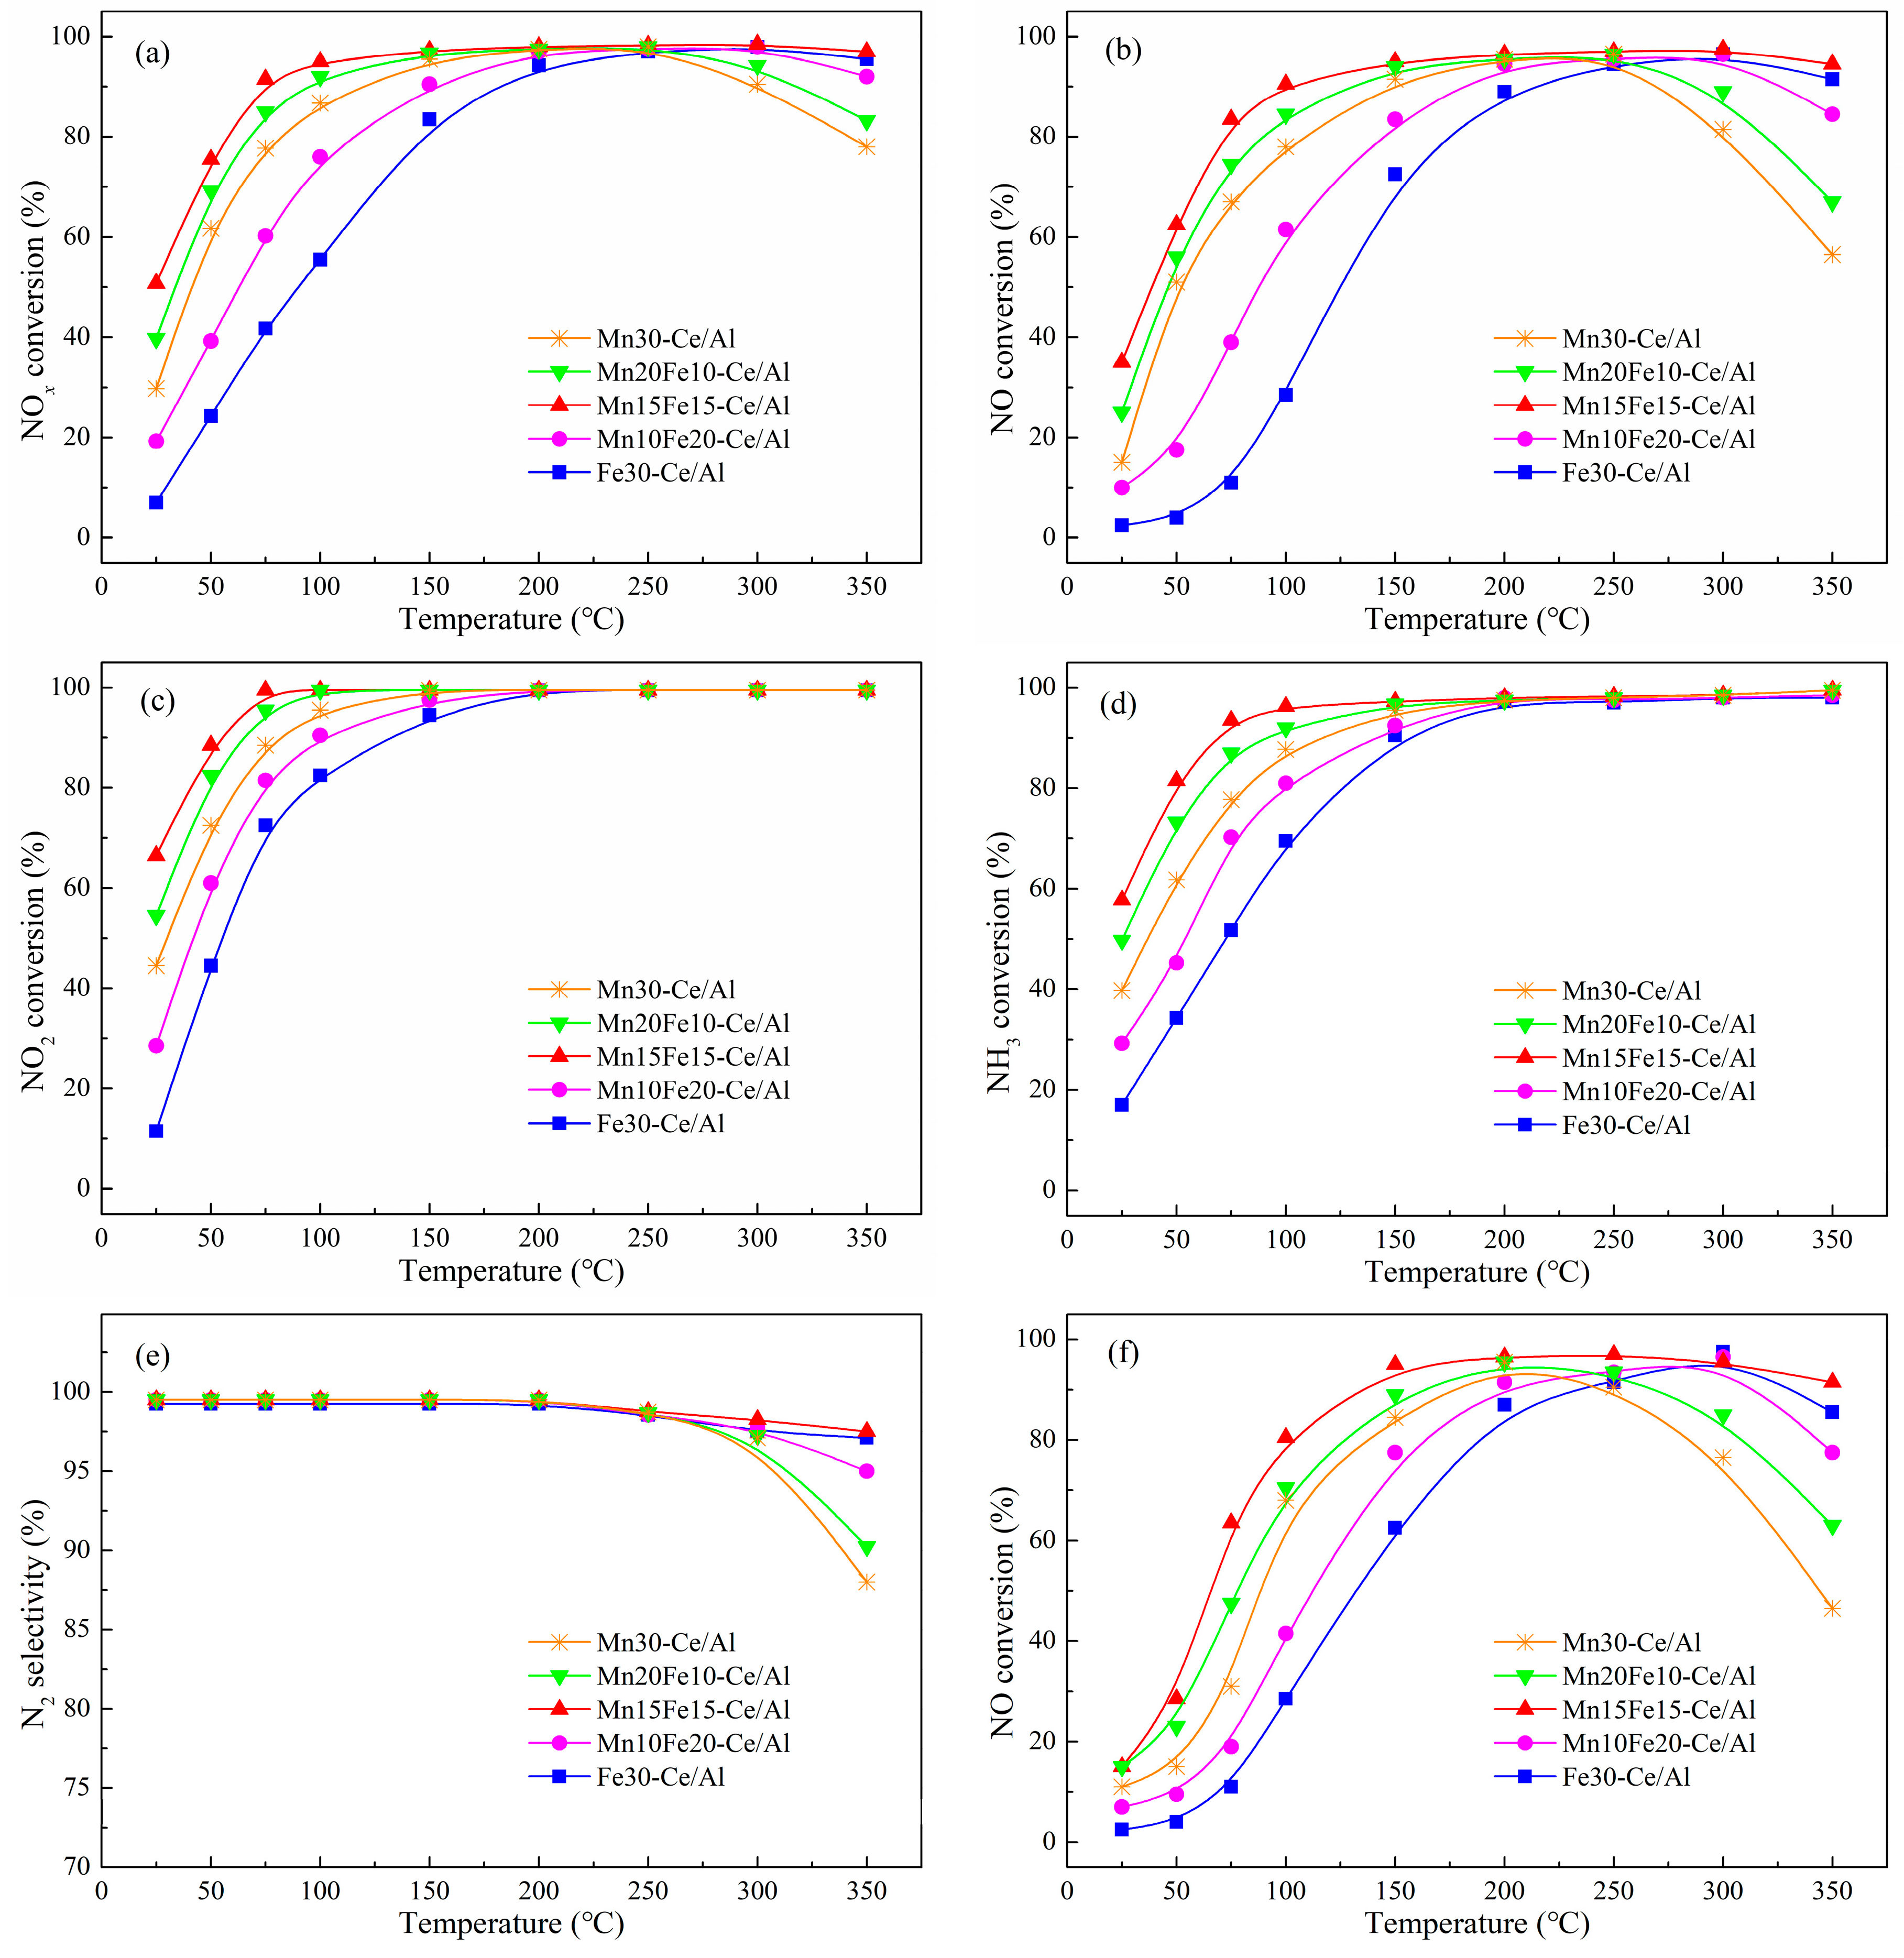
2.3.1. Effect of Mn/Fe Ratio on NO Oxidation of NO2

The reaction of NO oxidation into NO2 on Mn−Fe−Ce−Ox/γ-Al2O3 nanocatalysts with different Mn/Fe molar ratios are exhibited in Figure 8. Pure MnO2 or Fe2O3 doping on CeOx/γ-Al2O3 was also studied for comparison. It was easy to see that the NO oxidation of the five tested catalyst samples improved prominently with the temperature increasing from 25 °C to 350 °C. The NO oxidation of Fe30−Ce/Al sample was only less than 5% below 150 °C. The addition of Mn species into Fe−Ce−Ox/γ-Al2O3 increased the NO oxidation rate obviously and expanded the lower temperature window particularly. It was obvious that the Mn15Fe15−Ce/Al sample, which comprised the best Mn/Fe molar ratio, displayed the highest oxidation ability among the tested catalysts with the NO oxidation reaching approximately 31.3% at 150 °C and 64.2% at 350 °C, respectively. As the temperature rose above 350 °C, the NO oxidation rates began to decrease significantly for all tested samples. Moreover, the Mn20Fe10−Ce/Al and Mn30−Ce/Al samples showed lower NO oxidation rate than that of Mn15Fe15−Ce/Al sample in the researched temperature window. For the Mn20Fe10−Ce/Al sample, there was a noteworthy morphological transformation on the catalyst surface, as shown in Figure 1c, and the characteristic peaks of MnO2, Mn2O3 and Mn3O4 appeared obvious in the XRD curve as exhibited in Figure 2. Hence, it could be confirmed that the higher crystallization of MnOx was one of the main reasons for the deterioration of NO oxidation with Mn20Fe10−Ce/Al2O3 catalyst.

2.3.2. Effect of Mn/Fe Ratio on fast SCR Activity

The fast SCR activity of the prepared Mn−Fe−Ce−Ox/γ-Al2O3 nanocatalysts with diverse Mn/Fe molar ratios at different reaction temperatures were illustrated in Figure 9. It was found that the Mn/Fe molar ratio had remarkable effects on the catalytic performances of Mn−Fe−Ce−Ox/γ-Al2O3 nanocatalysts. Among all analyzed catalyst samples, the Mn15Fe15−Ce/Al sample exhibited the highest fast SCR activity in the whole tested temperature window, with NOx conversion above 90% at 75–350 °C. As illustrated in Figure 9a, the Fe30−Ce/Al sample showed the lowest catalytic activity in NOx conversion with the temperature rising from 25 °C to 200 °C. The addition of Mn into Fe−Ce/Al sample enhanced the fast SCR activity obviously. The appropriate amount of Mn doping enhanced the catalytic activity, while the excessive Mn doping caused a negative impact. When the Mn/Fe molar ratio grew to 0.5, the NOx conversion of Mn10Fe20−Ce/Al sample achieved approximately 90.3% at 150 °C. When the Mn/Fe molar ratio was larger than 1.0, the NOx conversion of Mn20Fe10−Ce/Al and Mn30−Ce/Al samples began to decline slightly. However, as the temperature changed within 250–350 °C, the variation tendency of NOx conversion with the Mn/Fe molar ratios increasing were entirely different. In the high temperature range, the Mn30−Ce/Al sample showed the lowest catalytic activity in NOx conversion, and the Mn20Fe10−Ce/Al sample had as high a catalytic activity as Mn15Fe15−Ce/Al. The reduction of NOx conversion was caused by the non-selective oxidation of NH3 at high temperatures, which was probably due to the redox property enhancement produced by manganese addition [47]. Moreover, the NO conversion performance of Mn−Fe−Ce−Ox/γ-Al2O3 nanocatalysts was similar to that of NOx conversion according to Figure 9b.
The NO2 conversion of Mn−Fe−Ce−Ox/γ-Al2O3 nanocatalysts could be divided into two phases as shown in Figure 9c. As the temperature below 200 °C, the NO2 conversion of all tested catalysts improved with the temperature increasing. In this temperature range, the NO2 conversion of Mn−Fe−Ce−Ox/γ-Al2O3 nanocatalysts raised initially and then reduced with the Mn/Fe molar ratio increasing. The highest NO2 conversion was obtained over the Mn15Fe15−Ce/Al sample with the Mn/Fe molar ratio of 1.0. As the temperature above 200 °C, the NO2 conversion of all tested catalysts stabilized at approximately 99%. Based on the Figure 9, the fast SCR activity of Mn−Fe−Ce−Ox/γ-Al2O3 nanocatalysts could be ranked Fe30−Ce/Al < Mn10Fe20−Ce/Al < Mn30−Ce/Al < Mn20Fe10−Ce/Al < Mn15Fe15−Ce/Al. Generally, the variation tendency of the specific surface area and the pore volume with the Mn/Fe molar ratio increasing coincided with that of fast SCR activity. Thereby, it could be believed that the fast SCR activity of Mn−Fe−Ce−Ox/γ-Al2O3 nanocatalysts was bound up with the specific surface area as reported in prior studies [30,47].
From Figure 9d, it is obvious that the variation tendency of NH3 conversion has a close resemblance to that of NO2 conversion over Mn−Fe−Ce−Ox/γ-Al2O3 nanocatalysts. In the range of 25–200 °C, the NH3 conversion was slightly higher than the NOx conversion for each Mn−Fe−Ce−Ox/γ-Al2O3 nanocatalyst at the same temperature. Meanwhile, the NH3 conversion reached above 99% for all tested catalysts within the temperature range of 200–350 °C. According to the results exhibited in Figure 9e, it can be basically confirmed that Mn−Fe−Ce−Ox/γ-Al2O3 nanocatalysts achieved satisfying N2 selectivities. In the test temperature region, the Mn30−Ce/Al sample presented excellent N2 selectivity that remained stable above 97.5%. The lowest N2 selectivity was 88.3% obtained at 350 °C over the Mn15Fe15−Ce/Al sample. In order to better understand the enhancing effect of fast SCR on NO conversion than that of standard SCR, a contrast test was carried out under NO without NO2 as shown in Figure 9f. Comparing the curves of Figure 9b,f, it could be confirmed that the participation of NO2 in deNOx reations boosted the NO conversion at relatively low temperature and broadened the active temperature window. Therefore, it was regarded as an effective method to improve NOx conversion at low temperature by oxidizing NO to NO2 and accelerating the fast SCR reaction.

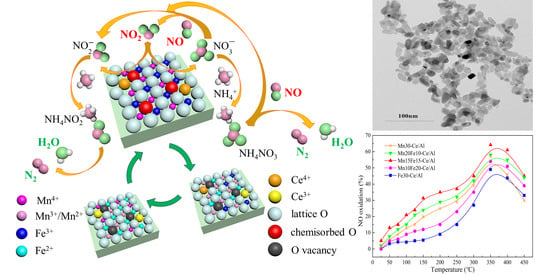
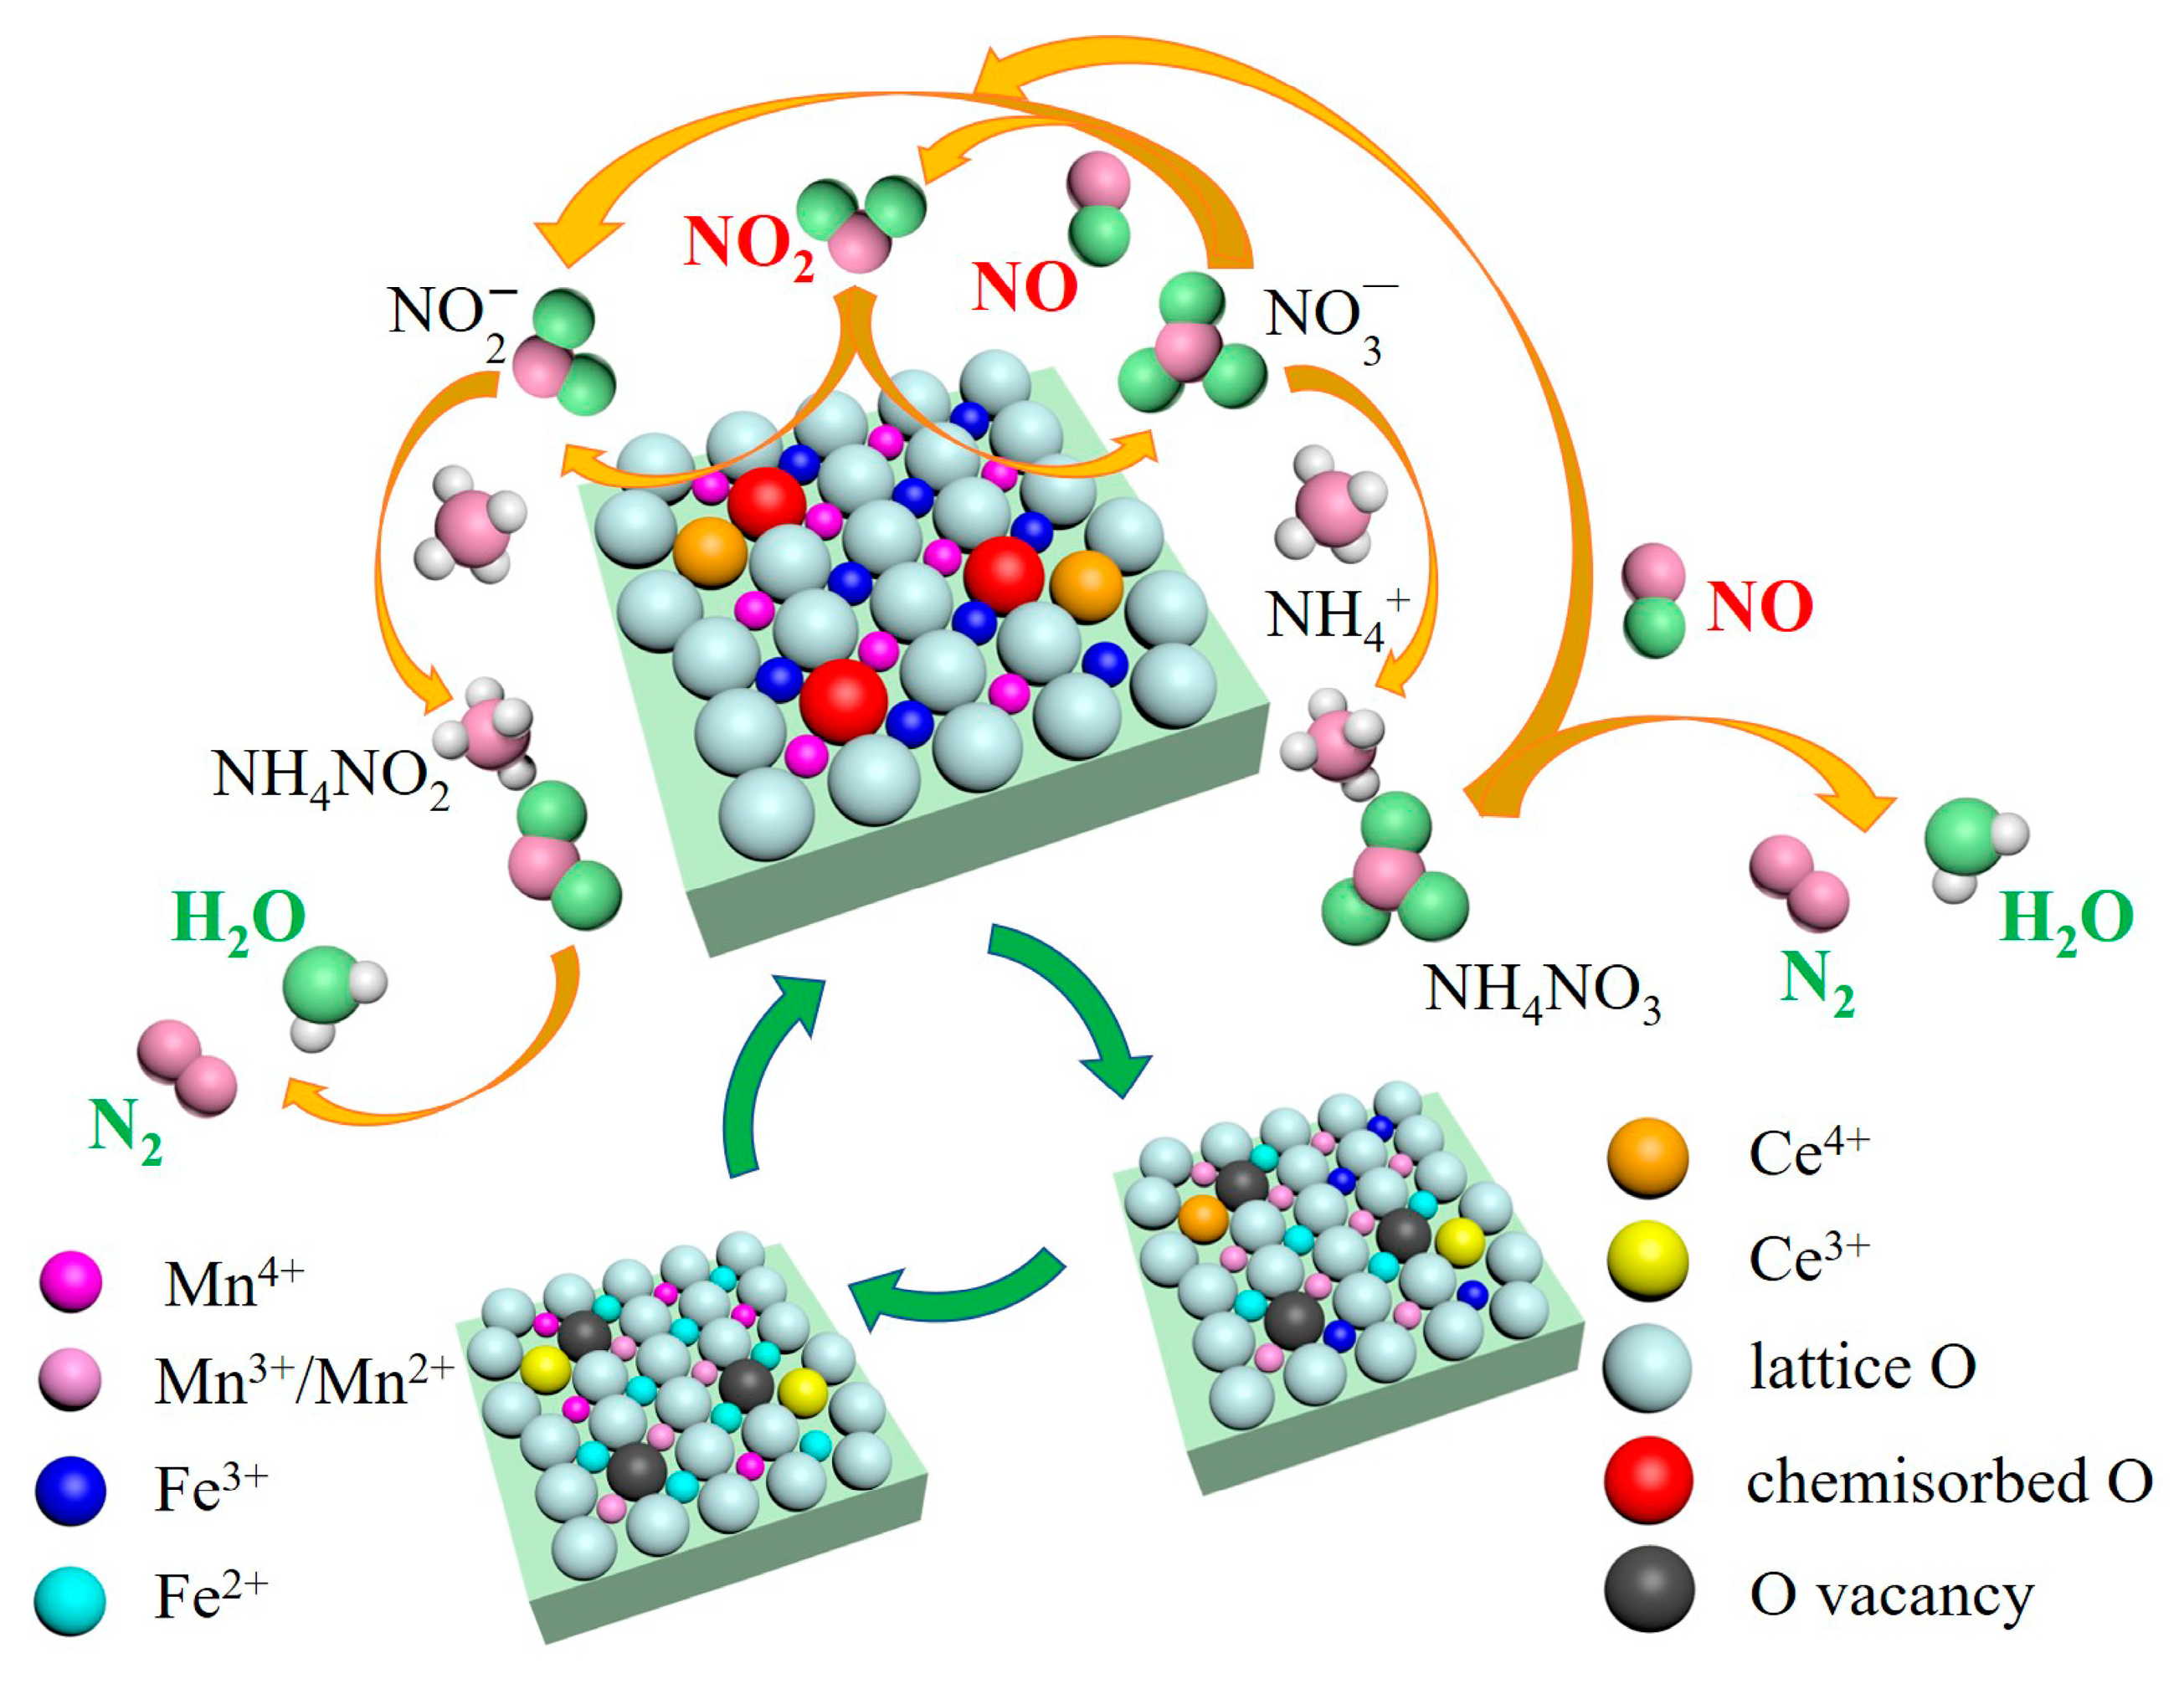
2.4. Reaction Mechanism Analysis

Based on the experiment data of physicochemical characteristics and catalytic performances of the tested catalyst samples exhibited above, the Mn/Fe molar ratio in Mn−Fe−Ce−Ox/γ-Al2O3 nanocatalysts influenced the oxidation and reduction characteristics of active chemisorbed sites notably, and changed the redox activities of active components significantly.
The synergistic effect among manganese, iron and cerium increased the percent of Mn4+/Mnn+, Fe3+/Fen+ and Ce3+/Cen+, formed more lattice oxygen and plenty of oxygen vacancy on the catalyst surface [16]. Among the three tested catalyst samples in this study, the Mn15Fe15−Ce/Al sample with the Mn/Fe molar ratio of 1.0 presented the highest probability of nitrate intermediate formation via the oxidization of NO into NO2, which was regarded as a pivotal catalytic step for accelerating the fast SCR reaction [47]. The fast SCR process mainly comprised four catalytic reactions [5]. Firstly, the disproportionation of NO2 formed NO 2 and NO 3 on the catalyst [48,49]. Secondly, the formed NO 2 reacted with NH 4 + composing the intermediate NH4NO2 on the catalyst surface, and then NH4NO2 decomposed rapidly into N2 and H2O. Thirdly, the formed NO 3 reacted with NH 4 + composing the intermediate NH4NO3 and further reacted with NO to produce NO2, N2 and H2O. At the same time, some formed NO 3 interacted with NO to produce NO 2 and NO2. Among these catalytic reactions, the NO transformation to NO2 was considered as the crucial step in the reaction mechanism of fast SCR through the nitrate process. It had been revealed that MnO2 was abundant in active oxygen and conducive to NO oxidation to NO2 [37]. Mn4+ had the highest catalytic activity for NO elimination in consideration of the promotion effect on the reaction of NO oxidation to NO2, which accelerated the fast SCR reaction remarkably [30]. Meanwhile, the MnO2 phase presented better a catalytic property than Mn2O3 due to its lattice structure defect [50]. Therefore, Mn4+ achieved the strongest redox ability comparing to the other valence states in MnOx-based catalysts [28]. The increase of the Mn4+/Mnn+ ratio in the Mn15Fe15−Ce/Al sample indicated the species transformation from Mn3+ and Mn2+ to Mn4+, and the chemical circumstance variation among the Mn10Fe20−Ce/Al, Mn15Fe15−Ce/Al and Mn20Fe10−Ce/Al samples. This variation was owing to the powerful interaction among manganese, iron and cerium with different Mn/Fe molar ratios, which had been fully proved by the results exhibited above. The increase of Mn4+ contained in the Mn15Fe15−Ce/Al sample was advantageous to NH3 adsorption and beneficial to NO catalytic oxidation. The Mn4+=O in the catalyst could react with NH 4 + and NO to form Mn3+−OH and release N2 and H2O. The formed Mn3+−OH could interact with NO 3 to turn back to Mn4+=O and generate NO2 and H2O. As a result, the highest Mn4+/Mnn+ ratio made a large contribution to intensify the fast SCR reaction [30]. Therefore, the Mn15Fe15−Ce/Al sample presented superior catalytic ability than the Mn10Fe20−Ce/Al and Mn20Fe10−Ce/Al samples.
Furthermore, it is proposed that the redox couples of Fe3+/Fe2+ and Ce4+/Ce3+ contained in Mn−Fe−Ce−Ox/γ-Al2O3 nanocatalysts strengthened the redox cycle of Mn4+/Mn2+ and improve the amount of active oxygen, which would further promote the catalytic reactions [9,35]. The percentage of Fe2+/Fen+ and Ce3+/Cen+ improved with the Mn/Fe molar ratio of 1.0, probably attributed to the strong electron transfer between Fe2+ ↔ Mn4+ [50], Ce3+ ↔ Mn3+ [35] and Ce3+ ↔ Mn4+ [37]. Hence, it is proposed that the appropriate Mn/Fe molar ratio could develop the intimate electronic interaction among manganese, iron and cerium. Comprehensive considering the XPS, H2-TPR, NH3-TPD and NO-TPD analysis in this study, the Mn−Fe−Ce−Ox/γ-Al2O3 nanocatalyst with the Mn/Fe molar ratio of 1.0 achieved the optimal physicochemical property in accordance with the catalytic performance. The possible redox catalytic pathway of fast SCR reaction over Mn−Fe−Ce−Ox/γ-Al2O3 nanocatalysts is exhibited in Figure 10.

3. Materials and Methods

3.1. Catalysts’ Preparation

The Mn−Fe−Ce/Al nanocatalyst samples were prepared by the co-precipitation method. Mn(NO3)2 (analytical pure 50%, Sinopharm, Shanghai, China), Fe(NO3)3·9H2O (analytical pure 99.9%, Sinopharm, Shanghai, China), and Ce(NO3)3·6H2O (analytical pure 99.9%, Nanjing-reagent, Nanjing China) were introduced as the precursors of MnOx, FeOx and CeOx, respectively. The nano γ-Al2O3 (ultra pure 99.99%, Aladdin, Seattle, Washington, USA) was used as the carrier for the active species. The precursors were all dissolved into deionized water followed by the addition of ammonia solution till pH rose to 8. Then, the nano γ-Al2O3 powder was put into the aqueous solution with continuous agitation to form a homogeneous gel. Subsequently, the gel was dried in N2 at 150 °C for 24 h and calcinated at 450 °C for 4 h. Lastly, the generated Mn−Fe−Ce−Ox/γ-Al2O3 nanocatalysts were triturated and filtered with 40–60 mesh, at which sizes the diffusion effect on the catalytic performance was less than 0.5%. Hence, it could be regarded as no diffusional control with the catalytic activity calculations in this study. Meanwhile, the same size catalyst particles were used as the object for the characterization tests. In this contribution, a series of Mn−Fe−Ce−Ox/γ-Al2O3 samples with different Mn/Fe ratios were prepared and all samples were made up of (Mn+Fe) 30 wt% and Ce 5 wt%. The molar ratios of Mn:Fe were calculated on the basis of the mass ratios as displayed in Table 5.

3.2. Catalysts’ Characterization

The Maxon Tristar II 3020 micropore-size analyzer (Micromeritics, Norcross, GA, USA) was introduced to test the N2 adsorption isotherms of the nanocatalysts at −196 °C. The nanocatalysts were vacuum degassed at 350 °C for 10 h and then the surface areas and the pore-size distributions were measured. The specific surface areas were determined according to the BET plot linear portion. The pore-size distributions were calculated according to the desorption branch with the Barrett–Joyner–Halenda (BJH) formula. The XRD profiles were achieved by a Bruker D8 advance analyzer (Bruker, Billerica, MA, USA) with Mo Kα radiation. The diffraction intensity was tested from 10° to 90° with point counting time of 1s and step of 0.02°. International Center for Diffraction Data (ICDD) was used to distinguish the element phases in XRD patterns by comparing characteristic peaks. The surface image data on the nanocatalysts was captured by a FEI Quanta 400 FEG scanning electron microscope (FEI, Hillsboro, OR, USA), and the advanced microstructural and compositional information of the nanocatalysts was obtained by a high-resolution transmission electron microscope JEOL JEM-2010 (JEOL, Tokyo, Japan). The Micromeritics Autochem II 2920 chemical adsorption instrument (Micromeritics, Norcross, GA, USA) was employed to complete the H2-TPR, NH3-TPD and NO-TPD tests. In the H2-TPR experiment, 50 mg nanocatalyst was pretreatment in He at 400 °C for 1 h, then was cooled to ambient temperature in the gas mixture of H2 and He at 30 mL/min. The H2 consumptions were tested within 50–850 °C at the heating rate of 10 °C/min. The experimental procedure of the NH3-TPD and NO-TPD tests were quite similar to H2-TPR test, with NH3 and NO replacing H2. XPS were analyzed via a Thermo ESCALAB 250XI under the pass energy of 46.95 eV, Al Kα radiation at 1486.6 eV, X-ray source at 150 W and binding energy precision within ± 0.3 eV. C 1s line at 284.6 eV was introduced as a reference.

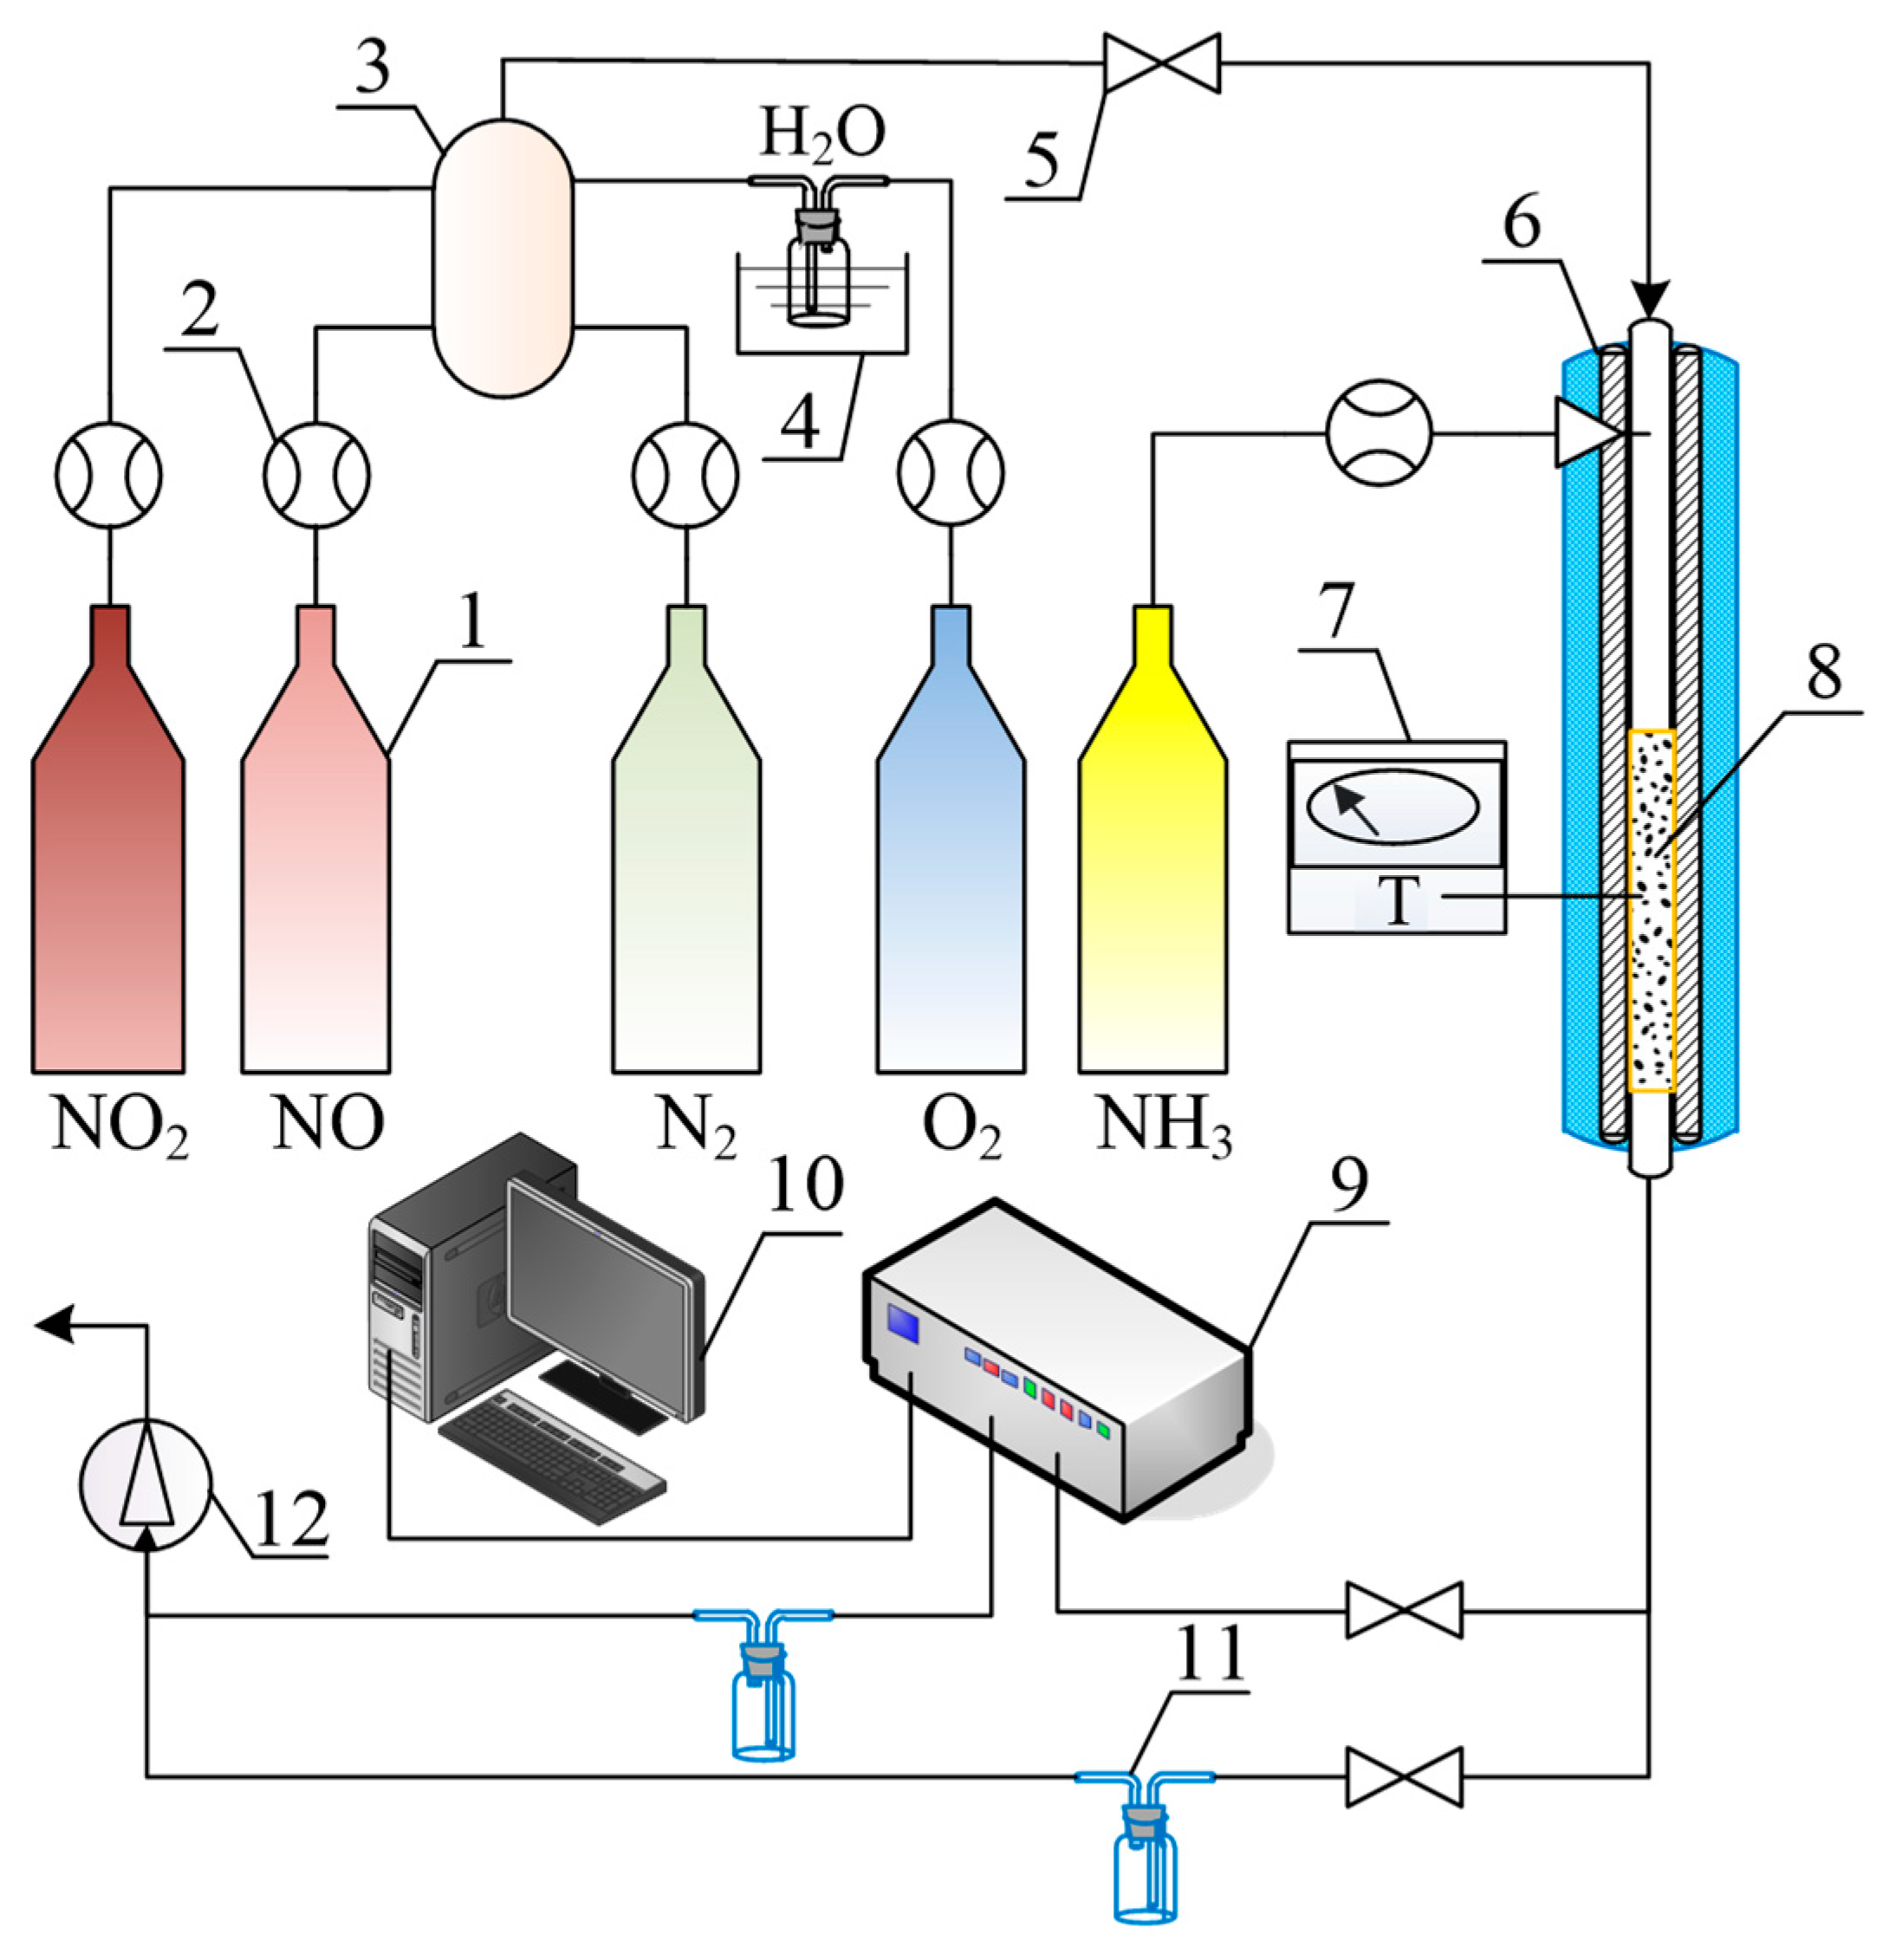
3.3. Catalytic Performance Tests

The catalytic performance of Mn−Fe−Ce−Ox/γ-Al2O3 nanocatalysts for NO oxidation to NO2 and fast SCR were explored in a fixed-bed reactor comprised of a tube furnace and a temperature control unit. All gas used in this experiment was controlled by mass flowmeters. The concentrations of NO and NO2 were incessantly documented by a German MRU MGA-5 analyzer joint with an external special detector for N2O and NH3, as shown in Figure 11. During the experiment of NO oxidation into NO2, the inlet gas contained 400 ppm NO, 5% O2, ~0.3% H2O and N2 as balance gas. While in the test of fast SCR catalytic activity, the inlet mixed gas included 200 ppm NO, 200 ppm NO2, 400 ppm NH3, 5% O2, ~0.3% H2O and N2 as balance gas. In the contrast experiment, 400 ppm NO was used instead of 200 ppm NO and 200 ppm NO2. The whole flow rate was approximately 900 mL·min−1, and the mass of the nanocatalyst for each run was 8.0 g. The gas hourly space velocity (GHSV) was about 25,000 h−1. The NO oxidation rate and the NOx conversion rate were calculated by the concentrations of NOx, NO and NO2 according to Equations (5) and (6), where [NOx] = [NO] + [NO2]. The NH3 conversion rate was calculated by the inlet and outlet NH3 concentrations, and the N2 selectivity was calculated by the concentrations of N2O and NOx, as show in Equations (7) and (8) [51,52,53]. Each experiment was repeated three times to assure the results’ accuracy.
NO   oxidation   rate = [ NO ] in [ NO ] out [ NO ] in × 100 %
NO x   conversion   rate = [ NO x ] in [ NO x ] out [ NO x ] in × 100 %
NH 3   conversion   rate = [ NH 3 ] in [ NH 3 ] out [ NH 3 ] in × 100 %
N 2   selectivity = 1 2 [ N 2 O ] out [ NO x ] in [ NO x ] out × 100 %

4. Conclusions

Mn−Fe−Ce−Ox/γ-Al2O3 nanocatalysts with different Mn/Fe ratios were synthesized to research the catalytic oxidation of NO into NO2 and the catalytic performance in the fast SCR reaction, in order to explore the strong interactions among manganese, iron and cerium. According to the physicochemical properties of the Mn10Fe20−Ce/Al, Mn15Fe15−Ce/Al and Mn20Fe10−Ce/Al nanocatalysts, it could be concluded that the Mn15Fe15−Ce/Al sample with Mn/Fe molar ratio of 1.0 achieved the optimal coexistence of manganese, iron and cerium, enhanced the active species distribution, and restrained the metal oxide crystallinity. In the meantime, it was found that the ratios of Mn4+/Mnn+, Fe2+/Fen+ and Ce3+/Cen+ presented the maximum in Mn15Fe15−Ce/Al sample, which were beneficial to enrich oxygen vacancy and chemisorbed oxygen on the catalyst, and were conducive to facilitate the fast SCR process by promoting the possibility of NO catalytic oxidation into NO2. The performance of NO oxidation and fast SCR catalytic activity over Mn−Fe−Ce−Ox/γ-Al2O3 nanocatalysts were in accordance with the structural results. Among all the tested samples, the Mn15Fe15−Ce/Al sample presented the highest catalytic ability in the oxidation of NO into NO2 (64.2%, 350 °C) and the optimal NOx conversion of fast SCR (>90%, 75~350 °C). Overall, it was believed that the optimization of the Mn/Fe ratio in Mn−Fe−Ce−Ox/γ-Al2O3 nanocatalysts was an extremely effective method to improve the structure–activity relationships for NO pre-oxidation and the fast SCR reaction.

Author Contributions

Conceptualization, Y.G.; Funding acquisition, Y.G., T.L., W.Z.; Methodology, Y.G., T.L.; Project administration, Y.G.; Writing—original draft, Y.G.; Writing—review and editing, M.Z. and W.Z.; Data curation, Y.G., W.F.

Funding

This research was funded by “National Natural Science Foundation of China, grant number 51708336”, “Shandong Provincial Natural Science Foundation, grant number ZR2016EEB28”, “Shandong Provincial Science and Technology Development Plan, grant number 2011GSF11716”, “Shandong Jianzhu University Doctoral Research Fund, grant number X18069Z”, “Shandong Jianzhu University Open Experimental Project, grant number 2018yzkf023, 2018wzkf013”, and “Shandong Electric Power Engineering Consulting Institute Science and Technology Project, grant number 37-K2014-33”.

Acknowledgments

This work was supported by National Natural Science Foundation of China (Project No.51708336), Shandong Provincial Natural Science Foundation (ZR2016EEB28), Shandong Provincial Science and Technology Development Plan (2011GSF11716), Shandong Jianzhu University open experimental project (2018yzkf023, 2018wzkf013), and the Shandong electric power engineering consulting institute science and technology project (37-K2014-33).

Conflicts of Interest

The authors declare no conflict of interest.

References

  1. Zhou, H.; Ge, M.Y.; Wu, S.G.; Ye, B.C.; Su, Y.X. Iron based monolithic catalysts supported on Al2O3, SiO2, and TiO2: A comparison for NO reduction with propane. Fuel 2018, 220, 330–338. [Google Scholar] [CrossRef]
  2. Roy, S.; Hegde, M.S.; Madras, G. Catalysis for NOx abatement. Appl. Energy 2009, 86, 2283–2297. [Google Scholar] [CrossRef]
  3. Zhou, X.; Huang, X.; Xie, A.; Luo, S.; Yao, C.; Li, X.; Zuo, S. V2O5-decorated Mn-Fe/attapulgite catalyst with high SO2 tolerance for SCR of NOx with NH3 at low temperature. Chem. Eng. J. 2017, 326, 1074–1085. [Google Scholar] [CrossRef]
  4. Bendrich, M.; Scheuer, A.; Hayes, R.E.; Votsmeier, M. Unified mechanistic model for Standard SCR, Fast SCR, and NO2 SCR over a copper chabazite catalyst. Appl. Catal. B Environ. 2018, 222, 76–87. [Google Scholar] [CrossRef]
  5. Ruggeri, M.P.; Grossale, A.; Nova, I.; Tronconi, E.; Jirglova, H.; Sobalik, Z. FTIR in situ mechanistic study of the NH3NO/NO2 “Fast SCR” reaction over a commercial Fe-ZSM-5 catalyst. Catal. Today 2012, 184, 107–114. [Google Scholar] [CrossRef]
  6. Koebel, M.; Elsener, M. Selective catalytic reduction of NO over commercial DeNOx-catalysts: Experimental determination of kinetic and thermodynamic parameters. Chem. Eng. Sci. 1998, 53, 657–669. [Google Scholar] [CrossRef]
  7. Gao, Y.; Luan, T.; Lu, T.; Cheng, K.; Xu, H. Performance of V2O5-WO3-MoO 3/TiO2 catalyst for selective catalytic reduction of NOx by NH3. Chin. J. Chem. Eng. 2013, 21, 1–7. [Google Scholar] [CrossRef]
  8. Li, G.; Wang, B.; Wang, H.; Ma, J.; Xu, W.Q.; Li, Y.; Han, Y.; Sun, Q. Fe and/or Mn oxides supported on fly ash-derived SBA-15 for low-temperature NH3-SCR. Catal. Commun. 2018, 108, 82–87. [Google Scholar] [CrossRef]
  9. Zhang, C.; Chen, T.; Liu, H.; Chen, D.; Xu, B.; Qing, C. Low temperature SCR reaction over Nano-Structured Fe-Mn Oxides: Characterization, performance, and kinetic study. Appl. Surf. Sci. 2018, 457, 1116–1125. [Google Scholar] [CrossRef]
  10. Huang, T.-J.; Zhang, Y.-P.; Zhuang, K.; Lu, B.; Zhu, Y.-W.; Shen, K. Preparation of honeycombed holmium-modified Fe-Mn/TiO2 catalyst and its performance in the low temperature selective catalytic reduction of NOx. J. Fuel Chem. Technol. 2018, 46, 319–327. [Google Scholar] [CrossRef]
  11. Ke, Z.; Feng, Y.; Mingyuan, Z.; Jianming, D.; Xugen, W.; Jinli, Z.; Bin, D. Enhanced Low Temperature NO Reduction Performance via MnOx-Fe2O3/Vermiculite Monolithic Honeycomb Catalysts. Catalysts 2018, 8, 100. [Google Scholar] [CrossRef]
  12. Wang, X.; Wu, S.; Zou, W.; Yu, S.; Gui, K.; Dong, L. Fe-Mn/Al2O3 catalysts for low temperature selective catalytic reduction of NO with NH3. Chin. J. Catal. 2016, 37, 1314–1323. [Google Scholar] [CrossRef]
  13. Zhang, M.; Li, C.; Qu, L.; Fu, M.; Zeng, G.; Fan, C.; Ma, J.; Zhan, F. Catalytic oxidation of NO with O2 over FeMnOx/TiO2: Effect of iron and manganese oxides loading sequences and the catalytic mechanism study. Appl. Surf. Sci. 2014, 300, 58–65. [Google Scholar] [CrossRef]
  14. Fang, N.; Guo, J.; Shu, S.; Luo, H.; Chu, Y.; Li, J. Enhancement of low-temperature activity and sulfur resistance of Fe0.3Mn0.5Zr0.2 catalyst for NO removal by NH3-SCR. Chem. Eng. J. 2017, 325, 114–123. [Google Scholar] [CrossRef]
  15. Boningari, T.; Pappas, D.K.; Ettireddy, P.R.; Kotrba, A.; Smirniotis, P.G. Influence of SiO2 on M/TiO2 (M = Cu, Mn, and Ce) Formulations for Low-Temperature Selective Catalytic Reduction of NOx with NH3: Surface Properties and Key Components in Relation to the Activity of NOx Reduction. Ind. Eng. Chem. Res. 2015, 54, 2261–2273. [Google Scholar] [CrossRef]
  16. France, L.J.; Yang, Q.; Li, W.; Chen, Z.; Guang, J.; Guo, D.; Wang, L.; Li, X. Ceria modified FeMnOx—Enhanced performance and sulphur resistance for low-temperature SCR of NOx. Appl. Catal. B Environ. 2017, 206, 203–215. [Google Scholar] [CrossRef]
  17. Cao, L.; Chen, L.; Wu, X.; Ran, R.; Xu, T.; Chen, Z.; Weng, D. TRA and DRIFTS studies of the fast SCR reaction over CeO2/TiO2 catalyst at low temperatures. Appl. Catal. A Gen. 2018, 557, 46–54. [Google Scholar] [CrossRef]
  18. Panahi, P.N.; Delahay, G.; Mousavi, S.M. Activity of gamma-Al2O3-based Mn, Cu, and Co oxide nanocatalysts for selective catalytic reduction of nitric oxide with ammonia. Turk. J. Chem. 2017, 41, 272–281. [Google Scholar] [CrossRef]
  19. Zhao, W.; Tang, Y.; Wan, Y.; Li, L.; Yao, S.; Li, X.; Gu, J.; Li, Y.; Shi, J. Promotion effects of SiO2 or/and Al2O3 doped CeO2/TiO2 catalysts for selective catalytic reduction of NO by NH3. J. Hazard. Mater. 2014, 278, 350–359. [Google Scholar] [CrossRef]
  20. Xu, H.; Liu, S.; Wang, Y.; Lin, Q.; Lin, C.; Lan, L.; Wang, Q.; Chen, Y. Promotional effect of Al2O3 on WO3/CeO2-ZrO2 monolithic catalyst for selective catalytic reduction of nitrogen oxides with ammonia after hydrothermal aging treatment. Appl. Surf. Sci. 2018, 427, 656–669. [Google Scholar] [CrossRef]
  21. Gao, Y.; Luan, T.; Zhang, W.; Li, H. The promotional effects of cerium on the catalytic properties of Al2O3-supported MnFeOx for NO oxidation and fast SCR reaction. Res. Chem. Intermed. 2018, in press. [Google Scholar] [CrossRef]
  22. Wang, C.; Yu, F.; Zhu, M.; Wang, X.; Dan, J.; Zhang, J.; Cao, P.; Dai, B. Microspherical MnO2-CeO2-Al2O3 mixed oxide for monolithic honeycomb catalyst and application in selective catalytic reduction of NOx with NH3 at 50–150 °C. Chem. Eng. J. 2018, 346, 182–192. [Google Scholar] [CrossRef]
  23. Qin, C.; Dang, X.; Huang, J.; Teng, J.; Huang, X. Plasma-catalytic oxidation of adsorbed toluene on Ag–Mn/γ-Al2O3: Comparison of gas flow-through and gas circulation treatment. Chem. Eng. J. 2016, 299, 85–92. [Google Scholar] [CrossRef]
  24. Fu, H.; Sun, S.; Yang, X.; Li, W.; An, X.; Zhang, H.; Dong, Y.; Jiang, X.; Yu, A. A facile coating method to construct uniform porous α-Fe2O3@TiO2 core-shell nanostructures with enhanced solar light photocatalytic activity. Powder Technol. 2018, 328, 389–396. [Google Scholar] [CrossRef]
  25. Kapteijn, F.; Singoredjo, L.; Andreini, A.; Moulijn, J.A. Activity and selectivity of pure manganese oxides in the selective catalytic reduction of nitric oxide with ammonia. Appl. Catal. B Environ. 1994, 3, 173–189. [Google Scholar] [CrossRef]
  26. Pérez Vélez, R.; Ellmers, I.; Huang, H.; Bentrup, U.; Schünemann, V.; Grünert, W.; Brückner, A. Identifying active sites for fast NH3-SCR of NO/NO2 mixtures over Fe-ZSM-5 by operando EPR and UV–vis spectroscopy. J. Catal. 2014, 316, 103–111. [Google Scholar] [CrossRef]
  27. Schwidder, M.; Heikens, S.; De Toni, A.; Geisler, S.; Berndt, M.; Brückner, A.; Grünert, W. The role of NO2 in the selective catalytic reduction of nitrogen oxides over Fe-ZSM-5 catalysts: Active sites for the conversion of NO and of NO/NO2 mixtures. J. Catal. 2008, 259, 96–103. [Google Scholar] [CrossRef]
  28. Wang, C.; Yu, F.; Zhu, M.; Tang, C.; Dong, L.; Dai, B. Synthesis of Both Powdered and Preformed MnOx-CeO2-Al2O3 Catalysts by Self-Propagating High-Temperature Synthesis for the Selective Catalytic Reduction of NOx with NH3. ACS Omega 2018, 3, 5692–5703. [Google Scholar] [CrossRef]
  29. Gao, G.; Shi, J.-W.; Liu, C.; Gao, C.; Fan, Z.; Niu, C. Mn/CeO2 catalysts for SCR of NOx with NH3: Comparative study on the effect of supports on low-temperature catalytic activity. Appl. Surf. Sci. 2017, 411, 338–346. [Google Scholar] [CrossRef]
  30. Wang, T.; Wan, Z.; Yang, X.; Zhang, X.; Niu, X.; Sun, B. Promotional effect of iron modification on the catalytic properties of Mn-Fe/ZSM-5 catalysts in the Fast SCR reaction. Fuel Process. Technol. 2018, 169, 112–121. [Google Scholar] [CrossRef]
  31. Huang, B.; Yu, D.; Sheng, Z.; Yang, L. Novel CeO2@TiO2 core–shell nanostructure catalyst for selective catalytic reduction of NOx with NH3. J. Environ. Sci. 2017, 55, 129–136. [Google Scholar] [CrossRef] [PubMed]
  32. Boningari, T.; Somogyvari, A.; Smirniotis, P.G. Ce-Based Catalysts for the Selective Catalytic Reduction of NOx in the Presence of Excess Oxygen and Simulated Diesel Engine Exhaust Conditions. Ind. Eng. Chem. Res. 2017, 56, 5483–5494. [Google Scholar] [CrossRef]
  33. Yao, X.; Zhao, R.; Chen, L.; Du, J.; Tao, C.; Yang, F.; Dong, L. Selective catalytic reduction of NOx by NH3 over CeO2 supported on TiO2: Comparison of anatase, brookite, and rutile. Appl. Catal. B Environ. 2017, 208, 82–93. [Google Scholar] [CrossRef]
  34. Yang, S.; Liao, Y.; Xiong, S.; Qi, F.; Dang, H.; Xiao, X.; Li, J. N2 Selectivity of NO Reduction by NH3 over MnOx-CeO2: Mechanism and Key Factors. J. Phys. Chem. C 2014, 118, 21500–21508. [Google Scholar] [CrossRef]
  35. Wang, B.; Chi, C.; Xu, M.; Wang, C.; Meng, D. Plasma-catalytic removal of toluene over CeO2-MnOx catalysts in an atmosphere dielectric barrier discharge. Chem. Eng. J. 2017, 322, 679–692. [Google Scholar] [CrossRef]
  36. Xiong, Y.; Tang, C.; Yao, X.; Zhang, L.; Li, L.; Wang, X.; Deng, Y.; Gao, F.; Dong, L. Effect of metal ions doping (M = Ti4+, Sn4+) on the catalytic performance of MnOx/CeO2 catalyst for low temperature selective catalytic reduction of NO with NH3. Appl. Catal. A Gen. 2015, 495, 206–216. [Google Scholar] [CrossRef]
  37. Yao, X.; Ma, K.; Zou, W.; He, S.; An, J.; Yang, F.; Dong, L. Influence of preparation methods on the physicochemical properties and catalytic performance of MnOx-CeO2 catalysts for NH3-SCR at low temperature. Chin. J. Catal. 2017, 38, 146–159. [Google Scholar] [CrossRef]
  38. Zhu, X.; Tu, X.; Mei, D.; Zheng, C.; Zhou, J.; Gao, X.; Luo, Z.; Ni, M.; Cen, K. Investigation of hybrid plasma-catalytic removal of acetone over CuO/γ-Al2O3 catalysts using response surface method. Chemosphere 2016, 155, 9–17. [Google Scholar] [CrossRef]
  39. Stanciulescu, M.; Caravaggio, G.; Dobri, A.; Moir, J.; Burich, R.; Charland, J.P.; Bulsink, P. Low-temperature selective catalytic reduction of NOx with NH3 over Mn-containing catalysts. Appl. Catal. B Environ. 2012, 123–124, 229–240. [Google Scholar] [CrossRef]
  40. Chen, Z.; Wang, F.; Li, H.; Yang, Q.; Wang, L.; Li, X. Low-Temperature Selective Catalytic Reduction of NOx with NH3 over Fe–Mn Mixed-Oxide Catalysts Containing Fe3Mn3O8 Phase. Ind. Eng. Chem. Res. 2012, 51, 202–212. [Google Scholar] [CrossRef]
  41. Cao, F.; Su, S.; Xiang, J.; Wang, P.; Hu, S.; Sun, L.; Zhang, A. The activity and mechanism study of Fe–Mn–Ce/γ-Al2O3 catalyst for low temperature selective catalytic reduction of NO with NH3. Fuel 2015, 139, 232–239. [Google Scholar] [CrossRef]
  42. Wu, S.; Yao, X.; Zhang, L.; Cao, Y.; Zou, W.; Li, L.; Ma, K.; Tang, C.; Gao, F.; Dong, L. Improved low temperature NH3-SCR performance of FeMnTiOx mixed oxide with CTAB-assisted synthesis. Chem. Commun. 2015, 51, 3470–3473. [Google Scholar] [CrossRef] [PubMed]
  43. Cheng, X.; Zhang, X.; Su, D.; Wang, Z.; Chang, J.; Ma, C. NO reduction by CO over copper catalyst supported on mixed CeO2 and Fe2O3: Catalyst design and activity test. Appl. Catal. B Environ. 2018, 239, 485–501. [Google Scholar] [CrossRef]
  44. Jin, R.; Liu, Y.; Wu, Z.; Wang, H.; Gu, T. Low-temperature selective catalytic reduction of NO with NH3 over MnCe oxides supported on TiO2 and Al2O3: A comparative study. Chemosphere 2010, 78, 1160–1166. [Google Scholar] [CrossRef] [PubMed]
  45. Grossale, A.; Nova, I.; Tronconi, E. Ammonia blocking of the “Fast SCR” reactivity over a commercial Fe-zeolite catalyst for Diesel exhaust aftertreatment. J. Catal. 2009, 265, 141–147. [Google Scholar] [CrossRef]
  46. Nova, I.; Ciardelli, C.; Tronconi, E.; Chatterjee, D.; Bandl-Konrad, B. NH3-SCR of NO over a V-based catalyst: Low-T redox kinetics with NH3 inhibition. AIChE J. 2006, 52, 3222–3233. [Google Scholar] [CrossRef]
  47. Gao, C.; Shi, J.-W.; Fan, Z.; Wang, B.; Wang, Y.; He, C.; Wang, X.; Li, J.; Niu, C. “Fast SCR” reaction over Sm-modified MnOx-TiO2 for promoting reduction of NOx with NH3. Appl. Catal. A Gen. 2018, 564, 102–112. [Google Scholar] [CrossRef]
  48. Grossale, A.; Nova, I.; Tronconi, E.; Chatterjee, D.; Weibel, M. The chemistry of the NO/NO2–NH3 “fast” SCR reaction over Fe-ZSM5 investigated by transient reaction analysis. J. Catal. 2008, 256, 312–322. [Google Scholar] [CrossRef]
  49. Iwasaki, M.; Shinjoh, H. A comparative study of “standard”, “fast” and “NO2” SCR reactions over Fe/zeolite catalyst. Appl. Catal. A Gen. 2010, 390, 71–77. [Google Scholar] [CrossRef]
  50. Li, Y.; Li, Y.; Wang, P.; Hu, W.; Zhang, S.; Shi, Q.; Zhan, S. Low-temperature selective catalytic reduction of NOx with NH3 over MnFeOx nanorods. Chem. Eng. J. 2017, 330, 213–222. [Google Scholar] [CrossRef]
  51. Chen, L.; Li, J.; Ablikim, W.; Wang, J.; Chang, H.; Ma, L.; Xu, J.; Ge, M.; Arandiyan, H. CeO2–WO3 Mixed Oxides for the Selective Catalytic Reduction of NOx by NH3 Over a Wide Temperature Range. Catal. Lett. 2011, 141, 1859–1864. [Google Scholar] [CrossRef]
  52. Liu, Z.; Yi, Y.; Zhang, S.; Zhu, T.; Zhu, J.; Wang, J. Selective catalytic reduction of NOx with NH3 over Mn-Ce mixed oxide catalyst at low temperatures. Catal. Today 2013, 216, 76–81. [Google Scholar] [CrossRef]
  53. Yang, S.; Li, J.; Wang, C.; Chen, J.; Ma, L.; Chang, H.; Chen, L.; Peng, Y.; Yan, N. Fe-Ti spinel for the selective catalytic reduction of NO with NH3: Mechanism and structure-activity relationship. Appl. Catal. B Environ. 2012, 117–118, 73–80. [Google Scholar] [CrossRef]
Figure 1. Scanning electron microscopy (SEM), transmission electron microscopy (TEM) and mapping of Mn−Fe−Ce−Ox/γ-Al2O3 nanocatalysts: (a) SEM of Mn10Fe20−Ce/Al; (b) SEM of Mn15Fe15−Ce/Al; (c) SEM of Mn20Fe10−Ce/Al; (d) TEM of Mn15Fe15−Ce/Al; (e) mapping of Mn15Fe15−Ce/Al; (f) mapping of Mn on Mn15Fe15−Ce/Al; (g) mapping of Fe on Mn15Fe15−Ce/Al; (h) mapping of Ce on Mn15Fe15−Ce/Al; (i) mapping of Al on Mn15Fe15−Ce/Al; (j) mapping of O on Mn15Fe15−Ce/Al.
Catalysts 08 00642 g001aCatalysts 08 00642 g001b
Figure 2. X-ray diffraction (XRD) patterns of Mn−Fe−Ce−Ox/γ-Al2O3 nanocatalysts.
Catalysts 08 00642 g002
Figure 3. X-ray photoelectron spectroscopy (XPS) analysis of Mn−Fe−Ce−Ox/γ-Al2O3 nanocatalysts: (a) XPS spectra for Mn 2p; (b) XPS spectra for Fe 2p; (c) XPS spectra for Ce 3d; (d) XPS spectra for O 1s.
Catalysts 08 00642 g003
Figure 4. H2-temperature-programmed reduction (H2-TPR) profiles of Mn−Fe−Ce−Ox/γ-Al2O3 nanocatalysts: (a) total H2-TPR curves; (b) multi-peak Gaussian fitting for Mn10Fe20−Ce/Al sample; (c) multi-peak Gaussian fitting for Mn15Fe15−Ce/Al sample; (d) multi-peak Gaussian fitting for Mn20Fe10−Ce/Al sample.
Catalysts 08 00642 g004
Figure 5. Graphical representation of the reduction process of Mn−Fe−Ce−Ox/γ-Al2O3 nanocatalysts with the reduction agent of H2 from 100 to 900 °C.
Catalysts 08 00642 g005
Figure 6. NH3-temperature-programmed desorption (NH3-TPD) profiles of Mn−Fe−Ce−Ox/γ-Al2O3 nanocatalysts: (a) total NH3-TPD curves; (b) multi-peak Gaussian fitting for Mn10Fe20−Ce/Al sample; (c) multi-peak Gaussian fitting for Mn15Fe15−Ce/Al sample; (d) multi-peaks Gaussian fitting for Mn20Fe10−Ce/Al sample.
Catalysts 08 00642 g006
Figure 7. NO-temperature-programmed desorption (NO-TPD) profiles of Mn−Fe−Ce−Ox/γ-Al2O3 nanocatalysts: (a) total NO-TPD curves; (b) multi-peak Gaussian fitting for Mn10Fe20−Ce/Al sample; (c) multi-peak Gaussian fitting for Mn15Fe15−Ce/Al sample; (d) multi-peak Gaussian fitting for Mn20Fe10−Ce/Al sample.
Catalysts 08 00642 g007
Figure 8. The activity of NO oxidation into NO2 over Mn−Fe−Ce−Ox/γ-Al2O3 nanocatalysts.
Catalysts 08 00642 g008
Figure 9. Fast SCR activity of Mn−Fe−Ce−Ox/γ-Al2O3 nanocatalysts. (ae) 200 ppm NO, 200 ppm NO2, 400 ppm NH3, 5% O2, ~0.3% H2O and N2 as balance gas; (f) 400 ppm NO, 400 ppm NH3, 5% O2, ~0.3% H2O and N2 as balance.
Catalysts 08 00642 g009
Figure 10. The possible redox catalytic pathway of the fast SCR reaction over Mn−Fe−Ce−Ox/γ-Al2O3 nanocatalysts.
Catalysts 08 00642 g010
Figure 11. The schematic diagrams of the catalytic performance tests. 1, standard gas; 2, mass flowmeter; 3, gas mixer; 4, water carrier; 5, shutdown valve; 6, resistance furnace; 7, temperature controller; 8, catalysts; 9, flue gas analyzer; 10, record system; 11, gas washing bottle; 12, induced draft fan.
Catalysts 08 00642 g011
Table 1. Physical properties of the nanocatalysts with different Mn/Fe ratios.
SamplesBET Surface Area (m2/g)Pore Volume (cm3/g)Pore Diameter (nm)
Fe30−Ce/Al58.20.3328.76
Mn10Fe20−Ce/Al77.40.5623.84
Mn15Fe15−Ce/Al122.70.7318.06
Mn20Fe10−Ce/Al88.20.5433.60
Mn30−Ce/Al73.30.5037.99
Table 2. Surface atomic compositions of the catalysts determined by XPS.
SamplesBinding Energy (eV)/Atomic Composition (%)
MnFeCeO
Mn2+
2p3/2
Mn3+
2p3/2
Mn4+
2p3/2
Fe2+
2p3/2
Fe3+
2p3/2
Ce3+
3d5/2
Ce4+
3d5/2
Oα
1s
Oβ
1s
Mn10Fe20−Ce/Al640.8/33.9642.1/36.2644.1/29.9709.8/28.1712.0/71.9885.819.4882.6/80.6530.3/76.6531.7/23.4
Mn15Fe15−Ce/Al641.3/6.8642.5/39.4644.4/53.8709.1/52.4711.3/47.6885.5/33.8882.4/66.2529.7/62.6531.2/37.4
Mn20Fe10−Ce/Al641.1/12.7642.247.2644.2/40.1709.4/42.7711.8/57.3885.7/23.8882.5/76.2529.4/70.2531.3/29.8
Table 3. Quantitative analysis of H2-TPR profiles.
SamplesTemperature (°C)/H2 Consumption (mmol/g)
Peak 1Peak 2Peak 3Peak 4Peak 5Total
Mn10Fe20−Ce/Al292/1.45366/2.30434/0.80643/0.27761/0.11--/4.93
Mn15Fe15−Ce/Al278/4.86353/0.85432/0.16597/0.14742/0.10--/6.11
Mn20Fe10−Ce/Al289/2.92361/2.13433/0.51582/0.28723/0.13--/5.97
Table 4. Quantitative analysis of NH3-TPD profiles.
SamplesTemperature (°C)/NH3 Composition (mmol/g)Temperature (°C)/NO Composition (mmol/g)
Peak 1Peak 2Peak 3TotalPeak 1Peak 2Peak 3Total
Mn10Fe20−Ce/Al213/0.16383/0.32547/0.76--/1.24271/0.32438/0.56597/0.70--/1.58
Mn15Fe15−Ce/Al211/0.38381/0.68545/0.55--/1.61264/0.44433/0.67569/0.64--/1.75
Mn20Fe10−Ce/Al210/0.56371/0.71542/0.29--/1.56261/0.59423/0.69588/0.39--/1.67
Table 5. Contents of Ce, Fe and Mn on Mn−Fe−Ce−Ox/γ-Al2O3 nanocatalysts.
SamplesMnFeCeMn:Fe
Mass Fraction (%)Molar Fraction (%)Mass Fraction (%)Molar Fraction (%)Mass Fraction (%)Molar Fraction (%)MOLAR RATIO
Fe30−Ce/Al0030.093.85.06.2--
Mn10Fe20−Ce/Al10.031.320.062.55.06.20.5:1
Mn15Fe15−Ce/Al15.047.015.046.85.06.21:1
Mn20Fe10−Ce/Al20.062.610.031.25.06.22:1
Mn30−Ce/Al30.093.9005.06.1--

