Article

Determination of Uric Acid in Co-Presence of Dopamine and Ascorbic Acid Using Cuprous Oxide Nanoparticle-Functionalized Graphene Decorated Glassy Carbon Electrode

1
School of Chemistry and Biological Engineering, Changsha University of Science & Technology, Changsha 410114, China
2
Hunan Key Laboratory of Biomedical Nanomaterials and Devices, School of Life Sciences and Chemistry, Hunan University of Technology, Zhuzhou 412007, China
*
Author to whom correspondence should be addressed.
These authors contributed equally to this work.
Catalysts 2018, 8(10), 407; https://doi.org/10.3390/catal8100407
Submission received: 31 August 2018 / Revised: 18 September 2018 / Accepted: 19 September 2018 / Published: 20 September 2018
(This article belongs to the Section Electrocatalysis)

Abstract

:
Cuprous oxide nanoparticles (Cu2O NPs) were dispersed into a graphene oxide (GO) solution to form a homogeneous Cu2O-GO dispersion. After this, the cuprous oxide nanoparticles were functionalized to electrochemically reduce the graphene oxide decorated glassy carbon electrode (Cu2O-ErGO/GCE). This was prepared by coating the Cu2O-GO dispersion onto the surface of the glassy carbon electrode (GCE), which was followed by a potentiostatic reduction process. An irreversible two-electron reaction of uric acid (UA) was observed at the voltammetric sensor. Moreover, the high concentrations of dopamine (DA) and ascorbic acid (AA) hardly affected the peak current of UA, which suggested that Cu2O-ErGO/GCE have excellent selectivity for UA. This is probably because the response peaks of the three compounds are well-separated from each other. The oxidation peak current was proportional to the concentration of UA in the ranges of 2.0 nM−0.6 μM and 0.6 μM−10 μM, respectively, with a low limit of detection (S/N = 3, 1.0 nM) after an accumulation time of 120 s. Cu2O-ErGO/GCE was utilized for the rapid detection of UA in human blood serum and urine samples with satisfactory results.

1. Introduction

Uric acid (UA) is a metabolite of nucleoprotein and nucleic acid. Having excessive amounts of UA in the human body can cause gout, renal failure and congenital hyperuricemia [1,2]. Therefore, the quantitative analysis of UA in the physiological fluids is of great importance in drug control and clinical diagnosis. Various methods have been developed for UA detection, such as spectrofluorometry [3], chromatography [4,5], enzymatic methods [6,7], chemiluminescence [8] and electroanalytical methods. Among these techniques, electrochemical methods are very suitable for the practical detection of UA due to their unique superiorities, including low cost, high sensitivity and good selectivity. The electrochemical determination of UA is commonly based on monitoring the oxidation signal of UA on the electrode. The electrooxidation process of UA is illustrated in Scheme 1 [9]. However, it is susceptible to interference from coexisting species, such as dopamine (DA) and ascorbic acid (AA), when detecting UA with bare electrodes since they have similar oxidation peak potentials [10,11,12]. Nanocomposite-modified electrodes can improve the anti-interference performance and selectivity, which is a common method that is used to solve this problem. At present, many chemically modified electrodes have been proposed for the determination of UA [9,13,14,15,16,17,18,19,20,21,22] although their selectivity is limited, especially due to the coexistence of DA and AA. Hence, developing a modified electrode with high sensitivity and selectivity to meet clinical demands is still challengeable and desirable.
In the past few years, transition metals and metal oxides have received increasing attention in many fields, such as sensors and electrocatalysis, due to their unique sensing performance and superior electrocatalytic activity [9,11,23,24]. Among these metal oxides, cuprous oxide (Cu2O) is a new type of p-type semiconductor with a narrow band gap, which can also be easily excited by visible light. Due to their outstanding advantages, such as non-toxic, low cost and stable photochemical properties, Cu2O nanoparticles have been extensively used in many fields, such as new energy, photocatalytic degradation, sterilization and sensing [25,26,27]. The different morphologies of Cu2O nanomaterials, such as hollow spheres, cubes, wires, octahedrons and cages, can be synthesized by adjusting the synthesis conditions [28]. At present, various electrochemical sensors based on Cu2O nanoparticles have been constructed for the detection of H2O2 [29,30], glucose [30,31,32], dopamine [33,34,35], herbicide paraquat [36], L-tyrosine [37], vanillin [38], sunset yellow [39] and NO2 [40]. As far as we know, the use of Cu2O for the determination of UA has rarely been reported in the literature. However, Cu2O nanoparticles are easily agglomerated, which greatly limits their application in electrochemical sensors. How to reduce the agglomeration of nano-semiconductors is an urgent problem to be solved.
Graphene (GR) is a single-layer two-dimensional planar crystal with the specific surface area of 2630 m2/g, which enables it to be an ideal template for GR-based composites in the fields of battery, photocatalysis, sensing and so on [41]. Xu et al. [29] successfully prepared Cu2O-reduced graphene oxide nanocomposites using three various methods (namely physical adsorption, in-situ reduction and one-pot synthesis). The composites were dispersed in 0.1% nafion solution and decorated on the glassy carbon electrode (GCE) by a drop-coating technique, which were constructed for nonenzymatic hydrogen peroxide sensing. Cu2O/GR nanocomposites were also successfully prepared by a solvothermal method [33], with Cu2O/GR/GCE having showed good electrocatalytic activity towards DA. As result, the proposed Cu2O/GR/GCE exhibited excellent sensing performances in terms of linear range (0.1−10 μM) and limit of detection (LOD, 10 nM). Ye et al. [36] developed a novel paraquat sensor based on Cu2O/polyvinyl pyrrolidone-functionalized GR nanosheet nanocomposite. However, the preparation of the above GR-based composites is complicated, which greatly affects the use of sensors in practical applications. Therefore, the development of a green routine for the creation of Cu2O–GR composite-based electrochemical sensors is very crucial.
Herein, a simple and green routine was proposed to construct an ultrasensitive sensor based on Cu2O/electrochemically reduced graphene oxide decorated glass carbon electrode (Cu2O-ErGO/GCE), which aimed to selectively detect UA even in the co-presence of DA and AA. The Cu2O-loaded graphene oxide (GO) nanocomposites were directly coated on the electrode surface, before being electrochemically reduced to obtain Cu2O-ErGO/GCE. The as-obtained Cu2O-ErGO has excellent electrocatalytic activity towards UA oxidation and thus, we have successfully realized the selective and sensitive detection of UA in human blood serum and urine samples.

2. Results and Discussion

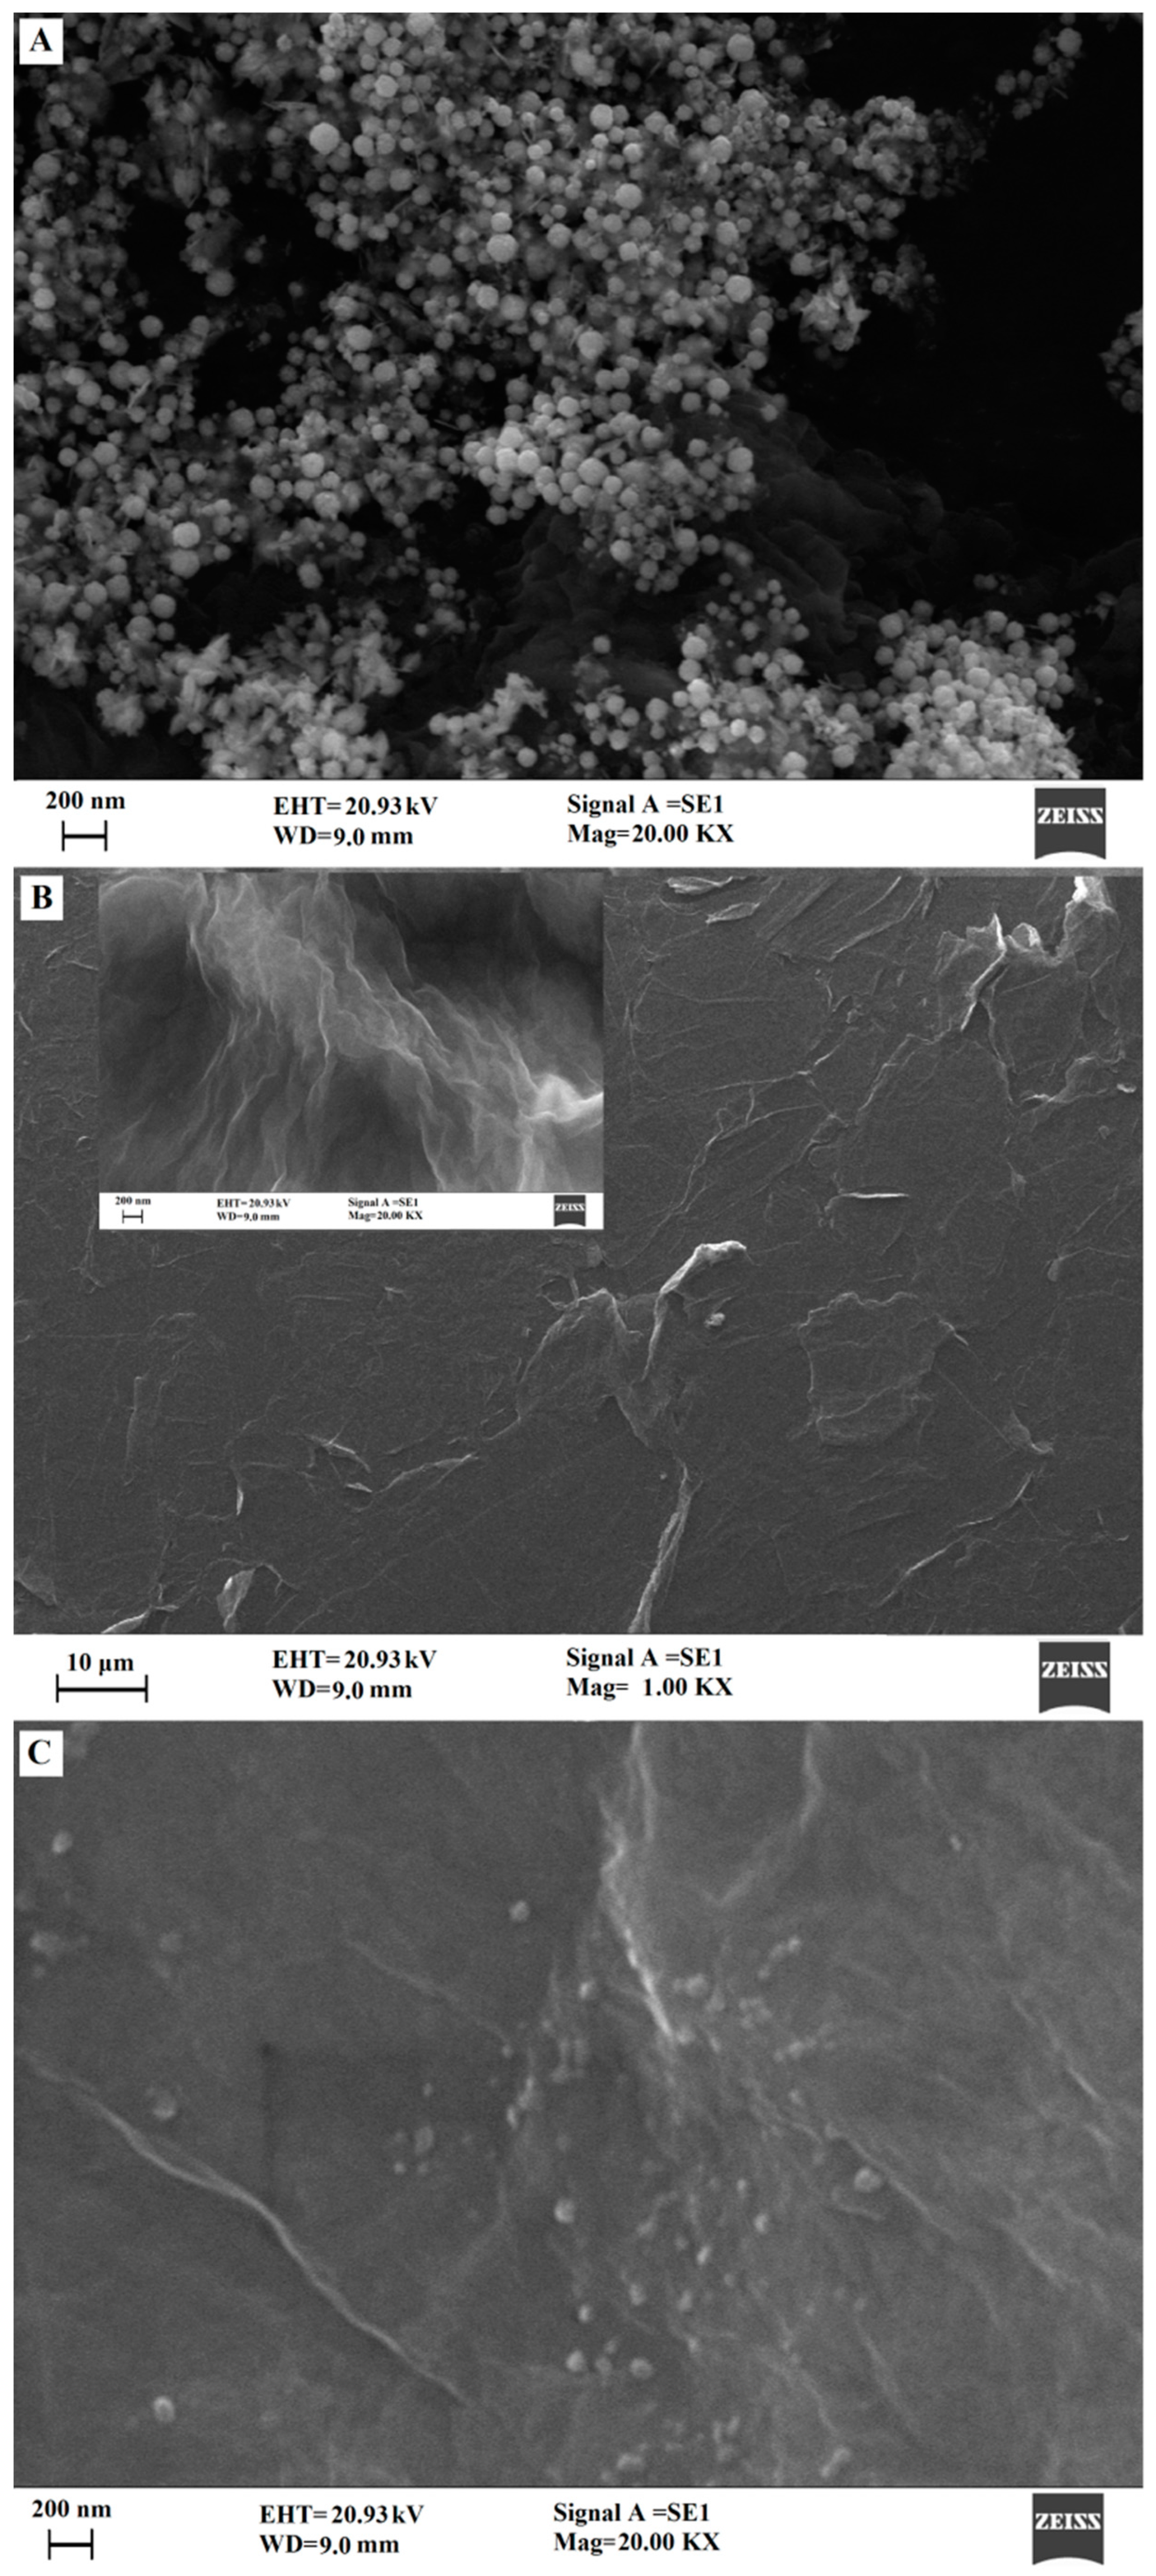
2.1. Characterization of Surface Morphologies

The morphologies of Cu2O, GO and Cu2O-ErGO nanocomposites were recorded by Scanning Electron Microscope (SEM) (Figure 1). Figure 1A shows the SEM image of the Cu2O nanoparticles. Most of these Cu2O nanoparticles had a spherical outline, with an average diameter of around 100 nm based on the SEM measurements of 500 nanoparticles. Figure 1B shows the low magnification SEM image of GO nanosheets, which clearly illustrates the flake-like shapes. Furthermore, the thickness of the wrinkled edges could be regarded as the thickness of the exfoliated GO nanosheets, which displayed a thickness about 2–20 nm. The GO at a high magnification (inset of Figure 1B) had a wrinkled surface, which corrugated and scrolled in a similar way to crumpled silk veils. This lamellar structure of GO can effectively increase the specific surface area of the modified electrode. Figure 1C clearly shows that a large number of Cu2O nanoparticles were decorated on a thin film of electrochemically reduced graphene oxide (ErGO), indicating the Cu2O nanoparticles successfully combined with the graphene support. Besides, the SEM image in Figure 1C revealed that these particles have a similar morphology and size to the Cu2O particles in Figure 1A, indicating that the introduction of ErGO did not change the structure of Cu2O. The Cu2O-ErGO nanocomposite is expected to improve the catalytic activity and sensitivity due to the catalytic activity of Cu2O and large surface area of GO [42].

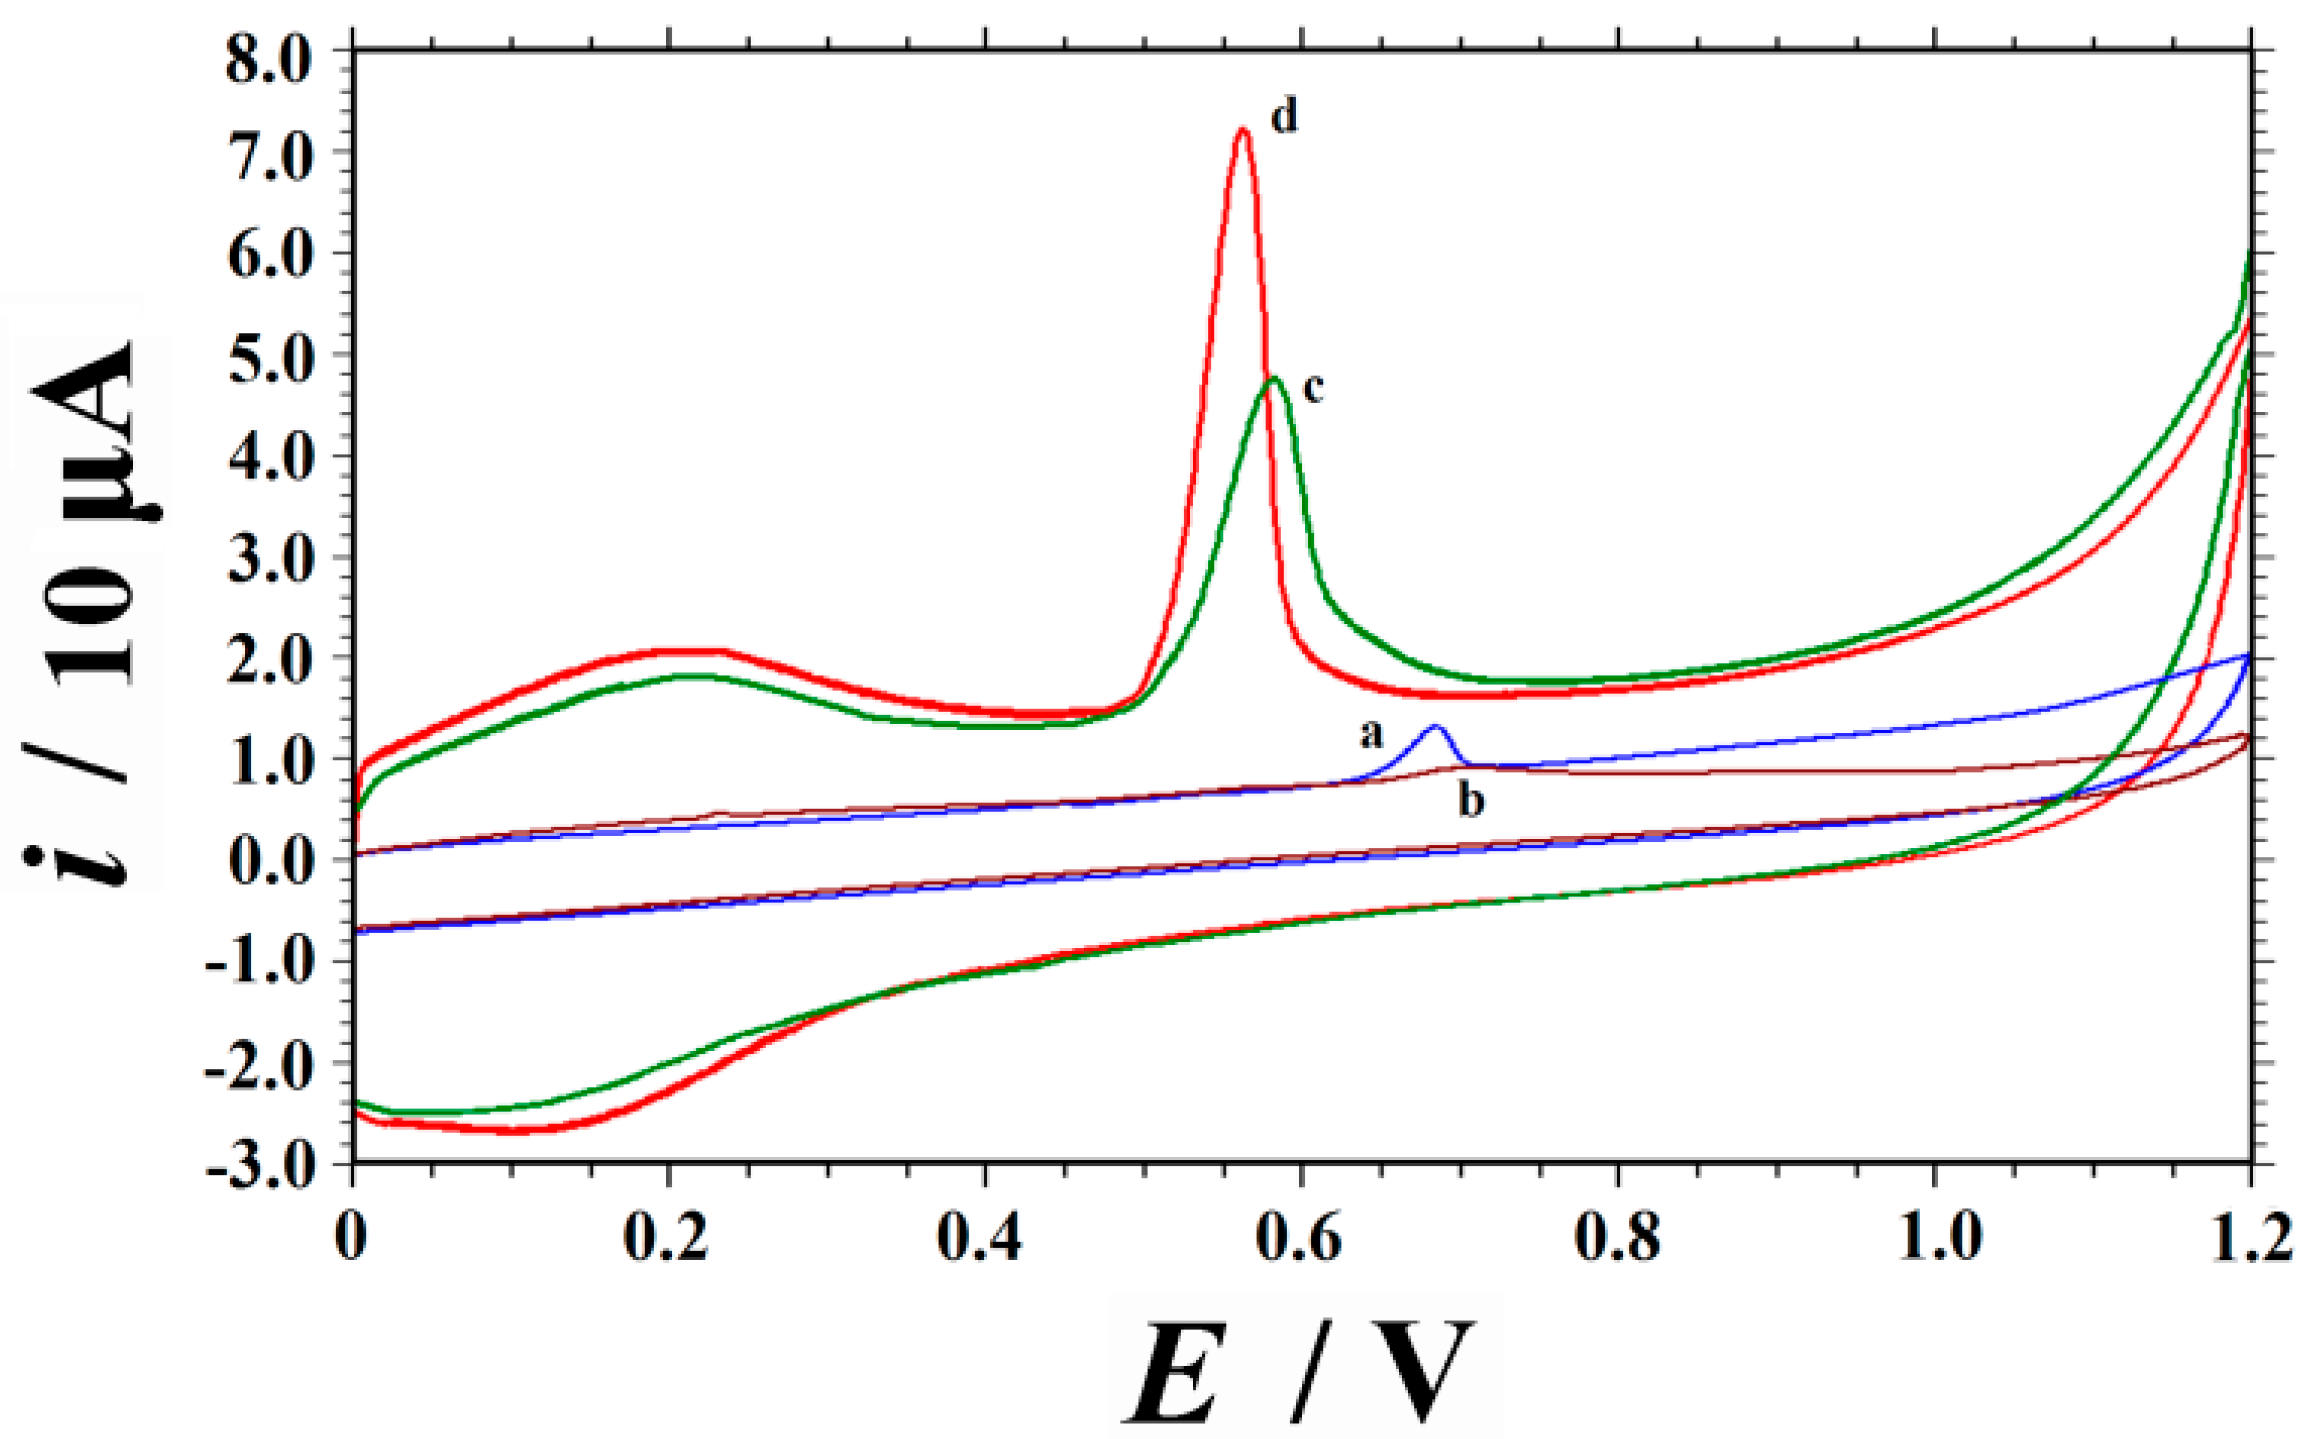
2.2. Voltammetric Responses of UA on Different Electrodes

The voltammetric behavior of 10 μM UA on the bare GCE, GO/GCE, ErGO/GCE and Cu2O-ErGO/GCE was measured in 0.1 M phosphate buffer solution (PBS, pH of 3.0) by cyclic voltammetry (CV). Only one oxidation peak was observed on all electrodes (Figure 2), which indicated that the electrochemical reaction of UA is completely irreversible. On the bare GCE, a broad and weak oxidation peak was observed at 0.683 V with a oxidation peak current (Ipa) of 5.413 μA, corresponding to a slow electron transfer kinetic process. On the GO/GCE, the oxidation potential (Epa) moves positively to 0.705 V and the Ipa decreases to 1.315 μA. This phenomenon is closely related to the retarded electron transfer due to the presence of poor electrical conductivity of GO. When decorated with ErGO, the Ipa of UA increases obviously (Ipa = 30.89 μA) and the Epa shifts negatively to 0.580 V, showing that ErGO has good electrocatalytic activity towards UA. This is probably due to the large specific surface area and excellent electrical conductivity of ErGO, which eventually increases the response current of UA. When decorated with the ErGO-Cu2O nanocomposites, the sharp oxidation peak appears with the Epa further shifting negatively to 0.561 V and the Ipa further increasing to 57.69 μA. The Ipa for Cu2O-ErGO/GCE is about 10-fold higher than that on the bare GCE and almost twice as large as that at the ErGO/GCE, which is due to the synergistic effect of ErGO and Cu2O nanoparticles.

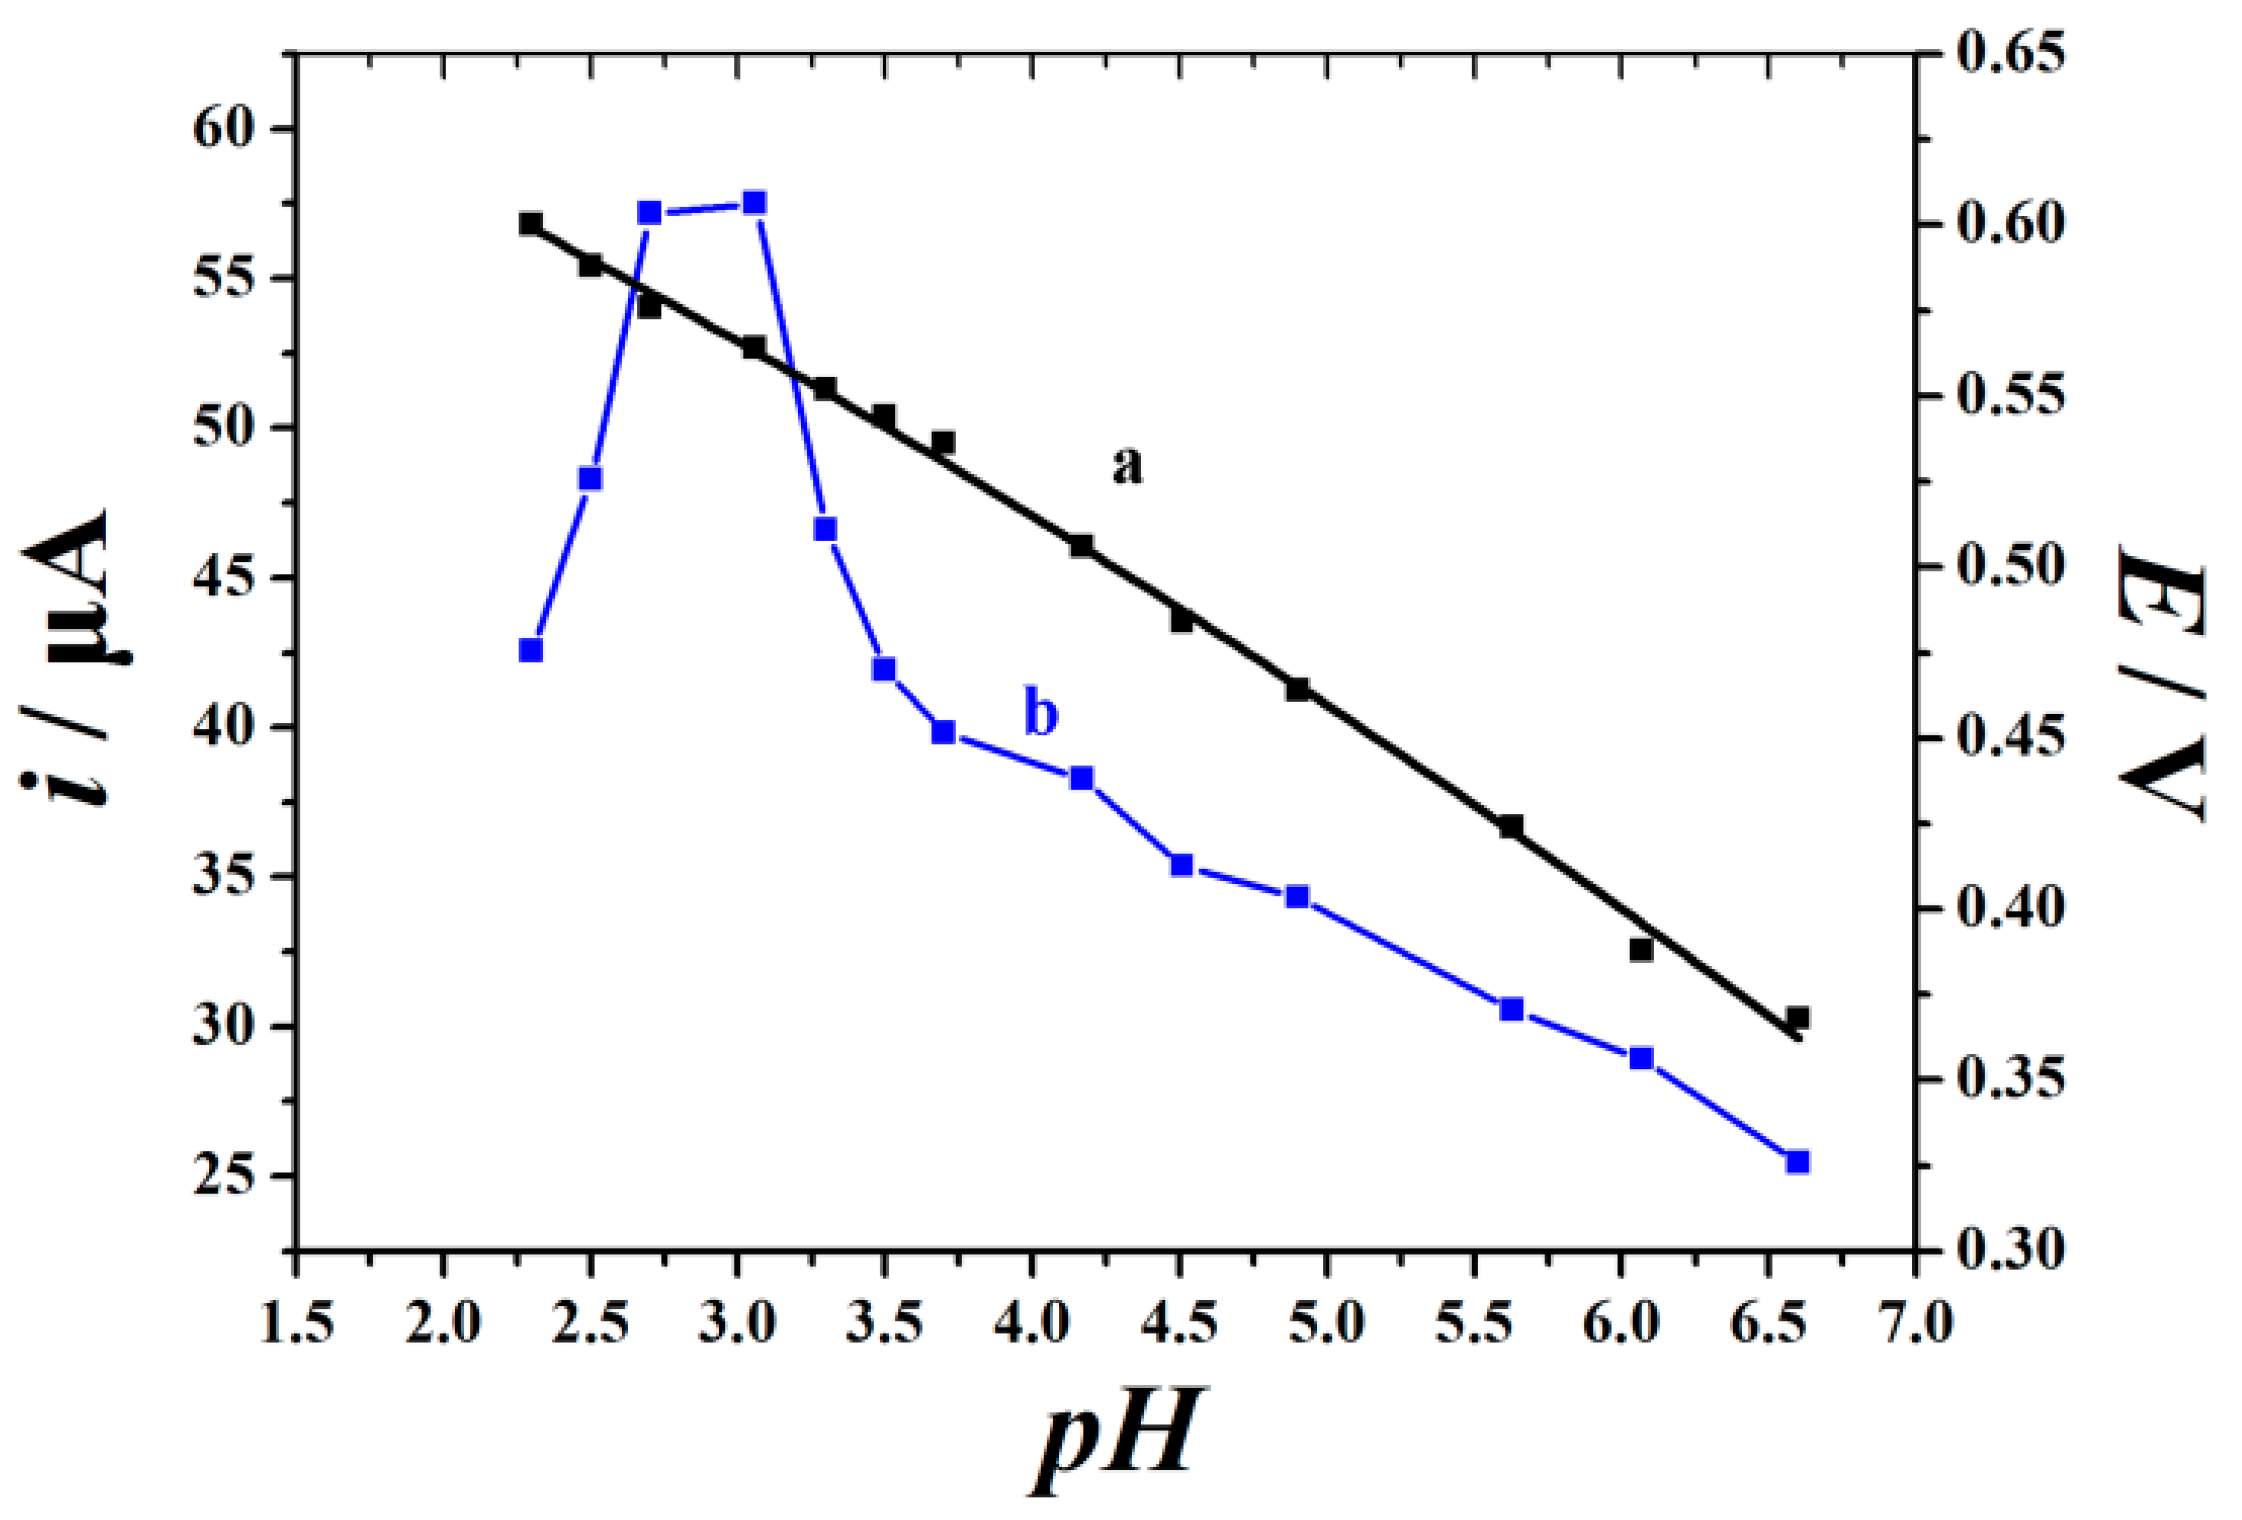
2.3. pH-Dependent Electrochemical Response

The influence of the solution pH on the voltammetric responses of 10 μM UA at Cu2O-ErGO/GCE was investigated by CV. The variation of Epa and Ipa with the solution pH values are shown in Figure 3. The Epa of UA shifts negatively with an increase in the pH, suggesting that the protons (H+) are involved in the oxidation of UA. Moreover, Epa is linearly related to the pH, while the corresponding regression equation is Epa (V) = −0.0548pH + 0.7304 (r = 0.9977). The slope (54.8 mV/pH) approaches the theoretical value of 57.6 mV/pH, implying that the equal number of electrons and protons take part in the UA oxidation. The Ipa of UA increases gradually with an increase in the pH, before reaching a maximum in the pH range of 2.7–3.1. After this, the Ipa decreases with a further increase in the pH. It is well known that the electrochemical behavior of UA (pKa1 = 2.38 and pKa2 = 9.39) is dependent on the pH value of the aqueous solution. In an acidic solution, UA is positively charged due to the protonation of the amino group, which is available to form strong hydrogen bonds with oxygen-containing groups on ErGO surface, such as carboxyl groups and carbonyl groups. This ultimately improves the adsorption of UA onto the electrode surface. Considering the sensitivity of the detection, a pH of 3.0 is recommended for UA determination.

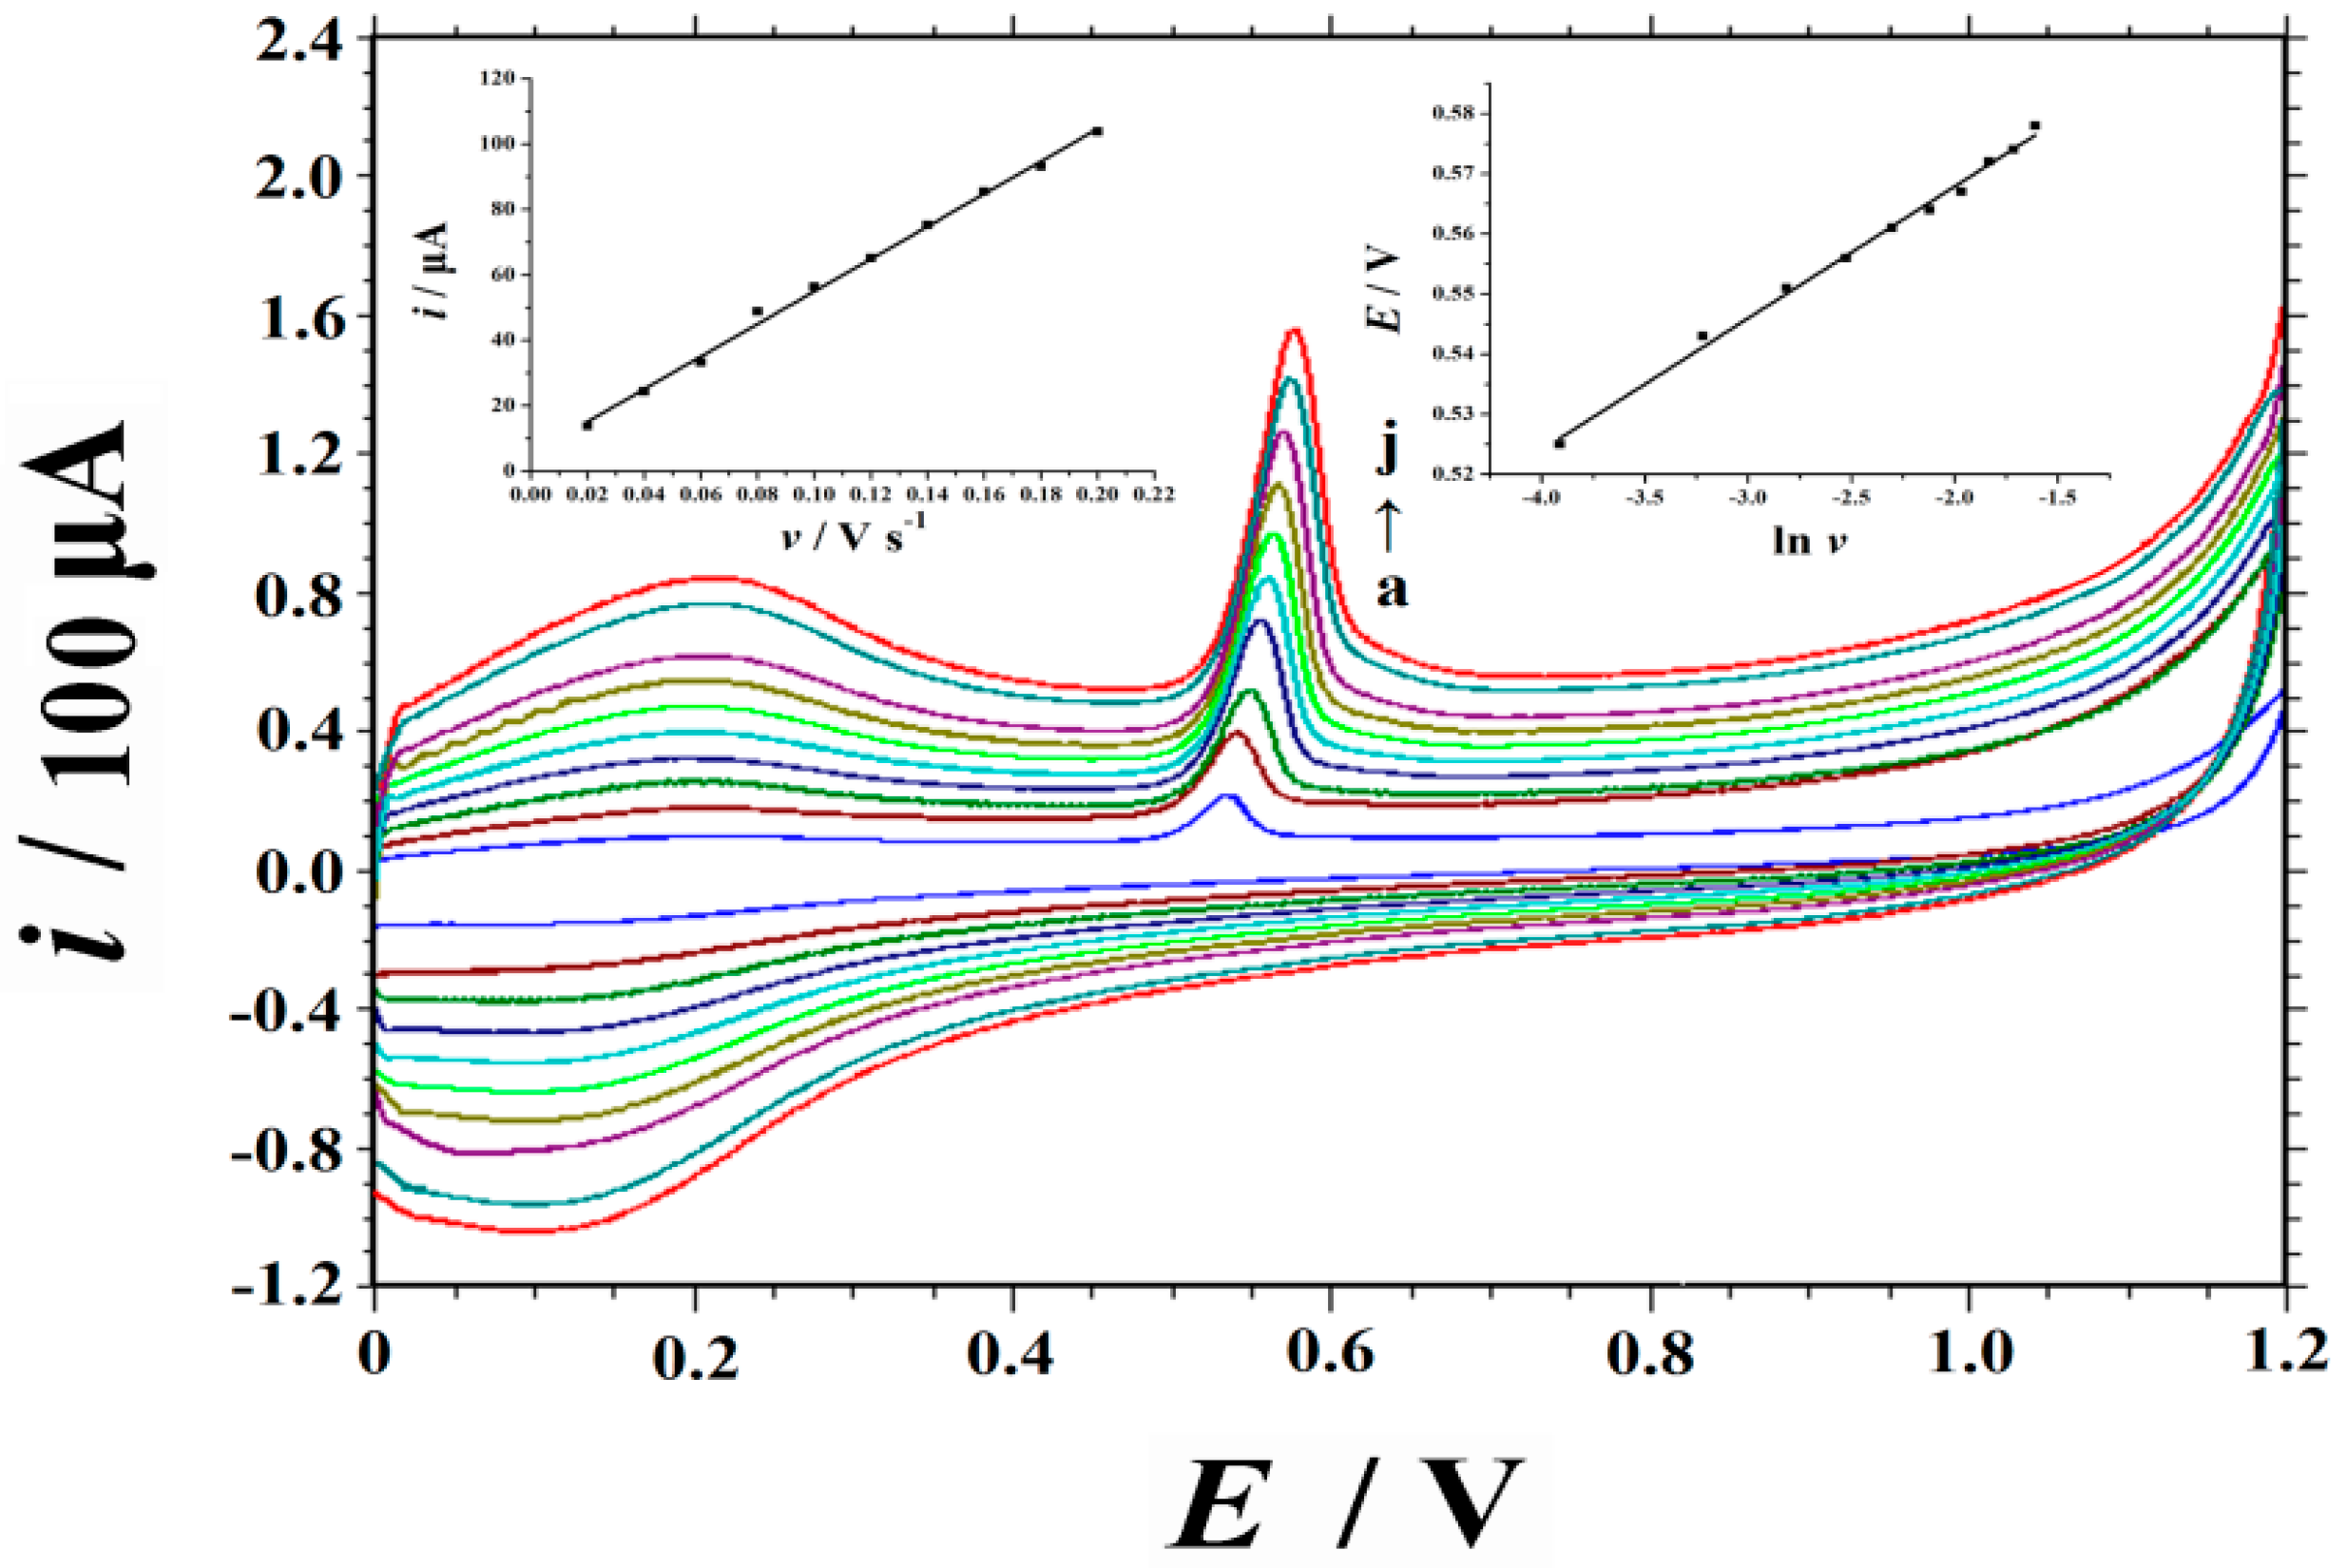
2.4. Sweep Rate and Electrochemical Kinetics

The electrochemical kinetics of UA oxidation at Cu2O-ErGO/GCE was investigated by CV, which was measured at various sweep rates. As presented in Figure 4, the Ipa has a positive linear relationship with the sweep rates (v), while the corresponding linear relationship can be expressed as Ipa (μA) = 497.32v (V s−1) + 5.2533 (r = 0.9984). This indicates that the oxidation of UA is controlled by the adsorption process. The diffusion or adsorption-controlled behavior was also cross-verified by plotting logIpa vs. logv, which yielded a linear regression equation of logIpa (μA) = 0.8841logv (V s−1) + 2.6319 (r = 0.9987). The obtained slope (0.8841) is close to 1.0, which further confirms that the reaction is adsorption-controlled. Furthermore, the Epa has a linear relationship to the Napierian logarithm of sweep rate (lnv). The linear regression equation is Ep (V) = 0.0219lnv (V s−1) + 0.6117 (r = 0.9974). For a completely irreversible and adsorption-controlled process, the electron transferred number (n) was calculated to be 2 according to Laviron’s theory [43]. Combining with the pH-dependent response results, the UA oxidation is a 2-electron and 2-proton process. This is consistent with previous reports [12,21].

2.5. Optimization of the Analytical Conditions

2.5.1. Optimization of Supporting Electrolytes

The influence of different supporting electrolytes on the Ipa of 10 μM UA at Cu2O-ErGO/GCE was investigated. PBS (pH of 2.3–6.6), (CH2)6N4–HCl buffer (pH of 4.0–6.0), HAc–NaAc buffer (pH of 3.0–6.0), HAc–NH4Ac buffer (pH of 3.0–6.0), NH3-NH4Cl buffer (pH of 8.0–10.0), H2SO4, HCl and H3PO4 (all concentrations of 0.1 M) were used as the supporting electrolytes. The sharp oxidation peak with the largest Ipa was found in 0.1 M PBS.

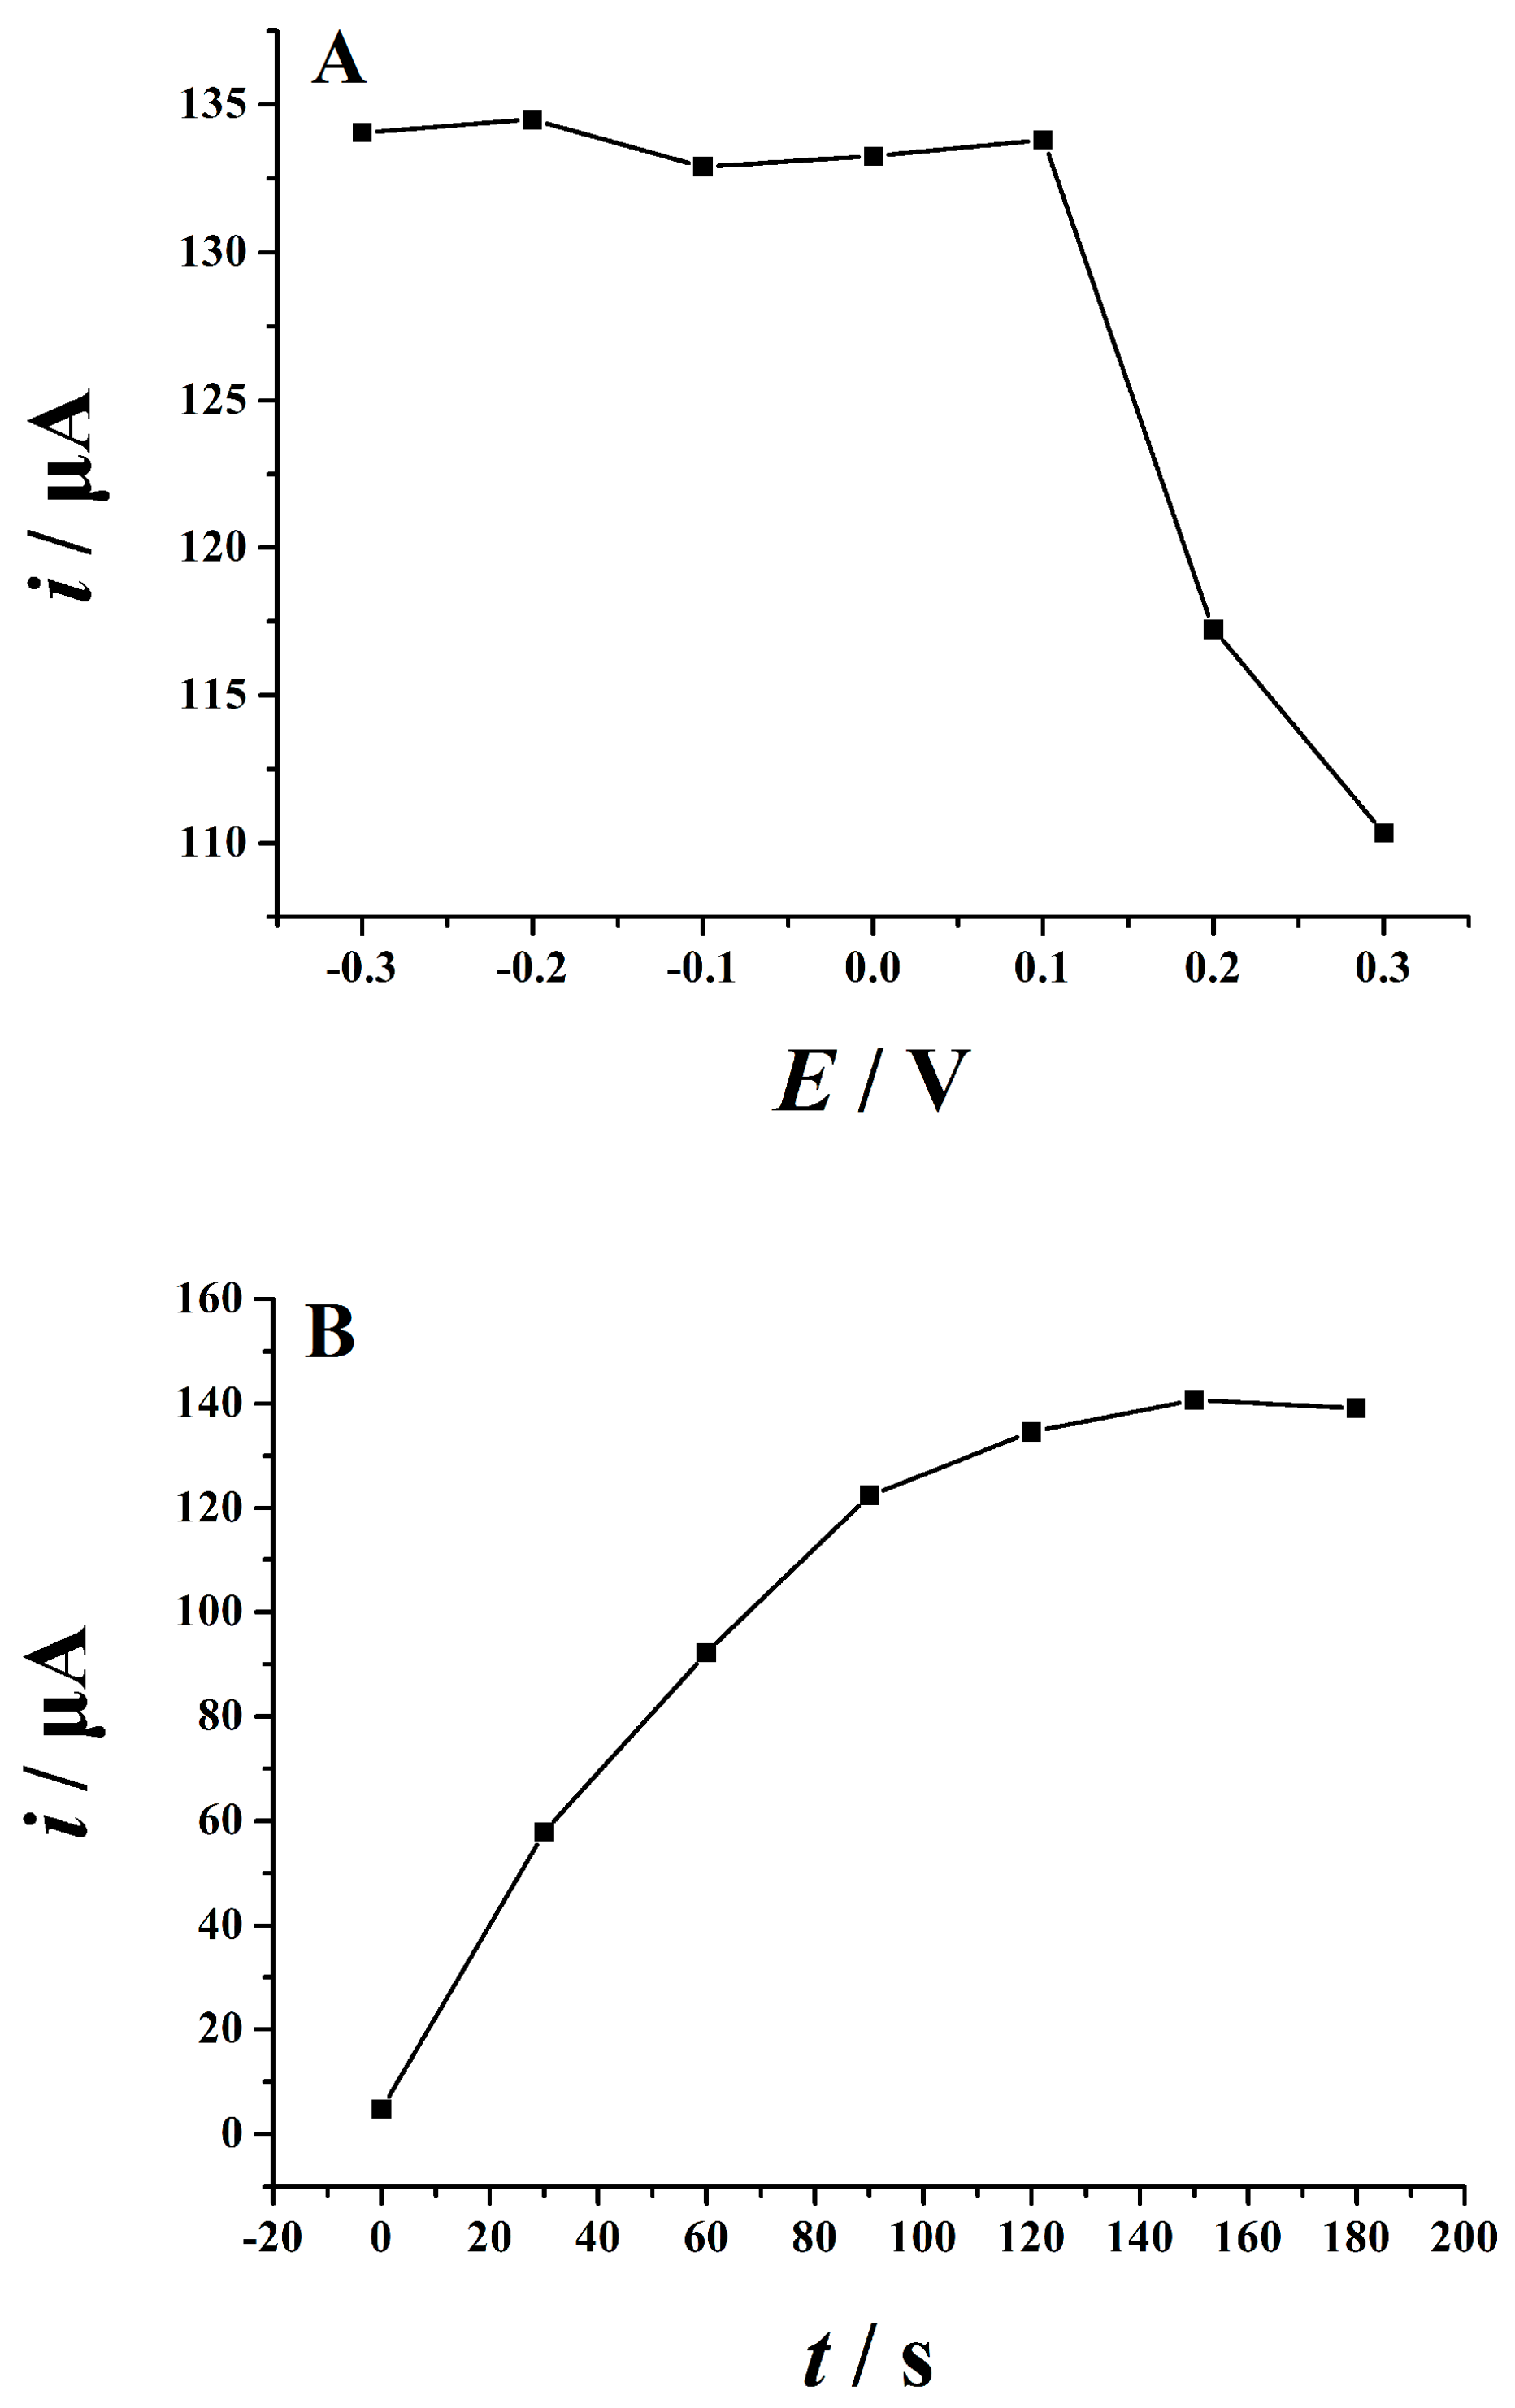
2.5.2. Optimization of Accumulation Conditions

As demonstrated in Section 2.4, the oxidation of UA at Cu2O-ErGO/GCE is an adsorption-controlled process. Therefore, the accumulation can increase the adsorption capacity of UA on the electrode surface and significantly enhance the sensitivity of the detection. The influence of the accumulation potential on the Ipa of UA is plotted in Figure 5A. When the accumulation potential varied from −0.3 to 0.1 V, the Ipa altered very slightly. However, the Ipa of UA decreases rapidly when the accumulation potential shifts to the positive and exceeds 0.1 V. The influence of the accumulation time was also investigated, with the results presented in Figure 5B. During 0–120 s, the Ipa of UA increases significantly over time, before leveling off. This is mainly related to the saturation adsorption of UA on the electrode surface. Therefore, the accumulation was performed at −0.2 V for 120 s before the electrochemical measurement or detection.

2.6. Analytic Properties

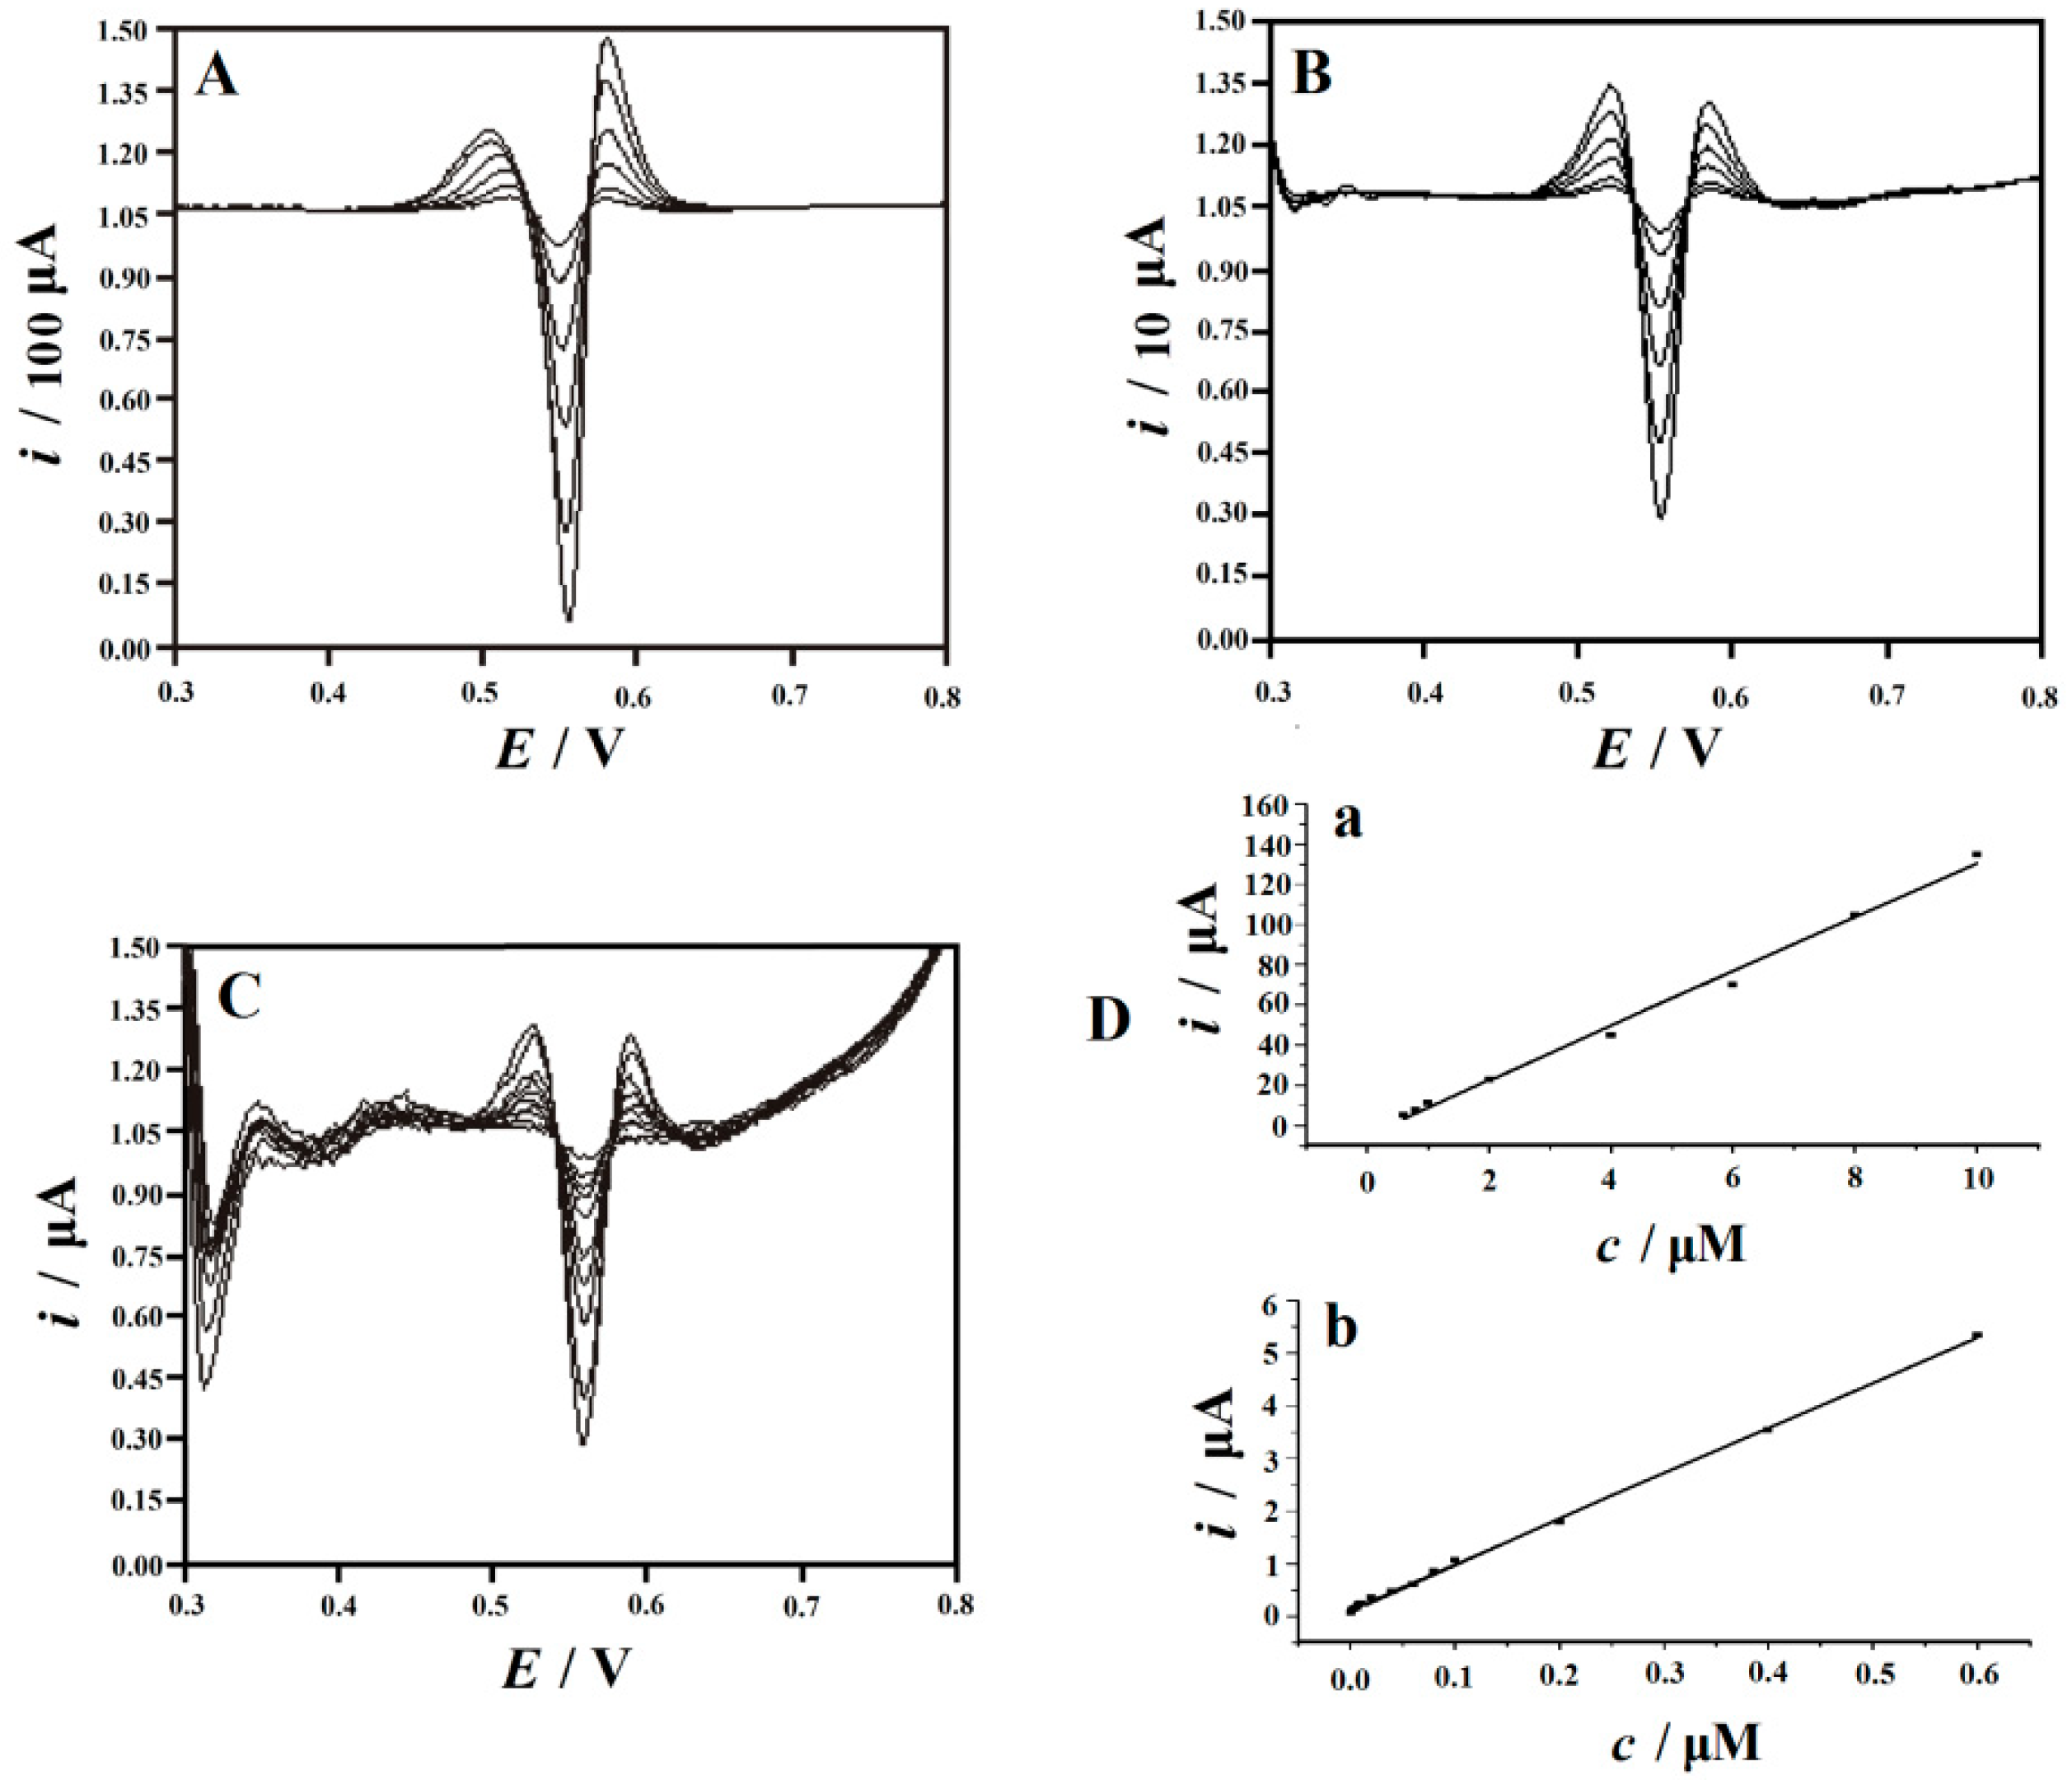
2.6.1. Calibration Curves, Dynamical Response Regions and Detection Limit
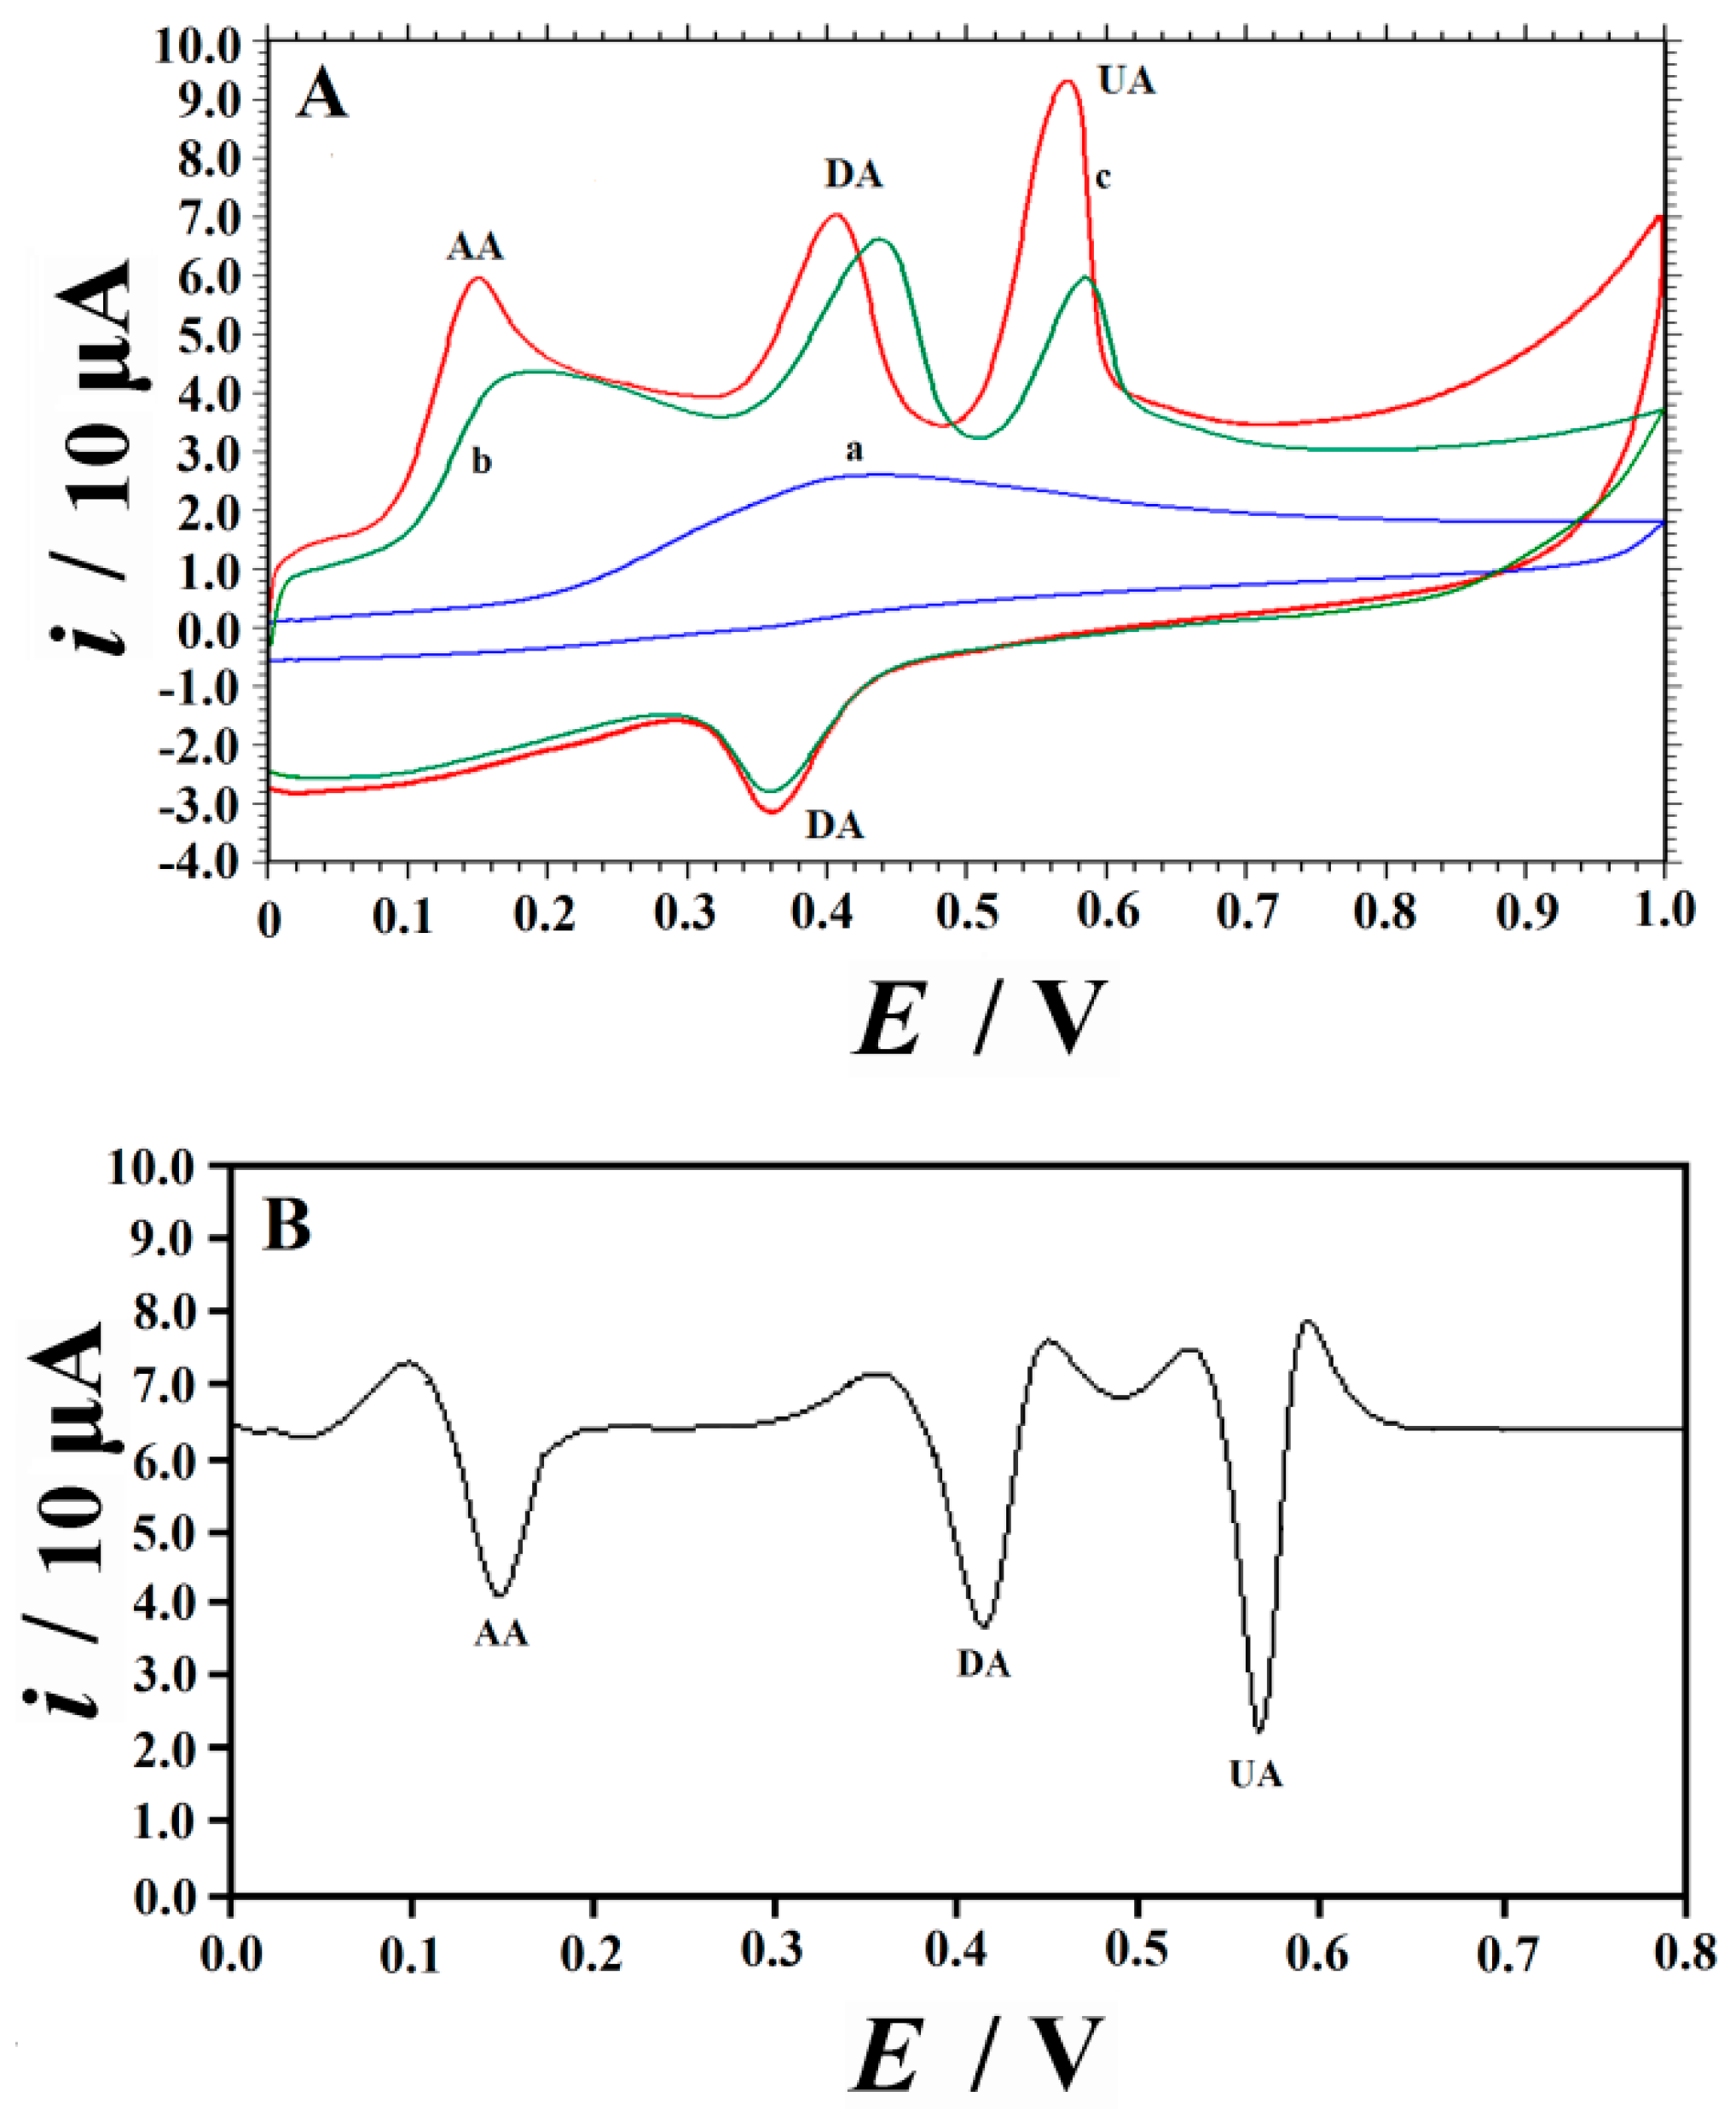
Under the optimal experimental conditions, the Ipa of UA with different concentrations at Cu2O-ErGO/GCE was measured by Second-order derivative linear sweep voltammetry (SDLSV) (Figure 6). The Ipa of UA increases linearly with an increase in the concentration in the ranges of 2.0 nM–0.6 μM and 0.6 μM–10 μM. The corresponding linear equations for these two ranges are Ipa (μA) = 8.6267c (μM) + 0.1289 (r = 0.9971) and Ipa (μA) = 13.467c (μM) − 4.3026 (r = 0.9996), respectively. The detection limit (S/N = 3) is found to be 1.0 nM. Compared with the existing nanocomposite-modified electrodes (Table 1), Cu2O-ErGO/GCE has a lower limit of detection and is suitable for the detection of UA at a lower concentration level.

2.6.2. Interference

As we all know, AA, DA and UA always coexist in the biological fluids, such as blood and urine. Hence, the interference effect of AA and DA on UA detection was first studied. The CV response of 10 μM UA in the presence of 1 mM AA and 50 μM DA is illustrated in Figure 7A. A broad and small peak appears at 430 mV at the bare GCE, indicating the very close peak potentials of AA, DA and UA at the bare electrode so that the simultaneous detection of the three compounds is difficult to achieve. On the contrary, the oxidation peaks of the three species were well separated at both ErGO/GCE and ErGO-Cu2O/GCE. For ErGO-Cu2O/GCE, the peak potential separation (∆Ep) between DA and UA is greater, while the Ipa of UA is much higher than DA and AA. The SDLSV of DA, UA and AA at ErGO-Cu2O/GCE is shown in Figure 7B. The ∆Ep for AA–DA, DA–UA are 0.262 V and 0.152 V, respectively. The large ∆Ep is favorable for the accurate detection of UA without interference. Other possible interferents, such as glucose, purine, oxalate, citrate and urea (all concentrations of 1.0 mM), were also examined. The variation of Ipa is not beyond ±5%, indicating no significant interference even in the presence of these potential interfering substances. Therefore, Cu2O-ErGO/GCE exhibits good selectivity for the detection of UA.

2.6.3. Repeatability, Reproducibility and Stability

The repeatability of Cu2O-ErGO/GCE was validated by ten parallel measurements of the Ipa of 10 μM UA. The relative standard deviation (RSD) is 2.2%, suggesting the good repeatability of Cu2O-ErGO/GCE. The precision of multiple Cu2O-ErGO/GCEs was also investigated. Seven Cu2O-ErGO/GCEs were fabricated by the same procedure independently and the RSD is calculated as 4.8%, which suggested that the electrode fabrication method has good reproducibility. Finally, the stability of Cu2O-ErGO/GCE was also evaluated. The ErGO-Cu2O/GCE was placed at 4 °C in a refrigerator for 2 weeks. After two weeks, the Ipa of 10 μM UA retains 92.4% of the initial response current, indicating that the Cu2O-ErGO/GCE has good stability.

2.6.4. Real Sample Analysis

Under the optimal analytical conditions, Cu2O-ErGO/GCE was used for the detection of UA in human serum and urine by SDLSV. The serum samples was provided by a local hospital and the urine samples were collected from students in our group. A total of 1.0 mL was taken from each sample, before being diluted with 0.1 M PBS (pH 3.0) in a 100-mL and 500-mL flask. The sample solutions were measured by the SDLSV method. The results are listed in Table 2. The samples were spiked with UA standard solution at levels similar to those found in the samples. The recoveries ranged from 97.5% to 102.8%, which indicates that this method can meet the requirements for the detection of UA in the actual samples.

3. Experimental

3.1. Reagents and Solutions

CuSO4·5H2O, NaOH, hydrazine hydrate solution (80 wt%), graphite powder, polyvinyl pyrrolidone (PVP) and H2O2 solution (30 wt%) were obtained from Sinopharm Chemical Reagent Co. Ltd. (Shanghai, China). AA, DA and UA were supplied by Sigma-Aldrich Co. (St. Louis, Mo, USA). All the reagents were of analytical grade. The stock solution of 0.01 M UA was prepared by dissolving the UA solid into a small volume of 0.1 M NaOH solution, before this was diluted to reach the desired concentration. Doubly distilled water was used in all experiments.

3.2. Synthesis of Cu2O Nanoparticles

According to a previous report [38], Cu2O nanoparticles (Cu2O NPs) were synthesized by the wet-chemical method. Following a typical process, 100 mg of CuSO4·5H2O and 50 mg of PVP were added into 20 mL of H2O with stirring. After this, 4 mL of NaOH (0.2 M) was added dropwise to form a blue precipitate. In the end, 15 μL of hydrazine hydrate solution (80 wt%) was added and the mixture was agitated at room temperature for 20 min. The solid product was separated from the solution by centrifugation. After this, the product was cleaned with anhydrous alcohol and water, before being vacuum-dried at 60 °C overnight.

3.3. Preparation of GO and Cu2O–GO Composite

Graphene oxide (GO) was synthesized according to our previous report [34]. Typically, concentrated H2SO4 (23 mL) was cooled to 0 °C, before graphite powder (0.5 g) and NaNO3 (0.5 g) were added with mechanical stirring. KMnO4 (3.0 g) was added slowly at a control temperature below 5 °C, before the temperature was raised to 35 °C and the mixture was stirred for 2 h to form a mash. Subsequently, 40 mL of water was slowly added into the solution at a temperature below 50 °C, before the temperature was increased to 95 °C and the mixture was stirred for 0.5 h. After 100 mL of water was added, the above solution was added into 20 mL of 30% H2O2 in batches. The suspension was treated by suction filtration in time and the precipitate was washed with 150 mL of hydrochloric acid (1:10) and 150 mL of H2O, respectively. The graphite oxide was obtained by drying under a vacuum at 50 °C overnight. Finally, 100 mg pf graphite oxide were dispersed in 100 mL of water and exfoliated to GO by ultrasonication for 2 h. After this, the golden-yellow supernatant with a concentration of about 1 mg/mL was obtained after centrifugation. A total of 1.0 mg of Cu2O NPs was added into 20 mL pf GO (1 mg/mL) and mixed under ultrasonication for 2 h. Finally, a homogeneous dispersion of Cu2O-GO was obtained.

3.4. Fabrication of Cu2O-ErGO/GCE

First, bare GCE was polished by 0.3 μm of alumina slurry, before being rinsed by absolute ethanol and water in an ultrasonic bath for 3 min and dried in N2 blowing. Five μL of Cu2O-GO dispersion was dropped on the freshly prepared GCE. After drying under ambient conditions, the Cu2O–GO/GCE was obtained. The Cu2O–GO/GCE was immersed in 0.1 M PBS (pH of 6.0), before being electrochemically reduced at −1.2 V for 120 s to obtain Cu2O-ErGO/GCE. For comparison, GO/GCE and ErGO/GCE were fabricated by the similar procedures.

3.5. Characterization and Measurements

The SEM photos of Cu2O NPs, GO nanosheets and Cu2O-ErGO nanocomposites were obtained by scanning electron microscopy (FESEM, EVO10, Carl Zeiss, Jena, Germany). The electrochemical behaviors of UA on the Cu2O-ErGO/GCE was measured by cyclic voltammetry (CV) and second-order derivative linear sweep voltammograms (SDLSV). Both the CV and SDLSV swept at a rate of 100 mV/s. The potential sweep ranges were 0.0–1.2 V for CV and 0.3–0.8 V for SDLSV. The supporting electrolyte used was 0.1 M PBS (pH of 3.0) except where stated otherwise. All the electrochemical tests were performed on a CHI 660D electrochemical workstation (Chenhua Instrument Co. Ltd., Shanghai, China). The SDLSV were obtained from the JP-303E polarographic analyzer (Chengdu Instrument Factory, Chengdu, China). All the electrochemical experiments were carried out with a three-electrode system where the Cu2O-ErGO/GCE (3-mm inner diameter) served as the working electrode, while Pt wire and saturated calomel electrode (SCE) acted as the counter electrode and reference electrode. The pH was measured by a pH meter (Shanghai Leichi Instrument Factory, Shanghai, China). The measurements were carried out at room temperature.

4. Conclusions

A novel electrochemical sensor based on cuprous oxide nanoparticles-electrochemically reduced graphene oxide nanocomposites decorated electrode (Cu2O-ErGO/GCE) was developed for the sensitive and selective detection of UA. The Cu2O-ErGO/GCE was prepared by a green and convenient routine that combined the drop-casting method with the electrochemical reduction method. The graphene can effectively load Cu2O NPs and promote the electron transfer between electrode and analytes due to its specific surface area and good conductivity. The proposed sensor shows high electrocatalytic activity towards the oxidation of UA. Moreover, the Cu2O-ErGO/GCE can selectively detect UA even in the presence of high concentrations of DA and AA. Considering its distinct advantages, including simplicity, rapidness, high selective and sensitive as well as good repeatability, reproducibility and stability, the proposed Cu2O-ErGO/GCE shows great potential for the detection of UA in the physiological samples.

Author Contributions

J.N. and J.W. conceived and designed the experiment and drafted the manuscript. M.W. and X.L. carried out the preparation and characterization of nanoparticles. N.H., D.L., G.L. and J.L. tested the electrochemical property. J.N., Q.H. supervised the study and participated in confirmation of the final draft. All authors read and approved the final manuscript.

Funding

This research was funded by the NSFC (No. 21505005 and 61703152), Hunan Provincial Natural Science Foundation (No. 2018JJ2424 and 2018JJ3134), the National Key R&D Program of China (2017YFC1600306), and the Huxiang Youth Talent Support Program (2015RS4051), Project of Science and Technology Plan in Zhuzhou (201706–201806), The key Project of Department of Education of Guangdong Province (2016GCZX008)and Opening Project of Key Discipline of Materials Science in Guangdong (CNXY2017001, CNXY2017002 and CNXY2017003).

Conflicts of Interest

The authors declare no conflict of interest.

References

  1. Alderman, M.; Aiyer, K.J.V. Uric acid: Role in cardiovascular disease and effects of losartan. Curr. Med. Res. Opin. 2004, 20, 369–379. [Google Scholar] [CrossRef] [PubMed]
  2. He, Q.; Liu, J.; Liang, J.; Liu, X.; Li, W.; Liu, Z.; Ding, Z.; Tuo, D. Towards Improvements for Penetrating the Blood–Brain Barrier—Recent Progress from a Material and Pharmaceutical Perspective. Cell 2018, 7, 24. [Google Scholar] [CrossRef] [PubMed]
  3. Marquardt, R.R. A simple spectrophotometric method for the direct determination of uric acid in avian excreta. Poult. Sci. 1983, 62, 2106–2108. [Google Scholar] [CrossRef] [PubMed]
  4. Dai, X.; Fang, X.; Zhang, C.; Xu, R.; Xu, B. Determination of serum uric acid using high-performance liquid chromatography (hplc)/isotope dilution mass spectrometry (id-ms) as a candidate reference method. J. Chromatogr. B 2007, 857, 287–295. [Google Scholar] [CrossRef] [PubMed]
  5. George, S.K.; Dipu, M.T.; Mehra, U.R.; Singh, P.; Verma, A.K.; Ramgaokar, J.S. Improved hplc method for the simultaneous determination of allantoin, uric acid and creatinine in cattle urine. J. Chromatogr. B 2006, 832, 134–137. [Google Scholar] [CrossRef] [PubMed]
  6. Gjorup, S.; Poulsen, H.; Prætorius, E. The uric acid concentration in serum determined by enzymatic spectrophotometry. Scin. J. Clin. Lab. Investig. 1955, 7, 201–203. [Google Scholar] [CrossRef]
  7. Prætorius, E.; Poulsen, H. Enzymatic Determination of Uric Acid with Detailed Directions. Scand. J. Clin. Lab. Investig. 1953, 5, 273–280. [Google Scholar] [CrossRef]
  8. Yu, J.; Wang, S.; Ge, L.; Ge, S. A novel chemiluminescence paper microfluidic biosensor based on enzymatic reaction for uric acid determination. Biosens. Bioelectron. 2011, 26, 3284–3289. [Google Scholar] [CrossRef] [PubMed]
  9. Huang, L.; Jiao, S.; Li, M. Determination of uric acid in human urine by eliminating ascorbic acid interference on copper (ii)-polydopamine immobilized electrode surface. Electrochim. Acta 2014, 121, 233–239. [Google Scholar] [CrossRef]
  10. He, Q.; Li, G.; Liu, X.; Liu, J.; Deng, P.; Chen, D. Morphologically tunable MnO2 nanoparticles fabrication, modelling and their influences on electrochemical sensing performance toward dopamine. Catalysts 2018, 8, 323. [Google Scholar] [CrossRef]
  11. He, Q.; Liu, J.; Liang, J.; Liu, X.; Tuo, D.; Li, W. Chemically Surface Tunable Solubility Parameter for Controllable Drug Delivery—An Example and Perspective from Hollow PAA-Coated Magnetite Nanoparticles with R6G Model Drug. Materials 2018, 11, 247. [Google Scholar] [CrossRef] [PubMed]
  12. He, Q.; Liu, J.; Liu, X.; Li, G.; Deng, P.; Liang, J.; Chen, D. Sensitive and selective detection of tartrazine based on TiO2-electrochemically reduced graphene oxide composite-modified electrodes. Sensors 2018, 18, 1911. [Google Scholar] [CrossRef] [PubMed]
  13. Yan, H.; Xiao, H.; Xie, Q.; Liu, J.; Sun, L.; Zhou, Y.; Zhang, Y.; Chao, L.; Chen, C.; Yao, S. Simultaneous electroanalysis of isoniazid and uric acid at poly(sulfosalicylic acid)/electroreduced carboxylated graphene modified glassy carbon electrode. Sens. Actuators B Chem. 2015, 207, 167–176. [Google Scholar] [CrossRef]
  14. Zheng, X.; Zhou, X.; Ji, X.; Lin, R.; Lin, W. Simultaneous determination of ascorbic acid, dopamine and uric acid using poly(4-aminobutyric acid) modified glassy carbon electrode. Sens. Actuators B Chem. 2013, 178, 359–365. [Google Scholar] [CrossRef]
  15. Lian, Q.; He, Z.; He, Q.; Luo, A.; Yan, K.; Zhang, D.; Lu, X.; Zhou, X. Simultaneous determination of ascorbic acid, dopamine and uric acid based on tryptophan functionalized graphene. Anal. Chim. Acta 2014, 823, 32–39. [Google Scholar] [CrossRef] [PubMed]
  16. Wang, C.; Du, J.; Wang, H.; Zou, C.; Jiang, F.; Yang, P.; Du, Y. A facile electrochemical sensor based on reduced graphene oxide and au nanoplates modified glassy carbon electrode for simultaneous detection of ascorbic acid, dopamine and uric acid. Sens. Actuators B Chem. 2014, 204, 302–309. [Google Scholar] [CrossRef]
  17. Yu, Y.; Chen, Z.; Zhang, B.; Li, X.; Pan, J. Selective and sensitive determination of uric acid in the presence of ascorbic acid and dopamine by pdda functionalized graphene/graphite composite electrode. Talanta 2013, 112, 31–36. [Google Scholar] [CrossRef] [PubMed]
  18. Wang, Y.; Bi, C. Simultaneous electrochemical determination of ascorbic acid, dopamine and uric acid using poly (tyrosine)/functionalized multi-walled carbon nanotubes composite film modified electrode. J. Mol. Liq. 2013, 177, 26–31. [Google Scholar] [CrossRef]
  19. Noroozifar, M.; Khorasani-Motlagh, M.; Jahromi, F.Z.; Rostami, S. Sensitive and selective determination of uric acid in real samples by modified glassy carbon electrode with holmium fluoride nanoparticles/multi-walled carbon nanotube as a new biosensor. Sens. Actuators B Chem. 2013, 188, 65–72. [Google Scholar] [CrossRef]
  20. Wang, Z.; Xia, J.; Zhu, L.; Zhang, F.; Guo, X.; Li, Y.; Xia, Y. The fabrication of poly (acridine orange)/graphene modified electrode with electrolysis micelle disruption method for selective determination of uric acid. Sens. Actuators B Chem. 2012, 161, 131–136. [Google Scholar] [CrossRef]
  21. Wang, G.; Meng, J.; Liu, H.; Jiao, S.; Zhang, W.; Chen, D.; Fang, B. Determination of uric acid in the presence of ascorbic acid with hexacyanoferrate lanthanum film modified electrode. Electrochim. Acta 2008, 53, 2837–2843. [Google Scholar] [CrossRef]
  22. Ojani, R.; Raoof, J.-B.; Maleki, A.A.; Safshekan, S. Simultaneous and sensitive detection of dopamine and uric acid using a poly(l-methionine)/gold nanoparticle-modified glassy carbon electrode. Chin. J. Catal. 2014, 35, 423–429. [Google Scholar] [CrossRef]
  23. Chen, K.; Wang, M.; Li, G.; He, Q.; Liu, J.; Li, F. Spherical α-MnO2 Supported on N-KB as Efficient Electrocatalyst for Oxygen Reduction in Al–Air Battery. Materials 2018, 11, 601. [Google Scholar] [CrossRef] [PubMed]
  24. Wang, M.; Chen, K.; Liu, J.; He, Q.; Li, G.; Li, F. Efficiently Enhancing Electrocatalytic Activity of α-MnO2 Nanorods/N-Doped Ketjenblack Carbon for Oxygen Reduction Reaction and Oxygen Evolution Reaction Using Facile Regulated Hydrothermal Treatment. Catalysts 2018, 8, 138. [Google Scholar] [CrossRef]
  25. Akimoto, K.; Ishizuka, S.; Yanagita, M.; Nawa, Y.; Paul, G.K.; Sakurai, T. Thin film deposition of Cu2O and application for solar cells. Sol. Energy 2006, 80, 715–722. [Google Scholar] [CrossRef]
  26. Poizot, P.; Laruelle, S.; Grugeon, S.; Dupont, L.; Tarascon, J.-M. Cheminform abstract: Nano-sized transition-metal oxides as negative-electrode materials for lithium-ion batteries. ChemInform 2001, 32, 496–499. [Google Scholar] [CrossRef]
  27. Zhang, H.; Zhu, Q.; Zhang, Y.; Wang, Y.; Zhao, L.; Yu, B. Inside front cover: One-pot synthesis and hierarchical assembly of hollow Cu2O microspheres with nanocrystals-composed porous multishell and their gas-sensing properties. Adv. Funct. Mater. 2007, 17, 2766–2771. [Google Scholar] [CrossRef]
  28. Hua, Q.; Shang, D.; Zhang, W.; Chen, K.; Chang, S.; Ma, Y.; Jiang, Z.; Yang, J.; Huang, W. Morphological evolution of Cu2O nanocrystals in an acid solution: Stability of different crystal planes. Langmuir 2011, 27, 665–671. [Google Scholar] [CrossRef] [PubMed]
  29. Xu, F.; Deng, M.; Li, G.; Chen, S.; Wang, L. Electrochemical behavior of cuprous oxide–reduced graphene oxide nanocomposites and their application in nonenzymatic hydrogen peroxide sensing. Electrochim. Acta 2013, 88, 59–65. [Google Scholar] [CrossRef]
  30. Li, Y.; Zhong, Y.; Zhang, Y.; Weng, W.; Li, S. Carbon quantum dots/octahedral Cu2O nanocomposites for non-enzymatic glucose and hydrogen peroxide amperometric sensor. Sens. Actuators B Chem. 2015, 206, 735–743. [Google Scholar] [CrossRef]
  31. Cao, H.; Yang, A.; Li, H.; Wang, L.; Li, S.; Kong, J.; Bao, X.; Yang, R. A non-enzymatic glucose sensing based on hollow cuprous oxide nanospheres in a nafion matrix. Sens. Actuators B Chem. 2015, 214, 169–173. [Google Scholar] [CrossRef]
  32. Yuan, B.; Xu, C.; Liu, L.; Zhang, Q.; Ji, S.; Pi, L.; Zhang, D.; Huo, Q. Cu2O/NiOx/graphene oxide modified glassy carbon electrode for the enhanced electrochemical oxidation of reduced glutathione and nonenzyme glucose sensor. Electrochim. Acta 2013, 104, 78–83. [Google Scholar] [CrossRef]
  33. Zhang, F.; Li, Y.; Gu, Y.; Wang, Z.; Wang, C. One-pot solvothermal synthesis of a Cu2O/graphene nanocomposite and its application in an electrochemical sensor for dopamine. Microchim. Acta 2011, 173, 103–109. [Google Scholar] [CrossRef]
  34. He, Q.; Liu, J.; Liu, X.; Li, G.; Deng, P.; Liang, J. Preparation of Cu2O-Reduced Graphene Nanocomposite Modified Electrodes towards Ultrasensitive Dopamine Detection. Sensors 2018, 18, 199. [Google Scholar] [CrossRef] [PubMed]
  35. He, Q.; Liu, J.; Liu, X.; Li, G.; Chen, D.; Deng, P.; Liang, J. Fabrication of Amine-Modified Magnetite-Electrochemically Reduced Graphene Oxide Nanocomposite Modified Glassy Carbon Electrode for Sensitive Dopamine Determination. Nanomaterials 2018, 8, 194. [Google Scholar] [CrossRef] [PubMed]
  36. Ye, X.; Gu, Y.; Wang, C. Fabrication of the Cu2O/polyvinyl pyrrolidone-graphene modified glassy carbon-rotating disk electrode and its application for sensitive detection of herbicide paraquat. Sens. Actuators B Chem. 2012, 173, 530–539. [Google Scholar] [CrossRef]
  37. Zhang, X.; Wang, G.; Gu, A.; Wu, H.; Fang, B. Preparation of porous Cu2O octahedron and its application as l-tyrosine sensors. Solid State Commun. 2008, 148, 525–528. [Google Scholar] [CrossRef]
  38. Ning, J.; He, Q.; Luo, X.; Wang, M.; Liu, D.; Wang, J. Rapid and Sensitive Determination of Vanillin Based on a Glassy Carbon Electrode Modified with Cu2O-Electrochemically Reduced Graphene Oxide Nanocomposite Film. Sensors 2018, 18, 2762. [Google Scholar] [CrossRef] [PubMed]
  39. He, Q.; Liu, J.; Liu, X.; Xia, Y.; Li, G.; Deng, P.; Chen, D. Novel Electrochemical Sensors Based on Cuprous Oxide-Electrochemically Reduced Graphene Oxide Nanocomposites Modified Electrode toward Sensitive Detection of Sunset Yellow. Molecules 2018, 23, 2130. [Google Scholar] [CrossRef] [PubMed]
  40. Shishiyanu, S.T.; Shishiyanu, T.S.; Lupan, O.I. Novel NO2 gas sensor based on cuprous oxide thin films. Sens. Actuators B Chem. 2006, 113, 468–476. [Google Scholar] [CrossRef]
  41. Geim, A.K. Graphene: Status and prospects. Science 2009, 324, 1530–1534. [Google Scholar] [CrossRef] [PubMed]
  42. Long, J.; Dong, J.; Wang, X.; Ding, Z.; Zhang, Z.; Wu, L.; Li, Z.; Fu, X. Photochemical synthesis of submicron- and nano-scale Cu2O particles. J. Colloid Interface Sci. 2009, 333, 791–799. [Google Scholar] [CrossRef] [PubMed]
  43. Laviron, E. Adsorption, autoinhibition and autocatalysis in polarography and in linear potential sweep voltammetry. J. Electroanal. Chem. Interfacial Electrochem. 1974, 52, 355–393. [Google Scholar] [CrossRef]
Scheme 1. The reaction mechanism of UA.
Catalysts 08 00407 sch001
Figure 1. SEM photos of (A) Cu2O nanoparticles; (B) GO nanosheets at low magnification and at high magnification (inset); and (C) Cu2O-ErGO composites.
Catalysts 08 00407 g001
Figure 2. CVs of 10 μM UA at different electrodes measured in 0.1 M PBS (pH of 3.0); (a) GCE, (b) GO/GCE, (c) ErGO/GCE and (d) Cu2O-ErGO/GCE. Accumulation potential: −0.2 V, accumulation time: 30 s and sweep rate: 0.1 V s−1.
Catalysts 08 00407 g002
Figure 3. The influence of pH on the voltammetric response of 10 μM UA on Cu2O-ErGO/GCE. The plots of the Epa against pH (a) and Ipa against pH (b). Supporting electrolyte: 0.1 M PBS; Accumulation potential: −0.2 V, accumulation time: 30 s and scan rate: 0.1 V s−1.
Catalysts 08 00407 g003
Figure 4. CVs of 10 μM UA at Cu2O-ErGO/GCE measured at various sweep rates (From a to j: 0.02, 0.04, 0.06, 0.08, 0.10, 0.12, 0.14, 0.16, 0.18 and 0.2 V s−1, respectively). The inset contains the plots of the peak current against sweep rate (left) and the peak potential against Napierian logarithm of sweep rate (right).
Catalysts 08 00407 g004
Figure 5. The influence of accumulation potential (A, accumulation time = 120 s) and accumulation time (B, accumulation potential = 120 s) on the peak current of 10 μM UA. Sweep rate: 0.1 V s−1.
Catalysts 08 00407 g005
Figure 6. SDLSV recorded on the Cu2O-ErGO/GCE in 0.1 M PBS (pH = 3.0) containing various concentrations of UA. (A) From inner to outer: 1, 2, 4, 6, 8 and 10 μM; (B) From inner to outer: 0.1, 0.2, 0.4, 0.6, 0.8 and 1.0 μM; (C) From inner to outer: 0.002, 0.004, 0.006, 0.008, 0.01, 0.02, 0.04, 0.06, 0.08 and 0.10 μM; (D) Linear relationship between the oxidation peak currents and the concentration of UA: (a) 0.6~10 μM and (b) 0.002~0.6 μM. Accumulation at −0.2 V for 120 s; Sweep rate: 0.1 V s −1.
Catalysts 08 00407 g006
Figure 7. (A) CV measured on the bare GCE (a), ErGO/GCE (b) and Cu2O-ErGO/GCE (c) in 0.1 M PBS (pH = 3.0) containing the mixture of 1.0 mM AA, 50 μM DA and 10 μM UA; (B) SDLSV of the mixture of 1.0 mM AA, 50 μM DA and 10 μM UA obtained at Cu2O-ErGO/GCE.
Catalysts 08 00407 g007
Table 1. Characteristics of various voltammetric sensors for the detection of uric acid.
ElectrodesTechniquesSupporting ElectrolyteWorking PotentialLinear Range/μMDetection Limit/μMRepeatability (RSD%)StabilityRef.
a PD-Cu(II)/GCEl DPV0.1 M o PBS (pH 7.5)+0.4 V vs. SCE60–168024.61.65.8% loss after 28 days[12]
b PSA-ERCG/GCEDPV0.1 M NH3-NH4Cl (pH 9.0)+0.016 V vs. SCE0.02–150.0122.810% loss after 2 weeks[13]
c P-4-ABA/GCEDPV0.2 M PBS (pH 4.5)+0.576 V vs. Ag/AgCl1.0–80.00.53.12.3% loss after 1 week[14]
d Trp-GR/GCEDPV0.1 M PBS (pH 7.0)+0.355 V vs. Ag/AgCl10–10001.245.922.77% loss after 1 week and 6.91% in 2 weeks[15]
e Au-RGO/GCEDPV0.1 M PBS (pH 7.0)+0.26 V vs. SCE8.8–531.82.05% loss after 1 week[16]
f PDDA-G/CPEDPV0.1 M PBS (pH 7.0)+0.18 V vs. Ag/AgCl0.5–200.083.610.1% loss after 20 days[17]
g poly (Tyr)/MWCNTs-COOH/GCEDPV0.1 M PBS (pH 7.4)+0.30 V vs. SCE1.0–3500.303.0Not mentioned[18]
h MWCNT–HoFNPs–CH/GCEm CV0.1 M p DCAABS (pH 1.0)+0.605 V vs. SCE0.2–500.00.161.19No significant change after 6 months[19]
i PAO/GH/GCEDPV0.1 M PBS (pH 6.5)+0.260 V vs. SCE0.1–10000.022.27.0% loss after 1 month[20]
j LaHCF/GCEDPV0.1 M PBS (pH 7.0)+0.432 V vs. SCE0.2–1000.1Not mentionedNot mentioned[21]
k Nano-Au-PMT/GCEDPV0.1 M PBS (pH 7.0)+0.37 V vs. SCE0.07–1.00.045Not mentioned12.0% loss after 2 weeks[22]
Cu2O-ErGO/GCEn LSV0.1 M PBS (pH 3.0)0.561 V vs. SCE0.002–0.6, 0.6–100.0012.27.6% loss after 2 weeksThis work
a PD-Cu(II)/GCE: polydopamine-Cu(II)-modified glassy carbon electrode; b PSA-ERCG/GCE: poly(sulfosalicylic acid) and electroreduced carboxylated graphene-modified glassy carbon electrode; c P-4-ABA/GCE: poly(4-aminobutyric acid)-modified glassy carbon electrode; d Trp-GR/GCE: tryptophan-functionalized graphene nanocomposite-modified glassy carbon electrode; e Au-RGO/GCE: Au nanoplates and reduced graphene oxide-modified glassy carbon electrode; f PDDA-G/CPE: poly(diallyldimethylammonium chloride)-functionalized graphene modified carbon paste electrode; g poly (Tyr)/MWCNTs-COOH/GCE: poly (tyrosine)-functionalized multi-walled carbon nanotubes composite film-modified glassy carbon electrode; h MWCNT–HoFNPs–CH/GCE: multiwalled carbon nanotubes–holmium fluoride nanoparticles–chitosan composite film-modified glassy carbon electrode; i PAO/GH/GCE: poly (acridine orange)/graphene-modified glassy carbon electrode; j LaHCF/GCE: hexacyanoferrate lanthanum film-modified glassy carbon electrode; k Nano-Au-PMT/GCE: poly(L-methionine)/gold nanoparticle-modified glassy carbon electrode; l DPV: differential pulse voltammetry; m CV: cyclic voltammetry; n LSV: linear sweep voltammetry; o PBS: phosphate buffer solution; p DCAABS: dichloroacetic acid buffer solution.
Table 2. Determination of uric acid in human serum and urine samples.
Samplesa Detected/μMAdded/μMTotal Found/μMRecovery/%b Content Detected/mM
urine 13.488 (±0.084)3.06.527 (±0.144)101.31.744 (±0.042)
urine 23.637 (±0.087)4.07.535 (±0.165)97.51.819 (±0.044)
urine 35.142 (±0.118)5.010.046 (±0.210)98.12.571 (±0.059)
serum 12.483 (±0.065)2.04.522 (±0.108)102.00.248 (±0.006)
serum 24.336 (±0.095)4.08.446 (±0.186)102.80.434 (±0.010)
serum 33.210 (±0.067)3.06.162 (±0.142)98.40.321 (±0.007)
a The results are expressed as mean value ± S.D. based on four replicates (n = 4). b The value of content is obtained by multiplying the detected value by the dilution factor of 100 for serum samples and 500 for urine samples.

