Article

Catalyst Deactivation and Regeneration Processes in Biogas Tri-Reforming Process. The Effect of Hydrogen Sulfide Addition

by
Urko Izquierdo
1,*,
Iker García-García
1,
Ángel María Gutierrez
2,
Juan Ramón Arraibi
2,
Victoria Laura Barrio
1,
José Francisco Cambra
1 and
Pedro Luis Arias
1
1
Faculty of Engineering, University of the Basque Country (UPV-EHU), 48013 Bilbao, Spain
2
Edp Naturgas Energía, c/General Concha, 20, 48010 Bilbao, Spain
*
Author to whom correspondence should be addressed.
Catalysts 2018, 8(1), 12; https://doi.org/10.3390/catal8010012
Submission received: 22 September 2017 / Revised: 3 January 2018 / Accepted: 4 January 2018 / Published: 9 January 2018

Abstract

:
This work studies Ni-based catalyst deactivation and regeneration processes in the presence of H2S under a biogas tri-reforming process for hydrogen production, which is an energy vector of great interest. 25 ppm of hydrogen sulfide were continuously added to the system in order to provoke an observable catalyst deactivation, and once fully deactivated two different regeneration processes were studied: a self-regeneration and a regeneration by low temperature oxidation. For that purpose, several Ni-based catalysts and a bimetallic Rh-Ni catalyst supported on alumina modified with CeO2 and ZrO2 were used as well as a commercial Katalco 57-5 for comparison purposes. Ni/Ce-Al2O3 and Ni/Ce-Zr-Al2O3 catalysts almost recovered their initial activity. For these catalysts, after the regeneration under oxidative conditions at low temperature, the CO2 conversions achieved—79.5% and 86.9%, respectively—were significantly higher than the ones obtained before sulfur poisoning—66.7% and 45.2%, respectively. This effect could be attributed to the support modification with CeO2 and the higher selectivity achieved for the Reverse Water-Gas-Shift (rWGS) reaction after catalysts deactivation. As expected, the bimetallic Rh-Ni/Ce-Al2O3 catalyst showed higher resistance to deactivation and its sulfur poisoning seems to be reversible. In the case of the commercial and Ni/Zr-Al2O3 catalysts, they did not recover their activity.

1. Introduction

Nowadays fossil fuels are still the main contributor to the energy mix, nevertheless all countries need a sustainable, clean, safe, reliable and guaranteed energy supply. The current energy system presents evident negative environmental impacts—with an increase of carbon dioxide emissions—that now is showing clear signs of exhaustion [1]. Therefore, the need for sustainable energy resources is very clear in order to decrease global climate change [2].
Thus, biogas provides solutions to the problems associated with the use of fossil fuels as well as to the ones derived from increasing energy consumption [3,4]. Biogas production is a low-carbon technology for the conversion of organic compounds that could replace natural gas and fossil fuels [5,6]. In the case of the United States, the use of biogas for transport has increased noticeably and in Europe is gaining market share in the transport fuel mix. However, there are many problems for the transportation sector, such as the lack of regulations to access the natural gas grids, or the decentralized production of the biogas [7,8]. In this sense, biogas can be used to produce a clean energy vector for production of sustainable energy such as hydrogen. The hydrogen commercial production processes from hydrocarbons comprise steam reforming (SR), partial oxidation (POX), and autothermal reforming (ATR). A tri-reforming process is the combination of endothermic dry and steam reforming with the exothermic oxidation in one step, and it has gained increasing attention [9]. Indeed, the occurrence of these reactions can help to overcome coke deactivation [10].
The tri-reforming process consists of the combination of water and oxygen with biogas, the following being the most important reactions involved:
Dry reforming (DR): CH4 + CO2 ↔ 2CO + 2H2 (ΔH0 = 247 kJ/mol)
Steam methane reforming (SMR): CH4 + H2O ↔ CO + 3H2 (ΔH0 = 206 kJ/mol)
Catalytic partial oxidation (CPO): CH4 + 1/2O2 → CO + 2H2 (ΔH0 = −36 kJ/mol)
Reverse Water-Gas-Shift (rWGS): CO2 + H2 ↔ CO + H2O (ΔH0 = 41 kJ/mol)
In addition, the following coke formation reactions can occur during the process:
Methane decomposition (MD): CH4 ↔ C + 2H2 (ΔH0 = 75 kJ/mol)
CO reduction (CO-R): CO + H2 ↔ C + H2O (ΔH0 = −131 kJ/mol)
Boudouard (B): 2CO ↔ C + CO2 (ΔH0 = 172 kJ/mol)
For the catalysts employed in the tri-reforming process, the most used metal is Ni due to its performance, although it deactivates quickly by coking. This is the reason why different supports have been tested in order to achieve a stable performance [11]. Vita et al. achieved an improvement in the methane tri-reforming reaction by the addition of La to the Ni/CeO2 catalytic system and afterwards, a high activity and stability for biogas tri-reforming using a Ni-based ceria-lanthana catalyst. This was due to the interactions of the nickel–lanthana–surface oxygen vacancies of ceria that enhanced the nickel dispersion [9] for a synthetic biogas without contaminants.
Through biogas tri-reforming, appropriate synthesis of gas composition for the Fischer-Tropsch process can also be obtained [12]. However, one of the major technological challenges is to develop catalysts that are able to tolerate contaminants such as hydrogen sulfide and siloxanes as reported by Nahar et al. [13]. In addition, the regeneration of these catalysts when they suffer deactivation is of great interest because these contaminants are common when biogas is produced from landfill material, animal manure, wastewater, and industrial or commercial organic waste. Rasi et al. reported that the amount of hydrogen sulfide in a landfill gas varied from 36 ppm to 115 ppm and in a farm biogas from 32 ppm to 169 ppm, while hydrogen sulfide was not detected in the gas from the sewage digester [14].
There are several studies related to the sulfur deactivation phenomenon in existing biogas-reforming processes. Regarding the biogas dry reforming process, Saha et al. studied the performance of non-precious metal-based catalysts for sulfur tolerance using Ni monometallic and Ni-Co bimetallic catalysts supported on alumina [15]. Indeed, related to the CO2/CH4 ratio study, the influence of the operating temperature and the H2S amount introduced were also taken into account. In this case, the results showed quite stable and active behavior for at least 6 h of operation. Chattanathan et al. studied the effect of H2S on CH4 conversion with a commercial catalyst, but quick deactivation was measured and no data about the catalyst composition was offered [16]. Among the literature available regarding sulfur deactivation under the biogas steam reforming process, Appari et al. studied the deactivation and regeneration of a Ni catalyst during steam reforming of model biogas. These experimental investigations were focused on the activity and regeneration processes of a self-prepared catalyst, obtaining low deactivation curves and successful regeneration process by steam treatment [17]. However, there are no experimental results available, to the best of our knowledge, about the effect of sulfur poisoning operating under a biogas tri-reforming process.
Therefore, operating the appropriate catalysts selection with sulfur, especially the active metals used, is one of the most important and challenging issues. Hulteberg reported that noble metals display almost one order of magnitude lower number of sulfides formation rate at a given hydrogen-to-hydrogen sulfide ratio [18]. These considerations have been taken into account to select the corresponding Ni monometallic and Rh-Ni bimetallic catalysts supported on γ-Al2O3. In addition, Hulteberg’s work shows a new regeneration process, which to the best of our knowledge has not been studied before: regeneration by oxidation at low temperature, which is difficult for sulfur-laden gas streams.
In previous studies, a model biogas consisting of methane and carbon dioxide was used [19]. In this work, special emphasis was dedicated to study the influence of hydrogen sulfide on catalyst activity and to a posterior catalyst regeneration through several processes [20,21]: the self-regeneration process and the regeneration by low temperature oxidation processes. For this reason, Ni was selected, and the γ-Al2O3 support was modified with ceria and zirconia and a noble metal, Rh, to improve catalyst stability.
In addition, deactivation and subsequent regeneration were studied in order to compare the two regeneration processes, in terms of the activities achieved for fresh and regenerated catalysts and the surface properties (determined by X-ray photoelectron spectroscopy (XPS)) of the deactivated catalysts after a second deactivation. To carry out this study, a fixed bed reaction system was used. Therefore, the main objective of this work was to test the feasibility of tri-reforming catalyst regeneration when sulfur poisoning occurs.

2. Results and Discussion

2.1. Fresh and Reduced Catalysts Characterization

Regarding the physico-chemical properties of the catalysts, a specific surface area (SSA) of 255 m2/g was measured for the commercial bare γ-Al2O3·support. As it is observed in Table 1, when modifiers were incorporated in the γ-Al2O3·support, the SSA decreased. Then, when metals were added in order to prepare the corresponding catalysts, the SSA value decreased even more. However, regarding the measured pore diameter (PD), the values of both unreduced catalysts and supports were similar, which could be because of the relatively low metal loadings (~10 wt. %) and good dispersion of the metals on the supports. In Table 1, the textural characterization of the catalysts under investigation is shown.
Reduced catalysts’ physico-chemical properties were also determined for the Ni/Ce-Al2O3, Ni/Ce-Zr-Al2O3, and Rh-Ni/Ce-Al2O3 (see Table 1) in order to observe possible differences between calcined and reduced catalysts. For that purpose, the samples were reduced following the same procedure as in the experiments (see Section 3.2). In general, when catalysts were reduced the surface area, pore volume and pore diameter decreased significantly. However, the surface area of the Ni/Ce-Zr-Al2O3 catalyst decrased only slightly, and its pore diameter increased while its pore volume remained constant.
In Table 2, calcined catalysts elemental compositions (ICP-OES), H2-chemisorption, and XRD results are summarized. Regarding the metal composition determined by ICP-OES, similar values to the intended ones were measured for all the catalysts prepared. However, the largest differences were more evident with the catalysts containing Ce. This can be related to dissolution processes of the samples previous to analysis by ICP-OES. For ICP-OES analysis, a solution that consisted of HCl, HNO3, and HF was employed for Ni, Rh, Zr and Ca quantification. In the case of Ce, however, it was not possible to detect it due to CeF2 precipitate formation. For Ce quantification, a solution consisting of H2O2 and HNO3 was used instead [22]. After preparing the corresponding solutions, the catalysts were dissolved using a digester and thereafter analyzed in an ICP-OES instrument. Despite this, small particles of the catalysts could still remain in solid state (not being perceptible), and therefore, not measured.
Using the hydrogen chemisorption technique, the highest metal surface area (MSA) and dispersion (D) were measured for the bimetallic catalysts. It has been reported that the addition of a small amount of noble metals to non-noble metal catalysts improves the previously mentioned properties due to the spillover effect [23,24], and this was evident with the Rh-Ni/Ce-Al2O3 catalyst. Therefore, higher catalytic activity is expected with this catalyst. Finally, from XRD, smaller Ni crystal sizes were measured for all the catalysts under investigation, when compared to the ones measured by H2 chemisorption. The observed differences could be related to Ni particles sintering during the reduction at high temperature for the samples analyzed by H2 chemisorption. It is well known that the dispersion of the particles onto the surface of the supports increases when small particles are obtained. Therefore, the highest metal dispersion and surface area measured for the bimetallic catalysts indicates the formation of smaller particles in this catalyst. Therefore, it is expected that the Rh-Ni/Ce-Al2O3 catalyst would have more active sites available for conversion of CH4, CO2, and CO to produce hydrogen.
In addition to the above techniques, TPR profiles for all the catalysts have also been previously published [19,25] (see Figure A2), showing slight differences among the catalysts under investigation. One significant difference is that with the commercial catalyst, Katalco 57-5, four different reduction peaks were detected, the biggest one being at 1048 K. For the rest of the monometallic and bimetallic catalysts, the main reduction peaks appeared in the range 900 K to 1200 K. Different reduction peaks were observed for the promoted supports. For Ce-Zr-Al2O3, Ce-Al2O3 and Zr-Al2O3 supports contributions were measured at 690 K, 880 K, 1000 K and 1170 K. For all of them very small peaks were observed. When calcined catalysts and calcined supports profiles are compared, lower H2 consumption is observed for the calcined supports.
The main peaks of Ni/Zr-Al2O3, Ni/Ce-Zr-Al2O3 and Ni/Ce-Al2O3 catalysts appeared at 1103 K, 1105 K and 1108 K, respectively. Thus, this is a possible indication of Ce reduction taking place at higher temperatures than Zr reduction. If Ni/Ce-Al2O3 and Rh-Ni/Ce-Al2O3 catalysts are compared, a lower reduction temperature was needed for the latter (1079 K). This could be related to the “spill over” effect, which improved the nickel reducibility [26]. According to the literature, these broad peaks can be attributed to the contribution of three different species. The peaks around 950 K are attributed to the reduction of NiO-Al species weakly interacting with the alumina support, while the reduction peaks reported at higher temperatures are related to the reduction of highly dispersed non-stoichiometric amorphous nickel aluminate spinels (at around 1050 K) and to a diluted NiAl2O4-like phase (at 1100 K) [27].

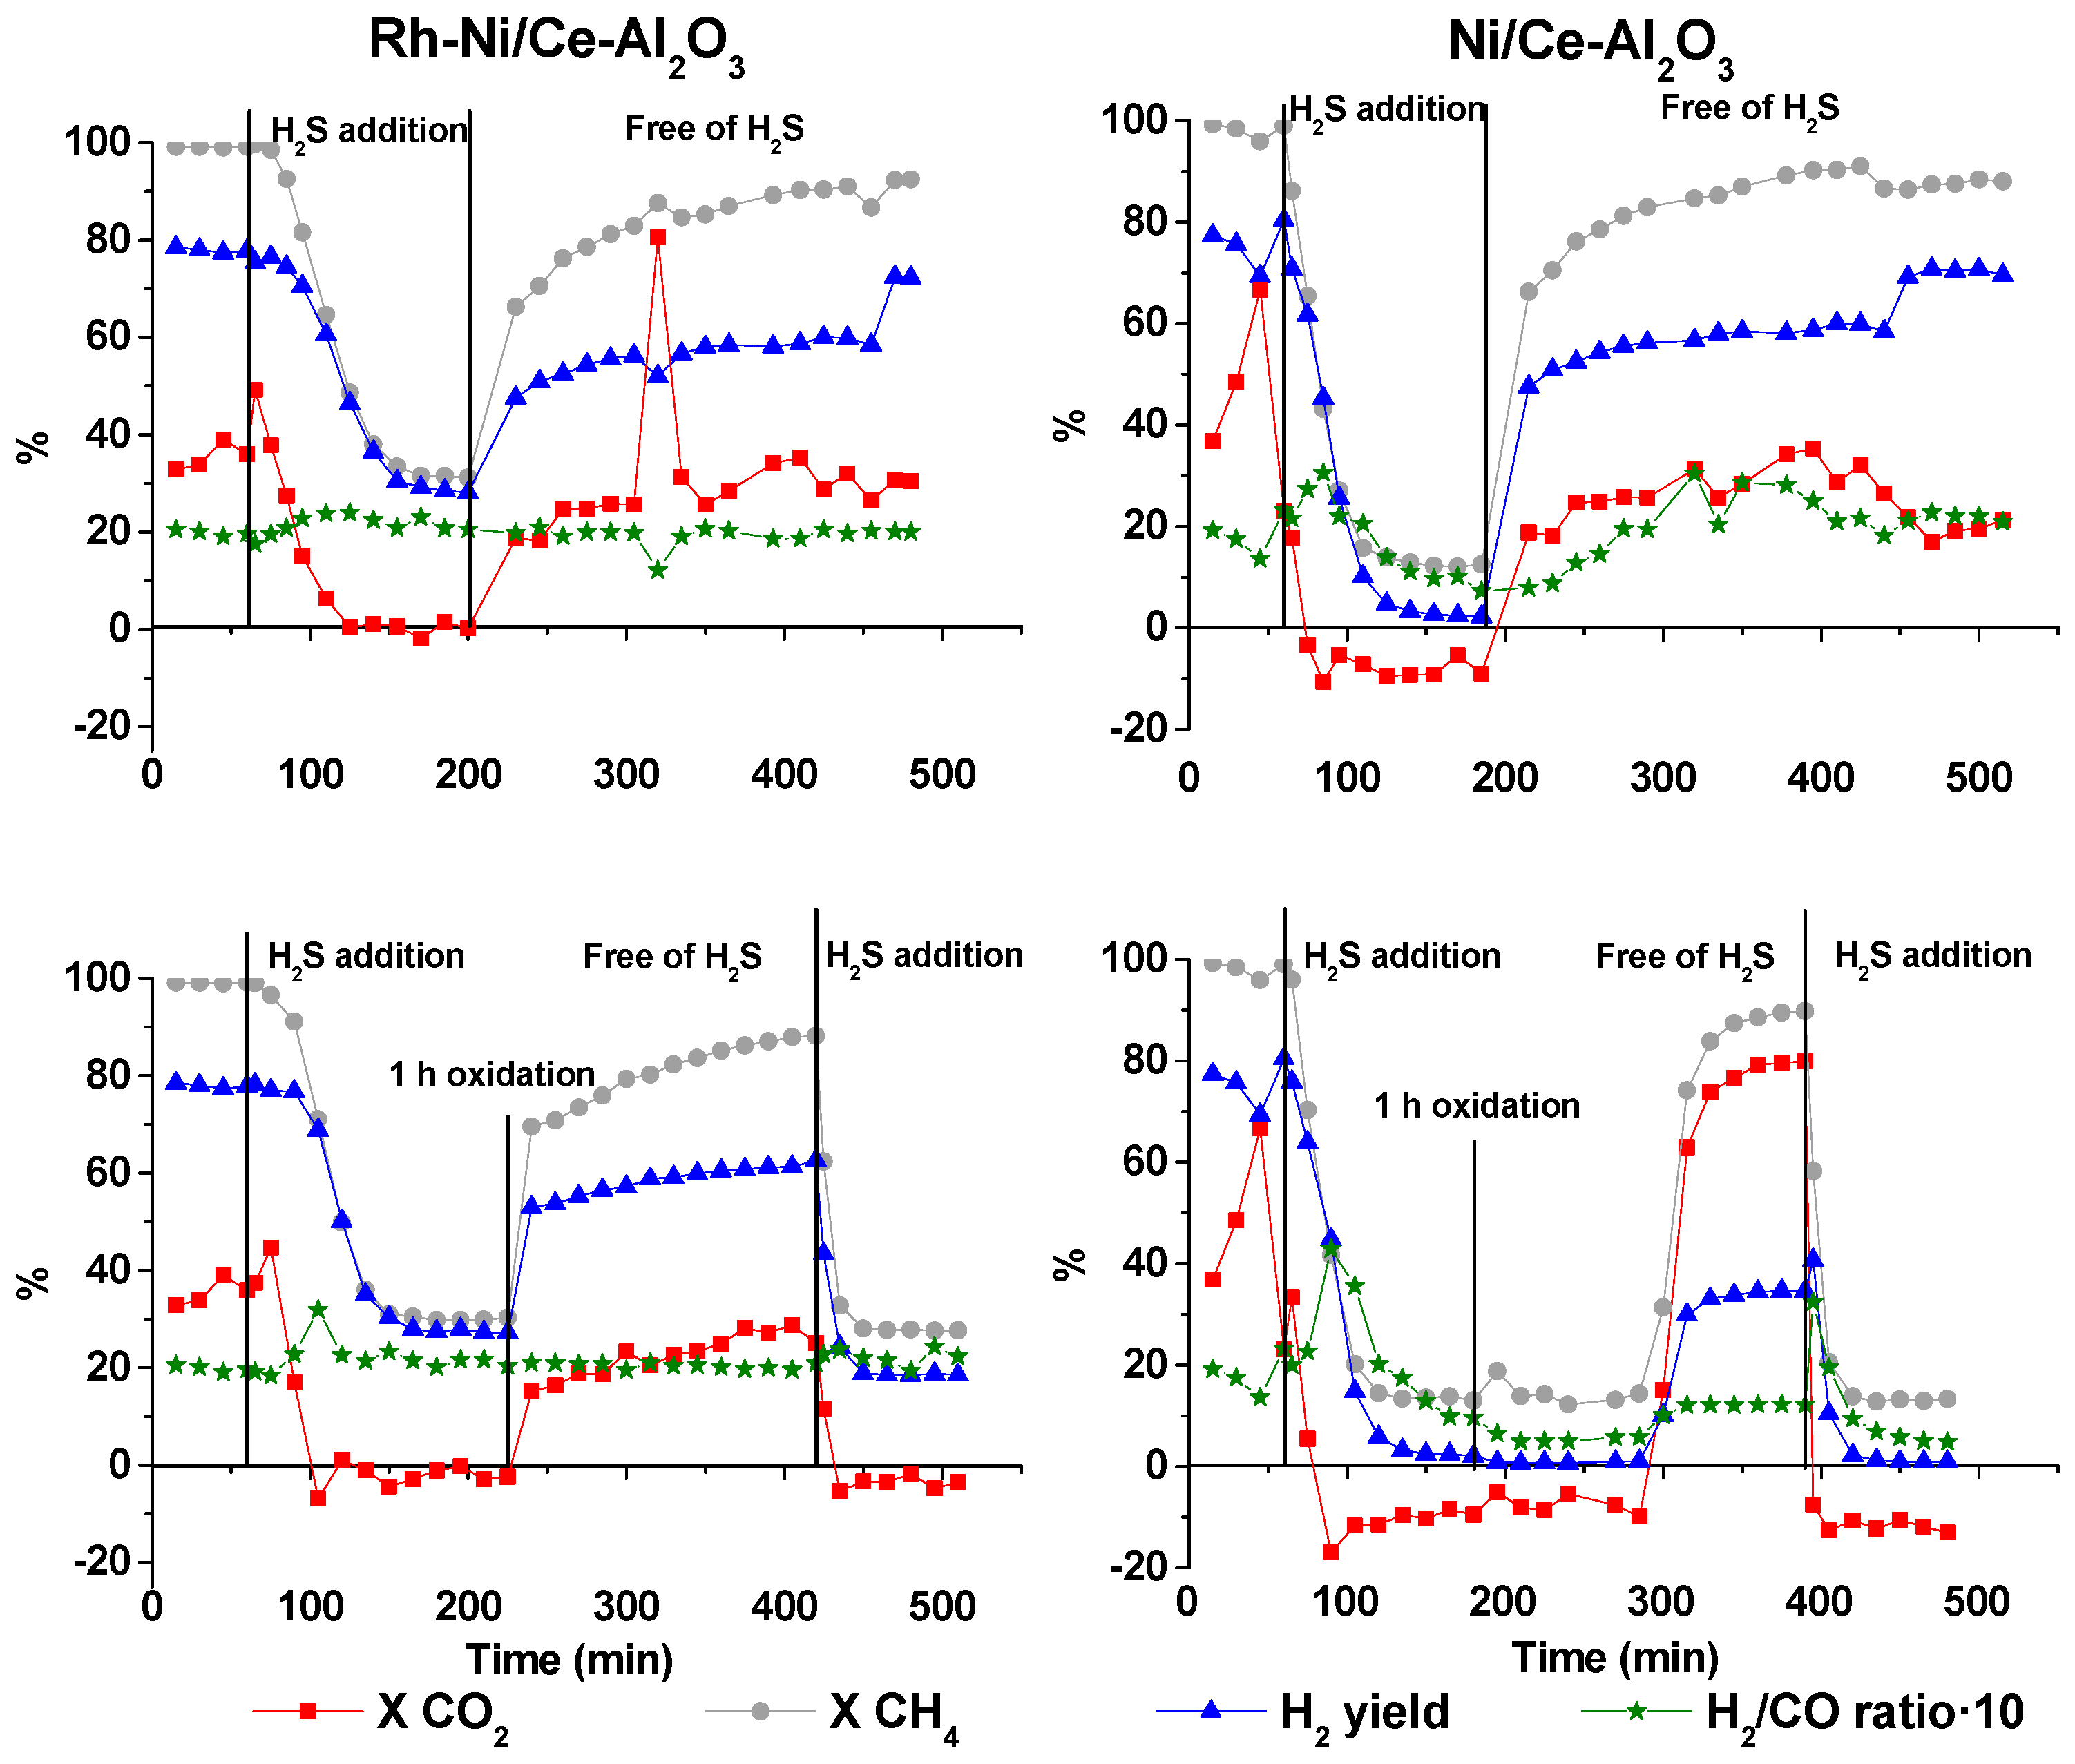
2.2. Activity Results

Once the characterization of the fresh catalysts was performed, the activity experiments were carried out using a Microactivity plant (see Section 3.2). The experimental conditions of the tests were selected based on the results obtained in a previous work of the authors [7], steam to carbon, H2O/C = 1.0 and oxygen to carbon, O/C = 0.25 (molar ratio). These results were again reproduced by all the catalysts under investigation by reaching very high conversions, near to the ones predicted by thermodynamic equilibrium (at 800 °C and 1 atm: XCH4 = 99.6, XCO2 = 34.7, H2 yield = 75.2). The Katalco 57-5 catalyst was used to establish the appropriate hydrogen sulfide concentration to the feed that would allow study of the deactivation phenomenon. To achieve this, a slow deactivation was targeted, in order to observe the deactivation curve and the resistance of the catalysts. Therefore, after one hour of stable operation under tri-reforming conditions, different H2S concentrations were continuously added to the system.
When 1.0%, 0.5%, 0.1%, 100 ppm, and 50 ppm (vol %) of H2S were constantly added to the system, it was not possible to observe the deactivation curves because this process was very fast. Finally, it was possible to observe the catalysts deactivation phenomena by adding continuously 25 ppm of H2S to the system. Therefore, the H2S concentration of 25 ppm was selected to provoke the deactivation by sulfur for the rest of the catalysts under investigation. Once the catalysts were fully deactivated, the self-regeneration and oxidation regeneration processes were studied.
The self-regeneration consisted of just removing the continuously fed H2S from the system until a stable activity was measured. For the regeneration by oxidation, the temperature was set at 873 K to feed a synthetic air stream for 1 h to the system after switching off all the reactant gases. Then, the experiments continued under the same initial tri-reforming conditions, free of H2S. The activity results obtained are presented in Figure 1, Figure 2 and Figure 3, and which are described below.
For all the catalysts under investigation, higher methane conversion was measured than carbon dioxide conversion because carbon dioxide is only consumed though the DR reaction, which is the most endothermic reaction, and SMR, CPO and WGS are more favorable, which is consistent with the observed high H2/CO ratios. This was expected from the thermodynamic equilibrium trends.

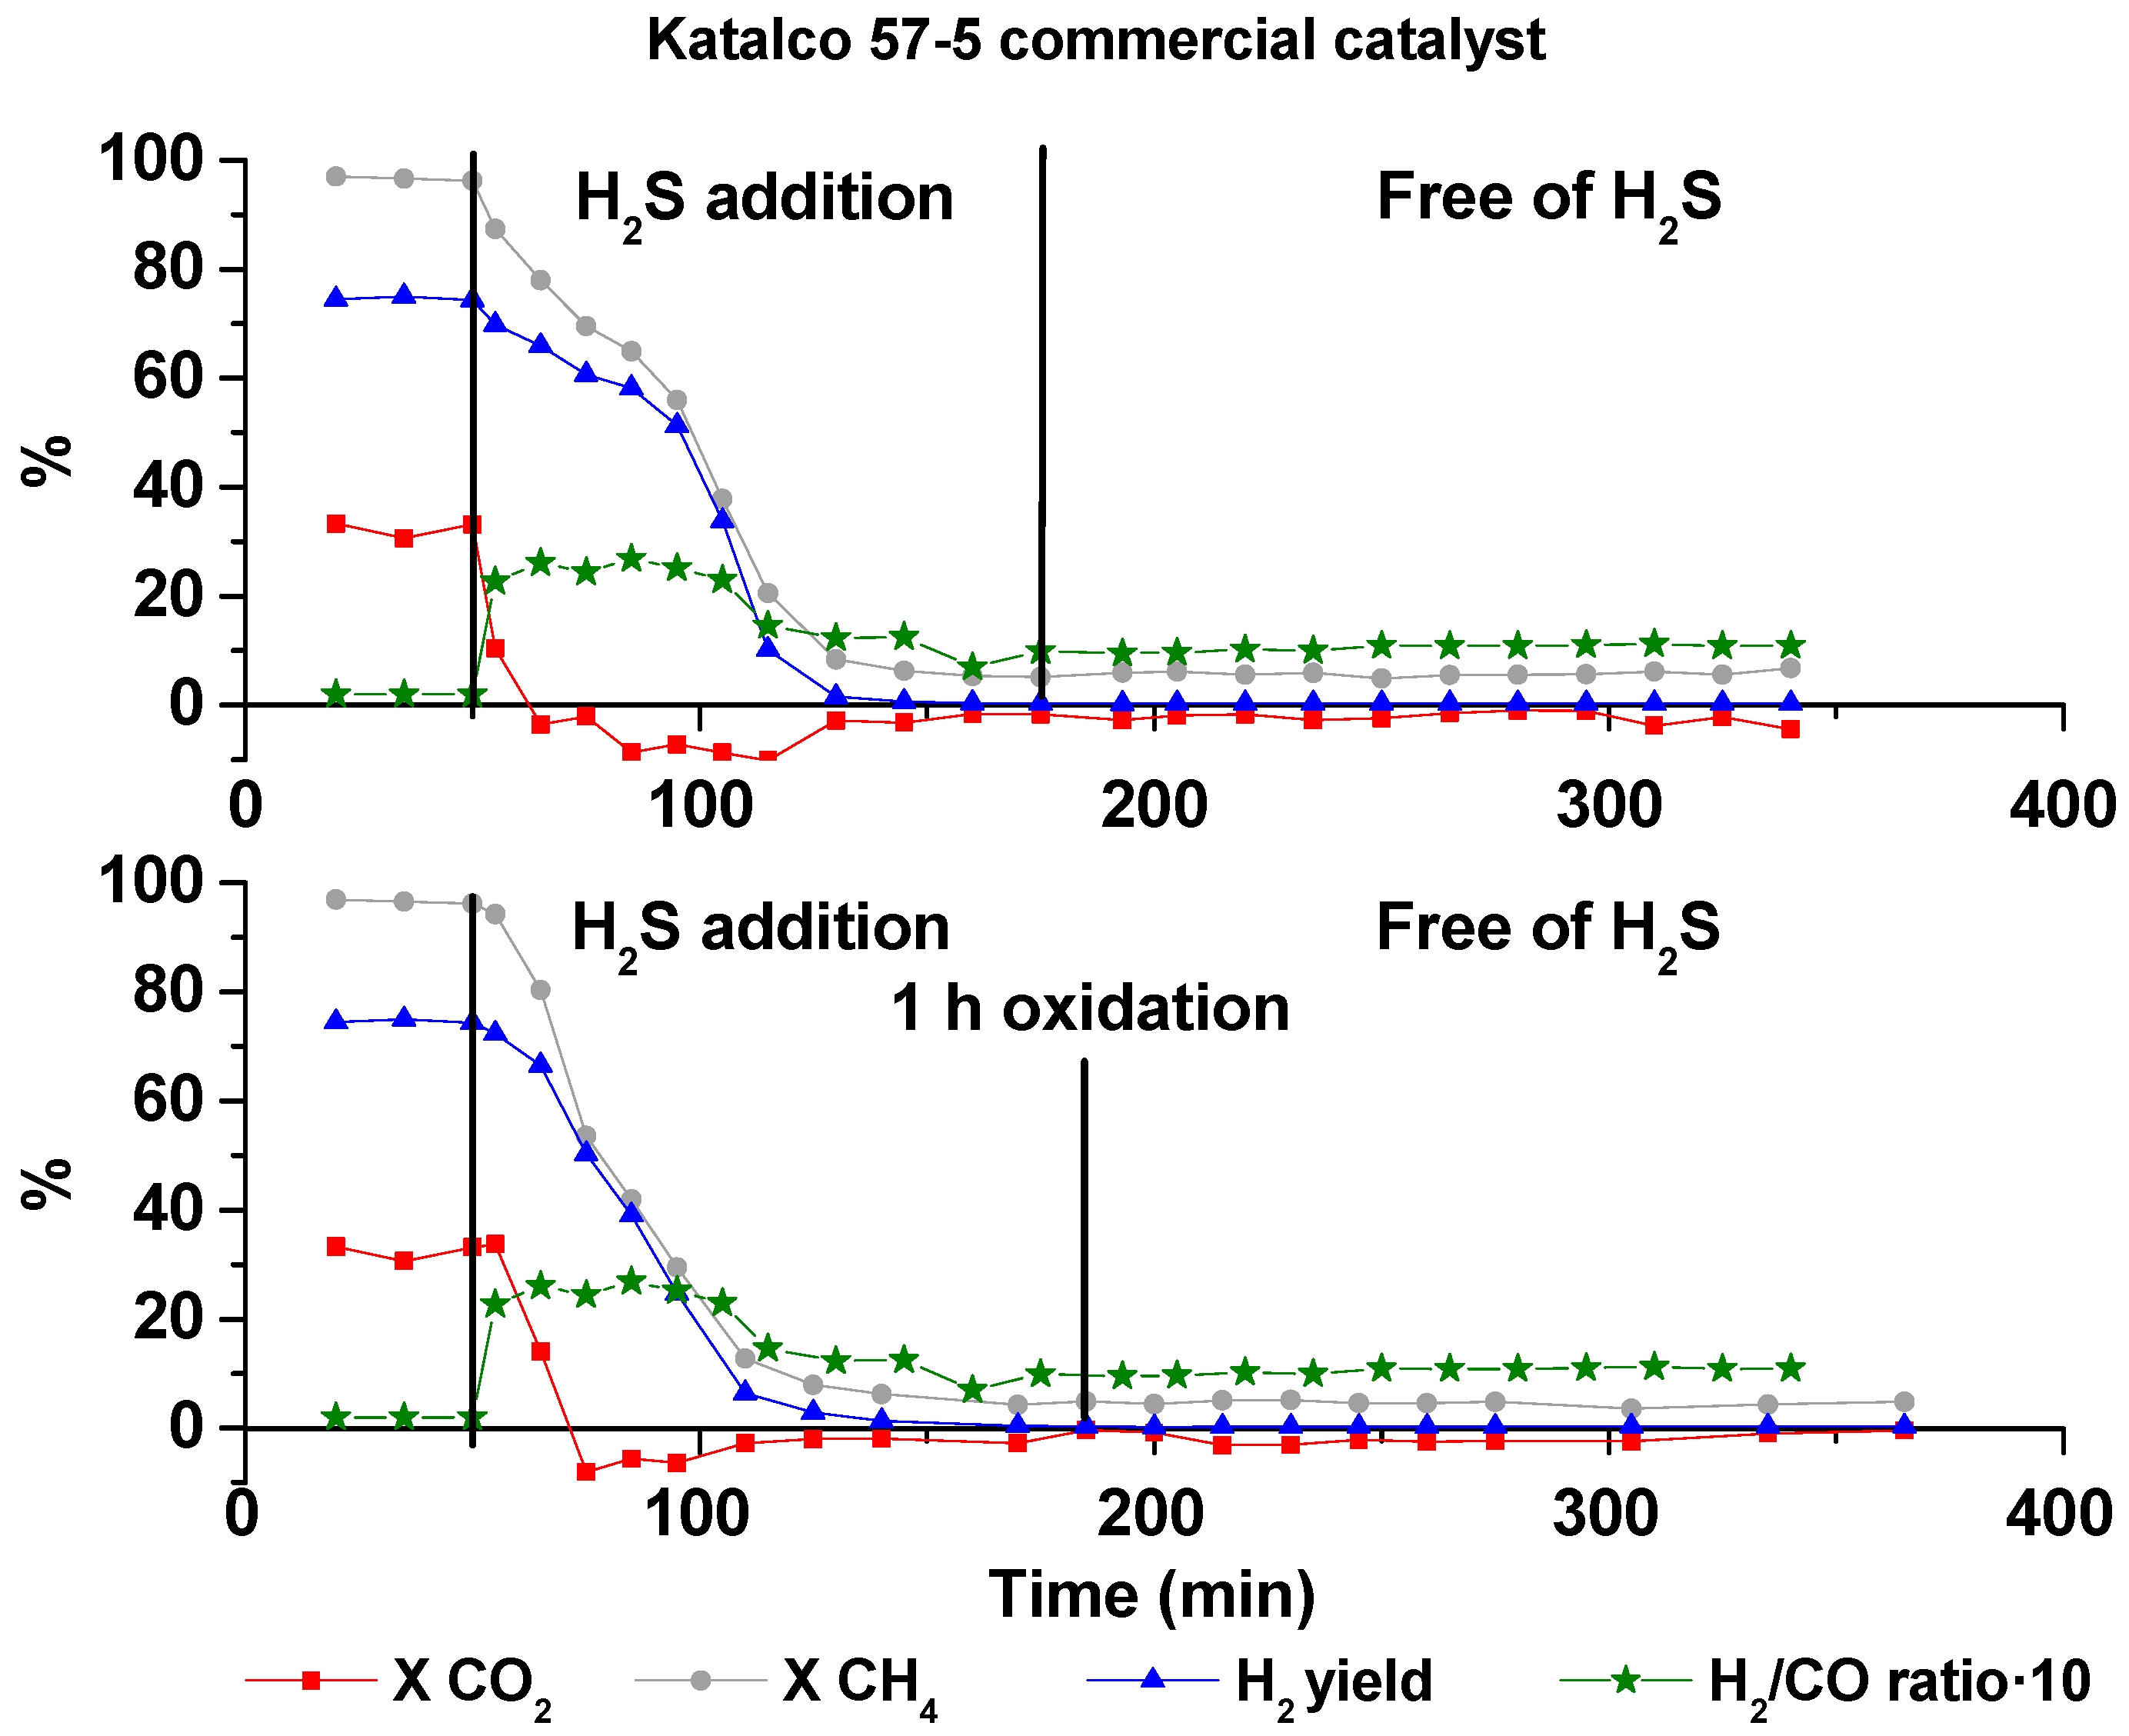
2.2.1. Katalco 57-5 Ni-Al2O3 Catalyst

In the case of Katalco 57-5 catalyst, see Figure 1, a stable and high activity (XCH4 = 96.6, XCO2 = 32.3, H2 yield = 74.6) was measured operating under tri-reforming conditions. When H2S was introduced to the system, the activity of the catalyst dropped. However, no regeneration was observed after the deactivation by any of the two regeneration processes studied.
During deactivation, the H2/CO ratio increased, which suggests that the main reactions occurring could be CPO and WGS. After deactivation, the negative CO2 conversion is also consistent with the WGS reaction. The previously mentioned reasons justify the absence of O2 as a reaction product and the H2/CO ratio higher than 2, assuming that the contribution of DR and SMR reactions is negligible.

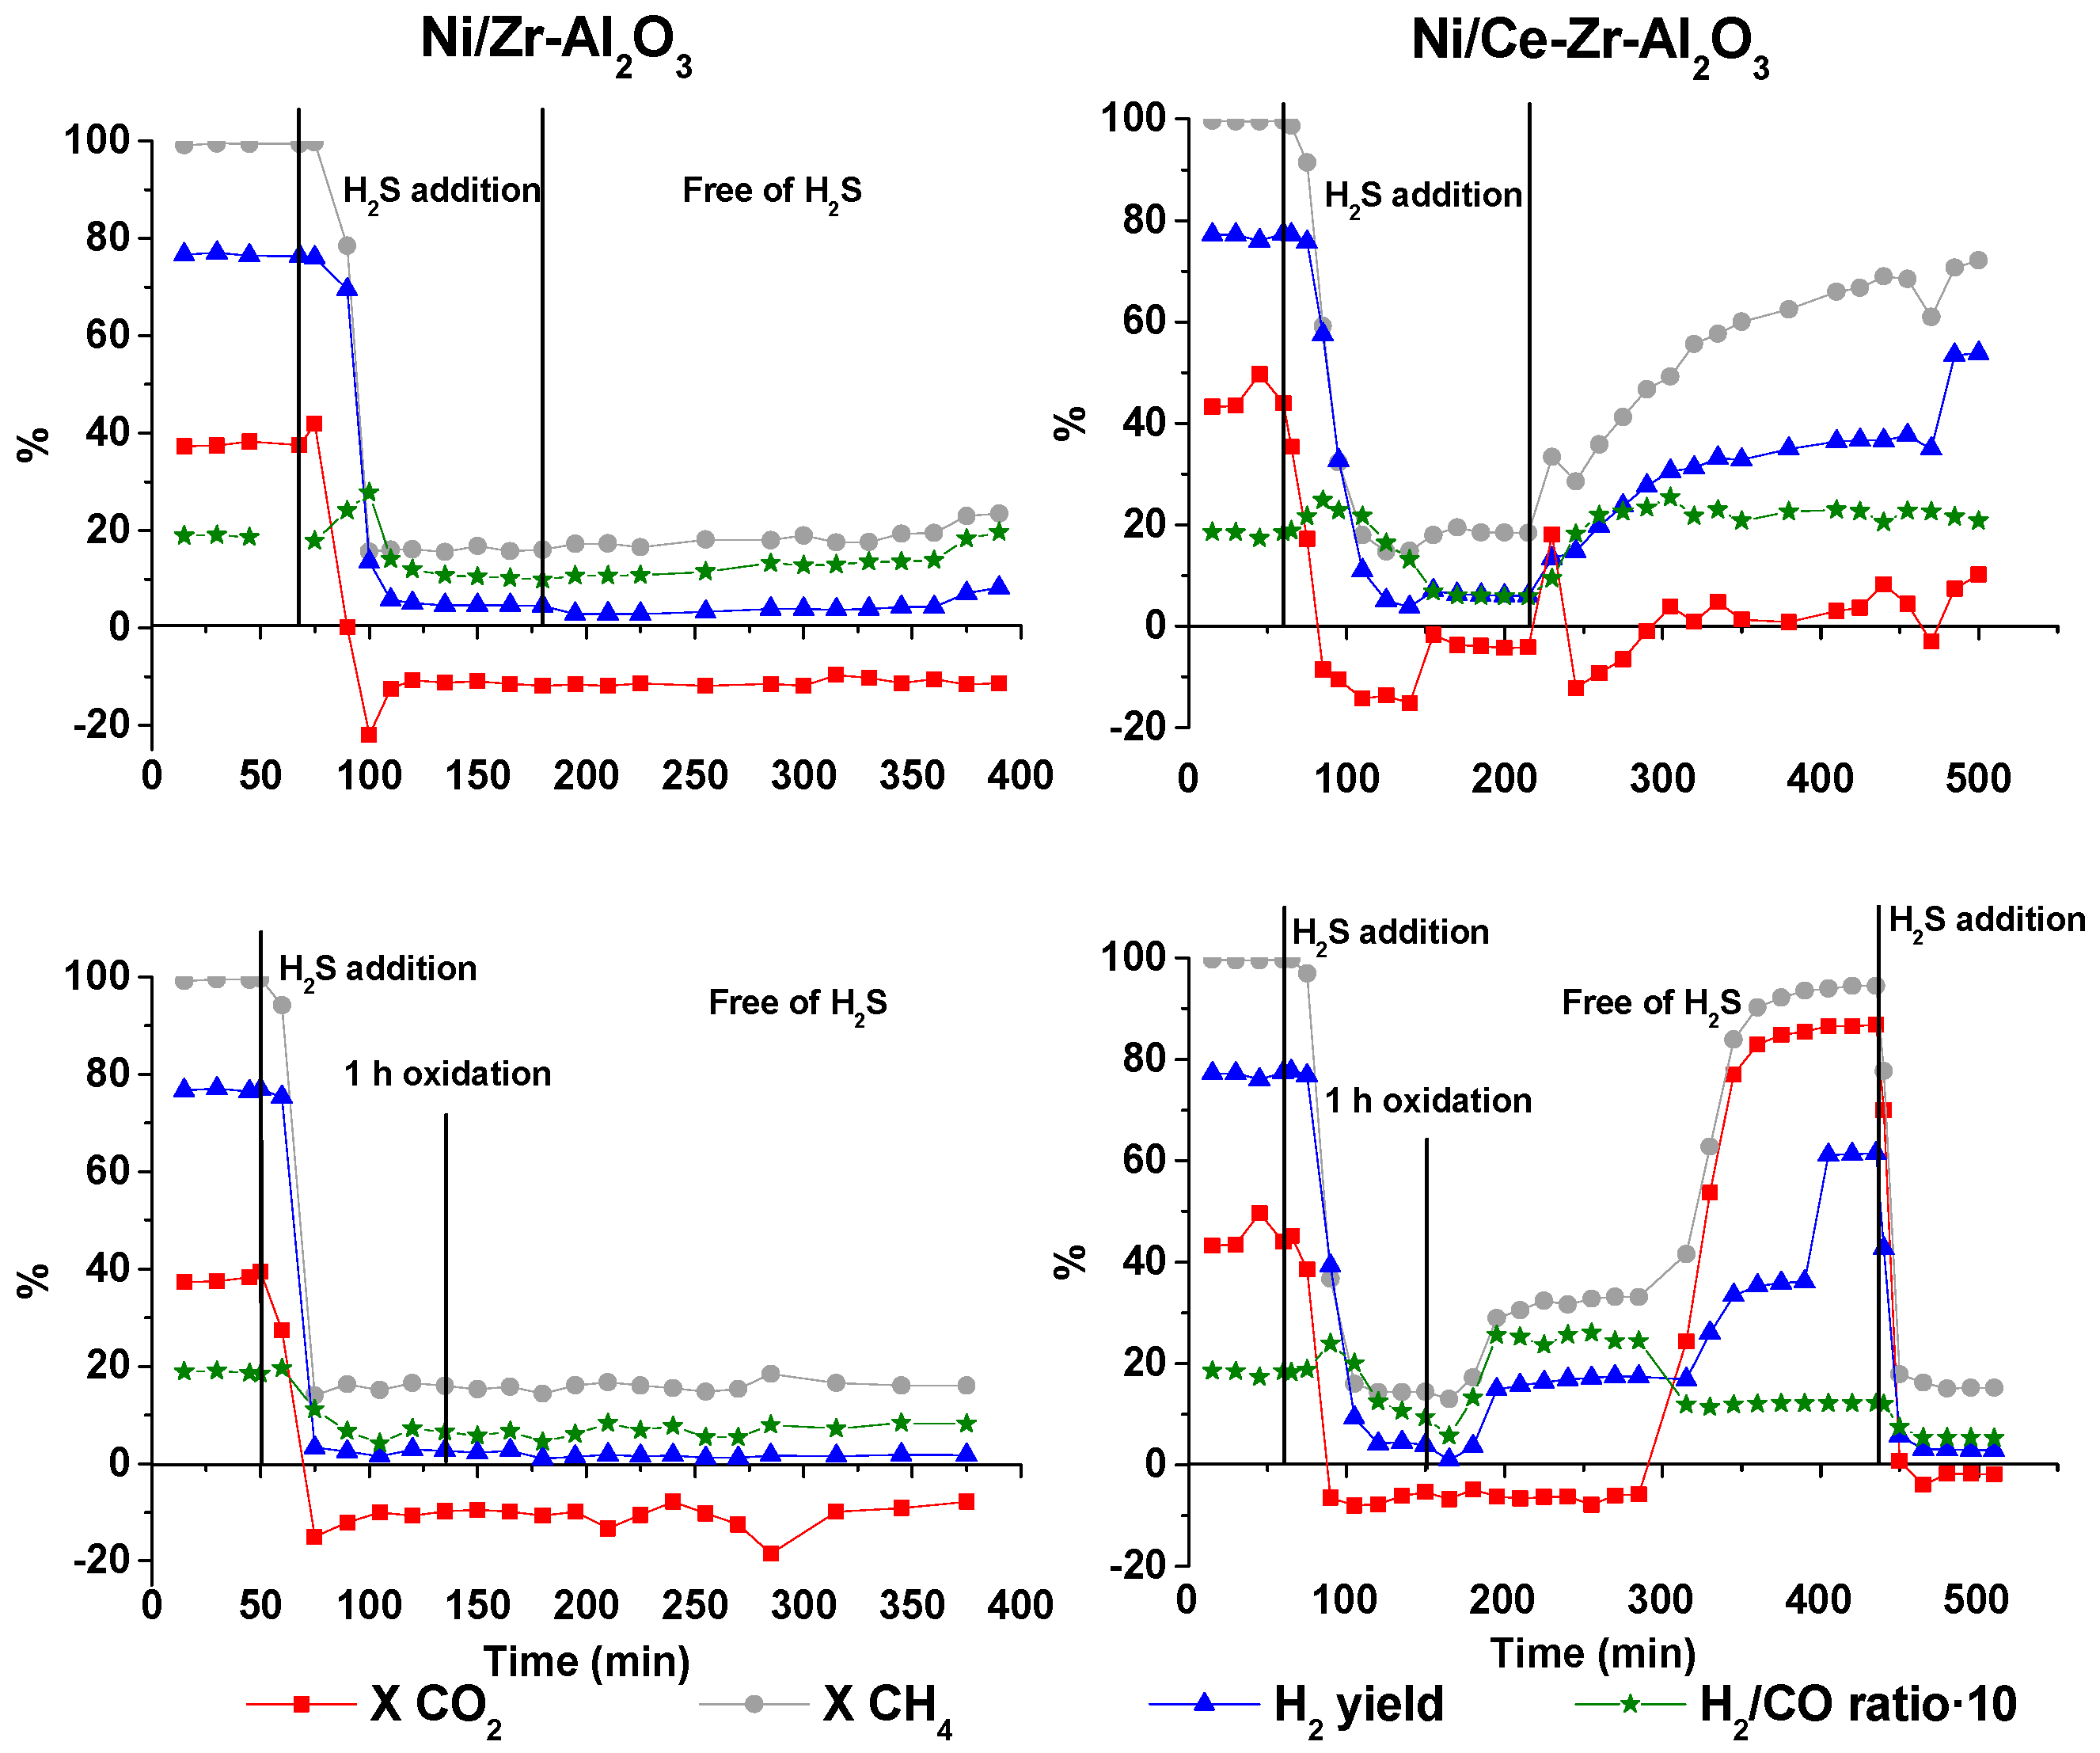
2.2.2. Ni/Zr-Al2O3 Catalyst

The catalytic activity measured for this catalyst operating under tri-reforming conditions was also high (XCH4 = 99.4, XCO2 = 34.3, H2 yield = 74.5), as shown in Figure 2. When H2S was continuously added to the system, quick catalyst deactivation was observed. Afterwards, as happened for Katalco 57-5 Ni-Al2O3 catalyst, no catalyst regeneration took place after both self-regeneration and regeneration by oxidation processes. However, the Ni/Zr-Al2O3 catalyst showed a slightly higher activity once being deactivated, compared to the Katalco 57-5 Ni-Al2O3 catalyst, as it is observed by its higher methane conversion and lower CO2 conversion. This could be due to the DR reaction.

2.2.3. Ni/Ce-Zr-Al2O3 Catalyst

The same experimental schedule (see Figure 4) was carried out for the Ni/Ce-Zr-Al2O3 catalyst. Although this catalyst recovered part of its activity after the regeneration processes, the conversion values measured after the self-regeneration process were lower than the ones obtained at the beginning of the experiment. The presence of H2S and subsequent deactivation could alter the morphology of the surface since no catalytic reactions occurred during the period in which the catalyst was fully deactivated. Then, when the continuous H2S addition was stopped, the catalyst recovered most of its activity, but the very low CO2 conversion indicates a combined poor selectivity to the DR reaction and concomitant presence of WGS reaction.
On the other hand, this catalyst recovered the catalytic activity after being self-regenerated (presented at the top of Figure 4). This regeneration process successfully allowed recovery of the initial conversion values. However, through the regeneration by the oxidation at low temperature (presented at the bottom of Figure 4), significantly higher carbon dioxide conversions were measured compared to the ones measured after the self-regeneration process and before deactivation. After regeneration by oxidation, the main reaction is SMR, but after 300 min of time on stream, the selectivity to DR reaction increased significantly, as indicated by the increase in the CH4 and CO2 conversion, which is also consistent with the preponderance of this reaction with regard to the WGS. The last step of this study corresponded to a second H2S addition, in which a quicker deactivation was noticed compared to the first one.

2.2.4. Ni/Ce-Al2O3 Catalyst

In the case of the catalyst modified only with CeO2, a similar behavior to the one observed for the Ni/Ce-Zr-Al2O3 was noticed with respect to the self-regeneration process. However, for the Ni/Ce-Al2O3 catalyst the activity recovered was slightly higher because the methane and carbon dioxide conversions achieved were almost the same as the ones measured at the beginning of the experiment. Regarding the regeneration process by oxidation at low temperature, after two hours of fully deactivated operation, this catalyst recovered its reforming capacity. As a result, CH4 conversion reached values similar to the ones obtained before the sulfur addition and CO2 conversion reached higher values than the ones initially measured.
Thus, after the self-regeneration process, higher conversions were achieved by the catalyst containing both support modifiers, CeO2 and ZrO2, especially for carbon dioxide (86.8%, Figure 2, right), than for the catalyst containing only CeO2 (79.5%, Figure 3, right). In the case of the only CeO2-containing catalyst, with respect to the regeneration process by the oxidation at low temperature, it needed longer time to be regenerated. Moreover, for this catalyst, quicker deactivation occurred when H2S was added to the system a second time.

2.2.5. Rh-Ni/Ce-Al2O3 Catalyst

The main difference when operating with this catalyst is its higher resistance against deactivation. Thus, apparently the presence of a small amount of Rh increased the deactivation resistance. From the catalytic results, the carbon dioxide conversions achieved were positive and the methane conversions quite significant, contributing to hydrogen yields around 30%. Therefore, this was the only catalyst showing relevant activity operating with 25 ppm of H2S.
When the self-regeneration process was carried out, the catalyst recovered its activity obtaining values close to the ones measured at the beginning of the experiment (Figure 3, top left). This catalyst was the one showing the highest activity after the self-regeneration process. In the study of the catalyst regeneration by the low temperature oxidation, this catalyst showed a very quick activity recovery compared to the previous ones. Additionally, lower carbon dioxide conversion was measured but at much higher hydrogen yield. Therefore, after regeneration by the low temperature oxidation, this catalyst did not show the previously mentioned selectivity to the reverse WGS reaction. This indicates that the Rh-containing catalysts resist the addition of H2S as shown here by the tendency of this catalyst to recover its initial activity.
Thus, this was a remarkable catalyst achieving similar conversion values before deactivation and after regenerations because of its high recovery capacity without being influenced by the rWGS reaction. Furthermore, this catalyst was the only one showing significant activity after the second H2S addition, while the rest of the catalysts suffered an initial quick and complete deactivation, with a posterior second deactivation being even more drastic. For the bimetallic catalyst, hydrogen yields around 20% and methane conversions near 30% were measured after the second H2S addition.

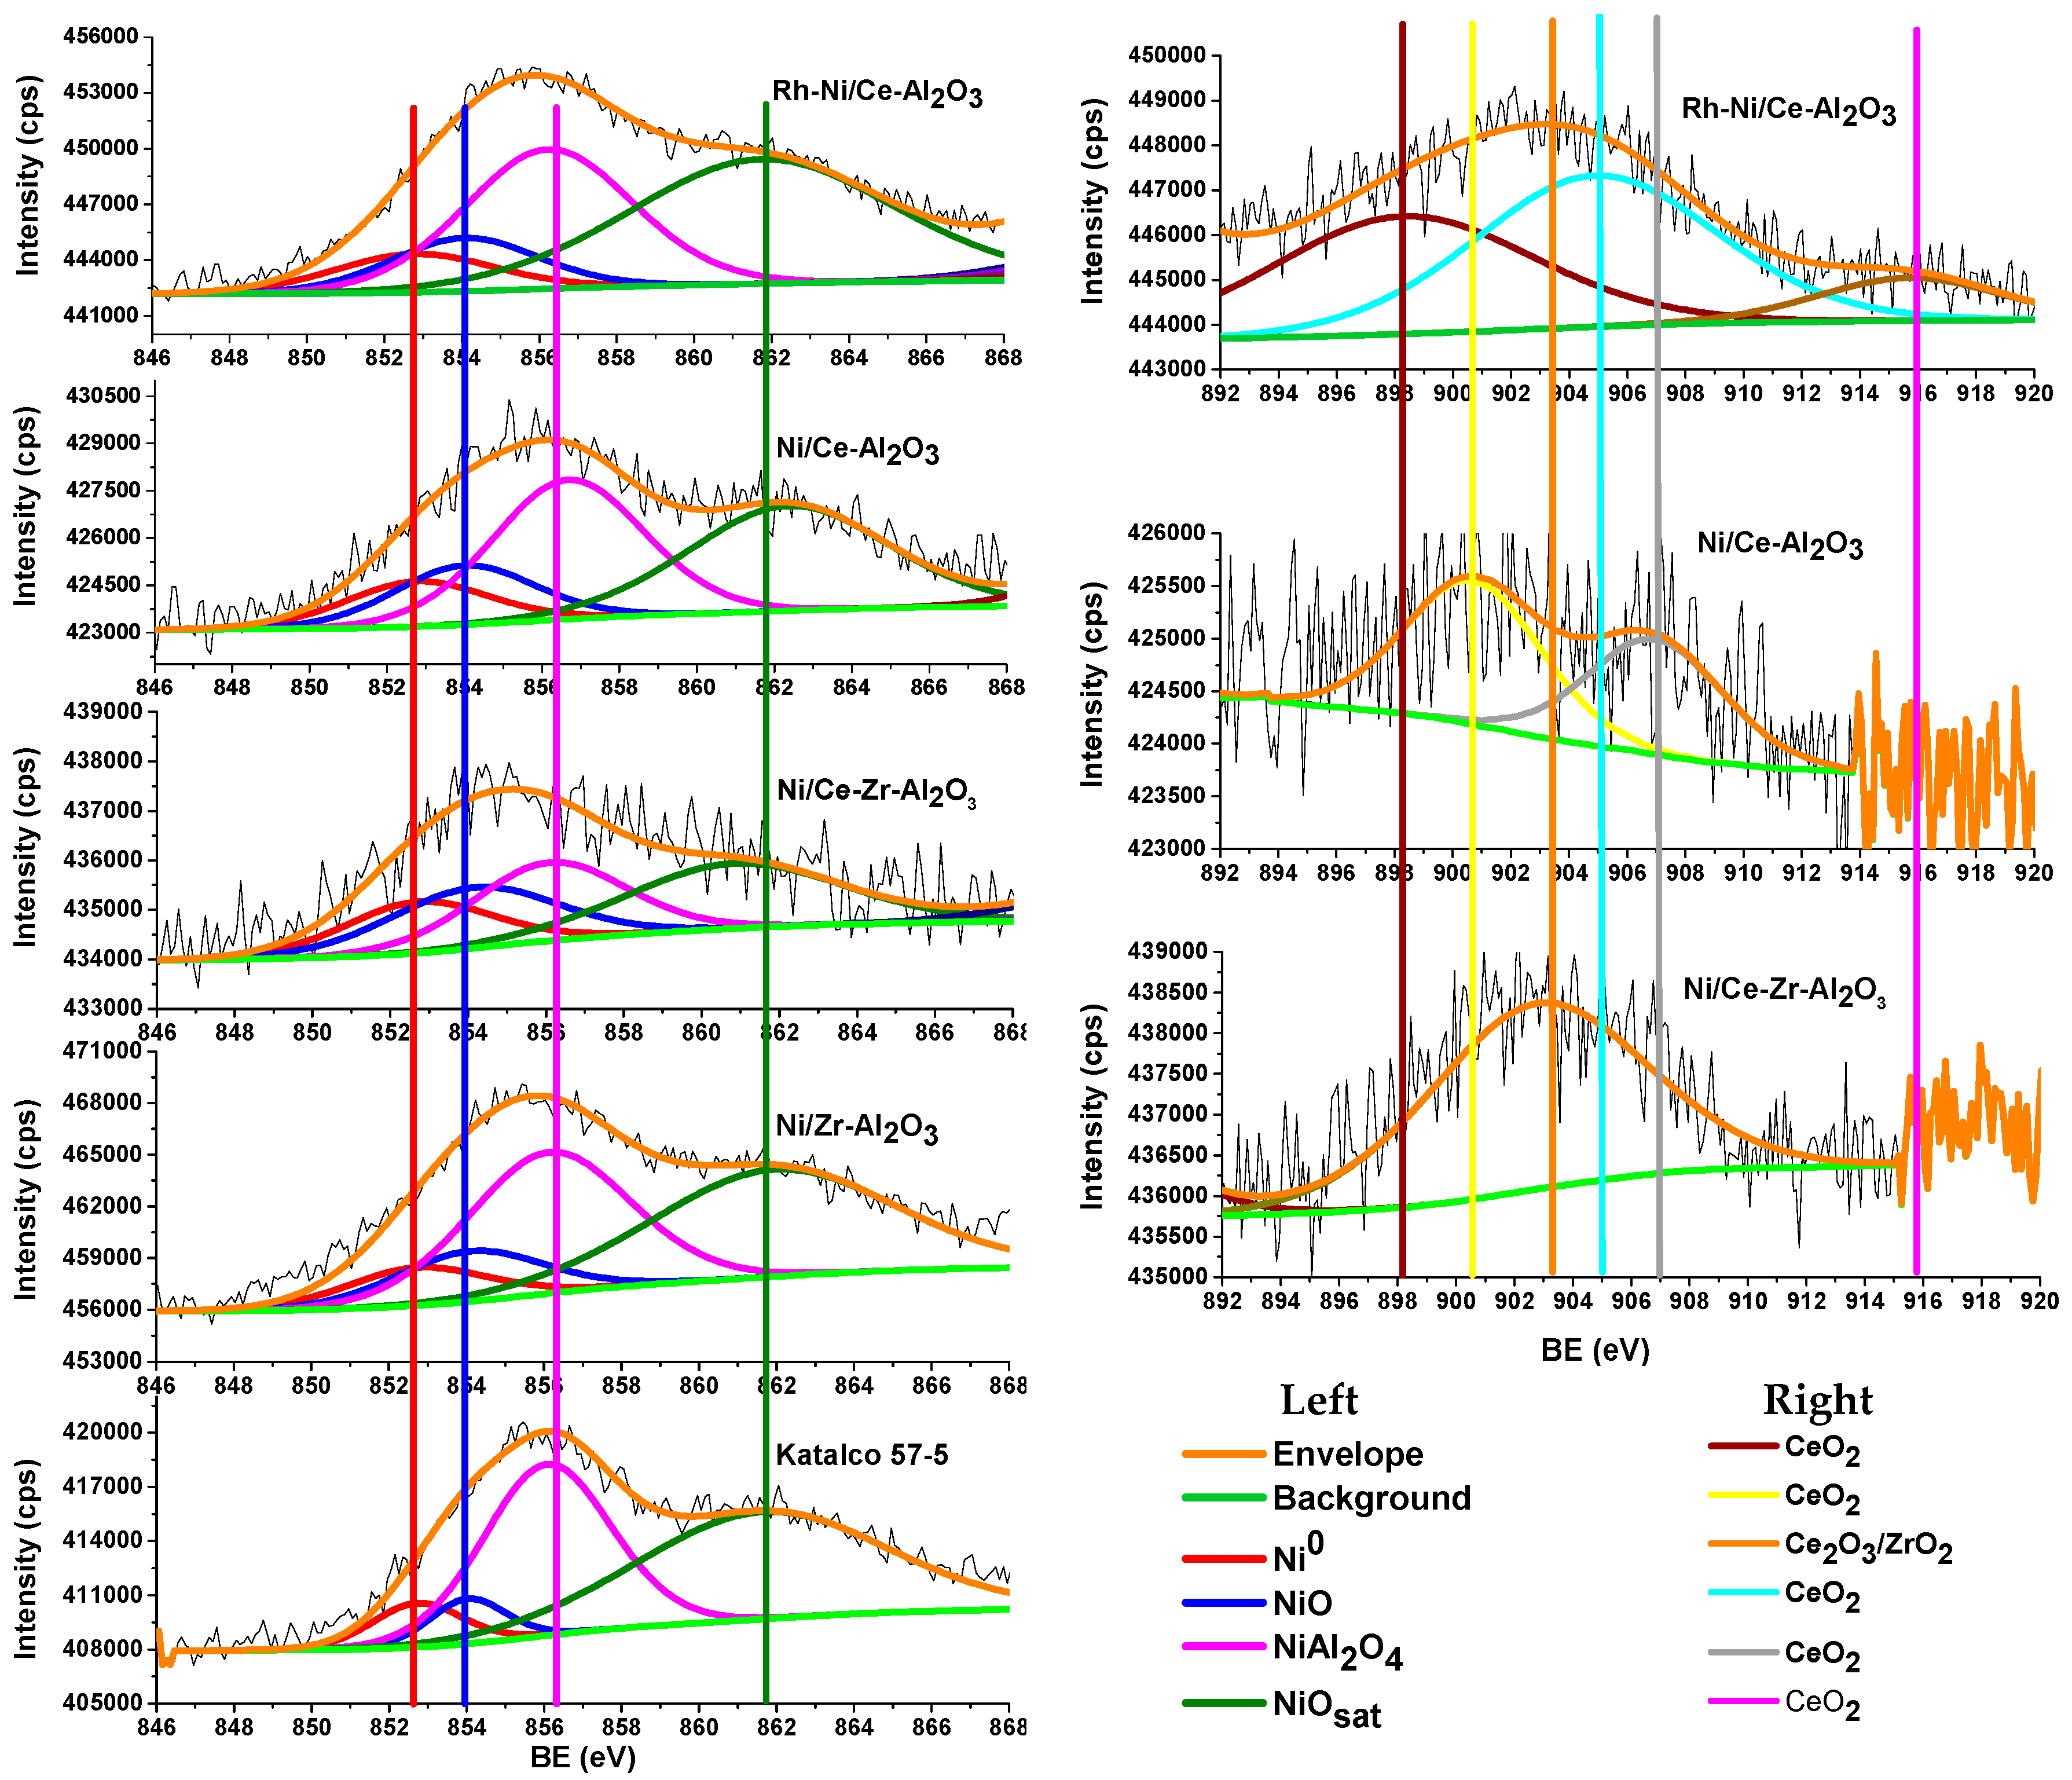
2.3. Fresh and Tested Catalysts Characterization by XPS

In order to compare the characteristics of the fresh and tested catalyst surfaces, a characterization using the XPS technique was carried out for all the catalysts. Therefore, apart from the characterization results obtained for the fresh catalysts, the corresponding ones were also compiled for each catalyst after operating under the abovementioned conditions in order to detect possible differences between both regeneration processes studied.
It is important to highlight that in the case of the regeneration process by oxidation at low temperature (a process that lasted 1 h), the catalysts completely deactivated after the last H2S addition. Characterization of the deactivated catalysts was carried out at this point. The comparison given in Table 3 is between fresh and calcined catalysts with the samples obtained after finishing all the procedure, as specified in Figure 4.
According to the results compiled in Table 3, the highest Ni/Al ratio measured for Katalco 57-5 catalyst can be related to the higher Ni content present in this catalyst (see Table 2). Focusing on the rest of γ-Al2O3-based catalysts, lower Ni/Al ratios than the measured for Katalco 57-5 catalyst were detected, the ratio measured for the Ni/Ce-Zr-Al2O3 catalyst being especially low. Then, the presence of both CeO2 and ZrO2 affected to the Ni/Al ratio. However, for the bimetallic catalyst, Rh-Ni/Ce-Al2O3, a ratio of 0.16 was determined, and this high value could be a result of a better dispersion of the metallic phase as confirmed by H2-chemisorption results.
The Ni/Al ratios measured for the catalysts tested after the self-regeneration process (self-regeneration + tri-reforming) were generally lower than fresh calcined catalysts, which can be directly related to the carbon deposition detected and determined by the high C/Al ratios (see Table 3). However, the catalysts containing CeO2 and CeO2-ZrO2 improved their Ni dispersion, which could be due to more C deposited onto Al2O3 than onto Ni, as observed in the Transmission Electron Microscope (TEM) pictures (Figure 5). In addition, higher carbon deposition was measured by XPS for the catalysts tested under the self-regeneration process. This fact can be explained by the influence of the low-temperature oxidation process, which contributed to remove part of the carbon deposited onto the catalyst surfaces.
Furthermore, the sulfur/alumina (S/Al) ratio was also measured for all the catalysts under investigation, with special interest paid to the catalysts tested under the regeneration process by oxidation at low temperature (regeneration by oxidation + tri-reforming + H2S addition), because for the completely deactivated catalysts, some sulfur deposition onto the catalytic surfaces was expected. However, only for the Katalco 57-5 Ni-Al2O3 catalyst some deposition of sulfur was detected, S/Al = 0.08, and corresponded to the catalyst tested after the self-regeneration process (self-regeneration + tri-reforming). The non-detection of sulfur in the rest of catalysts could be due to the low amount of sulfur deposited onto the surface of the catalysts, which could not be detected by this technique, but sufficient to deactivate catalyst active sites.
In order to determine the reasons why some catalysts suffered from deactivation and others recovered partially or almost all their initial activity, TEM images were acquired for the catalysts showing the best, Rh-Ni/Ce-Al2O3, (left of Figure 5) and the worst, Ni/Zr-Al2O3, (right of Figure 5) activity results. For both, the images correspond to the catalysts after the self-regeneration process and after the regeneration by oxidation processes. The corresponding micrographs can be observed in Figure 5.
These pictures are the most representative ones among all the micrographs obtained by this technique. For all the catalysts and areas analyzed no sulfur was detected by the Energy Dispersive X-ray Spectroscopy (EDX), which is in good agreement with the results obtained by XPS for the Rh-Ni/Ce-Al2O3 and Ni/Zr-Al2O3 catalysts. In addition, the presence of carbon can easily be observed, which is also in concordance with XPS results. Furthermore, the type of the carbon deposited onto the surface can be analyzed by TEM. As can be observed in Figure 5, encapsulated carbon was predominant, although some carbon filaments were also observed. The latter carbon appears as carbon nanotubes, which grow from the Ni particle.
In order to quantify the presence of the C deposited onto the catalysts surfaces, Temperature Programmed Oxidation (TPO) experiments were performed by Thermal Gravimetric Analyzer (TGA). The results shown in Figure 6 represent the evolution of the temperature with the first derivative of the percentage weight loss, in order to detect easily the negative or positive peaks related to the weight loss or gain, respectively. Additionally, the last column of Table 3 summarizes the total weight loss percentages.
Regarding the type of C, it has been reported that the oxidation of filamentous carbon associated with nickel particles occurs between 300 °C and 527 °C while the oxidation of carbon with different degrees of graphitization takes place above 527 °C [28,29,30]. From Figure 6 and the results compiled in Table 3 it can be seen that in general, very low weight losses were measured. Focusing on the left of Figure 6, there are negative peaks at low temperature, until 150 °C, attributed to the evaporation of water [31], specially detected for the Rh-Ni/Ce-Al2O3 and Ni/Zr-Al2O3 samples. Then, at increasing temperatures, these samples gain weight due to the oxidation at low temperature of the reduced Rh and Ni surface species. Regarding the carbon deposition, a negative peak was detected for Katalco 57-5 catalyst in the temperature range between 600 °C and 700 °C, which could correspond to the oxidation of carbon with different degrees of graphitization. This weight loss corresponds to 0.16% of the mass of the catalyst, and fits properly with the results obtained by XPS. Therefore, the C measured by XPS for the rest of catalysts, which shows a much lower ratio compared to the Katalco 57-5 one, could be considered negligible because no significant peaks were detected for these catalysts by TPO analyses in the same temperature range.
In the characterization of the catalysts tested after the regeneration by oxidation process, the initial large peaks at low temperature, below 100 °C, also correspond to moisture in the samples. Then, Rh and Ni particle oxidation takes place, mainly for the Rh-Ni/Ce-Al2O3 and Ni/Ce-Zr-Al2O3 catalysts, when the catalysts gain weight. The main difference compared to the previously described catalysts lies in the weight loss detected at the temperature around 350 °C for the Rh-Ni/Ce-Al2O3 and the negative peak for the Ni/Ce-Zr-Al2O3 catalyst in the temperature range between 500 °C and 700 °C. The weight loss for this last catalyst is around 0.52%. Then, in the temperature range between 800 °C and 900 °C, a significant peak was detected for the Rh-Ni/Ce-Al2O3 catalysts, which is attributed to the oxidation of carbon with different degrees of graphitization. The weight loss in this case corresponds to the 1.78% of the catalyst weight.
The low carbon deposition measured and the quick deactivation observed lead to the conclusions that the deactivation was mainly due to the addition of small amounts of sulfur as low as 25 ppm. As has been reported by other authors, the deactivation by sulfur can be described by the following general reaction Equation (8) [32,33], which is proposed to operate at high temperature:
H2S + Ni ↔ Ni-S + H2
Ni-S + 3/2O2 → NiO + SO2
As is shown above, all the CeO2-containing catalysts partially recovered their initial activity by both regeneration processes. This effect could be related to the oxygen fed in the regeneration process by oxidation at low temperature as well as the oxygen fed together with the other reactants for the self-regeneration process, which reacts according to reaction Equation (9).
For the catalysts tested under regeneration by oxidation process, a second sulfur addition was applied. At these conditions, no sulfur was detected, with the exception only of the Katalco 57-5 catalyst. There could be two effects to explain the non-detection of sulfur or SO2. The first one is the poor detection limit of the µ-GC and the characterization techniques used. The second deals with the possible sulfur desorption when the system was cooled down from 800 °C to atmospheric temperature. Therefore, the results of this work strongly suggest that catalyst deactivation mainly occurs via a mechanism of deposition of small amounts of sulfur on the catalysts active sites, which are successfully regenerated by sulfur oxidation with oxygen in presence of highly dispersed Ni and a noble metal.

3. Materials and Methods

In this section, the description of catalysts preparation techniques, activity measurements, equipment used and catalysts characterization techniques is detailed.

3.1. Catalysts Preparation

First, modified alumina supports were prepared using aluminum oxide (BET specific surface area 255 m2 g−1, pore volume 1.14 cm3 g−1; Alfa Aesar, Haverhill, MA, USA, P/N: 43832), cerium(III) nitrate hexahydrate (99.5%; Alfa Aesar, P/N: 11329) and Zirconium(IV) oxynitrate hydrate (99.99%; Sigma Aldrich, St. Louis, MO, USA, P/N: 243493). An aqueous solution consisting of 10.0 mL of water per gram of support was used to dissolve promoters. The amounts of CeO2 and ZrO2 salts precursors were calculated to achieve a nominal content of 6.0 wt. % Ce and 8.0 wt. % Zr for the cerium- and zirconium-doped γ-Al2O3 supports, and 3.0 wt. % Ce and 4.0 wt. % Zr for the cerium-zirconium-doped γ-Al2O3 support. The excess of solvent was evaporated in a rotary evaporator model Heidolph Laborota 4000 after being mixed overnight in order to obtain a homogeneous mixture. The evaporation procedure was carried out at 338 K and 40–100 mbar. After the evaporation step, the solid was introduced in an oven at 373 K during 1 h to assure a complete drying, then calcined in a muffle at 1073 K (rate of 5 K/min) in presence of static air during 4 h, in order to remove any volatile components.
Thereafter, the Ni was incorporated to these supports by impregnation with a Nickel(II) nitrate hexahydrate (99.99%; Sigma Aldrich, St. Louis, MO, USA, P/N: 203874) aqueous solution. The amounts of Ni salt precursor were calculated to achieve an intended load of 13.0 wt. % Ni for γ-Al2O3-based supports. For the bimetallic catalyst, a Rhodium(III) nitrate hydrate (~36 wt. % as rhodium; Sigma Aldrich, St. Louis, MO, USA, P/N: 83750) aqueous solution was incorporated to the previously calcined monometallic catalyst, following the same procedure indicated above, to achieve an intended load of 1.0 wt. % of Rh. Then, the catalysts were dried and calcined as indicated above. The activity of a commercial catalyst (ICI group; Katalco, 57-5 series) supported on α-Al2O3 was used for comparison purposes. These catalysts were previously tested by the authors under several biogas reforming conditions, and now the aim of the present work is to study the influence of sulfur in their stability [19].

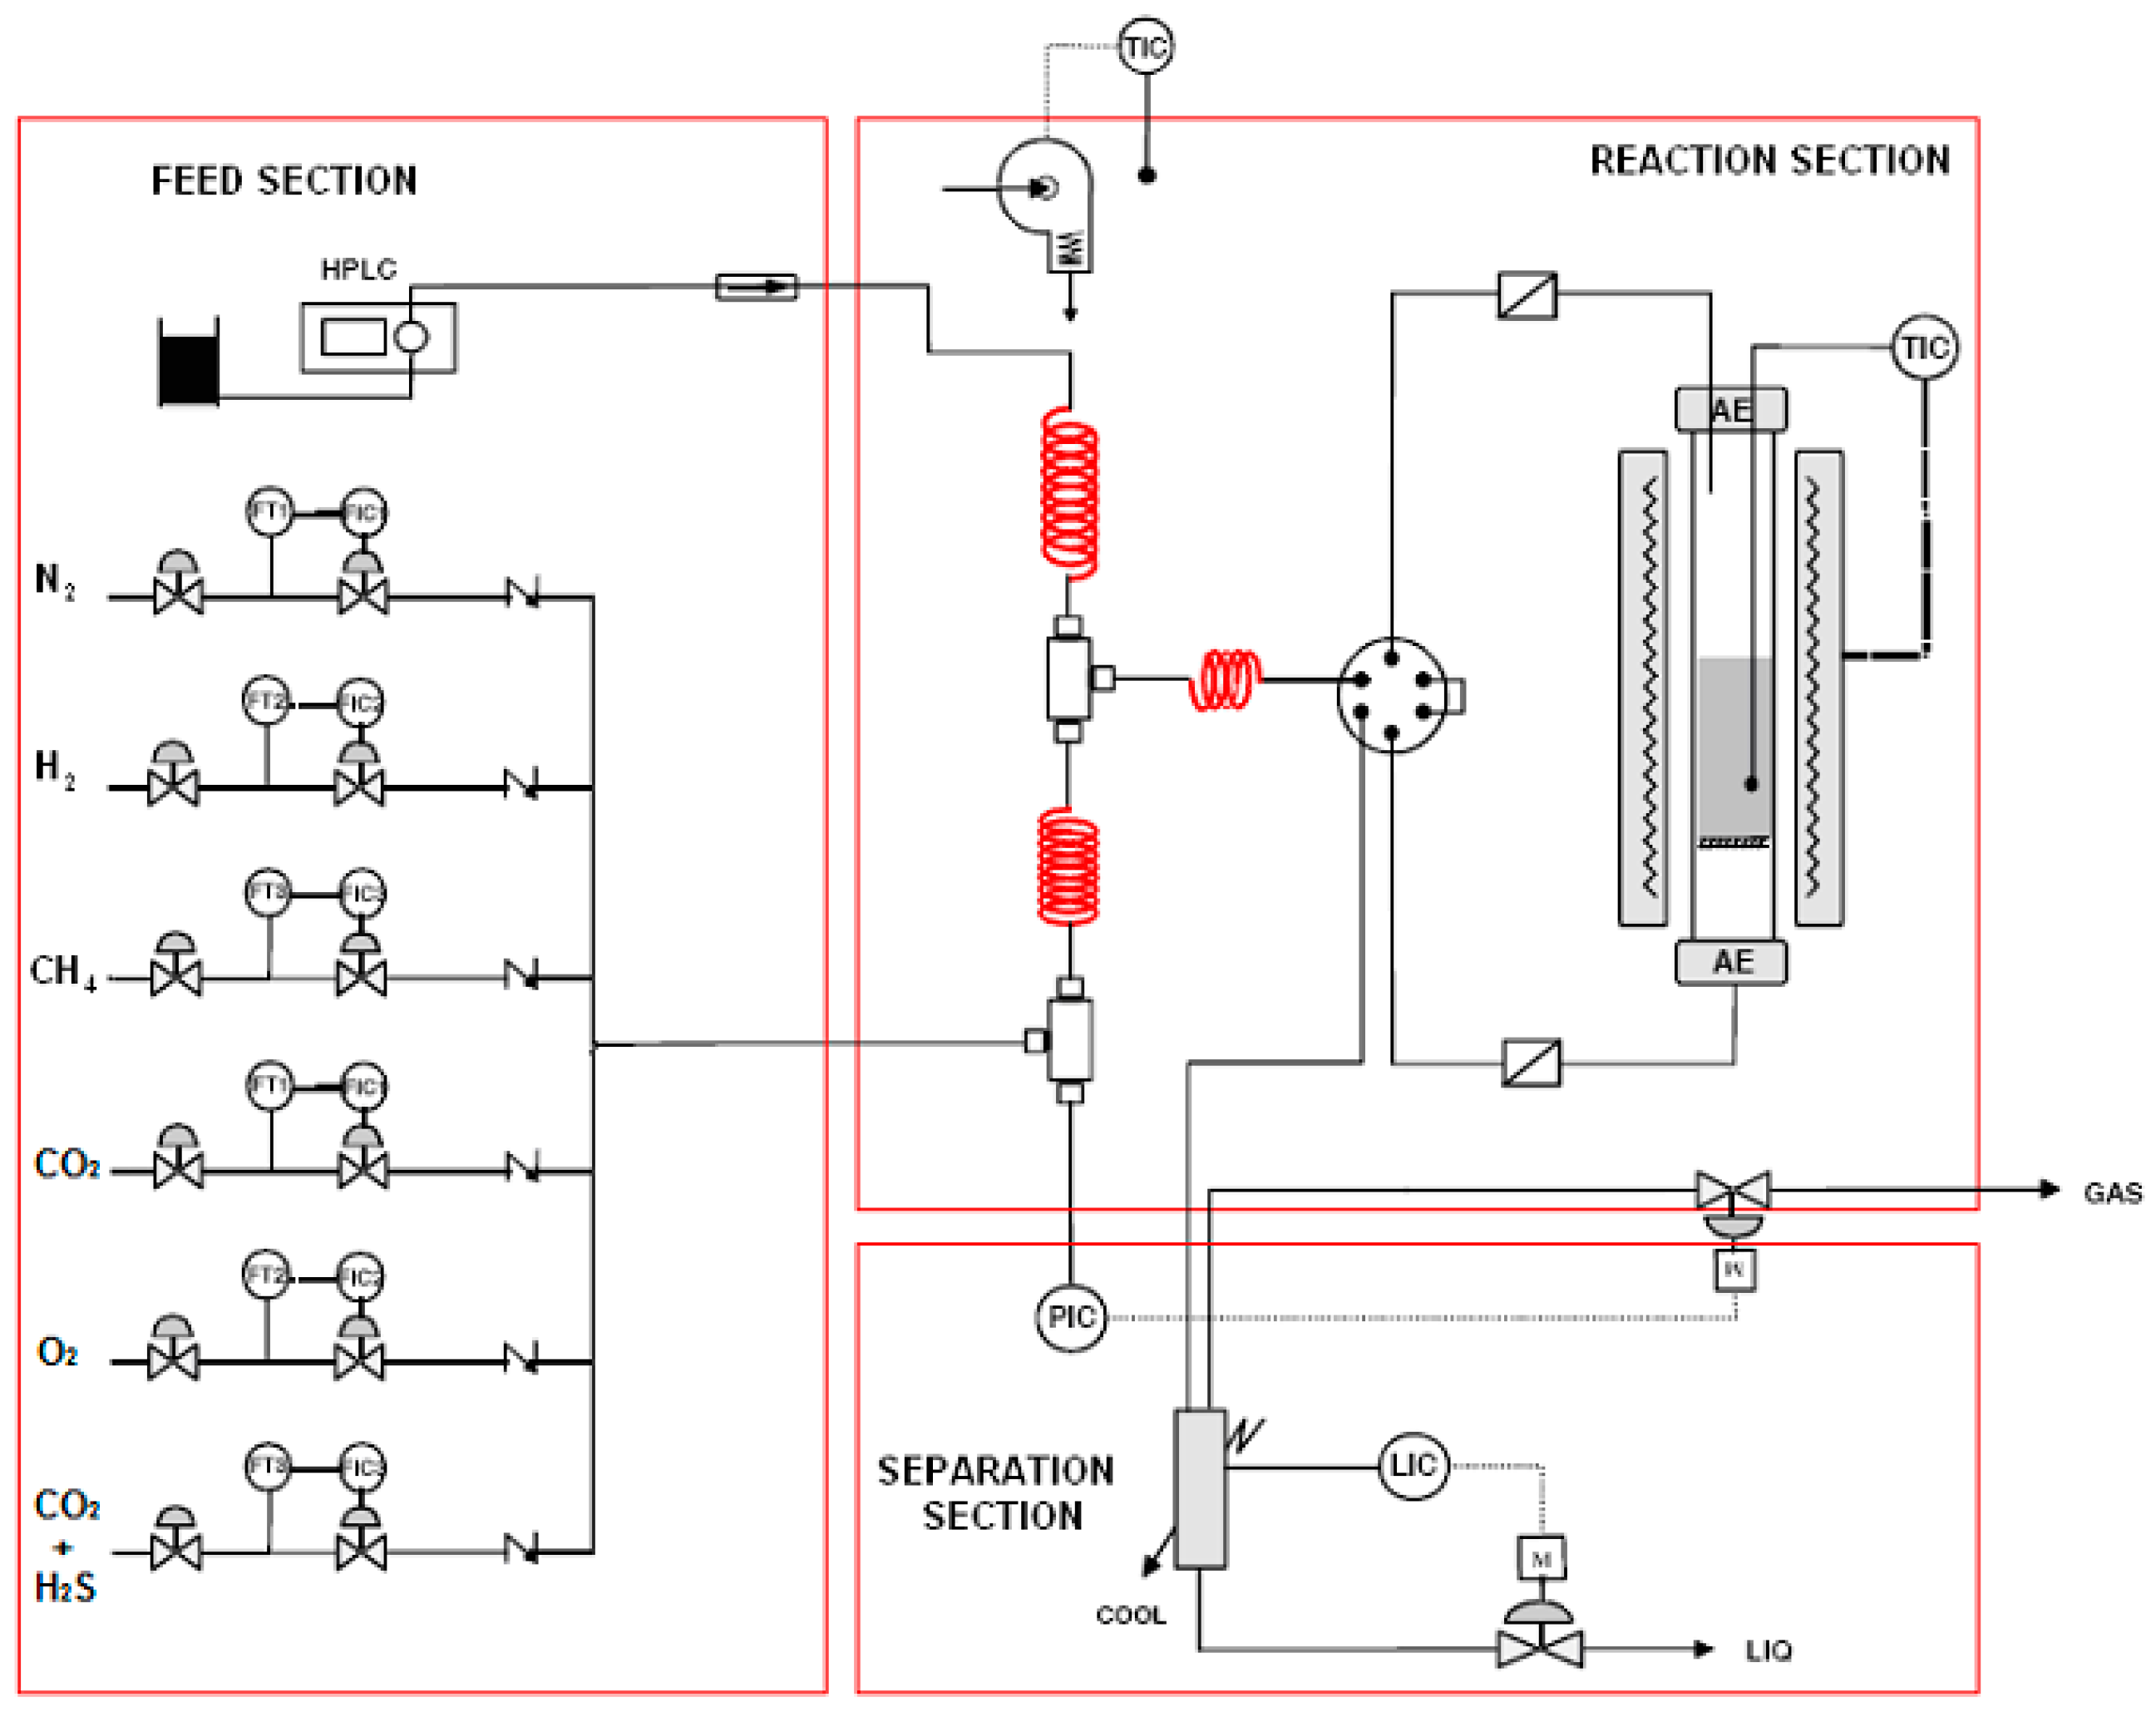
3.2. Activity Measurements

A bench-scale Microactivity plant (PID Eng&Tech, Alcobendas, Spain, see Figure 7) was used for the activity tests. Electronic controllers adjusted the fed gaseous mixture flows and a HPLC-Gilson liquid pump was used for deionized water injection (18.2 MΩ cm at 25 °C and a TOC value of 3 ppb). For all the experiments a model biogas consisting of 60 vol % CH4 and 40 vol % CO2 was fed [14,27,34]. A H2O/C molar ratio of 1.0 and O/C molar ratio of 0.25 were used in addition to nitrogen to simulate an air stream. Therefore, 210.0 mL/min of CH4, 140.0 mL/min of CO2, 197.7 mL/min of N2, 52.5 mL/min of O2 and 0.169 mL/min of liquid H2O were fed to the system at 800 °C and atmospheric pressure.
The fixed bed reactor system, (316-L stainless-steel, 4.57 mm inner diameter and 30 cm length) was filled with the same catalyst amount, 340 mg, (0.42–0.50 mm diameter particle size) for all experiments. The catalyst was diluted with inert silicon carbide (catalyst:SiC) at 1:4.5 w/w ratio (0.5–1.0 mm diameter particle size, Navarro SIC, S.A. P/N: grain 3/1 RC, pure and inert SiC), in order to avoid temperature gradients in the bed. The diluted catalyst bed was placed in the middle of the reactor and then it was totally filled with another bed of higher diameter SiC particles (0.5–1.0 mm diameter particle size). This higher size was used in order to separate satisfactorily SiC and tested catalysts after activity experiments. Using 340 mg of catalyst, activity tests for biogas tri-reforming process were carried out at weight hourly space velocity, WHSV, of 161 ggas·gcat−1 h−1. The effluent stream was cooled down in a partial condenser. The condensed aqueous phase was collected and weighted, and the gas phase was analyzed online by a Micro GC equipped with a TCD detector. Three columns, Molecular Sieve 5 Å PLOT, CP-Sil 5 CB, and Poraplot Q, were used in a series arrangement for complete separation of hydrogen, oxygen, nitrogen, methane, carbon monoxide, and carbon dioxide, which were calibrated using N2 as an internal standard. Before running the activity tests, each catalyst was heated from room temperature to 800 °C using 350 mL/min of pure N2, then they were reduced at 800 °C using 350 mL/min of a N2:H2 = 3:1 (v/v ) mixture during 4 h and, finally, exposed to the reaction mixture to start the corresponding activity test.
After 1 h of stable operation under the conditions described above, 25 ppm of H2S was continuously added to the model biogas in order to study the catalysts deactivation phenomena. For that purpose, another cylinder containing H2S and CO2 was used, allowing the operation at the same weight hourly space velocity (WHSV) by switching off the CO2 flow gas and switching on the CO2/H2S mixture. When the Micro GC measured no hydrogen, it was considered that complete deactivation took place. Then, two types of regeneration processes were carried out, a self-regeneration and a low temperature oxidation. The self-regeneration consisted of just removing the continuously fed H2S from the system until a stable activity was measured. For the regeneration by oxidation, the temperature was established at 873 K to feed a synthetic air stream during 1 h to the system after switching off all the reactant gases. Then, the experiments continued under the same initial tri-reforming conditions, free of H2S. For the catalysts that recovered part of their initial activity through the regeneration by oxidation process, and once they reached a stable operation, H2S was continuously added again in order to study and compare the two consecutive deactivations. In Figure 2, a general scheme of the studied conditions can be observed.
The tests described above were performed in order to know which catalysts were able to recover part of their initial activity. For that purpose, the following parameters were defined:
Methane conversion: XCH4 (%) = (VCH4in − VCH4out)/VCH4in × 100
Carbon dioxide conversion: XCO2 (%) = (VCO2in − VCO2out)/VCO2in × 100
Hydrogen yield: H2 yield (%) = VH2out/(2·VCH4in + VH2Oin) × 100
where Viin corresponds to the volumetric flow-rate of reactant i (NmL/min); Viout corresponds to the volumetric flow-rate of product i (NmL/min).

3.3. Catalysts Characterization Techniques

Fresh catalysts were characterized by different techniques. An inductively coupled plasma optical emission spectroscopy (ICP-OES) instrument, model 2000-DV (Perkin Elmer, Waltham, MA, USA), was used to measure the quantity of each element in the catalysts. The catalysts were properly dissolved using a digester and thereafter, analyzed by ICP-OES.
The textural properties, BET specific surface area and pore volume and average pore diameter, of the calcined and outgassed (at 423 K for 2 h) catalysts were evaluated by means of N2 adsorption-desorption isotherms obtained at 77 K using an Autosorb 1C-TCD.
Through temperature-programmed reduction, TPR, the reducible species formed during calcination step of the catalysts, and the reduction temperature were determined. The measurements were carried out using an Autosorb 1C-TCD apparatus, equipped with a thermal conductivity detector. A continuous flow of 5% H2/Ar (40 NmL/min) was passed over 500 mg of calcined catalyst powder (0.42–0.50 mm diameter particle size). The temperature was increased from room temperature to 1273 K at a rate of 10 K/min. The sample was previously outgassed at 573 K (rate of 5 K/min) during 30 min.
Nickel dispersion was measured by H2-pulse chemisorption at 313 K in the Autosorb 1C-TCD unit. Prior to pulse chemisorption experiment, all samples were reduced under pure H2 flow (40 NmL/min) for 2 h at 1073 K (rate of 10 K/min). To calculate metal dispersion, adsorption stoichiometry of H/Ni = 2 was assumed. Dispersion is calculated as follows:
D = v m · n · 100 · M 22 , 414 · m · w t .   %
where vm: adsorbed volume, measured at standard conditions (cm3); n: chemisorption stoichiometry factor; M: atomic weight of Ni; m: mass of the sample (g); wt. %: metal loading.
A temperature-programmed oxidation (TPO) was carried out by a thermogravimetric analysis (TGA) in order to quantify the coke amount produced during the experiments using a Mettler Toledo TGA/SDTA851 apparatus equipped with a TSO 801RO robot. Samples were heated from room temperature to 1023 K at 10 K/min flowing continuously 100 mL/min of pure oxygen.
The X-ray powder diffraction, XRD, of fresh and calcined catalysts’ patterns were collected using a X’PERT PRO automatic diffractometer operating at 40 kV and 40 mA, in theta-theta configuration, secondary monochromator with Cu-Kα radiation (λ = 1.5418 Å) and a PIXcel solid state detector (Panalytical, Almelo, The Netherlands). The samples were mounted on a zero background silicon wafer fixed in a generic sample holder. Data were collected from 10 to 80° 2θ (step size = 0.026 and time per step = 625 s) at RT. A fixed divergence and antiscattering slit giving a constant volume of sample illumination was used.
XPS technique was used to evaluate the surface characteristics (oxidation state of the species formed, interactions, atomic ratios, etc.) of the fresh and used samples. The measurements were carried out with a SPECS spectrometer equipped with a hemispherical electron analyzer and a monochromatic Al Kα1 (hʋ = 1486.6 eV) X-ray source (SURFACE NANO ANALYSIS, GmbH, Berlin, Germany). The base pressure of the spectrometer was typically 10−10 mbar. The spectra were collected at pass energy of 20 eV, which is typical of high-resolution conditions. Both fresh and used catalysts were analyzed with this technique.
Finally, transmission electron micrographs were acquired on a Philips CM 200 transmission electron microscope (TEM) at an acceleration voltage of 200 kV with a LaB6 filament (Kimball Physics Inc., Wilton, NH, USA). Typically, a small amount of sample was suspended in pure ethanol, sonicated and dispersed over a Cu grid with a carbon coated cellulose acetate-butyrate holey film. TEM images were recorded using a 4 k × 4 k TVIPS CCD camera at different magnifications.

4. Conclusions

In this work, Ni catalyst reactivation after sulfur poisoning while being used to reform biogas was studied using two different regeneration processes: a self-regeneration and regeneration by low temperature oxidation. Several Ni-supported catalysts were tested including Ni/Ce-Al2O3, Ni/Zr-Al2O3, Ni/Ce-Zr-Al2O3, Rh-Ni/Ce-Al2O3 and the Katalco 57-5 commercial Ni-Al2O3 catalyst for comparison purposes. In general, the Katalco 57-5 commercial Ni-Al2O3 and Ni/Zr-Al2O3 catalysts did not recover their initial activity with any of the two regeneration processes. However, this was not the case for the Ni/Ce-Al2O3 and Ni/Ce-Zr-Al2O3 catalysts, which recovered most of their initial activity after regeneration. Additionally, after these catalysts were regenerated via the oxidative process at low temperature, the CO2 conversion achieved after regeneration was significantly higher than the one obtained before sulfur poisoning. This effect was attributed to structural modifications that alter the reaction pathways by promoting higher selectivity for the DR and rWGS reactions.
As was expected, the bimetallic Rh-Ni/Ce-Al2O3 catalyst showed higher resistance to deactivation and its sulfur poisoning seemed to be reversible using any of the two regeneration processes. Moreover, after the catalyst regeneration, this catalyst did not show selectivity to the reverse WGS reaction, which is desirable to achieve the highest possible hydrogen yield.
The catalyst characterizations only detected very small sulfur contents for the Katalco 57-5 catalyst by XPS. C was also detected, but at very low concentrations as measured by TPO. Therefore, all these results combined point towards catalyst deactivation mainly occurring via a mechanism of deposition of small amounts of sulfur on the catalysts active sites, which are successfully regenerated by sulfur oxidation with oxygen in the presence of highly dispersed Ni and a noble metal.
The result of this work point towards future investigations focusing on the use of different supports and reforming metals that can resist sulfur poisoning and promote reaction pathways that ensure the obtaining of higher hydrogen yields.

Acknowledgments

This research was supported by the University of the Basque Country (UPV/EHU), the Central Analysis Service (SGIker) of the UPV/EHU, the Spanish Ministry of Economy and Competitiveness (ENE2014-53566-P), the European Union through the European Regional Development Fund (FEDER) and Naturgas Company (EDP group).

Author Contributions

Urko Izquierdo has performed the experimental analysis of the catalysts. Iker García-García has contributed to the catalysts preparation. José Francisco Cambra and Pedro Luis Arias have contributed to the catalysts characterization. Victoria Laura Barrio has contributed to the correlation between activity and characterization. Ángel María Gutierrez and Juan Ramón Arraibi have contributed advising about reforming processes. All the authors have contributed to the writing of the manuscript.

Conflicts of Interest

The authors declare no conflict of interest.

Appendix A

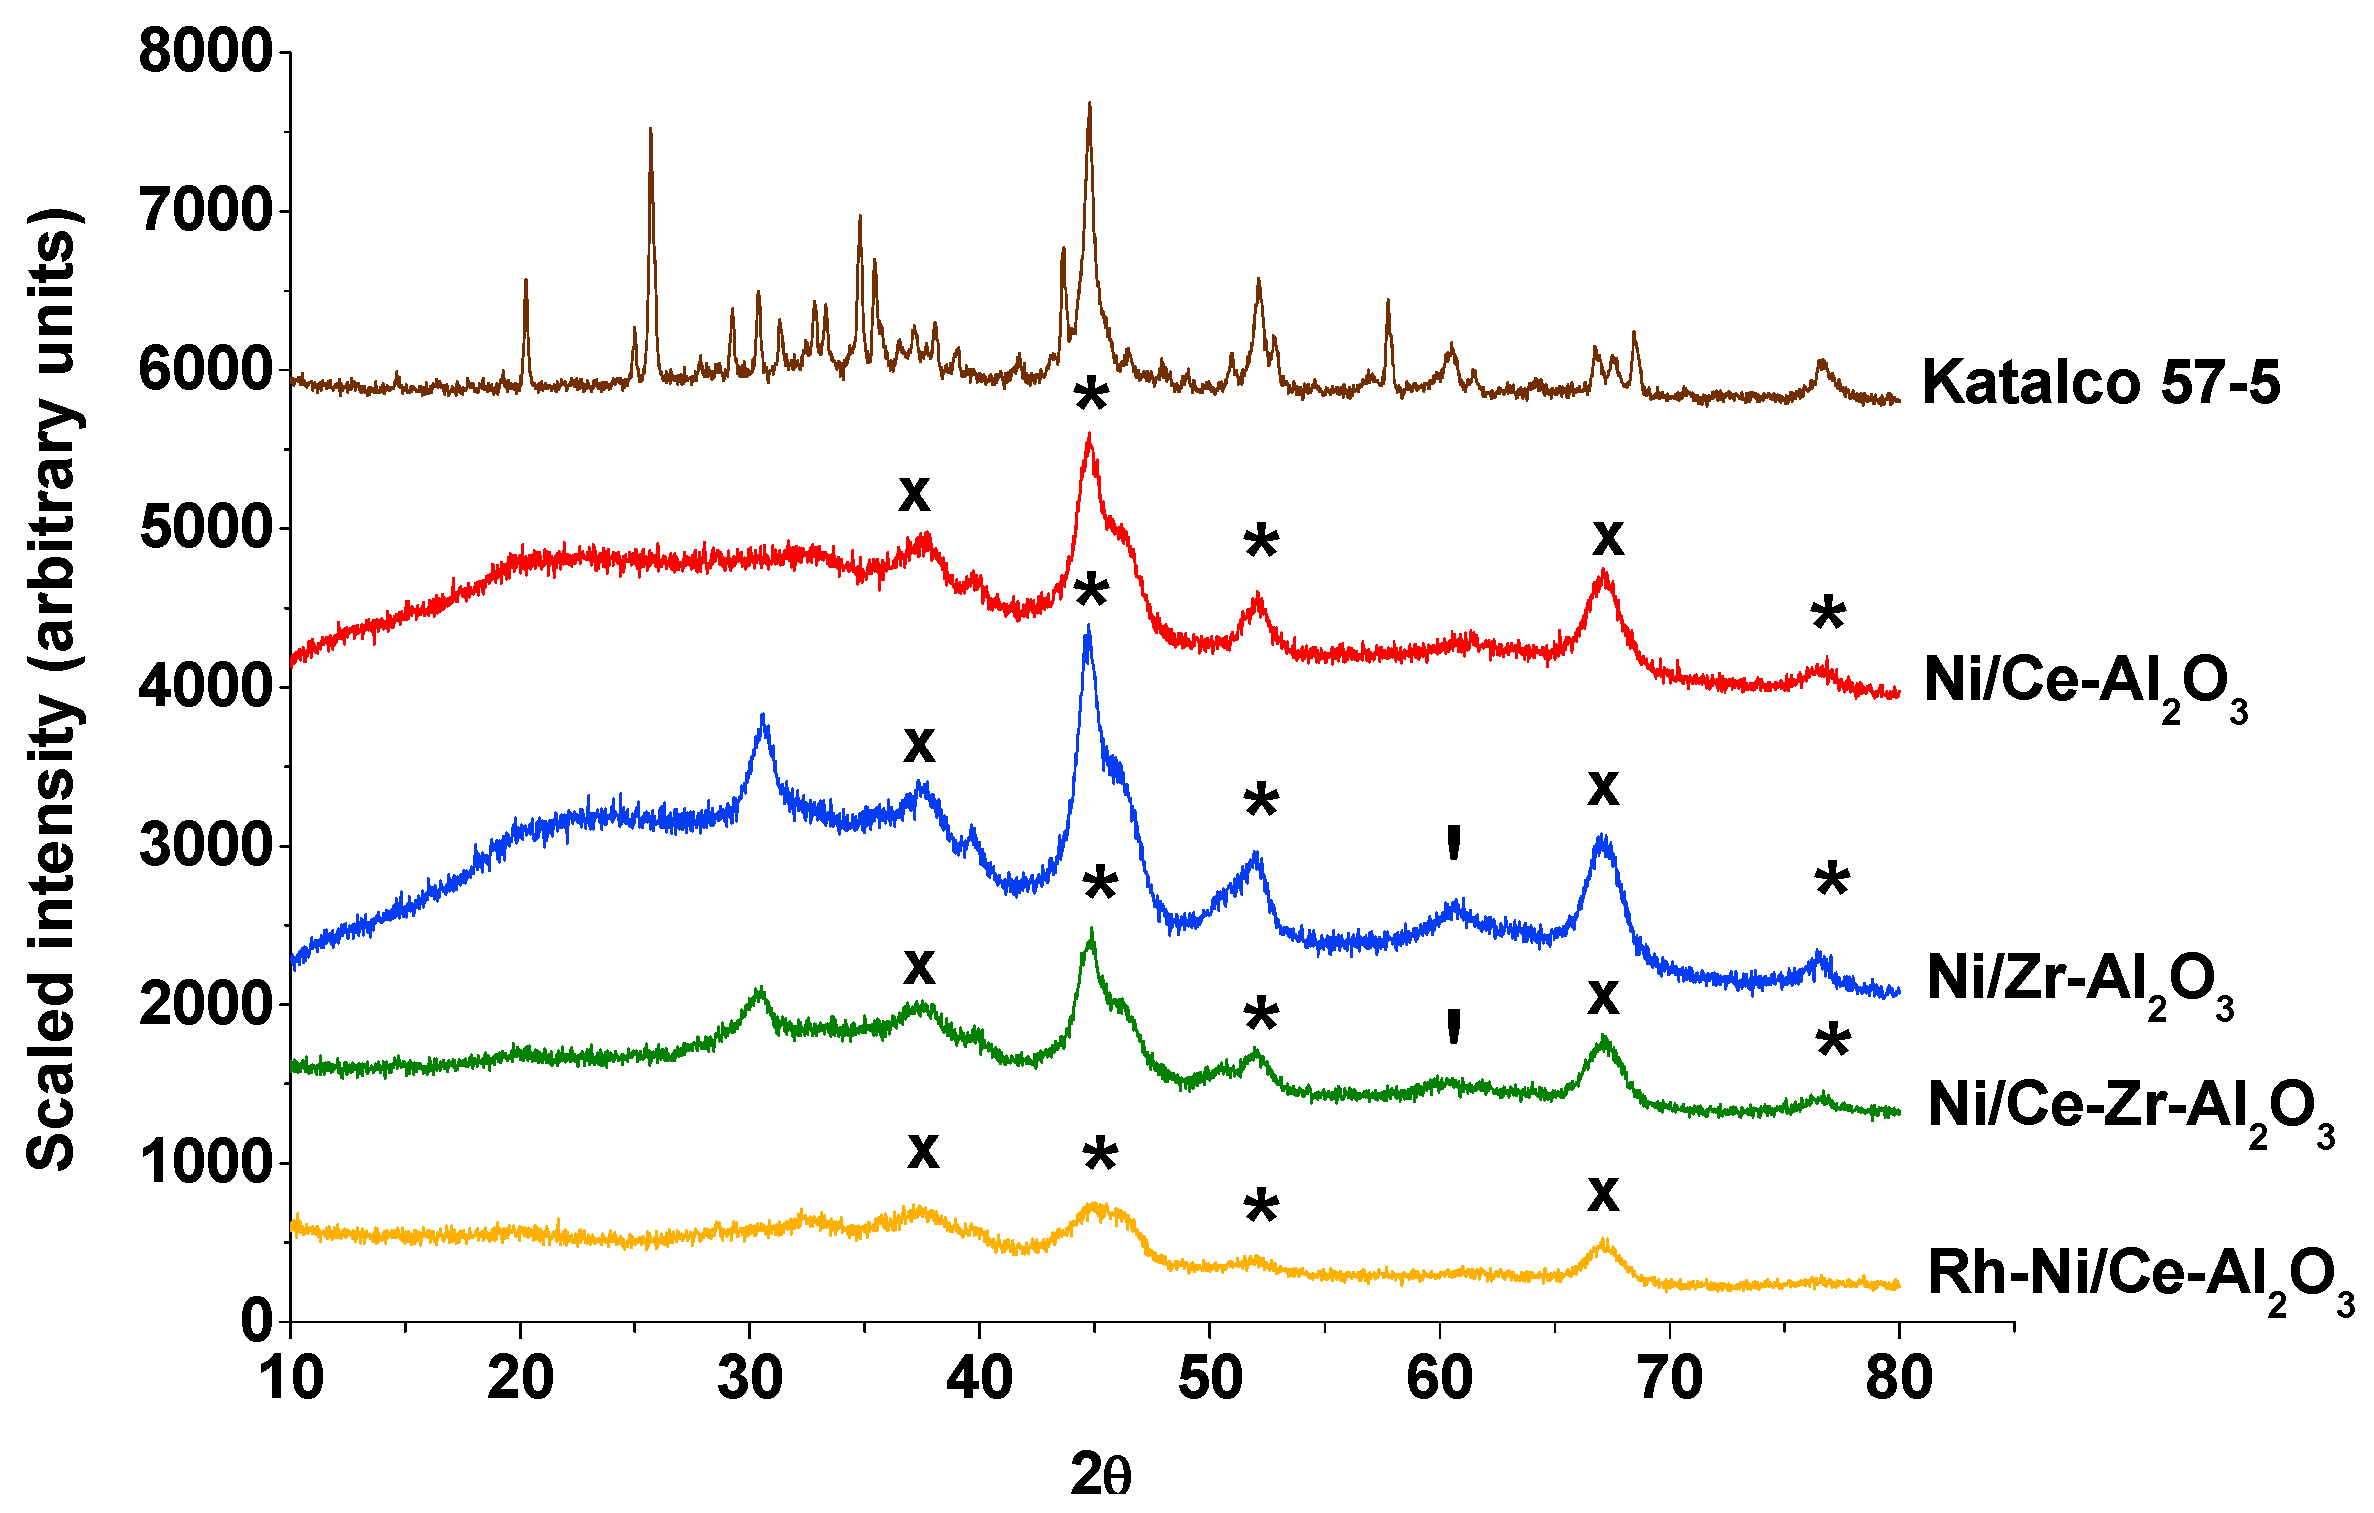
Appendix A.1. XRD Results

XRD measurements (Figure A1) were performed in order to obtain the crystallite average size of Ni, ceria and zirconium phases through the application of Scherrer equation. Applying this equation to the best-defined Ni0 reflections (52° for all the catalysts) the Ni0 average crystallites sizes were calculated and summarized in Table 2. The highest Ni0 crystallite size values were measured for Katalco 57-5 (23 nm) catalyst.
Figure A1. XRD patterns for reduced catalysts: (*) Ni0, (x) CeO2, and (’) ZrO2.
Catalysts 08 00012 g0a1
Taking into account that the XRD technique presents limitations for crystalline particles of size below 2–4 nm [35], CeO2 characteristic reflections were not attempted, because of the high dispersion of the CeO2 particles and to the overlap with Ni high intensity reflections [28]. In the case of ZrO2 particles, crystallite particles of 9 nm for the Ni/Zr-Al2O3 catalyst and of 11 nm for the Ni/Ce-Zr-Al2O3 catalyst were measured. For both catalysts, Ni0 crystallites of 7 nm were estimated.

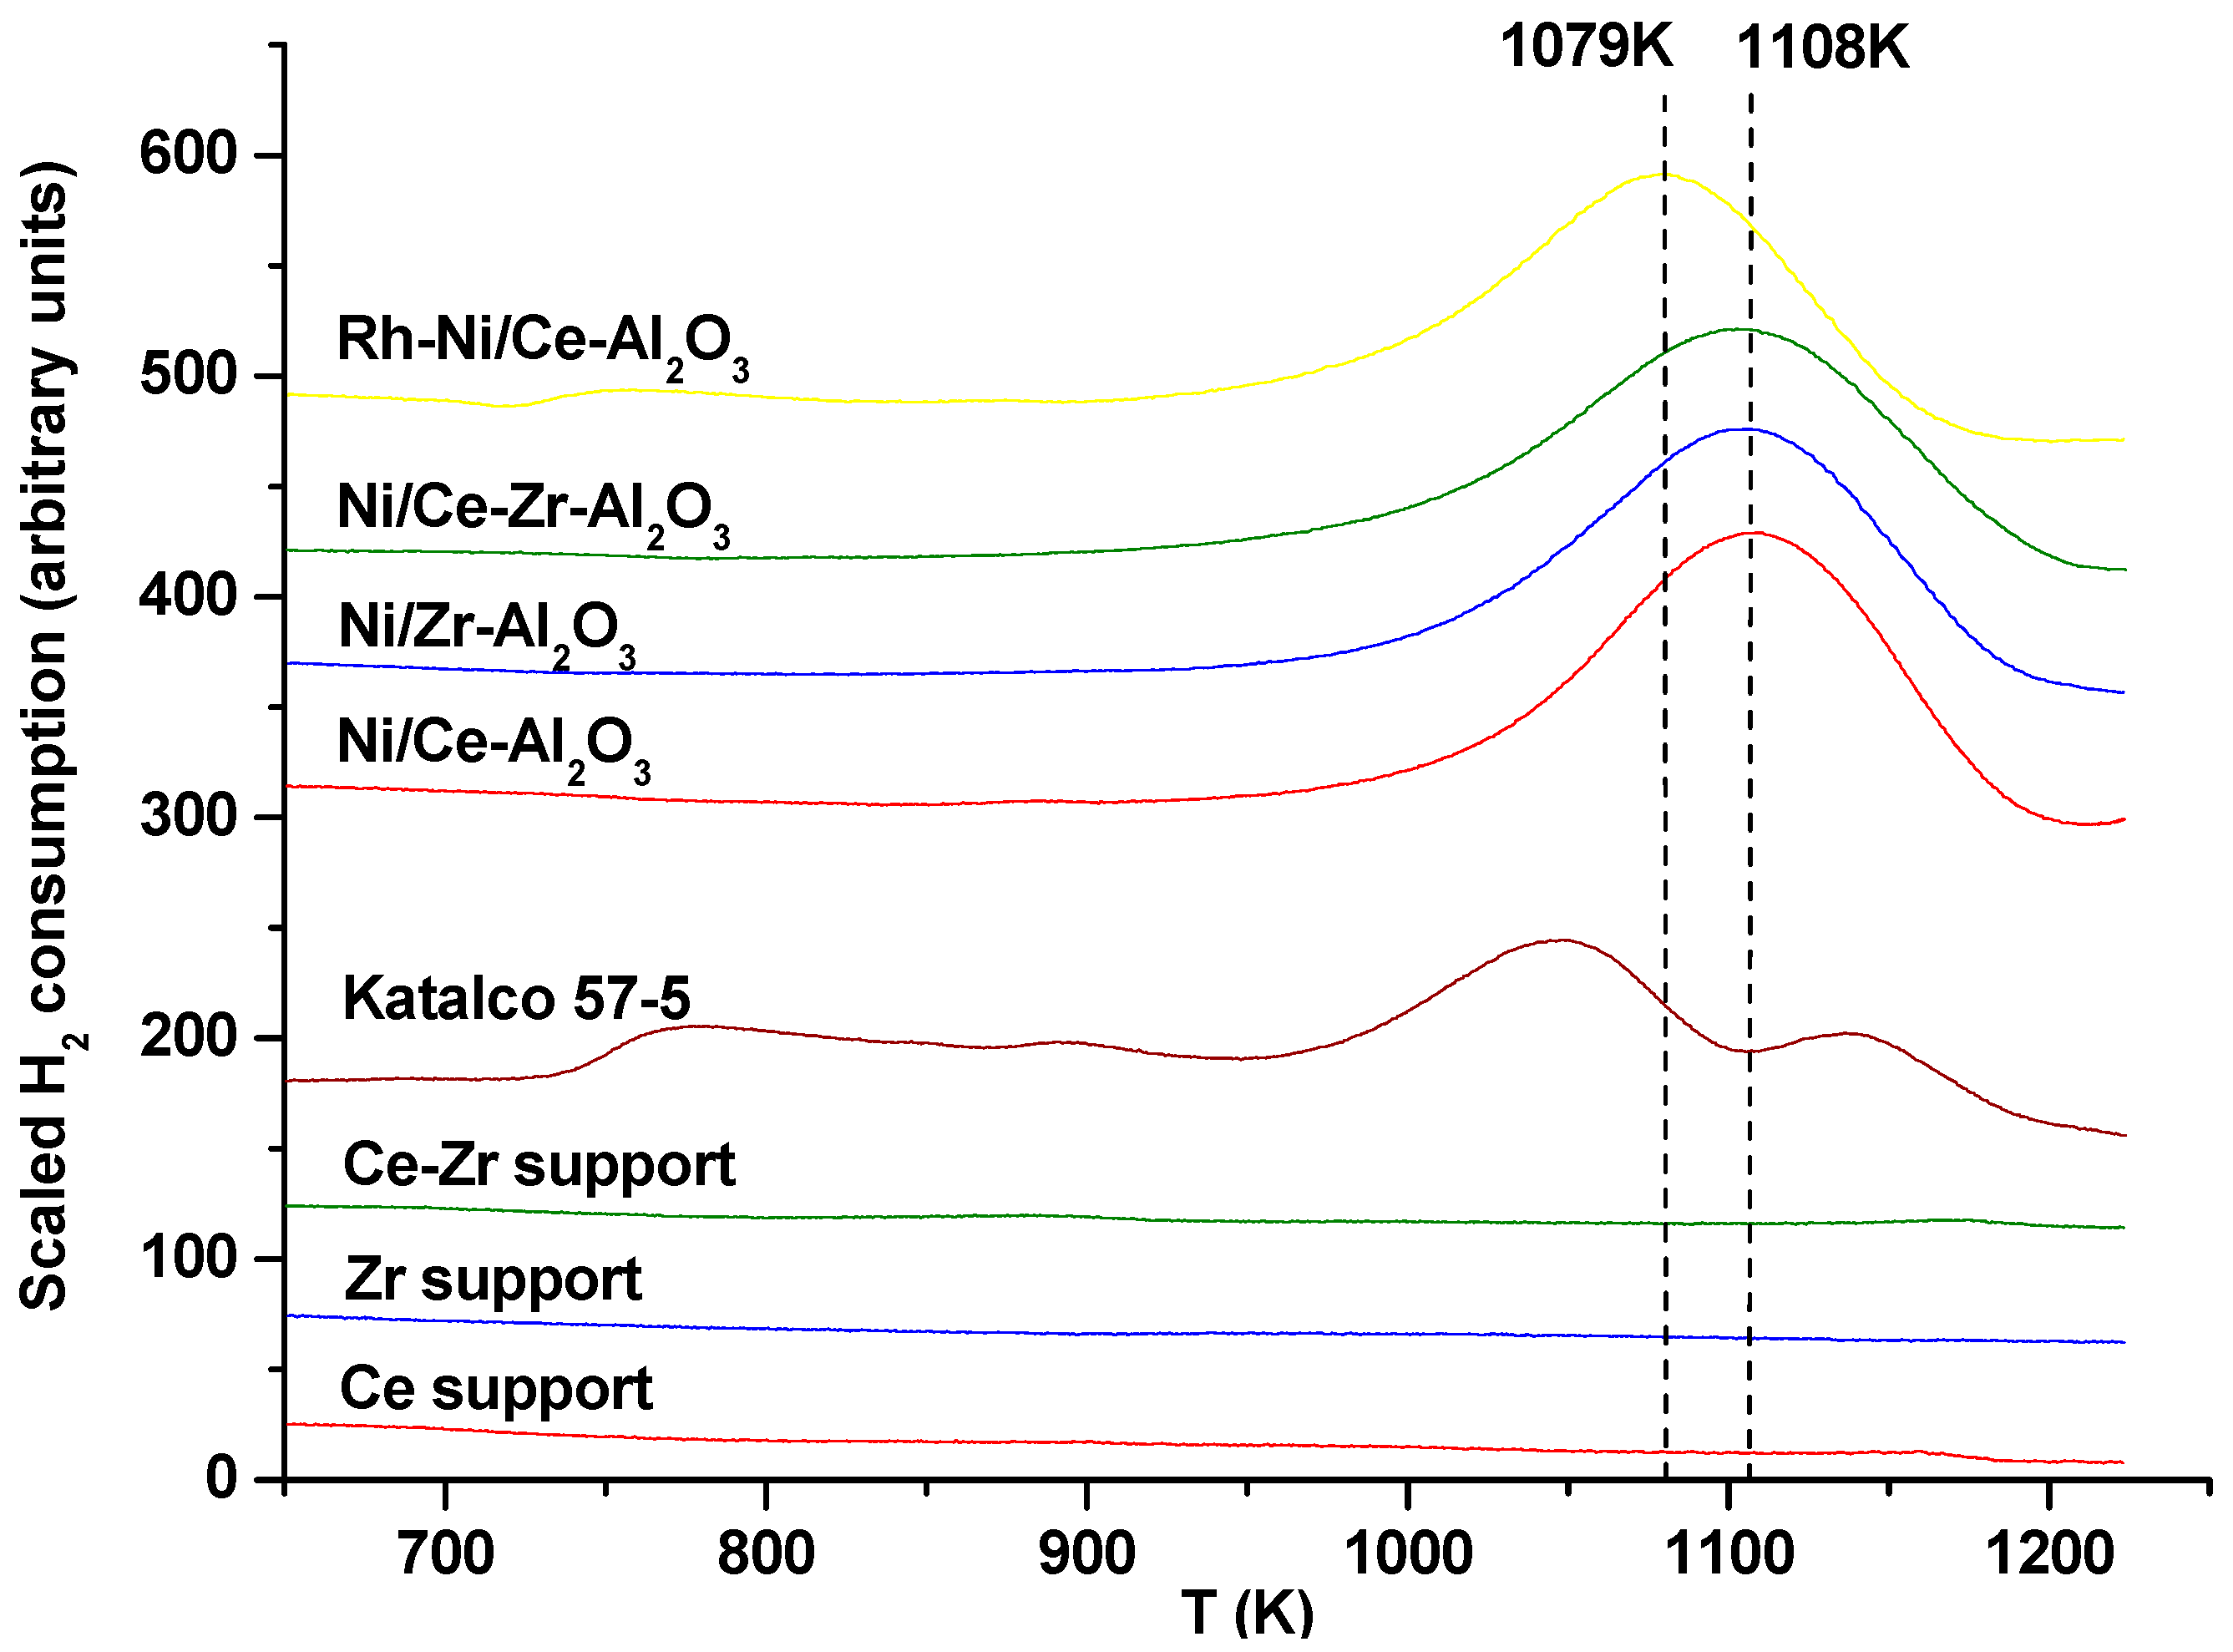
Appendix A.2. TPR Profiles

Figure A2 shows all TPR profiles of fresh calcined supports and catalysts.
Figure A2. TPR profiles of freshly calcined catalysts and supports.
Catalysts 08 00012 g0a2

Appendix A.3. XPS Spectra

The freshly calcined catalysts were characterized employing the XPS technique in order to detect the metal species on their surface. The results are depicted in Figure A3. For all catalysts under investigation, three different Ni species were determined: elemental nickel, Ni0 ≈ 852.8 eV, nickel oxide, NiO ≈ 853.8 eV, nickel aluminate, NiAl2O4 ≈ 856.0 eV and nickel oxide satellite, NiOsat ≈ 861.5 eV. These results are in good agreement with the ones obtained by TPR.
Additionally, cerium was determined as cerium dioxide according to the binding energies of the 3d electron at 898.3 eV, 908.8 eV, 905.3 eV, 907.3 eV and 916.7 eV. Also the peak at 903.7 eV was assigned to Ce2O3/ZrO2 species [36].
Figure A3. XPS spectra of freshly calcined catalysts.
Catalysts 08 00012 g0a3

References

  1. Afonso, T.L.; Marques, A.C.; Fuinhas, J.A. Strategies to make renewable energy sources compatible with economic growth. Energy Strateg. Rev. 2017, 18, 121–126. [Google Scholar] [CrossRef]
  2. Foster, E.; Contestabile, M.; Blazquez, J.; Manzano, B.; Workman, M.; Shah, N. The unstudied barriers to widespread renewable energy deployment: Fossil fuel price responses. Energy Policy 2017, 103, 258–264. [Google Scholar] [CrossRef]
  3. Ryckebosch, E.; Drouillon, M.; Vervaeren, H. Techniques for transformation of biogas to biomethane. Biomass Bioenergy 2011, 35, 1633–1645. [Google Scholar] [CrossRef]
  4. Budzianowski, W.M.; Postawa, K. Renewable energy from biogas with reduced carbon dioxide footprint: Implications of applying different plant configurations and operating pressures. Renew. Sustain. Energy Rev. 2017, 68, 852–868. [Google Scholar] [CrossRef]
  5. Ramaraj, S.; Hemaiswarya, S.; Raja, R.; Ganesan, V.; Anbazhagan, C.; Carvalho, I.S.; Juntawong, N. Microalgae as an Attractive Source for Biofuel Production. In Environmental Sustainability; Thangavel, P., Sridevi, G., Eds.; Springer: New Delhi, India, 2015. [Google Scholar]
  6. Ullah Khan, I.; Hafiz Dzarfan Othman, M.; Hashim, H.; Matsuura, T.; Ismail, A.F.; Rezaei-DashtArzhandi, M.; Wan Azelee, I. Biogas as a renewable energy fuel—A review of biogas upgrading, utilisation and storage. Energy Convers. Manag. 2017, 150, 277–294. [Google Scholar] [CrossRef]
  7. REN 21. Renewables 2017: Global Status Report. Available online: http://www.ren21.net/wp-content/uploads/2017/06/17-8399_GSR_2017_Full_Report_0621_Opt.pdf (accessed on 3 January 2018).
  8. Hakawati, R.; Smyth, B.M.; Mccullough, G.; De Rosa, F.; Rooney, D. What is the most energy efficient route for biogas utilization: Heat, electricity or transport? Appl. Energy 2017, 206, 1076–1087. [Google Scholar] [CrossRef]
  9. Pino, L.; Vita, A.; Laganà, M.; Recupero, V. Hydrogen from biogas: Catalytic tri-reforming process with Ni/La–Ce–O mixed oxides. Appl. Catal. B Environ. 2014, 148–149, 91–105. [Google Scholar] [CrossRef]
  10. Vita, A.; Italiano, C.; Fabiano, C.; Pino, L.; Laganà, M.; Recupero, V. Hydrogen-rich gas production by steam reforming of n-dodecane: Part I: Catalytic activity of Pt/CeO2 catalysts in optimized bed configuration. Appl. Catal. B Environ. 2016, 199, 350–360. [Google Scholar] [CrossRef]
  11. García-Vargas, J.M.; Valverde, J.L.; De Lucas-Consuegra, A.; Gómez-Monedero, B.; Sánchez, P.; Dorado, F. Precursor influence and catalytic behaviour of Ni/CeO2 and Ni/SiC catalysts for the tri-reforming process. Appl. Catal. A Gen. 2012, 431–432, 49–56. [Google Scholar]
  12. Sie, S.T.; Krishna, R. Fundamentals and selection of advanced Fischer–Tropsch reactors. Appl. Catal. A Gen. 1999, 186, 55–70. [Google Scholar] [CrossRef]
  13. Nahar, G.; Mote, D.; Dupont, V. Hydrogen production from reforming of biogas: Review of technological advances and an Indian perspective. Renew. Sustain. Energy Rev. 2017, 76, 1032–1052. [Google Scholar] [CrossRef]
  14. Rasi, S.; Veijanen, A.; Rintala, J. Trace compounds of biogas from different biogas production plants. Energy 2007, 32, 1375–1380. [Google Scholar] [CrossRef]
  15. Saha, B.; Khan, A.; Ibrahim, H.; Idem, R. Evaluating the performance of non-precious metal based catalysts for sulfur-tolerance during the dry reforming of biogas. Fuel 2014, 120, 202–217. [Google Scholar] [CrossRef]
  16. Chattanathan, S.A.; Adhikari, S.; McVey, M.; Fasina, O. Hydrogen production from biogas reforming and the effect of H2S on CH4 conversion. Int. J. Hydrogen Energy 2014, 39, 19905–19911. [Google Scholar] [CrossRef]
  17. Appari, S.; Janardhanan, V.M.; Bauri, R.; Jayanti, S. Deactivation and regeneration of Ni catalyst during steam reforming of model biogas: An experimental investigation. Int. J. Hydrogen Energy 2014, 39, 297–304. [Google Scholar] [CrossRef] [Green Version]
  18. Hulteberg, C. Sulphur-tolerant catalysts in small-scale hydrogen production, a review. Int. J. Hydrogen Energy 2012, 37, 3978–3992. [Google Scholar] [CrossRef]
  19. Izquierdo, U.; Barrio, V.L.; Requies, J.; Cambra, J.F.; Güemez, M.B.; Arias, P.L. Tri-reforming: A new biogas process for synthesis gas and hydrogen production. Int. J. Hydrogen Energy 2013, 38, 7623–7631. [Google Scholar] [CrossRef]
  20. Fidalgo, B.; Muradov, N.; Menéndez, J.A. Effect of H2S on carbon-catalyzed methane decomposition and CO2 reforming reactions. Int. J. Hydrogen Energy 2012, 37, 14187–14194. [Google Scholar] [CrossRef]
  21. Albertazzi, S.; Basile, F.; Brandin, J.; Einvall, J.; Fornasari, G.; Hulteberg, C.; Sanati, M.; Trifirò, F.; Vaccari, A. Effect of fly ash and H2S on a Ni-based catalyst for the upgrading of a biomass-generated gas. Biomass Bioenergy 2008, 32, 345–353. [Google Scholar] [CrossRef]
  22. Packer, A.P.; Lariviere, D.; Li, C.; Chen, M.; Fawcett, A.; Nielsen, K.; Mattson, K.; Chatt, A.; Scriver, C.; Erhardt, L.S. Validation of an inductively coupled plasma mass spectrometry (ICP-MS) method for the determination of cerium, strontium, and titanium in ceramic materials used in radiological dispersal devices (RDDs). Anal. Chim. Acta 2007, 588, 166–172. [Google Scholar] [CrossRef] [PubMed]
  23. García-Diéguez, M.; Herrera, M.C.; Pieta, I.S.; Larrubia, M.A.; Alemany, L.J. NiBa catalysts for CO2-reforming of methane. Catal. Commun. 2010, 11, 1133–1136. [Google Scholar] [CrossRef]
  24. Tsipouriari, V.A.; Efstathiou, A.M.; Zhang, Z.L.; Verykios, X.E. Reforming of methane with carbon dioxide to synthesis gas over supported Rh catalysts. Catal. Today 1994, 21, 579–587. [Google Scholar] [CrossRef]
  25. Izquierdo, U.; Barrio, V.L.; Lago, N.; Requies, J.; Cambra, J.F.; Güemez, M.B.; Arias, P.L. Biogas steam and oxidative reforming processes for synthesis gas and hydrogen production in conventional and microreactor reaction systems. Int. J. Hydrogen Energy 2012, 37, 13829–13842. [Google Scholar] [CrossRef]
  26. San-José-Alonso, D.; Juan-Juan, J.; Illán-Gómez, M.J.; Román-Martínez, M.C. Ni, Co and bimetallic Ni–Co catalysts for the dry reforming of methane. Appl. Catal. A Gen. 2009, 371, 54–59. [Google Scholar] [CrossRef]
  27. Lau, C.S.; Tsolakis, A.; Wyszynski, M.L. Biogas upgrade to syn-gas (H2–CO) via dry and oxidative reforming. Int. J. Hydrogen Energy 2011, 36, 397–404. [Google Scholar] [CrossRef]
  28. Iriondo, A.; Barrio, V.L.; Cambra, J.F.; Arias, P.L.; Guemez, M.B.; Sanchez-Sanchez, M.C.; Navarro, R.M.; Fierro, J.L.G. Glycerol steam reforming over Ni catalysts supported on ceria and ceria-promoted alumina. Int. J. Hydrogen Energy 2010, 35, 11622–11633. [Google Scholar] [CrossRef]
  29. Iriondo, A.; Cambra, J.F.; Güemez, M.B.; Barrio, V.L.; Requies, J.; Sánchez-Sánchez, M.C.; Navarro, R.M. Effect of ZrO2 addition on Ni/Al2O3 catalyst to produce H2 from glycerol. Int. J. Hydrogen Energy 2012, 37, 7084–7093. [Google Scholar] [CrossRef]
  30. Sánchez-Sánchez, M.C.; Navarro, R.M.; Fierro, J.L.G. Ethanol steam reforming over Ni/La–Al2O3 catalysts: Influence of lanthanum loading. Catal. Today 2007, 129, 336–345. [Google Scholar] [CrossRef]
  31. Blanco, P.H.; Wu, C.; Onwudili, J.A.; Williams, P.T. Characterization and evaluation of Ni/SiO2 catalysts for hydrogen production and tar reduction from catalytic steam pyrolysis-reforming of refuse derived fue. Appl. Catal. B Environ. 2013, 134–135, 238–250. [Google Scholar] [CrossRef]
  32. Jablonski, W.S.; Villano, S.M.; Dean, A.M. A comparison of H2S, SO2, and COS poisoning on Ni/YSZ and Ni/K2O-CaAl2O4 during methane steam and dry reforming. Appl. Catal. A Gen. 2015, 502, 399–409. [Google Scholar] [CrossRef]
  33. Appari, S.; Janardhanan, V.M.; Bauri, R.; Jayanti, S.; Deutschmann, O. A detailed kinetic model for biogas steam reforming on Ni and catalyst deactivation due to sulfur poisoning. Appl. Catal. A Gen. 2014, 471, 118–125. [Google Scholar] [CrossRef] [Green Version]
  34. Effendi, A.; Zhang, Z.G.; Hellgardt, K.; Honda, K.; Yoshida, T. Steam reforming of a clean model biogas over Ni/Al2O3 in fluidized- and fixed-bed reactors. Catal. Today 2002, 77, 181–189. [Google Scholar] [CrossRef]
  35. Davis, E.M.; Davis, R.J. Fundamentals of Chemical Reaction Engineering; Glandt, E., Klein, T., Edgar, F., Eds.; McGraw-Hill: New York, NY, USA, 2003; Volume 43. [Google Scholar]
  36. National Institute of Standards and Technology. Available online: https://srdata.nist.gov/xps/Default.aspx (accessed on 28 November 2017).
Figure 1. Katalco 57-5 Ni-Al2O3 catalyst activity results. Top: self-regeneration. Bottom: Regeneration by oxidation. Reaction conditions: 210.0 mL/min CH4, 140.0 mL/min CO2, 197.7 mL/min N2, 52.5 mL/min O2, 0.169 mL/min H2O at 800 °C and atmospheric pressure. WHSV of 161.5 ggas·gcat−1·h−1 (0.340 g of catalyst).
Catalysts 08 00012 g001
Figure 2. Ni/Zr-Al2O3 and Ni/Ce-Zr-Al2O3 catalysts activity results. Top left: self-regeneration of the Ni/Zr-Al2O3 catalyst. Bottom left: Regeneration by oxidation of the Ni/Zr-Al2O3 catalyst. Top right: self-regeneration of the Ni/CeZr-Al2O3 catalyst. Bottom right: Regeneration by oxidation of the Ni/Ce-Zr-Al2O3 catalyst. Reaction conditions: 210.0 mL/min CH4, 140.0 mL/min CO2, 197.7 mL/min N2, 52.5 mL/min O2, 0.169 mL/min H2O at 800 °C and atmospheric pressure. WHSV of 161.5 ggas·gcat−1·h−1 (0.340 g of catalyst).
Catalysts 08 00012 g002
Figure 3. Ni/Ce-Al2O3 and Rh-Ni/Ce-Al2O3 catalysts activity results. Top right: self-regeneration of the Ni/Ce-Al2O3 catalyst. Bottom right: Regeneration by oxidation of the Ni/Ce-Al2O3 catalyst. Top left: self-regeneration of the Rh-Ni/Ce-Al2O3 catalyst. Bottom left: Regeneration by oxidation of the Rh-Ni/Ce-Al2O3 catalyst. Reaction conditions: 210.0 mL/min CH4, 140.0 mL/min CO2, 197.7 mL/min N2, 52.5 mL/min O2, 0.169 mL/min H2O at 800 °C and atmospheric pressure. WHSV of 161.5 ggas gcat−1 h−1 (0.340 g of catalyst).
Catalysts 08 00012 g003
Figure 4. Scheme of the processes studied.
Catalysts 08 00012 g004
Figure 5. TEM micrographs for the catalyst that showed best (left, Rh-Ni/Ce-Al2O3) and worst (right, Ni/Zr-Al2O3) activity results, tested after self-regeneration (top) and regeneration by oxidation (bottom). Reaction conditions: 210.0 mL/min CH4, 140.0 mL/min CO2, 197.7 mL/min N2, 52.5 mL/min O2, 0.169 mL/min H2O at 800 °C and atmospheric pressure. Weight Hourly Space Velocity (WHSV) of 161.5 ggas·gcat−1·h−1 (0.340 g of each catalyst).
Catalysts 08 00012 g005
Figure 6. TPO results represented by the first derivative of percentage weight loss for the catalysts tested after self-regeneration (left) and regeneration by oxidation (right) processes. Reaction conditions: 210.0 mL/min CH4, 140.0 mL/min CO2, 197.7 mL/min N2, 52.5 mL/min O2, 0.169 mL/min H2O at 800 °C and atmospheric pressure. WHSV of 161.5 ggas·gcat−1·h−1 (0.340 g of each catalyst).
Catalysts 08 00012 g006
Figure 7. Scheme of the Microactivity plant.
Catalysts 08 00012 g007
Table 1. Calcined catalysts specific surface area (SSA), pore volume (PV) and average pore diameter (PD).
CatalystSpecific Surface Area (m2/g)Pore Volume (cm3/g)Pore Diameter (Å)
Bare Al2O3255.01.14-
6Ce-Al Support195.00.76150.1
8Zr-Al Support180.30.67143.9
3Ce-4Zr-Al Support191.70.74150.7
13Ni/Ce-Al2O3-calcined163.30.59143.7
13Ni/Ce-Al2O3-reduced102.50.1982.5
13Ni/Zr-Al2O3-calcined166.60.62146.3
13Ni/Ce-Zr-Al2O3-calcined151.00.60153.2
13Ni/Ce-Zr-Al2O3-reduced131.00.60183.2
1Rh-13Ni/Ce-Al2O3-calcined156.80.60150.1
1Rh-13Ni/Ce-Al2O3-reduced118.30.2991.5
Katalco 57-5-calcined21.60.09169.5
Numbers before Ce, Zr, Ni, or Rh represent nominal metal wt. % of catalysts prepared, but for simplicity they are omitted in the rest of the manuscript.
Table 2. Calcined catalysts chemical composition by ICP-OES (column 2); reduced catalysts metal surface area (MSA), dispersion (D) and Ni crystallite size (CS) by hydrogen chemisorption (column 3); and calcined catalysts Ni average CS by XRD (column 4).
CatalystChemical Composition (ICP-OES)H2 Chemisorption *XRD **
Nominal/Real (wt. %)MSA (m2/g)D (%)Ni CS (nm)Ni CS (nm)
Katalco 57-5-/12.4 (Ni) -/0.4 (Ca)----
Ni/Ce-Al2O313.0/10.8 (Ni) 6.0/3.3 (Ce)5.66.415.78
Ni/Zr-Al2O313.0/11.4 (Ni) 8.0/5.5 (Zr)---7
Ni/Ce-Zr-Al2O313.0/10.6 (Ni) 3.0/2.7 (Ce) 4.0/3.6 (Zr)5.17.313.97
Rh-Ni/Ce-Al2O313.0/10.0 (Ni) 1.0/0.9 (Rh) 6.0/3.6 (Ce)8.011.6-5
* Pretreatment: fresh and calcined samples were reduced under pure H2 flow for 2 h at 1073 K.; ** No pretreatment: freshly calcined samples. The diffractograms are shown in Figure A1.
Table 3. Ni/Al and C/Al atomic ratios measured by X-ray photoelectron spectroscopy (XPS) and total weight loss (wt. %) measured by TGA. Self-regenerated samples were analyzed after stable operation of the last tri-reforming process. Samples of regeneration by oxidation were analyzed after the last H2S addition.
CatalystsFresh CatalystNi/Al Atomic RatioC/Al Atomic Ratiowt. % Loss
Self RegeneratedRegeneration by OxidationSelf RegeneratedRegeneration by OxidationSelf RegeneratedRegeneration by Oxidation
Katalco 57-50.170.150.140.950.881.981.69
Ni/Ce-Al2O30.100.070.100.380.134.114.01
Ni/Zr-Al2O30.130.160.150.190.173.795.35
Ni/Ce-Zr-Al2O30.050.080.110.200.154.285.57
Rh-Ni/Ce-Al2O30.160.100.160.200.164.279.01

