Communication

Effect of CO Concentration on the α-Value of Plasma-Synthesized Co/C Catalyst in Fischer-Tropsch Synthesis

1
Department of Chemical & Biotechnological Engineering, Université de Sherbrooke, Sherbrooke, QC J1K 2R1, Canada
2
Canadian Light Source Inc., Saskatoon, SK S7N 2 V3, Canada
*
Author to whom correspondence should be addressed.
Catalysts 2017, 7(2), 69; https://doi.org/10.3390/catal7020069
Submission received: 28 December 2016 / Revised: 9 February 2017 / Accepted: 13 February 2017 / Published: 21 February 2017

Abstract

:
A plasma-synthesized cobalt catalyst supported on carbon (Co/C) was tested for Fischer-Tropsch synthesis (FTS) in a 3-phase continuously-stirred tank slurry reactor (3-φ-CSTSR) operated isothermally at 220 °C (493 K), and 2 MPa pressure. Initial syngas feed stream of H2:CO ratio = 2 with molar composition of 0.6 L/L (60 vol %) H2 and 0.3 L/L (30 vol %) CO, balanced in 0.1 L/L (10 vol %) Ar was used, flowing at hourly space velocity (GHSV) of 3600 cm3·h−1·g−1 of catalyst. Similarly, other syngas feed compositions of H2:CO ratio = 1.5 and 1.0 were used. Results showed ~40% CO conversion with early catalyst selectivity inclined towards formation of gasoline (C4–C12) and diesel (C13–C20) fractions. With prolonged time-on-stream (TOS), catalyst selectivity escalated towards the heavier molecular-weight fractions such as waxes (C21+). The catalyst’s α-value, which signifies the probability of the hydrocarbon-chain growth was empirically determined to be in the range of 0.85–0.87 (at H2:CO ratio = 2), demonstrating prevalence of the hydrocarbon-chain propagation, with particular predisposition for wax production. The inhibiting CO effect towards FTS was noted at molar H2:CO ratio of 1.0 and 1.5, giving only ~10% and ~20% CO conversion respectively, although with a high α-value of 0.93 in both cases, which showed predominant production of the heavier molecular weight fractions.

Graphical Abstract

1. Introduction

At present, South African Synthetic Oil Ltd., (SASOL) operates the world largest coal liquefaction plants and it produces synthetic fuels commercially through Fischer-Tropsch catalysis. Syngas, a mixture of carbon monoxide and hydrogen (CO + H2) is polymerized to a myriad of hydrocarbon products with –CH2– being considered as the basic monomer, as illustrated in sample Equation (1) by Thomas and Thomas [1] (p. 526). In addition to fuels and oils, Sasol produces locomotive and industrial lubricants, greases and solid waxes, cleansers and degreasing agents, besides a full spectrum of chemicals that include solvents, ammonia, mining reagents, explosives and polymers such as polyethylene, polypropylene and polyvinyl chloride.
n   C O + 2 n   H 2     [ C H 2 ] n + n   H 2 O
In the production of high molecular-weight hydrocarbons such as diesel and waxes, a Co-based catalyst is normally preferred. Although the catalyst exhibits high activity and long life in the low-temperature Fischer-Tropsch synthesis (LT-FTS) regime, exposure to high temperatures results in carbon deposition on metal-oxide supports such as Al2O3, SiO2 or TiO2, which is detrimental to the catalyst’s structural integrity [2]. However, there is a view that a carbon-supported catalyst may not be impacted in a similar way because of its resistance to both carbon fouling and carburization effects [3]. For this reason, we are advocating for the application of plasma-generated graphitic carbon as an effective FTS catalyst support in this study. Indeed some authors have observed the value carburization process can offer in catalyst regeneration. For example, Equation (2) shows a proposed mechanism of regenerating a Co-based FTS catalyst through carburization by initially forming the less active Co2C phase, followed by reduction in H2 [4].
CoO CO Co 2 C H 2 Co
Moreover, the graphitic carbon-support structure has been noted to enhance catalyst selectivity towards high molecular weight fractions with more than five carbon atoms in the hydrocarbon chain (C5+) by facilitating electron transfer between the Co metal and CO molecules during FTS [5]. It has been observed that certain desirable properties of the C support can easily be activated, enhanced or varied by functionalization using either basic or acidic media [6]. In fact, the very presence of carbon as a support does not seem to negatively influence the performance of the nanometric carbon-supported catalysts that were synthesized through plasma [7]. In the recent past, great interest has been stimulated in catalyst preparation by various plasma technologies because plasma produces materials that have improved LT-FTS activity, enhanced stability, and have better anti-carbon deposition performance [8]. In LT-FTS, a comparative study of identical single-metal Co/C catalysts produced by various methods showed that induction suspension plasma-spray (SPS) technology produces superior FTS catalysts [9].
Another approach that has been applied in FTS to improve selectivity towards the C5+ products is through CO-enriched syngas feeds, which lowers CH4 formation [10]. Nevertheless, where gas composition has been used to determine the product spectrum, low CO conversions have prevailed, with an increased reaction rate being observed at higher H2:CO ratios above 1.6, and this has an added advantage of using less catalyst quantities for the same feed conversion [2]. Since natural resources such as coal are finite, pursuit for alternative carbon sources and the use of CO-rich syngas of biomass origin is contemplated [11], and may present benefits that comprise sustainability through production of biomass-derived fuels. Interest in a Biomass to Liquid process via Fischer–Tropsch (BTL-FT) synthesis is growing steadily from both academia and industry because of its ability to produce carbon neutral and environmentally friendly clean fuels [12]. Commercial production of such fuels while simultaneously satisfying the increasing energy demand and meeting stringent environmental regulations is inevitable in the foreseeable future, particularly with the push towards sulphur-free diesel [13]. The world today is therefore bracing itself for compliance in automobile fuel production; to shift away from fossil fuels towards renewable sources of energy such as biomass.
A number of theories have been developed to elucidate the polymerization mechanisms that influence FTS product selectivity. In order to determine α, the probability of a catalyst being selective towards the formation of C5+ products, the Anderson-Schulz-Flory (ASF) distribution model shown in Equation (3) is normally applied [14]. The α-value is calculated from the gradient of the linearized expression in the plot of log(Mn/n) versus n, given as Equation (4) [15] (p. 403).
M n n = ( 1 α ) 2 α ( n 1 )
ln α = n ln α + l n [ ( 1 α ) 2 α ]
where:
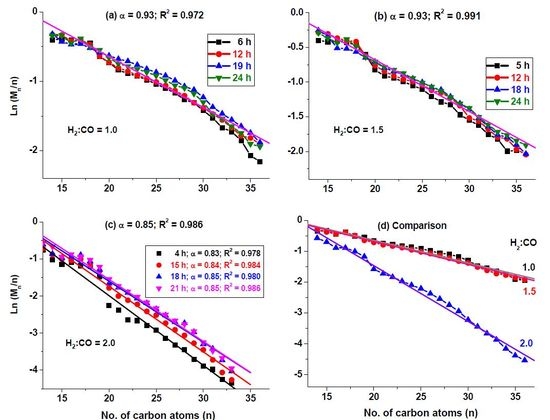
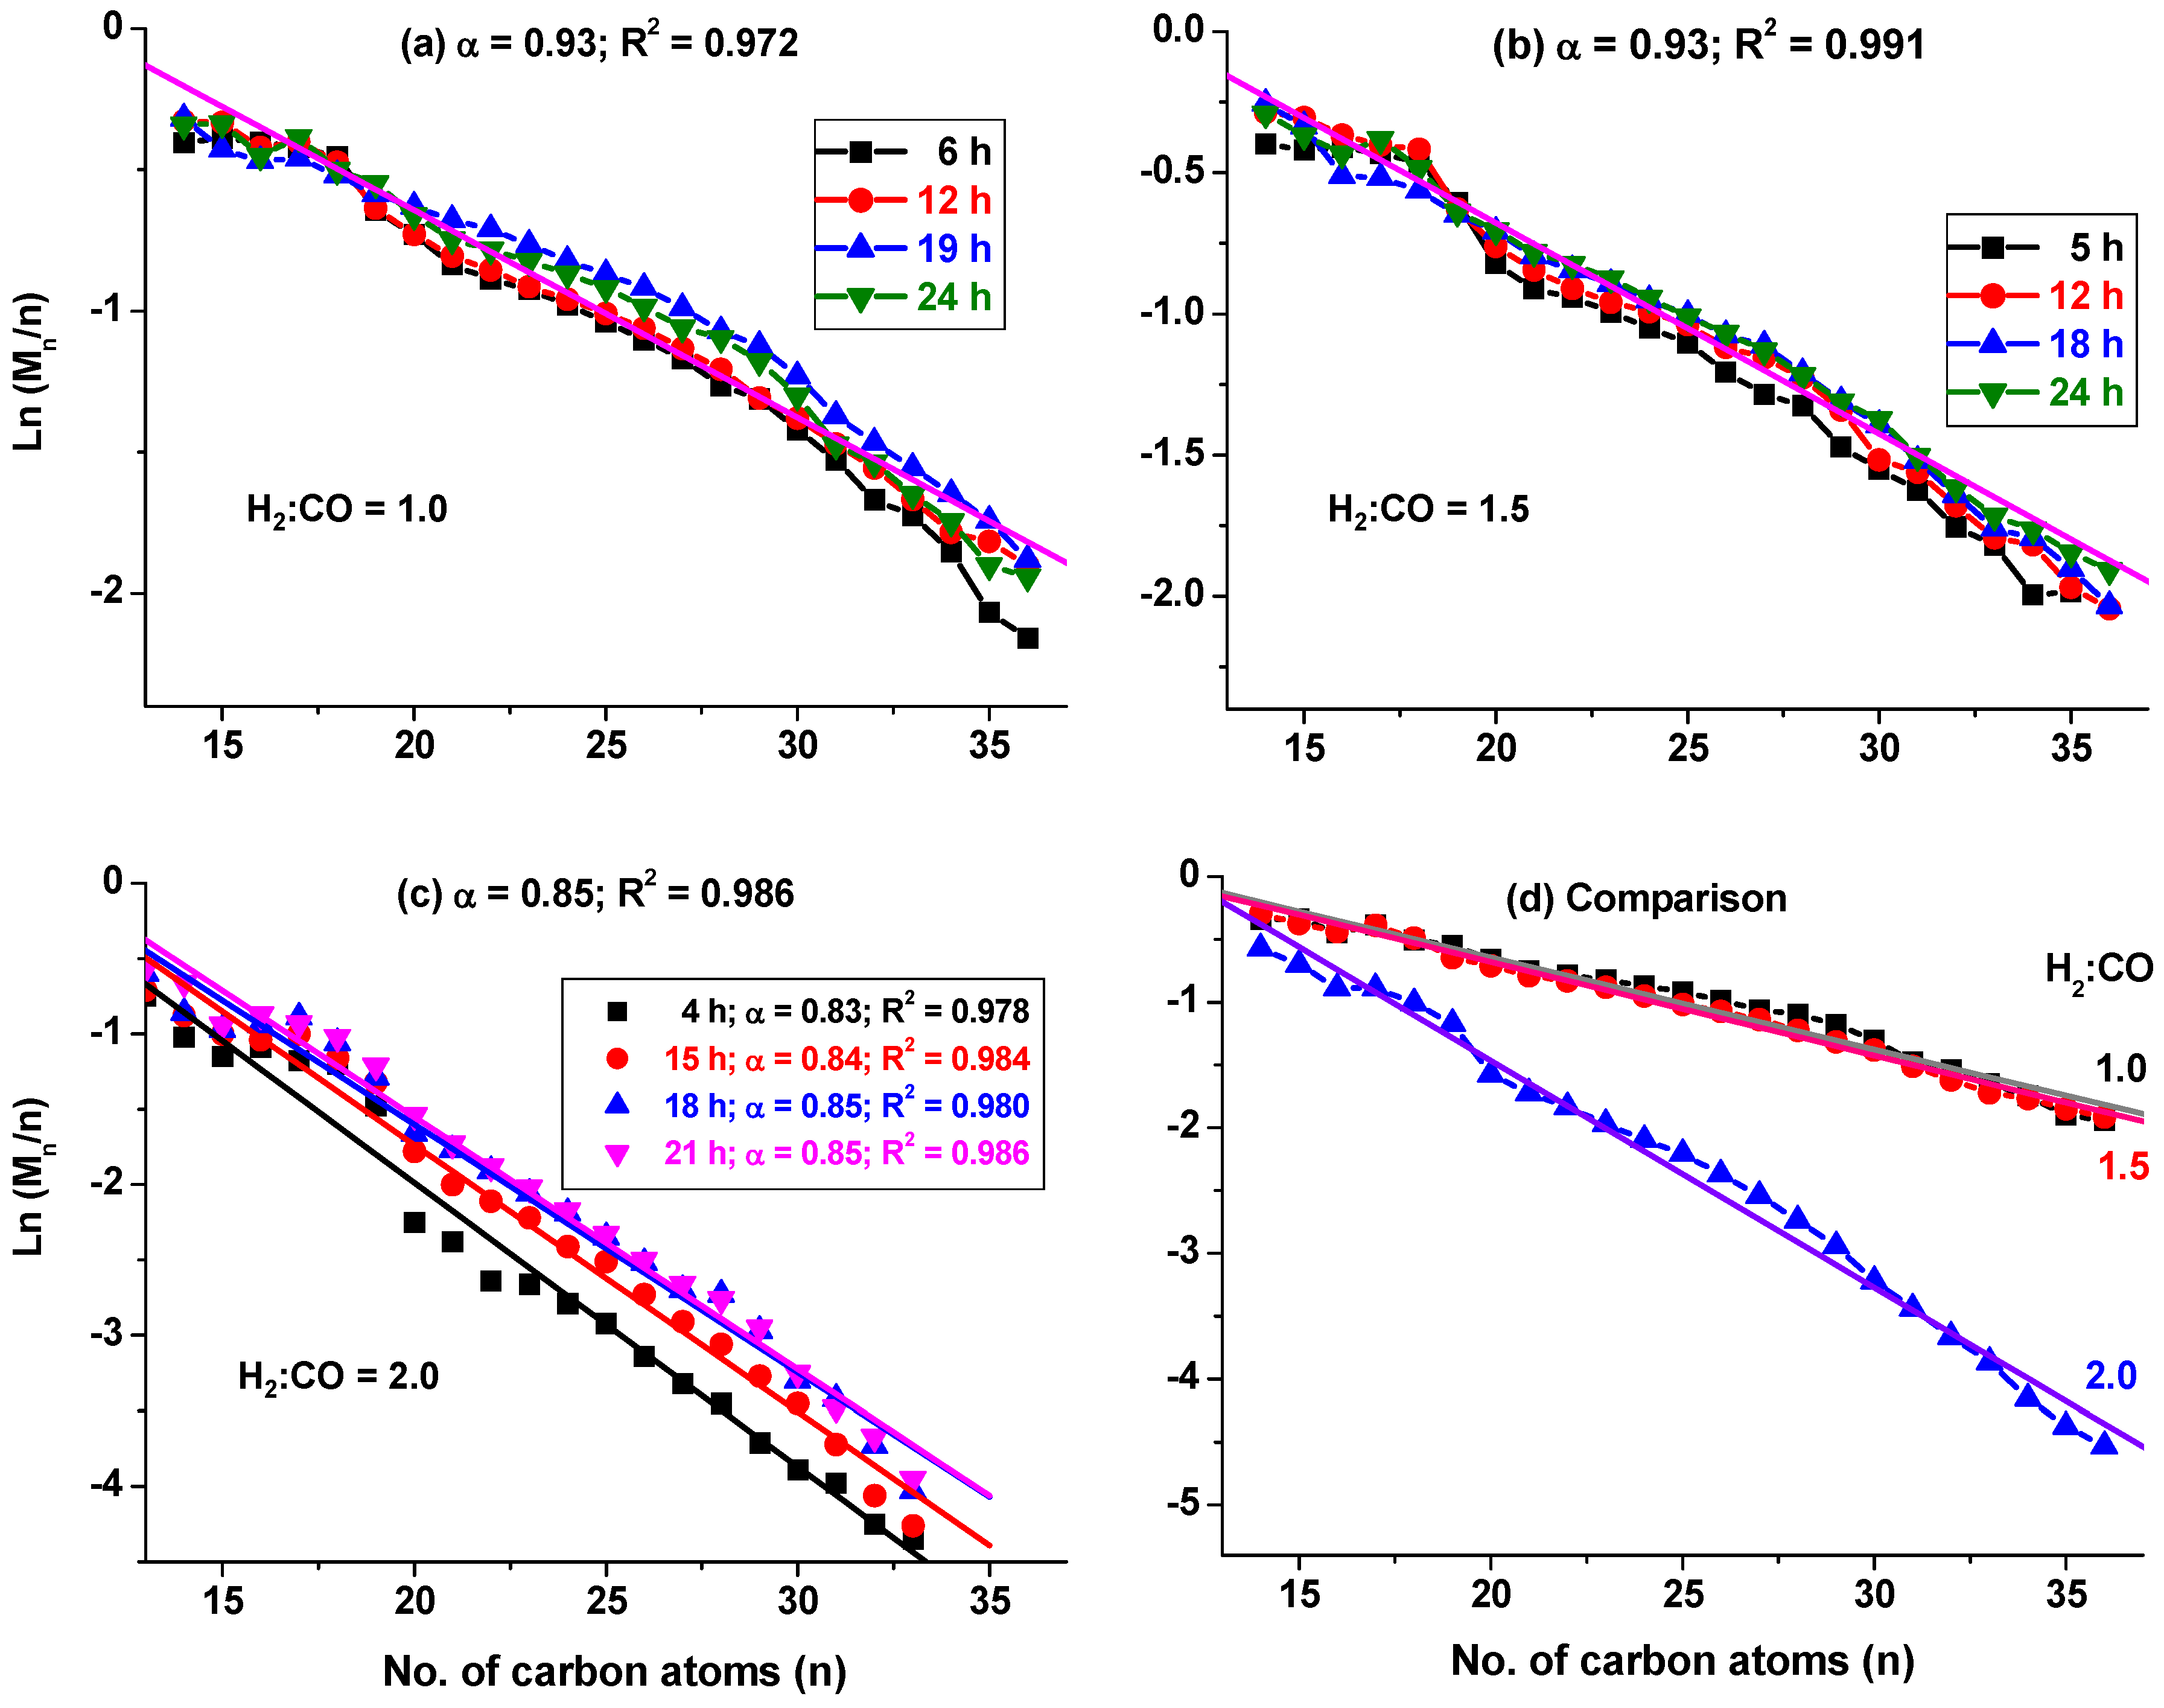
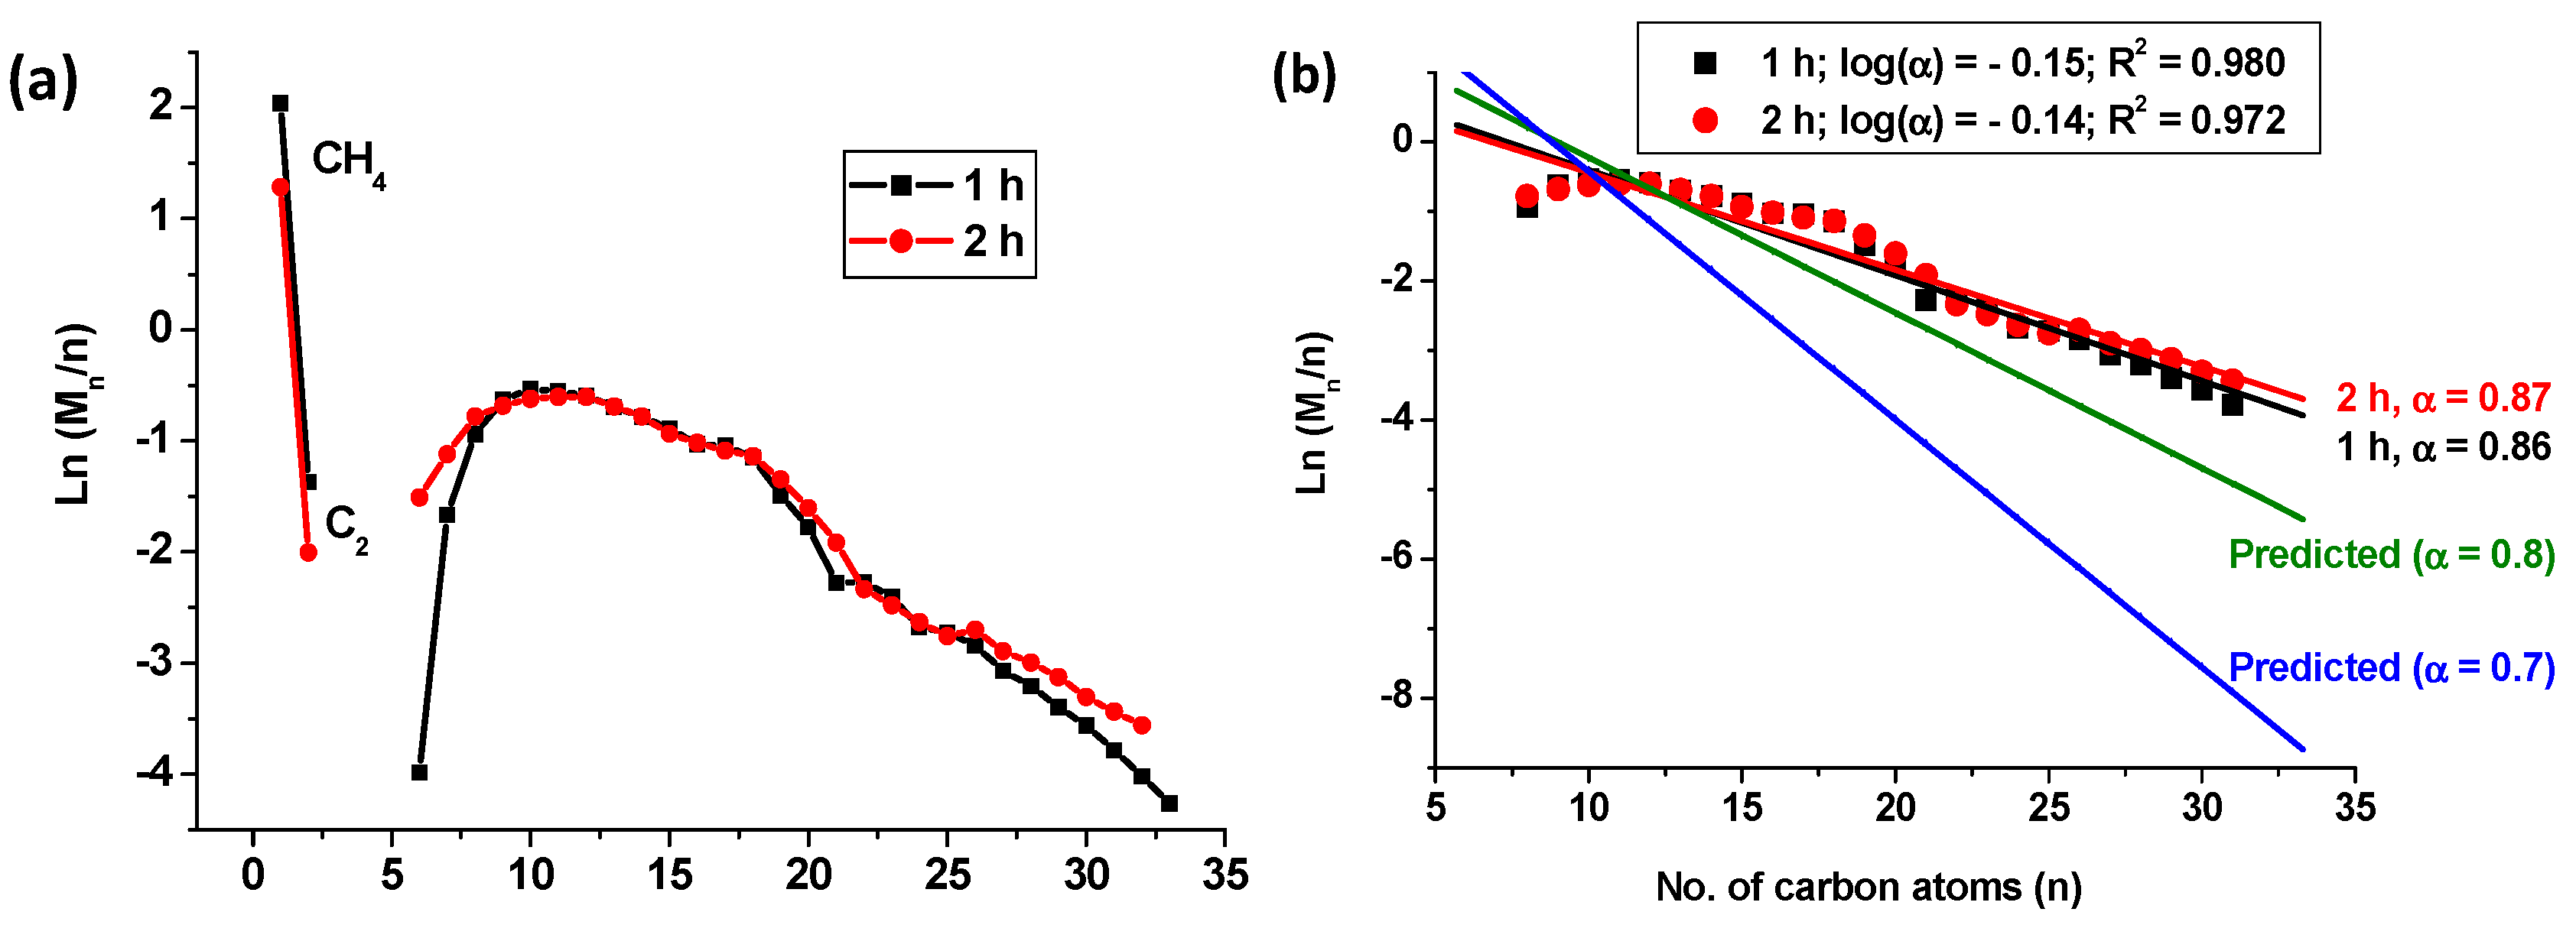
  • Mn = mole fraction of a hydrocarbon with chain length n
  • n = number of total carbon atoms
  • α = probability of chain growth (α < 1)
  • (1 − α) = probability of chain termination
Although being more expensive than the Fe-based catalyst, the Co catalyst is preferred for the production of long-chain paraffins because of its high activity and low water-gas shift activity [16]. On one hand, strong interaction between the metallic phase and the support has been observed to improve catalytic activity [17], but on the other hand, it may be detrimental due to the formation of irreducible metal-support compounds such as cobalt aluminate or cobalt silicate by way of incorporating CoO into the Al2O3 or SiO2 support respectively [18], thereby leading to catalyst deactivation. In addition, carburization of the Co catalyst may lead to deactivation since the cobalt carbide (Co2C) formed is not a catalytically active material for FTS [4], though it has been observed to enhance the activity of the Fe-based catalyst [19]. Other causes of catalyst deactivation include coking, surface restructuring of the Co metal phase in syngas, and sintering of the Co nanoparticles [20]. Some authors have equally suggested that Co-metal re-oxidation may also lead to catalyst deactivation [21], although there are some disagreements based on particle size effects as shown by empirical data [22].
Nevertheless, one method that has been adopted in solving catalyst deactivation issues is by addition of promoters. For example, precious metals like Au [23], and Pt [24], or in some cases, Ru have been employed to create multi-component catalysts such as (Ru + Co + Mn/Zr/SiO2) to enhance Co reducibility [25]. This alters catalyst activity and selectivity or the catalyst’s preference for a specific reaction mechanism [26], although some elements acting as promoters have been observed to aggravate metal particle sintering of the metal nanoparticles [27]. Other complex catalyst formulations such as carbon-supported cobalt manganese oxide (CoMnOx) catalysts [28], are currently being developed.
In this article, we limit our discussion to an approach that does not involve promoters because the single-metal Co/C catalyst is under scrutiny. Since one of the major causes of deactivation in Co-based catalysts is carbon deposition [29], in this project, a carbon support was envisaged for a permanent solution. Table 1 indicates a selected number of Co-based catalysts used in FTS reaction that were supported on various materials ranging from metal oxides to elemental carbon that has received considerable attention in the recent past. The Co metal may be added to the support using different approaches such as impregnation or precipitation, but currently the plasma technology is advancing, both in catalyst synthesis and activation. Although most researchers test the catalysts in the fixed-bed reactor with the H2:CO ratio of ~2 at 220 °C and 2 MPa pressure, in this study the slurry reactor operating under similar reaction conditions has been chosen.
In our earlier work, catalyst activity was determined by real-time analysis of the unreacted CO in the reactor effluent-gas stream, from which CO conversion was calculated. However, one of the constraints of our earlier reactor set-up was that similar real-time liquid-phase analysis was not possible, since it required total cooling of the reactor preferably overnight in order to sample the slurry. In doing so, a lot of valuable information from the liquid-phase was inaccessible until after over 36 h from the commencement of the reaction. This necessitated for a modification of our reactor system, where we have devised a method of analyzing the liquid-phase in order to determine the composition of the heavier hydrocarbons (C5+) in real time as the reaction progresses. Having a family of eight plasma-synthesized catalysts based on Co and Fe [30], the most active material at the lower temperatures of 160–220 °C was the single Co/C catalyst, which we have selected to use in this study.
Since the previous publication on the single-metal Co/C was centred on catalyst synthesis, characterization and benchmarking with the commercially available Fe-NanoCat® catalyst [7], one of the limitation in determining the true α-value of the catalyst was due to the reactor set-up. The plasma-synthesized Co/C was tested in a closed 3-φ-CSTSR for FTS. In the current reactor set up, the true α-value of the catalyst may be calculated because there is minimum time required to generate a reasonable amount of polymerization, which if not observed can lead to a wrong determination.
Therefore, the objectives of this work was: (i) to develop a safe sampling method of the slurry from the reactor, which was both hot and at high-pressure, without significantly interrupting the FTS reaction process or being exposed to the highly toxic CO; (ii) to illustrate hydrocarbon–chain propagation with TOS by providing empirical evidence for the gradual development of the longer-chain hydrocarbons using this novel sampling method; (iii) to determine the true α-value of the Co/C catalyst, while observing for the least time required for maximum possible polymerization to occur; and (iv) to investigate the effect of using CO-rich syngas feed stream on the LT-FTS product distribution, with a view that the current H2-rich syngas derived from natural gas will eventually be replaced by the CO-rich biomass-derived syngas. In characterizing the materials’ properties, we have motivated for the catalysts’ potential suitability in FTS application since the materials have been found to be both nanometric and non-porous [30]. Therefore, in this paper, we report for the first time the effect of feed gas composition on the catalyst’s α-value with TOS as projected from the FTS product distribution using the plasma-synthesized catalyst supported on carbon (Co/C).

2. Results

2.1. Catalyst Characterization

The catalyst under review has already been fully characterized by Brunauer-Emmett-Teller (BET) specific surface area analysis and porosity, Raman spectroscopy, Thermogravimetric analysis (TGA), X-ray diffraction (XRD) coupled with Rietveld quantitative analysis (RQA), and X-ray absorption near-edge structure (XANES) studies. In addition, the microscopic properties of the catalyst were revealed by Transmission electron microscopy (TEM) as well as with Scanning electron microscopy (SEM) coupled with the Energy dispersive X-ray spectroscopy (EDX). Since the details of this catalyst’s properties are available in earlier work [7], the results are summarized here for the benefit of the reader.

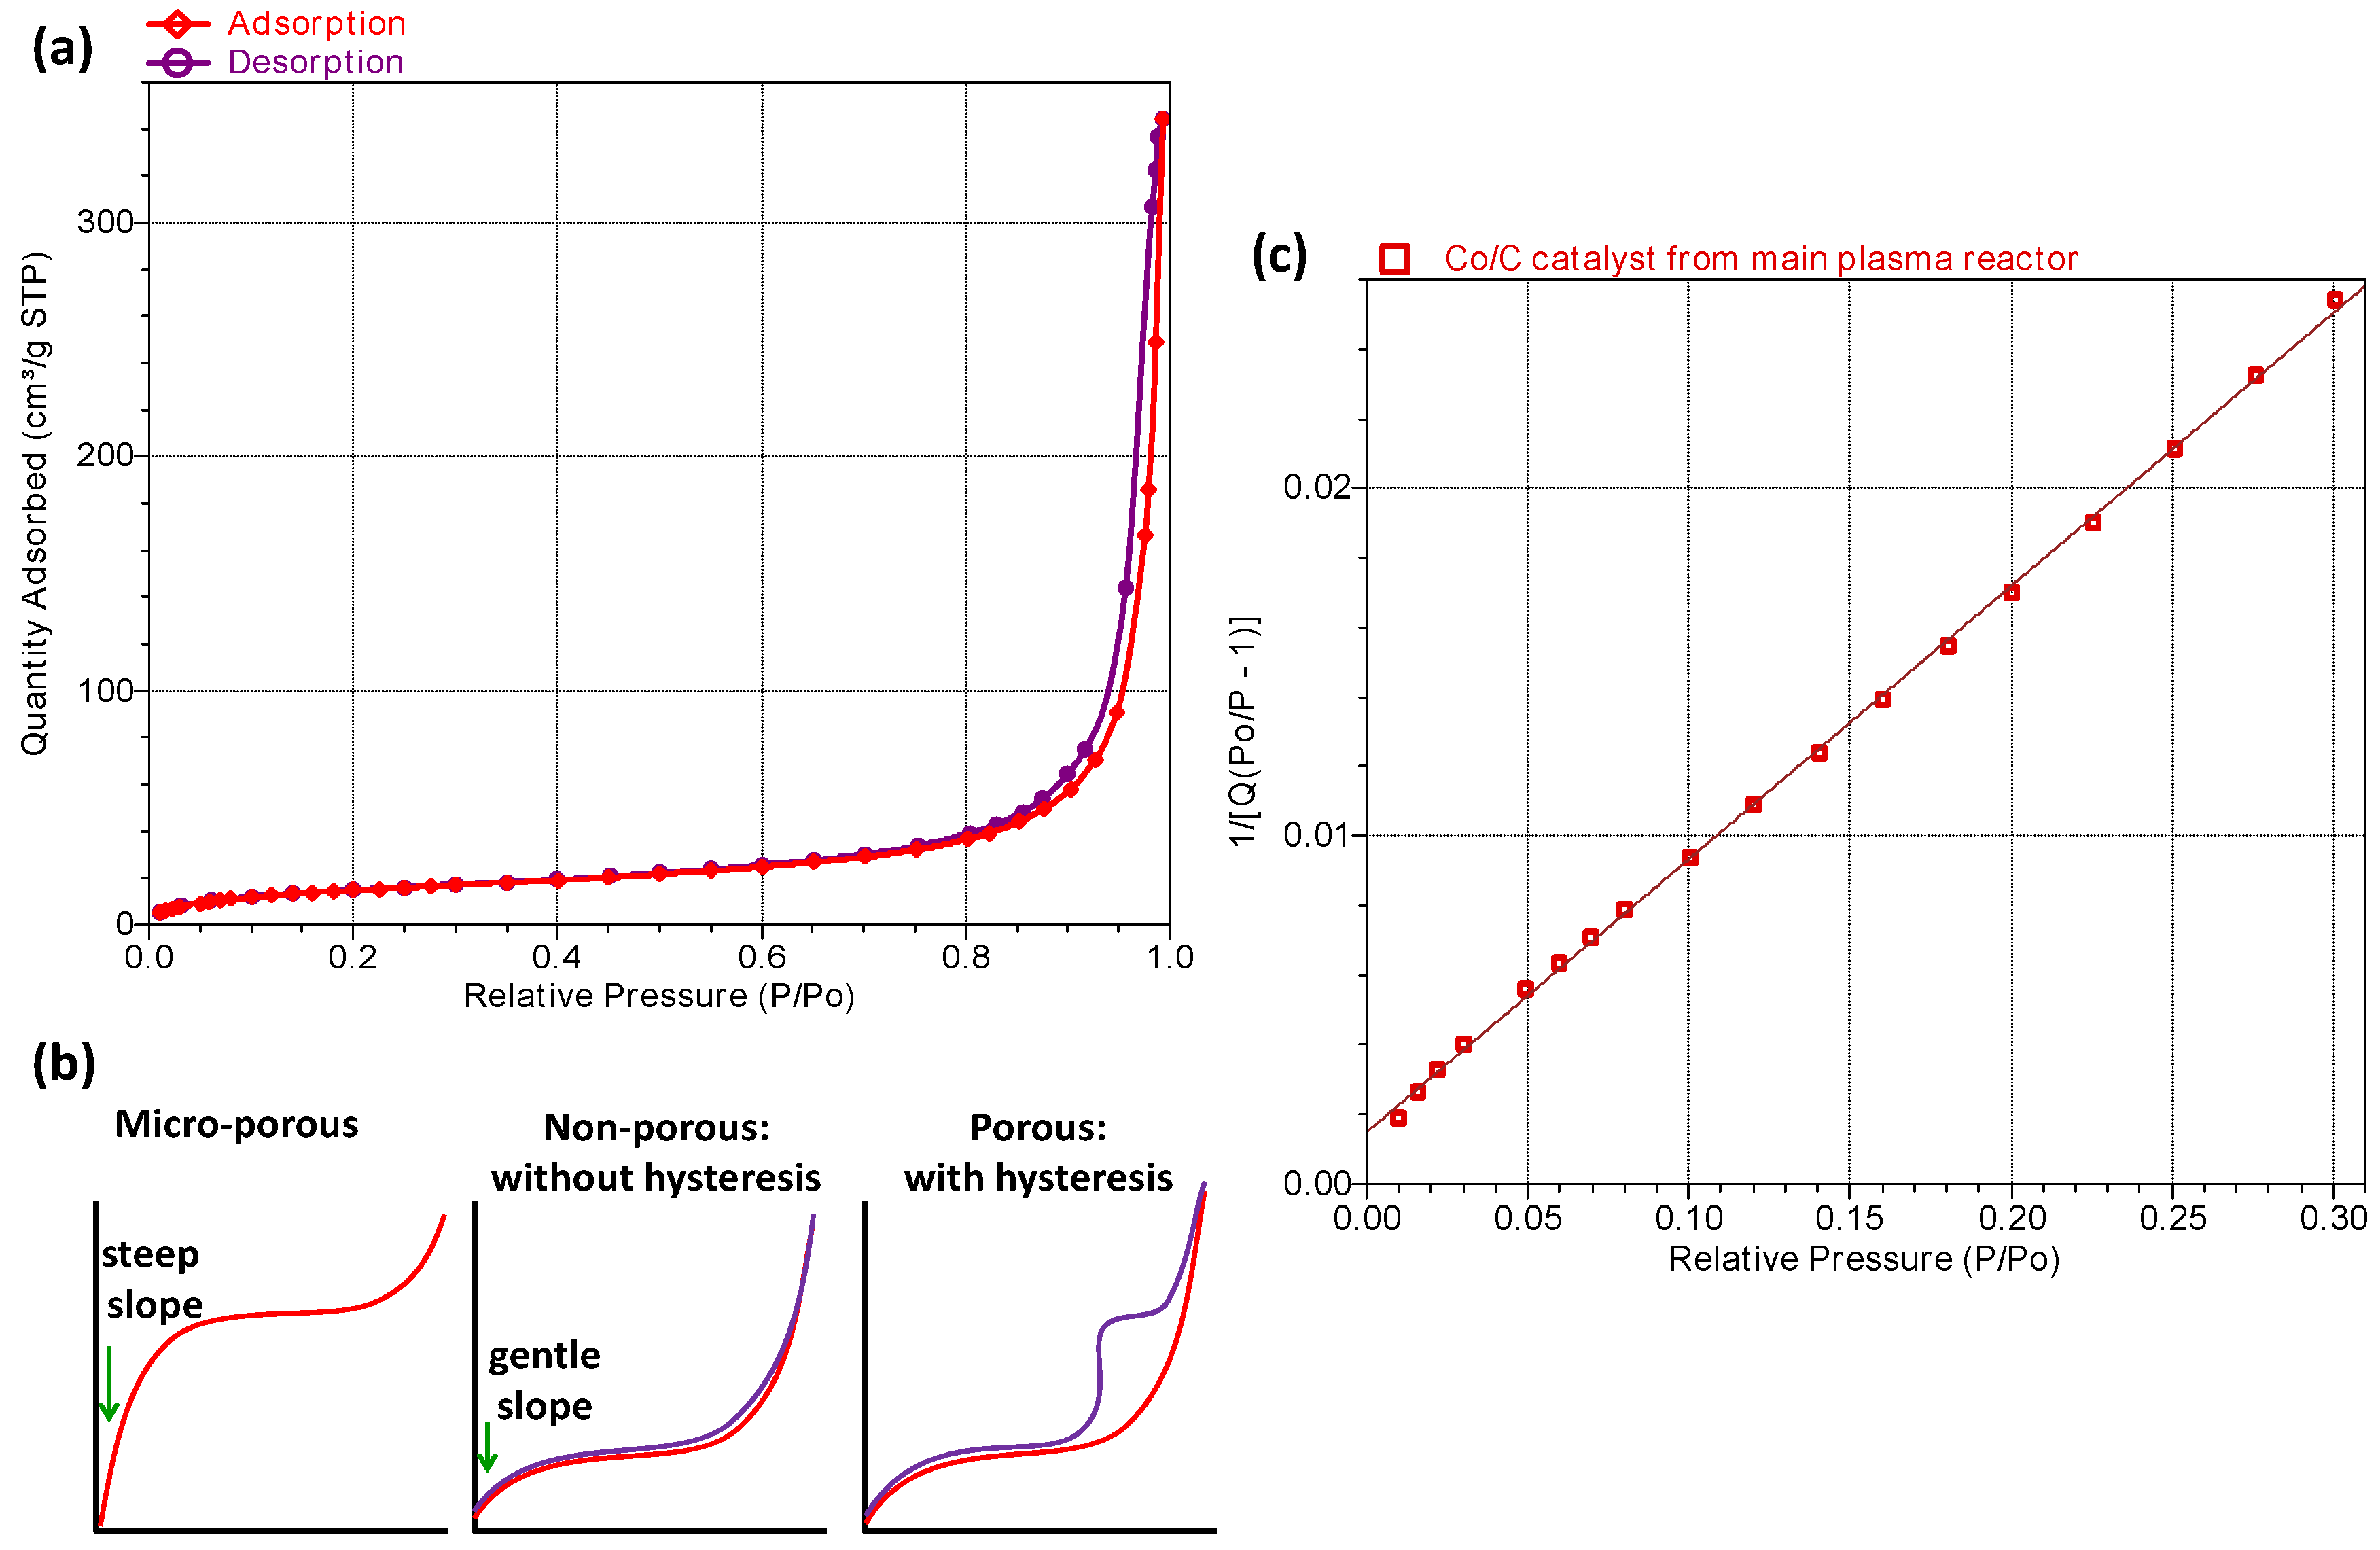
2.1.1. BET Surface Area Analysis

The fresh Co-only (Co/C) catalyst was determined to be both nanometric and non-porous in nature, but with a high BET specific surface area of about 56 m2∙g−1, pore diameter of about 28 nm and total pore volume of 0.39 cm3∙g−1 as given in Table 2.
Figure 1a depicts the non-porous nature of the material from its adsorption-desorption isotherms and Figure 1b provides the basis of interpretation. A steep isotherm in the low pressure region below P/Po = 0.30 means that the sample is micro-porous (type I isotherm), but since our plot was almost flat in that portion (type II isotherm), it implied that the catalyst was not microporous. In addition, the lack of hysteresis in the desorption arm of the isotherm indicated that the sample was non-porous. Figure 1c shows the BET transform plot with a perfect linear fit on the adsorption isotherm, indicating the high reliability of the method. Normally, solid powder samples with particle diameter in the micrometer range have BET specific surface area of ~1 m2∙g−1. However, when the powder particles are transformed into the nanometer range through plasma, their surface area significantly increases. For example, compact Co spheres of average diameter of 11 nm have a geometrically calculated external specific surface of about 70 m2∙g−1. Therefore, the measured BET surface area of 56 m2∙g−1 is representative of the tested catalyst.

2.1.2. Elemental Analysis

Due to the difficulties experienced in digesting the graphitic C-support for analysis by inductively-coupled plasma mass spectrometry (ICP-MS), TGA by carbon ignition was utilized, which revealed that the Co atomic-mass loading in the C matrix was approximately 0.25 g/g (25-wt. %) in the freshly synthesized catalysts through plasma.

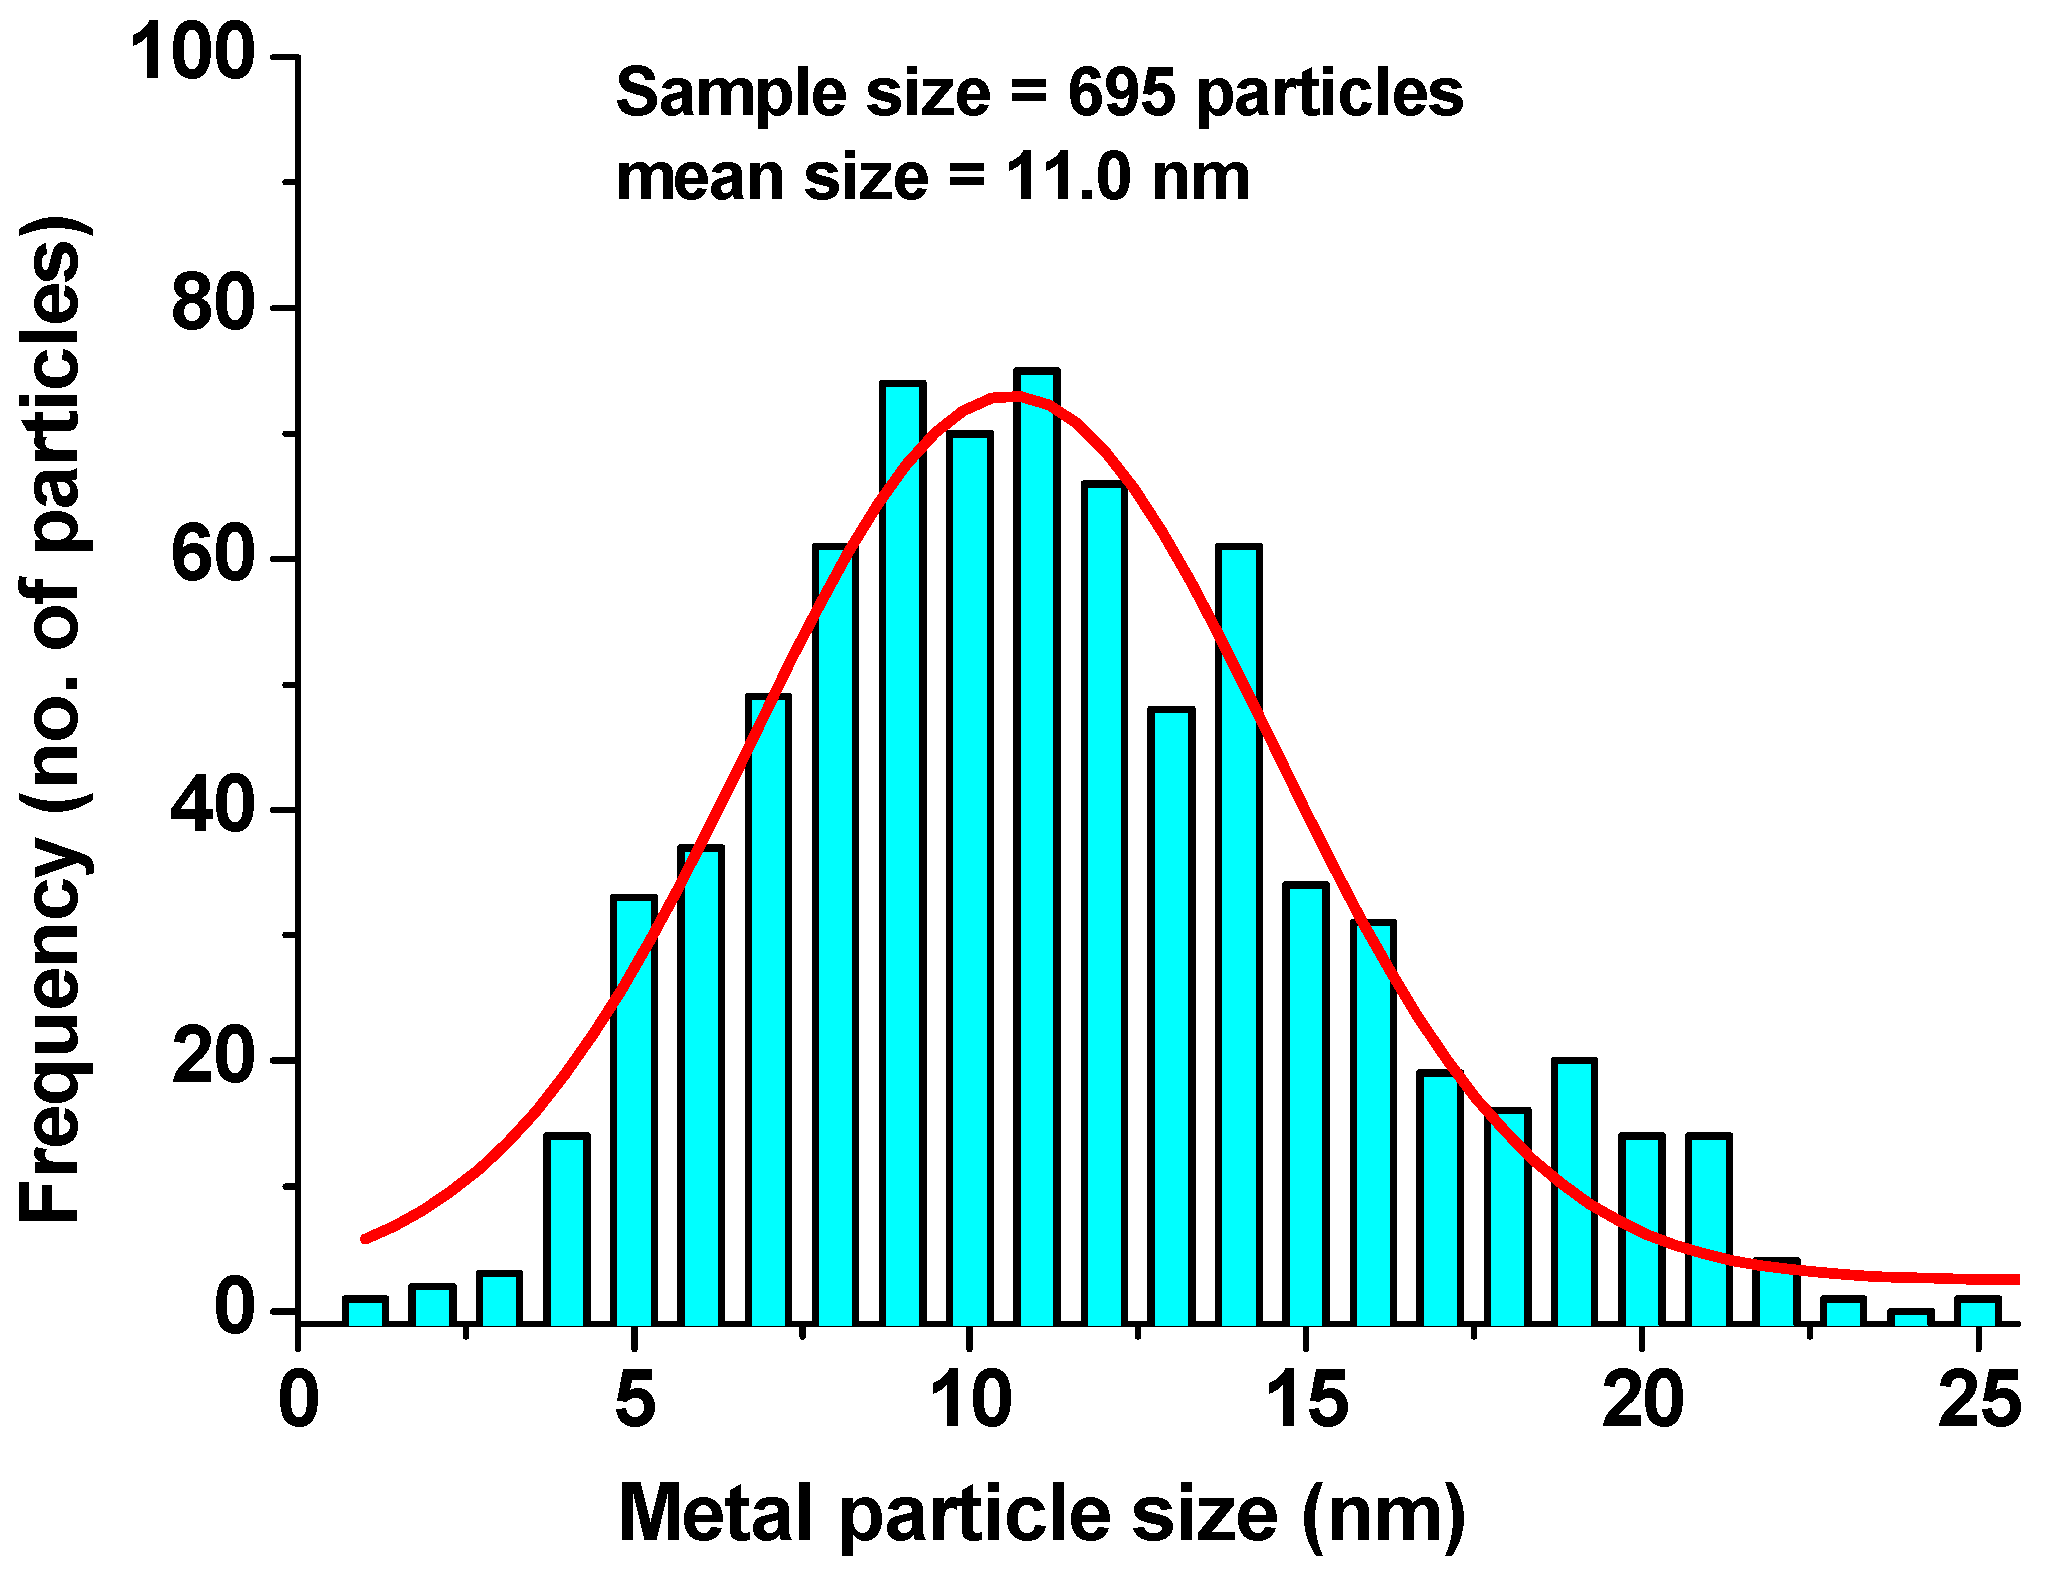
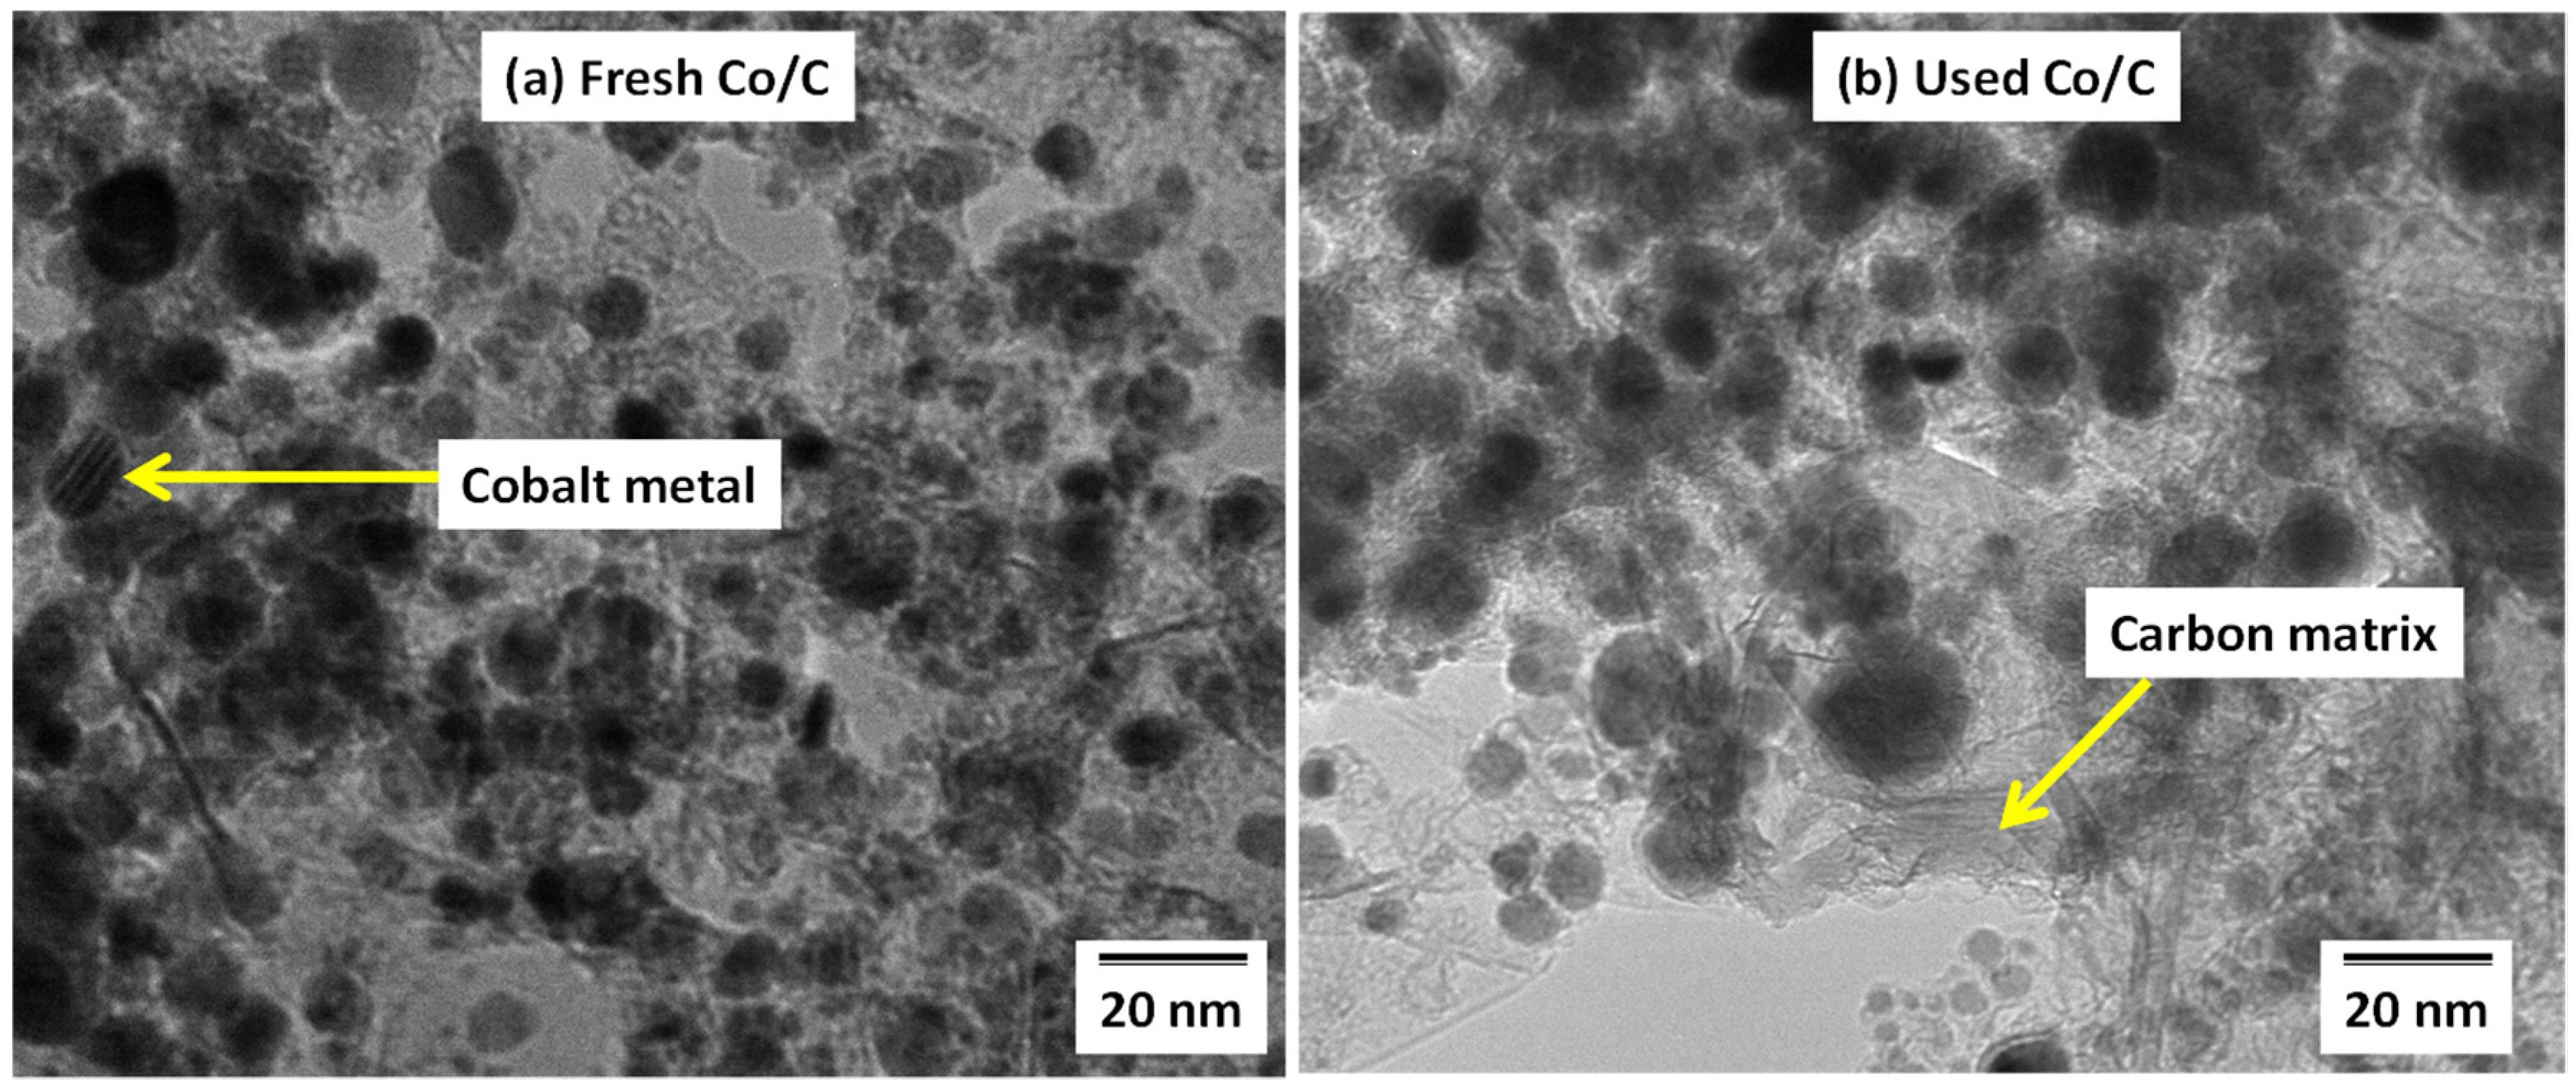
2.1.3. Microscopy: Elemental and Particle Size Analysis

Semi-quantitative SEM analysis coupled with EDX facility showed a Co metal-loading between 20%–30% in the carbon support, as confirmed by TGA (25-wt. %). Metal nanoparticle-size analysis by TEM imaging manifested a mean size of about 11.0 nm (counting 750 particles) before and after the reaction [7], as portrayed in Figure 2. This observation alluded to the absence of nanoparticle agglomeration in the spent catalyst sample after a 24-h reduction at 400 °C followed by another 24 h of FTS reaction. Figure 3 provides the metal nanoparticle size distribution of 695 particles of the fresh catalyst by TEM analysis, which exhibits a near Gaussian-type distribution, with a standard deviation of 4.4.

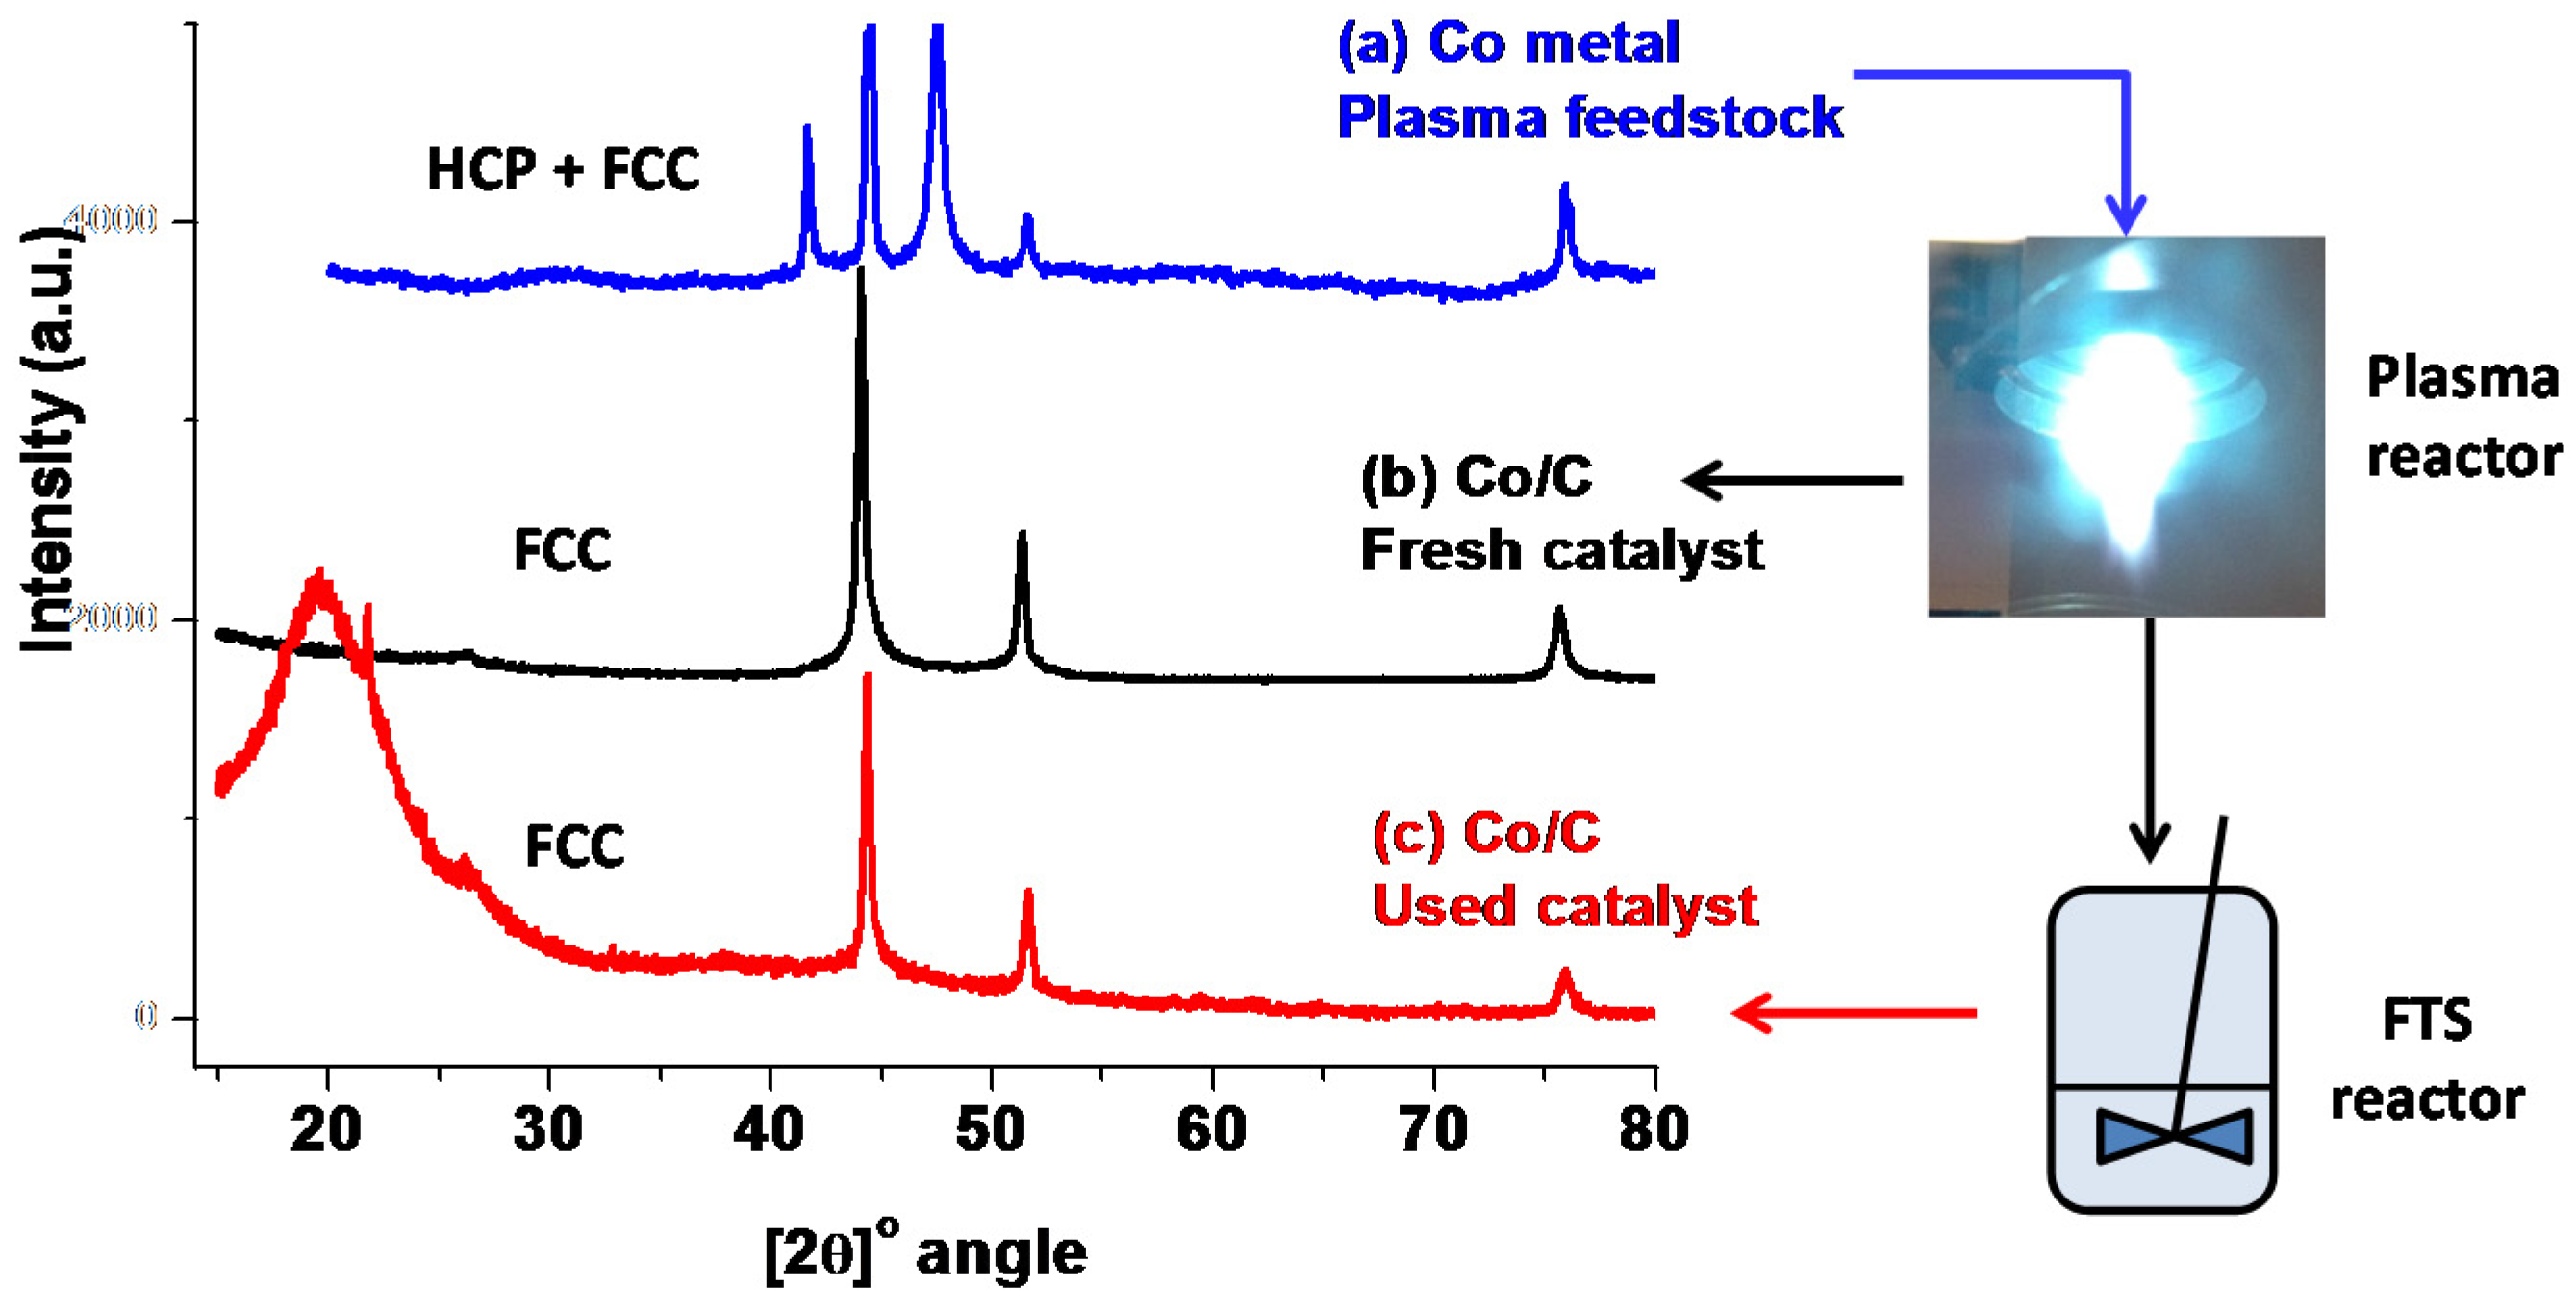
2.1.4. XRD and RQA Analysis

XRD analysis revealed the presence of metallic and carbidic species in the catalyst. In order to maximize the catalytic activity measured by CO conversion during FTS, prior catalyst reduction is paramount because the active species in Co-containing samples are construed to be metallic (Co°) in nature. Some authors have asserted that the highest CO conversions in FTS are attributed to higher Co reducibility [33], while the oxidation of the Co metal leads to catalyst deactivation [21]. Figure 4 presents the XRD patterns of the fresh Co metal injected into the plasma, which comprised two phases as analysed by RQA: 62% having face centred cubic (FCC) structure, and 38% hexagonal closed packing (HCP) structure [7]. After plasma synthesis, the Co moieties were perceived to be encapsulated in the carbon matrix and the metal contained only the FCC crystal structure, a phase that prevailed even after the FTS reaction. Since the Co/C catalyst is entirely nanometric, we are convinced that the material probably contains other phases that could be beyond the detection limits of the XRD instrument. However, in the absence of such evidence, we think that the FCC phase is the active form of this catalyst.

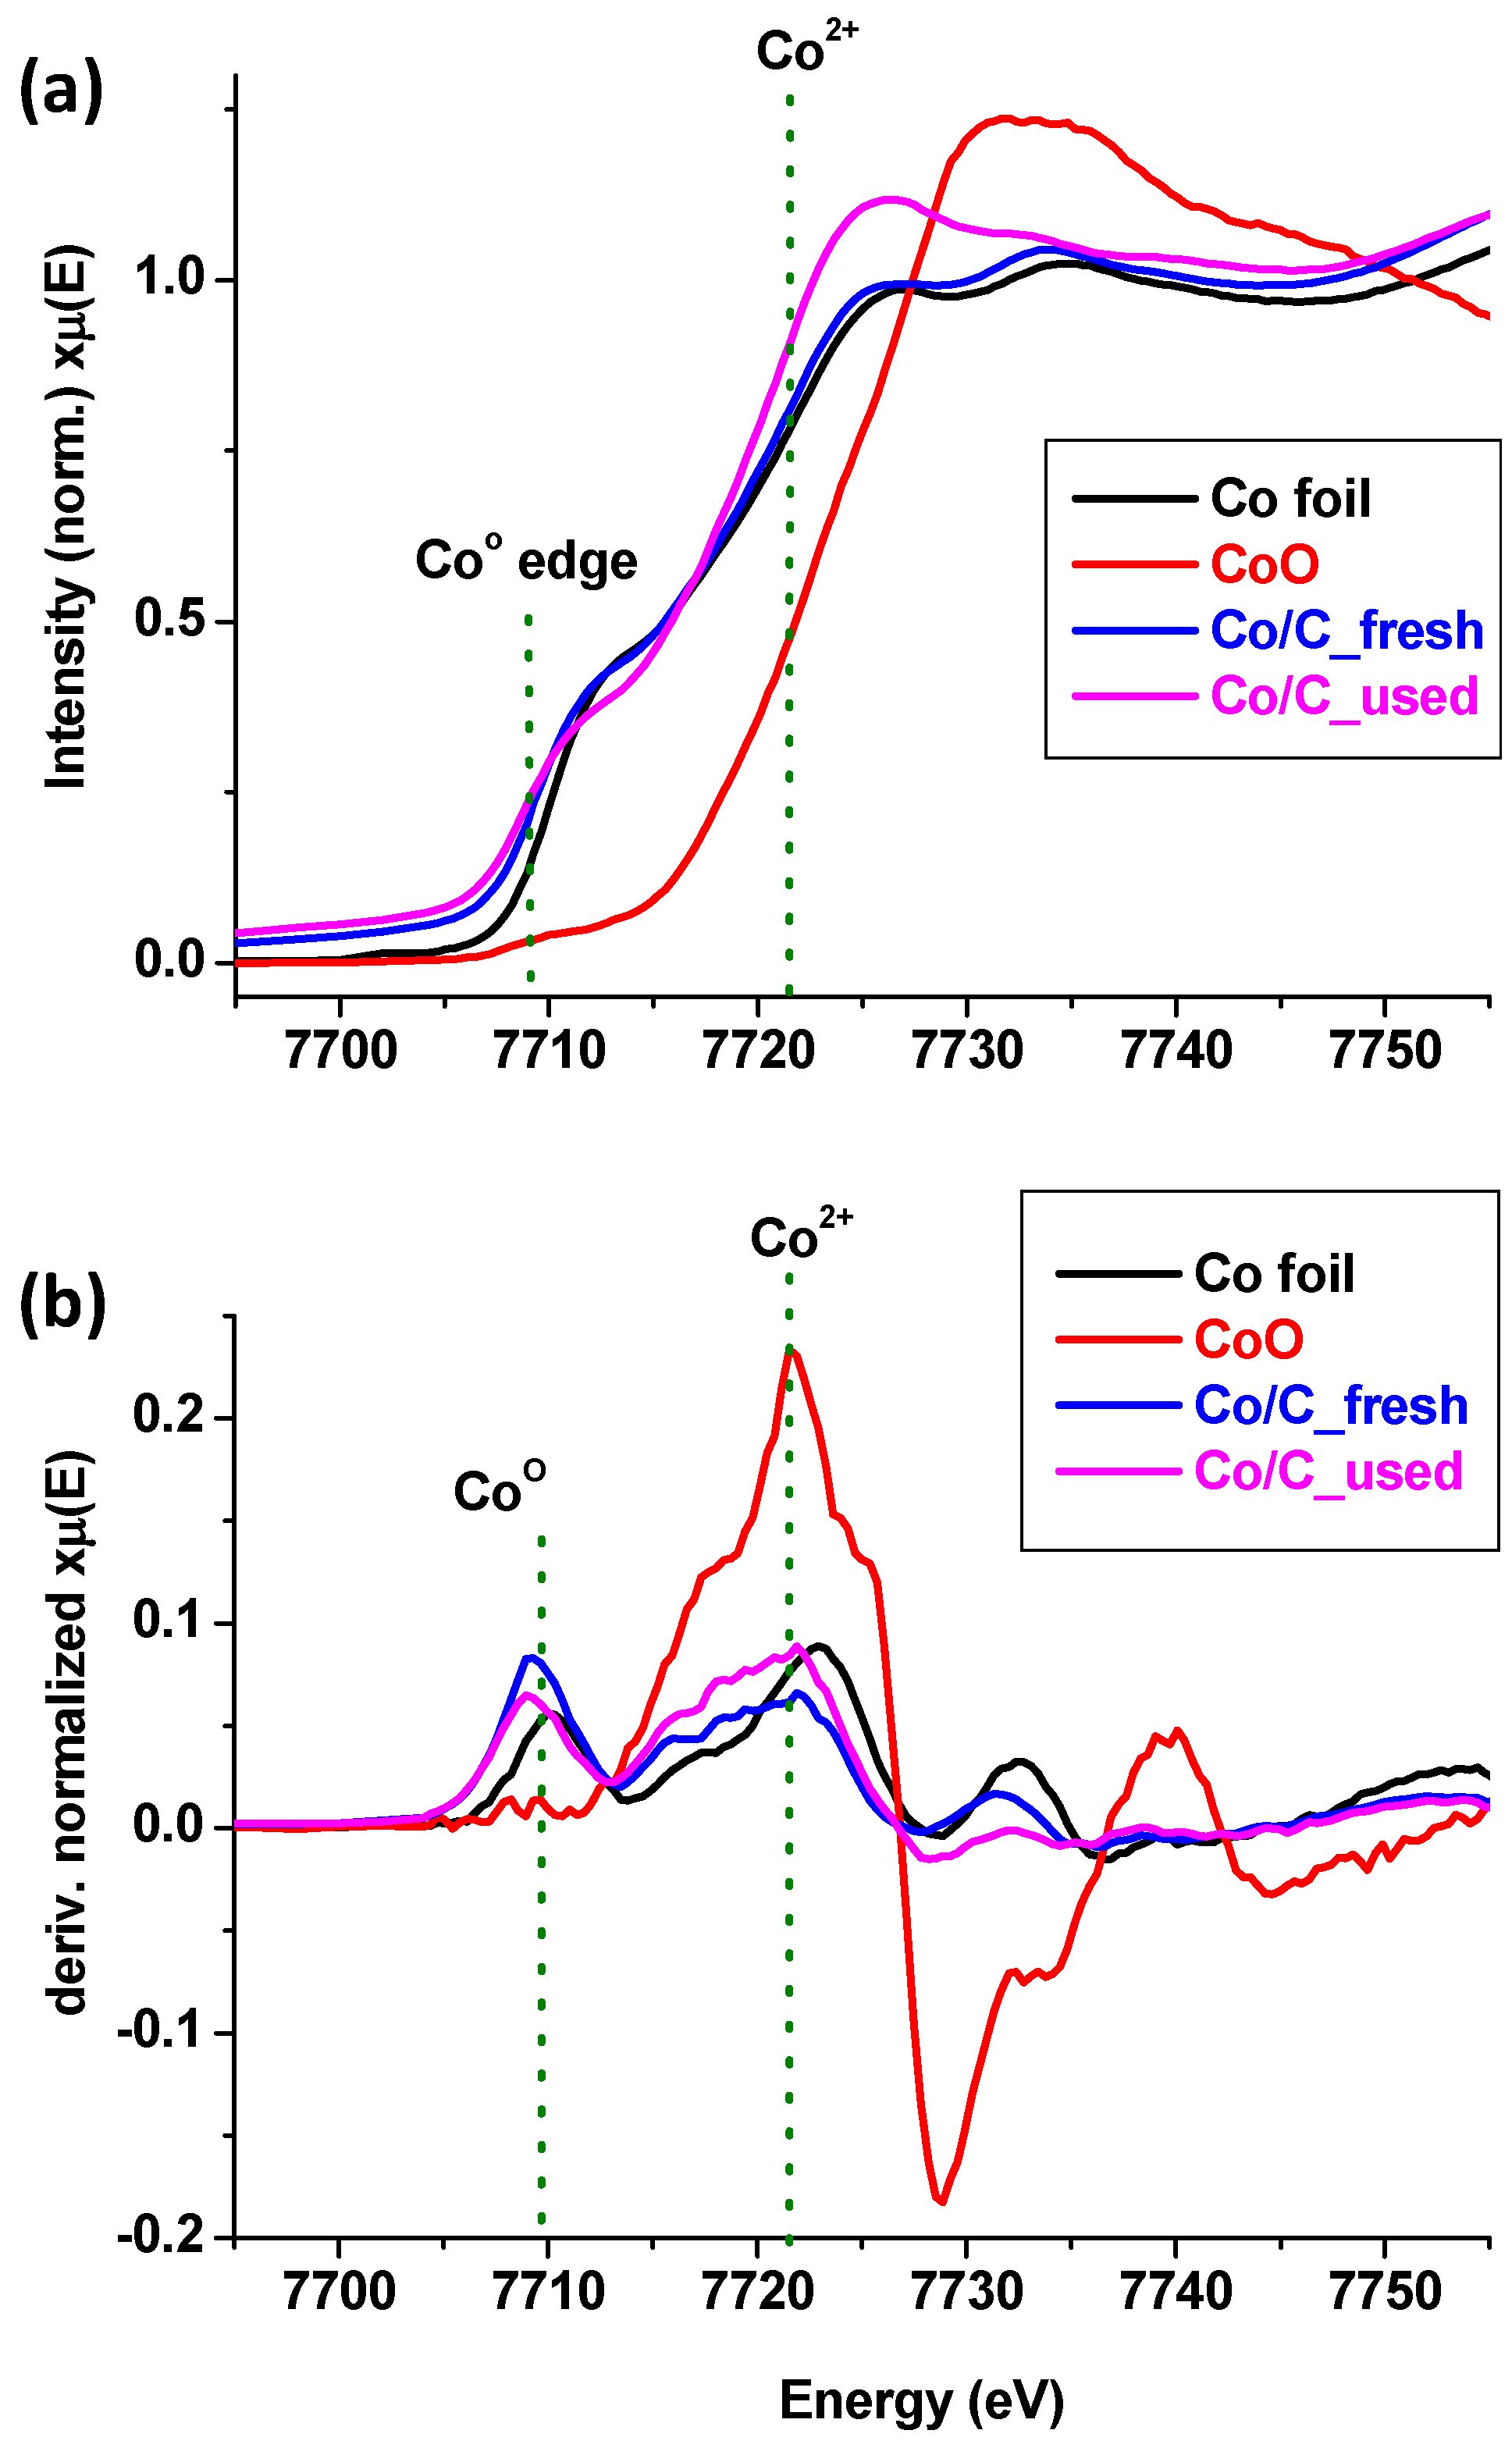
2.1.5. XANES Analysis

Spectral analysis of the fresh and used catalysts by X-ray absorption near-edge structure (XANES) did not indicate any form of oxidation in the samples. However, when compared to the metal-Co standard, a shift of the edge peak in both the fresh and used Co/C catalysts was observed, particularly when the derivative plots were examined, as seen in Figure 5. The Co species in the catalysts seemed to have become ‘more metallic’ in the sense of its electron-donating capability and hence the edge shift to the lower energies of the spectrum [41]. This was perhaps due to the simultaneous presence of metallic and carbidic species in the Co/C catalyst samples, as discussed in an earlier article [9]. The carbidic species in the samples were only evidenced by the XRD data analysis through RQA modeling using the High Score Plus software [7]. XANES peak-edge shift to the right implies occurrence of Co oxidation and more often than not leads to catalyst deactivation, whereas peak-edge shift to the left as was observed here, in both the fresh and used samples has a connotation of preventing deactivation, which may prove to be advantageous to the longevity of the catalyst material.

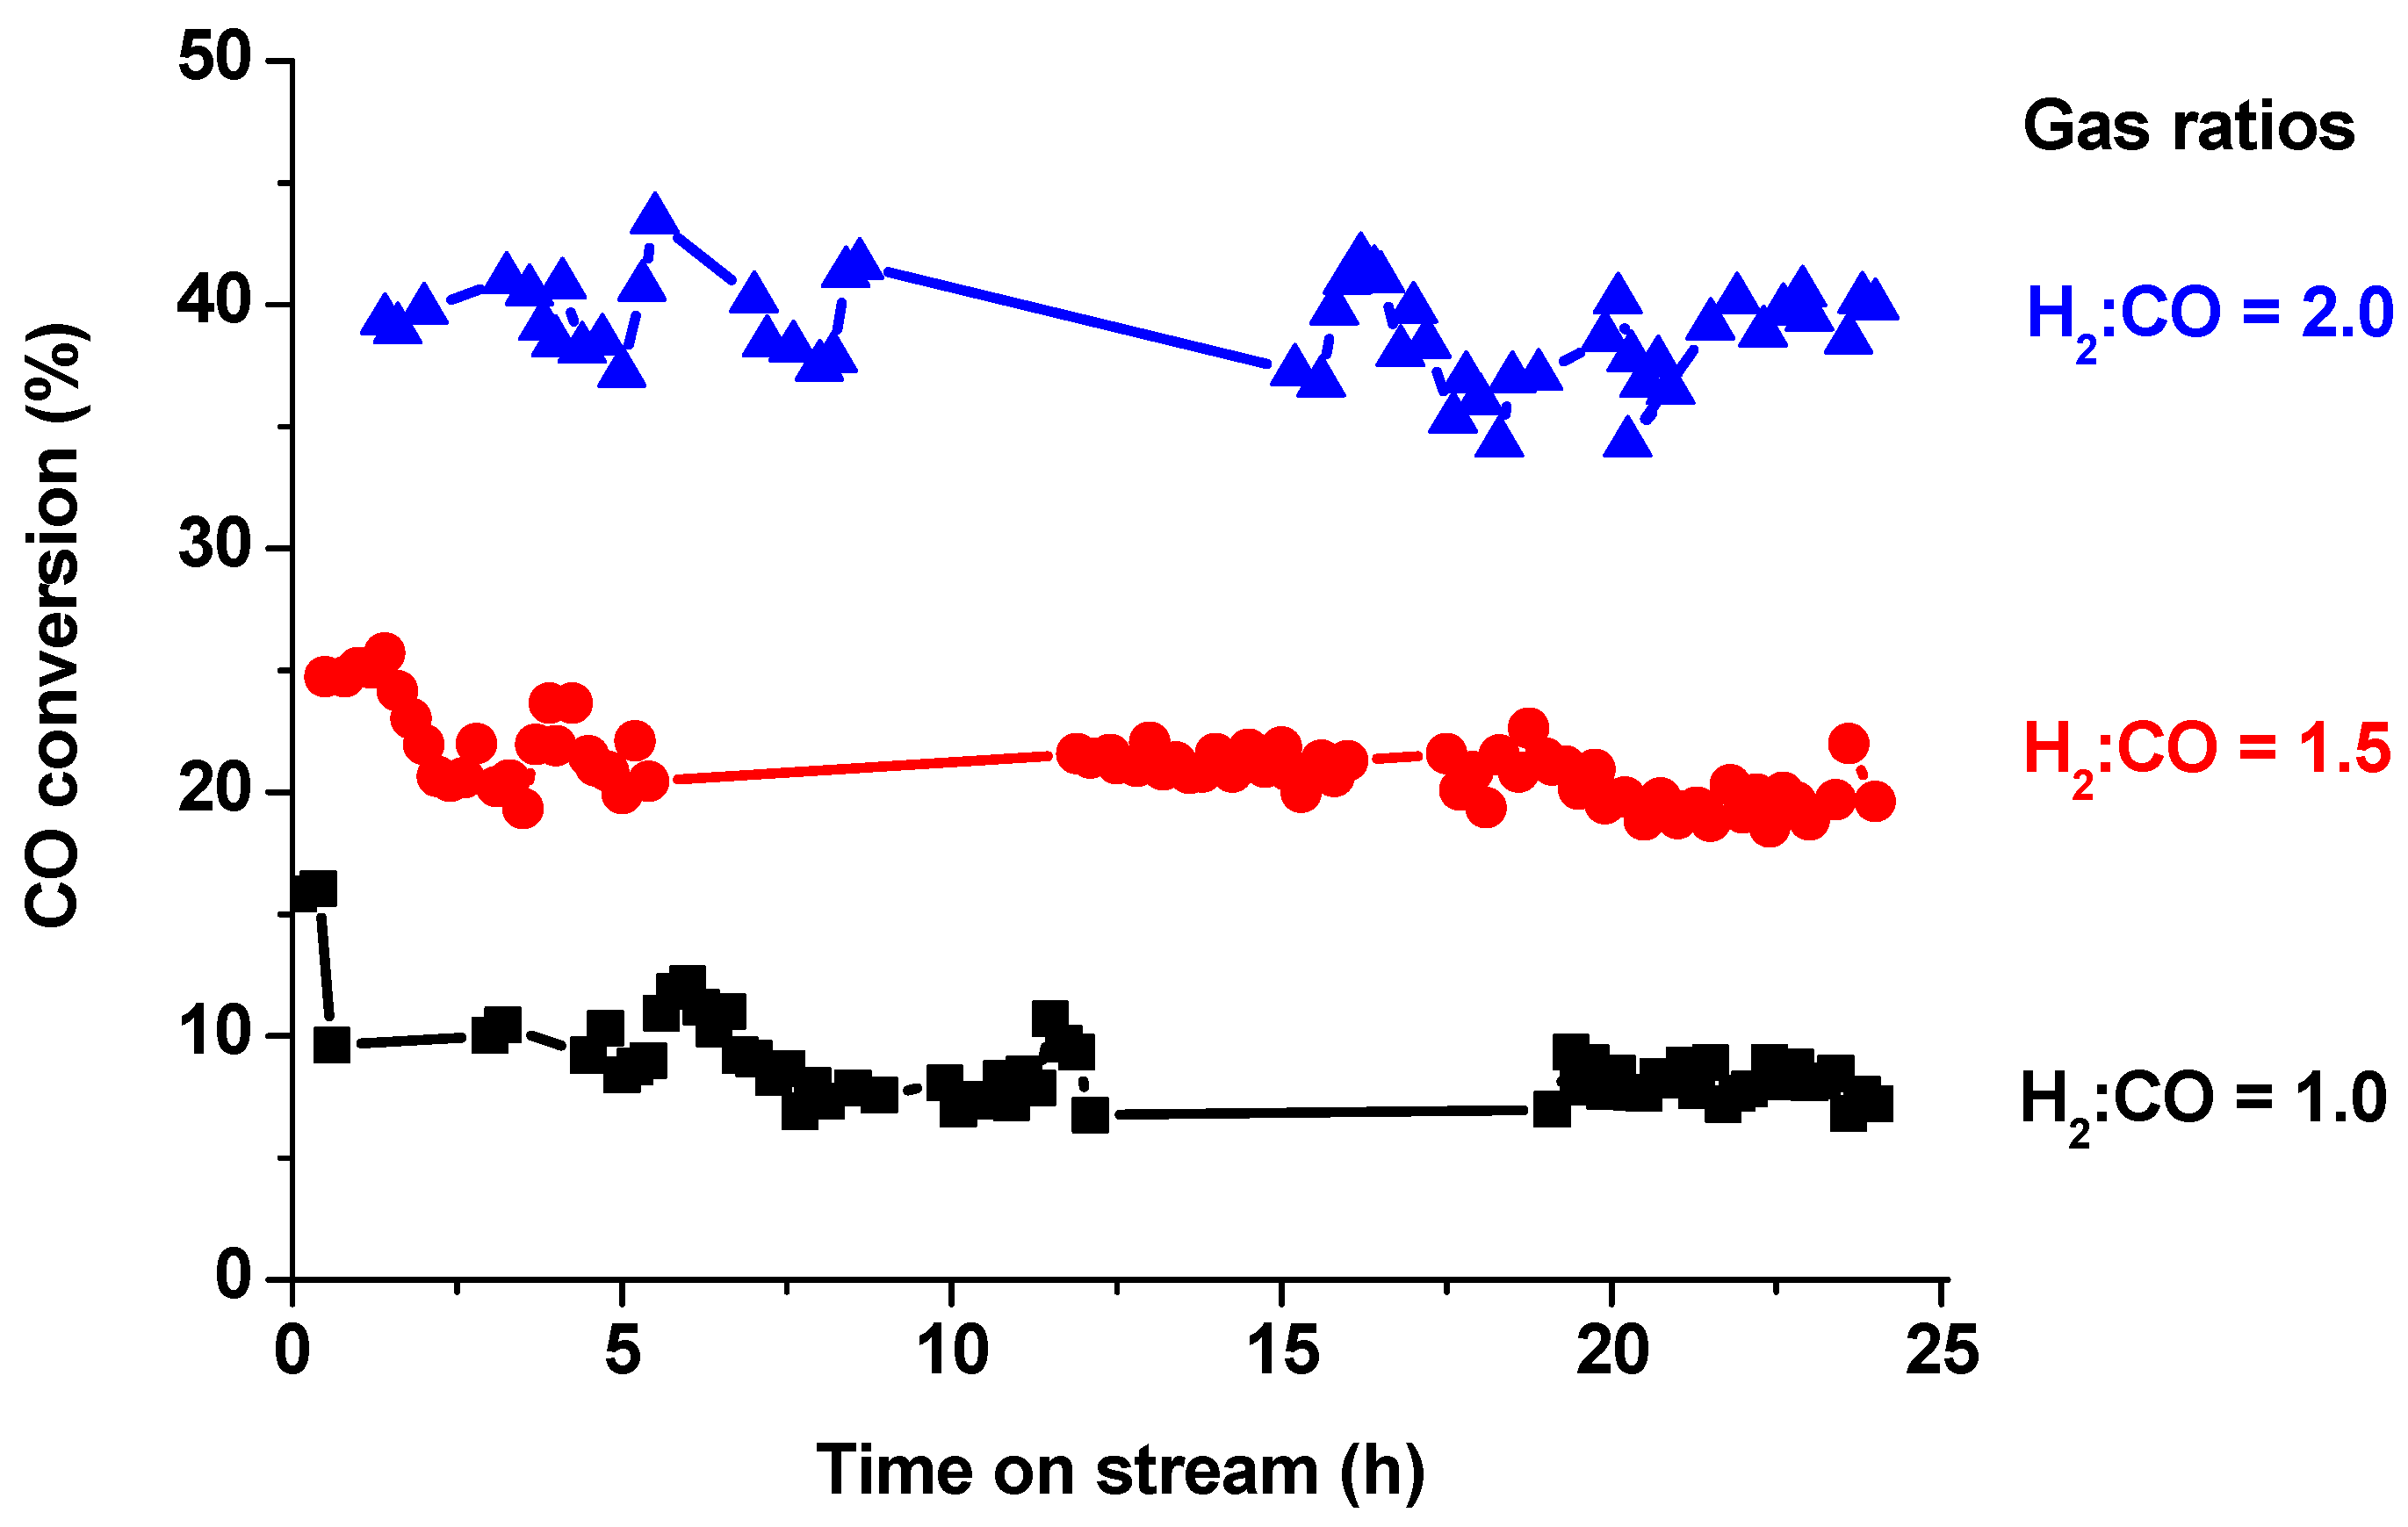
2.2. Catalyst Activity Testing

Figure 6 represents the catalytic activity at gas hourly space velocity (GHSV) of 3600 cm3∙g−1∙h−1 of catalyst, which presented between 38% and 43% CO conversion for the molar feed-gas ratio of H2:CO = 2. This finding was consistent with our earlier work [7]. For the CO-rich feed gas of molar ratio of H2:CO = 1.5 and 1.0, catalytic activity dropped to 20% and 10% CO conversion respectively.

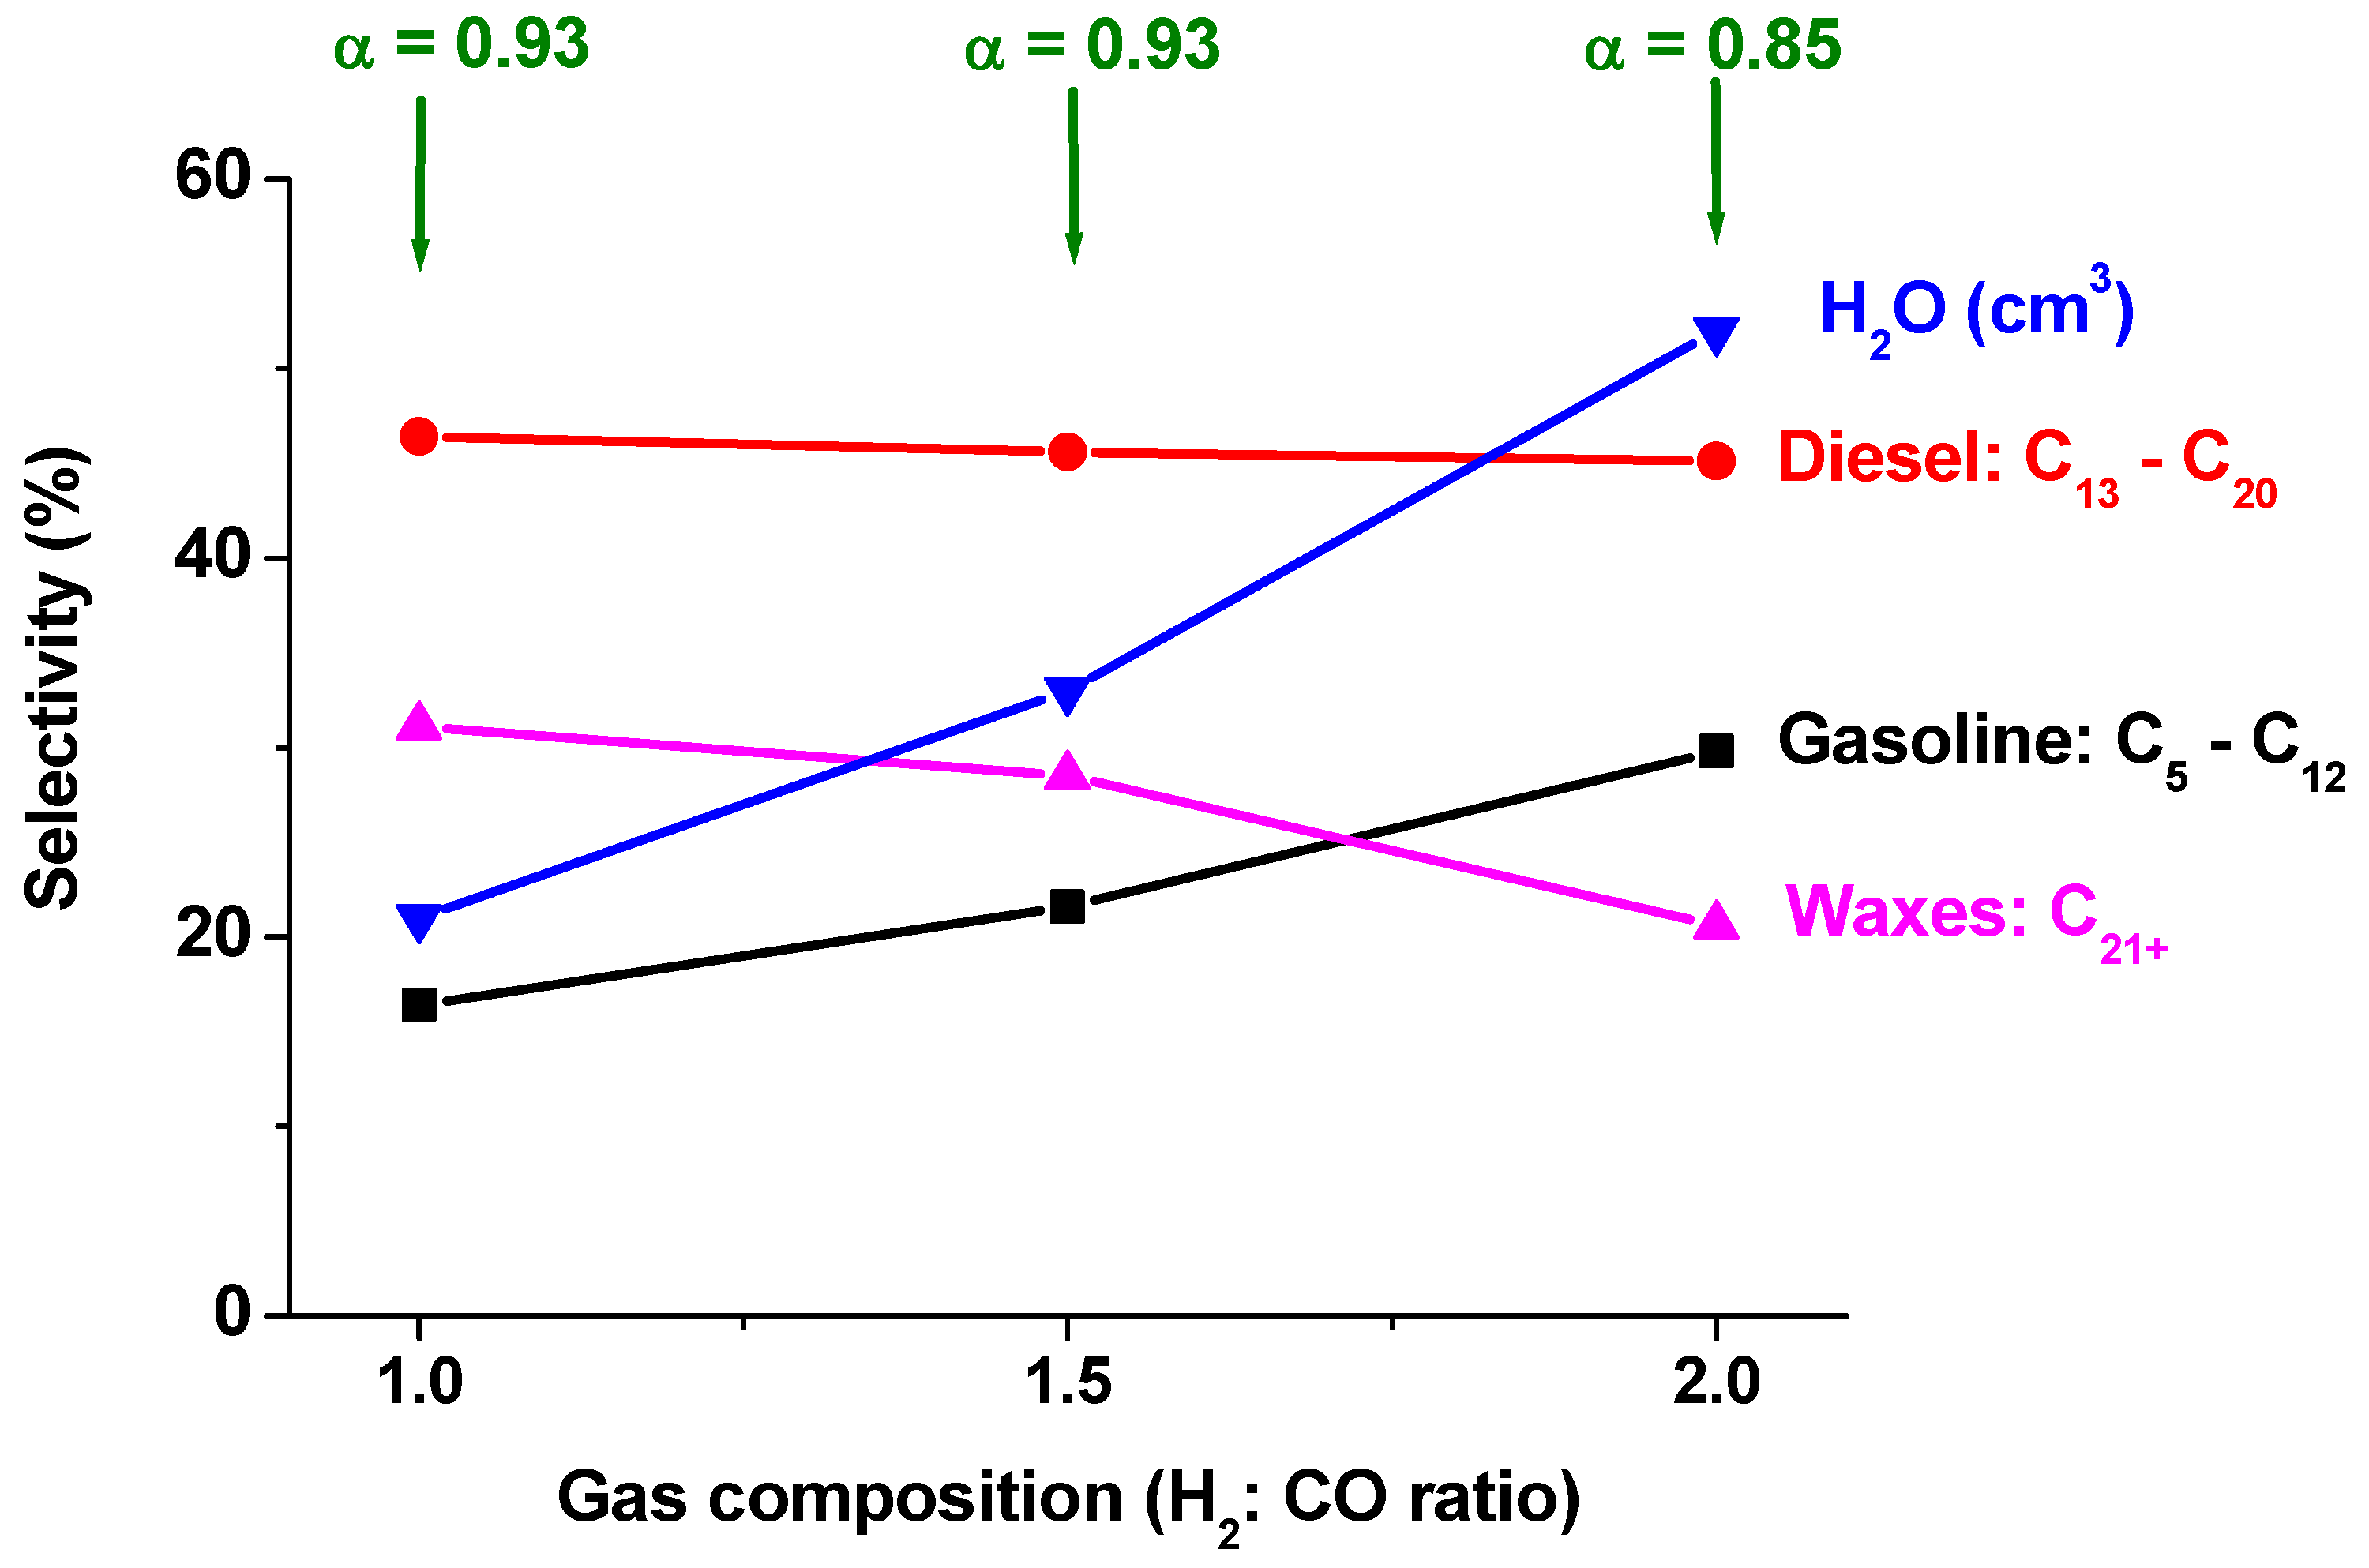
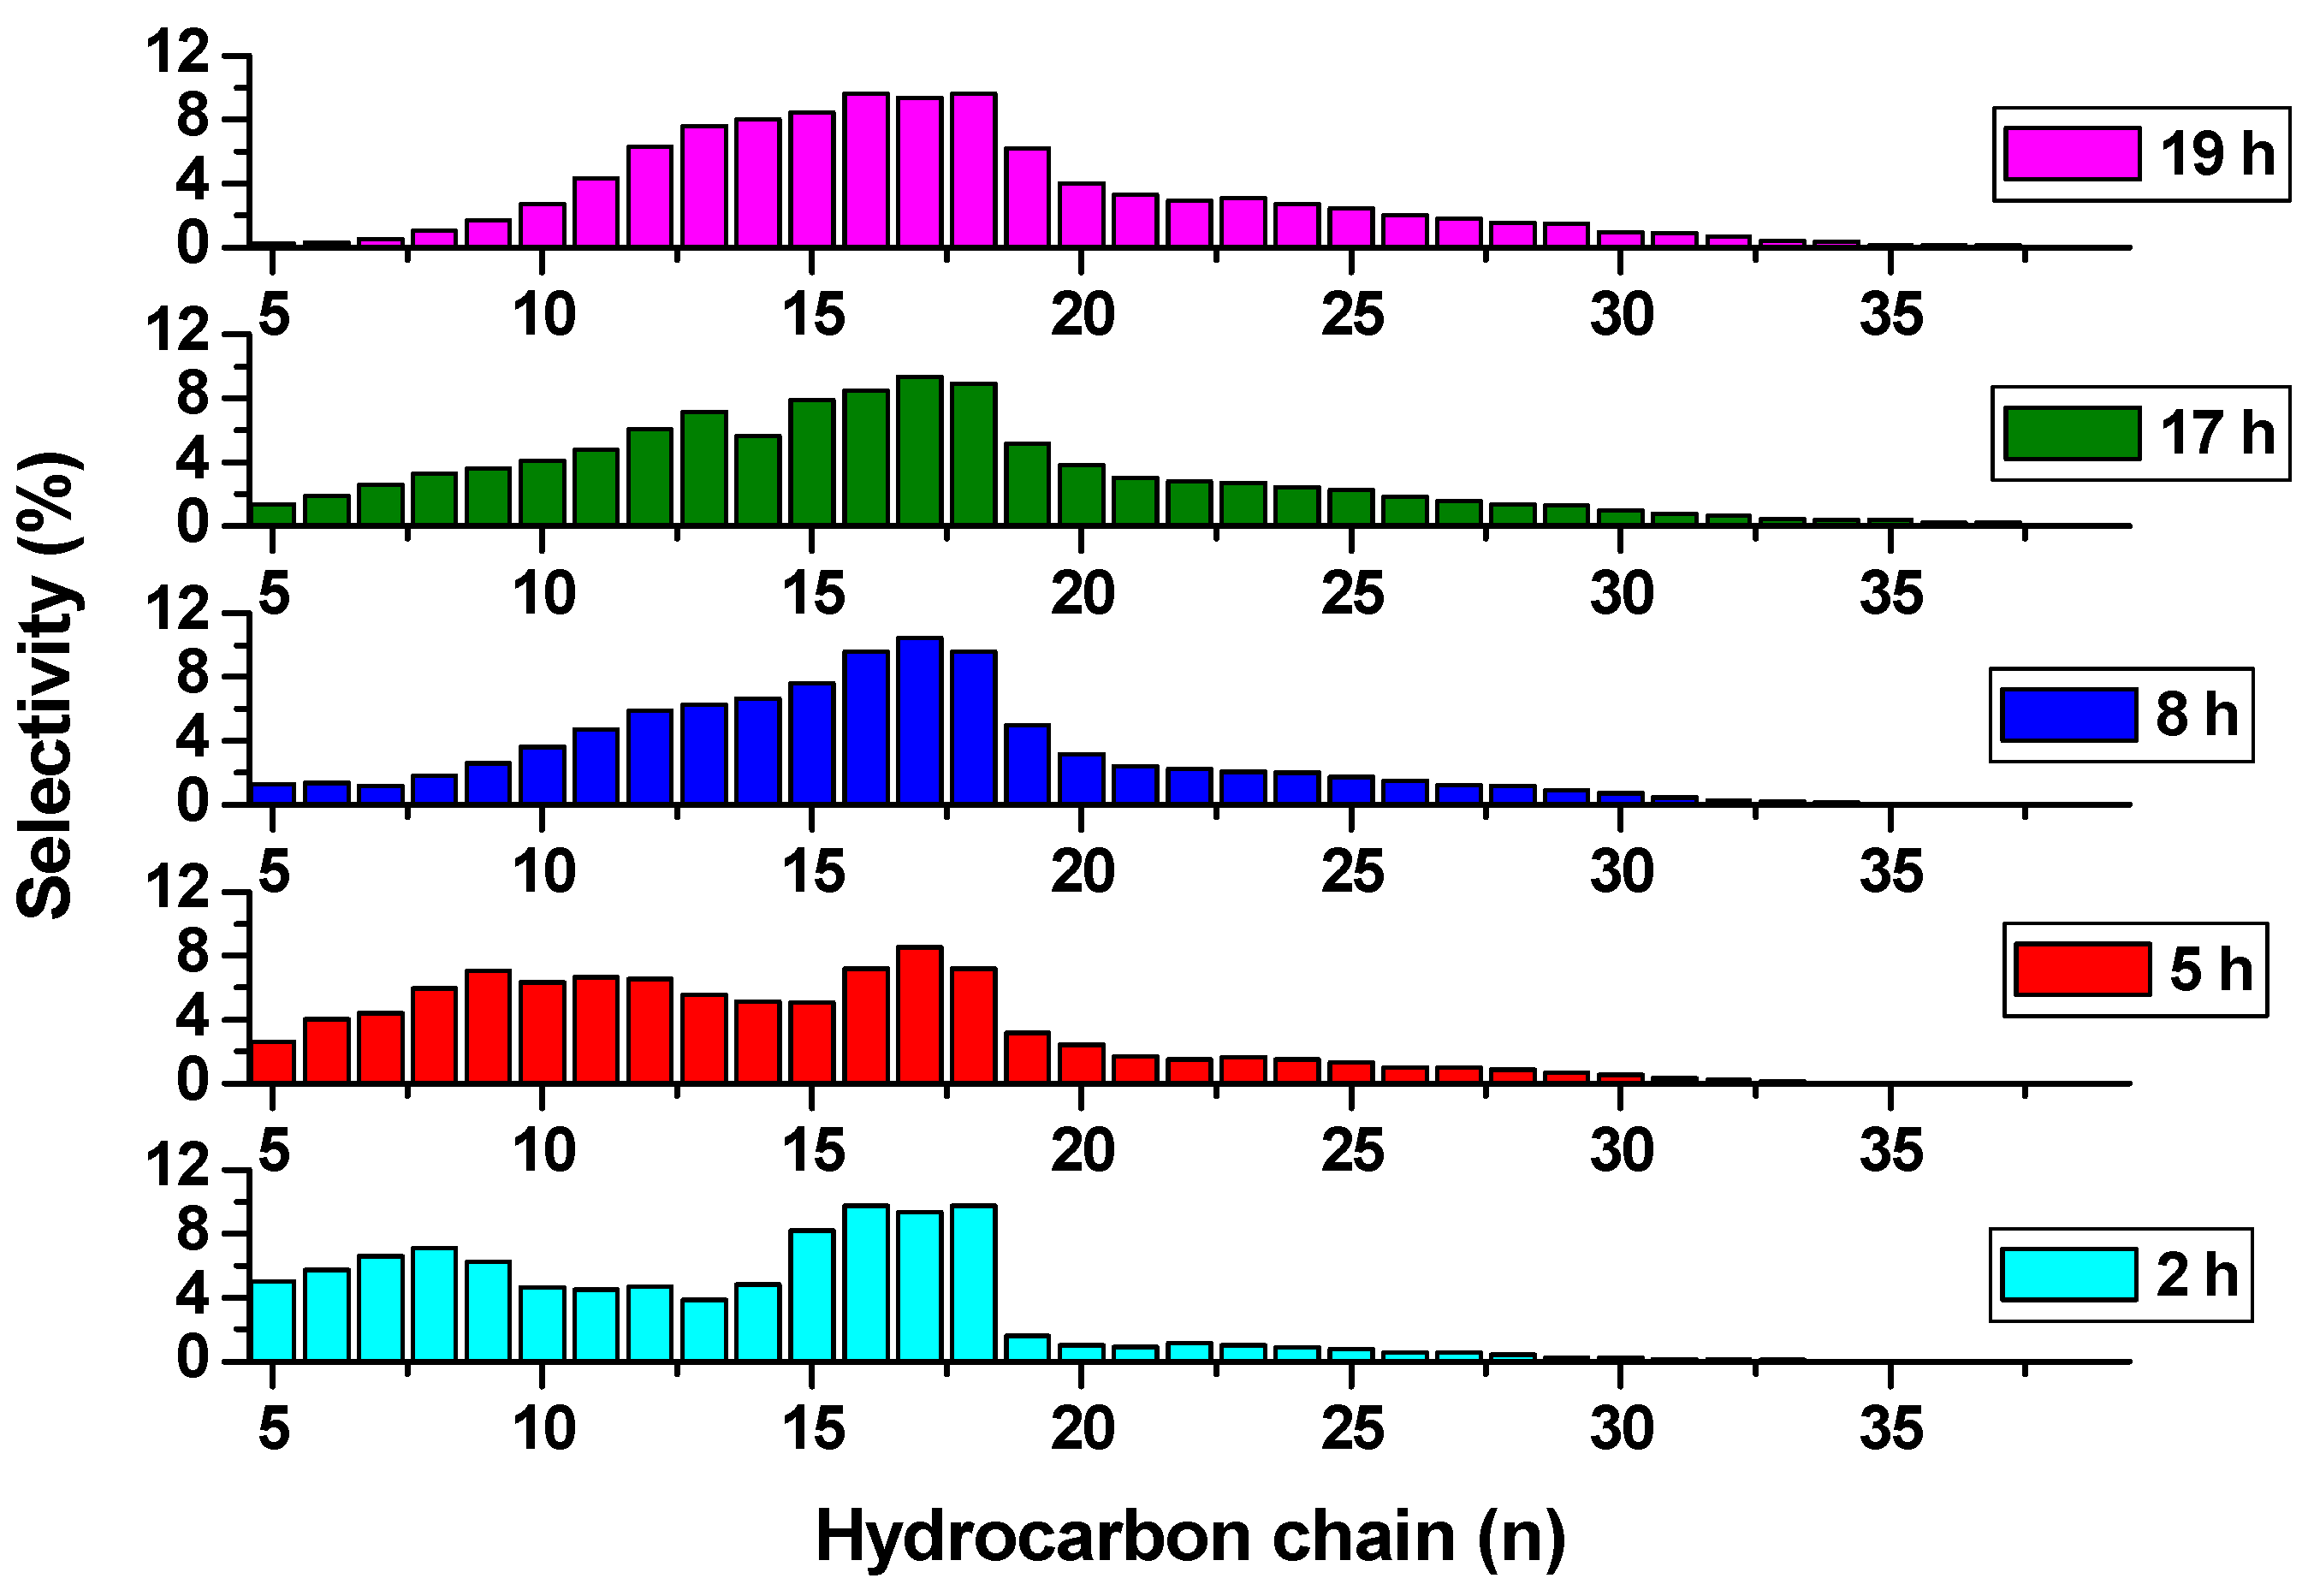
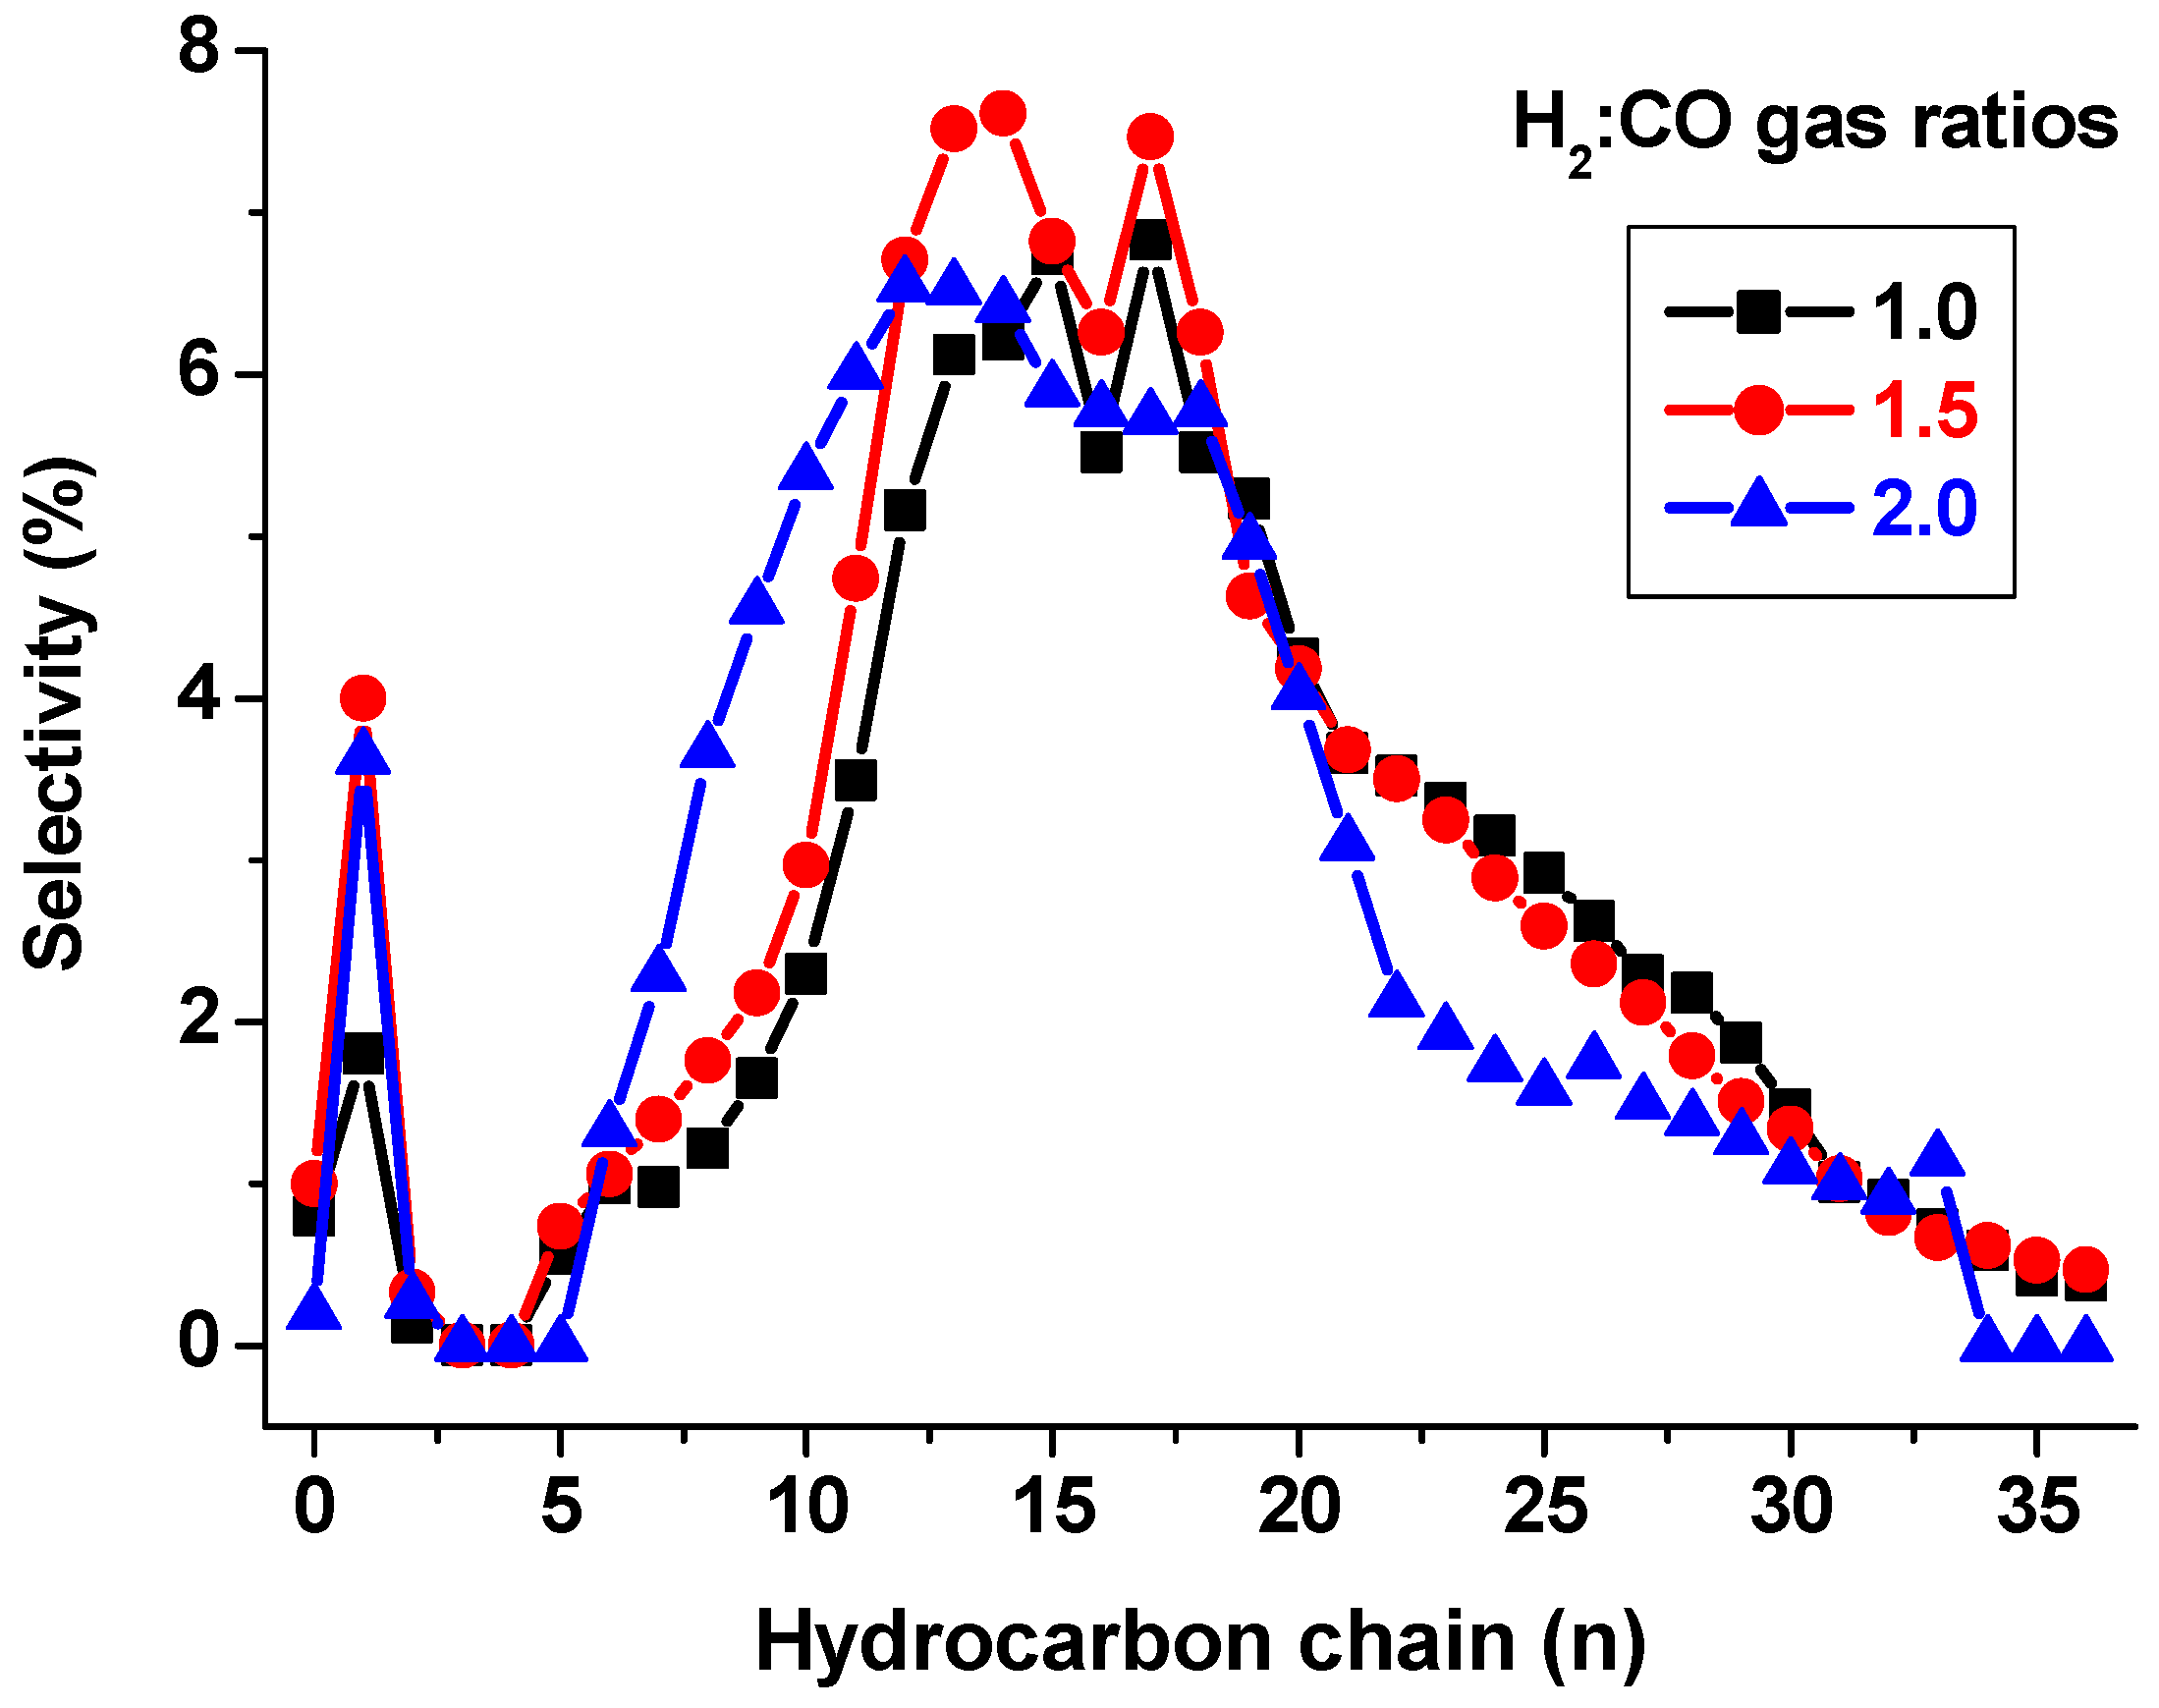
2.3. Catalyst Selectivity

Since the modification on the FTS reactor system offered capacity to simultaneously perform both gas-phase and liquid-phase analysis, combining the results provided a full portrait of the FTS product-spectrum in real time. Figure 7 demonstrates the progressive polymerization occurring in the liquid-phase with TOS. The slurry was sampled 5 times (after 2 h, 5 h, 8 h, 17 h and 19 h of FTS reaction). This procedure was repeated for another experiment, which produced similar results displaying the incremental change perceived in the liquid-phase of the FTS product distribution.
The emerging trend indicated that with passage of time from 2 h to 19 h, there was a substantial transformation from the shorter hydrocarbon chains to the higher molecular-weight fractions. For example, about 5% of C5 existed at 2 h, diminishing to almost zero at 19 h. At the same time, the waxes that were present in very minute quantities at 2 h had increased considerably at 19 h. From the gas-phase analysis, a high production of CH4 was recorded initially, making up to 11%, but dropped to approximately 8% after 6 h, and below 4% at 24 h. The combined C2’s (C2H6 and C2H4) gave a total of about 0.6%, while the composition of CO2 was only 0.5% in the effluent stream. No C3 or C4 compounds were detectable. Figure 8 provides the full spectrum of the FTS product distribution at various H2:CO ratios of 2.0, 1.5 and 1.0 that indicated a shift to the lower molecular weights as the H2:CO ratio increased from 1 to 2.

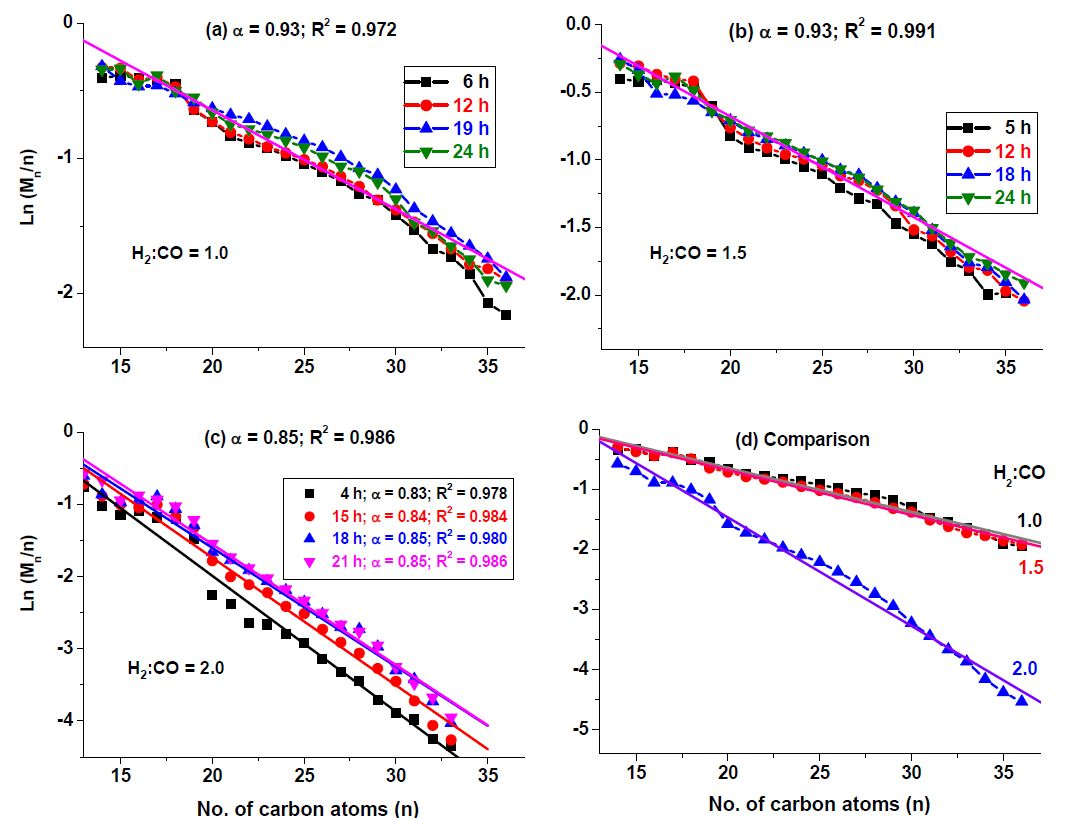
2.4. Determination of α-Values

Since our GC column was incapable of distinguishing the hydrocarbon compounds entirely by their various functional groups, in combining together all molecules with equal number of carbon atoms (alkanes, alkenes oxygenates, etc.), it was assumed that the formation of FTS products conformed to the conventional (ASF) polymerization kinetics, quantitatively described as requiring the presence of only one type of chain-growth site. Given that the catalyst was both nanometric and non-porous, heat and mass transport effects were essentially eliminated, so we suppose since earlier optimization tests indicated the same [42]. As presented in Figure 9, results of log(Mn/n) versus n demonstrated the typical deviation from the normal ASF distribution [43], due to the formation of significant amounts of CH4 followed immediately by almost a non-existent (C2–C5) portion. This created a dip in the plot as seen in Figure 9a: with very little of C2H6 and C2H4 observed (amounting to less than 1%, when combined).
From C4 there was a sharp rise towards C6 that gently increased to C10. Beyond C10 one may observe two definite gradients: a gentle one between C10–C16 and a steeper one above C16 that is detectable from Figure 9b. Solving for log(α) in Equation (4) revealed that the α-value for the Co/C catalyst was approximately 0.87, which was attained very quickly at low GHSV of 1800 cm3∙h−1∙g−1 of catalyst using H2:CO = 2. Analyses for samples tested at GHSV of 3600 cm3∙h−1∙g−1 using various H2:CO ratios of 2.0, 1.5 and 1.0 are provided in Figure 10 showing that the CO-rich gas streams (of H2:CO ratios of 1.5 and 1.0) displayed the higher α-value of 0.93, and attained the maximum value within ~6 h, while the H2-rich gas stream (H2:CO = 2) showed a lower α-value of 0.85, which was only attained after over 15 h on stream.
Table 3 summarizes the aggregate product fractions as obtained at the end of the reaction (TOS = 24 h) using the various gas feeds, which when the liquid-phase products were transmuted into the graphical format as shown in Figure 11 indicated that application of low H2:CO ratios suppresses H2O production, but enhances wax formation. High H2:CO ratio of 2 only influences additional formation of gasoline, because diesel production remains more or less constant at all H2:CO ratios. Prolonged reaction times were observed to shift the product spectrum from the gasoline fraction to the wax fraction, with little net impact on the quantity of diesel formed. Nonetheless, overall the catalyst was perceived to be more selective towards the production of the diesel-fraction (~45%), which was in fact, our target product. A convergence of gradients towards the highest possible α-value (~0.85) was observed to form a common product spectrum at higher residence times (above 15 h).

3. Discussion

3.1. Evaluation of Research Objectives

The application of nanometric catalysts in this work was targeted for two main reasons: that the FTS product selectivity is strongly influenced by the size of Co nanoparticles [30], and that it is desirable to operate the reactor away from diffusion-limiting regimes. Due to the nature of the reaction, the large polymeric molecules especially the waxes generated in due course may easily clog catalyst pores and lead to catalyst deactivation. Therefore, the application of both nanometric and non-porous catalysts with high BET specific surface area of ~56 m2∙g−1 of catalyst have been posited to be ideal for LT-FTS [7]. From our initial research objectives, it is hereby concluded that the plans were successfully executed and our product targets achieved since we were able to:
(i)
Use a specially designed liquid sampling column to provide empirical evidence for the gradual development of the longer-chain hydrocarbons from real-time liquid-phase analysis, illustrating hydrocarbon-chain propagation with TOS;
(ii)
Determine the true α-value of the plasma-synthesized Co/C catalyst as being above 0.85, which could only be ascertained after over 15 h on stream, since any α-values determined below this time period may be misleading;
(iii)
Establish that the application of CO-rich syngas, which may in future be derived from biomass, is a viable alternative that can replace the current use of H2-rich syngas in generating high molecular FTS products.
Microscopy through SEM coupled with EDX indicated uniform distribution of metal moieties in the carbon matrix, while TEM analysis showed highly dispersed Co nanoparticles of mean particle size of ~11 nm. Both XANES and XRD hinted to the fact that the used catalyst samples did not undergo metal oxidation, a characteristic that may prove to be beneficial to the longevity of the catalyst. In addition, XRD analysis revealed that the FCC crystal structure of the Co catalyst was the predominant and possibly the active phase in the FTS reaction [7], although some scholars have provided evidence for potentially greater intrinsic activity displayed by the HCP phase of the Co catalyst [44]. The catalytic activity for CO conversion was shown to greatly increase for catalysts with a majority of HCP stacking compared to those containing mostly the FCC phase particles [45]. In our plasma-synthesized Co/C sample, the existing HCP phase in the initial Co metal was completely transformed into the FCC phase and the catalyst was still very active. This contrasts with literature data where catalysts that contain mainly the HCP crystal structure show more active catalysis for CO hydrogenation than the FCC crystal structure of the Co metal obtained from Co3O4 reduction [4]. Besides, the HCP structure favours a different reaction mechanism, which involves direct CO dissociation, while the FCC structure kinetically favours the H-assisted CO dissociation mechanism on the Co metal [44]. We are of the opinion that there is full dependence on the presence of H2 to dissociate CO on the FCC phase, because the metal nanoparticle-size range in our samples can only produce the stable FCC structure, while the HCP would automatically undergo a phase transformation. A summary of the catalyst’s properties are provided in Table 4.

3.2. Application of Biomass and Bio-Syngas as Game Changer in Fuel Industry

This study intended to investigate the possible outcomes of exposing our recently formulated plasma-synthesized Co/C catalyst [9], to a CO-rich FTS feedstock because the composition of syngas feedstock was observed to impact on the FTS product distribution [46]. In this work, application of CO-rich gas feed simulating bio-syngas has established the practicality of producing higher molecular-weight hydrocarbons in FTS, although with lower CO conversions when compared to the H2-rich feeds. The high α-value of 0.93 obtained (at 220 °C and 2 MPa) for CO-rich inlet stream would be a beneficial characteristic to the plasma-synthesized Co/C catalyst, particularly when considering the use of biomass-derived syngas feeds.
Since low CO conversions could be expected in the FTS using CO-rich feed stocks, a slight increase in temperature above 220 °C may enhance catalytic activity and enrich the diesel fraction. Alternatively, the waxes so produced can be converted to diesel fuel by way of thermal or hydrocracking of the waxes so produced. In industry, Co catalysts are designed for maximum selectivity in wax production that in turn acts as a feedstock for hydrocracking, and it is projected that an 80% selectivity towards diesel fuel can be achieved by blending both the FTS and hydrocracking processes [47]. One of the advantages observed from these results is the rapid chain growth experienced by use of the plasma-derived catalyst, particularly with the application of low H2:CO ratios. In addition, since the hydrocarbon-chain growth begins at C5, very limited quantities of CO2, C2’s (ethane and ethene), C3’s and C4’s were detected, and in fact the CH4 production diminishes with TOS.

3.3. Catalyst Selectivity and α-Values

In this investigation, there was the typical deviation from the ASF distribution observed at the lower carbon values of (n ≤ 10) due to reaction thermodynamics favouring CH4 formation in appreciable quantities (up to 12%). However, the conspicuous absence of the C2–C4 portion cannot be explained from their thermodynamics point of view. For example, in the Fe-catalyzed LT-FTS, a two-α-model has been advanced to describe product selectivity, which is correlated to the catalyst’s surface properties. The non-polar Fe-carbide surface seems to be responsible for the production of paraffins and olefins, while the polar Fe-oxide surface could be responsible for the production of light hydrocarbons, olefins and oxygenates [48]. The deviation from the ASF distribution has been noted particularly for its poor suitability for nanometric catalytic systems, and this could be an indicator of critical variations in the dominant growth mechanisms of FTS catalyzed by nanoparticles [49]. Since the predicted α-values for the Co catalyst by the ASF model is in the range of 0.70–0.80, our Co/C catalyst depending on reaction conditions was found to be greater, in the range of 0.78–0.87 (for H2:CO = 2), and 0.93 (for H2:CO ≤ 1.5). The higher α-values were validated by the substantial conspicuous solid wax, visible to the naked eye [7]. This creates the impression that liquid GC analysis may only be partially effective since the wax may not dissolve fully in the solvent during analysis.
When heavier components of the product stream are unable to dissolve or accumulate in the solvent, it lowers its amount in the sample drawn for analysis (α = Mn+1/Mn). A noted classic example is the slow accumulation of the heavier products in the solvent that can lead to negative deviation from the α-values predicted by ASF [50]. However, in our case, the values were higher than those predicted. A possible explanation is that with the use of nanometric and non-porous materials, no diffusion limitations existed and hence the apparent instantaneously availability of the FTS products in the solvent for analysis. Besides, it is also thought that since the heavier hydrocarbons take longer to move away from the catalyst surface, by virtue of their size, they have greater re-adsorption probability after formation [51]. Other authors indeed agree with the supposition that the olefin-chain length influences re-adsorption rate because the strength of molecular physisorption on catalyst surface increases its solubility in FTS wax with growing chain length and this olefin re-adsorption model was used to accurately predict product selectivity over the entire range of their experimental conditions [14]. It is for this reason that we think our nanometric catalysts are efficient in the process of hydrocarbon chain-growth propagation because no diffusion limitations seem to exist.

4. Experimental Section

4.1. Catalyst Synthesis: Reagents

The raw materials used for catalyst synthesis and testing were: cobalt metal powder with particle size range of 1–10 μm and cobalt (II) oxide (Aldrich, Milwaukee, WI, USA); high purity FTS feed stock gases (PRAXAIR, Sherbrooke, QC, Canada) composing H2 (N5.0), CO (N2.5), and Ar (N5.0); mineral oil (Fisher Scientific, Ottawa, ON, Canada), with catalog name “O122-4, Mineral Oil, Heavy; USP/FCC (Paraffin Oil, Heavy)”, and 99% pure n-hexadecane solvent (Fisher Scientific, Whitby, ON, Canada)

4.2. Catalyst Characterization

The Co/C catalyst under review has already been fully characterized: initially by XANES (Canadian Light Source (CLS) Synchrotron, Saskatoon, SK, Canada), and for porosity and BET specific surface area using the Accelerated Surface Area Porosimeter (ASAP) 2020 instrument (Micromeritics, Norcross, GA, USA) [9], and later the quantitative elemental analysis for the Co metal in the C support was performed by the carbon ignition method using a TG-DTA Setsys 2400 instrument (Setarum, Hillsborough, NJ, USA), while phase analysis was conducted on a Philips X’pert PRO X-ray Diffractometer (PANalytical, EA Almelo, The Netherlands), which is fitted with Ni-filters for the Cu Kα radiation of wavelength alpha1 = 1.5406 Å, produced at 40 kV and 50 mA (PANalytical, EA Almelo, The Netherlands). Curve-fitting modeling to determine the various amounts of each species in the catalyst was done using the PANalytical’s High Score Plus software by Rietveld Quantitative Analysis (RQA).
In addition, the microscopic properties of the material were revealed by a Hitachi S-4700 Scanning Electron Microscope (SEM), equipped with an X-Max Oxford EDX spectrometer for elemental analysis (Hitachi, Tokyo, Japan). On the other hand, analysis by Transmission Electron Microscopy (TEM) was conducted on a Hitachi H-7500 Microscope, fitted with tungsten filament operated at an accelerating electron beam of 120 kV. A bottom-mounted AMT 4k x 4k CCD Camera System Model X41 captured images in bright field mode. (Hitachi, Tokyo, Japan) [7]. Comprehensive test procedures and analysis conditions are therefore provided in the cited articles.

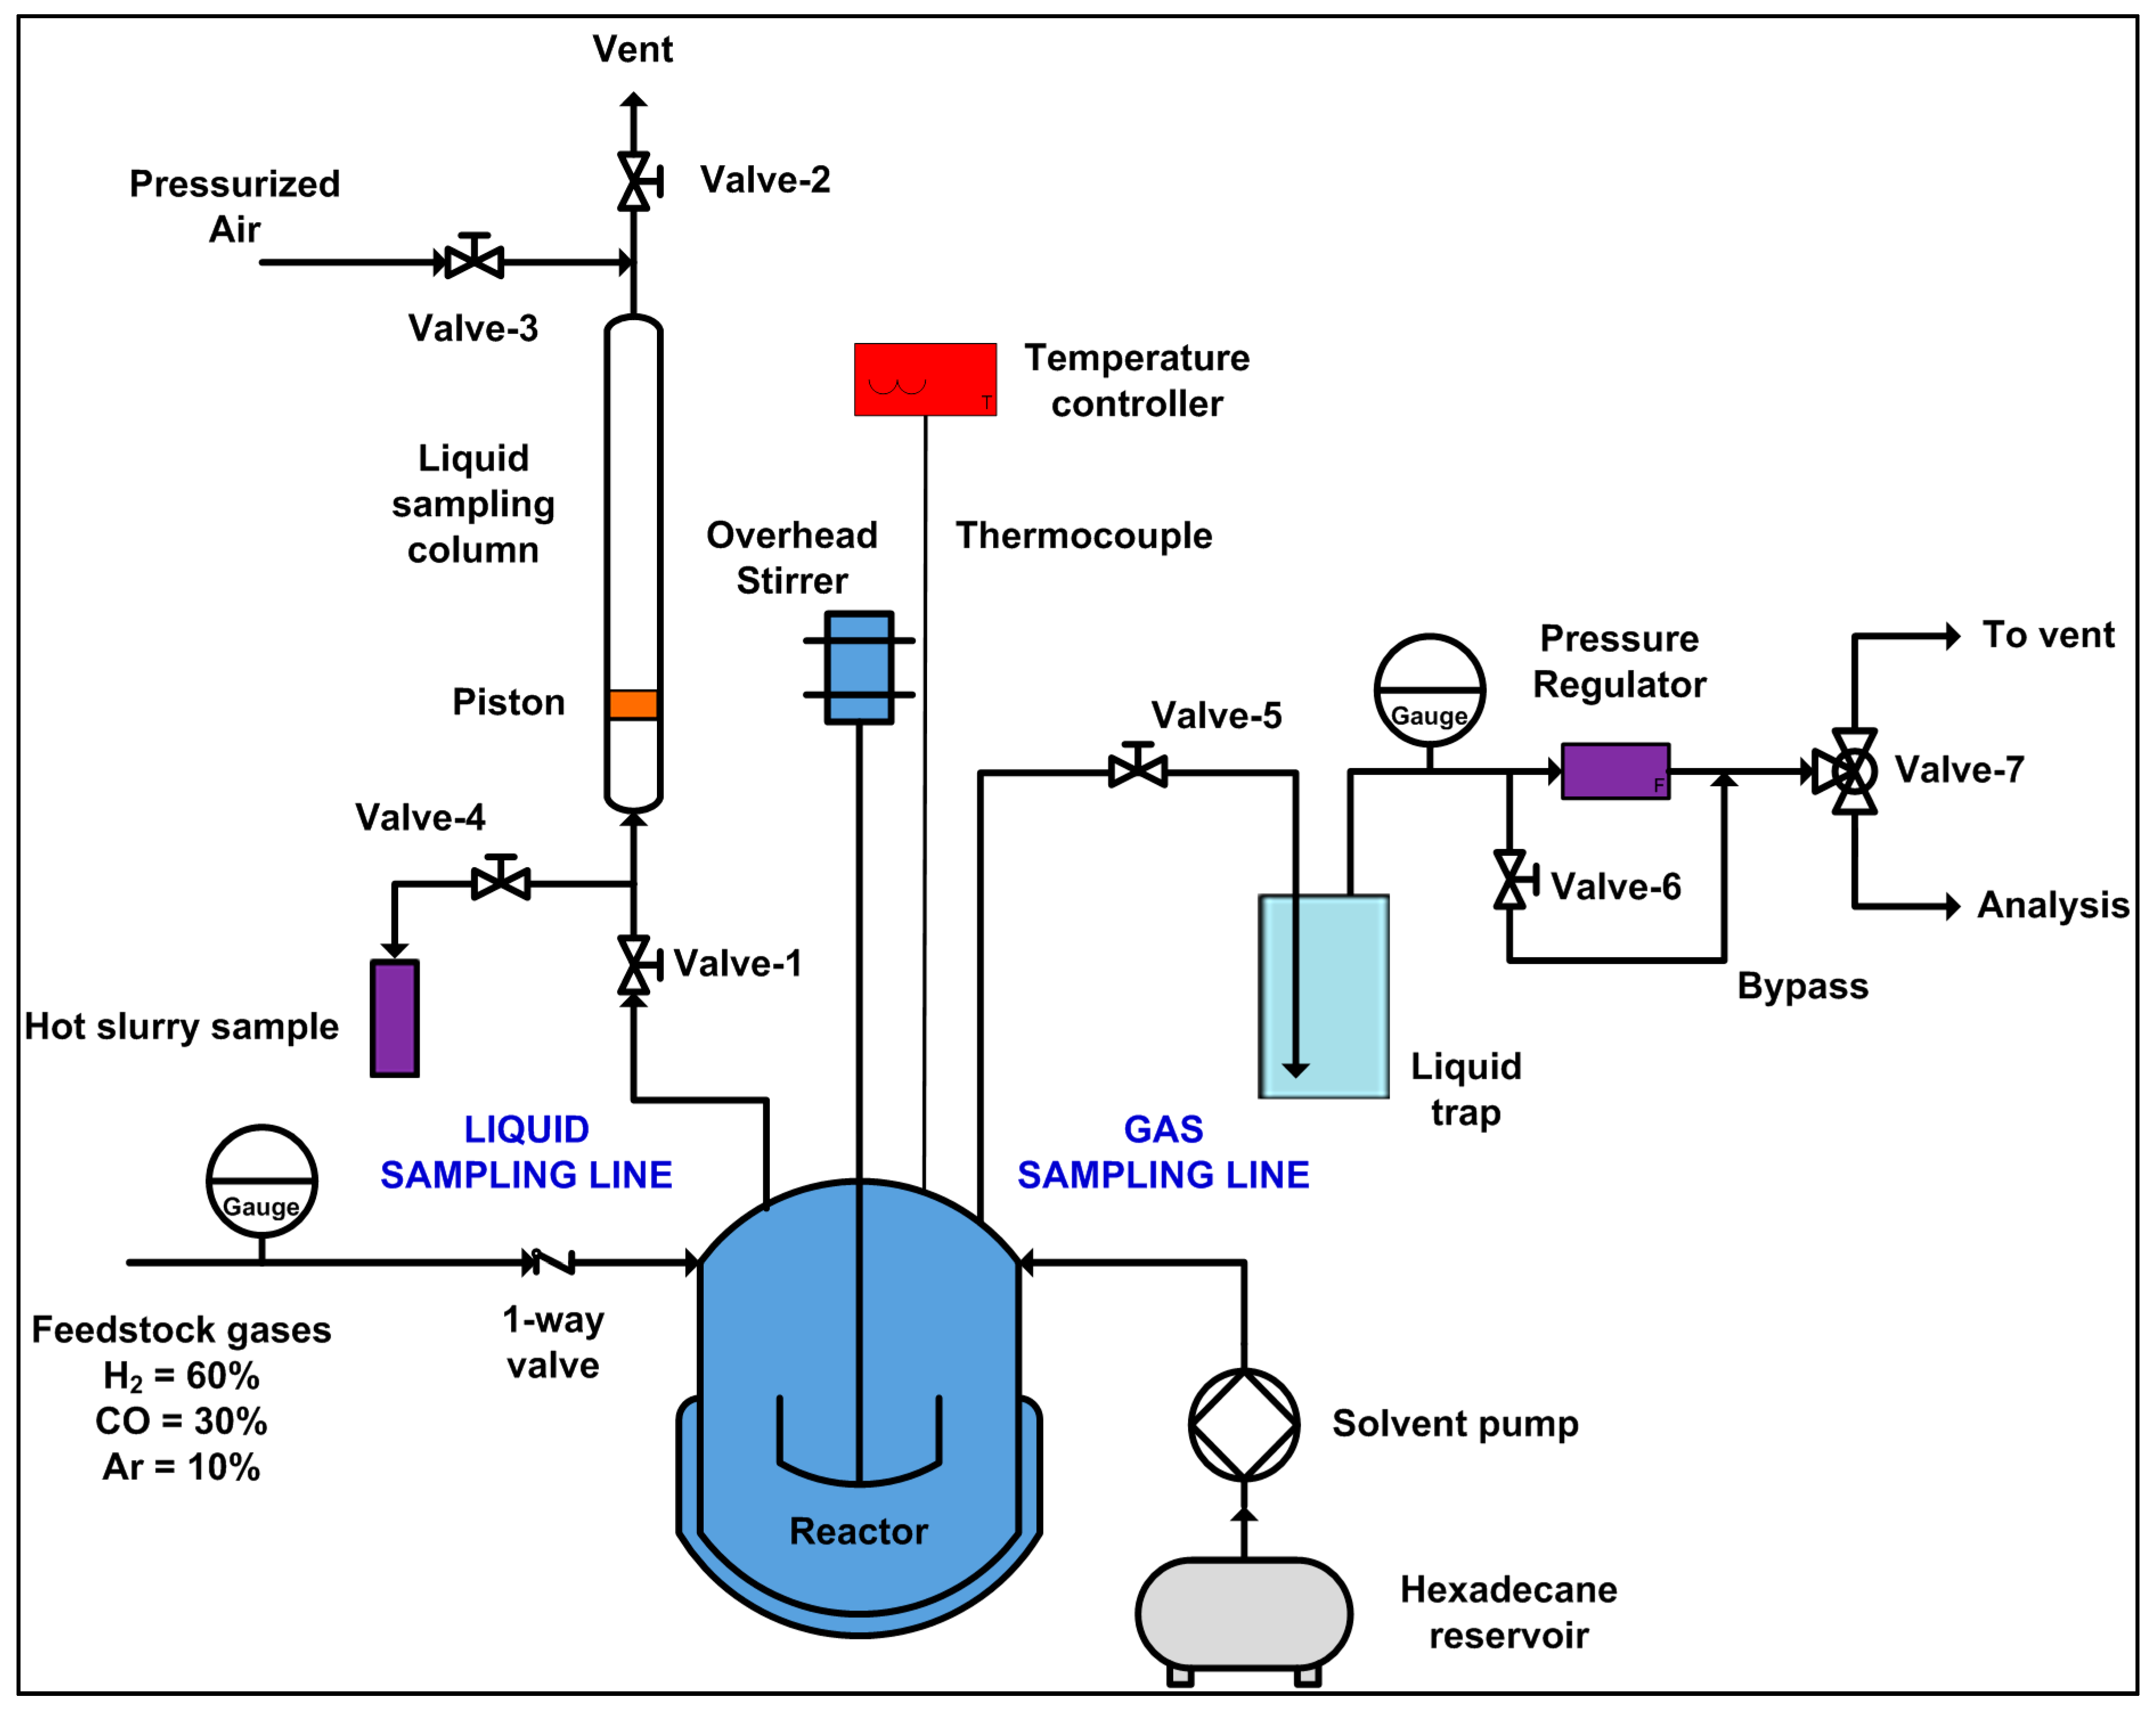
4.3. Reactor Designs

4.3.1. Plasma Synthesis Reactor

The reactor set-up and detailed production of the catalyst synthesis method through plasma has been provided in an earlier article [30], where two reactor vessels were used to trap the synthesized materials. The first vessel, which confines the plasma plume is regarded as the main plasma reactor, while the auxiliary reactor lies adjacent to the main plasma reactor and both of them are connected through a junction where the fine-powder catalyst particles are captured on filters during the high vacuum evacuation.

4.3.2. Fischer-Tropsch Synthesis Reactor (3-φ-CSTSR)

The catalyst was tested in a 3-phase continuously-stirred tank slurry reactor vessel with a holding capacity of 0.5 L (Autoclave Engineers, Erie, PA, USA). In the current work, the original reactor design [7] was modified, in that, a liquid-phase sampling line was introduced into the reactor as shown in Figure 11. The sampling pipe for the slurry originated from the bottom of the vessel, while the gas-phase sampling pipe originated from the top of the reactor. The scheme incorporated a method intended to draw the slurry safely at high temperature and pressure without interrupting the reaction by use of a 15-cm long liquid-sampling column having a 1.5-cm internal diameter.

4.4. Liquid Sampling

Before sampling the slurry, all valves were shut, then valve-1 in Figure 12 was opened to allow the reactor pressure (2 MPa) to push the piston and hence the liquid, up the sampling column. After shutting valve-1, valve-2 was opened slowly to release the pressure in the column. While valve-2 was still open and valve-3 shut, valve-4 was opened carefully to draw out about 1–2 cm3 sample of the slurry into a vial. Having all valves shut, the pressure in the air cylinder was raised slightly above the reactor pressure (e.g., 2.2 MPa). Valve-3 was then opened progressively in order to push the piston back to the bottom of the sampling column thereby pushing the untapped slurry back into the reactor for further reaction. The valve was shut again and by keeping all valves closed, valve-2 was opened to release the pressure that originated from the air bottle and then the valve was shut again. At the appointed time, the cycle was repeated at various time intervals without interrupting the reaction considerably. The drawn slurry sample was then filtered before injecting about 0.1 μm of the liquid sample into the liquid-based GC for analysis.

4.5. Catalyst Testing

All catalyst samples were pre-treated at 400 °C for 24 h in a pure H2 (N5.0) gas stream flowing at RTP, at the rate of 250 SCCM, (standard cubic cm per min or 4.17 × 10⁻⁶ Nm3∙s−1; where 1 SCCM = 1.67 × 10⁻⁸ Nm3∙s−1), while the FTS reaction was carried out in 3-φ-CSTSR operated isothermally at 220 °C and 2 MPa pressure with a stirring rate of over 2000 rpm. The purpose of pre-treatment by reduction is to gasify some of the excess carbon matrix in order to increase exposure of the metal nanoparticles to the FTS gas reactants. The initial gas composition was set in the H2:CO ratio of 2:1 flowing at 300 SCCM (or 5.01 × 10⁻⁶ Nm3∙s−1), containing 0.6 L/L (60 vol %) H2 and 0.3 L/L (30 vol %) CO, balanced in 0.1 L/L (10 vol %) Ar, for mass-balance calculation. At higher temperature (e.g., 260 °C), the catalyst became less useful for evaluating the α-value due to excessive CH4 production (up to ~46%) [52]. Hexadecane (C16) solvent was used to make up a reactor volume of 210 cm3, and a mass of 5.0 g of catalyst utilized to create a gas flow rate with GHSV of 3600 cm3∙g−1∙h−1 of catalyst. The catalyst was doubled to 10.0 g to deliver a GHSV of 1800 cm3∙g−1∙h−1 of catalyst, while holding all the other reaction parameters constant. In other experiments, the feed gas composition was altered from H2:CO ratio of 2.0 to 1.5 or to 1.0.
During the reaction, the gas-phase was sampled and tested for CO conversion using an at-line GC, while small quantities (1–2 cm3) of the slurry were drawn about five times at various intervals within the 24-h reaction for real-time liquid-phase analysis. The solid-liquid sample was filtered before injecting into the liquid-based GC. From the GC charts, peak areas were computed to determine the selectivity of the product spectrum for both the gas-phase and liquid-phase analyses by a method already described in an earlier article [7]. The α-values were obtained by the least-squares linear regression of Equation (3), but in the logarithmic form expressed as Equation (4), where log(Mn/n) is plotted against n (the hydrocarbon-chain length) [15]. The following typical characteristic ranges of α-values for various catalysts: for Ru = 0.85–0.95; Co = 0.70–0.80; and Fe = 0.50–0.70, which are designated in this article as the “predicted” α-values [53].

5. Conclusions

From the objectives of this work, we developed a safe sampling method of drawing small portions of the hot slurry from a pressured 3-φ-CSTSR vessel without significantly interrupting the FTS reaction process. This approach enabled us to provide tangible evidence for the gradual formation and shift of the FTS fractions towards the heavier hydrocarbons with TOS. When tested at 220 °C (493 K), 2 MPa pressure, and GHSV = 3600 cm3∙g−1∙h−1 of catalyst, results showed that there was lower catalyst activity of ~10% and ~20% CO conversion at H2:CO ratio of 1.0 and 1.5 respectively, with a predominant production of the heavier molecular weight fractions (diesel = C13–C20 and waxes = C21+), giving an α-value of 0.93. A higher catalyst activity (~40% CO conversion) was witnessed for H2:CO ratio of 2.0 with prevalent tendency to produce more light-weight hydrocarbons (gasoline = C4–C12) and this led to relatively lower α-value of 0.85. Although our target fraction in this reaction was to produce diesel fuel as the principal fraction, the α-values higher than the predicted figure of 0.8 imply that the catalyst has great propensity to produce C20+ fractions too, particularly under CO-rich gas-feed streams.

Acknowledgments

We thank the Canadian BiofuelNet National Centre of Excellence (NCE) for financial support, Henri Gauvin for technical expertise in the labs; the CCM (Centre de Caractérisation des Matériaux, Université de Sherbrooke) staff for facilitating the characterization: Irène Kelsey Lévesque and Carl St.-Louis for BET surface area analysis, Charles Bertrand for Microscopy (SEM & TEM), and Stéphane Gutierrez for XRD analysis.

Author Contributions

Catalyst synthesis, testing, characterization, data analysis and manuscript drafting was done by James Aluha, while Nicolas Abatzoglou supervised the entire work and proofread the document. Yongfeng Hu provided access to the Canadian Light Source (CLS) Synchrotron and supervised the XANES analysis.

Conflicts of Interest

The authors declare no conflict of interest.

Abbreviations

The following abbreviations have been used in this manuscript:
ASFAnderson-Schulz-Flory distribution
ASAPAccelerated surface area porosimeter (Micromeritics ASAP-2020) instrument
BETBrunauer-Emmett-Teller method for specific surface area analysis
EDXEnergy dispersive X-ray spectroscopy
FCCFace centred cubic structure
FTSFischer-Tropsch synthesis
GCGas chromatography
GHSVGas hourly space velocity
HCPHexagonal closed packing structure
ICP-MSInductively-coupled plasma mass spectrometry
LT-FTSLow-temperature Fischer-Tropsch synthesis
RQARietveld quantitative analysis
RTPRoom temperature and pressure
SASOLSouth African Synthetic Oil Ltd.
SCCMStandard cubic centimetre per minute
SEMScanning electron microscopy
SPSSuspension plasma-spray technology
TEMTransmission electron microscopy
TGAThermogravimetric analysis
TOSTime-on-stream
XANESX-ray absorption near-edge structure analysis by Synchrotron light
XRDX-ray diffraction analysis
3-φ-CSTSRThree-phase continuously-stirred-tank slurry reactor

References

  1. Thomas, J.M.; Thomas, W.J. Principles and Practice of Heterogeneous Catalysis; Wiley: Hoboken, NJ, USA, 1997; p. 526. [Google Scholar]
  2. Vosloo, A.C. Fischer–Tropsch: A futuristic view. Fuel Process. Technol. 2001, 71, 149–155. [Google Scholar] [CrossRef]
  3. Ding, M.; Yang, Y.; Wu, B.; Xu, J.; Zhang, C.; Xiang, H.; Li, Y. Study of phase transformation and catalytic performance on precipitated iron-based catalyst for Fischer-Tropsch synthesis. J. Mol. Catal. A Chem. 2009, 303, 65–71. [Google Scholar] [CrossRef]
  4. Kwak, G.; Kim, D.-E.; Kim, Y.T.; Park, H.-G.; Kang, S.C.; Ha, K.-S.; Juna, K.-W.; Lee, Y.-J. Enhanced catalytic activity of cobalt catalysts for Fischer-Tropsch synthesis via carburization and hydrogenation and its application to regeneration. Catal. Sci. Technol. 2016, 6, 4594–4600. [Google Scholar] [CrossRef]
  5. Fu, T.; Jiang, Y.; Lv, J.; Li, Z. Effect of carbon support on Fischer–Tropsch synthesis activity and product distribution over Co-based catalysts. Fuel Process. Technol. 2013, 110, 141–149. [Google Scholar] [CrossRef]
  6. D’Souza, L.; Barnes, S.; Regalbuto, J.R. The simple, effective synthesis of highly dispersed Pd/C and CoPd/C heterogeneous catalysts via charge-enhanced dry impregnation. Catalysts 2016, 6, 1–11. [Google Scholar] [CrossRef]
  7. Aluha, J.; Braidy, N.; Dalai, A.; Abatzoglou, N. Low-temperature Fischer-Tropsch synthesis using plasma-synthesised nanometric Co/C and Fe/C catalysts. Can. J. Chem. Eng. 2016, 94, 1504–1515. [Google Scholar] [CrossRef]
  8. Liu, C.-J.; Zou, J.; Yu, K.; Cheng, D.; Han, Y.; Zhan, J.; Ratanatawanate, C.; Jang, B.W.-L. Plasma application for more environmentally friendly catalyst preparation. Pure Appl. Chem. 2006, 78, 1227–1238. [Google Scholar] [CrossRef]
  9. Aluha, J.; Boahene, P.; Dalai, A.; Hu, Y.; Bere, K.; Braidy, N.; Abatzoglou, N. Synthesis and characterisation of nanometric Co/C and Fe/C catalysts for Fischer-Tropsch synthesis: A comparative study using a fixed-bed reactor. Ind. Eng. Chem. Res. 2015, 54, 10661–10674. [Google Scholar] [CrossRef]
  10. Tristantini, D.; Lögdberg, S.; Gevert, B.; Borg, Ø.; Holmen, A. The effect of synthesis gas composition on the Fischer–Tropsch synthesis over Co/γ-Al2O3 and Co–Re/γ-Al2O3 catalysts. Fuel Process. Technol. 2007, 88, 643–649. [Google Scholar] [CrossRef]
  11. Chaudhari, S.T.; Bej, S.K.; Bakhshi, N.N.; Dalai, A.K. Steam gasification of biomass-derived char for the production of carbon monoxide-rich synthesis gas. Energy Fuels 2001, 15, 736–742. [Google Scholar] [CrossRef]
  12. Hu, J.; Yu, F.; Lu, Y. Application of Fischer-Tropsch synthesis in biomass to liquid conversion. Catalysts 2012, 2, 303–326. [Google Scholar] [CrossRef]
  13. Aluha, J.; Braidy, N.; Dalai, A.; Abatzoglou, N. Low-temperature fischer-tropsch synthesis with carbon-supported nanometric iron-cobalt catalysts. In Proceedings of the 23rd European Biomass Conference and Exhibition, Vienna, Austria, 1–4 June 2015.
  14. van der Laan, G.P.; Beenackers, A.A.C.M. Hydrocarbon selectivity model for the gas-solid Fischer-Tropsch synthesis on precipitated iron catalysts. Ind. Eng. Chem. Res. 1999, 38, 1277–1290. [Google Scholar] [CrossRef]
  15. Bartholomew, C.H.; Farrauto, R.J. Fundamentals of Industrial Catalytic Processes; John Wiley & Sons, Inc.: Hoboken, NJ, USA, 2006; p. 403. [Google Scholar]
  16. Fu, T.; Li, Z. Review of recent development in Co-based catalysts supported on carbon materials for Fischer-Tropsch synthesis. Chem. Eng. Sci. 2015, 135, 3–20. [Google Scholar] [CrossRef]
  17. Jacobs, G.; Das, T.K.; Zhang, Y.; Li, J.; Racoillet, G.; Davis, B.H. Fischer-Tropsch synthesis: Support, loading, and promoter effects on the reducibility of cobalt catalysts. Appl. Catal. A 2002, 233, 263–281. [Google Scholar] [CrossRef]
  18. Jacobs, G.; Ma, W.; Gao, P.; Todic, B.; Bhatelia, T.; Bukur, D.B.; Davis, B.H. The application of synchrotron methods in characterizing iron and cobalt Fischer-Tropsch synthesis catalysts. Catal. Today 2013, 214, 100–139. [Google Scholar] [CrossRef]
  19. Ding, M.; Yang, Y.; Wu, B.; Li, Y.; Wang, T.; Ma, L. Study on reduction and carburization behaviors of iron-based Fischer-Tropsch synthesis catalyst. Energy Procedia 2014, 61, 2267–2270. [Google Scholar] [CrossRef]
  20. Khodakov, A.Y.; Chu, W.; Fongarland, P. Advances in the development of novel cobalt Fischer-Tropsch catalysts for synthesis of long-chain hydrocarbons and clean fuels. Chem. Rev. 2007, 107, 1692–1744. [Google Scholar] [CrossRef] [PubMed]
  21. van Berge, P.J.; van de Loosdrecht, J.; Barradas, S.; van der Kraan, A.M. Oxidation of cobalt based Fischer-Tropsch catalysts as a deactivation mechanism. Catal. Today 2000, 58, 321–334. [Google Scholar] [CrossRef]
  22. Van de Loosdrecht, J.; Balzhinimaev, B.; Dalmon, J.A.; Niemantsverdriet, J.W.; Tsybulya, S.V.; Saib, A.M.; van-Berge, P.J.; Visagie, J.L. Cobalt Fischer-Tropsch synthesis: Deactivation by oxidation? Catal. Today 2007, 123, 293–302. [Google Scholar] [CrossRef]
  23. Nabaho, D.; Niemantsverdriet, J.W.H.; Claeys, M.; van Steen, E. Hydrogen spillover in the Fischer-Tropsch synthesis: An analysis of gold as a promoter for cobalt-alumina catalysts. Catal. Today 2016, 275, 27–34. [Google Scholar] [CrossRef]
  24. Den Otter, J.H.; Nijveld, S.R.; de Jong, K.P. Synergistic promotion of Co/SiO2 Fischer-Tropsch catalysts by niobia and platinum. ACS Catal. 2016, 6, 1616–1623. [Google Scholar] [CrossRef]
  25. Miyazawa, T.; Hanaoka, T.; Shimura, K.; Hirata, S. Ruthenium modification on Mn and Zr-modified Co/SiO2 catalysts for slurry-phase Fischer-Tropsch synthesis. Catalysts 2015, 5, 26–37. [Google Scholar] [CrossRef]
  26. Fajín, J.L.C.; Cordeiro, M.N.D.S.; Gomes, J.R.B. Fischer-Tropsch synthesis on multicomponent catalysts: What can we learn from computer simulations? Catalysts 2015, 5, 3–17. [Google Scholar] [CrossRef]
  27. Jacobs, G.; Ma, W.; Davis, B.H. Influence of reduction promoters on stability of cobalt/γ-alumina Fischer-Tropsch synthesis catalysts. Catalysts 2014, 4, 49–76. [Google Scholar] [CrossRef]
  28. Iqbal, S.; Davies, T.E.; Morgan, D.J.; Karim, K.; Hayward, J.S.; Bartley, J.K.; Taylor, S.H.; Hutchings, G.J. Fischer Tropsch synthesis using cobalt based carbon catalysts. Catal. Today 2016, 275, 35–39. [Google Scholar] [CrossRef]
  29. Rytter, E.; Holmen, A. Deactivation and regeneration of commercial type Fischer-Tropsch Co-catalysts—A mini-review. Catalysts 2015, 5, 478–499. [Google Scholar] [CrossRef]
  30. Aluha, J.; Bere, K.; Abatzoglou, N.; Gitzhofer, F. Synthesis of nano-catalysts by induction suspension plasma technology (SPS) for Fischer-Tropsch reaction. Plasma Chem. Plasma P 2016, 36, 1325–1348. [Google Scholar] [CrossRef]
  31. Borg, Ø.; Eri, S.; Blekkan, E.A.; Storsæter, S.; Wigum, H.; Rytter, E.; Holmen, A. Fischer-Tropsch synthesis over γ-alumina-supported cobalt catalysts: Effect of support variables. J. Catal. 2007, 248, 89–100. [Google Scholar] [CrossRef]
  32. Abbaslou, R.M.M.; Tavassoli, A.; Soltan, J.; Dalai, A.K. Iron catalysts supported on carbon nanotubes for Fischer-Tropsch synthesis: Effect of catalytic site position. Appl. Catal. A 2009, 367, 47–52. [Google Scholar] [CrossRef]
  33. Trépanier, M.; Tavasoli, A.; Dalai, A.K.; Abatzoglou, N. Fischer-Tropsch synthesis over carbon nanotubes supported cobalt catalysts in a fixed bed reactor: Influence of acid treatment. Fuel Process. Technol. 2009, 90, 367–374. [Google Scholar] [CrossRef]
  34. Fu, T.; Huang, C.; Lv, J.; Li, Z. Fuel production through Fischer-Tropsch synthesis on carbon nanotubes supported co catalyst prepared by plasma. Fuel 2014, 121, 225–231. [Google Scholar] [CrossRef]
  35. Bezemer, G.L.; Bitter, J.H.; Kuipers, H.P.C.E.; Oosterbeek, H.; Holewijn, J.E.; Xu, X.; Kapteijn, F.; van Dillen, A.J.; de Jong, K.P. Cobalt particle size effects in the Fischer-Tropsch reaction studied with carbon nanofiber supported catalysts. J. Am. Chem. Soc. 2006, 128, 3956–3964. [Google Scholar] [CrossRef] [PubMed]
  36. De la Osa, A.R.; Romero, A.; Dorado, F.; Valverde, J.L.; Sánchez, P. Influence of cobalt precursor on efficient production of commercial fuels over FTS Co/SiC catalyst. Catalysts 2016, 6, 98. [Google Scholar] [CrossRef]
  37. Moazami, N.; Mahmoudi, H.; Rahbar, K.; Panahifar, P.; Tsolakis, A.; Wyszynski, M.L. Catalytic performance of cobalt-silica catalyst for Fischer-Tropsch synthesis: Effects of reaction rates on efficiency of liquid synthesis. Chem. Eng. Sci. 2015, 134, 374–384. [Google Scholar] [CrossRef]
  38. Moazami, N.; Wyszynski, M.L.; Mahmoudi, H.; Tsolakis, A.; Zou, Z.; Panahifar, P.; Rahbar, K. Modelling of a fixed bed reactor for Fischer–Tropsch synthesis of simulated N2-rich syngas over Co/SiO2: Hydrocarbon production. Fuel 2015, 154, 140–151. [Google Scholar] [CrossRef]
  39. Hong, J.; Chu, W.; Chernavskii, P.A.; Khodakov, A.Y. Cobalt species and cobalt-support interaction in glow discharge plasma-assisted Fischer-Tropsch catalysts. J. Catal. 2010, 273, 9–17. [Google Scholar] [CrossRef]
  40. Eschemann, T.O.; Bitter, J.H.; de Jong, K.P. Effects of loading and synthesis method of titania-supported cobalt catalysts for Fischer-Tropsch synthesis. Catal. Today 2014, 228, 89–95. [Google Scholar] [CrossRef]
  41. Mohandas, J.C.; Gnanamani, M.K.; Jacobs, G.; Ma, W.; Ji, Y.; Khalid, S.; Davis, B.H. Fischer-Tropsch synthesis: Characterization and reaction testing of cobalt carbide. ACS Catal. 2011, 1, 1581–1588. [Google Scholar] [CrossRef]
  42. Blanchard, J.; Abatzoglou, N. Nano-iron carbide synthesized by plasma as catalyst for Fischer-Tropsch synthesis in slurry reactors: The role of iron loading and K, Cu promoters. Catal. Today 2014, 237, 150–156. [Google Scholar] [CrossRef]
  43. Davis, B.H. The Two-Alpha Value for Iron Fischer-Tropsch Catalysts: Fact or Fiction? ACS Fuel: San Francisco, CA, USA, 2006; Argonne National Laboratory: San Francisco, CA, USA; pp. 173–183. [Google Scholar]
  44. Liu, J.-X.; Su, H.-Y.; Sun, D.-P.; Zhang, B.-Y.; Li, W.-X. Crystallographic dependence of Co activation on cobalt catalysts: HCP versus FCC. J. Am. Chem. Soc. 2013, 135, 16284–16287. [Google Scholar] [CrossRef] [PubMed]
  45. Ducreux, O.; Rebours, B.; Lynch, J.; Roy-Auberger, M.; Bazin, D. Microstructure of supported cobalt Fischer-Tropsch catalysts. Oil Gas Sci. Technol. Rev. IFP 2009, 64, 49–62. [Google Scholar] [CrossRef]
  46. Farias, F.E.M.; Sales, F.G.; Fernandes, F.A.N. Effect of operating conditions and potassium content on Fischer-Tropsch liquid products produced by potassium-promoted iron catalysts. J. Nat. Gas Chem. 2008, 17, 175–178. [Google Scholar] [CrossRef]
  47. Schulz, H. Short history and present trends of Fischer-Tropsch synthesis. Appl. Catal. A 1999, 186, 3–12. [Google Scholar] [CrossRef]
  48. Huyser, J.; van Vuuren, M.J.; Kupi, G. Advances in Fischer-Tropsch synthesis, catalysts, and catalysis. In The Value of a Two Alpha Model in the Elucidation of a Full Product Spetrum for Fe-LTFT; Davis, B.H., Occelli, M.L., Eds.; CRC Press: Boca Raton, FL, USA, 2010; pp. 185–197. [Google Scholar]
  49. Tavakoli, A.; Sohrabi, M.; Kargari, A. Application of Anderson-Schulz-Flory (ASF) equation in the product distribution of slurry phase FT synthesis with nanosized iron catalysts. Chem. Eng. J. 2008, 136, 358–363. [Google Scholar] [CrossRef]
  50. Dictor, R.A.; Bell, A.T. An explanation for deviations of Fischer-Tropsch products from a Schulz-Flory distribution. Ind. Eng. Chem. Proc. Des. Dev. 1983, 22, 678–681. [Google Scholar] [CrossRef]
  51. Iglesia, E.; Reyes, S.C.; Madon, R.J.; Soled, S.L. Selectivity control and catalyst design in the Fischer-Tropsch synthesis: Sites, pellets, and reactors. Adv. Catal. 1993, 39, 221–302. [Google Scholar]
  52. Aluha, J.; Abatzoglou, N. Synthetic fuels from 3-φ Fischer-Tropsch synthesis using syngas feed and novel nanometric catalysts synthesised by plasma. Biomass Bioenergy 2016, 95, 330–339. [Google Scholar] [CrossRef]
  53. Dry, M.E. Catalytic aspects of industrial Fischer-Tropsch synthesis. J. Mol. Catal. 1982, 17, 133–144. [Google Scholar] [CrossRef]
Figure 1. Porosity analysis of the fresh Co/C catalyst showing (a) overlaid adsorption-desorption isotherms; (b) cartoons with various impressions of isotherm interpretations; and (c) the BET transform plot.
Catalysts 07 00069 g001
Figure 2. Transmission Electron Microscopic (TEM) images for the fresh and used plasma-synthesized Co/C samples.
Catalysts 07 00069 g002
Figure 3. Normal metal particle-size distribution of the fresh Co/C catalyst by TEM analysis.
Catalysts 07 00069 g003
Figure 4. X-ray diffraction (XRD) patterns for the (a) Co metal; (b) freshly plasma-synthesized Co/C catalyst and (c) used sample.
Catalysts 07 00069 g004
Figure 5. XANES spectra (a) normalized and (b) first derivative of the fresh and used Co/C samples compared with the Co0 and CoO standards.
Catalysts 07 00069 g005
Figure 6. Plots showing the positive influence of H2 on FTS reaction with TOS using the Co/C catalyst tested at 220 °C, 2 MPa and GHSV of 3600 cm3∙g−1∙h−1.
Catalysts 07 00069 g006
Figure 7. Catalyst selectivity from liquid-sample analysis at various TOS for reaction performed at 220 °C, 2 MPa and GHSV of 3600 cm3∙g−1∙h−1 with H2:CO ratio = 2.
Catalysts 07 00069 g007
Figure 8. Effect of gas composition on the product spectrum of Fischer-Tropsch synthesis (FTS) after 24 h on stream at 220 °C, 2 MPa and gas hourly space velocity (GHSV) of 3600 cm3∙g−1∙h−1.
Catalysts 07 00069 g008
Figure 9. Plots of log(Mn/n) versus n comparing predicted (literature data value) and the measured α-values of Co/C catalyst after 1–2 h on stream, tested at 220 °C, 2 MPa and GHSV = 1800 cm3∙h−1∙g−1.
Catalysts 07 00069 g009
Figure 10. Plots displaying fast convergence and higher α-values for CO-rich feed gases with H2:CO ratio of (a) = 1.0, (b) 1.5, (c) 2.0, and (d) their comparison after 24 h on stream at 220 °C, 2 MPa and GHSV of 3600 cm3∙g−1∙h−1.
Catalysts 07 00069 g010
Figure 11. Impact of gas composition on FTS product fractions after 24 h on stream with catalyst samples tested at 220 °C, 2 MPa and GHSV of 3600 cm3∙g−1∙h−1.
Catalysts 07 00069 g011
Figure 12. Design of our 3-φ-CSTSR incorporating both liquid and gas sampling lines.
Catalysts 07 00069 g012
Table 1. Some Co catalysts that have been tested in typical FTS reaction conditions.
CatalystCatalystFTS ReactionReference
Synthesis Method *Support #Metal Particle Size (nm) θReactorGHSV (cm3∙g−1∙h−1)H2:COPressure (MPa)Temp (°C)% CO Conversion $
Co/Al2O3IWIAl2O311–28Fixed-bed6100–95002.1221050[31]
Co/CIWICNTs9–24Fixed-bed20002227090[32]
Co/CIWICNTs4–20Fixed-bed36002222050[33]
Co/CDBD-plasmaCNTs5–26Fixed-bed18002223095[34]
Co/CIWI, DP, IACNFBs2.6–27Plug-flow-23.5210–25060–80[35]
Co/CInduction SPSCarbon9–11CSTR36002222042[7]
Co/SiCIMSiC15–35Fixed-bed60002222025[36]
25092
Co/SiO2-SiO2-Fixed-bed60001.91.5–2.523042[37,38]
Co/SiO2IWI, GD-plasmaSiO25.8–10.2Fixed-bed180020.122022[39]
Co/TiO2DP, IWITiO22–13Fixed-bed3450–58502222035[40]
FTS = Fischer-Tropsch synthesis; GHSV = gas hourly space velocity; CSTR = continuously-stirred tank reactor* CP = Co-precipitation; DP = Deposition-precipitation; IA = Ion adsorption; IM = Impregnation method; IWI = Incipient wetness impregnation; DBD = dielectric-barrier discharge plasma (treatment); GD = Glow discharge (treatment); SPS = suspension-plasma spray (synthesis); θ Mean metal particle size varies in the data depending on analytical technique applied (e.g., Transmission Electron Microscopic (TEM) imaging, X-ray Diffraction (XRD), Chemisorption); $ The highest CO conversion achieved is reported here; # CNT = Carbon nanotubes; CNFBs = Carbon nanofibres.
Table 2. Catalyst porosity analysis results by the BET method.
PropertyAuxiliary Plasma Reactor *Main Plasma Reactor *
BET surface area (m2∙g−1)55.554.4
Average pore diameter (nm) $27.428.3
Total pore volume (cm3∙g−1) #0.380.39
BET = Brunauer-Emmett-Teller specific surface area analysis. * The plasma reactor design in catalyst synthesis comprises the auxiliary and main reactors, see Section 4.3.1. $ Single point adsorption total pore volume of pores less than 120 nm in diameter at P/Po = 0.98. # Average pore diameter (4V/A by BET).
Table 3. Product fractions with various feed gas compositions at 24 h of FTS reaction tested at 220 °C, 2 MPa and GHSV of 3600 cm3∙g−1∙h−1.
Feed Gas (H2:CO Ratio)Product Fraction (%)α-Value
CO2CH4C2C5–C12C13–C20C21+H2O (cm3)
1.00.81.80.116.446.431.1210.93
1.51.04.00.321.645.628.5330.93
2.00.23.60.329.845.120.6520.85
Table 4. Summary details of the properties of the plasma synthesized Co/C catalyst.
MeasurementMethodCatalyst PropertyValues
Metal loading in carbon supportCarbon ignition, SEMCo atomic-mass (g/g)0.25
Catalyst compositionXRD, XANESPhases presentCo0, Co3C
Dominant structureFCC
PorosityN2 physisorption by BETBET surface area (m2∙g−1)56
Mean pore diameter (nm)28
Total pore volume (cm3∙g−1)0.39
Metal nanoparticlesMicroscopy, TEMMean particle size (nm)11
Alpha-valuesASF product distributionH2:CO ratio 1.00.93
H2:CO ratio 1.50.93
H2:CO ratio 2.00.85
Catalyst activityGC analysisCO conversion (220 °C, 2 MPa) H2:CO ratio 1.010%
H2:CO ratio 1.520%
H2:CO ratio 2.040%
SelectivityLiquid-GC analysis FTS at 220 °C, 2 MPa, H2:CO = 2.0Sample product distribution: CO20.2
CH43.6
C2–C40.3
C5–C12 (Gasoline)29.8
C13–C20 (Diesel)45.1
C21+ (Wax)20.6

