Article

Water–Gas Shift Reaction over Ni/CeO2 Catalysts

1
Boreskov Institute of Catalysis, Prospekt Akademika Lavrentieva, 5, 630090 Novosibirsk, Russia
2
Novosibirsk State University, Pirogova street, 2, 630090 Novosibirsk, Russia
*
Author to whom correspondence should be addressed.
Catalysts 2017, 7(10), 310; https://doi.org/10.3390/catal7100310
Submission received: 28 August 2017 / Revised: 2 October 2017 / Accepted: 7 October 2017 / Published: 20 October 2017
(This article belongs to the Special Issue Nanostructured Materials for Applications in Heterogeneous Catalysis)

Abstract

:
This paper reports the results of a study of a water–gas shift reaction over nickel–ceria catalysts with different metal loading. Within this study, the overall CO conversion and observed kinetic behavior were investigated over the temperature range of 250–550 °C in different reactor configurations (fixed-bed and microchannel reactors). The quasi-steady state kinetics of the CO water–gas shift reaction was studied for fractions of Ni-containing cerium oxide catalysts in fixed-bed experiments at lab-scale level using a very dilute gas (1% CO + 1.8% H2O in Не). A set of experiments with a microchannel reactor was performed using the feed composition (CO:H2O:H2:N2 = 1:2:2:2), representing a product gas from methane partial oxidation. The results were interpreted using computational models. The kinetic parameters were determined by regression analysis, while mechanistic aspects were considered only briefly. Simulation of the WGS reaction in the microreactor was also carried out by using the COMSOL Multiphysics program.

1. Introduction

Electricity and hydrogen are now considered as the dominant energy carriers in modern green chemical and process engineering. Syngas, being composed of hydrogen and carbon monoxide, is considered an alternative to conventional fuels in all its applications. It can be burned like natural gas, used as a source of hydrogen for fuel cells, or transformed into other hydrocarbon fuels. The composition of syngas varies depending on operational conditions and technologies used. The water–gas shift reaction (WGS) is the preferred chemical reaction applied in the syngas cleaning and conditioning stages to remove toxic CO and produce H2 along with CO2 prior to using a syngas product stream in different applications. The WGS reaction is reversible and moderately exothermic:
CO + H2O = CO2 + H2   ∆rHo298 = −41.1 kJ/mol.
The reaction is quite sensitive to temperature and shifts to reactants as the temperature increases. Due to the reversibility of the WGS reaction, the rate of the forward reaction is strongly inhibited by reaction products. Maximum CO conversions and selectivities are typically governed by equilibrium independent of reaction pressure because there is no variation in the number of moles. However, the kinetic potential of catalysts greatly affects the actual reaction rate to the desired products. Depending on the feed stream characteristics and the catalyst that is used in conditioning, side reactions such as the methanation reaction can accompany the water gas shift reaction process:
CO + 3H2 = CH4 + H2O,   ∆rHo298 = −206.1 kJ/mol.
Meantime, generating CH4 that is of a high heating value and a low toxicity, could be even preferred than oxidation to CO2 [1,2].
Today, one of the most important criteria for the production of hydrogen-rich gas and syngas treatment systems is compact design. Thus, sub-millimeter channels offer the advantage of decoupling the hydrodynamics, reaction kinetics, and transport phenomena controlling the overall behavior of a catalytic reactor. Compared with traditional reactors, high heat and mass transfer give many more opportunities to improve the efficiency of heterogeneous catalysts and reach optimal process conditions [3,4]. For a catalytic process to be successfully used in a microchannel reactor, the reaction must exhibit intrinsically rapid kinetics that is detectable at millisecond residence times. Optimization and performance predictions of scale-up effects require first a knowledge of chemistry and reaction kinetics. Simulation studies are very helpful afterwards.
Generally, two different approaches have been used to develop a suitable kinetic model for the rate of catalytic reactions [5]. Microkinetics modeling explores the detailed chemistry of the reaction. Although the WGS reaction involves only four simple molecules, the reaction mechanism is quite complex and depends on the catalyst and feed composition [6,7,8]. A direct experimental investigation of a particular mechanism for WGS reaction is difficult or impossible under realistic operating conditions. Empirical models of macrokinetics for heterogeneous catalytic reactions dependent on factors such as the concentration of reactants and products and exponentially on temperature are used more often. Being based on experimental results, empirical models provide an easy and computationally lighter way to make predictions about reaction rates and the system behavior.
For oxide-supported catalysts, strong evidence exists that the metal oxide support is directly involved in the WGS reaction mechanism. Cerium oxide-based WGS catalysts have become increasingly attractive since such materials possess a high lattice oxygen capacity, mobility, and reducibility. The presence of Ce was shown to promote the thermal stability of materials and a decrease in the size of the Ni particle in catalytic systems like Ni/Al2O3 and Ni/ZrO2. Ceria-supported platinum catalysts are the most active in a water–gas shift reaction, but economically not feasible. Nickel–ceria catalysts are promising materials due to their relatively high activity in this reaction [9,10]. The activity and selectivity of supported nickel catalysts are known to be strongly dependent on the amount of metal employed, the size of the dispersed metal particles, the metal–support interaction, and the composition of the supports [11]. It was demonstrated that nickel catalysts showed good performance for the WGS, especially at high temperature (450 °C). The beneficial role of ceria for the nickel WGS catalyst has been reported elsewhere [12,13,14,15].
This paper reports results of a study of the water–gas shift reaction over nickel–ceria catalysts with different metal loading at temperatures in the range of 250–550 °C. Within this study, the overall CO conversion and the observed kinetic behavior were investigated in different reactor configurations (fixed-bed and microchannel reactors). The fixed-bed experiments at lab scale were carried out using a very dilute gas (1% CO + 1.8% H2O in Не). A set of experiments with a microchannel reactor were performed using feed stream composition (CO:H2O:H2:N2 = 1:2:2:2), representing the product gas character relative to the partial oxidation of methane. The results were interpreted using computational models. Kinetic parameters for the rate equations of Reactions (1) and (2) were determined by regression analysis, while mechanistic aspects are considered here only briefly. Simulation of the WGS reaction in the microreactor was also carried out using the COMSOL Multiphysics program.

2. Results

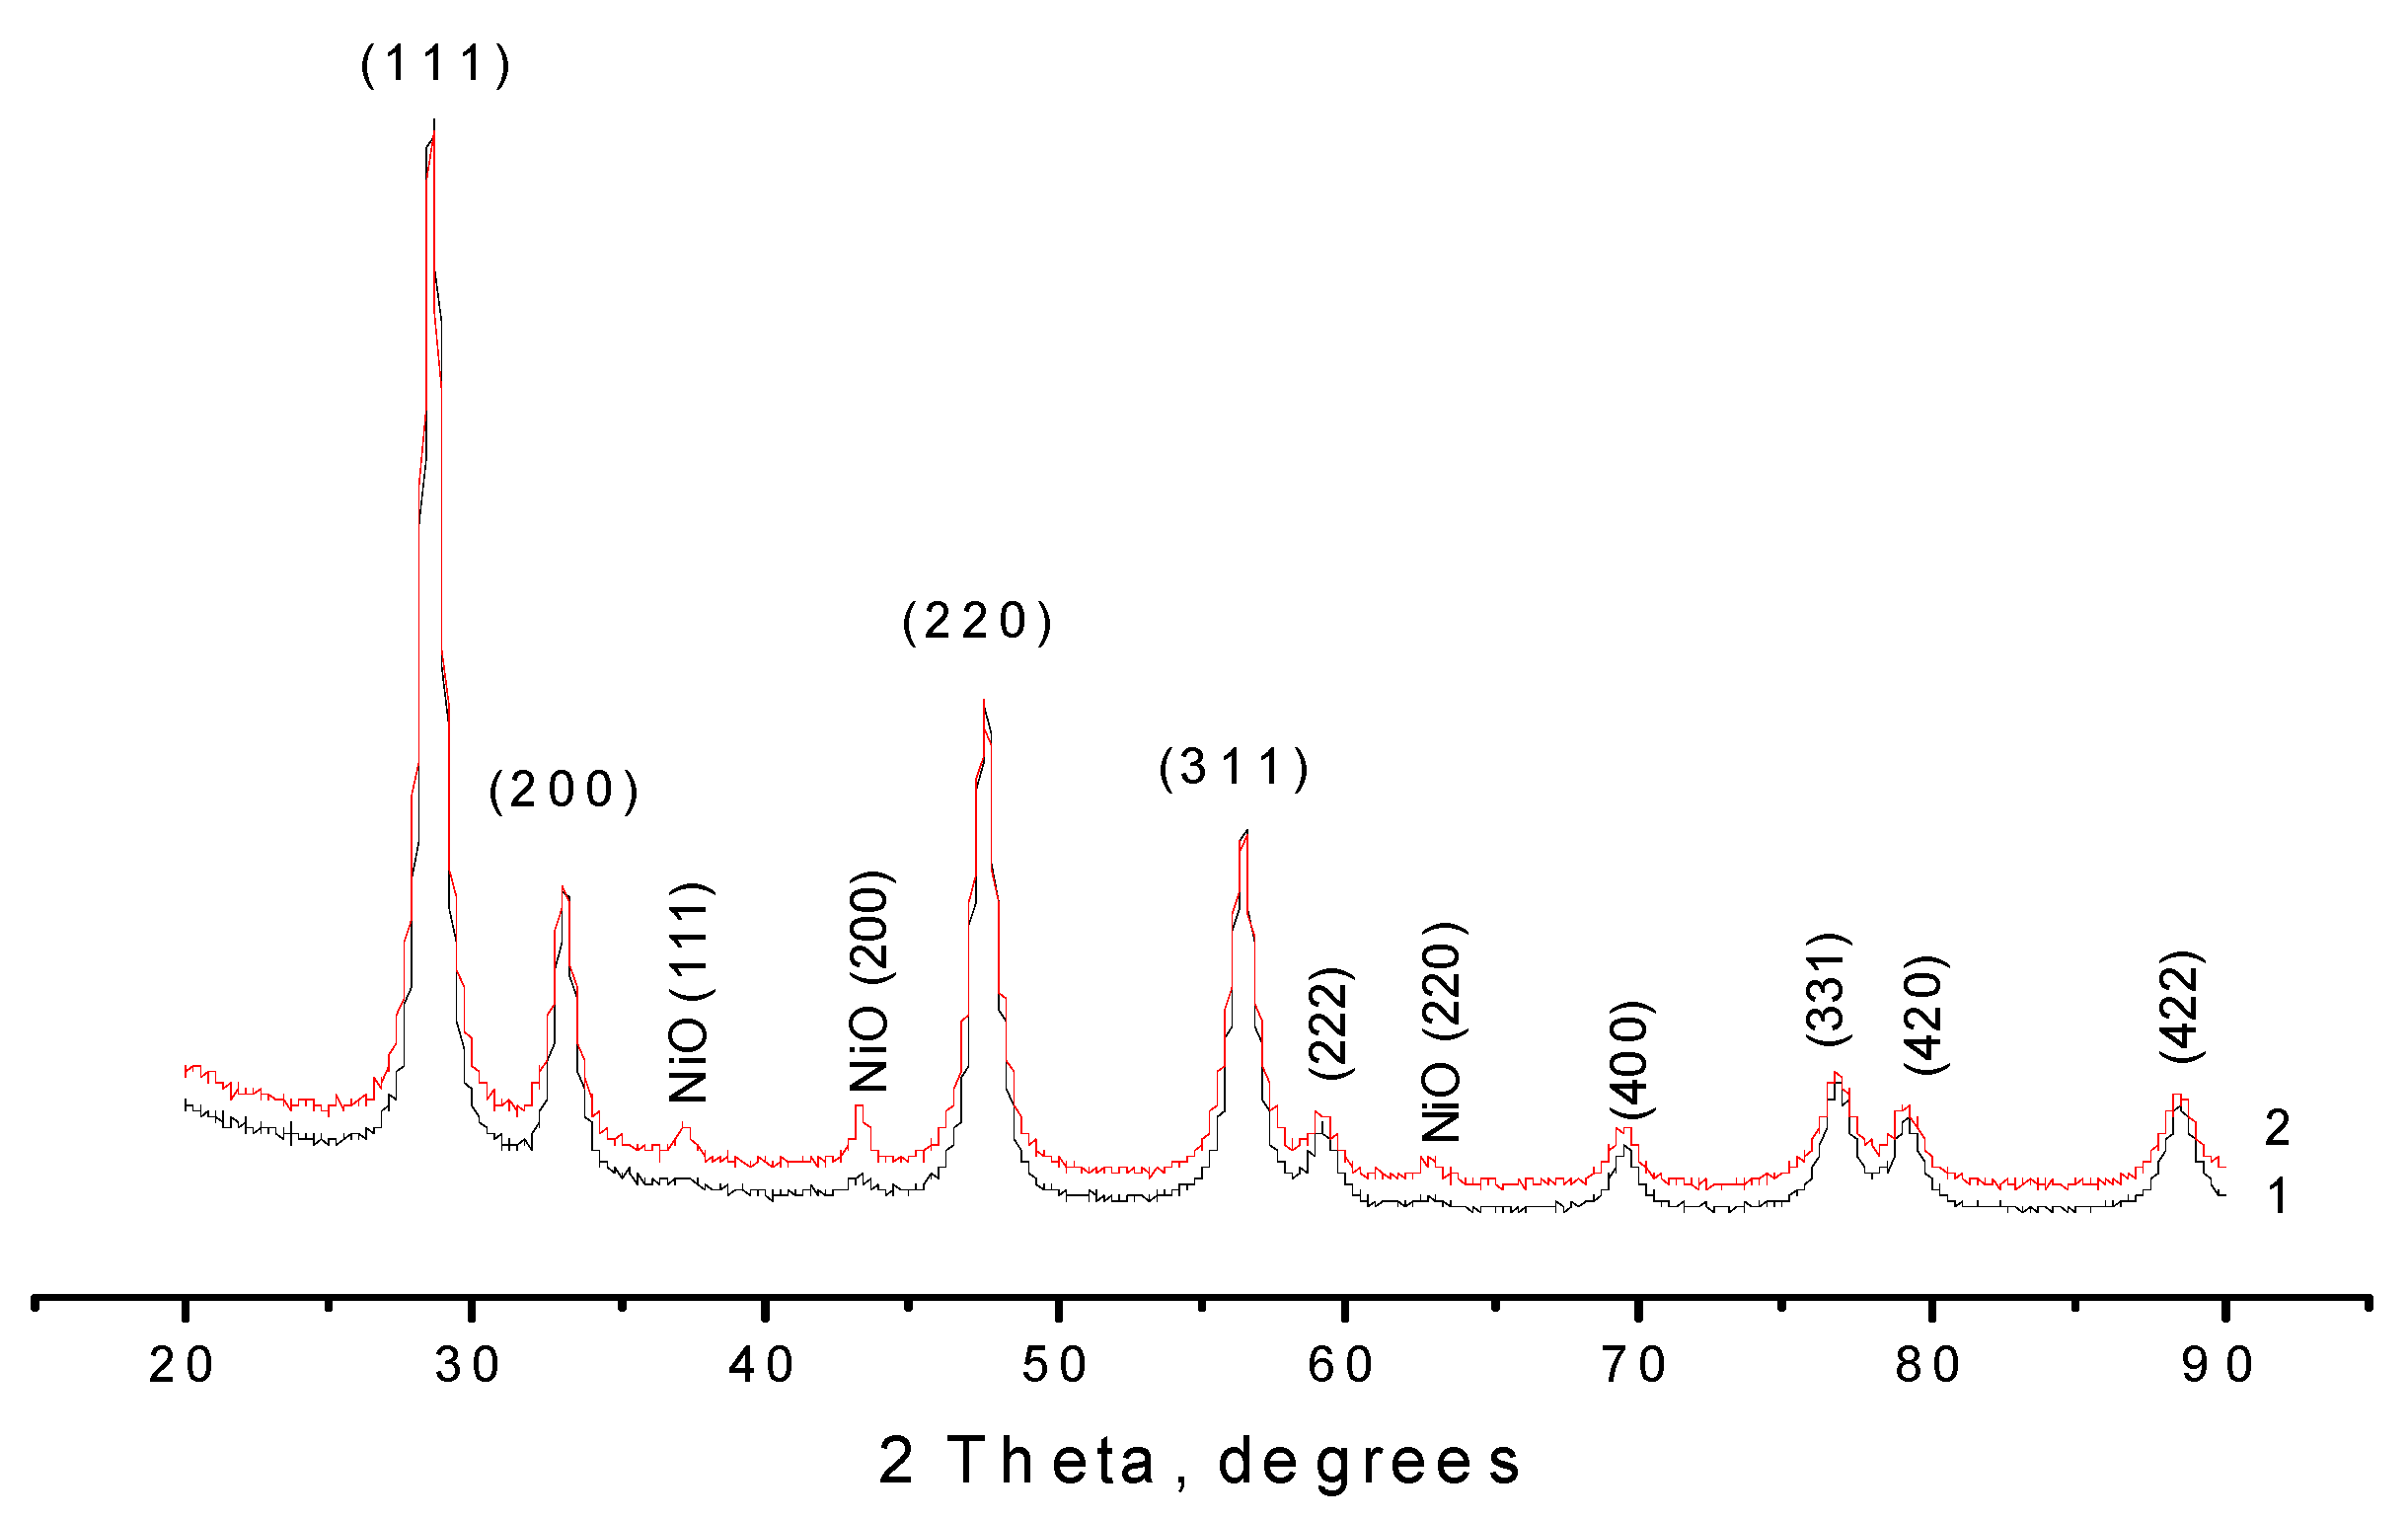
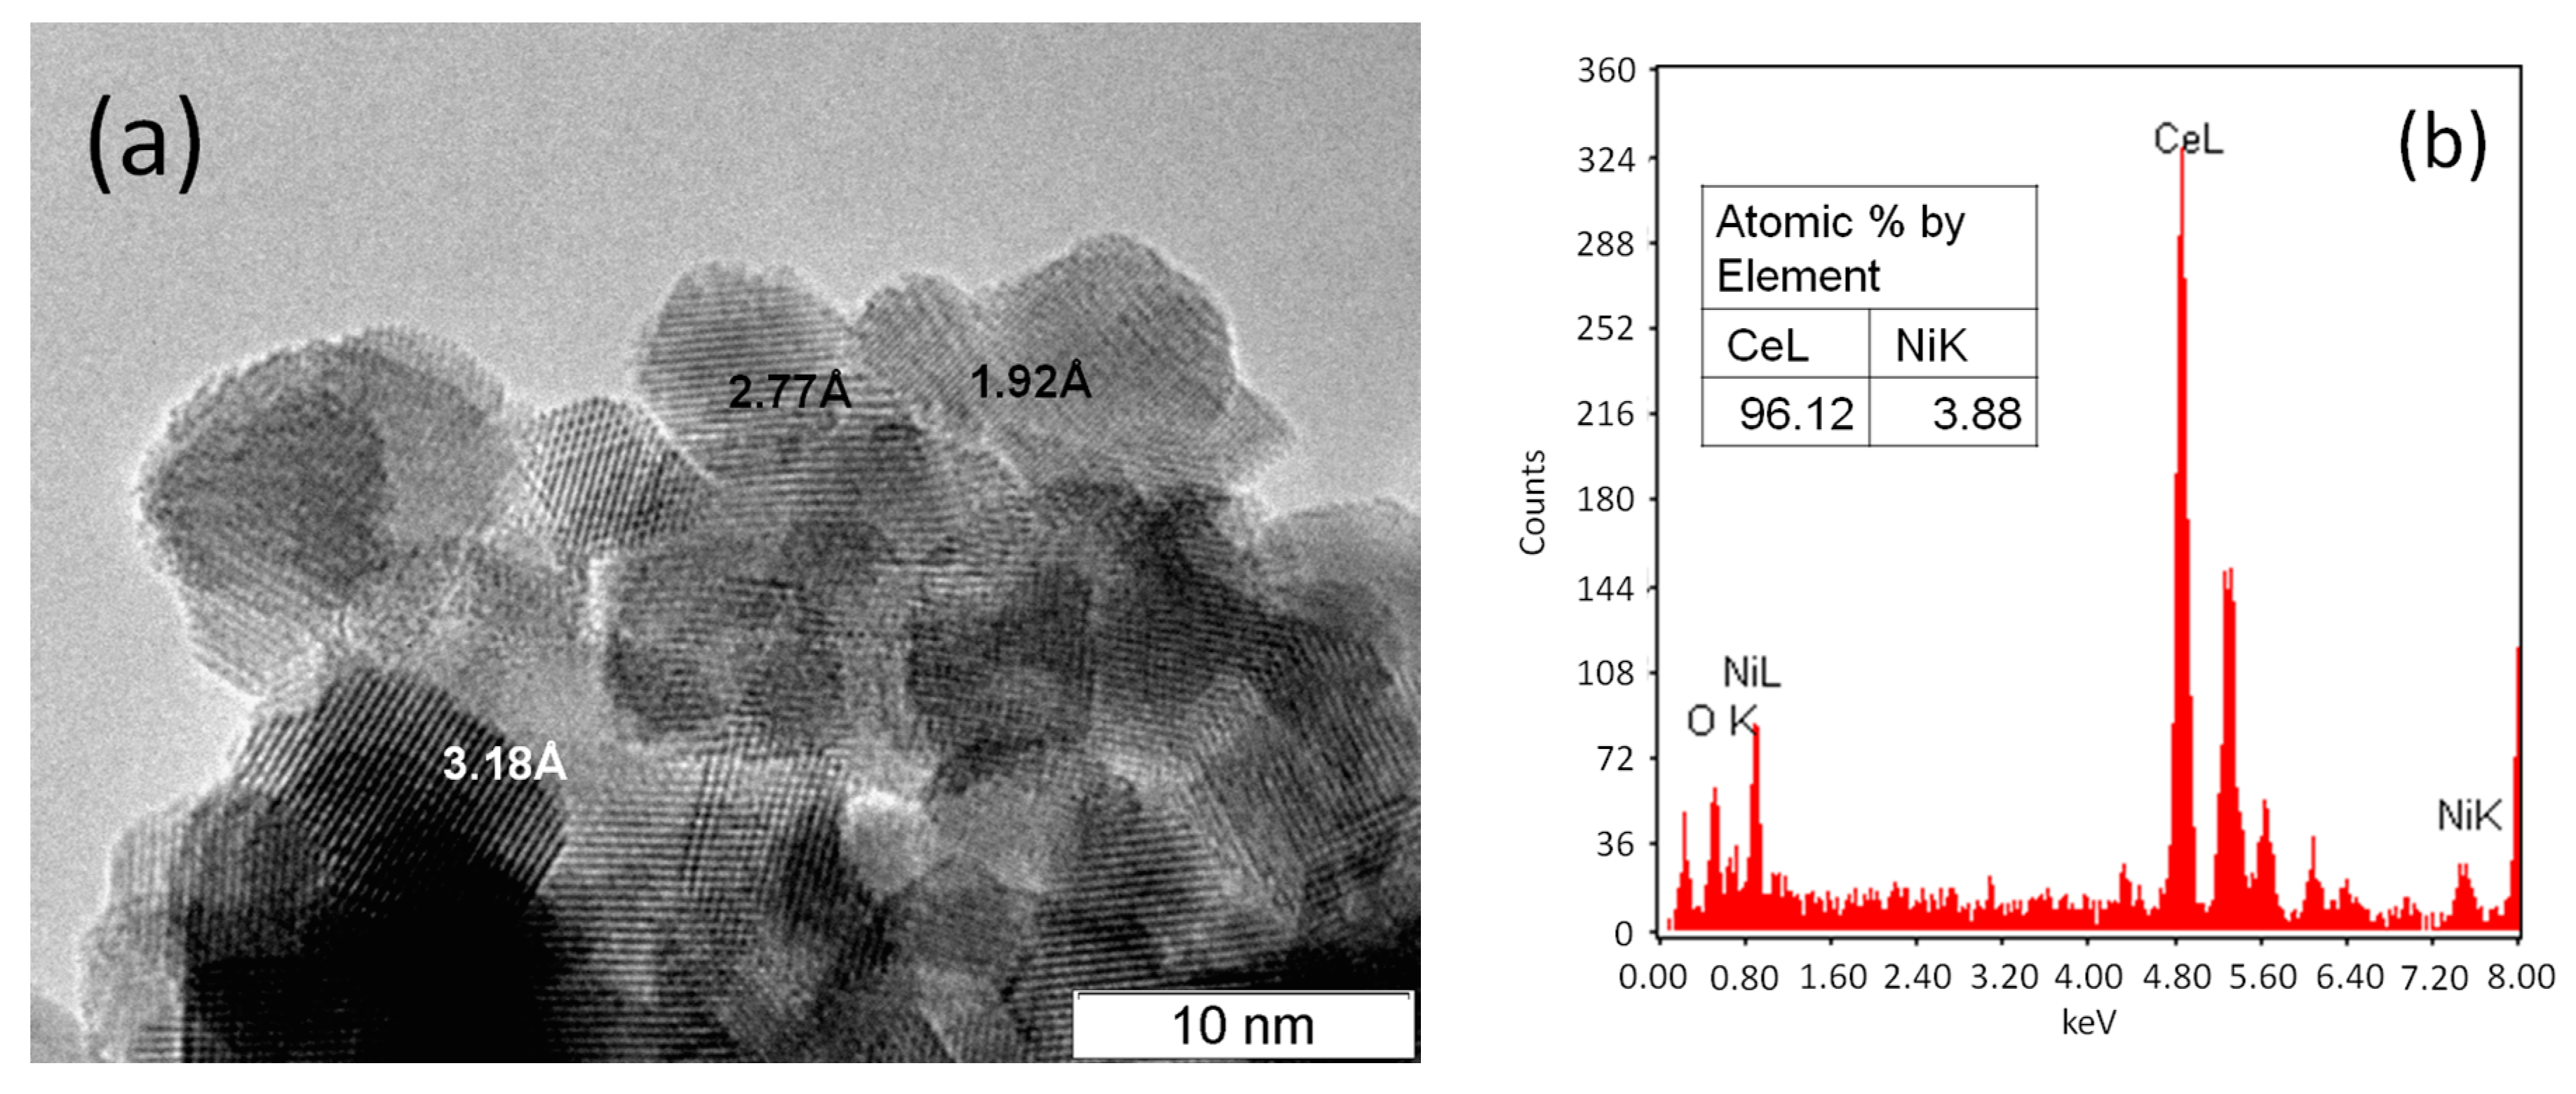
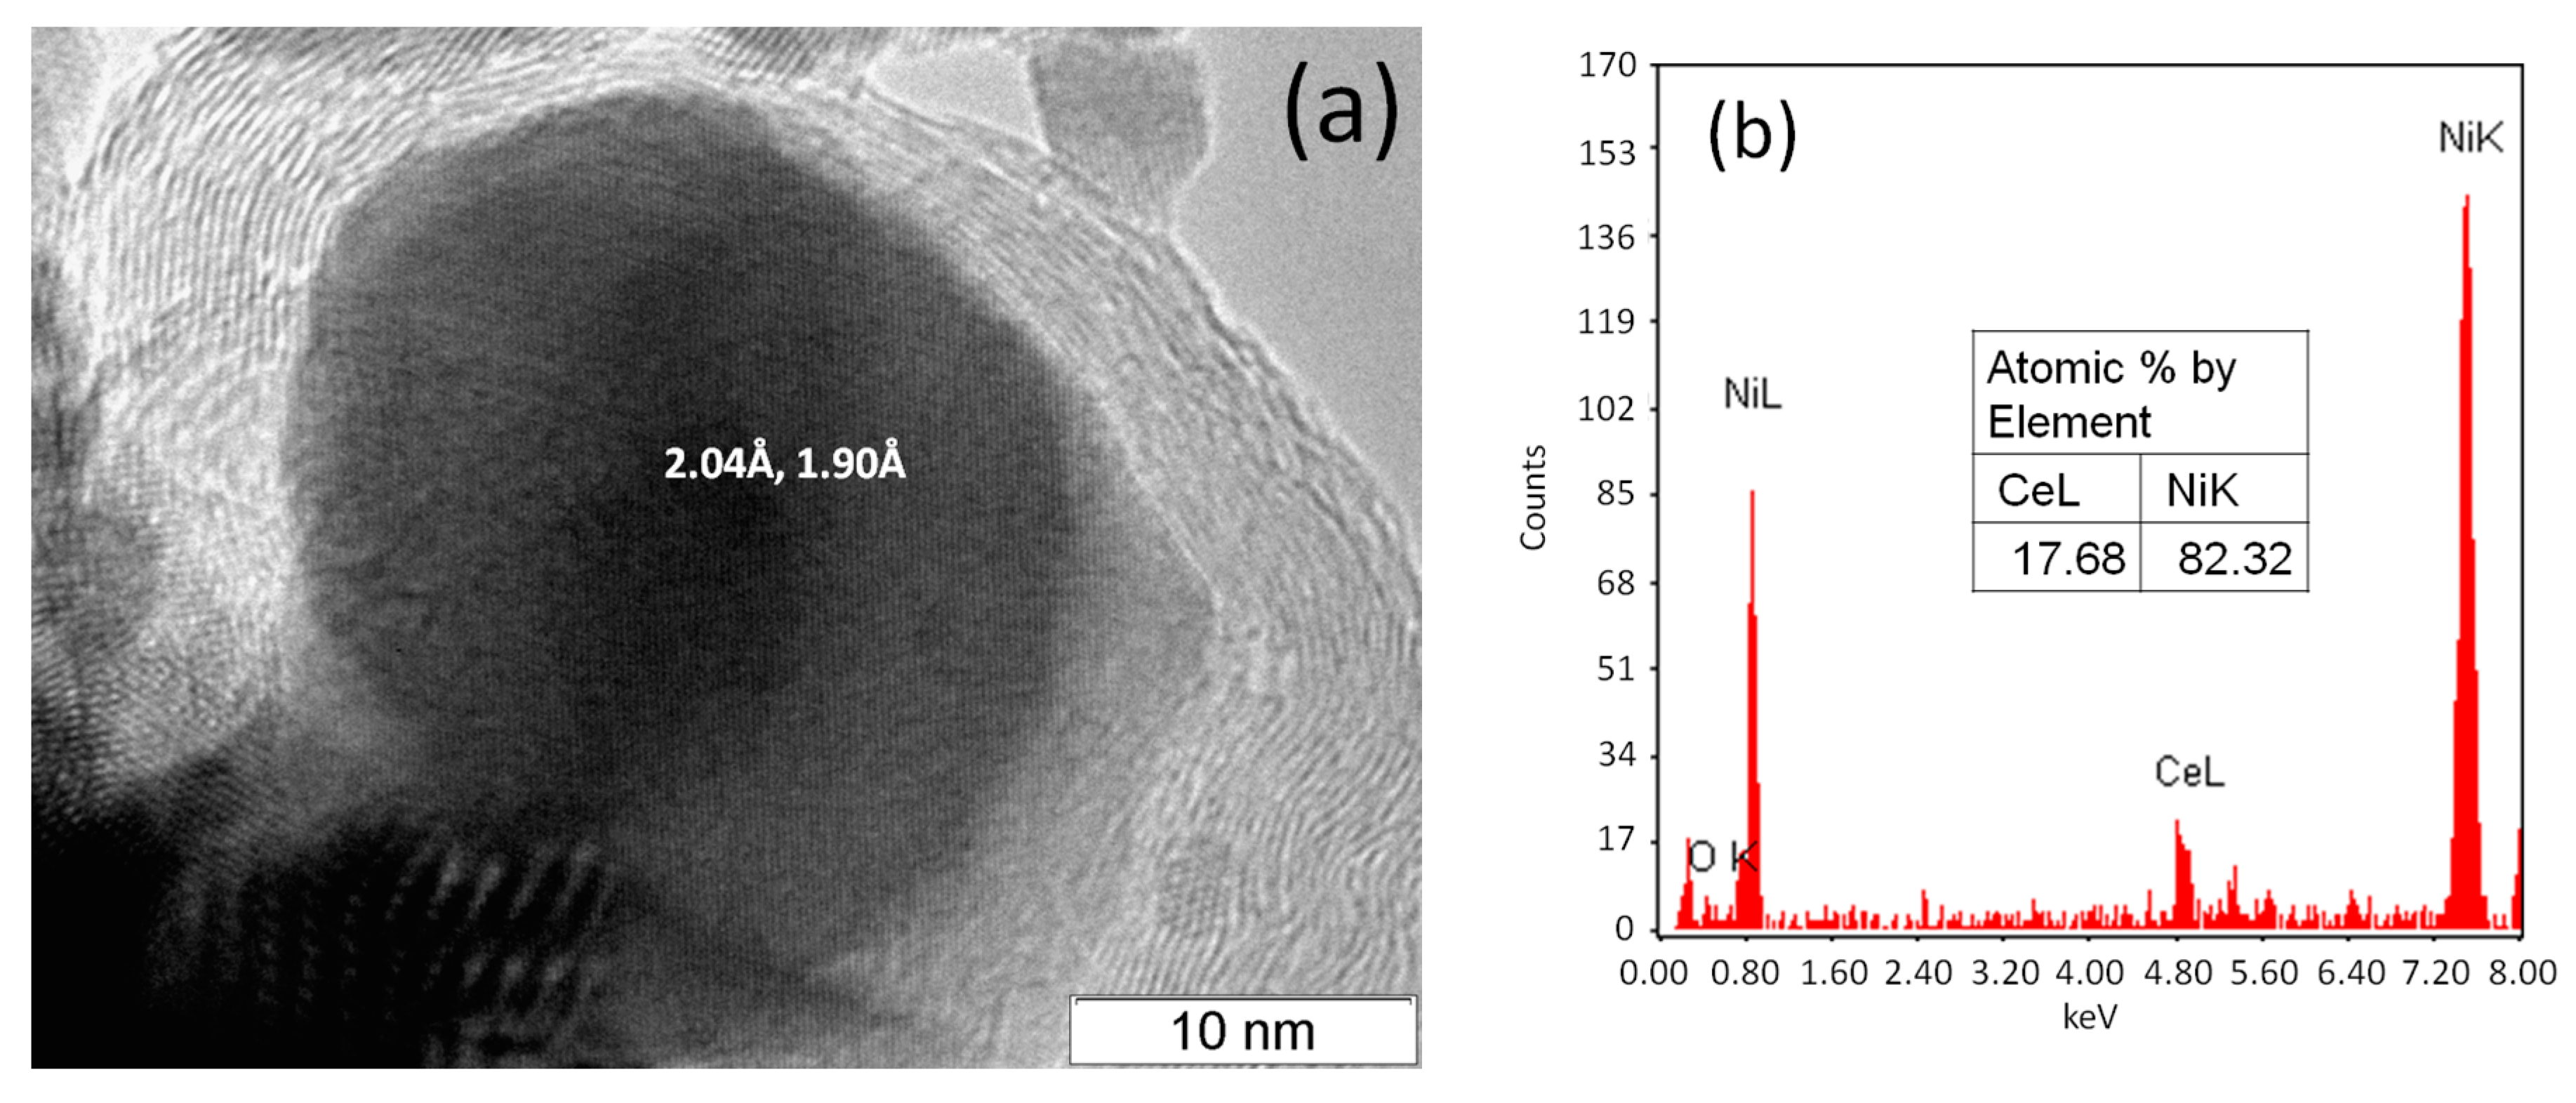
2.1. Ni/CeO2 Catalyst Characterization

Table 1 shows the surface area of the as-prepared nickel–ceria catalysts. The high surface area facilitates the catalytic reactions. Analyses of argon thermodesorption data show that the specific surface area of catalysts slightly decreases with increasing nickel loading.
The structural features of catalysts were estimated by X-ray diffraction. The X-ray diffraction patterns for the catalysts with nickel content of 5% and 10% are presented in Figure 1. Both samples are biphasic, comprised of cubic Fm-3m CeO2 and NiO phases. Based on the XRD data, nickel content was estimated to be 1.1 wt % and 8.7 wt % for the 5% Ni/CeO2 and 10% Ni/CeO2 samples, respectively. Hence, Ni species were highly dispersed and can in part be dissolved in the ceria matrix. Increasing Ni content in the catalyst increased the mean size of nickel particles, as shown in Table 2.
It was found earlier [16] that in as-prepared Ni/CeO2 catalysts, nickel oxide can be present as NiO particles strongly or weakly interacting with the surface of CeO2 and the Ni–Ce–O solid solution. Moreover, the states and distribution ratio of nickel species depend on the shape of CeO2 particles. Catalytic activity could be controlled by a combination of the Ni particles’ surface structure (mainly for those strongly interacting with the support) and Ni atoms in the Ni–Ce–O surface layer formed by reduction of Ni2+ cations in the reaction conditions. It is known that ceria affects the reducibility of metal oxides supported on it. Thus, NiO is reduced at 300–400 °C. In turn, the addition of nickel improves the reducibility of ceria due to the strong Ni–CeO2 interaction [9]. TEM images (Figure 2) demonstrate a microdomain type of CeO2 particles with a good domain crystallinity (lattice planes are resolved), and interplanar distances corresponding to cubic ceria phase. Nickel particles are not visible by TEM; however, Ni was detected by EDX analysis. A low content of Ni in the surface layer by EDX analysis implies its possible dissolution in CeO2 surface layers.
Compared to the as-prepared catalysts, deposited carbon species over nickel metallic particles species were observed by TEM in the case of the spent catalyst (Figure 3). In this case a low content of Ce estimated by EDX for the area observed in this figure including Ni particles and support implies their weak interaction. It is well known that Ni-based catalysts are prone to carbon deposition and Ni particles’ sintering, especially in the presence of water and at high temperature. As a result, the available surface area decreases, thus affecting catalytic activity. However, the carbon rapidly accumulated on the catalyst surface does not cause serious deactivation as the catalytic sites remain available for the adsorption of gaseous reactants.
Until now, very little has been known about Ni/CeO2 composite nanomaterials with respect to the importance of strong metal–support interactions and the influence of CeO2 morphology on the chemical state and catalytic performance of nickel species. More detailed work is required for a better understanding of the structure–performance relationship of a nickel catalyst supported on ceria and the correlation between the structure and catalytic activity. This will also permit a more rational approach to the design of novel catalysts.

2.2. Kinetic Behavior on the WGS Reaction in the Fixed-Bed Reactor Configuration

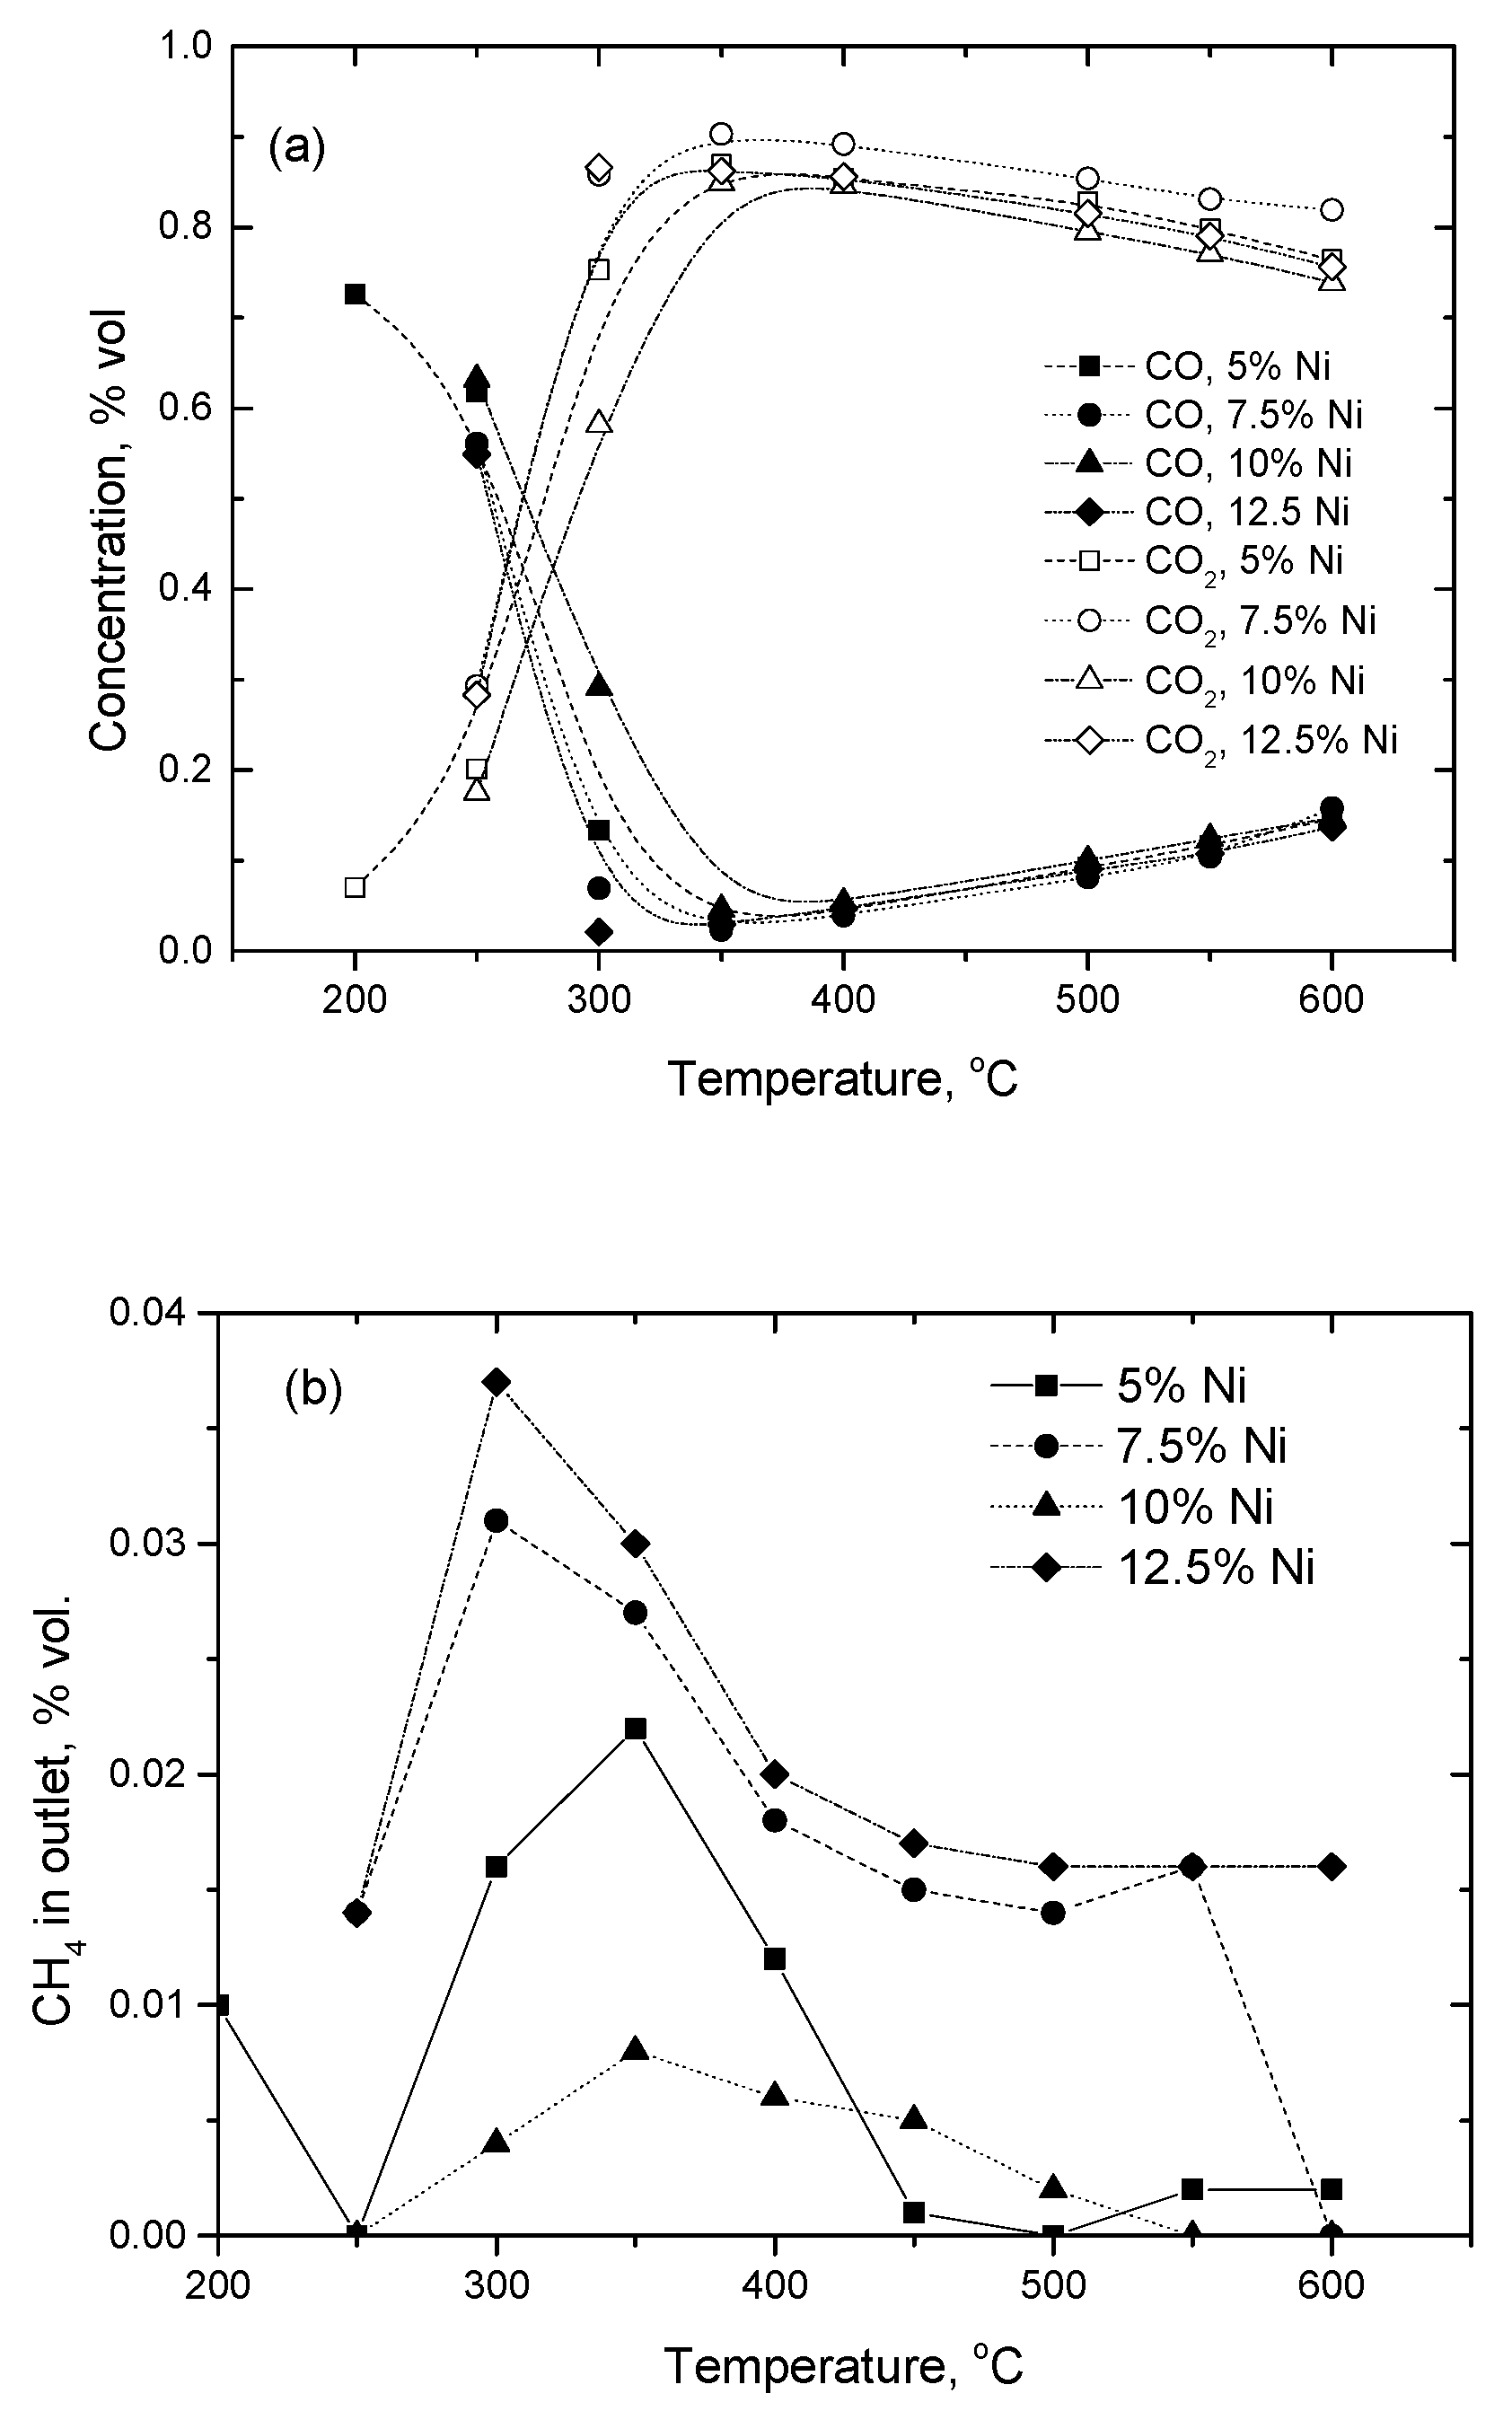
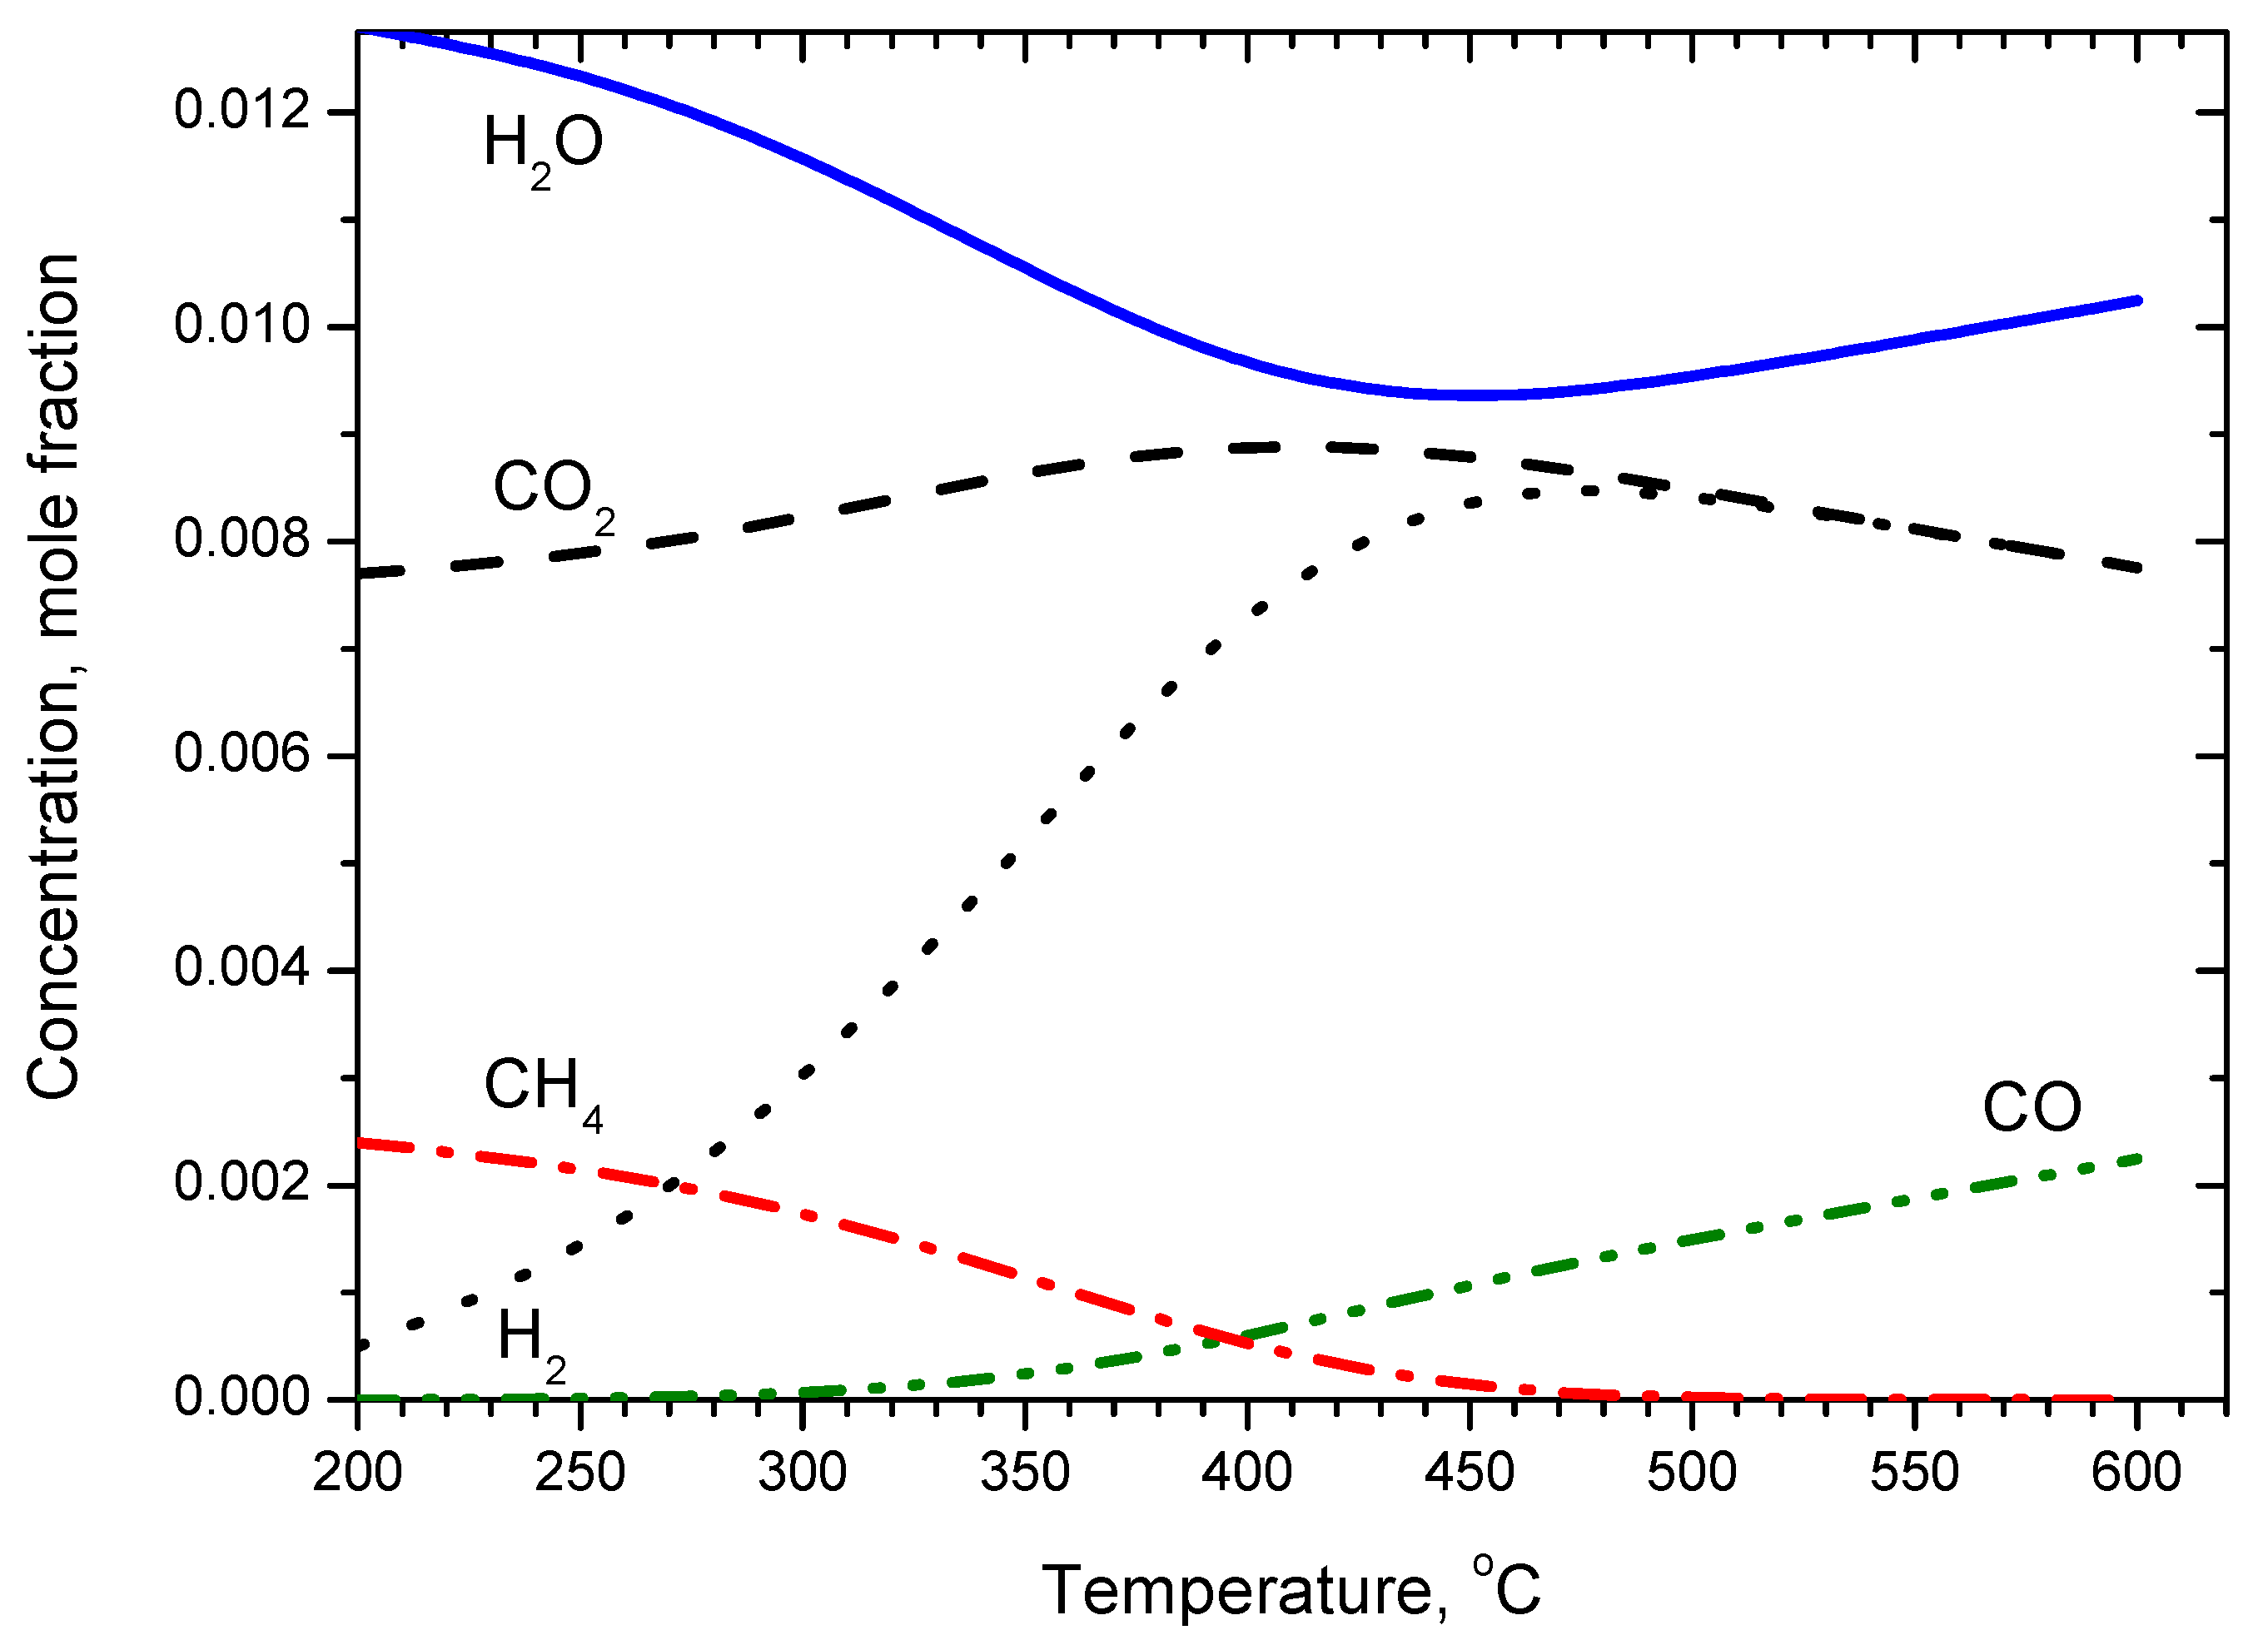
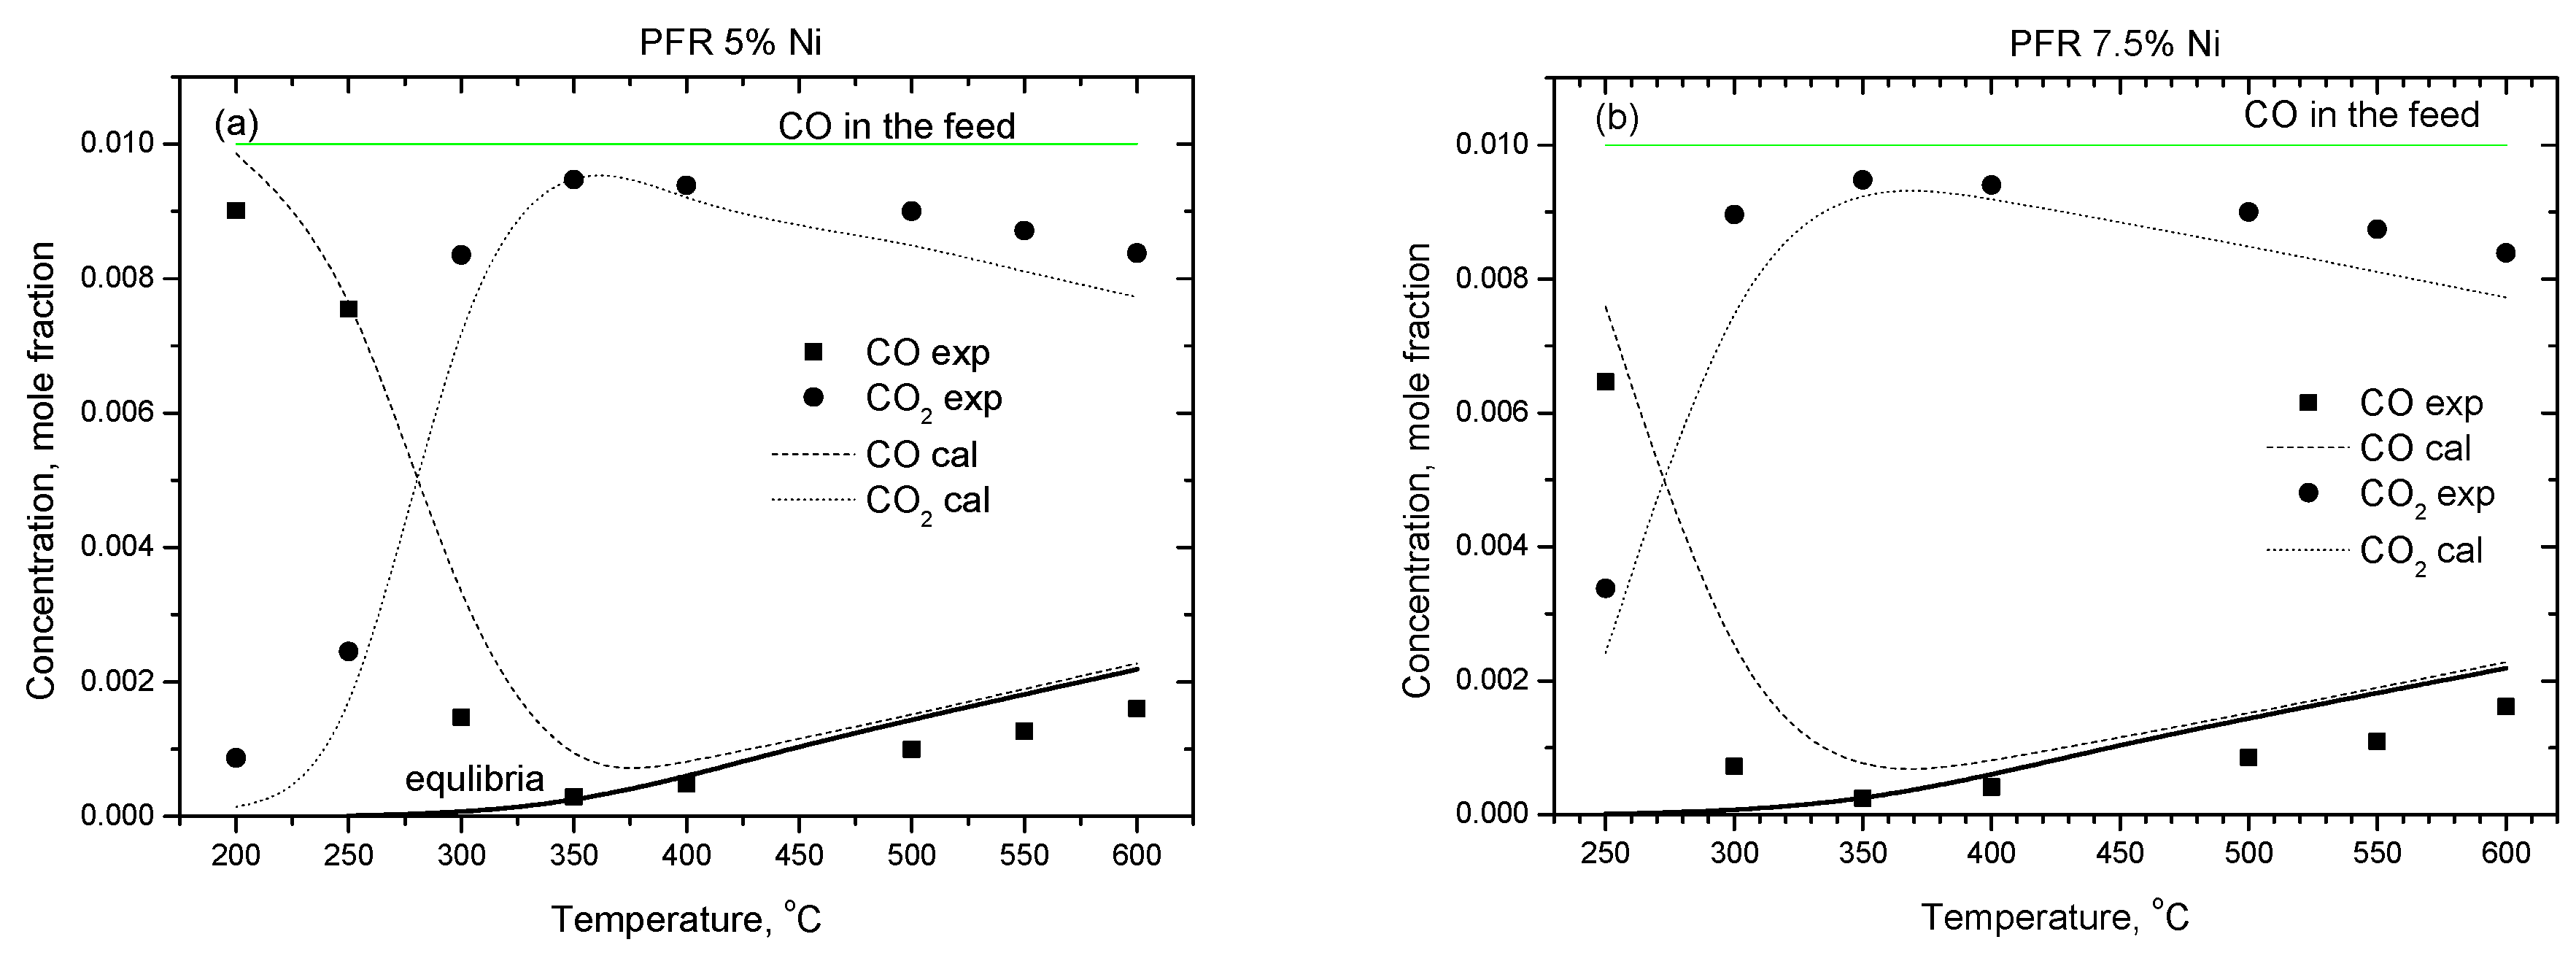
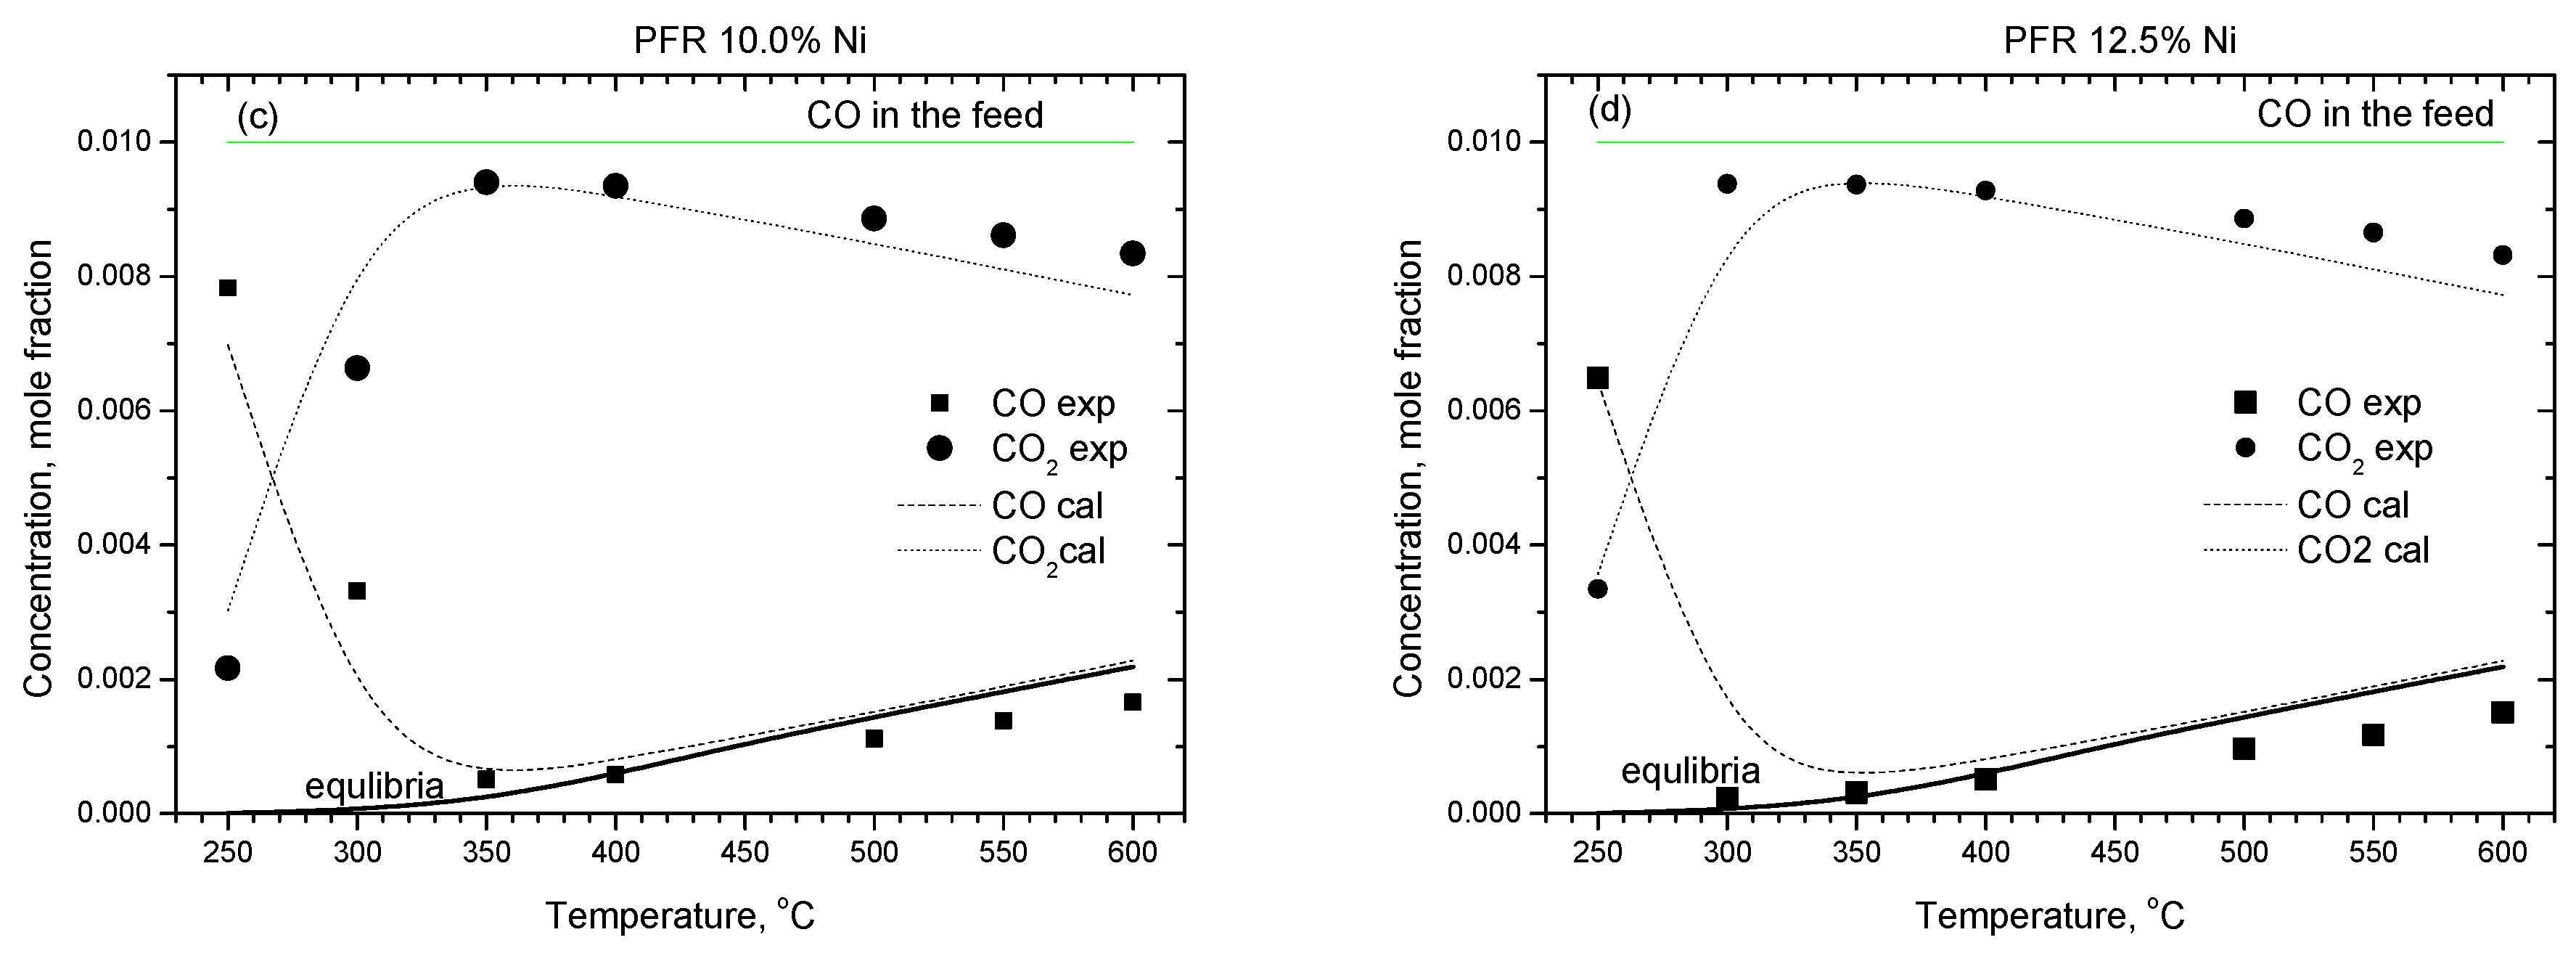
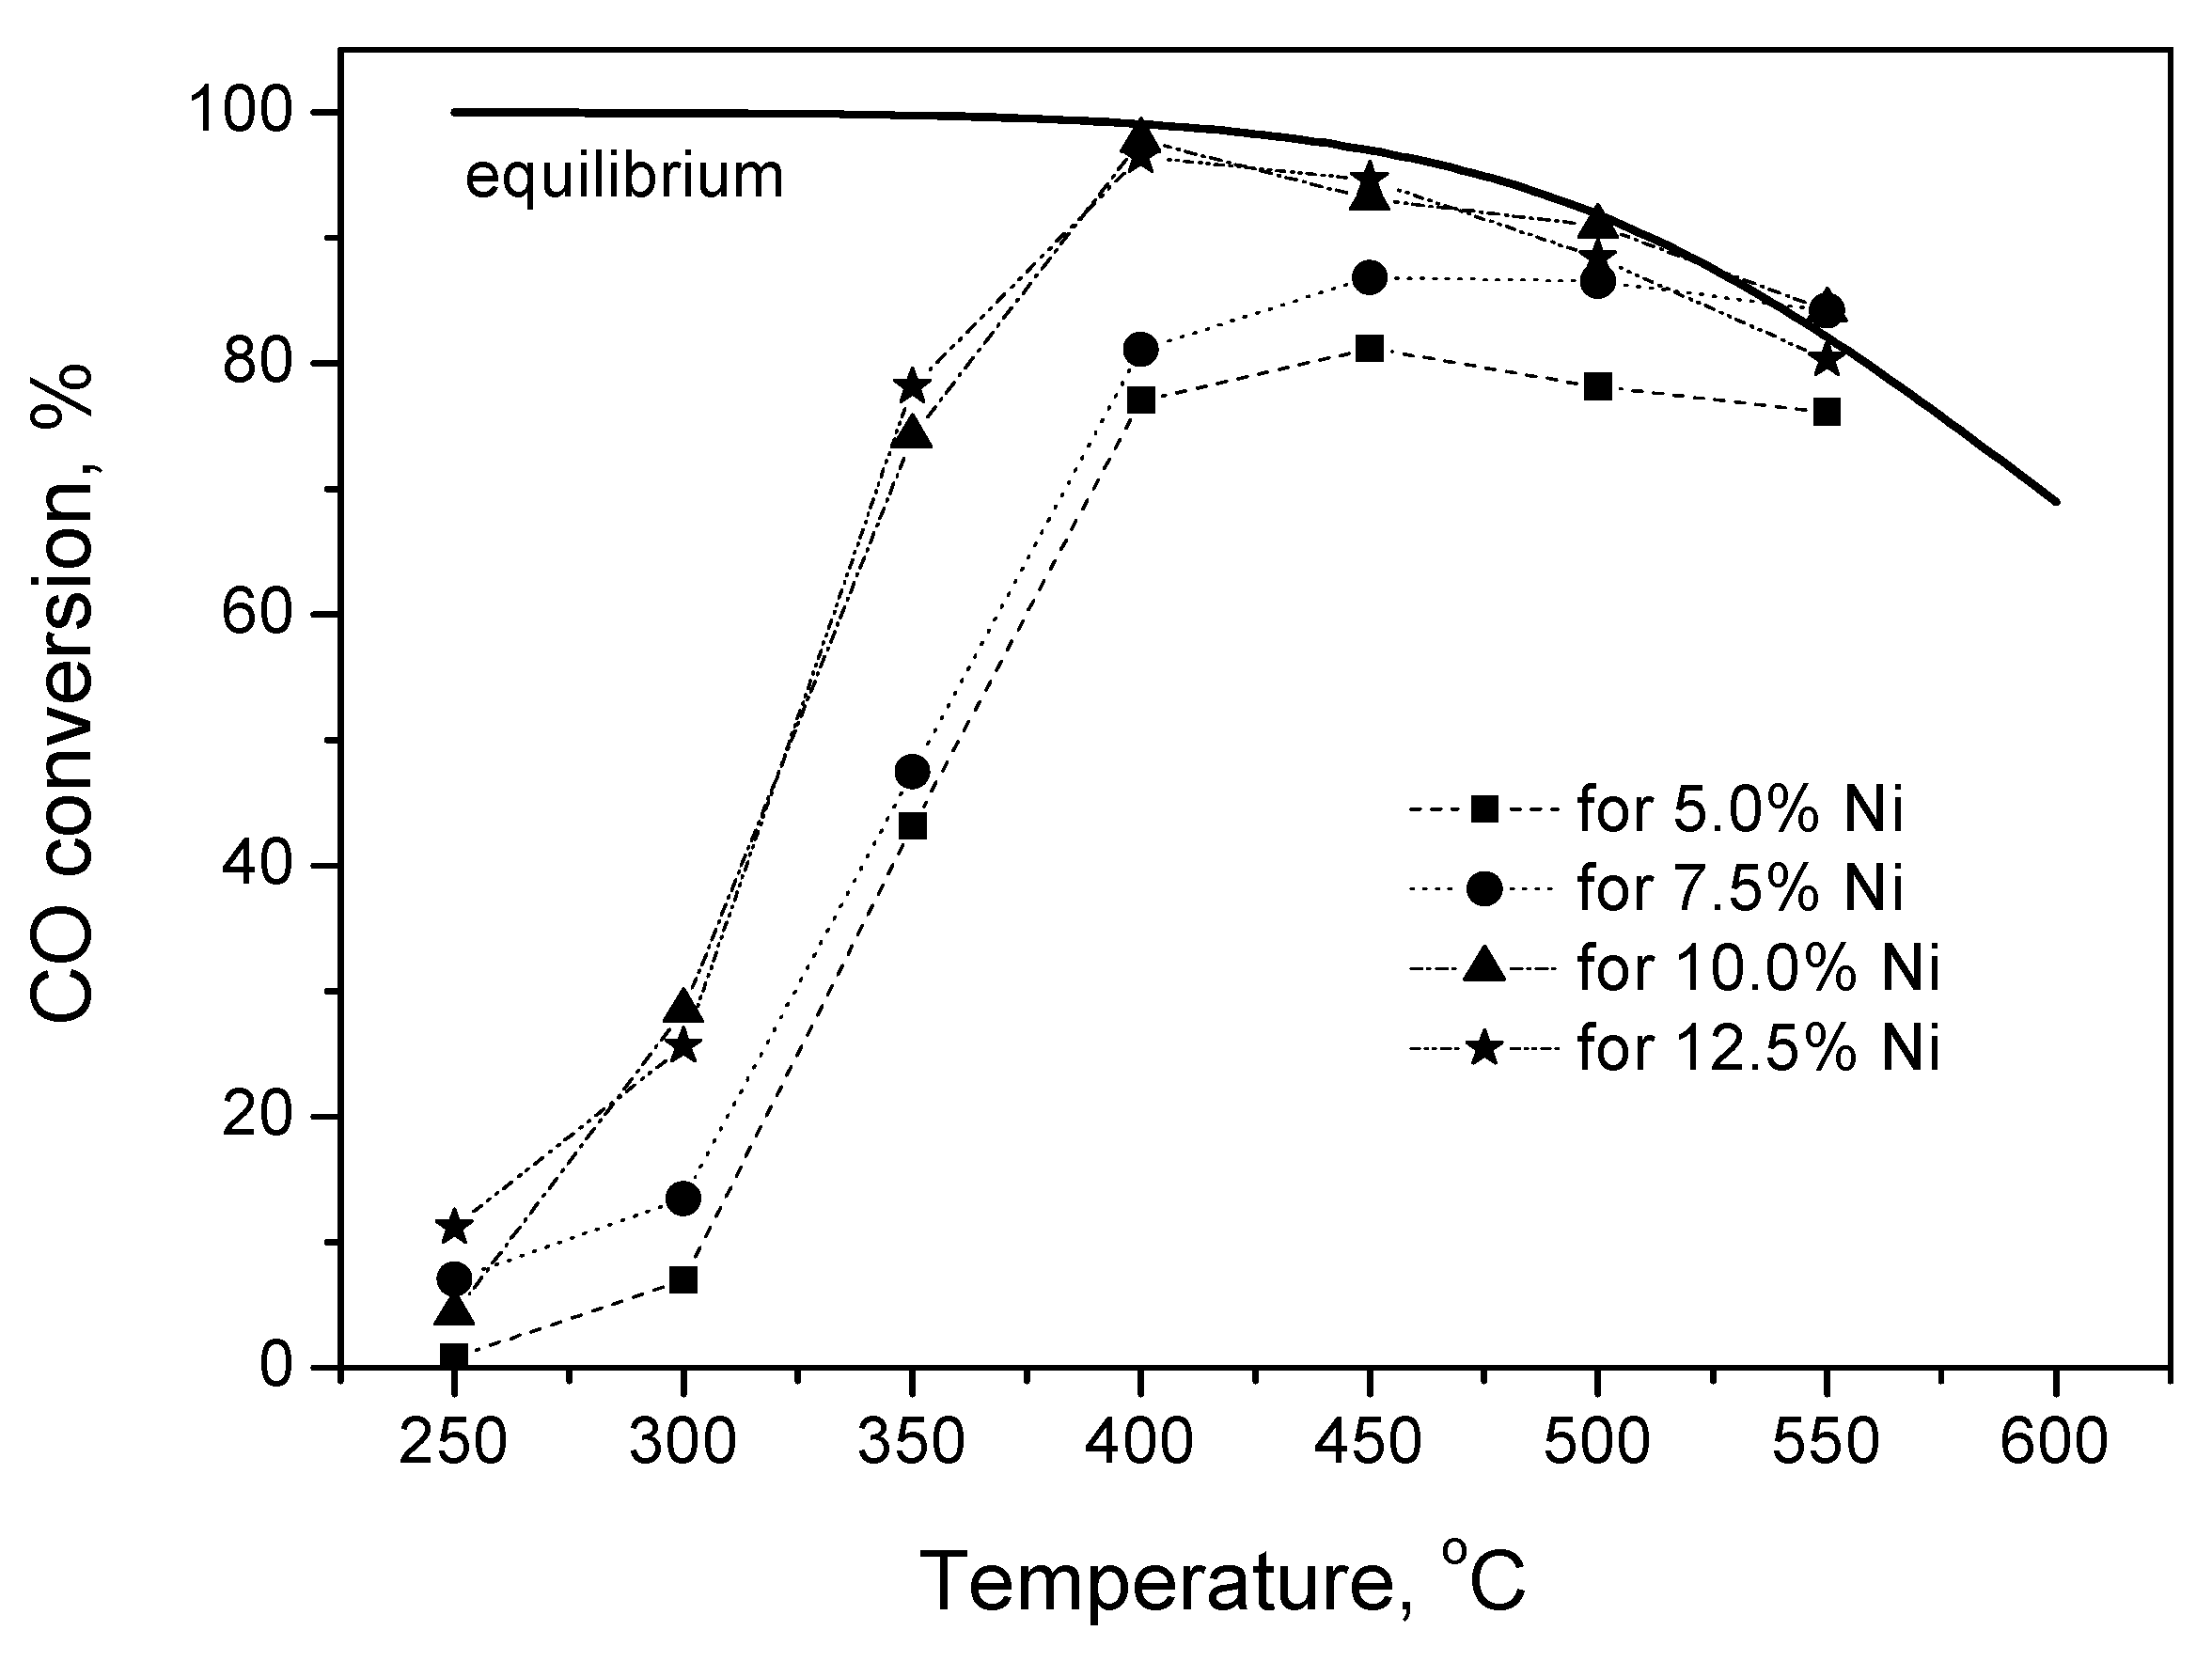
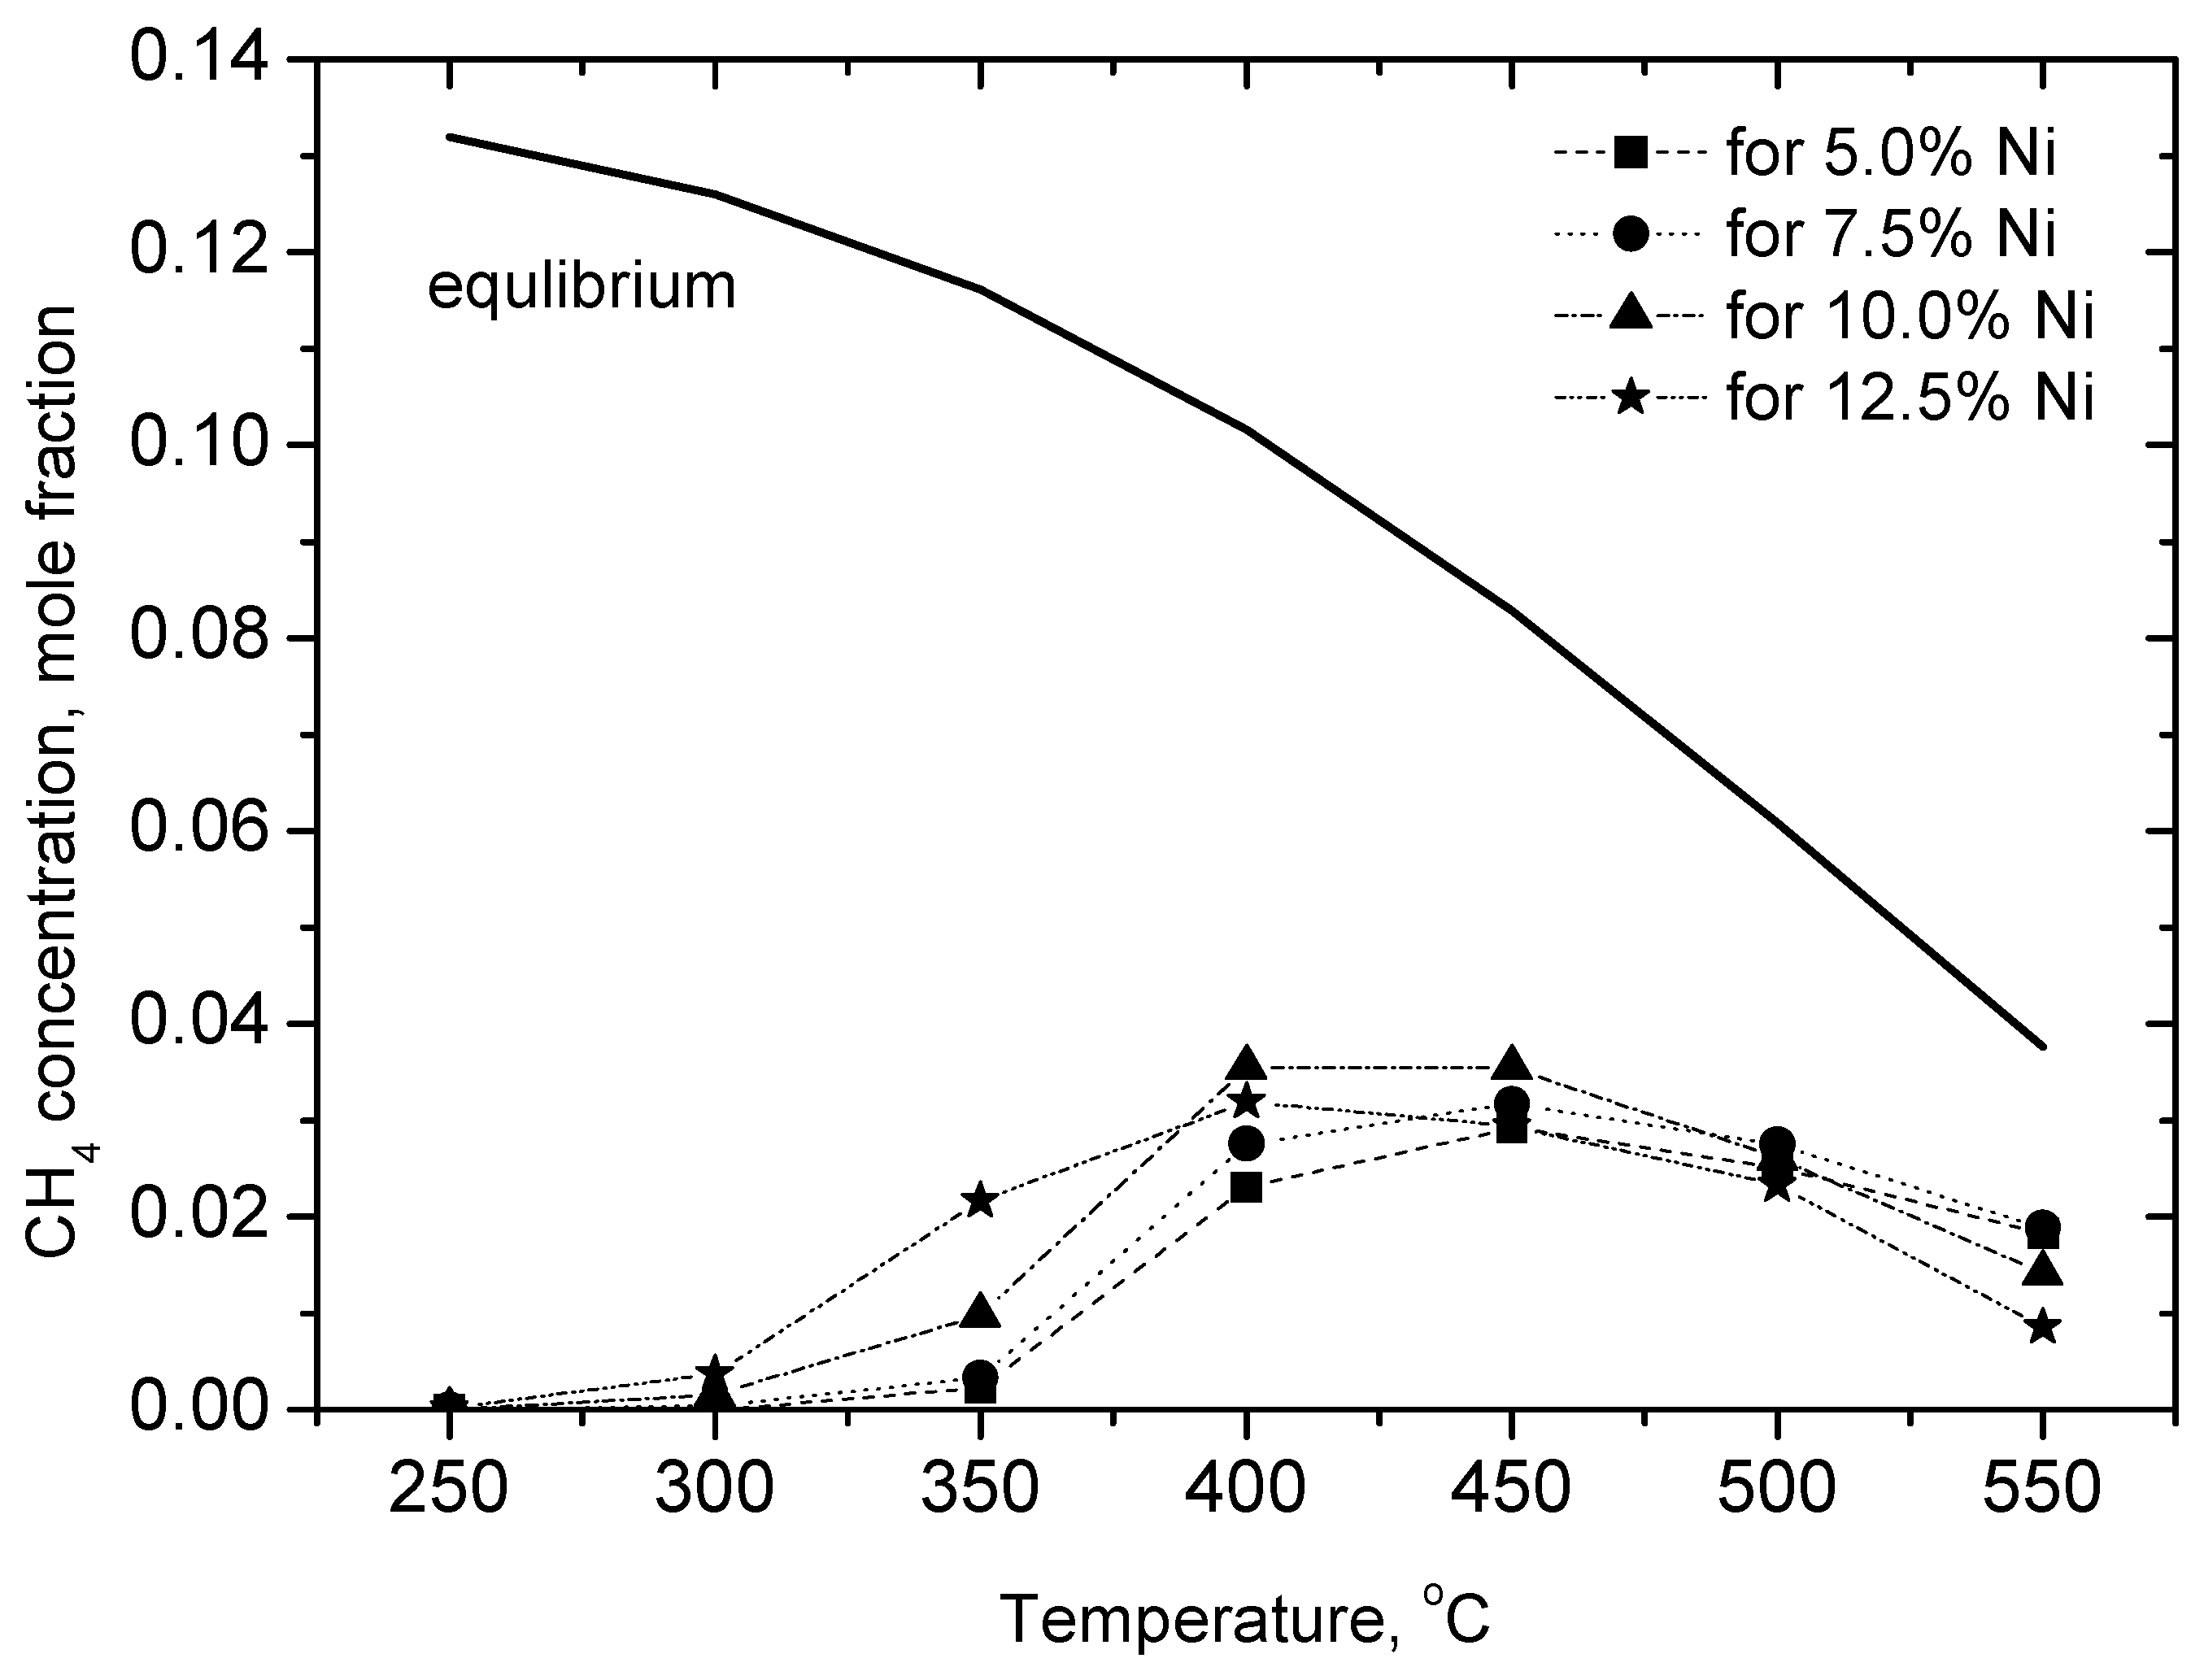
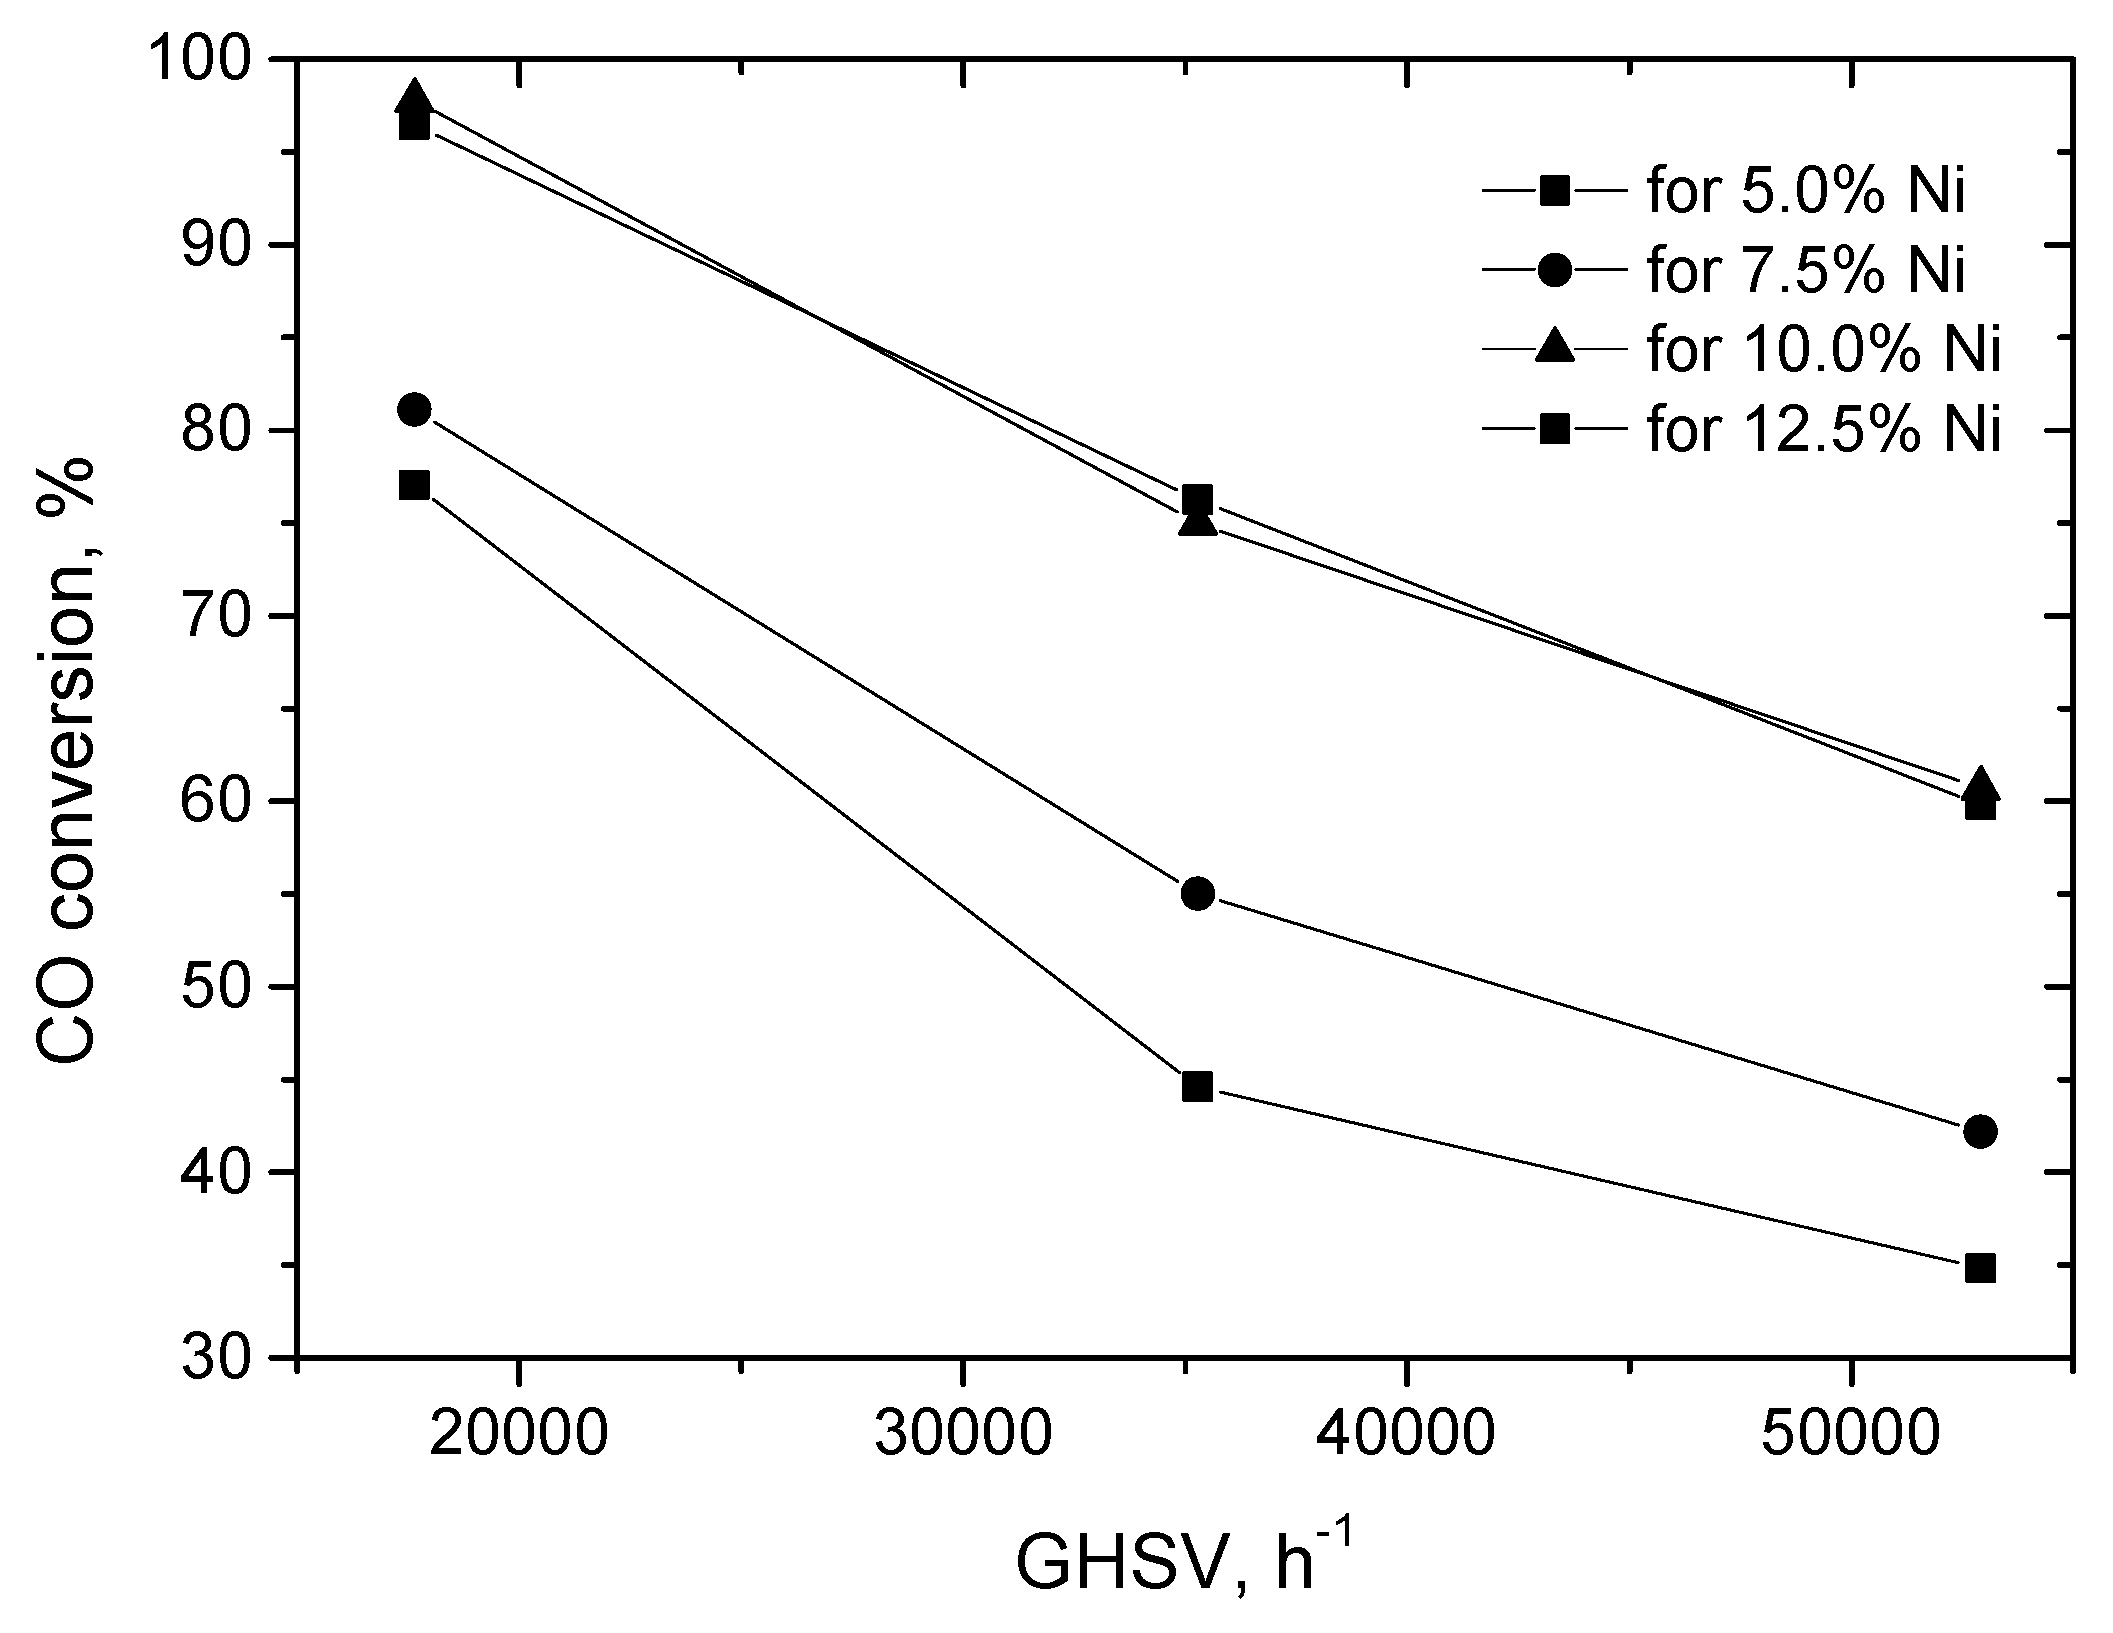
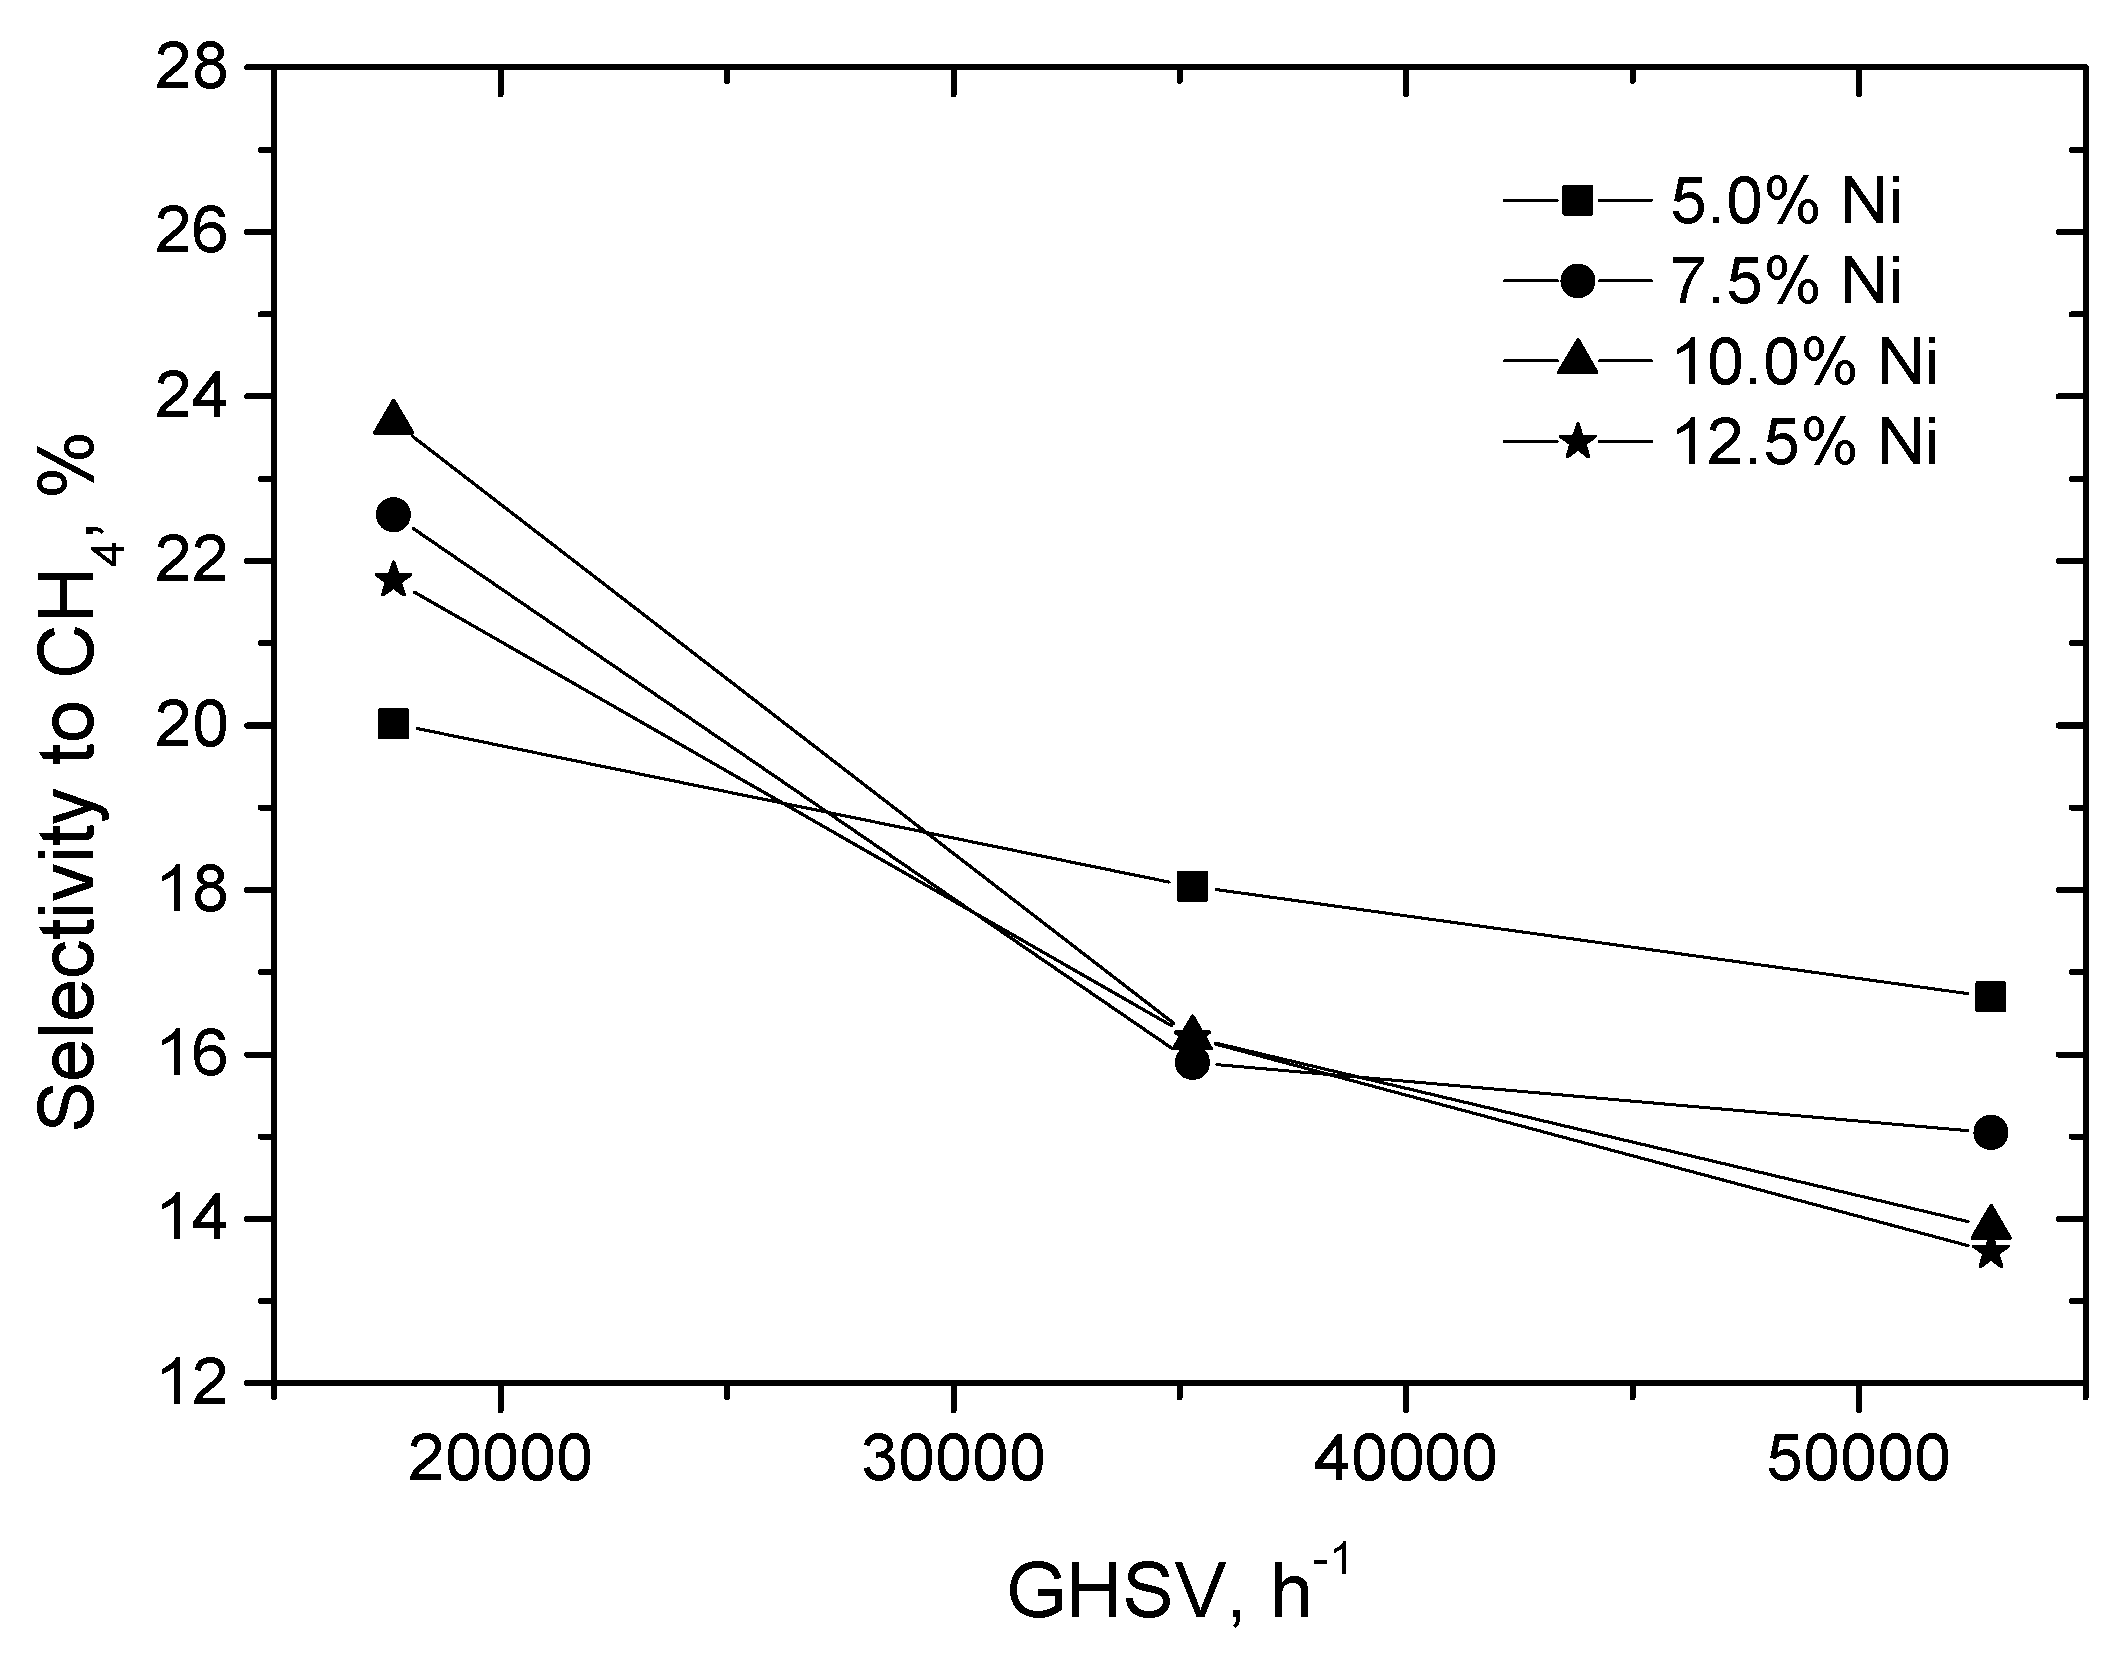
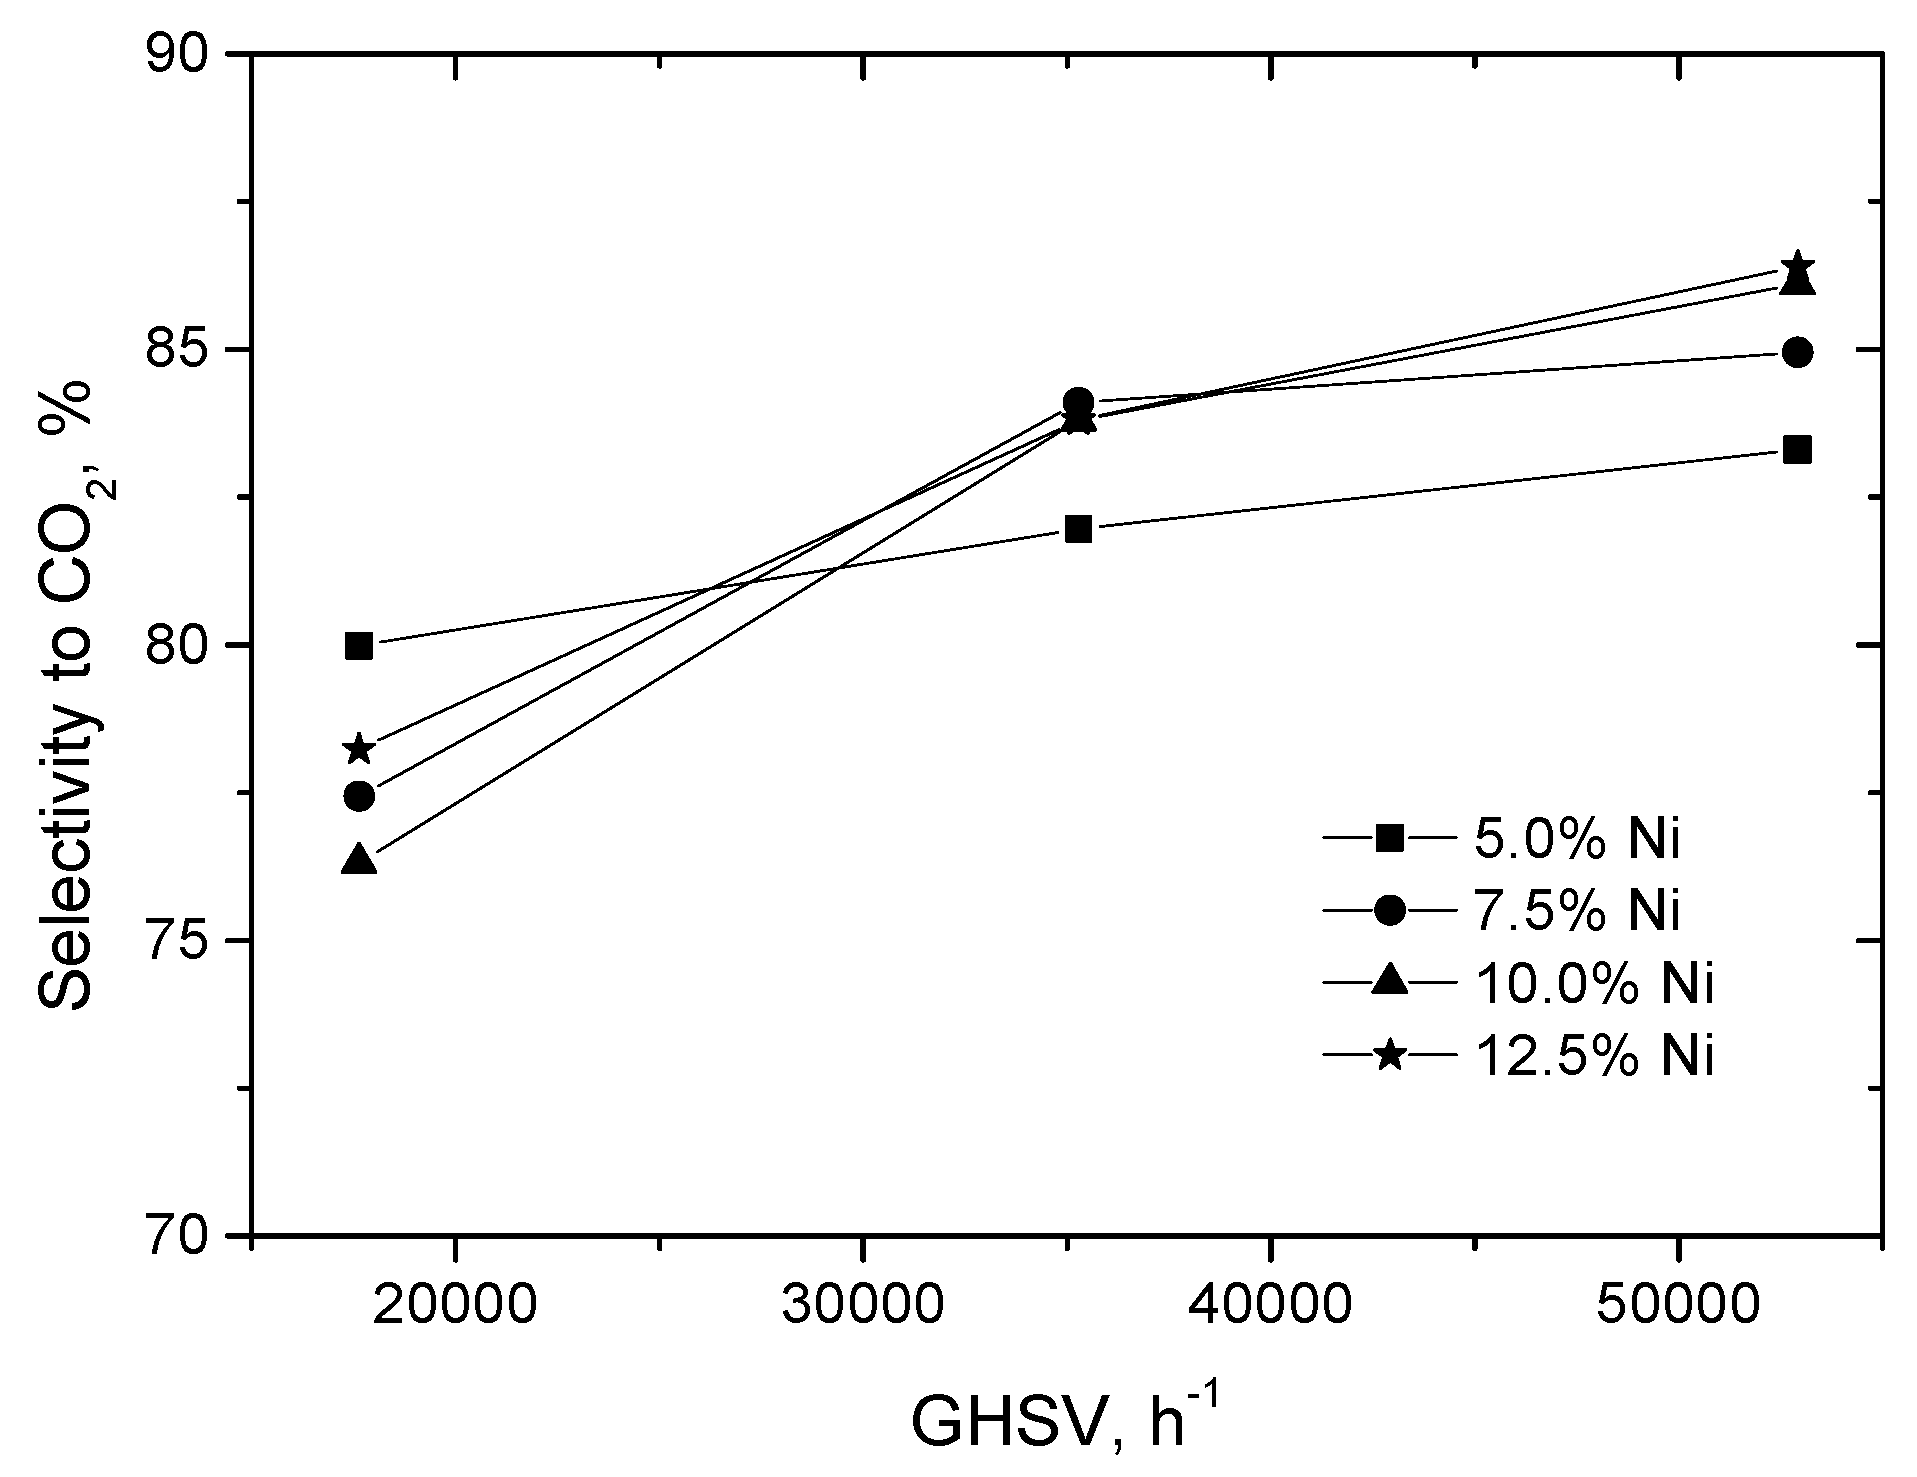
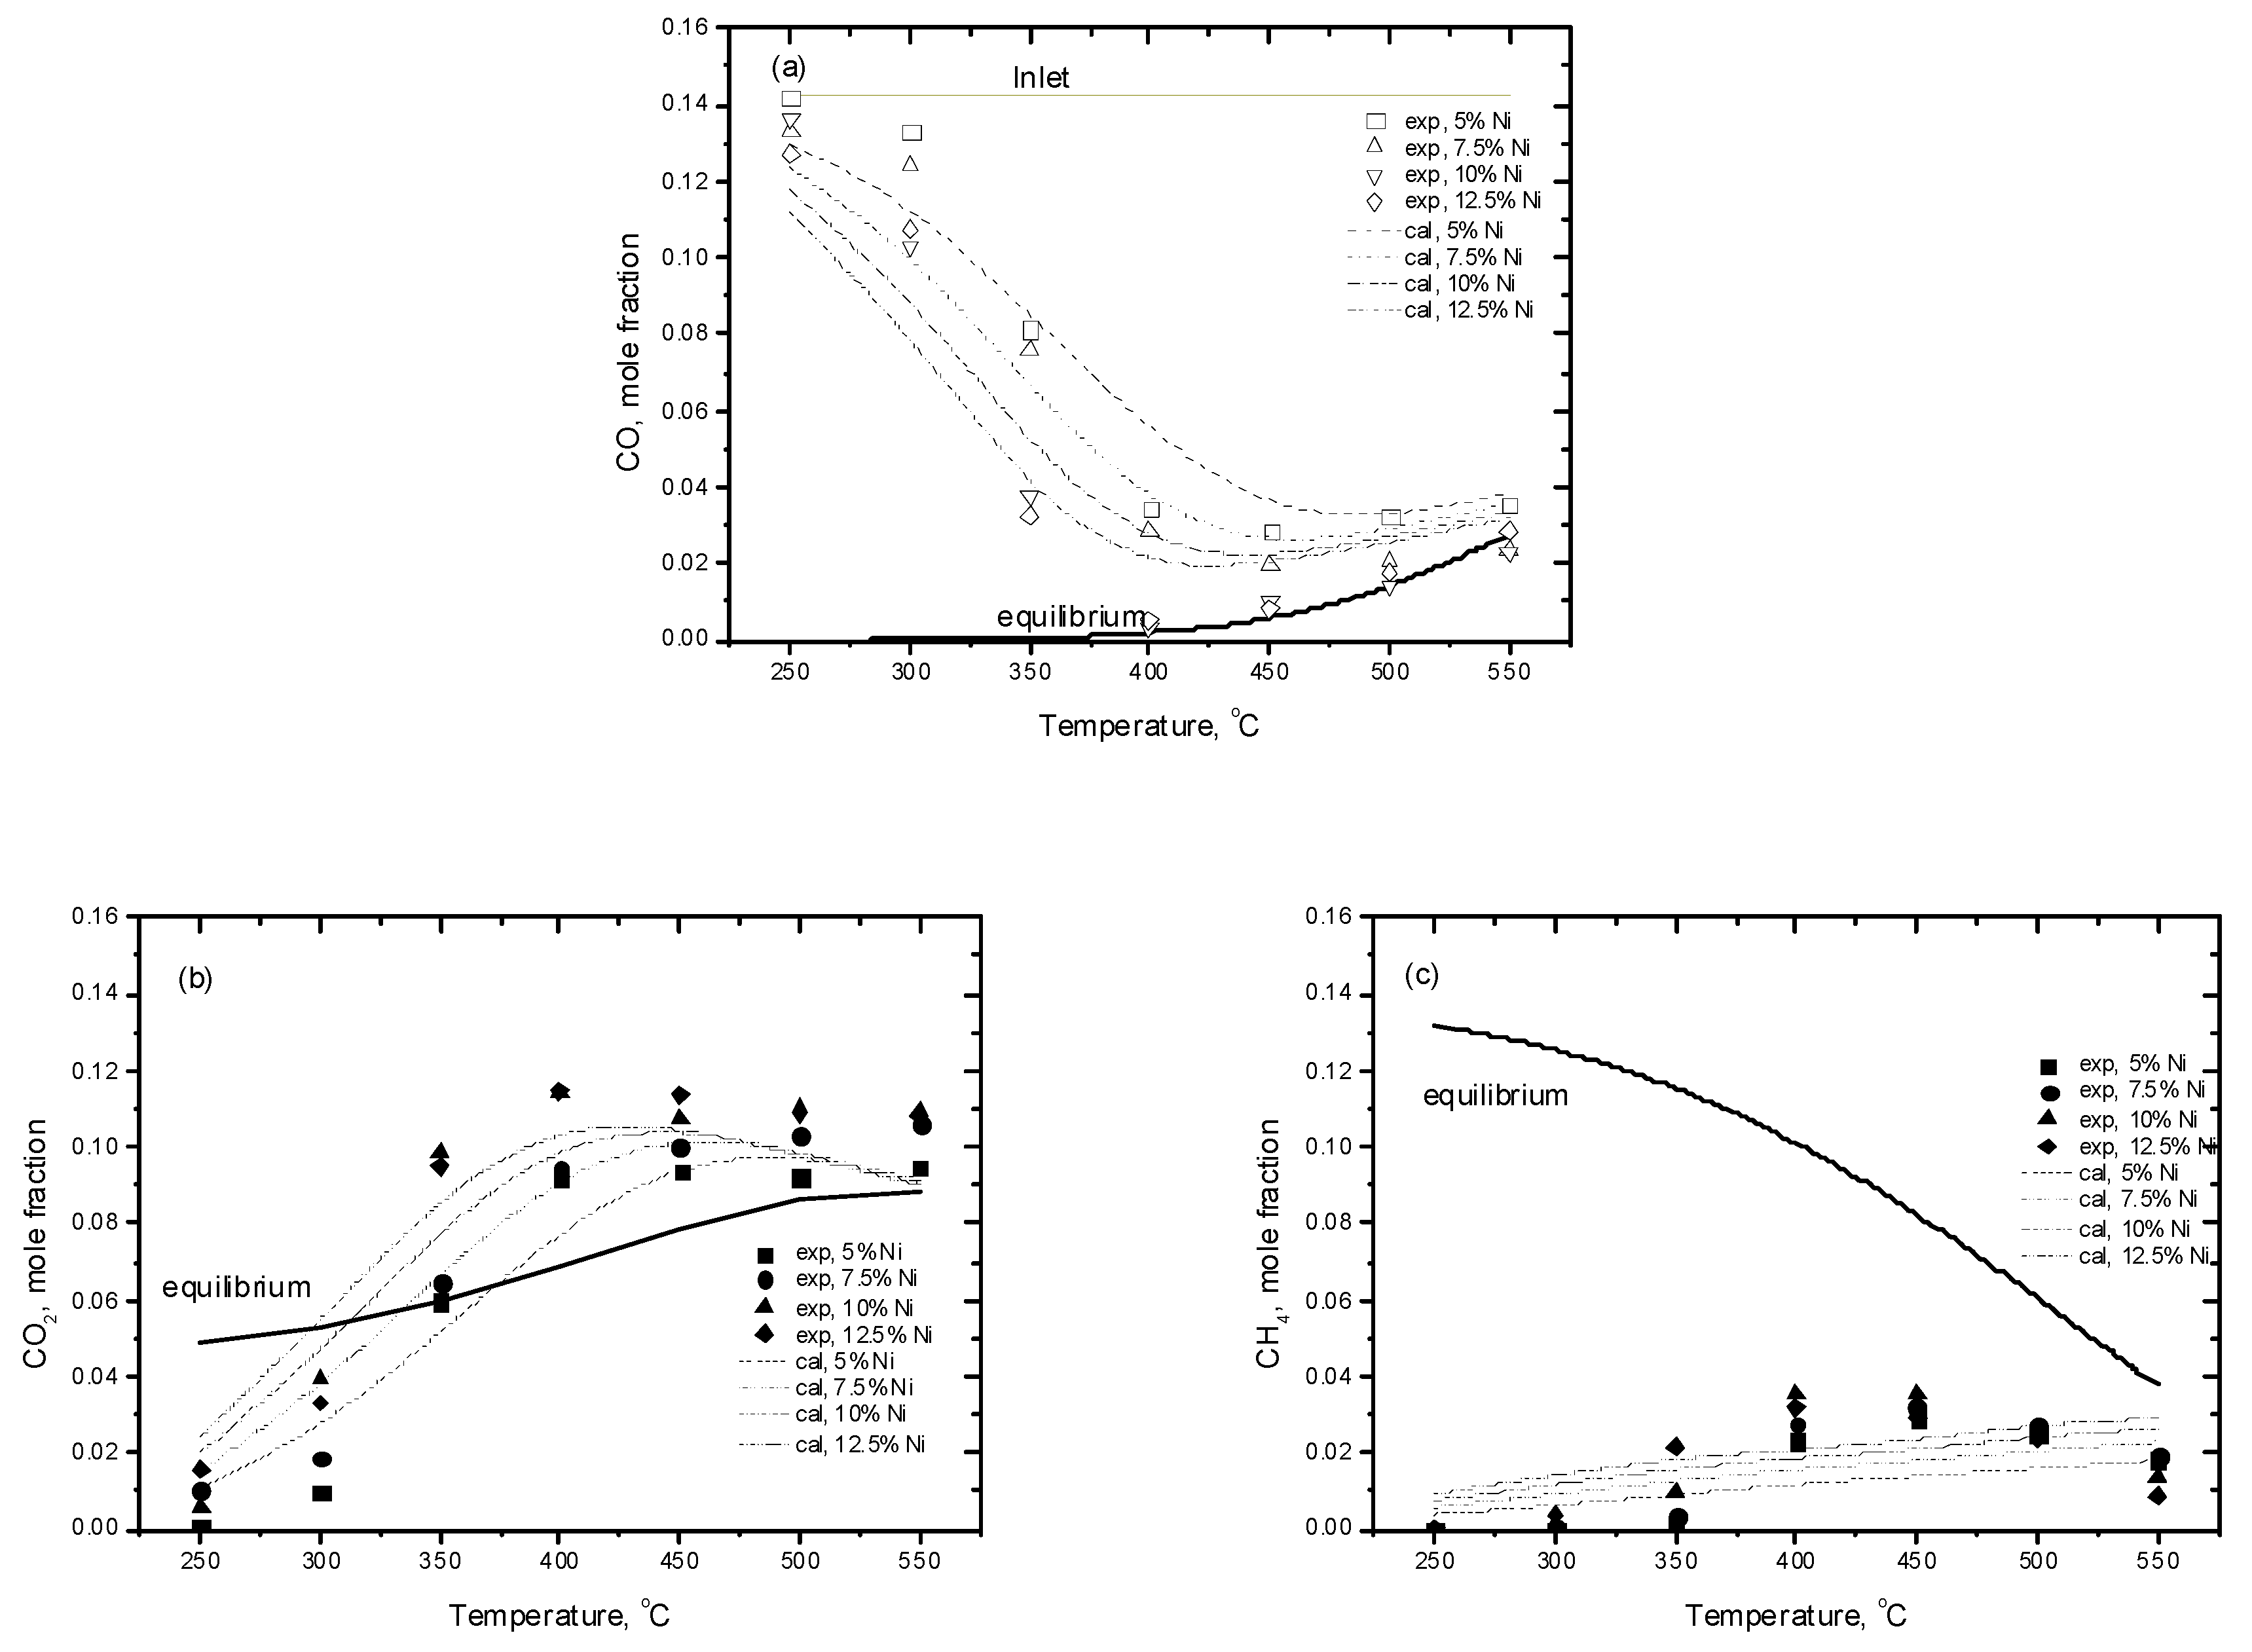
2.2.1. Experimental Observation

In order to study catalytic activity for the water–gas shift reaction and elucidate kinetic parameters, experiments were performed in a fixed-bed flow reactor loaded with 0.1 g of nickel–ceria catalyst (contact time 50 ms) over a temperature range of 250–600 °C under atmospheric pressure. A micro quartz reactor operated isothermally was used for the study. A very dilute feed gas composition of 1% CO + 1.8% H2O balanced to 10 L·h−1 with Не was employed.
Concentrations of carbon-containing reaction products versus temperature in the outlet gas are given in Figure 4. The reaction initiates at temperatures around 200 °C. However, some methane formation occurs at temperature around 250 °C, as shown in Figure 4b. Clearly, there is no appreciable difference in the light-off temperature of WGS reaction for Ni/CeO2 catalysts with nickel content from 5 to 12.5 wt %. It can be seen that all prepared samples with different weight percentages of nickel exhibit a high specific activity for CO conversion in the temperature range of 300–450 °C. In fact, the values of CO conversion to CO2 at 400 °C for samples with 10 and 12.5 wt % Ni are nearly the same, 94.7% and 95.3%, respectively. Some decrease in the specific surface area observed for catalysts with a higher nickel loading (Table 1) suggests the formation of bulk NiO particles. Large Ni particles formed after reduction in the reaction mixture, which would have a negligible interaction with ceria, appear to have a small effect on the catalytic activity compared with well-dispersed Ni nanoparticles. Simultaneously, the total number of highly dispersed nickel species may also increase with nickel loading (Table 2).
Concentration of methane in the reaction products was detected to be very low for maximum values below 0.022–0.037 vol % at 300–350 °C (Figure 4b), showing negligible secondary methanation reaction for these catalysts in the feed with the excess of H2O. The most promising for methanation reaction was found to be 2 wt % Ni/CeO2 catalyst [17,18,19]. As shown in the literature [20,21,22,23,24], methanation at the surface of supported Ni catalysts is highly structure-sensitive and is also sensitive to the presence of hydrogen.

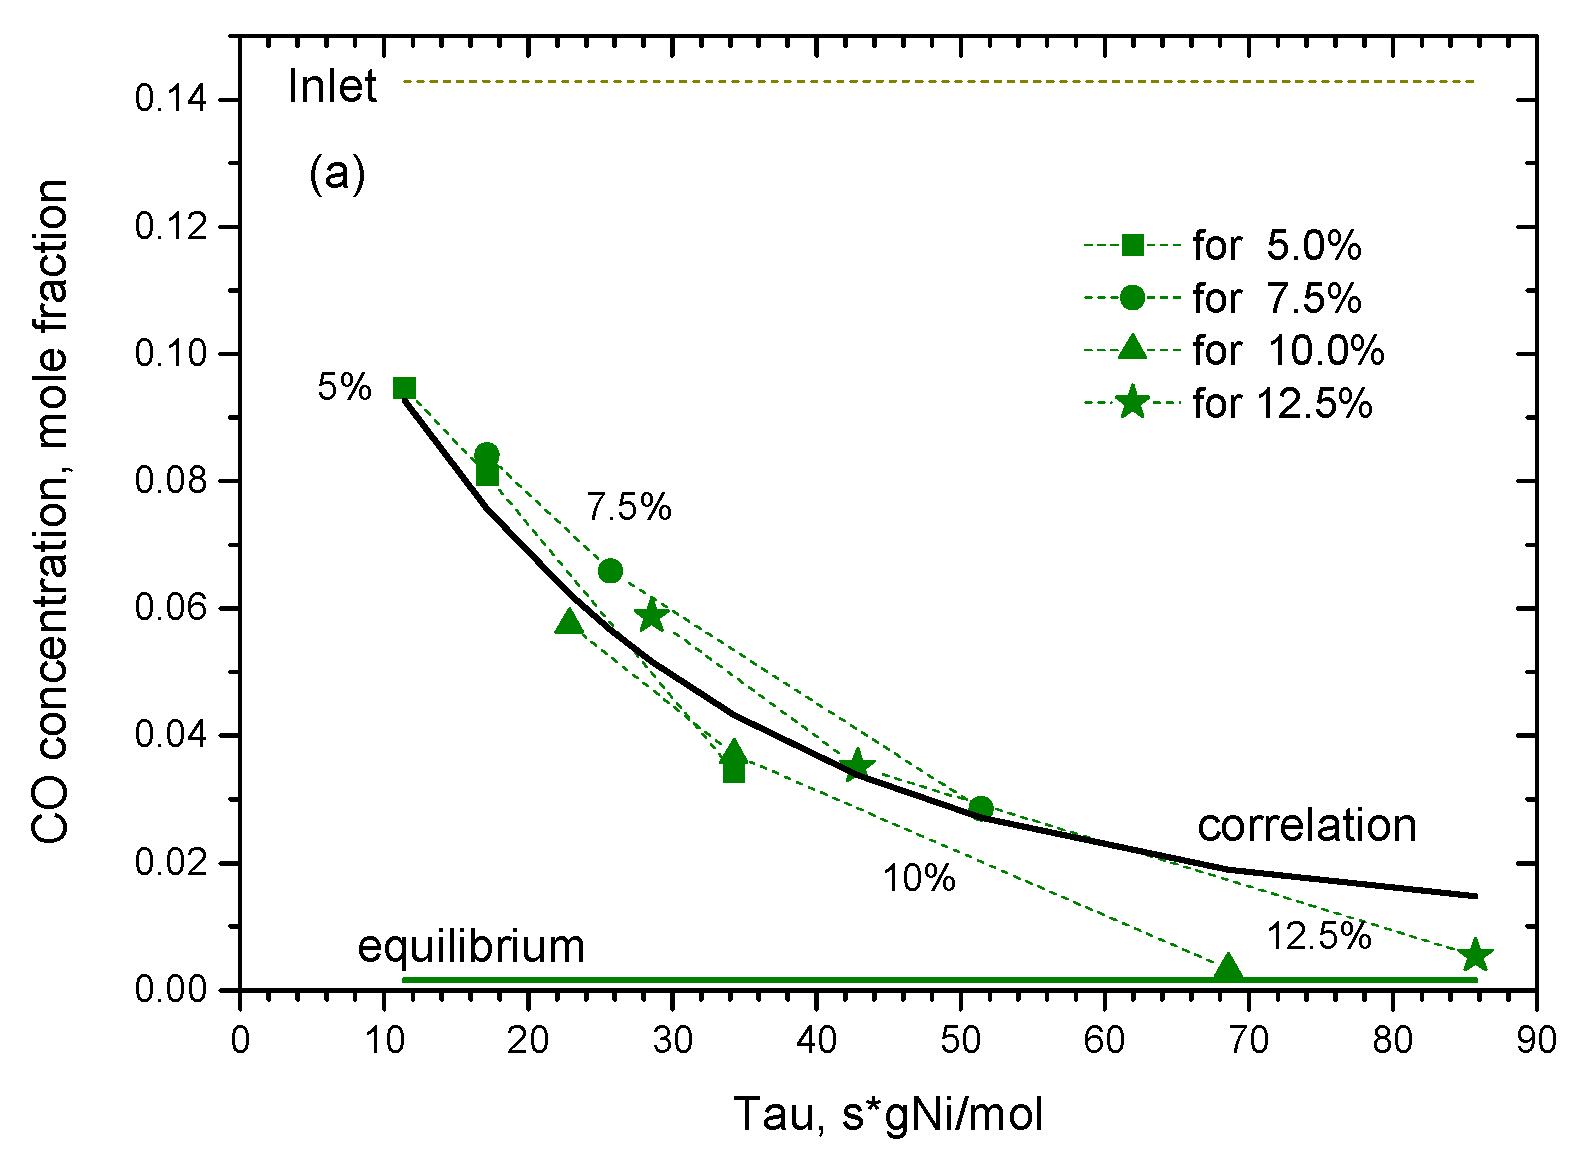
2.2.2. Kinetic Modeling

A series of experiments (Figure 4) with Ni/CeO2 catalysts for the water gas shift reaction were carried out isothermally in a plug flow fixed bed reactor. The experiments were performed under conditions where transport resistances are negligible. There was no hydrogen in the inlet mixture. Experiments with changing reaction temperature were conducted at a constant contact time (50 ms). The reaction was examined using a very dilute gas mixture of 1% CO + 1.8% H2O in Не and at very short residence times in an attempt also to avoid sequential reaction through the forward reaction.
The composition of the mixture at the reactor exit is mainly influenced by variable parameters such as temperature and feed concentration. The thermodynamic equilibrium analysis of the water–gas shift reaction can give us some information concerning operating conditions. As is well known, the thermodynamic equilibrium CO conversion is favored at low temperatures and independent of the reaction pressure. Thermodynamic calculations of the system have been performed with the “Thermos” program [25,26] using the Gibbs free energy minimization approach. Gibbs free energy is computed at the atmospheric pressure and temperature of the reactor and calculated using standard molar entropy, enthalpy of the reaction at a given temperature, and temperature dependence of the specific heat of each compound. Figure 5 shows thermodynamic predictions for particular experimental conditions.
According to thermodynamic predictions for the given feed composition, 0.01 CO and 0.018 H2O in He, the maximum hydrogen production observed at 450 °C is accompanied with a minimum methane formation. The reaction of CO methanation becomes thermodynamically unfavorable at elevated temperatures.
As a result of mathematical treatment and experimental evaluation, a semi-empirical kinetic model for the rate of the reaction was deduced. A kinetic model of water–gas shift (WGS) was based on the stoichiometric Reactions (1) and (2). By using the law of mass action, the rates of the chemical Reaction (1) can be written as directly proportional to the concentrations of reactants and products:
R 1 = k + 1 ( y C O y H 2 O 1 K e q 1 y C O 2 y H 2 )
R 2 = k + 2 ( y C O y H 2 3 1 K e q 2 y C H 4 y H 2 O ) ,
where Ri are reaction rates and yi are concentrations of reagents in mole fractions. Reaction ki and equilibrium Keqi constants are written in the Arrhenius form:
k i ( T ) = k 0 i exp ( E i R T )
K e q i ( T ) = K 0 i exp ( E e q i R T ) .
The computer program “Thermos” provided equilibrium concentrations that were used to calculate the values of equilibrium constants. The apparent activation energies and kinetic constants were calculated with assumption of the isothermal plug-flow reactor model:
d y i d τ = 1 γ [ q i y i j = 1 N S q j ]
d y d τ = i = 1 N S q i
τ = 0 :   y i = y i 0 ;   γ = 1 .
Here, y i , y i 0 —mole fractions of components in the reaction mixture and at the inlet of the reactor, respectively; γ N N 0 —a molar expansion factor defined as a ratio of the total molar flux N to the inlet N° one; τ G c a t N 0 —a reference contact time in the units of s × g / m o l ; is calculated as a function of the catalyst weight; q i = j = 1 N R z j i R j —rate of i-component formation/consumption; z j i are coefficients of the stoichiometric matrix for the Reactions (1) and (2).
Estimations of kinetic parameters were made for each reaction realization using methodology of minimizing the objective function:
Q = j = 1 N exp i = 1 N S [ ( y i j exp y i j c a l c ) 2 + ( γ j exp γ j c a l c ) 2 ] min ,
where i—index of component, j—index of experiment, NS—number of components, Nexp—number of experiments.
When all the relevant concentrations were ascertained using the molar balanced equations for the elements, kinetic parameters can be estimated to match the experimental data based on a minimization of the objective function. The Gauss–Marquardt method is a minimization algorithm for gradient descent. The system of Equations (7)–(9) was solved numerically, as has been shown in detail elsewhere [27,28,29].
Thus, for Ni/CeO2 catalysts tested in the fixed-bed experiments, the averaged values of kinetic parameters of the kinetic model (2) and the confidence intervals to the estimates for the WGS reaction are given in Table 3. No reliable kinetic model parameters for methanation Reaction (4) in these conditions have been identified.
Simulated data for different Ni loadings obtained with the set of kinetic parameters (Table 3) against experimental observations in the fixed-bed reactor are shown in Figure 6. Confidential intervals obtained in the computations for each component are small enough. Therefore, the kinetic model applied is quite adequate to fit the experimental data obtained by using the estimated kinetic parameters. Thus, Figure 7 illustrates the good agreement between the experimental and calculated data. Here the diagonal line represents the line of identity.

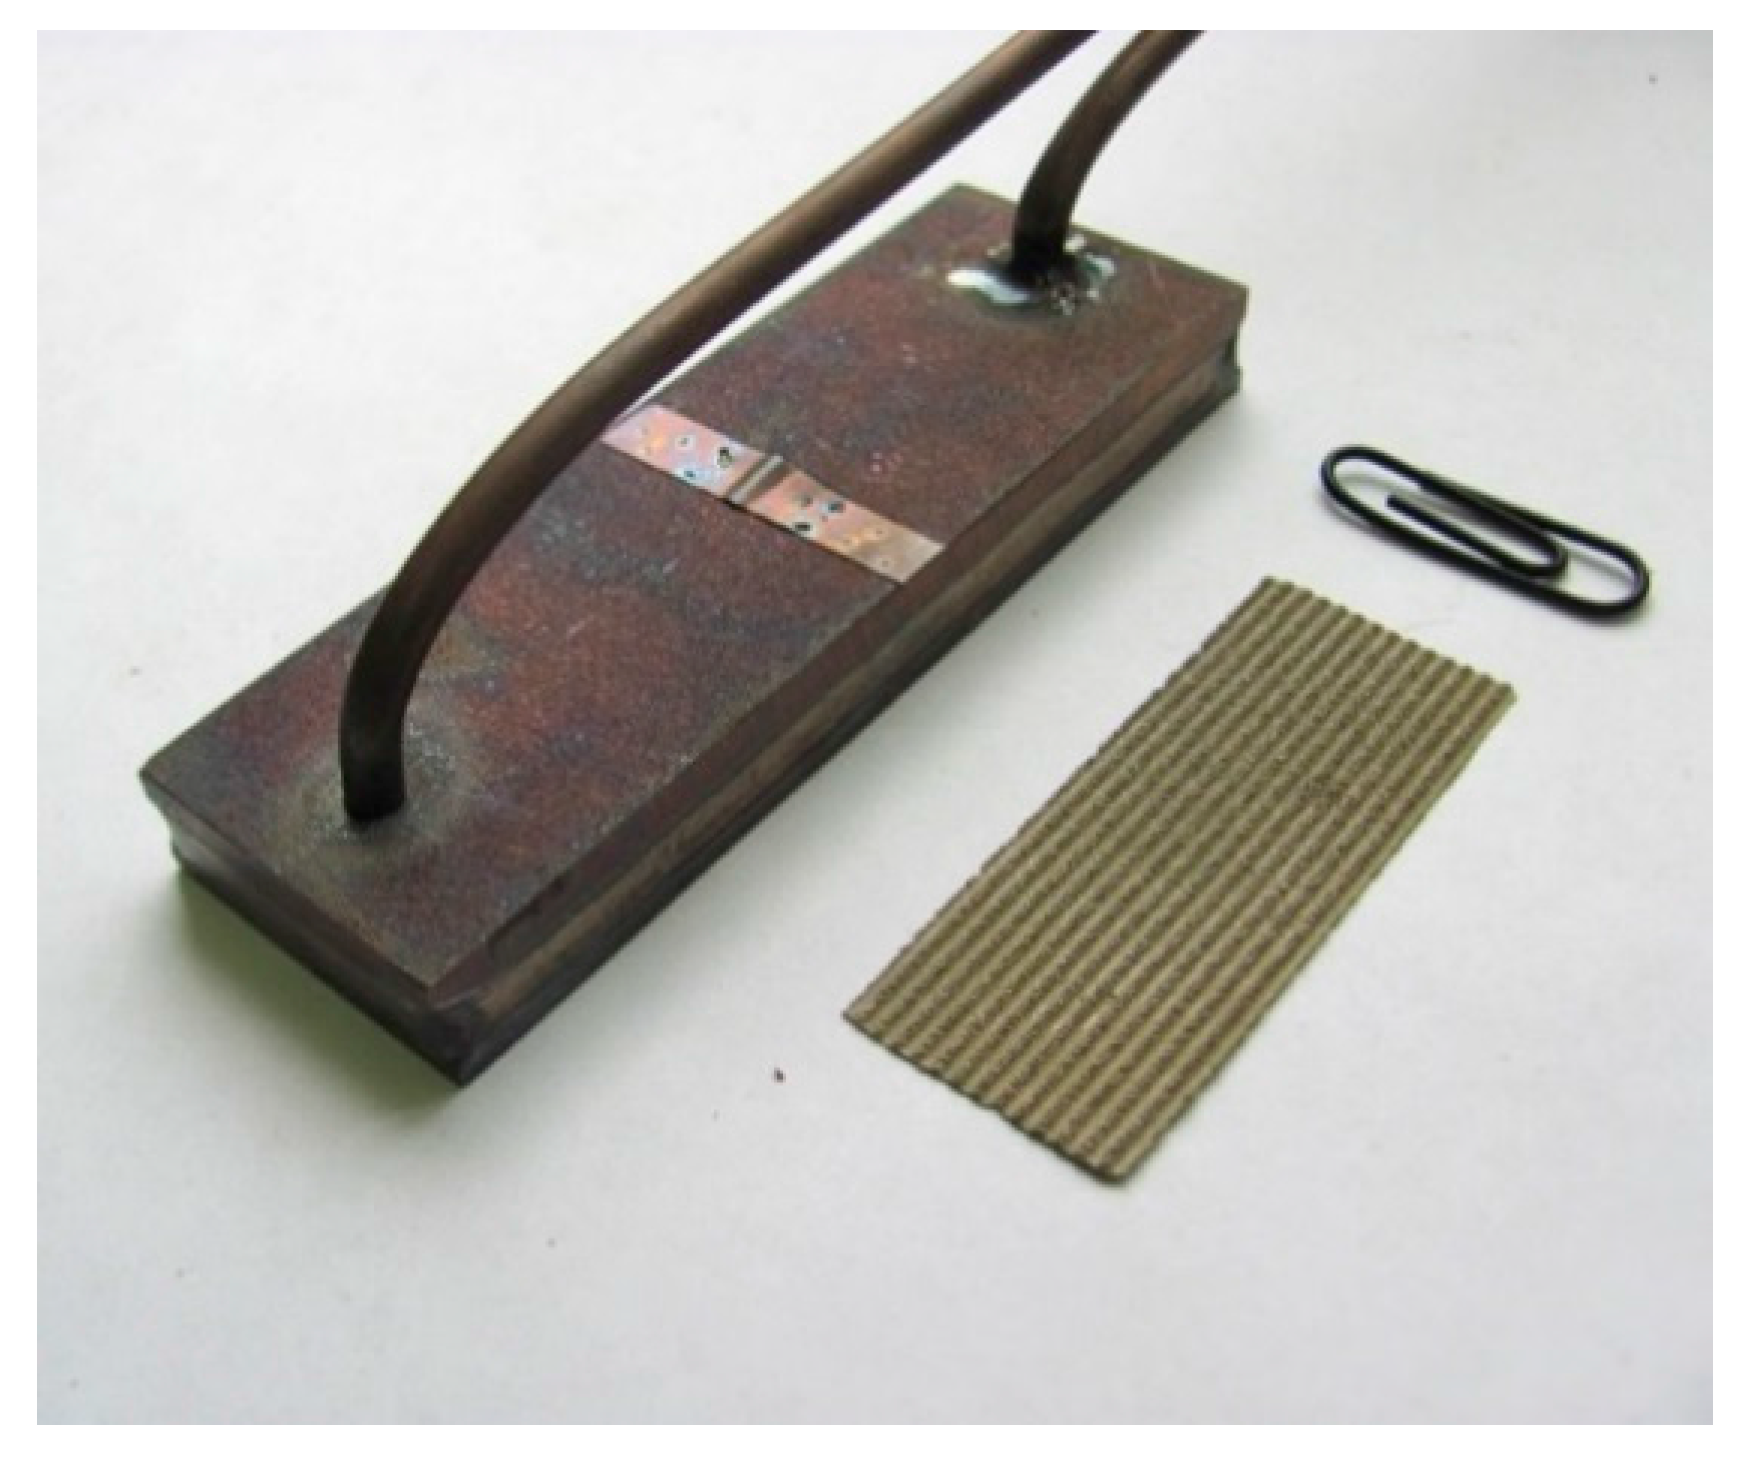
2.3. Kinetic Behavior of the WGS Reaction in a Microchannel Reactor Configuration

Nowadays, microchannel reactor technology has also been explored as a possible reactor configuration for the WGS reaction. Microchannel reactors have characteristic dimensions, such as channel gaps, which are on the microscale (typically < 1000 μm) or meso-scale (1000 μm to a few millimeters) level [30]. Shorter space–time yields are enabled in microchannel systems due to a reduction of the transport limitation. Microchannel WGS systems were reported to have very short (less than 30 ms) residence times at temperatures between 250 and 300 °C [31].

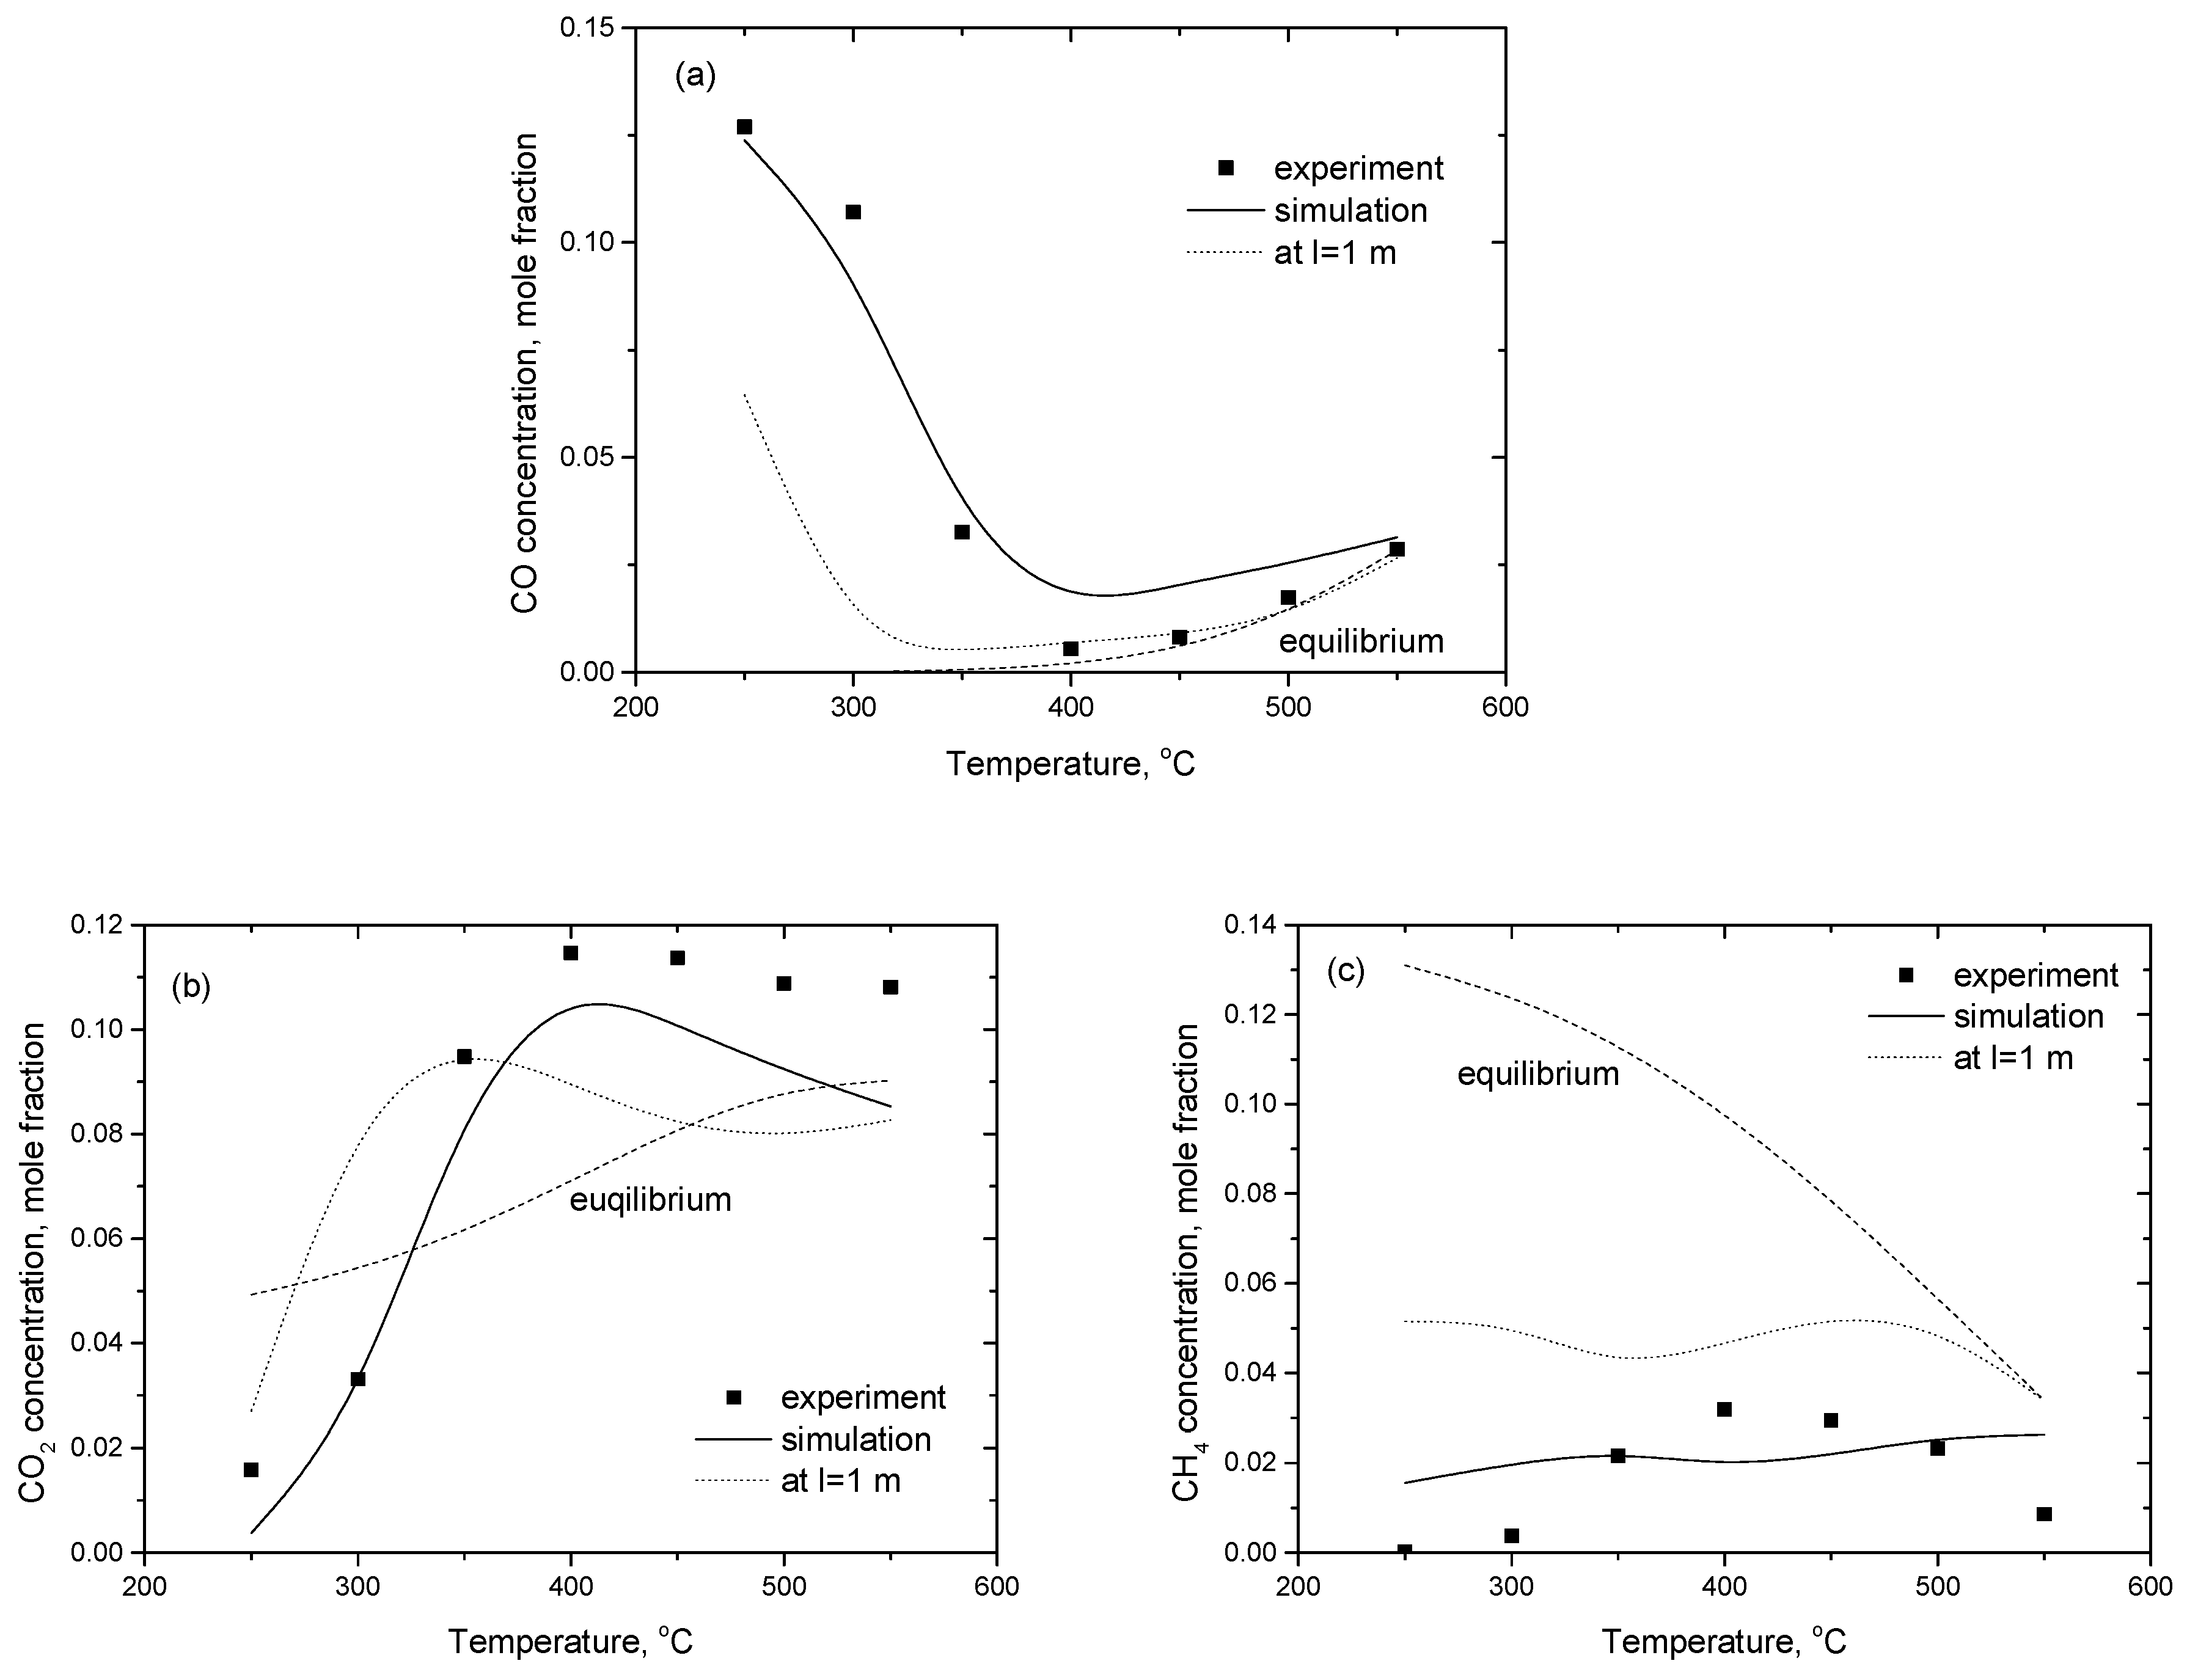
2.3.1. Experimental Data

A set of experiments with a specially designed microchannel reactor with catalyst-loaded microchannel plates was performed at atmospheric pressure and temperature 250–550 °C. The feed stream composition (CO:H2O:H2:N2 = 1:2:2:2), which contains large amount of hydrogen and water as reactants, represented a product gas from methane partial oxidation to give us more information about the methanation reaction over Ni/CeO2 catalysts. The effects of temperature and gas hourly space velocity (GHSV, h−1) on CO conversion and selectivity to CO2 and CH4 were studied. GHSV is the ratio of the volume flow rate of the gas to the volume of the reactor, calculated at standard temperature and pressure. A higher GHSV value (Table 4) represents a shorter residence time. The performance of a microchannel reactor was characterized by CO conversion and selectivity to CO2 and CH4 at a given gas hourly space velocity in the reactor.
The fast dissociation of water on Ni/CeO2 would have a dramatic effect on the activity and stability of this system as a catalyst for the water–gas shift [32]. The catalysts in this set of experiments were actually tested under forward WGS feed conditions because of the large excess of water. The WGS reaction should proceed faster under a large excess of water above stoichiometric ratio. The rate of the forward reaction will dominate as long as there is some H2O in the system. Carbon monoxide is required by both Reactions (1) and (2) and conversion of CO can be expected to be rather high. Schumacher et al. [7] also tested catalysts under forward WGS feed conditions. For the catalysts investigated on an aluminum oxide support the following experimental trend was found Cu > Co > Ru > Ni > Pt > Au > Fe > Pd > Rh > Ir. The Ni catalyst shows high activity in the intermediate temperature range.
The data related to the feed mixture used in the experiments with microchannel reactor are given in Table 4.
All studied catalysts demonstrated high and stable activity in the water–gas shift reaction. Selectivity and conversion are interrelated. Temperature dependences of CO conversion at GHSV = 17,640 h−1 over catalysts with different nickel loading are presented in Figure 8. It can be observed that catalysts with nickel loading 10 and 12.5 wt % exhibit higher conversion over the considered temperature range and almost reach equilibrium at a temperature of about 400 °C.
The effect of temperature on selectivity to CO2 at GHSV = 17,640 h−1 over catalysts with nickel loading from 5 to 12.5 wt % is shown in Figure 9. As temperature increases, CO2 selectivity decreases, reaching minimum values at 400–500 °C, and then grows again for all of the catalysts studied. Such an effect seems to be evidence of mechanism alteration during the transition from low to high temperatures. At high temperatures, the exothermic reaction of CO methanation shifts to the left, towards an increase in CO2 selectivity and lowering CO conversion. Notably, the catalysts with a high nickel content displayed the lowest selectivity to CO2 in the low temperature region, but the highest values in a high (˃450 °C) temperature region.
Regarding CH4 formation, appreciable amounts of methane appear at temperatures above 320–340 °C until reaching their maximum at 400–450 °C (Figure 10). A further increase of temperature leads to a drop in methane concentration, apparently due to a side reaction of methane steam reforming. The lowest methane concentration at high temperature was observed during a reaction over 12.5 wt % Ni/CeO2.
The highest CO conversion (97.8%) was obtained at a relatively low temperature of 400 °C and the lowest GHSV of 17,640 h−1 for the 12.5 wt % Ni/CeO2 catalyst. The effect of GHSV on conversion and selectivity at 400 °C is illustrated in Figure 11, Figure 12 and Figure 13.
As shown in Figure 11, conversion of CO drops rapidly for all examined catalysts as GHSV is increased from 17,640 to 52,920 h−1 (Table 4). Thus, about a 40% decrease in conversion was observed for catalysts with nickel loading 10 and 12.5 wt % Ni. At the maximum GHSV of 52,920 h−1 corresponding to the shortest residence time, the highest value of about 59.8% was detected for both catalysts mentioned above. Consequently, methane concentration is reduced and CO2 selectivity slightly increases with the increase of GHSV from 17,640 to 52,920 h−1, as can be seen from Figure 12 and Figure 13. Changes in methane concentration during variation of gas velocity seem to be caused by water consumption in the water–gas shift Reaction (1), and therefore the equilibrium of CO methanation Reaction (2) was shifted to the right.
For the remaining CO, the lowest value of 0.34% was observed for the 10 wt % Ni/CeO2 catalyst (Table 5). This value of CO residual concentration is comparable with literature data concerning microchannel reactors despite the fact that compositions of the initial reaction mixture and inlet CO concentration differ strongly. For example, Kolb et al. [33] used a catalyst 1% Pt/CeO2/Al2O3 deposited on the microchannel plate made of metallic foil. The initial mixture was comprised of 10.0% CO, 20.0% H2O, 30.0% H2, 10.0% CO2, and 30.0% Ar, corresponding to reformate composition after isooctane steam reforming. At 340 °С and WHSV = 2.9 mL · g catal 1 · s 1 СО conversion was equal to 79% and outlet СО concentration −2.3%. It should be emphasized that catalysts involved in processes of CO to CO2 conversion usually contain expensive rare metals. Tonkovich et al. [34], for instance, employed a catalyst 5% Ru/ZrO2 deposited on nickel foam at 400 °С and GHSV = 72,000 h−1. The CO conversion was about 70% for the feed with CO concentration 5%, H2O/CO ratio equal to 3 and N2 balance. Germani et al. [35] used a microreactor equipped with two steel plates, each containing 49 channels loaded with 2% Pt/CeO2/Al2O3 catalyst. The initial mixture simulated the composition of reformate after autothermal reforming of gasoline with the following composition: 32.2% H2, 9.6% CO, 8.4% CO2, 23% H2O, and Ar balance. The authors showed that at a reaction temperature of 380 °C and WHSV = 16.7 mL · g catal 1 · s 1 , CO conversion was about 75%.
According to this research, a microchannel reactor loaded with catalyst can successfully provide a sufficiently low concentration of CO at the outlet, which is acceptable for subsequent mixture purification by the low-temperature water–gas shift or direct CO selective oxidation and, after that, in PEMFC [36].

2.3.2. Kinetic Assessment

Effect of the Resistance to Mass Transfer

The application of a microchannel parallel-passage reactor configuration for kinetic measurements has been demonstrated experimentally and investigated theoretically [37,38]. The reacting gas mixture flows through the channels and chemical reactions can occur on the catalytic surface of the channel. It is of central importance that the testing is performed under conditions without any transport limitations concerning heat and mass transfer. In this study, the reactor thermal management sub-system provided an isothermal environment for the rate measurements of the exothermal WGS reaction. Another important aspect to estimate is the effect of the mass transport resistance. The global effectiveness factor (usually ranging from 0 to 1), which accounts for the effect of different diffusion resistances on the intrinsic rate of reaction, is a convenient quantity to measure how much the reaction rate is lowered because of the mass transport limitation within a catalytic system [39,40,41,42,43]. For example, the calculated 10% error associated with neglecting the diffusion effect in such a reactor configuration is on the same order as the experimental error associated with conversion measurements, with a ±5% relative accuracy [38].
The cold-pressing method, applied successfully for the preparation of the catalyst-loaded microchannel plates, ensures strong and tight microchannel walls. Given the measured rates, the pore resistance effect was estimated using Wagner–Weisz–Wheeler modulus M W [44]. With the value of 1.7228 × 10⁻² at 550 °C, which is the highest value of M W , the pore resistance is negligible in this study. Therefore, we can assume that the WGS reaction occurs at a fluid, non-porous solid interface without internal transport effect and the geometric surface area of the channels directly accessible to the reaction gas mixture more likely represents the true catalytic area.
Under laminar flow conditions in the channels, and at steady state, the flow rate to the surface (per unit area) is equal to the reaction rate at the surface. Using the component’s effectiveness factor formulation [43] and assuming the reaction rate based on the per-unit surface area to be of the first order, the effectiveness factor for the CO conversion rate as the key component is as follows:
η e x t = k m k C O + k m ,
where the surface rate constant with units of m · s 1 is numerically equal to the rate at which the unit volume of reactant (carbon oxide) is consumed per unit catalyst surface per unit time. The surface rate constant k C O may be evaluated from the experimental data, substituting a fractional conversion of CO, residence time τ and the volume-specific catalyst surface area in a channel S s p . c h · m 2 · m 3 :
k C O · S s p . c h = 1 τ · ln ( 1 X C O ) .
The mass transfer coefficient k m in a channel is evaluated from a Sherwood number Sh:
S h = k m · d h D C O m i x ,
where D C O m i x is mixture-averaged (effective) diffusion coefficient for CO species in remaining mixture, the effective hydraulic diameter d h is a function of area S and perimeter P of the channel cross section (the Chesy relation):
d h = 4 S P .
The rate of mass transfer to the reactive surface describing the flux from the gas to the catalytic surface strongly depends on the shape and fluid dynamic design of the channel. The mass transfer efficiency being determined by the Sherwood number Sh, is defined as in [44]:
S h = 2.977 + 8.854 · ( z * · 10 3 ) 0.5174 · exp ( 42.29 · z * ) .
Here z * = z d h · P e , where z is the axial coordinate of the channel and P e is the Peclet number.
Having calculated with Equation (11) the effectiveness factors for the experimental data, the minimum value of η e x t = 9.98 × 10⁻¹ (Sh = 2.98) was found. At the specified reaction conditions, the calculated values of the rate constant k C O and mass transfer coefficient k m were estimated to be 0.00757 m·s−1 and 3.66 m·s−1, while the values of effective diffusion coefficient for CO species and gas viscosity were equal to 3.52 × 10⁻⁴ m2·s−1 and 3.32787 × 10⁻⁵ Pa, respectively. The results indicate that the rate of gas/solid mass transfer was sufficiently large compared to the rate of catalytic reaction over the range of experimental conditions in this study, so diffusional limitations can be safely neglected.

Kinetic Modeling

We avoid a detailed discussion of the reforming chemistry in terms of elementary steps. A mechanism-independent power-law kinetic model (Equations (3) and (4)) derived from atmospheric pressure experiments has been applied to reveal the difference in the performance of catalysts under study. The temperature-dependent coefficients in the kinetic model can then be determined from data treatment by substituting the rates of reactants’ disappearance and product formation into the experimental rates of overall CO conversion and CO conversion to the products and solving by iteration. All the compositions of output gases are determined using the mass balance principle. The computer program “Thermos” provided us with equilibrium concentrations that were used to calculate a value of equilibrium constants (5) and (6) (Table 6). The parameters were related at all temperatures by the van’t Hoff equation. For the rate Equations (3) and (4), predicted Arrhenius parameters and activation energies are shown in Table 7. It can be seen that the reaction rate constants for the methanation reaction decrease with the increase of Ni content in the catalyst.
Over the temperature range of interest, 350–450 °C, selectivities to carbon-containing reaction products are very close. Correlation curves between CO, CO2, and CH4 concentrations and the reference contact time calculated as a function of the catalyst loading at 400 °C correspond to the rate constants k = 0.1256 ± 0.007 for the WGS Reaction (1) and k = 0.2207 ± 0.02 mol·g−1·s−1 for methanation Reaction (2) (Figure 14).
After optimization procedure to minimize the difference between the observed and calculated data, kinetic parameters for the WGS (3) and methanation (4) Reactions in H2O- and H2-rich gases are shown in Table 8 below. It can be seen that the confidence intervals became smaller for the kinetic parameters across all trials. Simulated data for different Ni loadings obtained with the set of kinetic parameters (Table 8) in comparison with experimentally determined with the microreactor appear in Figure 15.
In general, the kinetic model is able to describe the experimental results in the range of temperatures investigated. The reaction initiates at temperatures around 250 °C and comes to be close to equilibrium at about 400 °C. However, methane formation occurs at temperatures between 325–550 °C, as shown in Figure 15c. Yet, it can be concluded that the macrokinetic model (4) applied in the kinetic simulations does not fit perfectly and predict the actual kinetic behavior of the methanation reaction in experiments. The modeling of the methanation system is known to be much more complex than the simple model system [45]. Methanation rates over different nickel-based catalysts, including single-crystal nickel surfaces, have been shown [46] to fall within about an order of magnitude of each other when compared at the same conditions. These results showed large differences between measured and calculated rates. It was elucidated in [47] that methane formation during WGS conditions attributed to changes in the structure of the catalyst. Alstrup [20] gave a summary of the kinetic models for CO methanation over nickel. The kinetic model for methanation based on the formation of reactive surface carbon from the reaction between absorbed CO* and H* and stepwise hydrogenation of C* to produce CH* as the rate limiting step, was developed in [48]. Carbon coverage dependency was also included in the model. However, the kinetic model was not thermodynamically consistent. The microkinetic approach in attempts to describe this reaction using its most fundamental set of elementary reaction steps, seems to be capable accurately predict reaction kinetics over wide ranges of temperature.

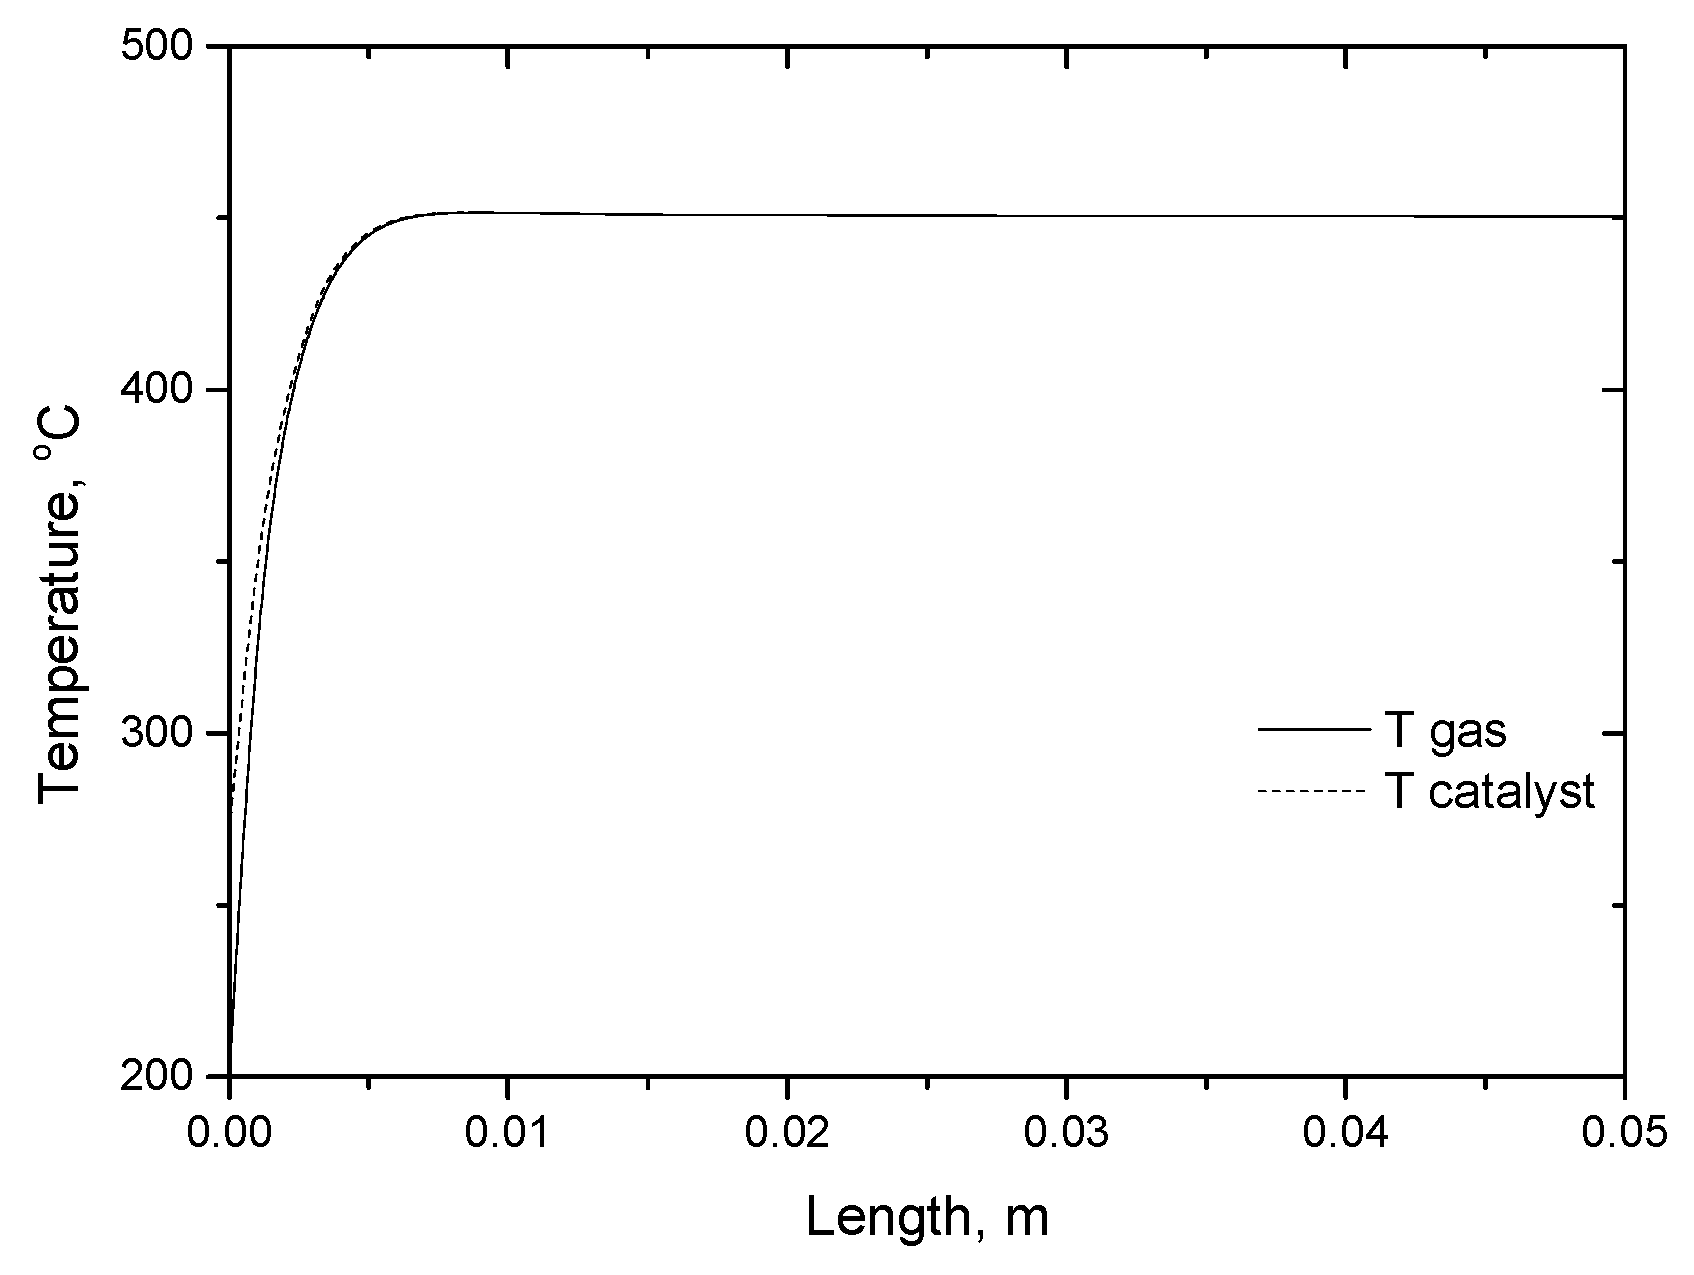
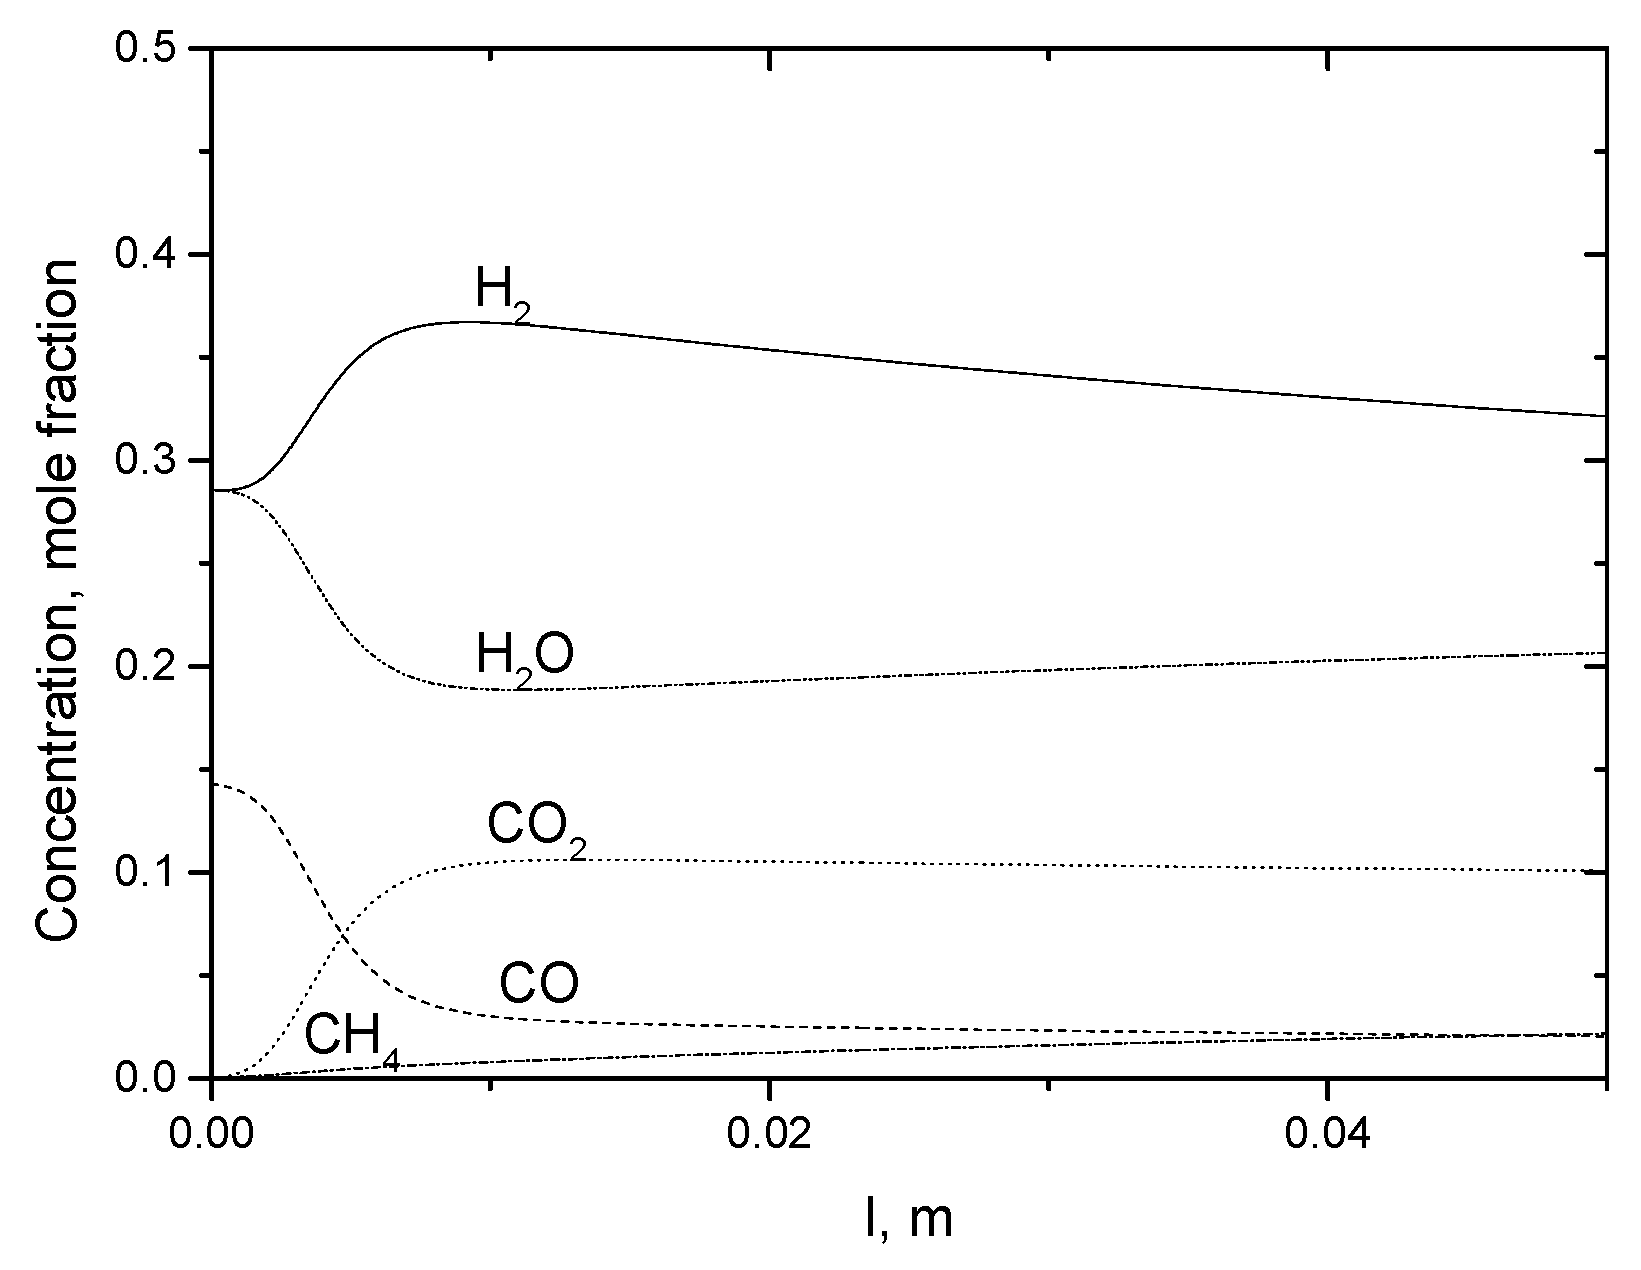
2.3.3. Microreactor Simulations

Mathematical simulations can reproduce the behavior of a reaction system under study using a mathematical model. It is a reliable way to explain and predict numerically the effect of inlet compositions and operating conditions in scaled-up reactors, which can be also extended to industrial applications.
The developed reaction kinetics is used as baseline for these simulations of the WGS reaction in the microchannel reactor. The microreactor modeling with Comsol Multiphysics package was performed in an analogous way as it was published in the paper [49]. Mathematical simulation is done on the base of two-phase model. The model takes into account the convective heat and mass transfer in the gas phase of the reactor channels, changes in both concentrations and temperature due to Reactions (1) and (2) in the solid phase, the heat exchange with oven and axial thermal conductivity of the solid phase of microreactor, heat and mass exchange between gas and solid phases. The assumptions made are as follows: the steady state flow is considered for the reactor operation; ideal incompressible gas flaw is assumed; fully developed laminar flow is employed, the pressure drop along the reactor is neglected and the static pressure at the outlet is zero. The ambient temperature is assumed to be uniform as set by the external furnace. The temperature and composition are dependent on the thermo-physical properties and species mass sources.
Gas phase species balances:
ε u Y g i z = S v β ( z ) ( Y s i Y g i ) ,   i = 1 , 6 ,
where 1—CO, 2—CO2, 3—CH4, 4—H2, 5—H2O, 6—N2.
Solid phase species balances:
S v β ( z ) ( Y s i Y g i ) + ( 1 ε ) V m ν i j W j = 0 ,   i = 1 , 6 ,
Gas phase energy balance:
c p u 0 T g z = S v α ( z ) ( T s T g ) ,
Solid phase energy balance:
( 1 ε ) λ s 2 T s z 2 S v α ( z ) ( T s T g ) + ( 1 ε ) Q j W j + S e x t α e x t ( T f u r n a c e T s ) = 0 ,
Boundary conditions:
z = 0 :   T g = T g i n ,   Y g i = y g i i n ,   λ s T s z = 0
z = L : λ s T s z = 0 .
  • ygi—concentrations in gas phase, mole fraction;
  • ysi—concentrations in solid phase, mole fraction;
  • u—velocity of gas, m/s;
  • ɛ—catalyst fraction;
  • Sv—the specific surface-to-volume ratio in the channel, m−1,
  • β—mass transfer coefficient, m/s;
  • cp—gas heat capacity, J m−3 K−1;
  • cs—catalyst heat capacity, J m−3 K−1;
  • Tg—gas phase temperature, К;
  • Ts—solid phase temperature, К;
  • α—mass transfer coefficient, m/s;
  • Tfurnace—temperature in the furnace, К;
  • λ—thermal conductivity of the catalyst;
  • L—reactor length;
  • Vm—molar volume, m3 mol−1.
The mass transfer and heat transfer coefficients were evaluated from the correlations (15) for Nu and Sh numbers [44]. The reaction rate constants for the WGS Reaction (1) (Table 3) and methanation Reaction (2) (Table 8) were adapted to be suitable the computational domain (Table 9).
The simulation results obtained with the proposed kinetics for the Ni/CeO2 catalyst allow direct comparison of experimental and computational results for given operating conditions. The main results are given in Figure 16, Figure 17 and Figure 18.
Graphs of predicted concentrations CO and CO2 in the product gas versus reaction temperature are in good agreement with the experimental observations. Again, the macrokinetic model (4) does not predict the actual kinetic behavior of the methanation reaction.
The microreactor operates under forward WGS feed conditions. The feed gas mixture was far non-stoichiometric. Both experimental results and simulation data show that due to a large excess of water and hydrogen in the feed CO conversion and CO2 concentration in the product gas as a function of the temperature during WGS reaction reach the maximum beyond which the system reaches equilibrium.
The simulations of the temperature in gas/solid phase and species concentrations in the reactor channel length are shown in Figure 17 and Figure 18. It can be seen that for the given operational conditions and the channel length the residence time is not sufficient to reach the steady state.

3. Materials and Methods

3.1. Ni/CeO2 Catalysts Preparation and Characterization

Cerium oxide was prepared via the organic polymerized complex method, which is a modified version of the polymeric precursor method suggested by Pechini. The modified preparation procedures described earlier [50,51]. This method of preparing catalysts enables homogeneous oxides, in particular CeO2 with a fluorite structure, to have well-controlled properties and a high surface area. In particular, aqueous solutions of cerium nitrate Ce(NO3)3, citric acid (CA), ethylene glycol (EG), and ethylenediamine (ED) were employed to synthesize ceria. The ethylene glycol and citric acid were used as complex formation reagents, ethylenediamine was chosen as additional complex builder as it enhances uniformity. The molar ratio of precursors CA:EG:ED:Metal = 375:1125:375:1 were used in the preparation of the sol solution. Citric acid has been firstly dissolved in ethylene glycol at a ratio of CA:EG = 1:3 at 60 °C. Aqueous Ce(NO3)3 was dissolved in small amounts of distilled water. Ethylenediamine has then been added drop-by-drop at room temperature into the solution obtained after mixing Ce(NO3)3 solution and CA/EG mixture. After 2 h, the mixture has been heated above 100 °C to evaporate any trace of water. A very dark and viscous product has been obtained after 4–5 days of polymerization. This petrol-like mass has been further calcined in an air flow furnace at 700 °C for 4 h. Nickel was supported by the incipient wetness impregnation with Ni(NO3)2 aqueous solution, followed by drying and calcination for 2 h at 300 °C. Nickel loading in Ni/CeO2 catalysts was varied between 5 to 12.5 wt %.
The specific surface area of catalysts was determined by using Ar thermodesorption data obtained on a SORBI-M instrument by the BET (Brunauer, Emmett, Teller) method. Powdered catalysts were characterized by X-ray diffraction (XRD) using a Bruker D8 Advance diffractometer (CuKα radiation in 2Θ scanning range 15–90° with step 0.05°). Transmission electron microscopy (TEM) micrographs were obtained with a JEM-2010 instrument (lattice resolution 1.4 Å, acceleration voltage 200 kV).
Catalyst-loaded microchannel plates were prepared by the cold-pressing method [52,53]. Foamed nickel (JSC “Novomet-Perm”, Permsky kray, Russia) (open porosity 0.8, average size of a structural cell 0.25 mm, specific surface area 10 m2·g−1) was used as a precursor for the microchannel plates. The foamed nickel plates with thickness of 2–3 mm were exposed to ultrasonic treatment in suspension of Ni/CeO2 catalyst in ethanol to incorporate catalyst in pores of foamed nickel. Ethanol to catalyst ratio was 2:1, average catalyst particles size was <10 micrometers. After drying in air, the plates were cold-pressed at 250 atm using special designed engraved die. As a consequence, 12 parallel channels of 50 mm long with cross sections of 0.5 × 0.2 mm were formed in each plate of size 20 × 50 mm and thickness 0.5 mm. The channel wall thickness, or the spacing between two channels, is fixed at 1 mm. Overviews of the microchannel plate and the microreactor under study are presented in Figure 19. The weight of the incorporated catalyst was determined by weighing the plate before and after the catalyst loading procedure. The total catalyst loading for an assembly of four microchannel plates was about 0.8 g.

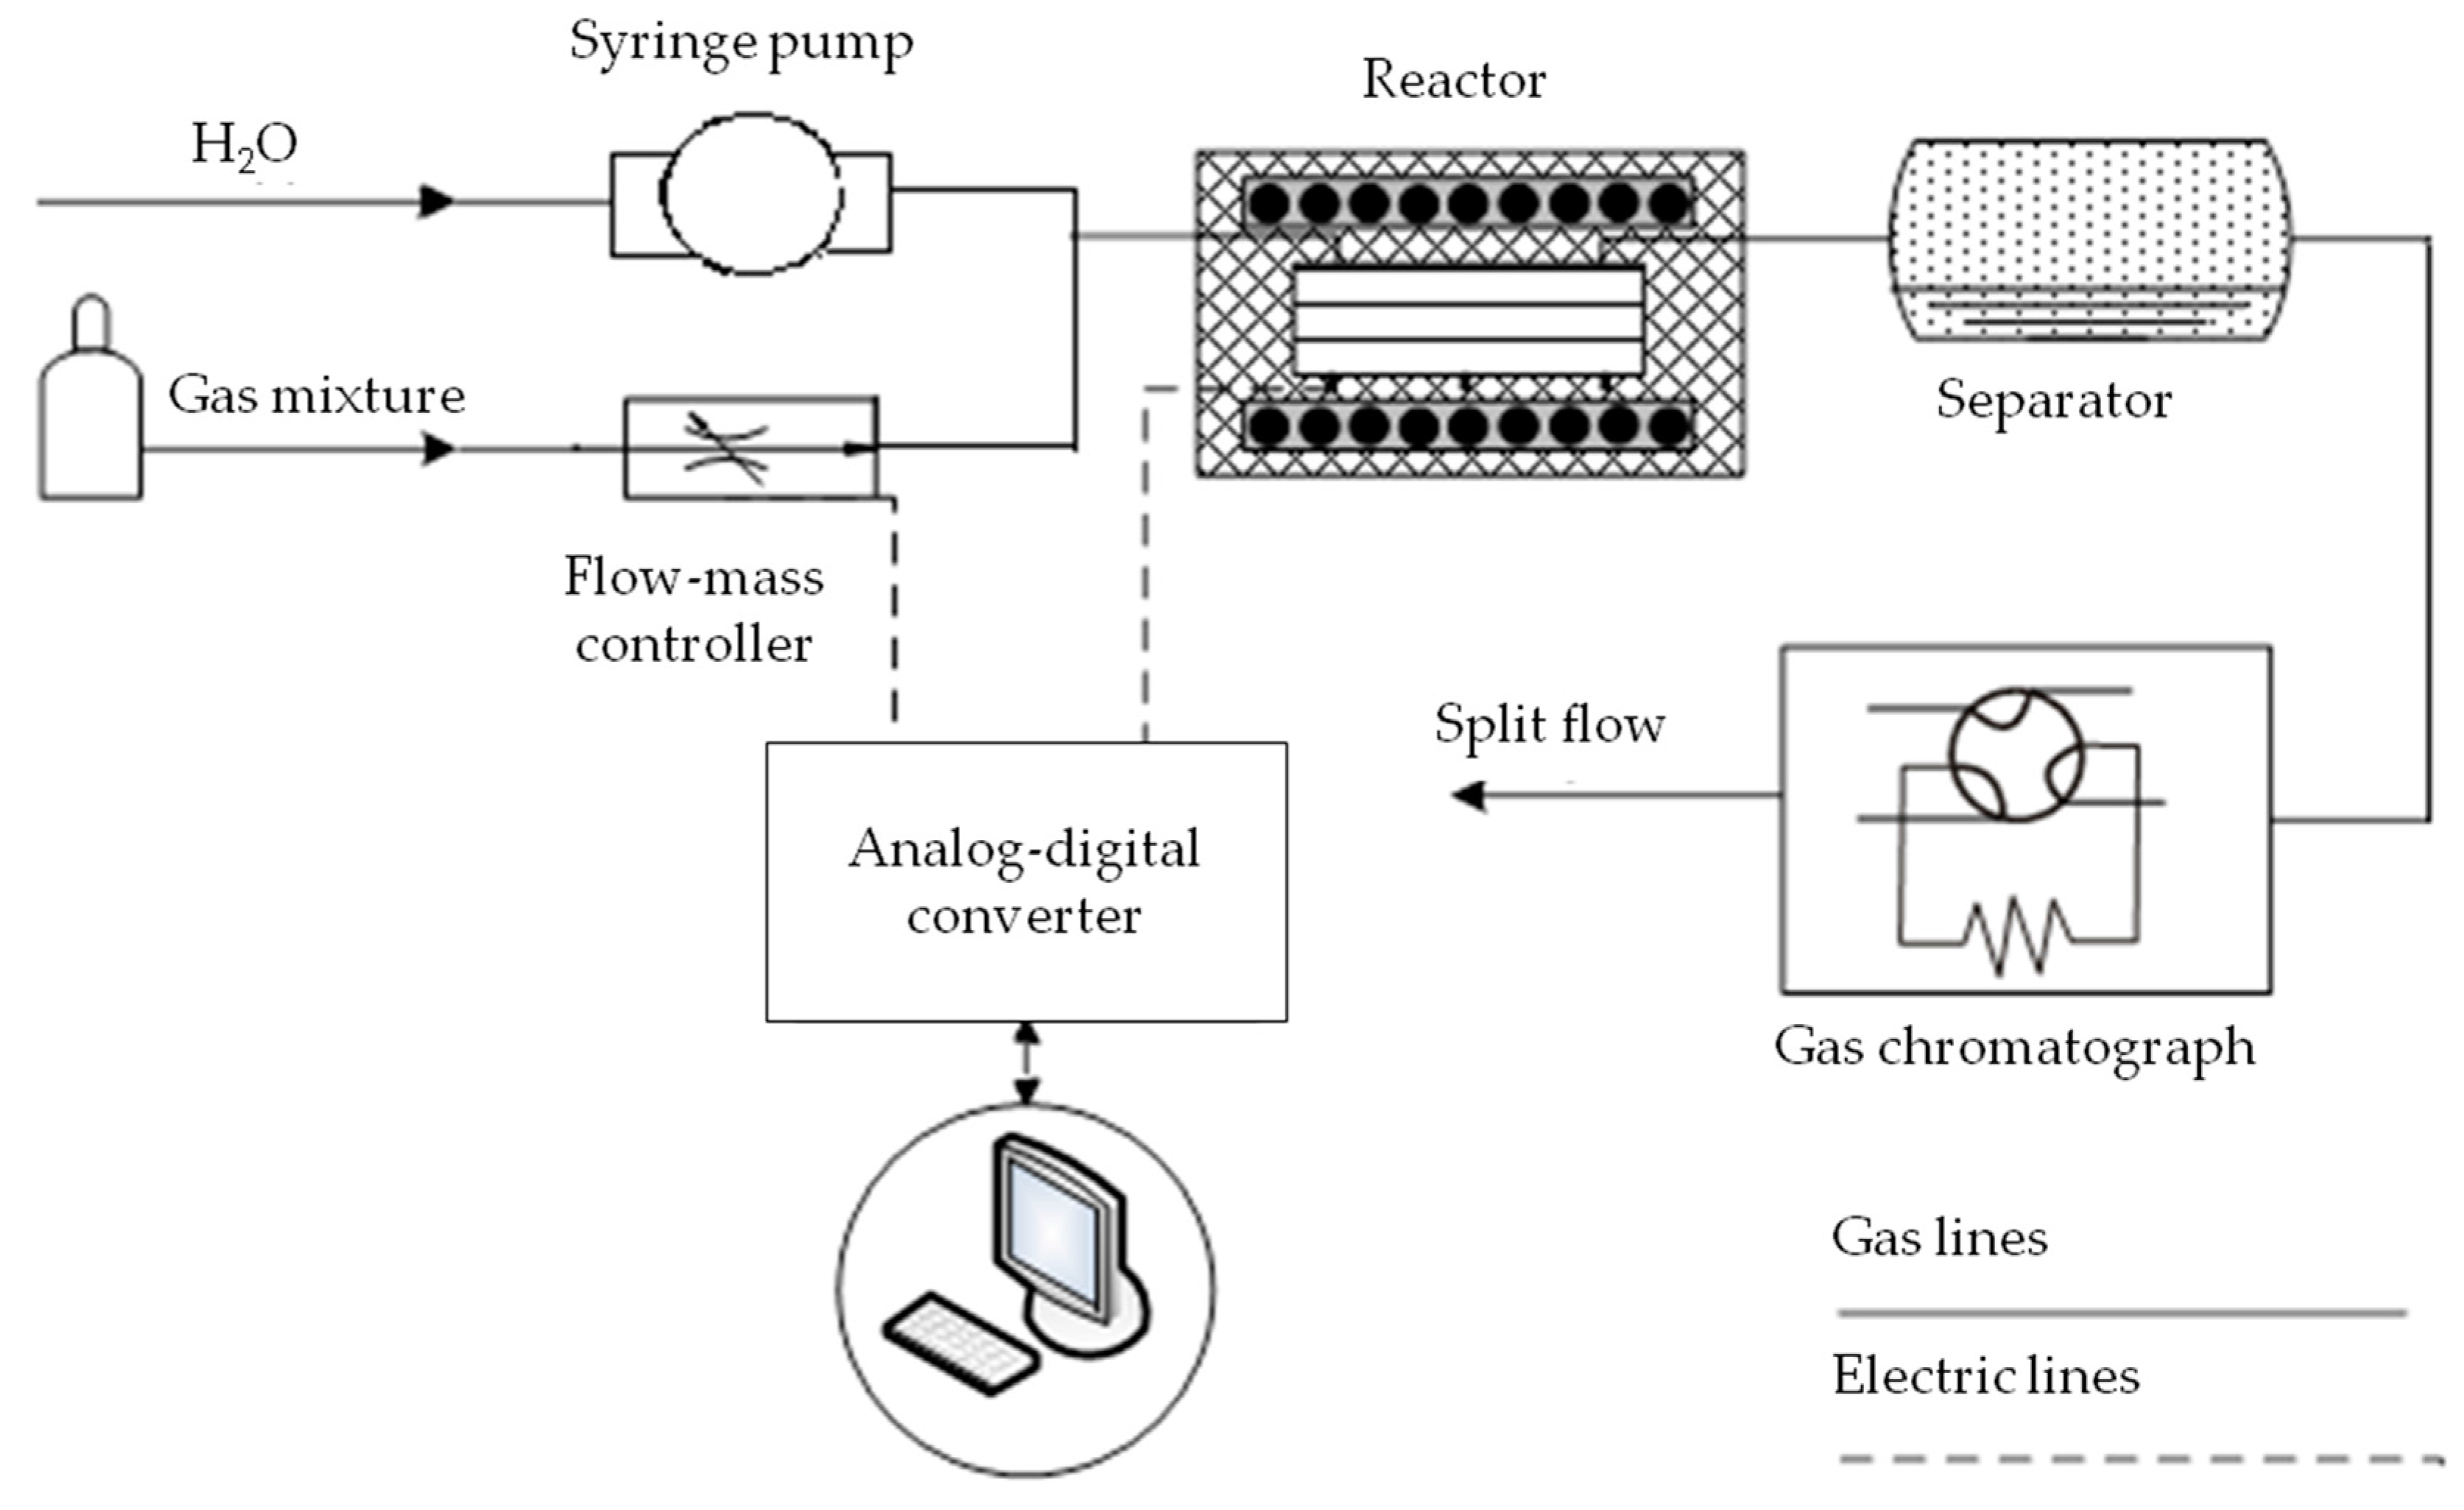
3.2. Catalyst Testing

Catalytic activity was studied by using a fixed-bed reactor in a computer-controlled flow installation. The catalysts were not activated prior to testing. The feeding gas (10 L/h) was a mixture of 1% CO + 1.8% H2O in Не. In order to improve the isothermicity of the bed, a Ni/CeO2 catalyst sample (0.1 g) of fraction 0.25–0.5 mm was well mixed with quartz sand (0.9 mL) of fraction 0.5–1 mm. Reactant and product concentrations were measured on-line with a Test-201 (Bonair, Novosibirsk, Russia) gas analyzer equipped with IR absorbance, electrochemical and polarographic sensors.
Catalytic activity of microchannel plates was studied in the setup developed in the lab (schematic view is shown on Figure 20) with a specially designed reactor at atmospheric pressure and temperature 250–550 °C using the feed mixture H2:N2:CO:H2O = 2:2:1:2. The total volume of the microchannel plate assembly was about 2 cm3. The experimental reactor with the size of 52 × 22 × 4 mm was made of heat-resistant stainless steel and sealed by welding. The mixture comprising of H2, N2, CO with 2:2:1 mol ratio was fed into reactor by using a flow-mass controller (RRG-10, Eltochpribor, Moscow, Russia). Water was supplied by a syringe pump (WZS-50F6, Sensitec, The Netherlands). The feed supply rates was varied, and the volumetric flow rate was equal to 7, 14, and 21 mL/s (GHSV = 17,640, 35,280, and 52,920 h−1).
The complete microchannel reactor was surrounded by an electric tubular furnace for heating and thermal insulation. Proportional-Integral-Derivative (PID) automatic control of the temperature was performed using an automatic PID regulator (Termodat 13KT2, Perm, Russia). A thermocouple was inserted inside the reactor body to measure the actual reaction temperature. Temperature maintenance precision was about 0.5 °C. Analog-digital converter ADAM4019 (Advantech Co., Ltd., Taipei, Taiwan) with LabView 2009 (National Instruments, Inc., Austin, TX, USA.) was used to collect data and control the temperature and flow rate. The outlet reaction mixture passed through a cold trap to remove water and remaining gas mixture was analyzed by gas chromatography (LKhM-8MD, Moscow, Russia). Analysis was performed using a CaA zeolite column for H2, N2, CH4, CO and Porapaq Q column for CO2, with argon as the carrier gas, at room temperature.

4. Conclusions

Nickel–ceria catalysts with nickel loading of 5–12.5 wt % were prepared and studied in water–gas shift reaction both as fractions in the model diluted feed and as supported layers in a microchannel reactor at GHSV = 17,640, 35,280 and 52,920 h−1 in real feeds with the excess of water and hydrogen. The most active catalysts were found to contain 10 and 12.5 wt % Ni. Formation of methane was observed at temperatures above 320–340 °C. Nevertheless, selectivity towards CO2 remained high enough, up to 70–80%. The activity of the prepared nickel–ceria catalysts was sufficiently high in comparison with the literature data for rare-earth metal-based catalysts tested in microchannel conditions. The catalysts can be used as a basic system. Promotion with Mo, Pt, Ru, etc. could increase the sulfur resistance. During prolonged testing (up to two weeks) of developed catalysts in microchannel reactor in real feeds, including start-up–shutdown procedures, no deactivation was observed. Hence, the middle-term stability of these catalysts is sufficient. The catalysts have the potential for their further optimization toward the practical applications.

Acknowledgments

The work was carried out with the financial support of the Ministry of Education and Science of the Russian Federation under the Agreement 14.616.21.0036, unique agreement ID RFMEFI61615X0036. Simulation of the WGS reaction was carried out in frames of budget project No 0303-2016-0013 for Boreskov Institute of Catalysis.

Author Contributions

N.M. prepared and characterized catalysts for studies; D.A., L.M. and A.G. prepared catalyst-loaded microchannel plates and performed catalytic experiments in microchannel reactor; N.M. and M.S. performed experiments in fixed-bed reactor; L.B. and E.I. analyzed the data and carried out kinetic modeling; L.B., M.S. and V.S. wrote the paper; V.S. carried out the general management of work.

Conflicts of Interest

The authors declare no conflict of interest.

References

  1. Ledjeff-Hey, K.; Roes, J.; Wolters, R. CO2-scrubbing and methanation as purification system for PEFC. J. Power Sources 2000, 86, 556–561. [Google Scholar] [CrossRef]
  2. Minyukova, T.P.; Itenberg, I.S.; Khassin, A.A.; Sipatrov, A.G.; Dokuchits, E.V.; Terent’ev, V.Y.; Khristolyubov, A.P.; Brizitskii, O.F.; Yurieva, T.M. Permeable composite material for compact apparatus for hydrogen-rich gases deep cleaning from CO. Chem. Eng. J. 2007, 134, 235–238. [Google Scholar] [CrossRef]
  3. Stankiewicz, A.I.; Moulijn, J.A. Process intensification: Transforming chemical engineering. Chem. Eng. Prog. 2000, 96, 22–34. [Google Scholar]
  4. Ehrfeld, W.; Hessel, V.; Löwe, H.B. State of the Art of Microreaction Technology. In Microreactors: New Technology for Modern Chemistry; Wiley-VCH Verlag GmbH & Co. KGaA: Weinheim, Germany, 2000; ISBN 9783527295906. [Google Scholar]
  5. Smith, R.J.; Loganathan, M.; Shantha, M.S. A review of the water gas shift reaction kinetics. Int. J. Chem. React. Eng. 2010, 8. [Google Scholar] [CrossRef]
  6. Membrane Reactors for Energy Applications and Basic Chemical Production. In Woodhead Publishing in Energy; Basile, A.; Di Paola, L.; Hai, F.; Piemonte, V. (Eds.) Elsevier Ltd.: Cambridge, UK, 2010; Volume 76, ISBN 978-1-78242-223-5. [Google Scholar]
  7. Schumacher, N.; Boisen, A.; Dahl, S.; Gokhale, A.A.; Kandoi, S.; Grabow, L.C.; Dumesic, J.A.; Mavrikakis, M.; Chorkendorff, I. Trends in low-temperature water-gas shift reactivity on transition metals. J. Catal. 2005, 229, 265–275. [Google Scholar] [CrossRef]
  8. Pinaeva, L.G.; Sadovskaya, E.M.; Ivanova, Y.A.; Kuznetsova, T.G.; Prosvirin, I.P.; Sadykov, V.A.; Schuurman, Y.; van Veen, A.C.; Mirodatos, C. Water gas shift and partial oxidation of CH4 over CeO2–ZrO2 (–La2O) and Pt/CeO2–ZrO2 (–La2O3): Performance under transient conditions. Chem. Eng. J. 2014, 257, 281–291. [Google Scholar] [CrossRef]
  9. Li, Y.; Fu, Q.; Flytzani-Stephanopoulos, M. Low-temperature water-gas shift reaction over Cu- and Ni-loaded cerium oxide catalysts. Appl. Catal. B Environ. 2000, 27, 179–191. [Google Scholar] [CrossRef]
  10. Jacobs, G.; Chenu, E.; Patterson, P.M.; Williams, L.; Sparks, D.; Thomas, G.; Davis, B.H. Water-Gas Shift: Comparative Screening of Metal Promoters for Metal/Ceria Systems and Role of the Metal. Appl. Catal. A Gen. 2004, 258, 203–214. [Google Scholar] [CrossRef]
  11. Czekaj, I.; Loviat, F.; Raimondi, F.; Wambach, J.; Biollaz, S.; Wokaun, A. Characterization of surface processes at the Ni-based catalyst during the methanation of biomass-derived synthesis gas: X-ray photoelectron spectroscopy (XPS). Appl. Catal. A Gen. 2007, 329, 68–78. [Google Scholar] [CrossRef]
  12. Haryanto, A.; Fernando, S.D.; Filip To, S.D.; Steele, P.H.; Pordesimo, L.; Adhikari, S. High Temperature Water Gas Shift Reaction over Nickel Catalysts for Hydrogen Production: Effect of Supports, GHSV, Metal Loading, and Dopant Materials. J. Thermodyn. Catal. 2011, 2, 106. [Google Scholar] [CrossRef]
  13. Pastor-Pérez, L.; Reina, T.R.; Ivanova, S.; Centeno, M.A.; Odriozola, J.A.; Sepúlveda-Escribano, A. Ni-CeO2/C Catalysts with enhanced OSC for the WGS reaction. Catalysts 2015, 5, 298–309. [Google Scholar] [CrossRef] [Green Version]
  14. Barrio, L.; Kubacka, A.; Zhou, G.; Estrella, M.; Martínez-Arias, A.; Hanson, J.C.; Fernández-García, M.; Rodriguez, J.A. Unusual physical and chemical properties of Ni in Ce1−xNixO2−y oxides: Structural characterization and catalytic activity for the water gas shift reaction. J. Phys. Chem. C 2010, 114, 12689–12697. [Google Scholar] [CrossRef]
  15. Pastor-Pérez, L.; Buitrago-Sierra, R.; Sepúlveda-Escribano, A. CeO2-promoted Ni/activated carbon catalysts for the water–gas shift (WGS) reaction. Int. J. Hydrogen Energy 2014, 39, 17589–17599. [Google Scholar] [CrossRef]
  16. Tang, K.; Liu, W.; Li, J.; Guo, J.; Zhang, J.; Wang, S.; Niu, S.; Yang, Y. The Effect of Exposed Facets of Ceria to the Nickel Species in Nickel-Ceria Catalysts and Their Performance in a NO + CO Reaction. ACS Appl. Mater. Interfaces 2015, 7, 26839–26849. [Google Scholar] [CrossRef] [PubMed]
  17. Zyryanova, M.M.; Snytnikov, P.V.; Amosov, Y.I.; Ven’yaminov, S.A.; Golosman, E.Z.; Sobyanin, V.A. Selective Methanation of CO in the Presence of CO2 in Hydrogen-Containing Mixtures on Nickel Catalysts. Kinet. Catal. 2010, 51, 907–913. [Google Scholar] [CrossRef]
  18. Zyryanova, M.M.; Snytnikov, P.V.; Gulyaev, R.V.; Amosov, Y.I.; Boronin, A.I.; Sobyanin, V.A. Performance of Ni/CeO2 Catalysts for Selective CO Methanation in Hydrogen-Rich Gas. Chem. Eng. J. 2014, 238, 189–197. [Google Scholar] [CrossRef]
  19. Konishcheva, M.V.; Potemkin, D.I.; Snytnikov, P.V.; Zyryanova, M.M.; Pakharukova, V.P.; Simonov, P.A.; Sobyanin, V.A. Selective CO Methanation in H2-Rich Stream over Ni–, Co– and Fe/CeO2: Effect of Metal and Precursor Nature. Int. J. Hydrogen Energy 2015, 40, 14058–14063. [Google Scholar] [CrossRef]
  20. Alstrup, I. On the Kinetics of Co Methanation on Nickel Surfaces. J. Catal. 1995, 151, 216–225. [Google Scholar] [CrossRef]
  21. Yadav, R.; Rinker, R.G. Step-Response Kinetics of Methanation over a Ni/Al2O3 Catalyst. Ind. Eng. Chem. Res. 1992, 31, 502–508. [Google Scholar] [CrossRef]
  22. Ramaroson, E.; Tempere, J.F.; Guilleux, M.F. Spectroscopic characterization and reactivity study of ceria-supported nickel catalysts. J. Chem. Soc. Faraday Trans. 1992, 88, 1211–1218. [Google Scholar] [CrossRef]
  23. Herrmann, J.M.; Ramaroson, E.; Tempere, J.F.; Guilleux, M.F. Semiconductivity study of ceria-supported nickel related to its methanation catalytic activity. Appl. Catal. 1989, 53, 117–134. [Google Scholar] [CrossRef]
  24. Andersson, M.P.; Abild-Pedersen, F.; Remediakis, I.N.; Bligaard, T.; Jones, G.; Engbæk, J.; Lytken, O.; Horch, S.; Nielsen, J.H.; Sehested, J.; et al. Structure sensitivity of the methanation reaction: H2-induced CO dissociation on nickel surfaces. J. Catal. 2008, 255, 6–19. [Google Scholar] [CrossRef]
  25. Ermakova, A. Methods of Applied Thermodynamics, Employed for Mathematical Simulation of Chemical Processes and Reactors; Teaching medium; Boreskov Institute of Catalysis, Siberian Branch of the Russian Academy of Sciences: Novosibirsk, Russia, 2002. (In Russian) [Google Scholar]
  26. Fadeev, S.I.; Ermakova, A.; Ivanov, E.A.; Gudkov, A.V. The calculation of thermodynamic equilibrium of gas phase processes by parameter marching method. Theor. Found. Chem. Technol. 1997, 31, 62–67. (In Russian) [Google Scholar]
  27. Ermakova, A. Macrokinetic models of complex reactions. In Industrial Catalysis in Lectures; Noskov, A.S., Ed.; Kalvis: Moscow, Russia, 2006; Volume 4, pp. 67–114. ISBN 5895300049. (In Russian) [Google Scholar]
  28. Ermakova, A. Macrokinetic models of complex reactions. In Investigation Methods of Chemical Reactions Kinetics; Parmon, V.N., Ed.; Boreskov Institute of Catalysis: Novosibirsk, Russia, 2000; pp. 5–52. (In Russian) [Google Scholar]
  29. Ermakova, A. Macrokinetics Methods Used in Mathematical Modeling of Chemical Processes and Reactors; Institut Kataliza SO RAN im. G.K. Boreskova: Novosibirsk, Russia, 2001. (In Russian) [Google Scholar]
  30. Shekhawat, D.; Spivey, J.J.; Berry, D.A. Fuel Cells: Technologies for Fuel Processing; Elsevier: Oxford, UK, 2011; ISBN 978-0-444-53563-4. [Google Scholar]
  31. Goerke, O.; Pfeifer, P.; Schubert, K. Water gas shift reaction and selective oxidation of CO in microstructures. Appl. Catal. A Gen. 2004, 263, 11–18. [Google Scholar] [CrossRef]
  32. Carrasco, J.; López-Durán, D.; Liu, Z.; Duchoň, T.; Evans, J.; Senanayake, S.D.; Crumlin, E.J.; Matolín, V.; Rodríguez, J.A.; Ganduglia-Pirovano, M.V. In situ and theoretical studies for the dissociation of water on an active Ni/CeO2 catalyst: Importance of strong metal-support interactions for the cleavage of O-H bonds. Angew. Chem. Int. Ed. 2015, 54, 3917–3921. [Google Scholar] [CrossRef] [PubMed]
  33. Kolb, G.; Baier, T.; Schürer, J.; Tiemann, D.; Ziogas, A.; Specchia, S.; Galletti, C.; Germani, G.; Schuurman, Y. A micro-structured 5 kW complete fuel processor for iso-octane as hydrogen supply system for mobile auxiliary power units. Part II—Development of water–gas shift and preferential oxidation catalysts reactors and assembly of the fuel processor. Chem. Eng. J. 2008, 138, 474–489. [Google Scholar] [CrossRef]
  34. Tonkovich, A.Y.; Zilka, J.L.; LaMont, M.J.; Wang, Y.; Wegeng, R.S. Microchannel reactors for fuel processing applications. I. Water gas shift reactor. Chem. Eng. Sci. 1999, 54, 2947–2951. [Google Scholar] [CrossRef]
  35. Germani, G.; Alphonse, P.; Courty, M.; Schuurman, Y.; Mirodatos, C. Platinum/ceria/alumina catalysts on microstructures for carbon monoxide conversion. Catal. Today 2010, 110, 114–120. [Google Scholar] [CrossRef] [Green Version]
  36. Adachi, H.; Ahmed, S.; Lee, S.H.D.; Papadias, D.; Ahluwalia, R.K.; Bendert, J.C.; Kanner, S.A.; Yamazaki, Y. A natural-gas fuel processor for a residential fuel cell system. J. Power Sources 2009, 188, 244–255. [Google Scholar] [CrossRef]
  37. Groppi, G.; Ibashi, W.; Tronconi, E.; Forzatti, P. Structured reactors for kinetic measurements in catalytic combustion. Chem. Eng. J. 2001, 82, 57–71. [Google Scholar] [CrossRef]
  38. Groppi, G.; Ibashi, W.; Tronconi, E.; Forzatti, P. Structured reactors for kinetic measurements under severe conditions in catalytic combustion over palladium supported systems. Catal. Today 2001, 69, 399–408. [Google Scholar] [CrossRef]
  39. Aris, R. The Mathematical Theory of Diffusion and Reaction in Permeable Catalyst; Clarendon Press: Oxford, UK, 1975; ISBN 0198519311. [Google Scholar]
  40. Hill, C.G. An Introduction to Chemical Engineering Kinetics and Reactor Design; Wiley: New York, NY, USA, 1977. [Google Scholar]
  41. Schmidt, D. The Engineering of Chemical Reactions, 2nd ed.; Oxford University Press: New York, NY, USA, 2005. [Google Scholar]
  42. Fogler, H.S. Elements of Chemical Reaction Engineering, 3rd ed.; Prentice-Hall International, Inc.: Upper Saddle River, NJ, USA, 2009; ISBN 013-9-73-785-5. [Google Scholar]
  43. Levenspiel, O. Chemical Reaction Engineering, 3rd ed.; Wiley: New York, NY, USA, 1999. [Google Scholar]
  44. Groppi, G.; Belloli, A.; Tronconi, E.; Forzatti, P. A comparison of lumped and distributed models of monolith catalytic combustors. Chem. Eng. Sci. 1995, 50, 2705–2715. [Google Scholar] [CrossRef]
  45. Dooling, D.J.; Rekoske, J.E.; Broadbelt, L.J. Microkinetic Models of Catalytic Reactions on Nonuniform Surfaces: Application to Model and Real Systems. Langmuir 1999, 15, 5846–5856. [Google Scholar] [CrossRef]
  46. Kelley, R.D.; Goodman, D.W. The Chemical Physics of Solid Surfaces and Heterogeneous Catalysis; King, D.A., Woodruff, D.P., Eds.; Elsevier: Amsterdam, The Netherlands, 1982; Volume 4, pp. 427–454. [Google Scholar]
  47. Kim, S.H.; Nam, S.-W.; Lim, T.-H.; Lee, H.-I. Effect of pretreatment on the activity of Ni catalyst for CO removal reaction by water–gas shift and methanation. Appl. Catal. B Environ. 2008, 81, 97–104. [Google Scholar] [CrossRef]
  48. Delgado, K.H.; Maier, L.; Tischer, S.; Zellner, A.; Stotz, H.; Deutschmann, O. Surface Reaction Kinetics for Oxidation and Reforming of H2, CO, and CH4 over Nickel-based Catalysts. Catalysts 2015, 5, 871–904. [Google Scholar] [CrossRef]
  49. Safronovich, E.S.; Gribovskii, A.G.; Vernikovskaya, N.V.; Ovchinnikova, E.V.; Makarshin, L.L.; Chumachenko, V.A. Realization of Highly Exothermal Processes in Micro-Channel Reactors: Experimental Studies and Mathematical Modeling. In Proceedings of the IV International Scientific School-Conference for Young Scientists in Memory of Professor L.N. Kurina “Catalysis: From Science to Industry”, Tomsk, Russia, 23–27 October 2016; Ivan Fedorov: Tomsk, Russia, 2016; p. 120. [Google Scholar]
  50. Sadykov, V.A.; Kuznetsova, T.G.; Frolova-Borchert, Y.V.; Alikina, G.M.; Lukashevich, A.I.; Rogov, V.A.; Muzykantov, V.S.; Pinaeva, L.G.; Sadovskaya, E.M.; Ivanova, Y.A.; et al. Fuel-rich methane combustion: Role of the Pt dispersion and oxygen mobility in a fluorite-like complex oxide support. Catal. Today 2006, 117, 475–483. [Google Scholar] [CrossRef]
  51. Kuznetsova, T.G.; Sadykov, V.A.; Moroz, E.M.; Trukhan, S.N.; Paukshtis, E.A.; Kolomiichuk, V.N.; Burgina, E.B.; Zaikovskii, V.I.; Fedotov, M.A.; Lunin, V.V.; et al. Preparation of Ce-Zr-O composites by a polymerized complex method. Stud. Surf. Sci. Catal. 2002, 143, 659–667. [Google Scholar] [CrossRef]
  52. Makarshin, L.L.; Gribovskij, A.G.; Andreev, D.V.; Parmon, V.N. Catalytic Micro-Passage Plates and Method of Their Making. Patent RU232,304,7, 27 April 2008. [Google Scholar]
  53. Makarshin, L.L.; Andreev, D.V.; Gribovskii, A.G.; Dutov, P.M.; Khantakov, R.M.; Parmon, V.N. Effect of the microchannel plate design on the capacity of methanol steam reformers. Kinet. Catal. 2007, 48, 765–771. [Google Scholar] [CrossRef]
Figure 1. XRD patterns for 5% Ni/CeO2 (1) and 10% Ni/CeO2 (2) catalysts. Reflections of NiO are denoted by NiO (hkl), those of CeO2 denoted by (hkl).
Catalysts 07 00310 g001
Figure 2. High-resolution TEM image (a) and EDX spectrum (b) of as-prepared 5% Ni/CeO2 sample.
Catalysts 07 00310 g002
Figure 3. High resolution TEM image (a) and EDX spectrum (b) of 5% Ni/CeO2 catalyst after reaction.
Catalysts 07 00310 g003
Figure 4. Catalytic performance of Ni/CeO2 catalysts with different nickel loading in WGS reaction with the feed 1% CO + 1.8% H2O in Не: (a) concentrations of CO and CO2; (b) concentration of CH4.
Catalysts 07 00310 g004
Figure 5. The effect of the temperature on equilibrium gas composition (in mole fraction) for the feed 0.01 CO + 0.018 H2O in He.
Catalysts 07 00310 g005
Figure 6. Comparison of experimentally determined (symbols) and numerically predicted (lines) mole fractions as a function of temperature for WGS in a fixed-bed reactor: (a) 5% Ni/CeO2; (b) 7.5% Ni/CeO2; (c) 10% Ni/CeO2; (d) 12.5% Ni/CeO2, solid lines = equilibrium composition at given temperatures for 1% CO + 1.8% H2O in Не.
Catalysts 07 00310 g006aCatalysts 07 00310 g006b
Figure 7. The parity plot of the calculated and experimental data on the outlet concentration (in mole fraction) of the fixed-bed reactor: (a) Y (CO); (b) Y (CO2).
Catalysts 07 00310 g007
Figure 8. Temperature dependence of CO conversion at GHSV = 17640 h−1 over catalysts with different nickel loading.
Catalysts 07 00310 g008
Figure 9. Temperature dependence of CO2 selectivity at GHSV = 17,640 h−1 over catalysts with different nickel loading.
Catalysts 07 00310 g009
Figure 10. Methane concentration as a function of temperature at the reactor outlet over catalysts with different nickel loading.
Catalysts 07 00310 g010
Figure 11. Effect of GHSV on CO conversion for catalysts with different nickel loading at 400 °C.
Catalysts 07 00310 g011
Figure 12. Effect of GHSV on selectivity to CH4 for catalysts with different nickel loading at 400 °C.
Catalysts 07 00310 g012
Figure 13. Effect of GHSV on selectivity to CO2 for catalysts with different nickel loading at 400 °C.
Catalysts 07 00310 g013
Figure 14. Correlation curves (thick black lines) between CO (a), CO2 (b), and CH4 (c) concentrations at 400 °C and the reference contact time calculated as a function of the catalyst loading.
Catalysts 07 00310 g014aCatalysts 07 00310 g014b
Figure 15. Comparison of experimental (symbols) and numerically predicted (lines) concentrations for WGS as a function of temperature: (a) CO, (b) CO2, (c) CH4 (feed stream—0.1429 CO + 0.2857 H2O + 0.2857 H2 in N2).
Catalysts 07 00310 g015
Figure 16. Comparison of experimentally and numerically predicted concentrations for WGS over the 12.5% Ni/CeO2 catalyst and equilibria for the given feed mixture as a function of temperature: (a) CO, (b) CO2, (c) CH4 (feed stream—14.29% CO + 28.57% H2O + 28.57% H2 in N2).
Catalysts 07 00310 g016
Figure 17. Temperature evolution in gas phase (Tgas) and solid phase (Tcatalyst) along the reactor length at the inlet temperature of 200 °C.
Catalysts 07 00310 g017
Figure 18. Species concentrations versus reactor length.
Catalysts 07 00310 g018
Figure 19. The microchannel reactor and catalyst-loaded microchannel plate.
Catalysts 07 00310 g019
Figure 20. Image of the experimental setup for the WGS reaction in the microchannel reactor.
Catalysts 07 00310 g020
Table 1. Specific surface area of catalyst samples.
No.Chemical CompositionSpecific Surface Area, m2·g−1
15% Ni/CeO282
27.5% Ni/CeO280
310% Ni/CeO275
412.5% Ni/CeO269
Table 2. Structural data for catalyst samples.
SamplePhase CompositionCell Parameter, Å X-ray Particle Size D, Å
5% Ni/CeO2CeO25.407135
NiO4.178115
10% Ni/CeO2CeO25.406125
NiO-180
Table 3. Kinetic parameters for the case of the fixed-bed reactor.
Reactionln k0Е, kJ/mol
CO + H2O → CO2 + H223.53 (+/−) 3.12108 (+/−) 14.1
Table 4. Feed characteristics of a four-component mixture.
InletH2N2COH2OGHSV, h−1
Q, cm3/s2.82.81.42.817,640
5.65.62.85.635,280
8.48.44.28.452,920
y0,i, mol/mol0.28640.28640.14290.2864
C0,i, mol/m312.7512.756.3812.75
Table 5. CO concentrations at the reactor outlet at different GHSV.
Ni Loading on CeO2 (wt %)CO Concentration, (%, Dry Basis)
GHSV = 17,640 h−1GHSV = 35,280 h−1GHSV = 52,920 h−1
400 °С450 °С400 °С
53.432.848.109.47
7.52.851.996.598.41
100.341.053.705.75
12.50.540.813.525.88
Table 6. Equilibrium constants calculated by the van’t Hoff equation.
ReactionK0ilnK0iЕeqi, kJ/mol
CO + H2O → CO2 + H21.350 × 10−2−4.3050238.038
CO + 3H2 → CH4 + H2O2.741 × 10−13−28.92531216.808
Table 7. Kinetic parameters for catalysts with different Ni loading in the microchannel reactor.
NoReactionNi Contentln k0iEi, kJ/mol
1CO + H2O5%7.109 ± 3.151.23 ± 16.5
2CO + 3 H25%5.206 ± 2.837.70 ± 16.8
1CO + H2O7.5%5.113 ± 2.842.13 ± 14.5
2CO +3 H27.5%3.760 ± 2.932.29 ± 17.3
1CO + H2O10%6.361 ± 4.547.37 ± 22.2
2CO +3 H210%1.788 ± 3.021.56 ± 17.3
1CO + H2O12.5%6.187 ± 3.647.86 ± 17.9
2CO + 3 H212.5%0.00056 ± 3.116.09 ± 17.8
Table 8. Optimized kinetic parameters for the WGS and methanation reactions in H2O- and H2-rich gases.
NoReactionNi contentln k0iEi, kJ/mol
1CO + H2O5%–12.5%5.241 ± 1.642.51 ± 7.9
2CO + 3 H25%–12.5%1.957 ± 1.523.33 ± 9.0
Table 9. Physical and computational domain of the simulated reactor and model settings.
CellDimensions
Catalysts 07 00310 i001Length—1.5 mm
Height—0.5 mm
Sv = 186.67 m−1
K1 = 1.95 × 10¹¹ × exp(-E1/(R × Tc)) mol·m−3·s−1
E1 = 109,600 J·mol−1
K2 = 0.856 × 10⁴ × exp(-E2/(R × Tc)) mol·m−3·s−1
E2 = 16,000 J·mol−1

