Article

Rare Earth-Promoted Nickel Oxide Nanoparticles as Catalysts for N2O Direct Decomposition

1
Center of Excellence for Advanced Materials Research (CEAMR), King Abdulaziz University, P.O. Box 80203, Jeddah 21589, Saudi Arabia
2
Chemistry Department, Faculty of Science, King Abdulaziz University, P.O. Box 80203, Jeddah 21589, Saudi Arabia
3
Institut Für Chemische Reaktionstechnik, Friedrich-Alexander-Universität Erlangen-Nürnberg, Egerlandstraße 3, Erlangen 91058, Germany
*
Author to whom correspondence should be addressed.
Catalysts 2016, 6(5), 70; https://doi.org/10.3390/catal6050070
Submission received: 31 March 2016 / Revised: 30 April 2016 / Accepted: 9 May 2016 / Published: 17 May 2016

Abstract

:
For this paper, a series of rare earth (Gd, La, Sm) promoted NiO catalysts were prepared by using the microwave-assisted precipitation method and tested for N2O direct decomposition. The obtained solids have been characterized by using various techniques. X-ray diffraction (XRD) results revealed that the incorporation of RE oxides into NiO significantly decreases its crystallite size. Field-emission scanning electron microscopy (SEM) and transmission electron microscopy (TEM) observations indicated that the addition of RE oxides swells the NiO particles yielding particles into a rice-like morphology. N2 adsorption studies showed a sharp surface area increase as well as mesoporosity development accompanied the RE incorporation. It was found that the RE oxides significantly enhance the NiO activity.

Graphical Abstract

1. Introduction

Due to the underestimation and lack of awareness of the potential contribution of N2O to environmental problems, it suffered for several decades from a lack of interest from scientists and politicians. In the mid-1990s, N2O was identified as a relatively strong greenhouse gas, a contributor to the destruction of ozone in the stratosphere. Since then, interest in it has grown [1,2,3,4].
Regarding its greenhouse effect, the estimated contribution of N2O to global warming is about 6% [3]. However, due to its long lifespan (~150 years), N2O has 21 and 310 times the global warming potential (GWP) of CH4 and CO2, respectively [3,4]. The identified N2O anthropogenic sources include agricultural as well as industrial processes. The major industrial processes are: (a) fossil fuels and biomass combustion; (b) inorganic industry: production of nitric acid (which is essential material in the fertilizer industry); and (c) organic industries: production of adipic acid (used in the production of Nylon 6,6 and 6,12, caprolactam, acrylonitrile, and glyoxal) [2,3,4]. Moreover, N2O is produced, in many cases, as a by-product in three-way catalysis (TWC) during the removal of NOx, CO, and hydrocarbons [2,3].
The studies dealing with N2O abatement have gained more attention after the citation of this gas as the second non-CO2 greenhouse gas in the Kyoto Protocol (December 1997). Direct catalytic N2O decomposition is considered a promising solution for N2O abatement. Various catalyst categories have been developed for N2O direct decomposition; among them metal oxides showed promising activity features. The activity of such catalysts is greatly influenced by the preparation method as well as the addition of some promoters. Excellent activity has been reported for Co3O4-based catalysts [5,6,7,8,9,10,11,12,13,14,15,16].Yan et al. [5,6] investigated the performance of series of MxCo1xCo2O4 (M = Mg, Ni, Zn) catalysts for N2O decomposition and compared it with bare Co3O4. The best performance was observed from Zn0.36Co0.64Co2O4, Mg0.54Co0.46Co2O4 and Ni0.74Co0.26Co2O4 catalysts. The dependence of the N2O decomposition activity of metal exchanged MCo2O4 (M = Cu, Ni) was investigated by Abu-Zied et al. [7,8]. Cu0.75Co0.25Co2O4 and Ni0.50Co0.50Co2O4 catalysts exhibited the highest activity. Moreover, the activity of these catalysts sharply decreased with increased calcination temperature [7,8]. Doping Co3O4-based catalysts with Ce, Zr, Ca, Sr, Ba, Li, Na, K and Cs ions promotes its activity markedly [9,10,11,12,13,14,15,16].
Recently, high N2O decomposition activities were reported for other metal oxide catalysts. For instance, Amrousse et al. [17,18] reported an improvement in N2O decomposition activity upon partial substitution for Fe3O4 of Co, Mn, and Zn ions, where the highest activities were obtained over Co0.6Fe0.4Fe2O4, Zn0.6Fe0.4Fe2O4, and Mn0.8Fe0.2Fe2O4 catalysts. For a series of MgxFe1–xFe2O4 catalysts, the best performance was obtained over the x = 0.6 catalyst [19]. Contrary to Co3O4-based spinel catalysts, doping the Mg0.6Fe0.4Fe2O4 catalysts with potassium ions has decreased its N2O decomposition activity. It was suggested that this could be due to reduction of both the surface iron oxides and the surface areas of the K-containing catalysts [19]. Promising N2O decomposition activity was reported for CuO promoted with cesium as well as rare earth oxides [20,21,22]. As for Co3O4, it was shown that the incorporation of alkali cations to NiO increases its activity in N2O decomposition [23,24]. The obtained activity order was: un-promoted << Li- << Na- < Cs- < K-promoted NiO catalysts. Moreover, these authors highlighted the importance of zero-valent Ni in enhancing the electron donating ability of these catalysts [23,24]. Wu et al. [25] reported superior activity from K-doped NiAl mixed oxide catalysts than Na- and Cs-doped ones during N2O decomposition. Bi-metal promoted NiO catalysts have also been investigated. In this context, Zhang et al. [26] reported a synergic effect upon doping NiO with Co and Ba ions, where the highest activity was observed over Co1.0Ba1.5Ni9 catalyst. This synergy was ascribed to the obtained catalysts surface area and active sites increase [26]. An enhancement effect was reported for doping NiO with Ce and Ba ions [27]. It was suggested that Ba ions weaken the Ni–O band, whereas the Ce ions increase the population of the active sites by increasing the catalyst surface area.
The literature review reveals the promising activity of doped NiO for N2O abatement. However, the promotion effect of rare earth oxides, other than cerium, on the activity of NiO catalyst has not yet been reported. The present investigation evaluates Gd, La, and Sm’s promotion of NiO catalyst for N2O decomposition. These catalysts were prepared using the microwave-assisted route for nickel and rare earth (RE) oxalates, followed by calcination at 500 °C. Various characterizing tools were employed to analyze the synthesized catalysts. Discussions follows concerning the effect of the added RE ions on the structural and the catalytic performance of NiO.

2. Results

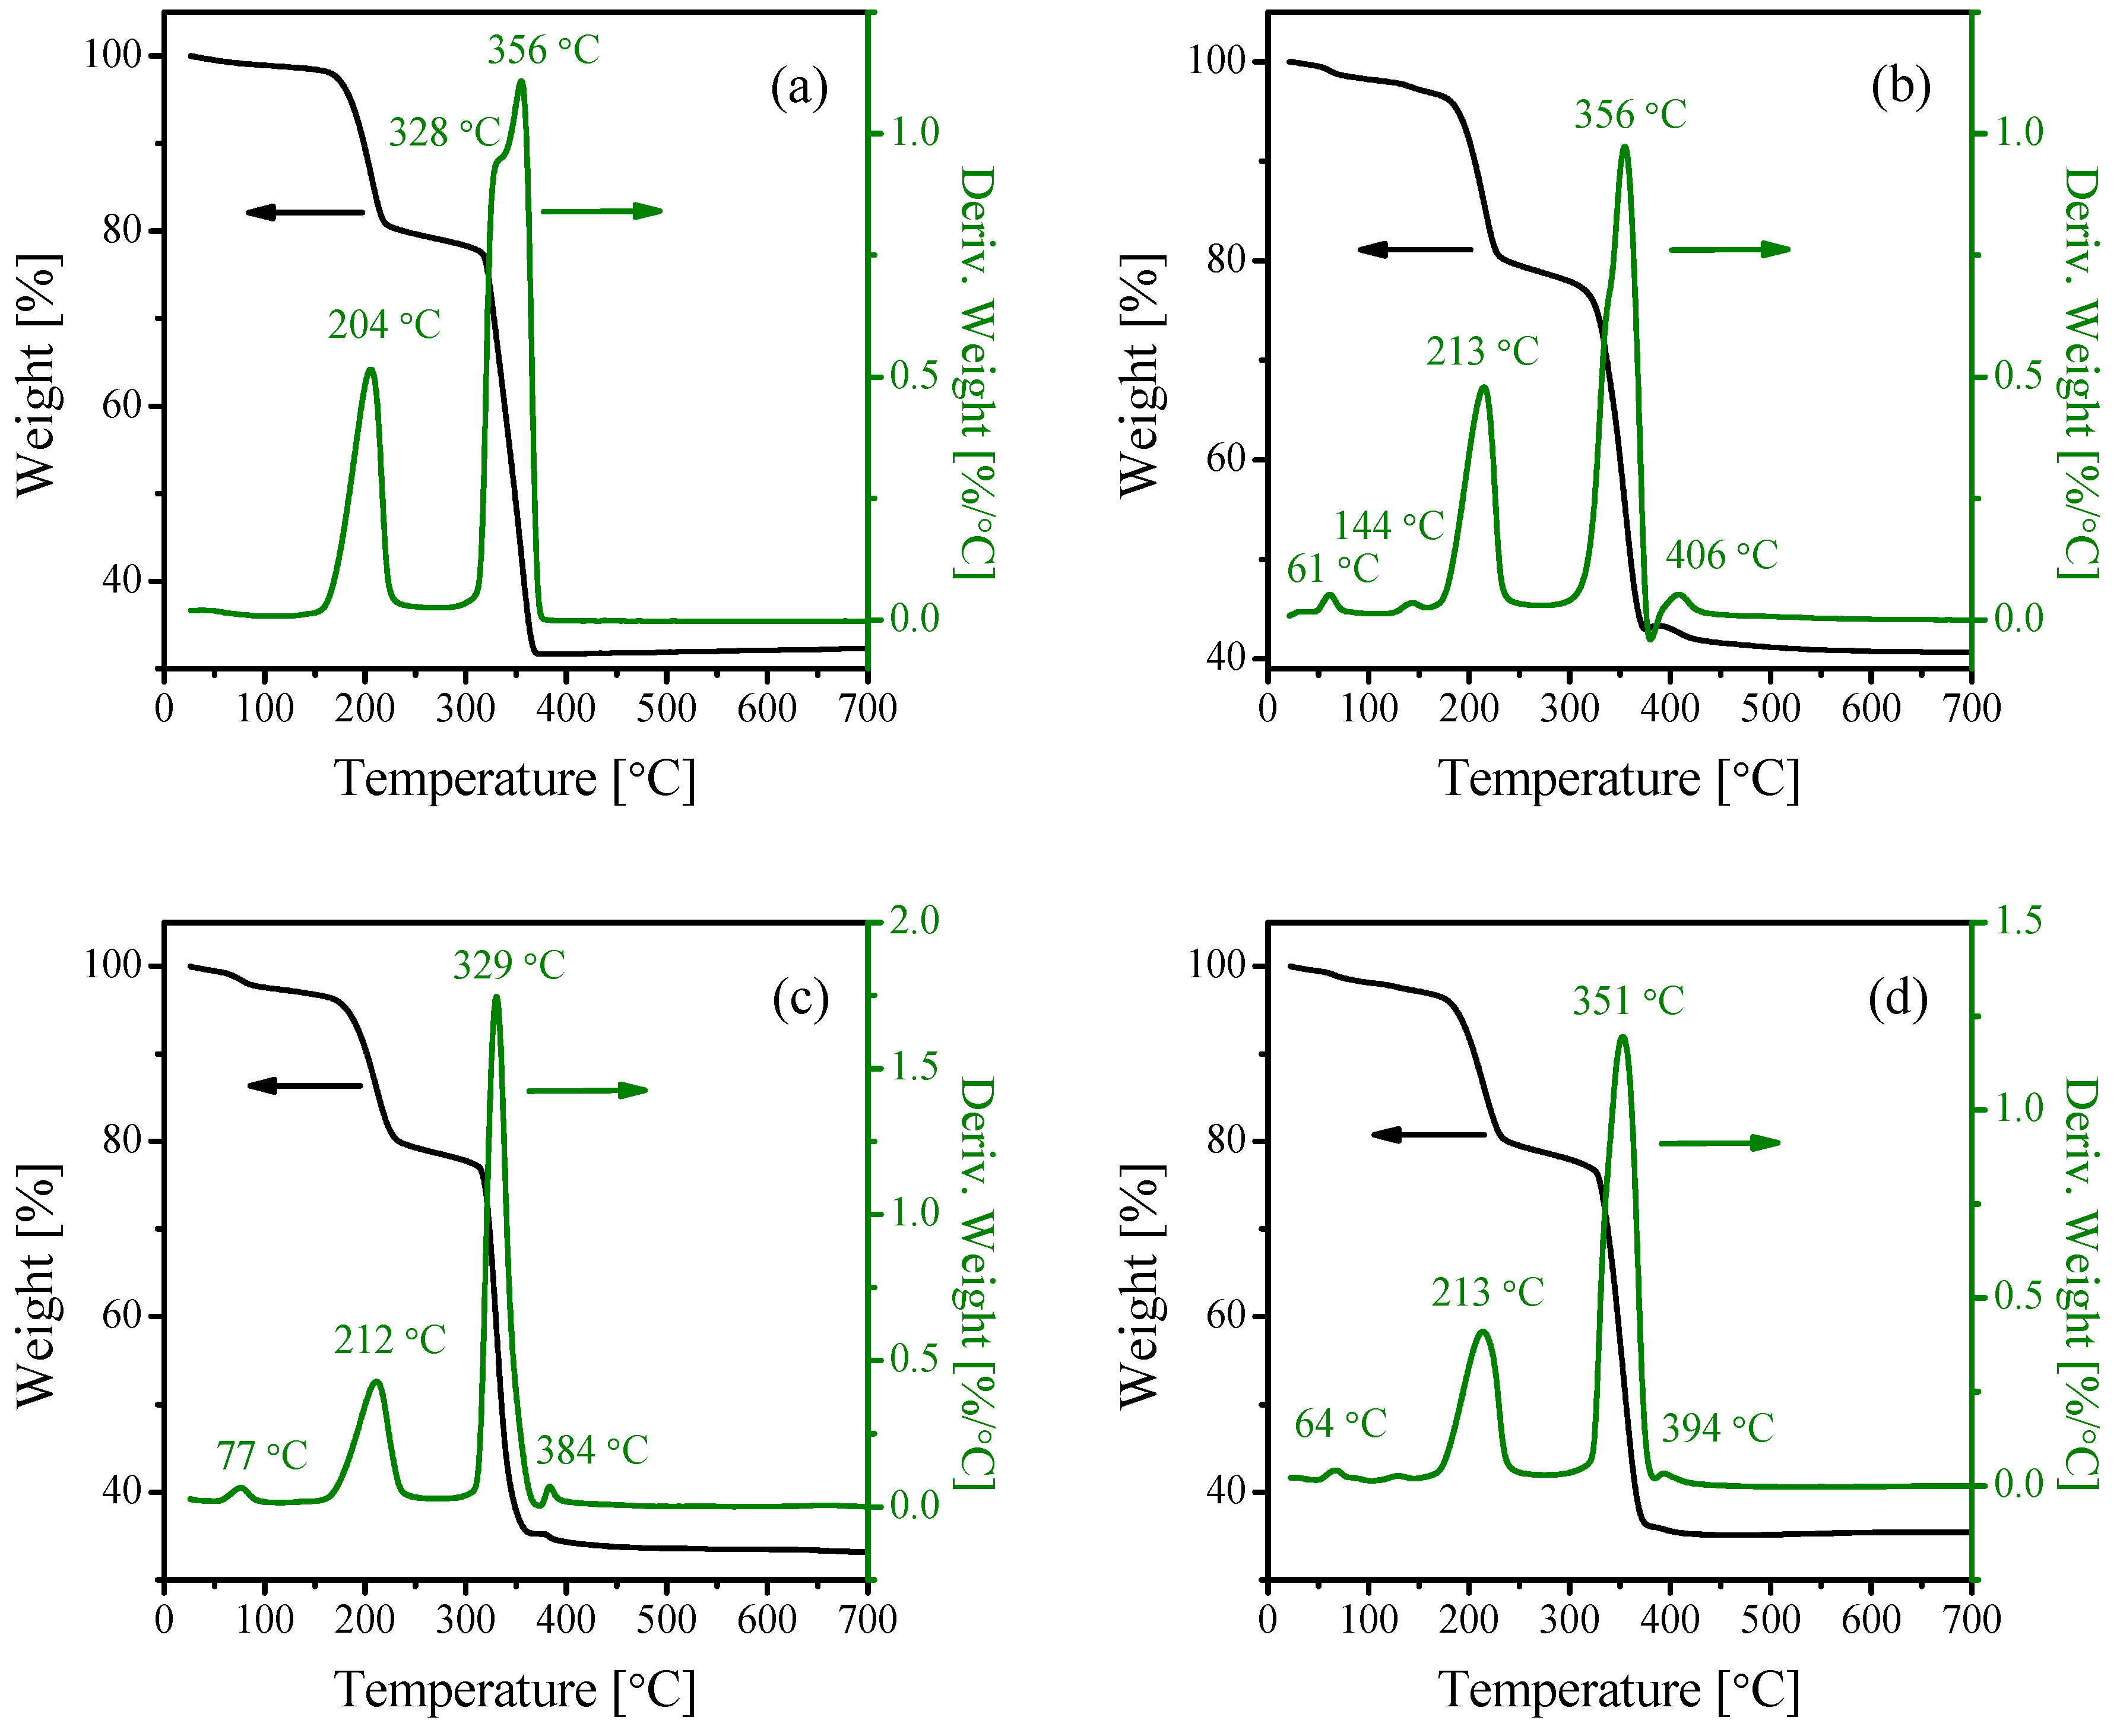
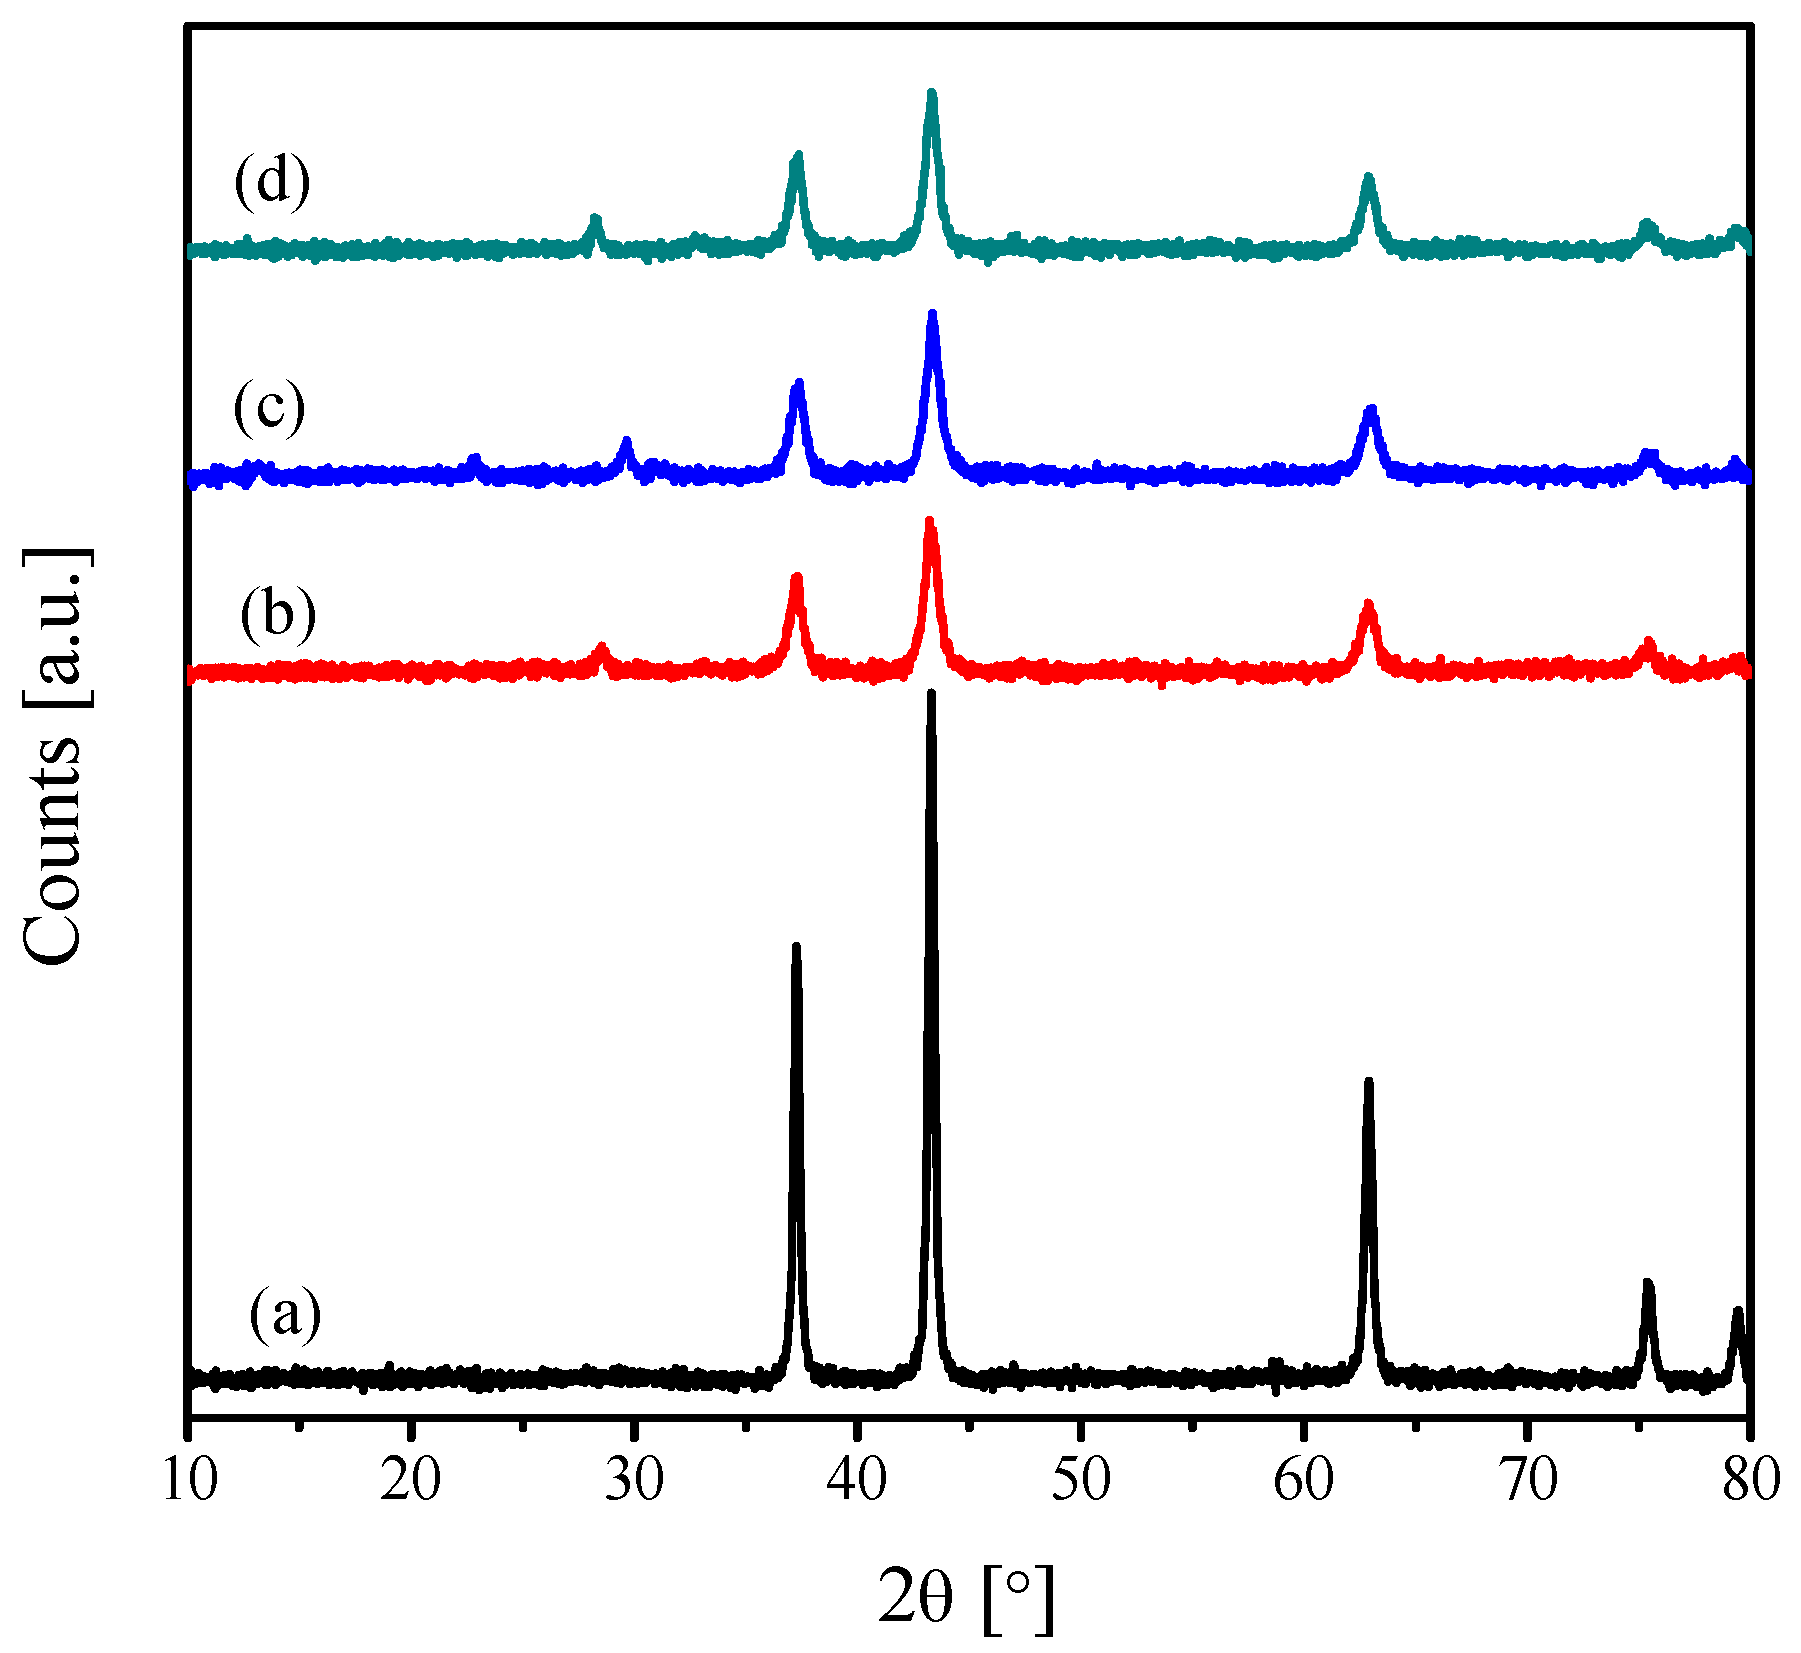
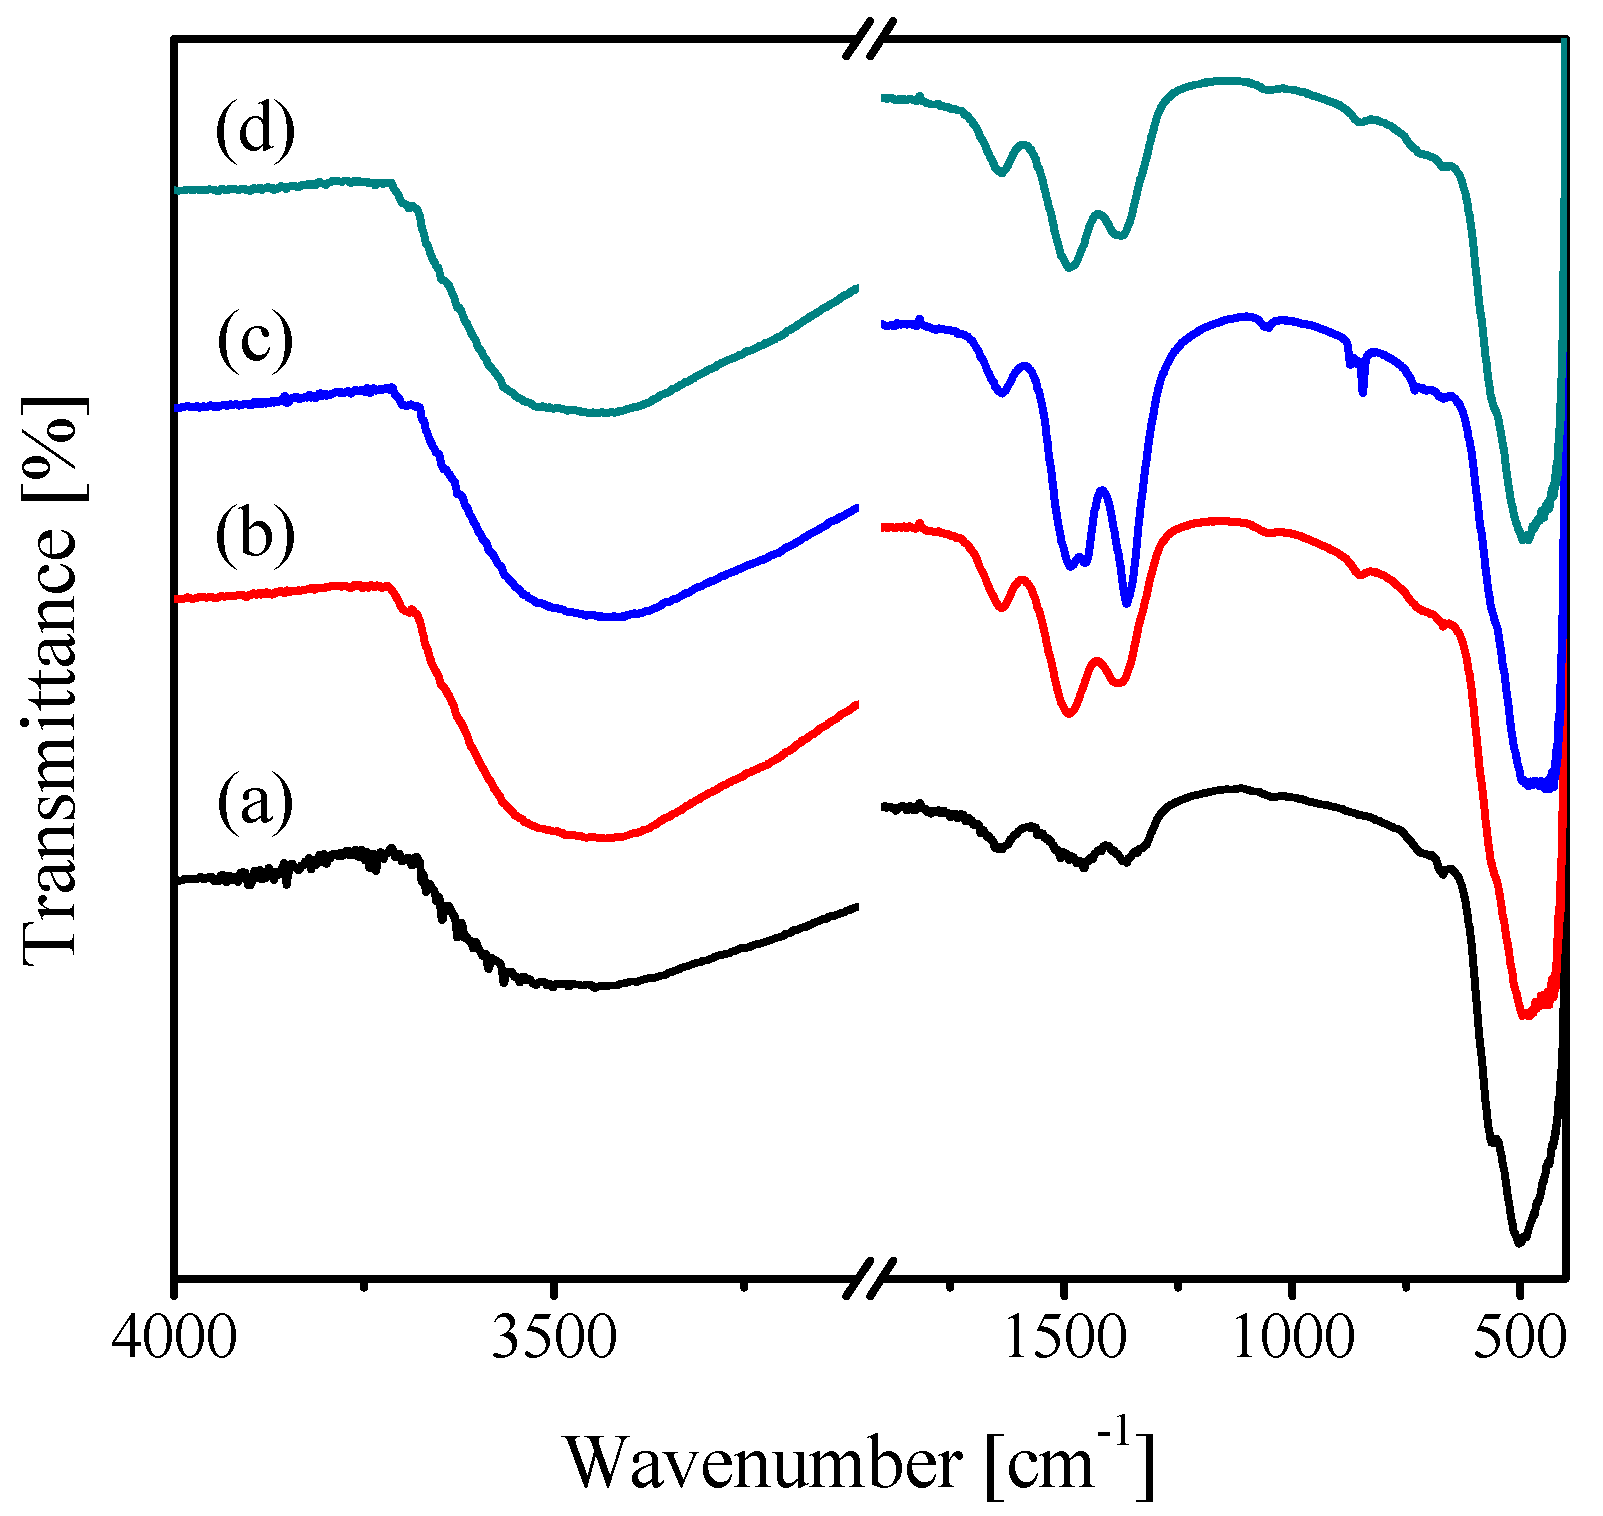
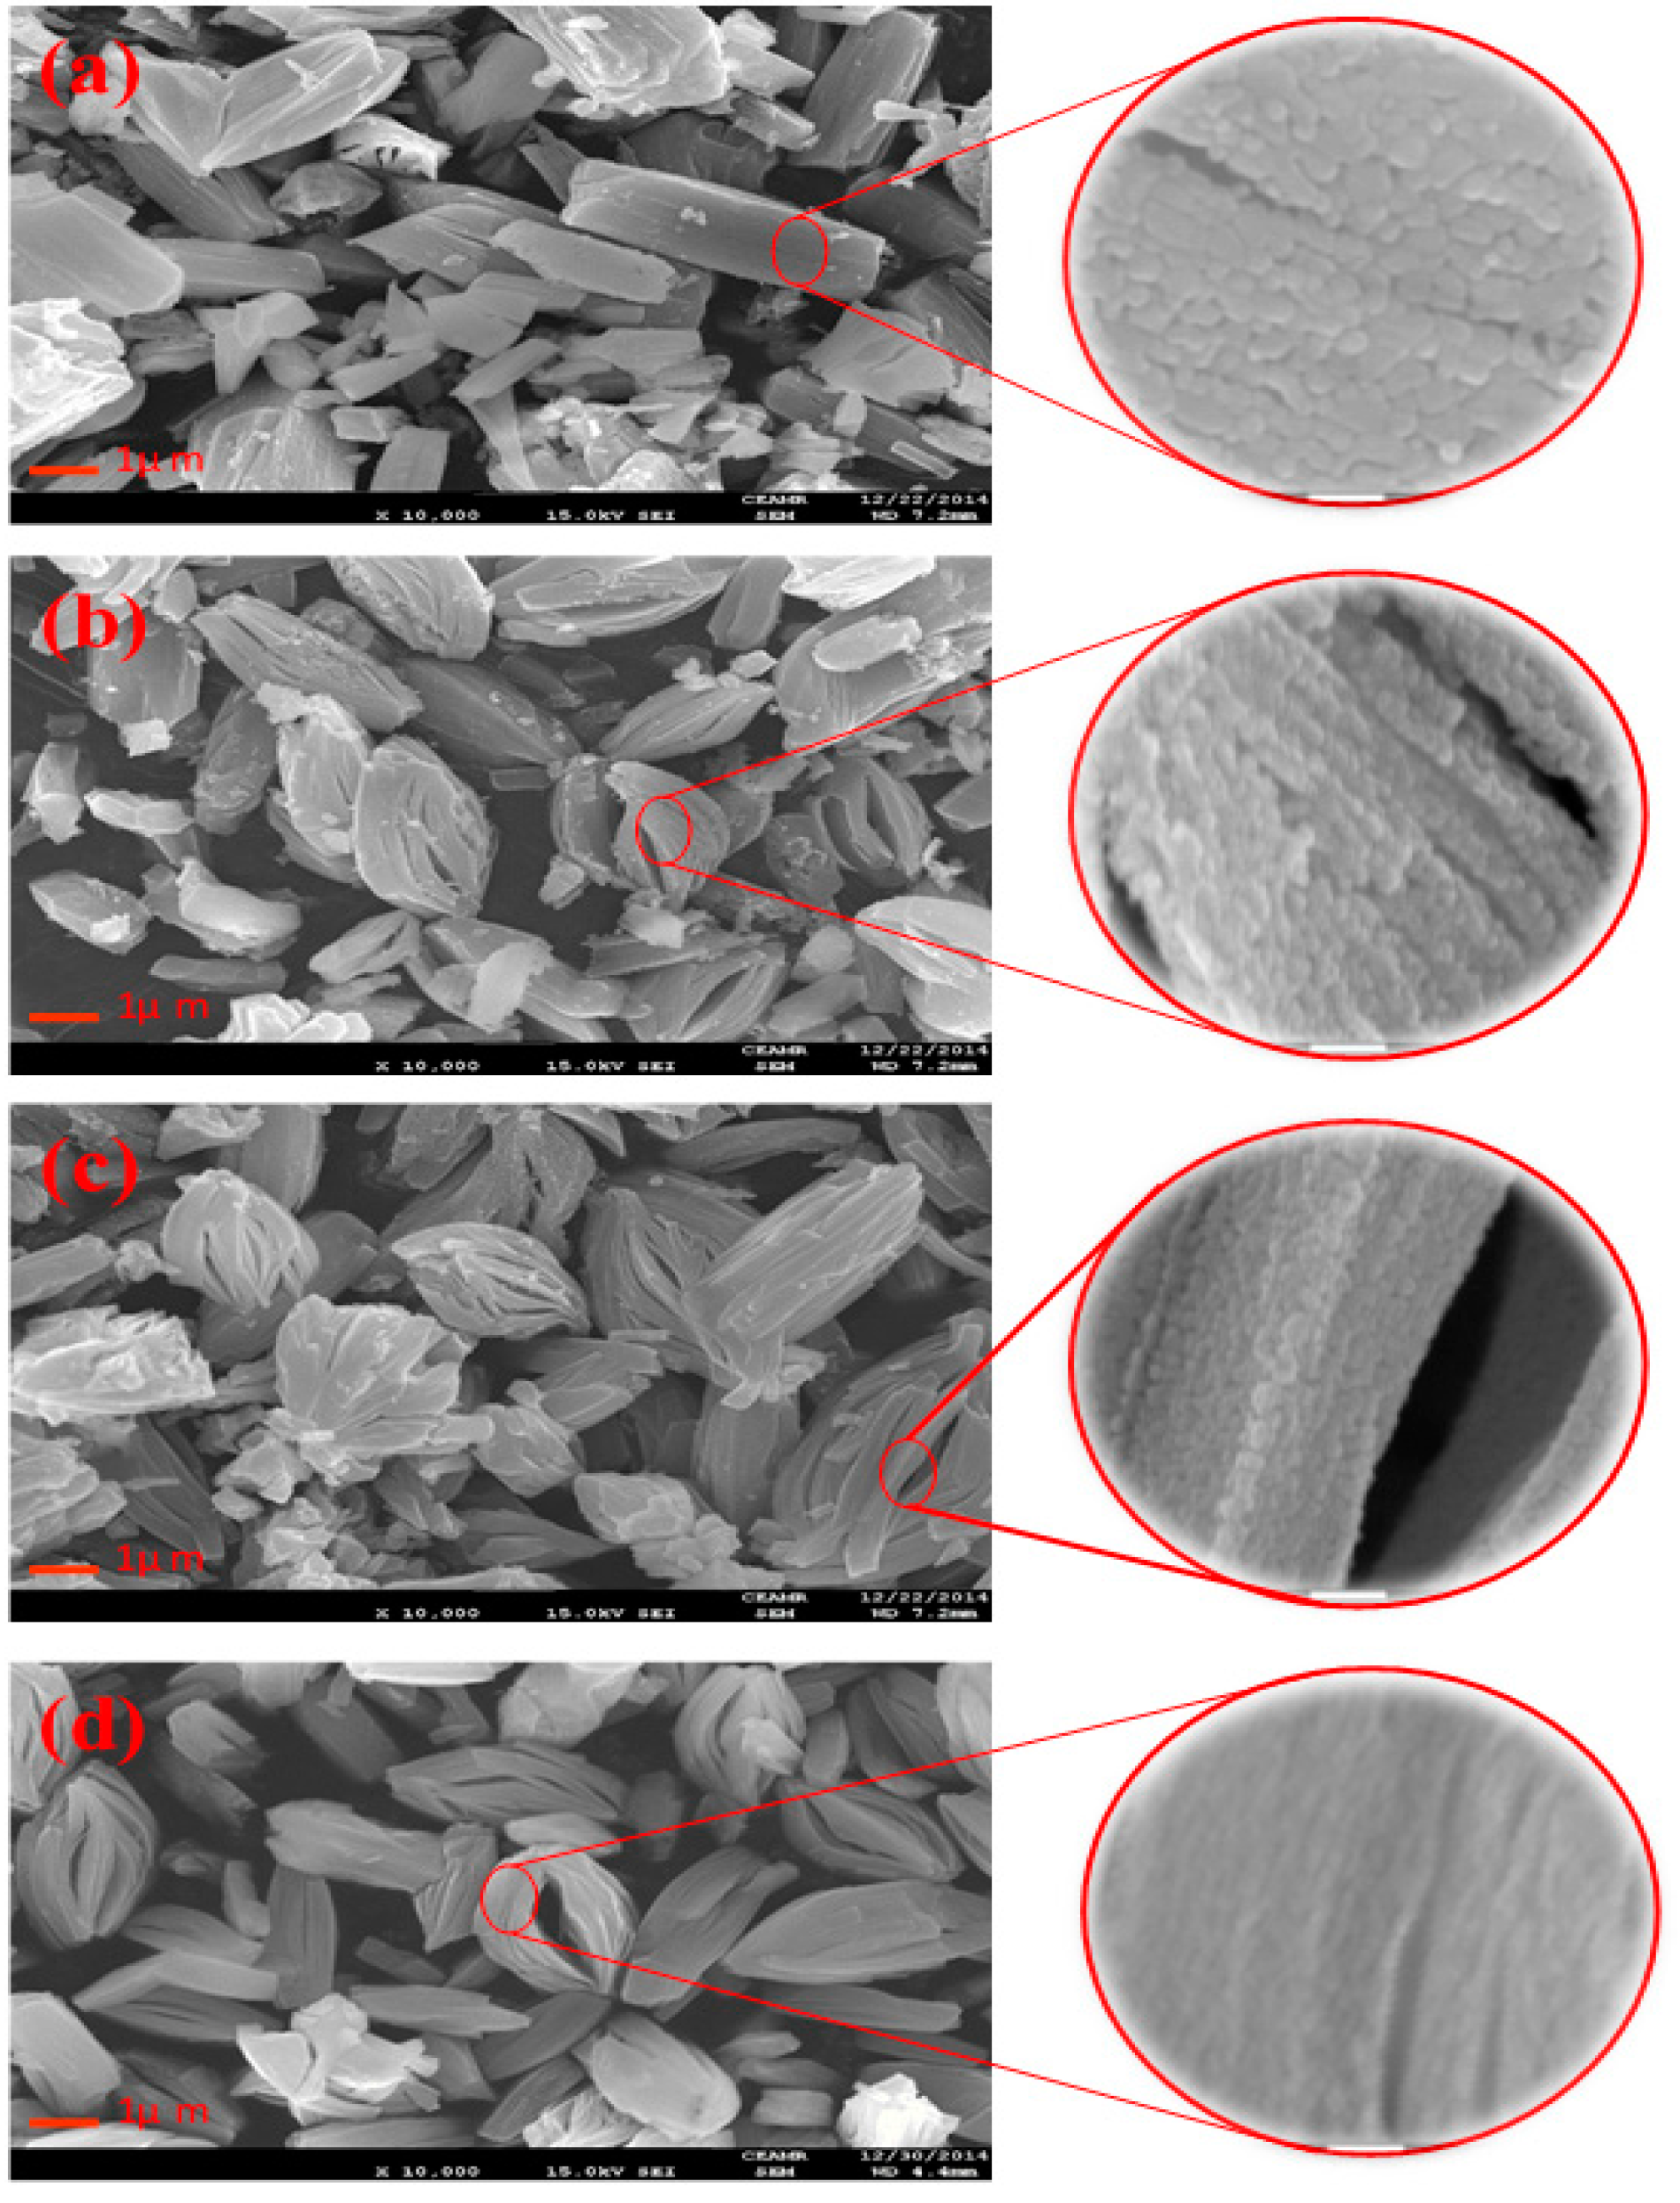
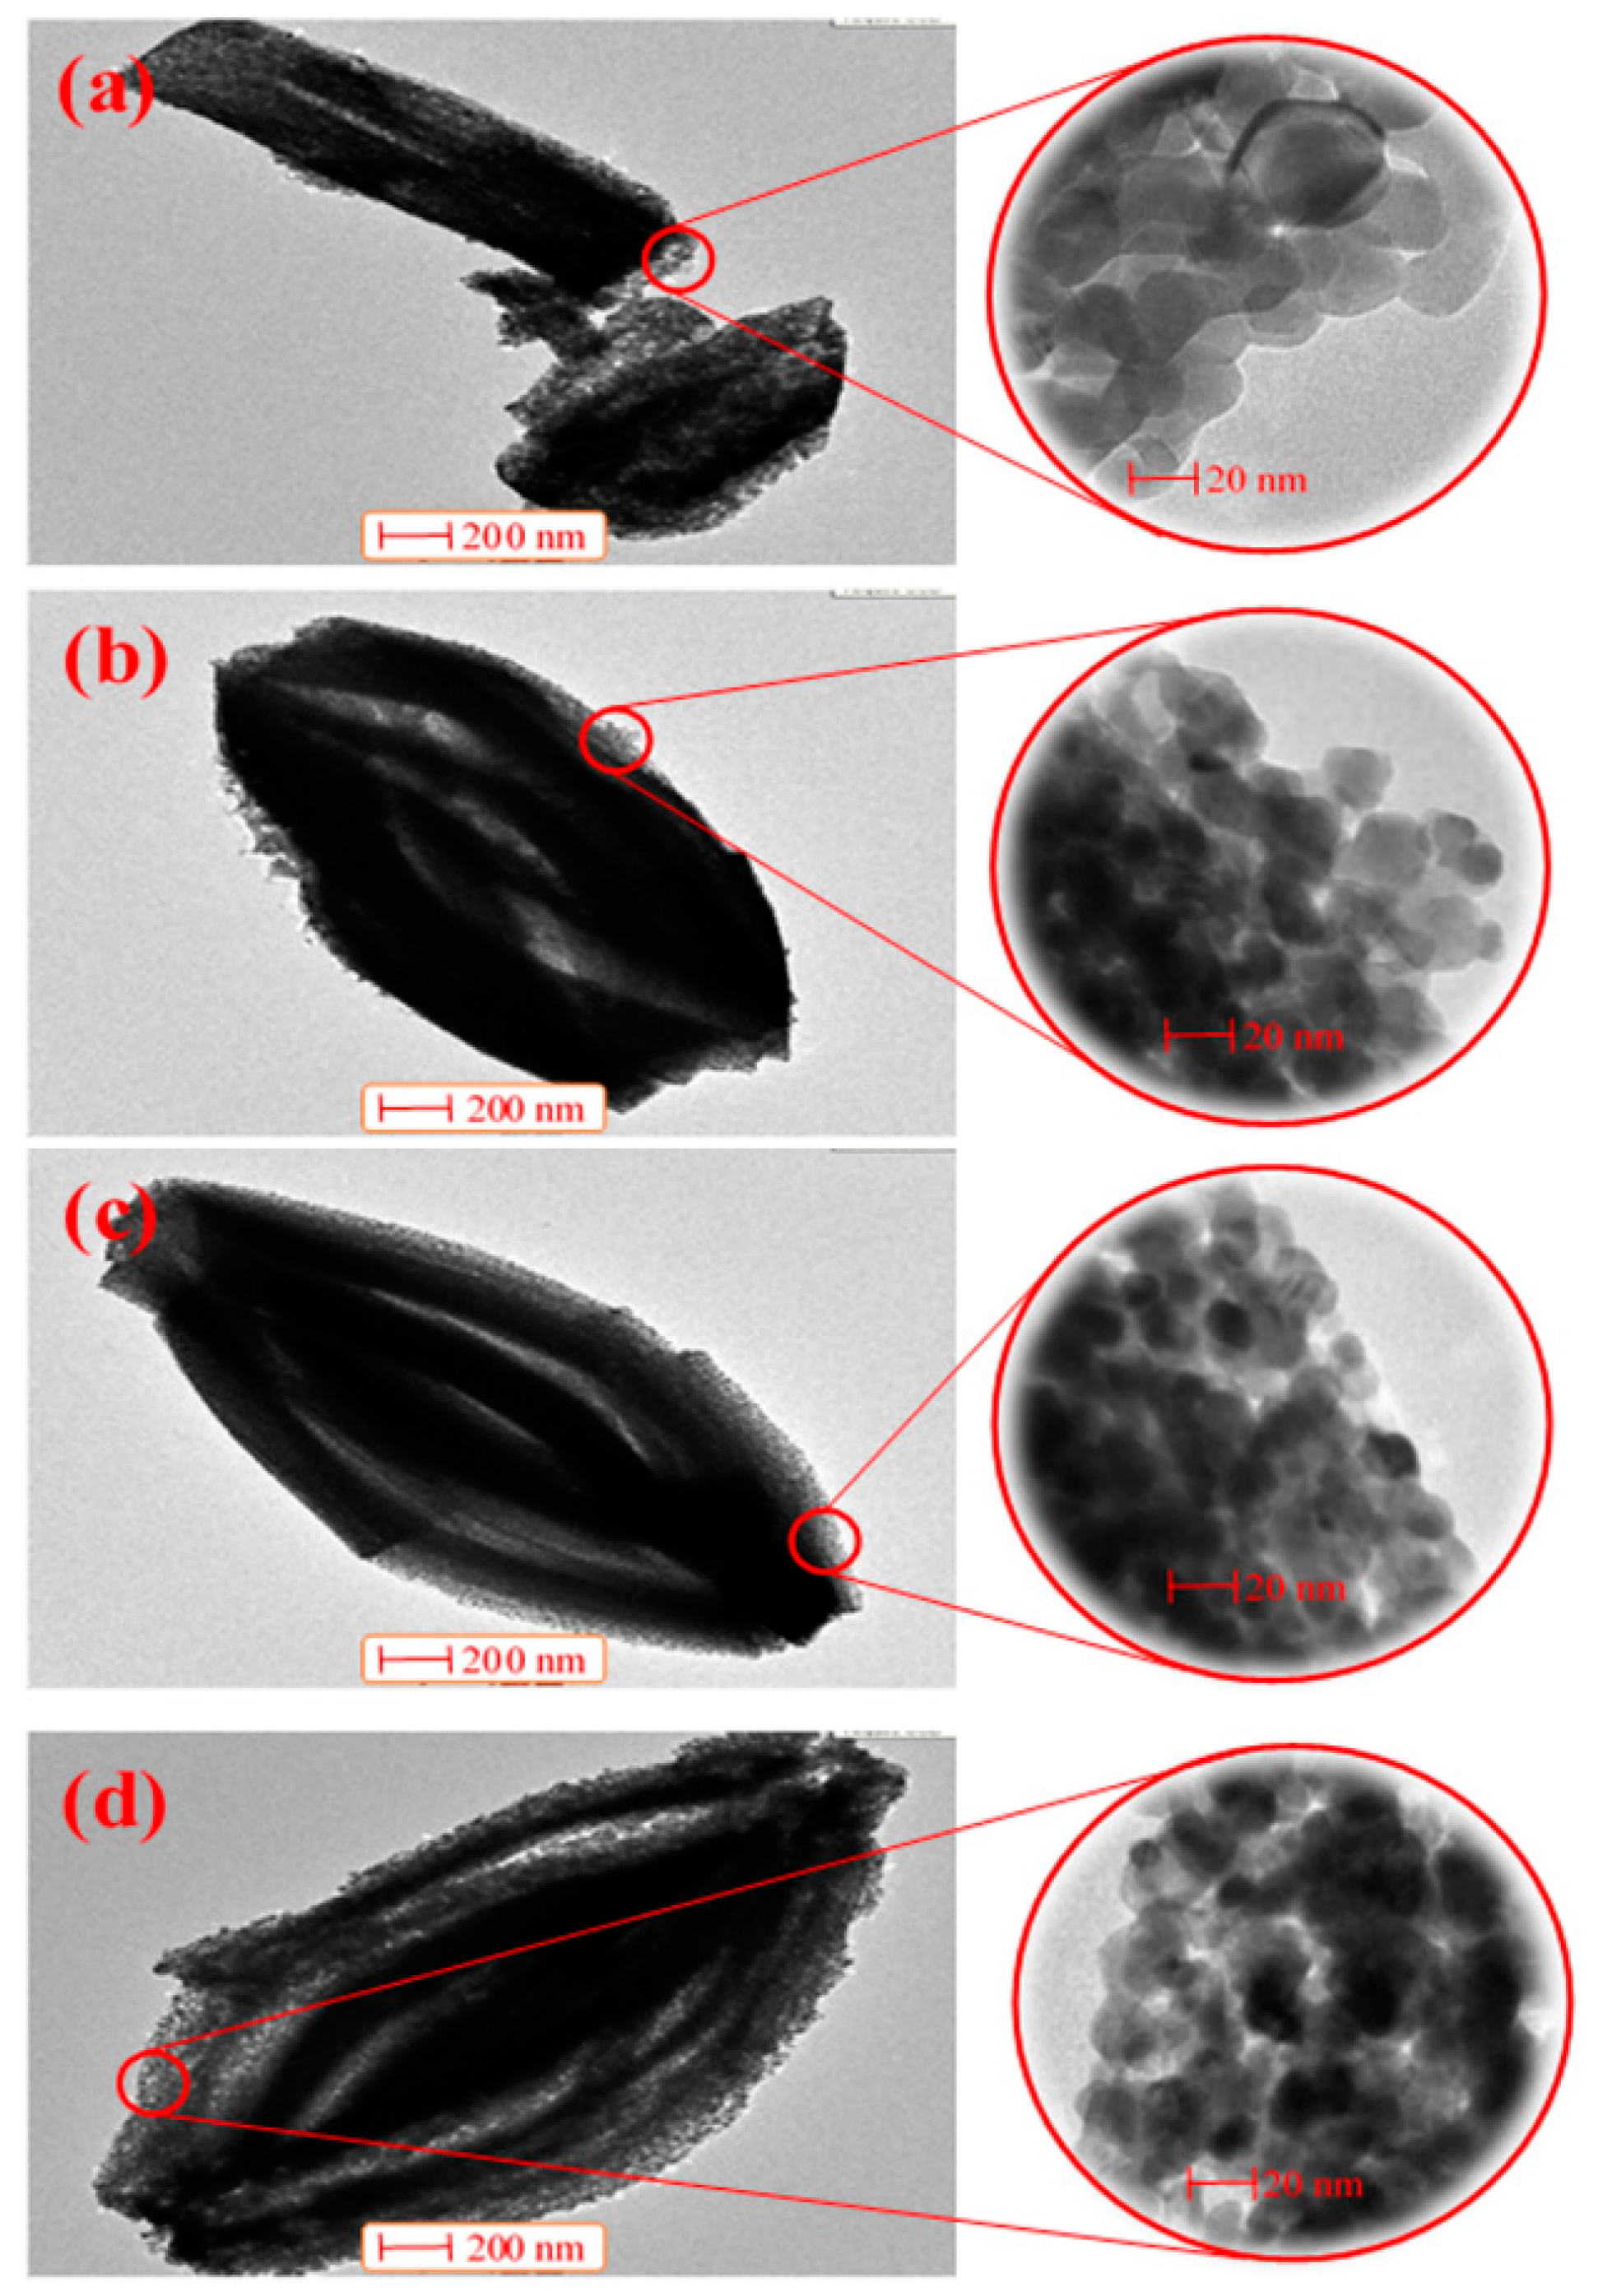
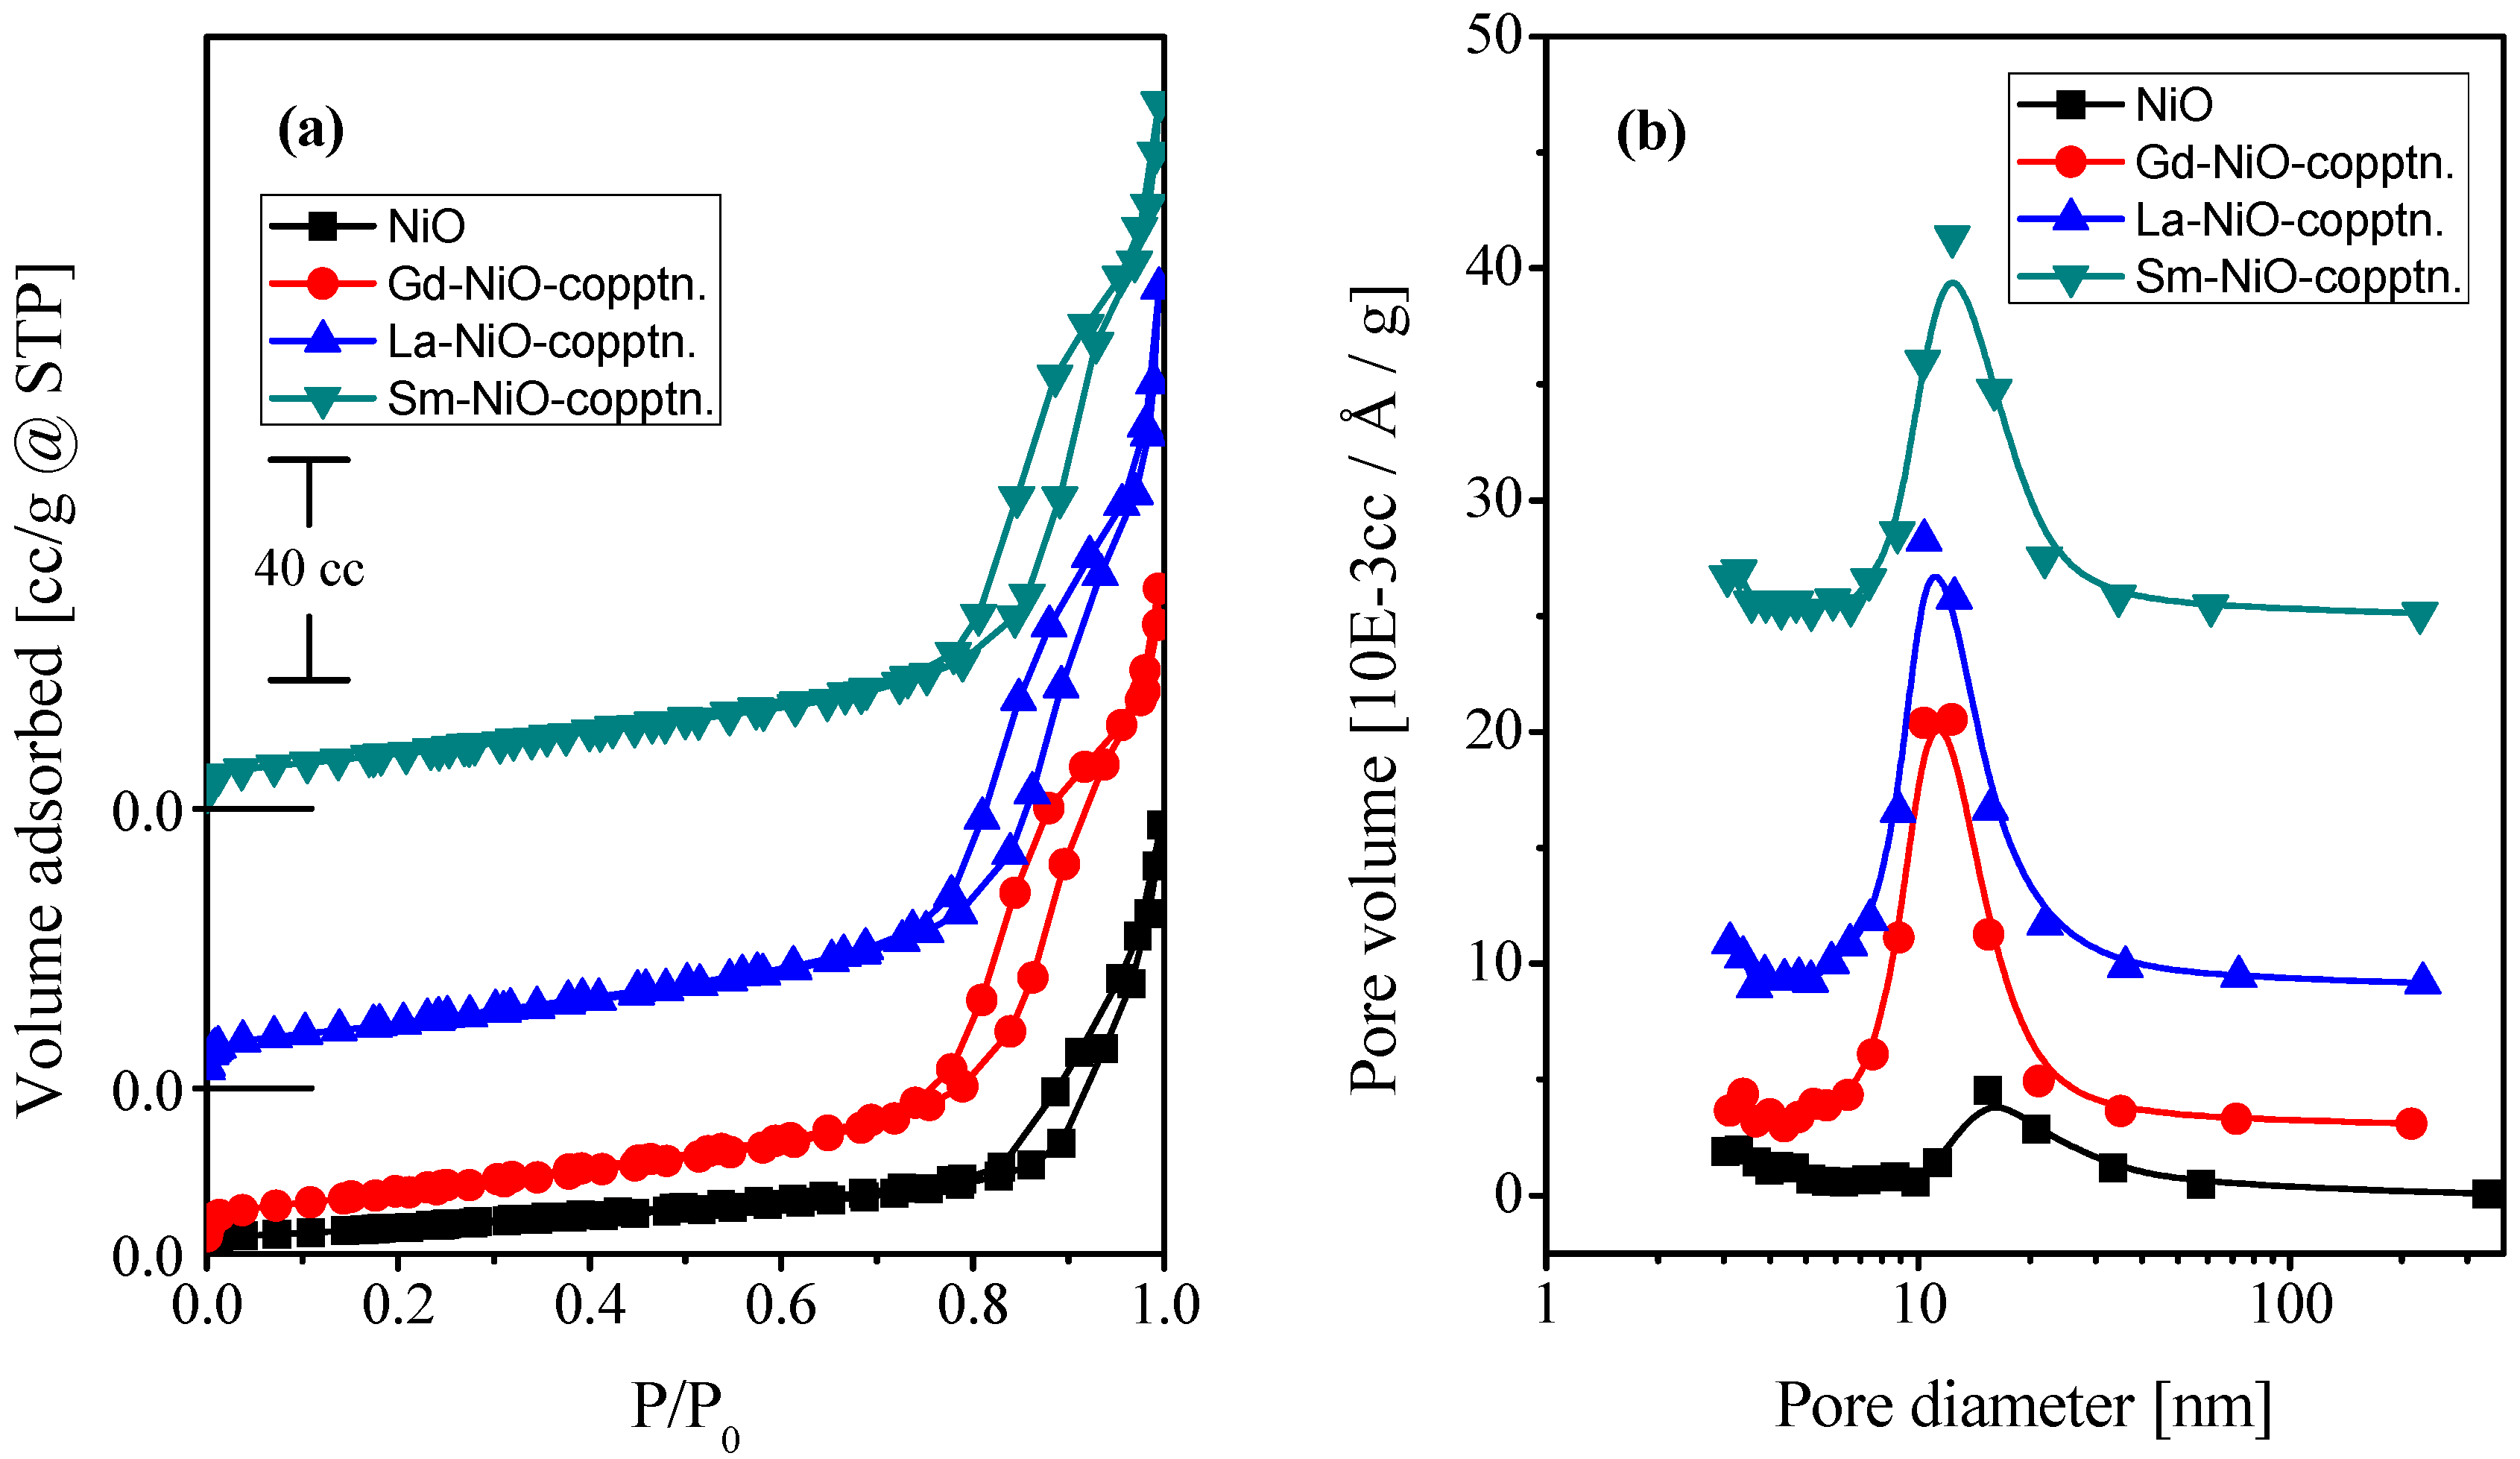
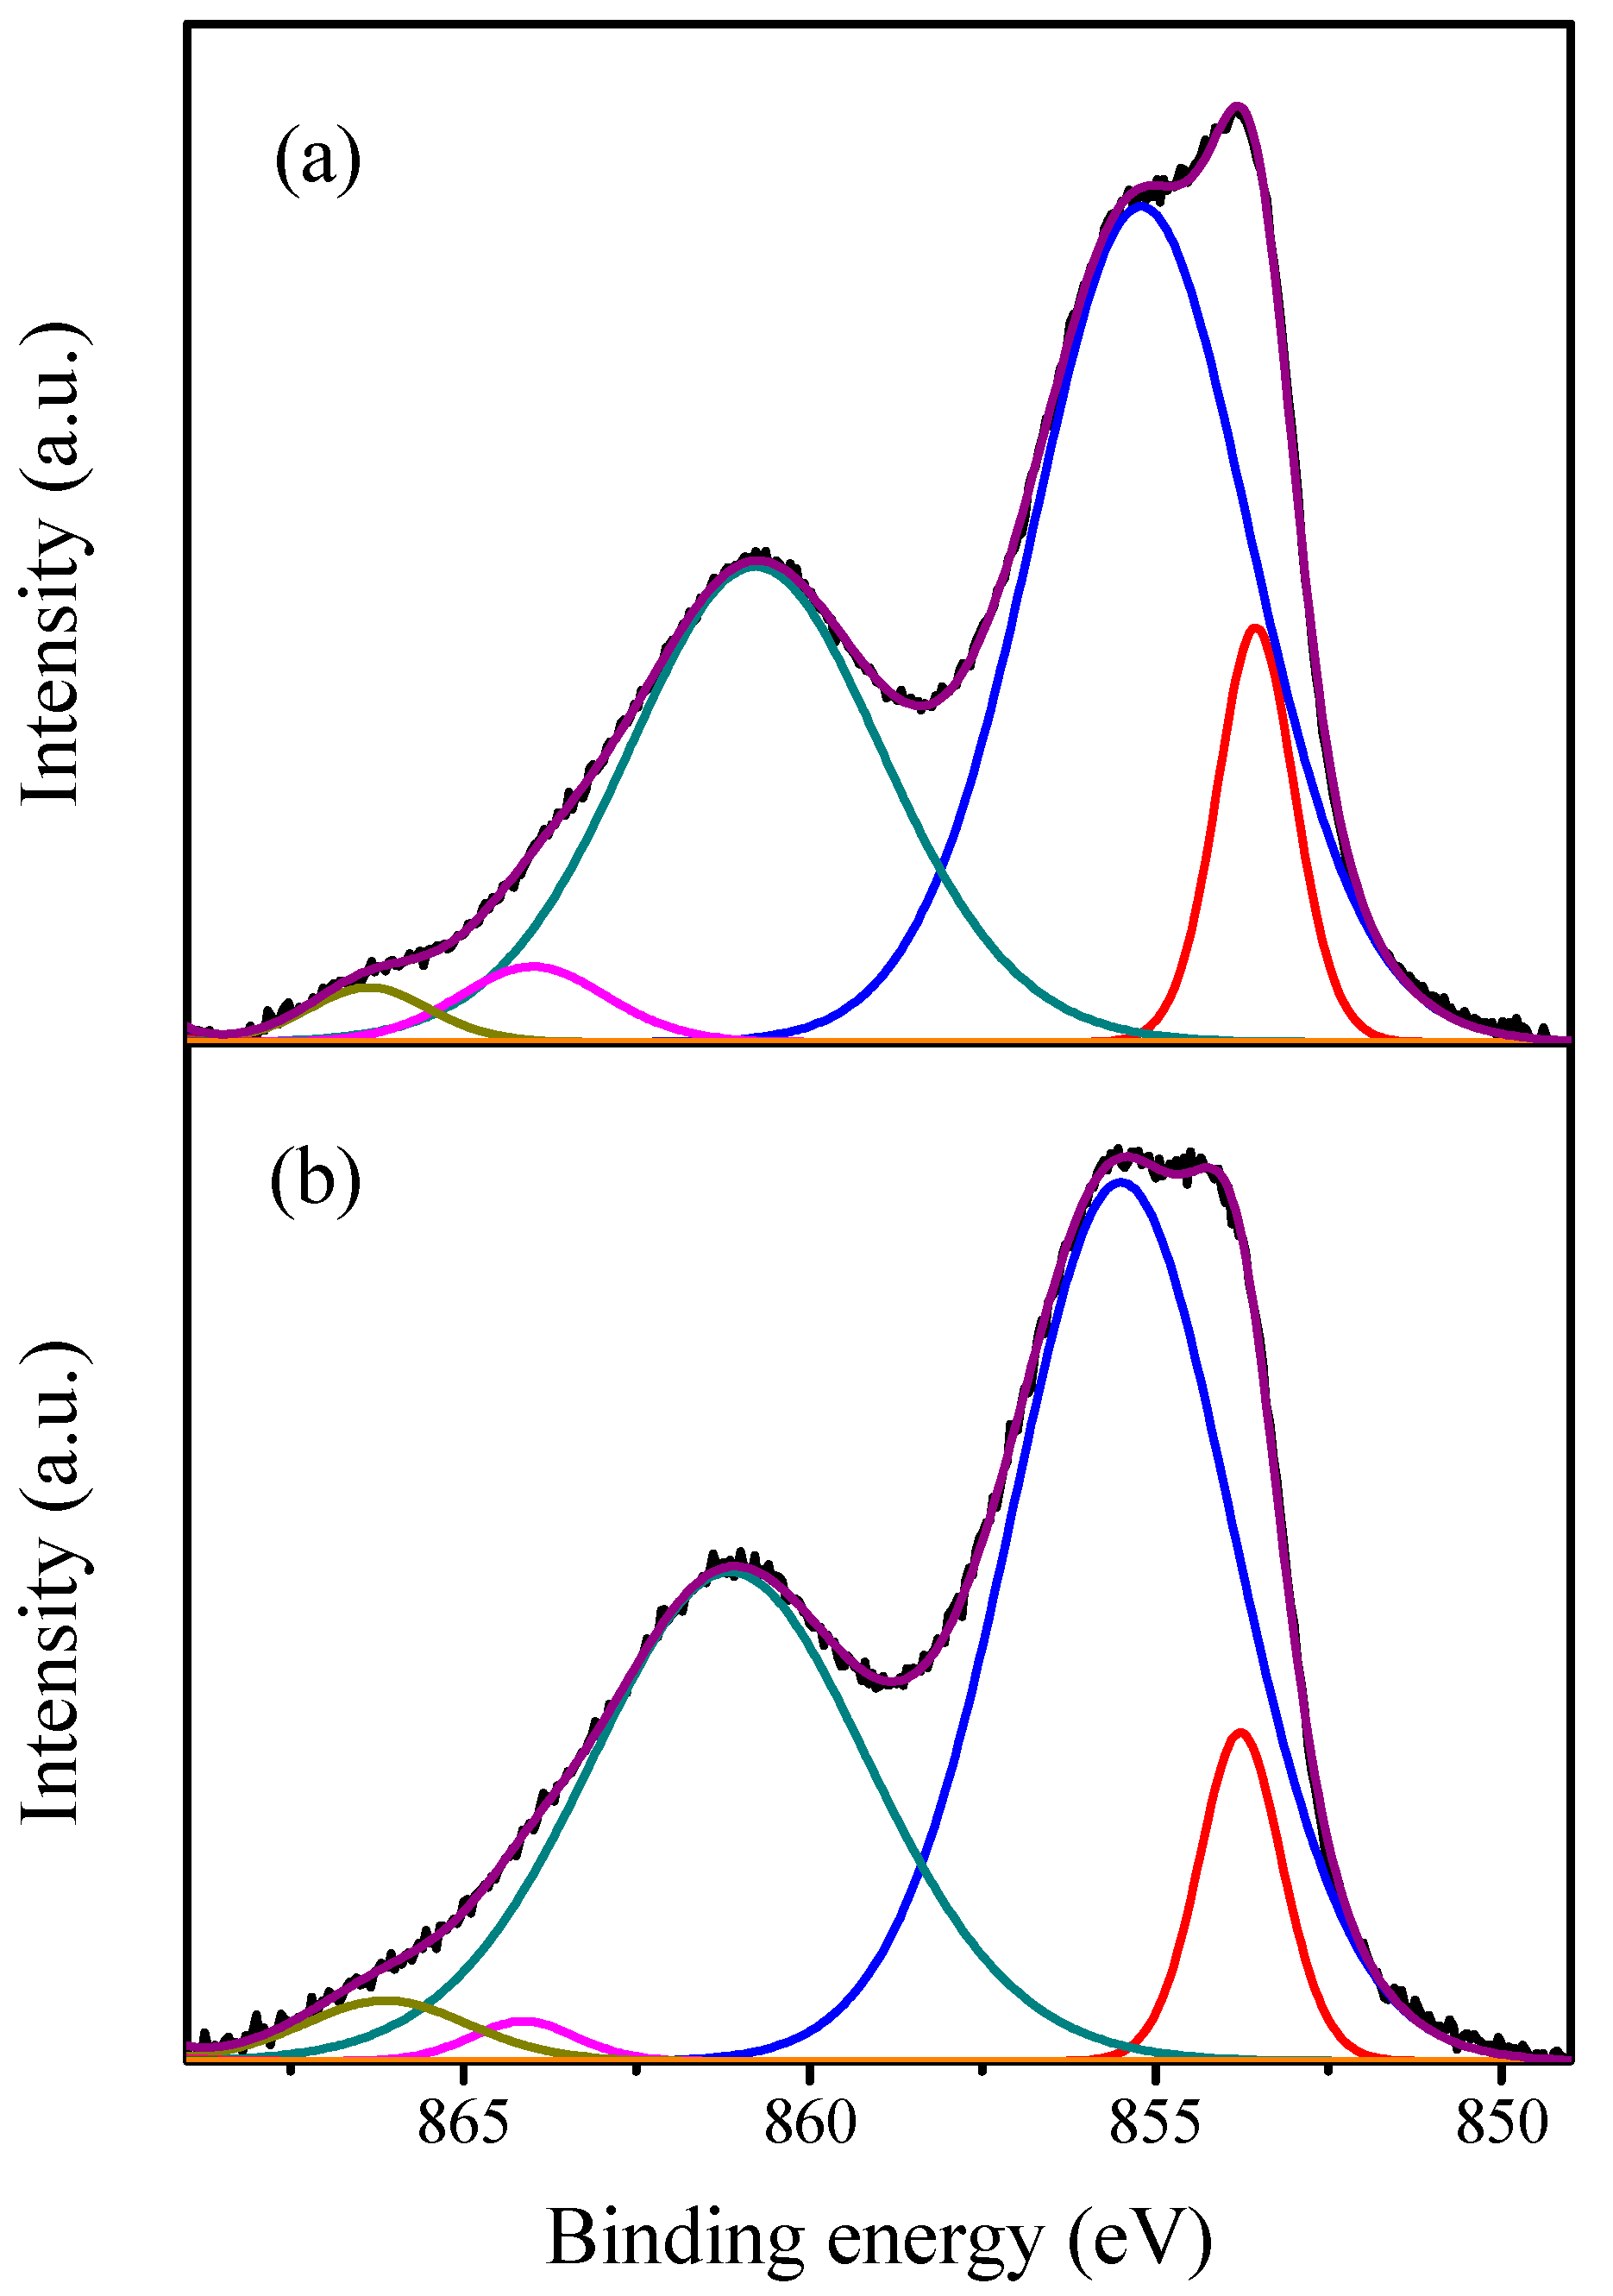
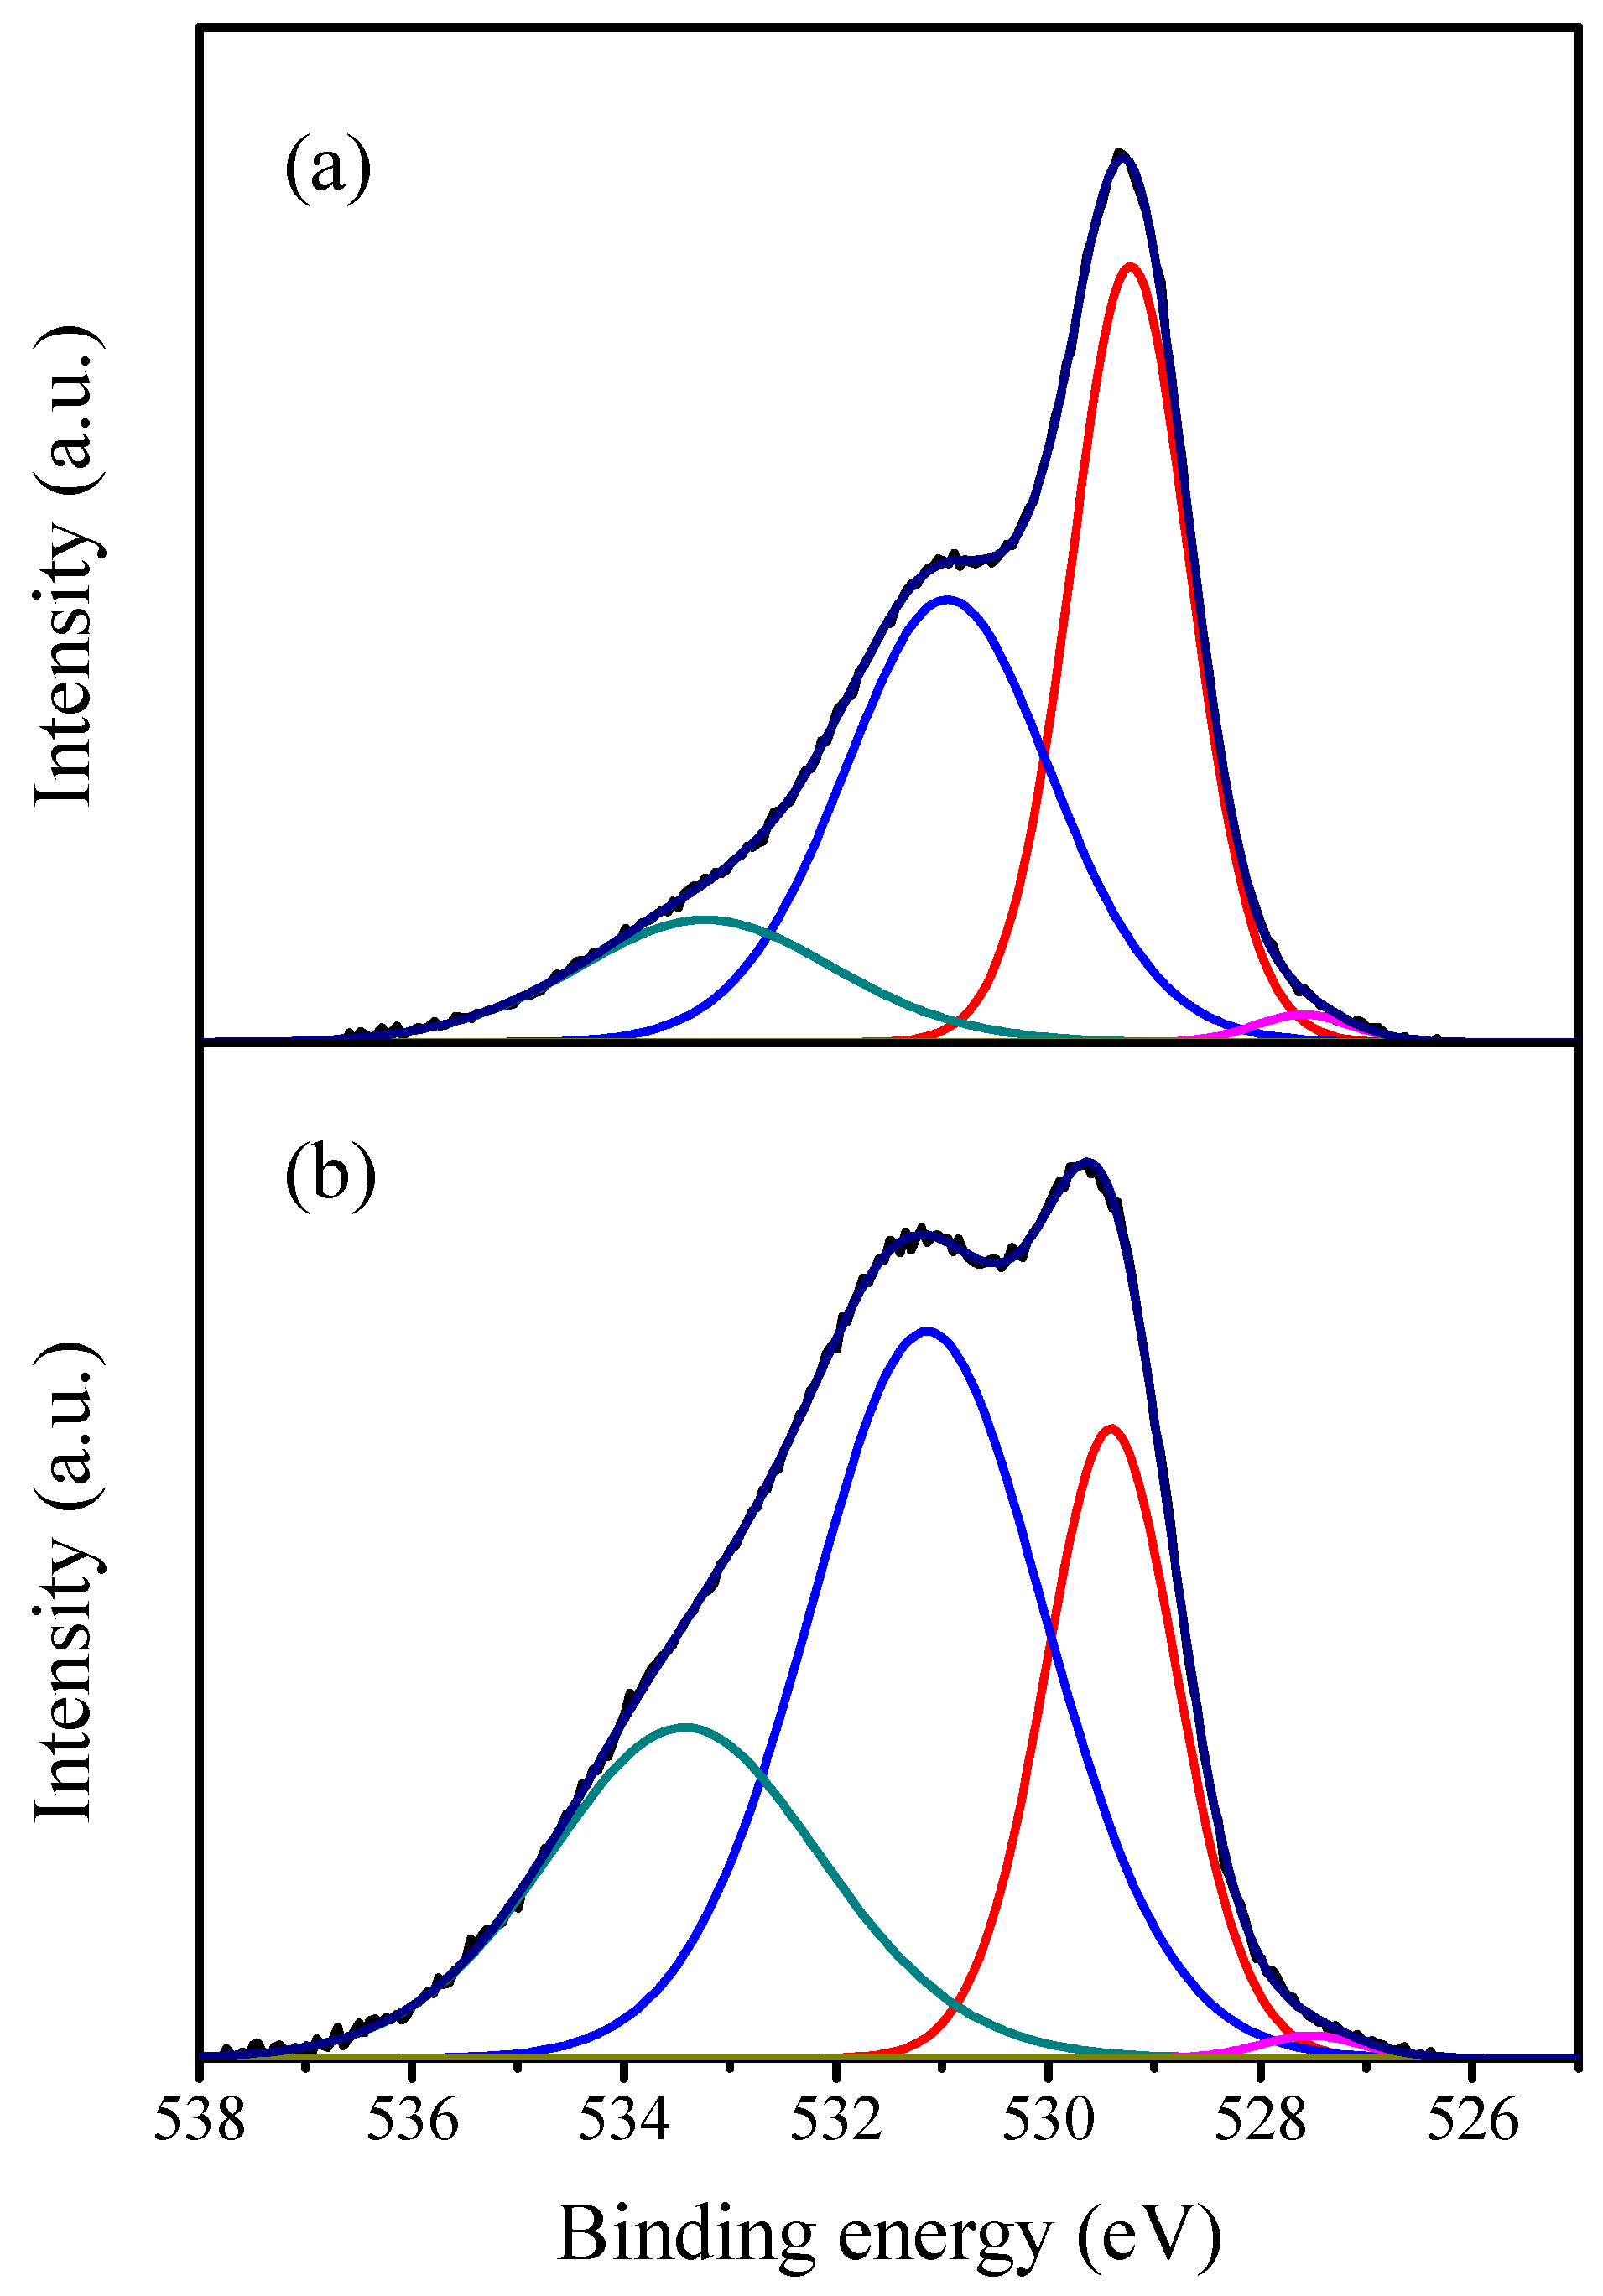
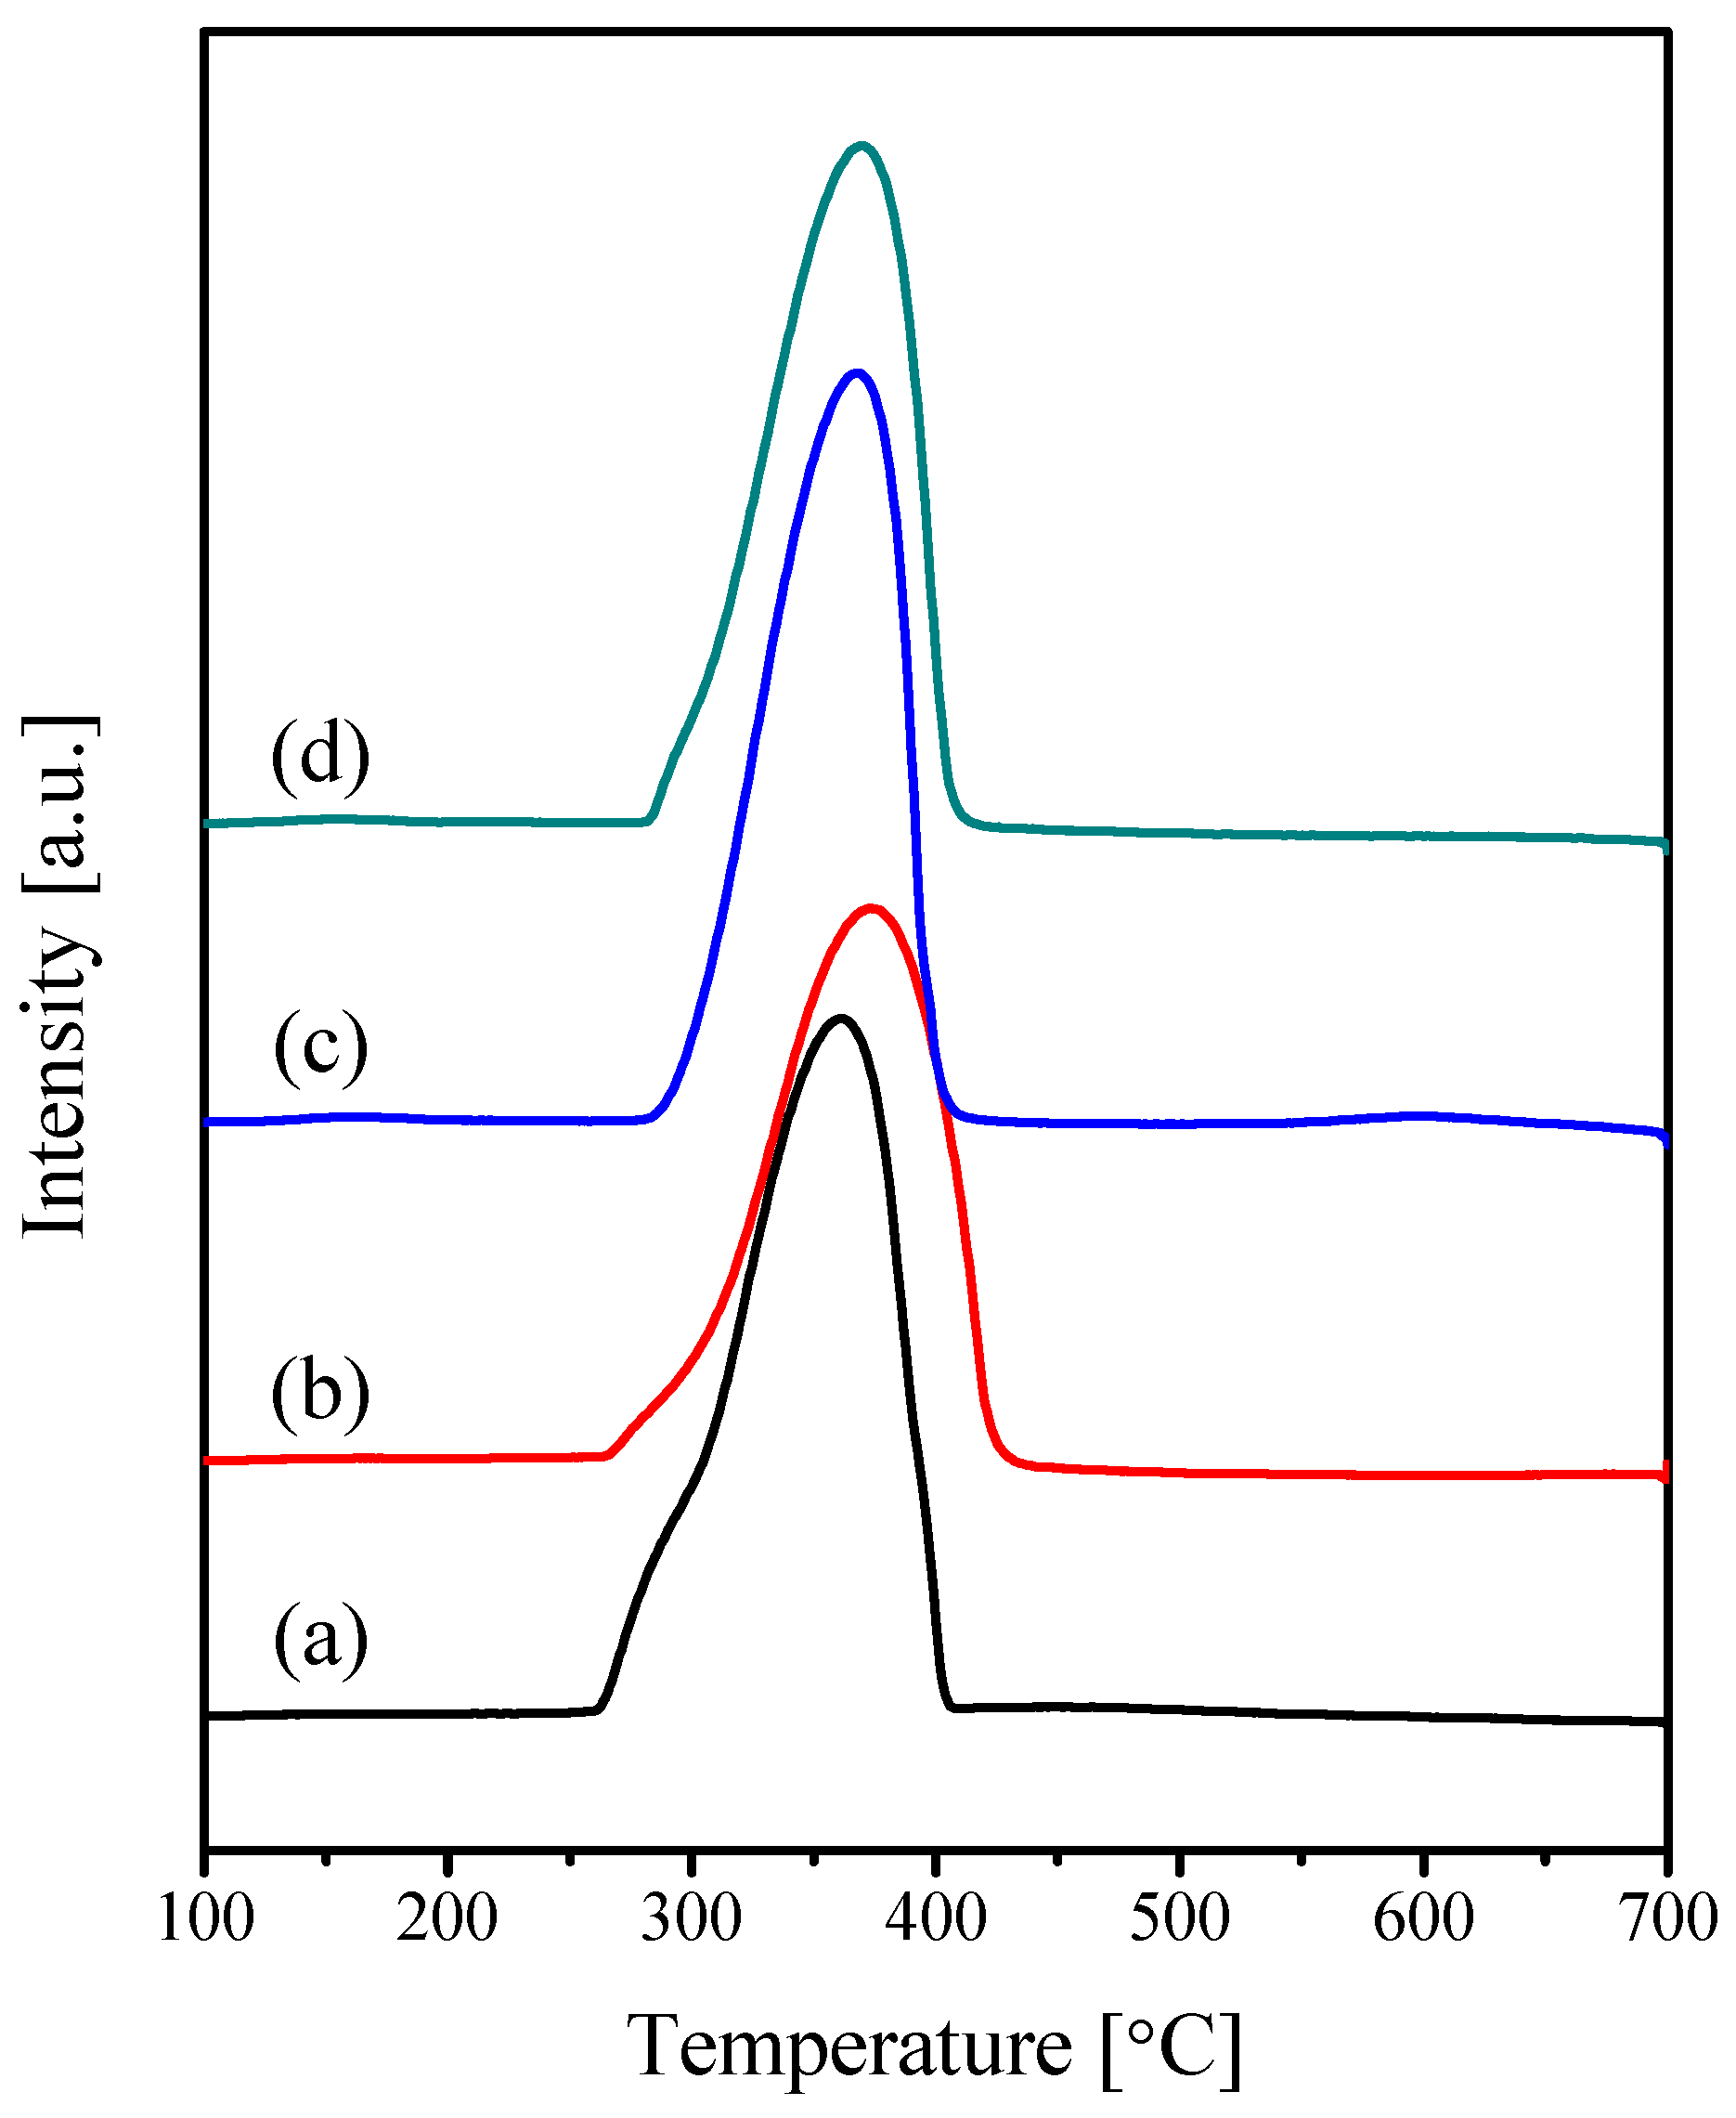
2.1. Characterization of the Catalysts

Figure 1 shows the thermogravimetric (TGA) curves obtained for the bare nickel oxalate and its RE-containing mixtures obtained by heating these solids from ambient to 700 °C in N2 flow. The thermogram of the bare NiC2O4·2H2O (Figure 1a) reveals a weight loss of about 1% accompanying the sample heating to 100 °C, which could be correlated with the removal of adsorbed water. This step is followed by another one, maximized at 204 °C. The weight loss obtained in this step (19.66%) is very close to that (19.72%) ascribed to the dehydration of this salt. Further increasing the heating temperature to 700 °C is accompanied by further weight loss. This loss is not a simple one; instead it is a composite one maximized at 328 °C and 365 °C with a residue of 31.88%. This residue is close to that (32.13%) attributed to the formation of Ni metal. Therefore, this weight loss could be related to the consecutive decomposition of anhydrous nickel oxalate to nickel oxide and then to nickel metal. The obtained TGA curves for the RE-containing parents Figure 1b–d show early weight loss steps, which extend from ambient temperature 100 °C and an amount around 3%. These steps could be related to the dehydration of the RE-oxalates. In the temperature range of 100 °C–370 °C, two weight loss steps can be observed. Using the same interpretation given for the bare nickel oxalate, the first step could be related to the dehydration of the hydrated nickel oxalate, whereas the second could be attributed to the anhydrous nickel oxalate decomposition. The final step in Figure 1b–d, which is maximized at 384 °C–406 °C, could be assigned to the RE-oxalates decomposition. Based on the TGA results, the various catalysts precursors were calcined at 500 °C, for 1 h, in air.
Figure 2 shows the XRD diffractograms of the products obtained after the various precursors were calcined at 500 °C. The diffractogram of calcined nickel oxalate (Figure 2a) shows reflections at 2θ = 37.29°, 43.31°, 62.87°, 75.36°, and 79.42°. These reflections are consistent with those of the standard rhombohedral NiO (JCPDS card file No. 44-1159). No other reflections were detected, indicating the high purity of the obtained NiO phase via the thermal decomposition of nickel oxalate in air. Since XRD is a bulk sensitive technique, it cannot detect Ni0 phase with crystallite dimensions less than 5 nm. Instead, the presence of such phase could be detected by using the XPS technique (vide infra). The diffractograms of the Gd-, La- and Sm-containing samples (Figure 2b–d, respectively) show the same reflections exhibited by the bare NiO sample, indicating the presence of NiO as a major phase component of these solids. Moreover, these diffractograms show the existence of weak reflections below 35°, which could be related to the presence of the relevant RE-oxides in minor amounts [21,22]. It is obvious from Figure 2 that the NiO characteristic diffraction peaks are markedly broadened upon the addition of the various RE-oxides. The crystallite size of NiO of the prepared samples was calculated using the Sherrer equation using the main reflection at 2θ = 43.31°. The obtained results are listed in Table 1. The bare NiO show a crystallite size value of 45 nm. The addition of the RE-oxides leads to a marked decrease of this value, where reduction values of 44%–51% were obtained.
Figure 3 shows the FT-IR spectra of the solid products after calcination. All these spectra show a strong absorption in the 600–400 cm−1 range. This absorption corresponds to the Ni–O stretching of the NiO structure [28,29]. Two peaks can be observed at ~3450 cm−1 and ~1443 cm−1, which could be attributed to the O–H stretching and bending vibration of water molecules [29]. Two other peaks can be observed at ~1485 cm−1 and ~1361 cm−1, which are related to the metal carbonate structures [7,30]. The higher intensities of these two absorptions in the case of the RE-containing samples could be related to their high ability to form surface carbonate structures [21,22]. Inspection of Figure 3 reveals the absence of any peaks due to oxalate anion, suggesting complete decomposition of the precursors, which is in agreement with the XRD findings.
Electron microscopy investigations have elucidated the morphological features of the prepared catalysts. Field emission scanning electron microscope (FE-SEM) images of the bare NiO and its RE-promoted catalysts are depicted in Figure 4. Bare NiO (Figure 4a) consists of particles with a rectanguloid morphology; many of these particles are fractured. The magnified part of Figure 4a reveals that these rectanguloids are composed of smaller welded particles with inter-particle voids. As a whole, the incorporation of the RE-oxides into the NiO structure leads to marked modification in the morphology of the parent NiO material. All the highly dispersed RE-oxides swell the bare NiO particles giving a rice-like morphology. The magnified parts in Figure 4b–d clearly indicate that the particles of the various RE/NiO catalysts are composed of smaller ones, which are smaller than those of the bare NiO. This picture suggests a significant textural change of bare NiO upon the incorporation of RE-oxides. In this context, we reported that the incorporation of various RE-oxides into CuO and Co3O4 results in a noticeable decrease in their particles sizes [21,22,31]. Concurrently, Xue et al. [10] reported a decrease in the Co3O4 SEM-estimated particles size after the addition of 5% of CeO2. They suggested that the added CeO2 affected the dispersion of the supported Co3O4, preventing its sintering. In a similar manner, we may suggest that the swelling of NiO induced by the highly dispersed RE-oxides prevents it from sintering.
Figure 5 shows the transmission electron microscopy (TEM) nanographs of the prepared samples. In agreement with the FE-SEM observation, a TEM image of the bare NiO (Figure 5a) reveals its rectangular morphology. The magnified section of Figure 5a manifests that these rectangles are composed of smaller uniform hexagonal particles, with diameters in the range of 20–45 nm. TEM nanographs of the RE-promoted NiO, Figure 5b–d, clearly indicate the swelling of the NiO particles as a result of the RE-oxide incorporation. This finding matches well with that obtained using FE-SEM analysis. As shown in the magnified sections in Figure 5b–d, the swelled particles are composed of huge numbers of aggregates or agglomerates of tiny particles. Moreover, it is obvious that the addition of RE-oxides to NiO leads to: (i) distortion of its hexagonal self-assembled structure; and (ii) a decrease in the size of the tiny particles with values of 10–25 nm, 10–23 nm and 10–21 nm for the Gd/NiO, La/NiO, and Sm/NiO catalysts, respectively. This particle size decrease agrees well with that obtained using Scherrer equation analysis of the XRD data listed in Table 1.
Textural characteristics of the prepared catalysts were investigated by nitrogen sorption analysis. Figure 6 reports the obtained nitrogen adsorption–desorption isotherms. The isotherm of bare NiO belongs to Type-II according to IUPAC classification [32], indicating mono-layer and multi-layer formation. The isotherms for the RE-promoted NiO catalysts are similar to each other and exhibit Type-IV character, a well-defined step in the adsorption branch [32]. The Type-II → Type-IV transformation clearly suggests the development of mesopores in NiO as a result of RE-oxide incorporation. This finding agrees well with the information abstracted from FE-SEM and TEM analyses. At P/P0 < 0.3, the isotherms show a mild increase in the amount adsorbed, resulting from the N2 adsorption on the walls of the mesopores [33], indicating the monolayer formation. A sharp increase in the amount adsorbed can be observed at P/P0 > 0.7, indicating the capillary condensation within the mesoporous channels. The irreversible desorption of the adsorbed N2 molecules from the surfaces of the RE-promoted catalysts leads to the development of hysteresis loops, which belong to type H1 hysteresis [32]. The specific surface areas have been calculated using the BET equation. The obtained values (Table 1) clearly indicate that promoting NiO with the various RE-oxides leads to more than a 100% increase in its BET surface area. Figure 6b reports the BJH pore size distribution curves of the prepared catalysts. A mono-dispersal peak can be observed for all the catalysts, which is maximized at 16 nm for bare NiO and at 11–12 nm for the RE-promoted catalysts. This feature clearly indicates the mesoporosity of the prepared catalysts. Moreover, the incorporation of the REs is accompanied by a sharp increase in the mesopores’ peak heights. This picture suggests that the added REs induce a slight decrease in the pores diameters and a noticeable increase in the number of the pores locates at the mesoporous range. In agreement, Table 1 shows that the RE-containing catalysts have smaller pore diameters and larger pore volumes.
Crystal formation is controlled by the initial nucleation and subsequent growth. From the obtained morphological and textural features of the obtained catalysts, it is evident that the added REs play an important role in controlling these two processes. CTAB, which is a cationic surfactant, was reported to enhance the formation of rod-like structures of NiO [34] and Co3O4 [31] with reduced dimensions. During the NiC2O4 synthesis, Ni2+ ions first interact with CTAB to produce the Ni-CTAB complex, which is transformed immediately to NiC2O4-CTAB complex upon the addition of oxalic acid solution. Then, NiC2O4 seeds grow, yielding micro-rods of NiC2O4. Finally, the calcination process decomposes the CTAB NiC2O4 molecules, forming NiO with retained morphology. Spherical particles are produced throughout the equivalent growth rate along the nucleation axes [18]. Thus, it is plausible to suggest that the incorporated RE ions, during the precipitation, distribute themselves in a manner that prevents the faster growing of NiO rods faces and ensures the formation of swelled NiO nanoparticles, which are composed of small sphere-like particles, and the development of mesoporosity.
XPS analysis was used to examine the elemental composition in the upper layers of bare NiO and Gd-promoted NiO catalysts. Figure 7 reports the obtained Ni 2p3/2 XPS spectra of these two catalysts. The Ni 2p3/2 peak of bare NiO (Figure 7a) was deconvoluted into two other peaks at binding energy (BE) values of 853.55 and 855.21 eV (Table 2), which indicates the presence of nickel in two oxidation states. The peak at 853.55 eV could be attributed to the presence of metallic nickel (Ni0), whereas the peak at 855.21 eV could be related to the Ni2+ in the form of NiO [24,35,36]. The analysis of the Ni 2p3/2 peak of Gd/NiO catalyst (Figure 7b) reveals the presence of two contributions at 853.53 and 855.13 eV (Table 2). Similarly, these could be assigned to Ni0 and NiO, respectively. In this respect, the detection of Ni0 state by XPS and not by XRD could be ascribed to the higher sensitivity of the former technique than the later one.
Figure 8 depicts the O 1s core-level spectra of NiO and Gd/NiO catalysts. The spectrum of bare NiO (Figure 8a) was deconvoluted into four contributions. The first one, maximized at 527.57 eV, could be related to the unstable oxygen moiety [37]. The second peak appears at 529.22 eV, which could be assigned to the NiO crystal-lattice oxygen atoms [34,38,39]. The peak at 530.95 eV could be assigned to the oxygen atoms adjacent to nickel vacancies [39], oxygen atoms in hydroxyl groups [40], or bound to carbon atoms in the form of C=O [38]. Finally, the contribution located at 533.23 eV could be ascribed to oxygen atoms in adsorbed water molecules [38]. The same four contributions were obtained for the Gd/NiO catalysts, which appear at 527.52, 529.41, 531.14, and 533.43 eV.

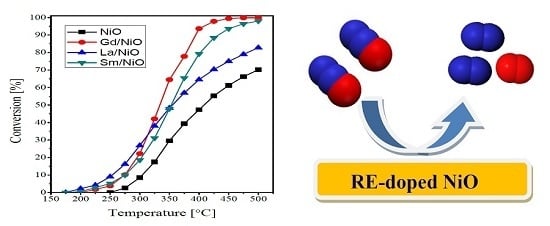
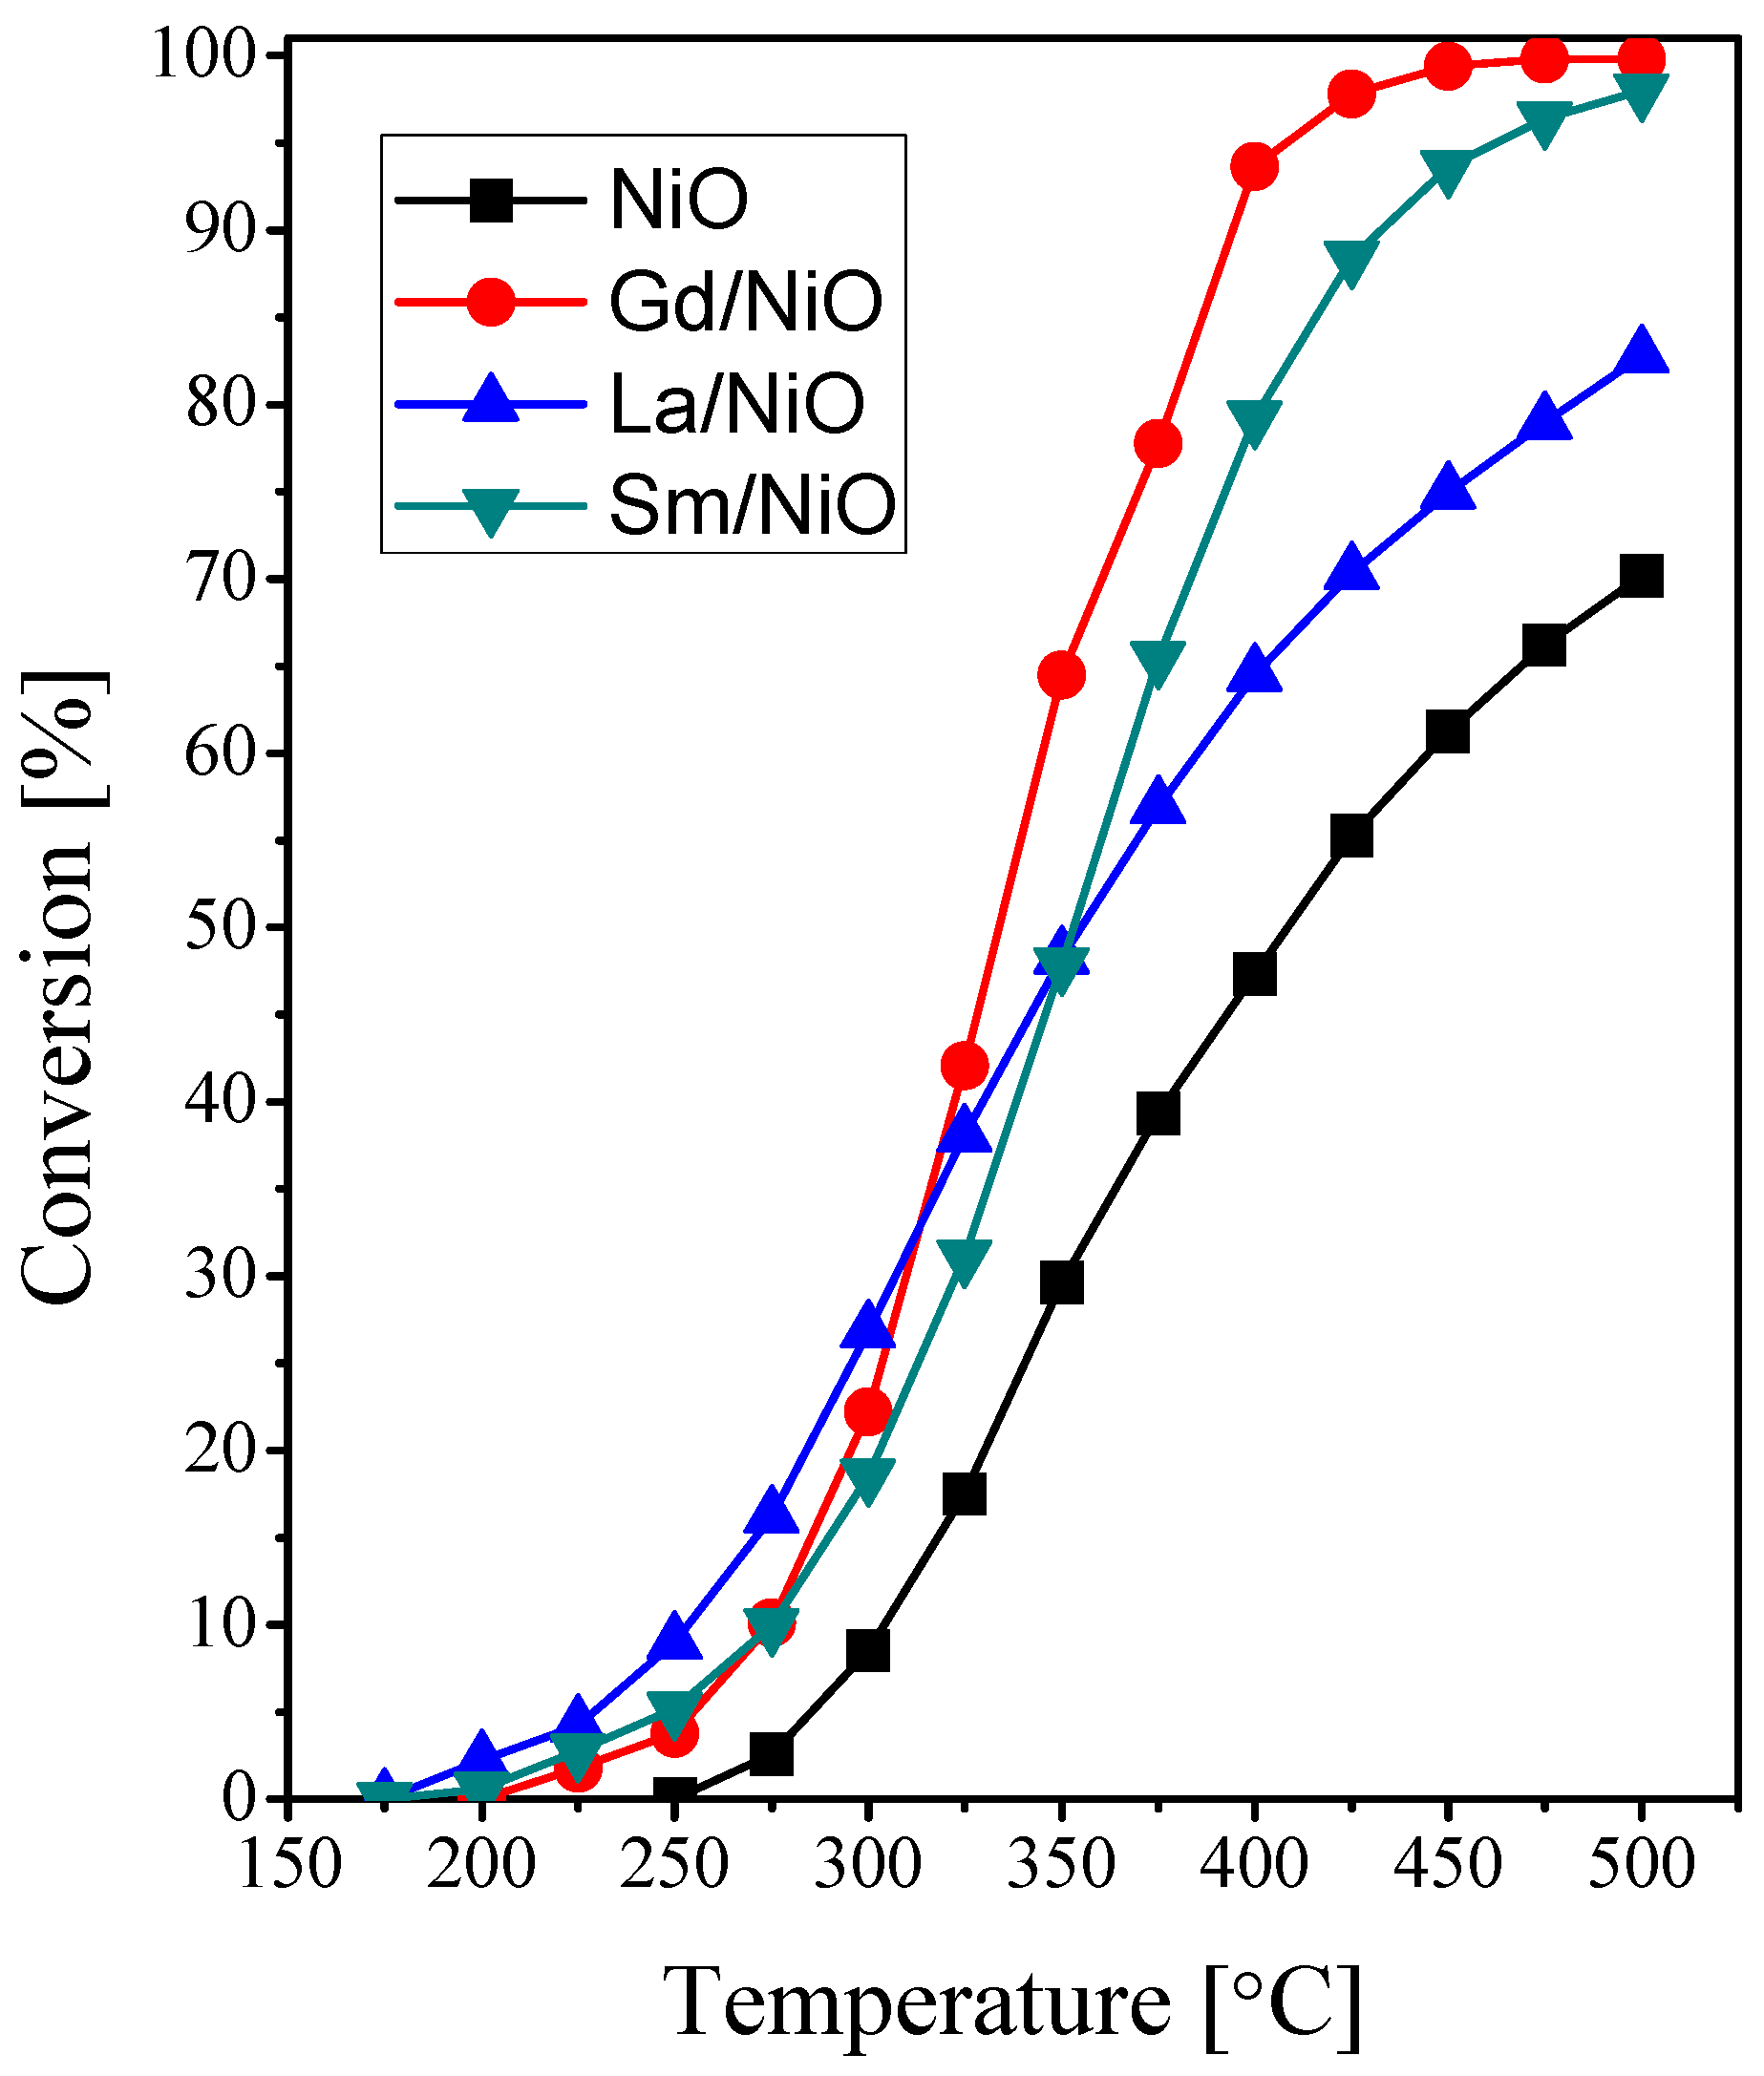
2.2. Catalytic Activity Measurements

Figure 9 shows the comparison of the catalytic behavior bare NiO and its RE-promoted catalysts during N2O decomposition. For bare NiO catalyst, the T50 temperature (50% N2O conversion) is 409 °C, and a maximum conversion of 70% is reached at 500 °C. The incorporation of the RE-oxides into NiO clearly increase its activity; the T50 values are 345, 345, and 333 °C for La/NiO, Sm/NiO, and Gd/NiO catalysts, respectively. The respective conversion% of N2O over these catalysts at 500 °C is 83%, 98%, and 100%. The promotion effect of RE-oxides during N2O decomposition over NiO-based catalysts has not been published in the literature yet. However, the activity of the present catalysts is comparable with the activities of other active catalysts measured at similar reaction conditions. For CuxCo1–xCo2O4 and NixCo1–xCo2O4 (0.0 ≤ x ≤ 1.0) spinel-oxide catalysts, the highest activity (100% convesion) was obtained at 500 °C by the catalysts with x = 0.75 and 0.50, respectively [7,8]. Among a series of alkali-doped NiO catalysts, the K- and Cs-promoted catalysts (M/Ni molar ratio = 0.05) showed the highest activity levels [24]. The activity of the present catlysts is higher than that of the Gd-, La-, and Sm-promoted CuO catalysts prepared by the same procedure [21,22].
Some research groups correlate the enhancement of N2O decomposition activity with the improved reducibility of catalysts. In this context, it was shown that Cu2+ substitution and K+ doping of Co3O4 spinel is accompanied by Co3+ → Co2+ reduction improvement and Co2+ stabilization, respectively [15]. Highly active catalysts for N2O decomposition was obtained by fine tuning of these two parameters. Pasha et al. [23] reported a direct correlation between the low- temperature H2-TPR peak shift of Cs-promoted NiO and its N2O decomposition activity. The activity of RE (Gd, La, Nd, Pr, Sm, Tb, Y)-promoted CuO catalysts was correlated with their ability to enhance CuO reduction [21,22]. To elucidate the reasons for the activity performance of our catalysts, their reduction behavior was studied by H2-TPR technique. H2-TPR profiles of NiO and it RE-promoted catalysts are displayed in Figure 10. Bare NiO shows one major asymmetric reduction peak, which is maximized at 362 °C and has a shoulder at around 288 °C. This indicates an overlap of multiple reduction peaks. With the aid of literature data, the lower temperature peak could be assigned to the NiO → NiO1+δ, whereas the higher temperature one could be due to NiO1+δ → Ni0 transformation [23,41,42] The peak temperatures for the major Ni2+ reduction of Gd/NiO, La/NiO and Sm/NiO are 374, 368 and 369 °C, respectively. Apparently, the reducibility of the NiO is not improved by RE-oxide addition. Therefore, the NiO reducibility enhancement is not a major reason for the activity increase upon the NiO doping with the RE-oxides.
The reported N2O decomposition mechanism on various metal oxide catalysts involves the following steps: (i) N2O adsorption via electron donation from the catalyst surface to the adsorbate; (ii) N–O bond destabilization, which leads to its scission and the liberation of N2 molecule and the formation of an adsorbed O species; and (iii) recombination of two O species and desorption of one oxygen molecule. Thus, this reaction requires the coexistence of a redox couple on the catalysts surfaces, such as Co2+–Co3+ [7,8,9,10,11,12,13,14,15,16,43], Cu+–Cu++ [21,22], Ni0–Ni2+ [23,24]. In this respect, our XPS analysis (Figure 7) revealed the presence of Ni0–Ni2+ redox couple on the surfaces of bare NiO and Gd-promoted NiO. For alkali-promoted NiO catalysts, it was shown that the added alkali cations shift the Ni 2p3/2 peak towards lower BE values, which leads to the formation of electron-rich Ni0 phase at the catalyst surface [24]. This electron-rich Ni0 phase can donate more elections, thus enhancing the N2O adsorption and decomposition [24]. Based on the Co 2p3/2 XPS-peak shift towards lower BE values, Asano et al. [43] suggested a similar induced electronic promotion via doping Co3O4 with potassium ions. Our XPS results (Figure 7) revealed the coexistence of Ni0 and Ni2+ species on the catalysts surfaces, which suggests that these two species are involved in the N2O decomposition over the tested catalysts. Moreover, the absence of the BE of Ni 2p3/2 peak to lower values indicates that the high catalytic activity for the RE-promoted catalysts cannot be ascribed to the electronic promotion and the formation of the so called “surface-electron-rich Ni0 species.” Throughout N2 adsorption measurements (Table 1), it was concluded that the incorporation of the various RE-oxides into NiO accompanied by a sharp increase in its BET surface area. Therefore, it is plausible to relate the obtained activity increase to the surface area increase resulting from the RE-oxide incorporation. In this regard, synergic effect was reported upon doping NiO with Ba and Ce during N2O decomposition [27]. The H2-TPR investigations for these catalysts revealed the absence of any reduction improvement accompanying the Ba and Ce doping. From the BET surface area increase, it was concluded that the role of Ce is to increase the population of active sites for the reaction [27].

3. Materials and Methods

3.1. Catalysts Preparation

A series of bare NiO and NiO promoted-RE (Gd, La, Sm) catalysts were prepared using the microwave-assisted precipitation method. The RE/Ni ratio was adjusted to be 0.05 in all preparations. Initially, bare NiO was prepared by dissolving 3.893 g of nickel nitrate (Ni(NO3)2.6H2O) (Alfa Aesar Co., Karlsruhe, Germany) in 25 mL of distilled water. A solution containing 2.439 g of cetyltrimethylammonium bromide (CTAB) (Alfa Aesar Co., Karlsruhe, Germany) dissolved in 25 mL distilled water was mixed and stirred with nickel nitrate solution. An oxalic acid solution (1.40 g in 50 mL of distilled water) was, then, added and the obtained mixture was immediately irradiated by microwave with the power of 280 W for 10 min. The obtained precipitate was left to cool at room temperature, then separated by successive centrifugation with distilled water. The resultant nickel oxalate was dried overnight at 50 °C. Finally, NiO was obtained by calcining the dried nickel oxalate at 500 °C, in air, for 1 h. NiO promoted-RE catalysts were prepared using a similar procedure. Briefly, the stoichiometric amounts of nickel nitrate and the RE nitrates (Gd(NO3)3.6H2O, La(NO3)3.6H2O, Sm(NO3)3.6H2O) (Alfa Aesar Co., Karlsruhe, Germany) were co-precipitated employing oxalic acid as precipitant and CTAB as surfactant at a microwave power of 280 W for 10 min. Finally, the RE/NiO catalysts were obtained by calcining the dried precipitates at 500 °C in air, for 1 h.

3.2. Characterization Techniques

The prepared solids were characterized using various techniques. The thermal behavior of the prepared bare Ni oxalate and RE/Ni oxalates was checked using thermogravimetric analysis (TGA) with the aid of TA instrument (Lukens Drive, New Castle, DE, USA) apparatus (model TGA-Q500). The experiments were performed using 5 mg of each sample, a heating rate of 10 °C·min−1 and a nitrogen flow rate of 40 mL·min−1. The crystalline structure was determined using the X-ray powder diffraction (XRD). A Thermo-Scientific ARL X’TRA Powder Diffractometer (Thermo Fisher Scientific Co., Ecublens, Switzerland) was used for the XRD investigations, which employed Cu Kα radiation (λ = 0.154 nm). FT-IR spectra were collected on Nicolet iS50 FT-IR spectrometer employing ATR sampling accessory. The morphology and the particle size of the prepared catalysts were investigated with electron microscopy techniques. TEM images were taken using TECNAI-G2 Spirit EWIN microscope (FEI Co., Hillsboro, OR, USA), which operated at 120 kV. FE-SEM investigations were performed on a JEOL model JSM-7600F microscope (JEOL Co., Tokyo, JAPAN). Nitrogen adsorption isotherms, measured at −196 °C, of the catalyst were constructed using automated nitrogen adsorption apparatus (QUADRASORB evo, Quantachrome Co., Boynton Beach, FL, USA). Each adsorbent was degassed at 250 °C for 12 h before the measurement. The X-ray photoelectron spectroscopy (XPS) measurements were conducted using a SPECS GmbH X-ray photoelectron spectrometer using Al-Kα (1486.6 eV) source, which operated at 13.5 kV and 5 × 10⁻¹⁰ mbar. The binding energies were determined using carbon 1 s binding energy of 284.6 eV reference. Catalysts temperature-programmed reduction with hydrogen (H2-TPR) was performed on Micromeritics AutoChem II 2920 apparatus (Quantachrome Co., Boynton Beach, FL, USA), which operated with a TCD detector. Each catalyst was pre-treated in helium at 300 °C for 30 min and cooled down to 40 °C. The flow of the gas was then switched from He to 10% H2 in Ar and the sample temperature increased to 700 °C at a heating rate of 5 °C·min−1.

3.3. Catalytic Decomposition of N2O

N2O direct decomposition experiments were carried out in a quartz-glass fixed bed continuous flow reactor. The reactant gas mixture, 500 ppm N2O in He, was passed over 500 mg catalyst at a total flow rate of 200 mL·min−1, which led to the W/F value of 0.15 g·s·cm−3. The measurements were performed in the temperature range between 150 and 500 °C at atmospheric pressure. Before each catalytic run, the catalyst was activated at 500 °C in helium flow (200 mL·min−1) for 1 h. The reactant gas (500 ppm N2O in He) was introduced to the catalyst bed with the aid of Bronkhorst thermal mass flow controllers. The effluent gas was analyzed by using non-dispersive infrared analyzer (Hartmann and Braun, Uras 10E). The measurements were performed under isothermal conditions using the same sample of catalyst during the whole run. The steady state was reached after about 30–45 min for the various catalysts.

4. Conclusions

In this study, bare NiO and its Gd-, La-, and Sm-promoted catalysts were prepared by the calcination, at 500 °C, of their oxalates, previously prepared by the microwave-assisted precipitation route. Bulk and surface analysis of the obtained solids revealed that the preparation method leads to the formation of nanostructured materials. Moreover, the incorporation of the various RE oxides into NiO is accompanied by dramatic morphological and textural modifications. RE oxides induces a rectanguloid to rice-like morphology transformation. In addition, these promoters decrease the crystallites’ size and increase both the specific surface area and pore volume. The N2O decomposition over NiO catalysts promoted by RE elements was investigated to elucidate the effect of additives on the catalytic activity. The obtained results demonstrate that the presence of RE oxides enhances NiO activity markedly. Based on the absence of NiO reduction improvement, the higher activity of the RE-promoted catalysts was attributed to their role in enhancing the textural properties of NiO catalyst.

Acknowledgments

This project was funded by the National Plan for Science, Technology and Innovation (MAARIFAH)—King Abdulaziz City for Science and Technology—the Kingdom of Saudi Arabia—award number (12-ENV2756-03). The authors also gratefully acknowledge the Science and Technology Unit, King Abdulaziz University for technical support.

Author Contributions

B.M.A., S.M.B., and S.A.K. performed catalyst preparation. B.M.A., S.M.B., S.A.K. and W.S. participated in the catalyst characterization, activity evaluation, data analysis and manuscript writing. The final version of the manuscript was approved by all the authors.

Conflicts of Interest

The authors declare no conflicts of interest.

References

  1. Centi, G.; Perathoner, S.; Vazzana, F.; Marella, M.; Tomaselli, M.; Mantegazza, M. Novel catalysts and catalytic technologies for N2O removal from industrial emissions containing O2, H2O and SO2. Adv. Environ. Res. 2000, 4, 325–338. [Google Scholar]
  2. Kapteijn, F.; Rodriguez-Mirasol, J.; Moulijn, J.A. Heterogeneous catalytic decomposition of nitrous oxide. Appl. Catal. B 1996, 9, 25–64. [Google Scholar]
  3. Pérez-Ramírez, J.; Kapteijn, F.; Schöffel, K.; Moulijn, J.A. Formation and control of N2O in nitric acid production where do we stand today? Appl. Catal. B 2003, 44, 117–151. [Google Scholar]
  4. Pérez-Ramírez, J. Prospects of N2O emission regulations in the European fertilizer industry. Appl. Catal. B 2007, 70, 31–35. [Google Scholar]
  5. Yan, L.; Ren, T.; Wang, X.; Ji, D.; Suo, J. Catalytic decomposition of N2O over MxCo1−xCo2O4 (M = Ni, Mg) spinel oxides. Appl. Catal. B 2003, 45, 85–90. [Google Scholar]
  6. Yan, L.; Ren, T.; Wang, X.; Gao, Q.; Ji, D.; Suo, J. Excellent catalytic performance of ZnxCo1−xCo2O4 spinel catalysts for the decomposition of nitrous oxide. Catal. Commun. 2003, 4, 505–509. [Google Scholar]
  7. Abu-Zied, B.M.; Soliman, S.A.; Abdellah, S.E. Enhanced direct N2O decomposition over CuxCo1−xCo2O4 (0.0 ≤ x ≤ 1.0) spinel-oxide catalysts. J. Ind. Eng. Chem. 2015, 21, 814–821. [Google Scholar]
  8. Abu-Zied, B.M.; Soliman, S.A.; Abdellah, S.E. Pure and Ni-substituted Co3O4 spinel catalysts for direct N2O decomposition. Chin. J. Catal. 2014, 35, 1105–1112. [Google Scholar]
  9. Stelmachowski, P.; Zasada, F.; Maniak, G.; Granger, P.; Inger, M.; Wilk, M.; Kotarba, A.; Sojka, Z. Optimization of multicomponent cobalt spinel catalyst for N2O abatement from nitric acid plant tail gases: Laboratory and pilot plant studies. Catal. Lett. 2009, 130, 637–641. [Google Scholar]
  10. Xue, L.; Zhang, C.; He, H.; Teraoka, Y. Catalytic decomposition of N2O over CeO2 promoted Co3O4 spinel catalyst. Appl. Catal. B 2007, 75, 167–174. [Google Scholar]
  11. Abu-Zied, B.M.; Soliman, S.A. Nitrous oxide decomposition over MCO3–Co3O4 (M = Ca, Sr, Ba) catalysts. Catal. Lett. 2009, 132, 299–310. [Google Scholar]
  12. Basahel, S.N.; Abd El-Maksod, I.H.; Abu-Zied, B.M.; Mokhtar, M. Effect of Zr4+ doping on the stabilization of ZnCo-mixed oxide spinel system and its catalytic activity towards N2O decomposition. J. Alloys Compd. 2010, 493, 630–635. [Google Scholar]
  13. Maniak, G.; Stelmachowski, P.; Kotarba, A.; Sojka, Z.; Rico-Pérez, V.; Bueno-López, A. Rationales for the selection of the best precursor for potassium doping of cobalt spinel based deN2O catalyst. Appl. Catal. B 2013, 136, 302–307. [Google Scholar]
  14. Abu-Zied, B.M. Nitrous oxide decomposition over alkali-promoted magnesium cobaltite catalysts. Chin. J. Catal. 2011, 32, 264–272. [Google Scholar]
  15. Franken, T.; Palkovits, R. Investigation of potassium doped mixed spinels CuxCo3−xO4 as catalysts for an efficient N2O decomposition in real reaction conditions. Appl. Catal. B 2015, 176, 298–305. [Google Scholar]
  16. Klyushina, A.; Pacultová, K.; Krejčová, S.; Słowik, G.; Jirátová, K.; Kovanda, F.; Ryczkowski, J.; Obalová, L. Advantages of stainless steel sieves as support for catalytic N2O decomposition over K-doped Co3O4. Catal. Today 2015, 257, 2–10. [Google Scholar]
  17. Amrousse, R.; Katsumi, T. Substituted ferrite MxFe1−xFe2O4 (M = Mn, Zn) catalysts for N2O catalytic decomposition processes. Catal. Commun. 2012, 26, 194–198. [Google Scholar]
  18. Amrousse, R.; Tsutsumi, A.; Bachar, A.; Lahcene, D. N2O catalytic decomposition over nano-sized particles of Co-substituted Fe3O4 substrates. Appl. Catal. A 2013, 450, 253–260. [Google Scholar]
  19. Wang, J.; Feng, M.; Zhang, H.-J.; Xu, X.-F. Catalytic decomposition of N2O over Mg-Fe mixed oxides. J. Fuel Chem. Technol. 2014, 42, 1464–1469. [Google Scholar]
  20. Pasha, N.; Lingaiah, N.; Reddy, P.S.S.; Sai Prasad, P.S. Direct decomposition of N2O over cesium-doped CuO catalysts. Catal. Lett. 2009, 127, 101–106. [Google Scholar]
  21. Abu-Zied, B.M.; Bawaked, S.M.; Kosa, S.A.; Schwieger, W. Effect of Some Rare Earth Oxides Doping on the Morphology, Crystallite Size, Electrical Conductivity and N2O Decomposition Activity of CuO Catalyst. Int. J. Electrochem. Sci. 2016, 11, 1568–1580. [Google Scholar]
  22. Abu-Zied, B.M.; Bawaked, S.M.; Kosa, S.A.; Schwieger, W. Impact of Gd-, La-, Nd- and Y-doping on the textural, electrical conductivity and N2O decomposition activity of CuO Catalyst. Int. J. Electrochem. Sci. 2016, 11, 2230–2246. [Google Scholar]
  23. Pasha, N.; Lingaiah, N.; Reddy, P.S.S.; Sai Prasad, P.S. An investigation into the effect of Cs promotion on the catalytic activity of NiO in the direct decomposition of N2O. Catal. Lett. 2007, 118, 64–68. [Google Scholar] [CrossRef]
  24. Abu-Zied, B.M.; Asiri, A.M. The role of alkali promoters in enhancing the direct N2O decomposition reactivity over NiO catalysts. Chin. J. Catal. 2015, 36, 1837–1845. [Google Scholar]
  25. Wu, H.-P.; Li, W.-J.; Guo, L.; Pan, Y.-F.; Xu, X.-F. Effect of promoter species and precursors on catalytic activity of alkali metal promoted NiAl mixed oxides for N2O decomposition. J. Fuel Chem. Technol. 2011, 39, 550–555. [Google Scholar] [CrossRef]
  26. Zhang, F.; Wang, X.; Zhang, X.; Tursun, M.; Yu, H. Promotion by Co of a NiO-BaCO3 catalyst for N2O decomposition. Chin. J. Catal. 2015, 36, 344–347. [Google Scholar]
  27. Zhang, F.; Wang, X.; Zhang, X.; Turxun, M.; Yu, H.; Zhao, J. The catalytic activity of NiO for N2O decomposition doubly promoted by barium and cerium. Chem. Eng. J. 2014, 256, 365–371. [Google Scholar] [CrossRef]
  28. Barakat, A.; Al-Noaimi, M.; Suleiman, M.; Aldwayyan, A.S.; Hammouti, B.; Ben Hadda, T.; Haddad, S.F.; Boshaala, A.; Warad, I. One step synthesis of NiO nanoparticles via solid-state thermal decomposition at low-temperature of novel aqua(2,9-dimethyl-1,10-phenanthroline)NiCl2 complex. Int. J. Mol. Sci. 2013, 14, 23941–23954. [Google Scholar] [CrossRef] [PubMed]
  29. El-Kemary, M.; Nagy, N.; El-Mehasseb, I. Nickel oxide nanoparticles: Synthesis and spectral studies of interactions with glucose. Mater. Sci. Semicond. Process. 2013, 16, 1747–1752. [Google Scholar] [CrossRef]
  30. Abu-Zied, B.M.; Soliman, S.A. Thermal decomposition of praseodymium acetate as a precursor of praseodymium oxide catalyst. Thermochim. Acta 2008, 470, 91–97. [Google Scholar] [CrossRef]
  31. Abu-Zied, B.M.; Bawaked, S.M.; Kosa, S.A.; Schwieger, W. Effect of Pr, Sm, and Tb doping on the morphology, crystallite size, and N2O decomposition activity of Co3O4 nanorods. J. Nanomater. 2015, 2015, 580582:1–580582:10. [Google Scholar] [CrossRef]
  32. Leofanti, G.; Padovan, M.; Tozzola, G.; Venturelli, B. Surface area and pore texture of catalysts. Catal. Today 1998, 41, 207–219. [Google Scholar] [CrossRef]
  33. Piumetti, M.; Hussain, M.; Fino, D.; Russo, N. Mesoporous silica supported Rh catalysts for high concentration N2O decomposition. Appl. Catal. B 2015, 165, 158–168. [Google Scholar] [CrossRef]
  34. Babu, G.A.; Hayakawa, Y.; Ravi, G. Microwave synthesis and magnetic investigations of surfactant assisted NiO nanostructures. Mater. Lett. 2015, 149, 54–57. [Google Scholar] [CrossRef]
  35. Kaichev, V.V.; Gladky, A.Y.; Prosvirin, I.P.; Saraev, A.A.; Hävecker, M.; Knop-Gericke, A.; Schlögl, R.; Bukhtiyarov, V.I. In situ XPS study of self-sustained oscillations in catalytic oxidation of propane over nickel. Surf. Sci. 2013, 609, 113–118. [Google Scholar] [CrossRef]
  36. Guil-López, R.; La Parola, V.; Peña, M.A.; Fierro, J.L.G. Evolution of the Ni-active centres into ex hydrotalcite oxide catalysts during the COx-free hydrogen production by methane decomposition. Int. J. Hydrogen Energy 2012, 37, 7042–7055. [Google Scholar] [CrossRef]
  37. Rodríguez, J.L.; Valenzuela, M.A.; Poznyak, T.; Lartundo, L.; Chairez, I. Reactivity of NiO for 2,4-D degradation with ozone: XPS studies. J. Hazard. Mater. 2013, 262, 472–481. [Google Scholar]
  38. Biesinger, M.C.; Payne, B.P.; Lau, L.W.M.; Gerson, A.; Smart, R.St.C. X-ray photoelectron spectroscopic chemical state quantification of mixed nickel metal, oxide and hydroxide systems. Surf. Interf. Anal. 2009, 41, 324–332. [Google Scholar] [CrossRef]
  39. Payne, B.P.; Biesinger, M.C.; McIntyre, N.S. Use of oxygen/nickel ratios in the XPS characterisation of oxide phases on nickel metal and nickel alloy surfaces. J. Electron. Spectrosc. Relat. Phenom. 2012, 185, 159–166. [Google Scholar] [CrossRef]
  40. Abu-Zied, B.M.; Asiri, A.M. An investigation of the thermal decomposition of silver acetate as a precursor for nano-sized Ag-catalyst. Thermochim. Acta 2014, 581, 110–117. [Google Scholar] [CrossRef]
  41. Yu, F.; Xu, X.; Peng, H.; Yu, H.; Dai, Y.; Liu, W.; Ying, J.; Sun, Q.; Wang, X. Porous NiO nano-sheet as an active and stable catalyst for CH4 deep oxidation. Appl. Catal. A 2015, 507, 109–118. [Google Scholar] [CrossRef]
  42. Zhou, Q.; Zhou, D.; Wu, Y.; Wu, T. Oxidative dehydrogenation of ethane over RE-NiO (RE = La, Nd, Sm, Gd) catalysts. J. Rare Earths 2013, 31, 669–673. [Google Scholar] [CrossRef]
  43. Asano, K.; Ohnishi, C.; Iwamoto, S.; Shioya, Y.; Inoue, M. Potassium-doped Co3O4 catalyst for direct decomposition of N2O. Appl. Catal. B 2008, 78, 242–249. [Google Scholar] [CrossRef]
Figure 1. TGA thermograms for Ni-oxalate. (a); Gd/Ni-oxalate (b); La/Ni-oxalate (c); and Sm/Ni-oxalate (d).
Catalysts 06 00070 g001
Figure 2. XRD diffractograms of the calcined Ni-oxalate (a); Gd/Ni-oxalate (b); La/Ni-oxalate (c); and Sm/Ni-oxalate (d).
Catalysts 06 00070 g002
Figure 3. FT-IR spectra of the calcined Ni-oxalate. (a); Gd/Ni-oxalate (b); La/Ni-oxalate (c); and Sm/Ni-oxalate (d).
Catalysts 06 00070 g003
Figure 4. FE-SEM images of the calcined NiO. (a); Gd/NiO (b); La/NiO (c); and Sm/NiO (d).
Catalysts 06 00070 g004
Figure 5. TEM images of the calcined NiO. (a); Gd/NiO (b); La/NiO (c); and Sm/NiO (d).
Catalysts 06 00070 g005
Figure 6. Nitrogen adsorption isotherms (a) and pore size distribution curves (b) of the calcined NiO, Gd/NiO, La/NiO and Sm/NiO catalysts.
Catalysts 06 00070 g006
Figure 7. Ni 2p3/2 XPS spectra of bare NiO (a) and Gd/NiO (b) catalysts.
Catalysts 06 00070 g007
Figure 8. O 1s XPS spectra of bare NiO (a) and Gd/NiO (b) catalysts.
Catalysts 06 00070 g008
Figure 9. The influence of the reaction temperature on the N2O conversion over NiO and its RE-promoted catalysts.
Catalysts 06 00070 g009
Figure 10. H2-TPR profiles of the calcined NiO. (a), Gd/NiO (b), La/NiO (c), and Sm/NiO (d).
Catalysts 06 00070 g010
Table 1. Some physical properties for the bare NiO and RE-promoted NiO catalysts.
CatalystCrystallite Size (nm)SBET (m2·g−1)Vp (cc·g−1)Pd (nm)
NiO45170.12015.423
Gd/NiO22370.18812.34
La/NiO25410.22610.377
Sm/NiO25370.20012.351
SBET = BET surface area, Vp = pore volume, Pd = pore diameter.
Table 2. Ni 2p3/2 binding energies and their relative spectral areas of NiO and Gd/NiO catalysts.
CatalystNi0NiO
BE (eV)Area (%)BE (eV)Area (%)
NiO853.5514.96855.2185.04
Gd/NiO853.5312.15855.1387.84

