Article

Co-Pyrolysis Behaviors of the Cotton Straw/PP Mixtures and Catalysis Hydrodeoxygenation of Co-Pyrolysis Products over Ni-Mo/Al2O3 Catalyst

1
Institute of Nuclear and New Energy Technology, Tsinghua University, Beijing 100084, China
2
Gannan Normal University, Chemical Institute of Chemical Industry, Ganzhou 341000, China
3
Beijing Engineering Research Center for Biofuels, Beijing 100084, China
*
Author to whom correspondence should be addressed.
Catalysts 2015, 5(4), 2085-2097; https://doi.org/10.3390/catal5042085
Submission received: 4 October 2015 / Revised: 11 November 2015 / Accepted: 11 November 2015 / Published: 8 December 2015
(This article belongs to the Special Issue Catalytic Conversion of Biomass)

Abstract

:
The doping of PP (polypropylene) with cotton straw improved the bio-oil yield, which showed there was a synergy in the co-pyrolysis of the cotton straw and PP at the range of 380–480 °C. In a fixed-bed reactor, model compounds and co-pyrolysis products were used for reactants of hydrodeoxygenation (HDO) over Ni-Mo/Al2O3. The deoxygenation rate of model compounds decreased over Ni-Mo/Al2O3 in the following order: alcohol > aldehyde > acetic acid > ethyl acetate. The upgraded oil mainly consisted of C11 alkane.

1. Introduction

The decreasing supplies of fossil fuels and chemical feedstocks have made researchers and industry exploit alternative renewable resources. Biomass energy is one of the candidates.
Biomass is a clean and renewable energy [1], and can be converted into bio-oil by the pyrolysis method [2,3,4,5]. Bio-oil mainly consists of oxygenated organic compounds with bad properties, such as corrosiveness, instability, and low calorific value [6,7], which hinder its direct application as transportation fuel. Thus, it is necessary to improve the quality of bio-oil. A promising way to increase the quality and yield of bio-oil is the co-pyrolysis of biomass/synthetic polymer mixtures [8,9,10,11,12]. The co-pyrolysis of mixtures of biomass and synthetic polymers has received attention in recent years [9]. Plastics with approximately 14 wt. %, such as PE (polyethylene) and PP (polypropylene), provide hydrogen to biomass during co-pyrolysis and improve bio-oil quality [9,13,14,15,16]. Besides the co-pyrolysis of mixtures of biomass and synthetic polymers, other methods such as decarboxylation [17,18,19] and aqueous-phase reforming [20] can do the same. It is difficult to remove all oxygen from bio-oil with the aforementioned methods, even when catalysts are used.
Hydroprocessing [21,22] is one of the promising routes to upgrade pyrolysis oils. Hydrodeoxygenation (HDO) [23,24,25,26,27] has great potential on an industrial scale. Thus, pyrolysis oil upgraded by HDO has been investigated from different aspects [28,29,30]. Many catalysts [31,32,33] were investigated. Priecel [34] studied the role of Ni species in the deoxygenation of rapeseed oil. The CoMo-, NiMo-, and NiW-supported catalysts were studied for their excellent activity as bi-metal catalysts [35,36]. Many model compounds were used as reactants to study the HDO process [37,38,39]. Stephen [40] reported the catalytic hydrodeoxygenation of two lignin model compounds (anisole and guaiacol) in the temperature range of 260 to 325 °C. Limin [41] investigated the deoxygenation of long-chain fatty acid esters at mild conditions (200 °C, 3.0 MPa), which provided an energy-economic route to upgrade bio-oils with high oxygen content. However, HDO of the model compounds is different from that of real crude oil over Ni-Mo/Al2O3, so HDO of real crude oil is required over Ni-Mo/Al2O3.
Now, it was controversial to the synergistic interaction in the co-pyrolysis of biomass and synthetic polymers. For hydrodeoxygenation over Ni-Mo/Al2O3, the model compound was often used as a reactant, and crude oil as feedstock was seldom reported. In the study, the co-pyrolysis behavior of a mixture (PP and cotton straw) was investigated under an inert atmosphere by a thermogravimetric analyzer. Then the crude bio-oil was used as feedstock for HDO over Ni-Mo/Al2O3. The upgraded oil was analyzed by GC-MS.

2. Results and Discussion

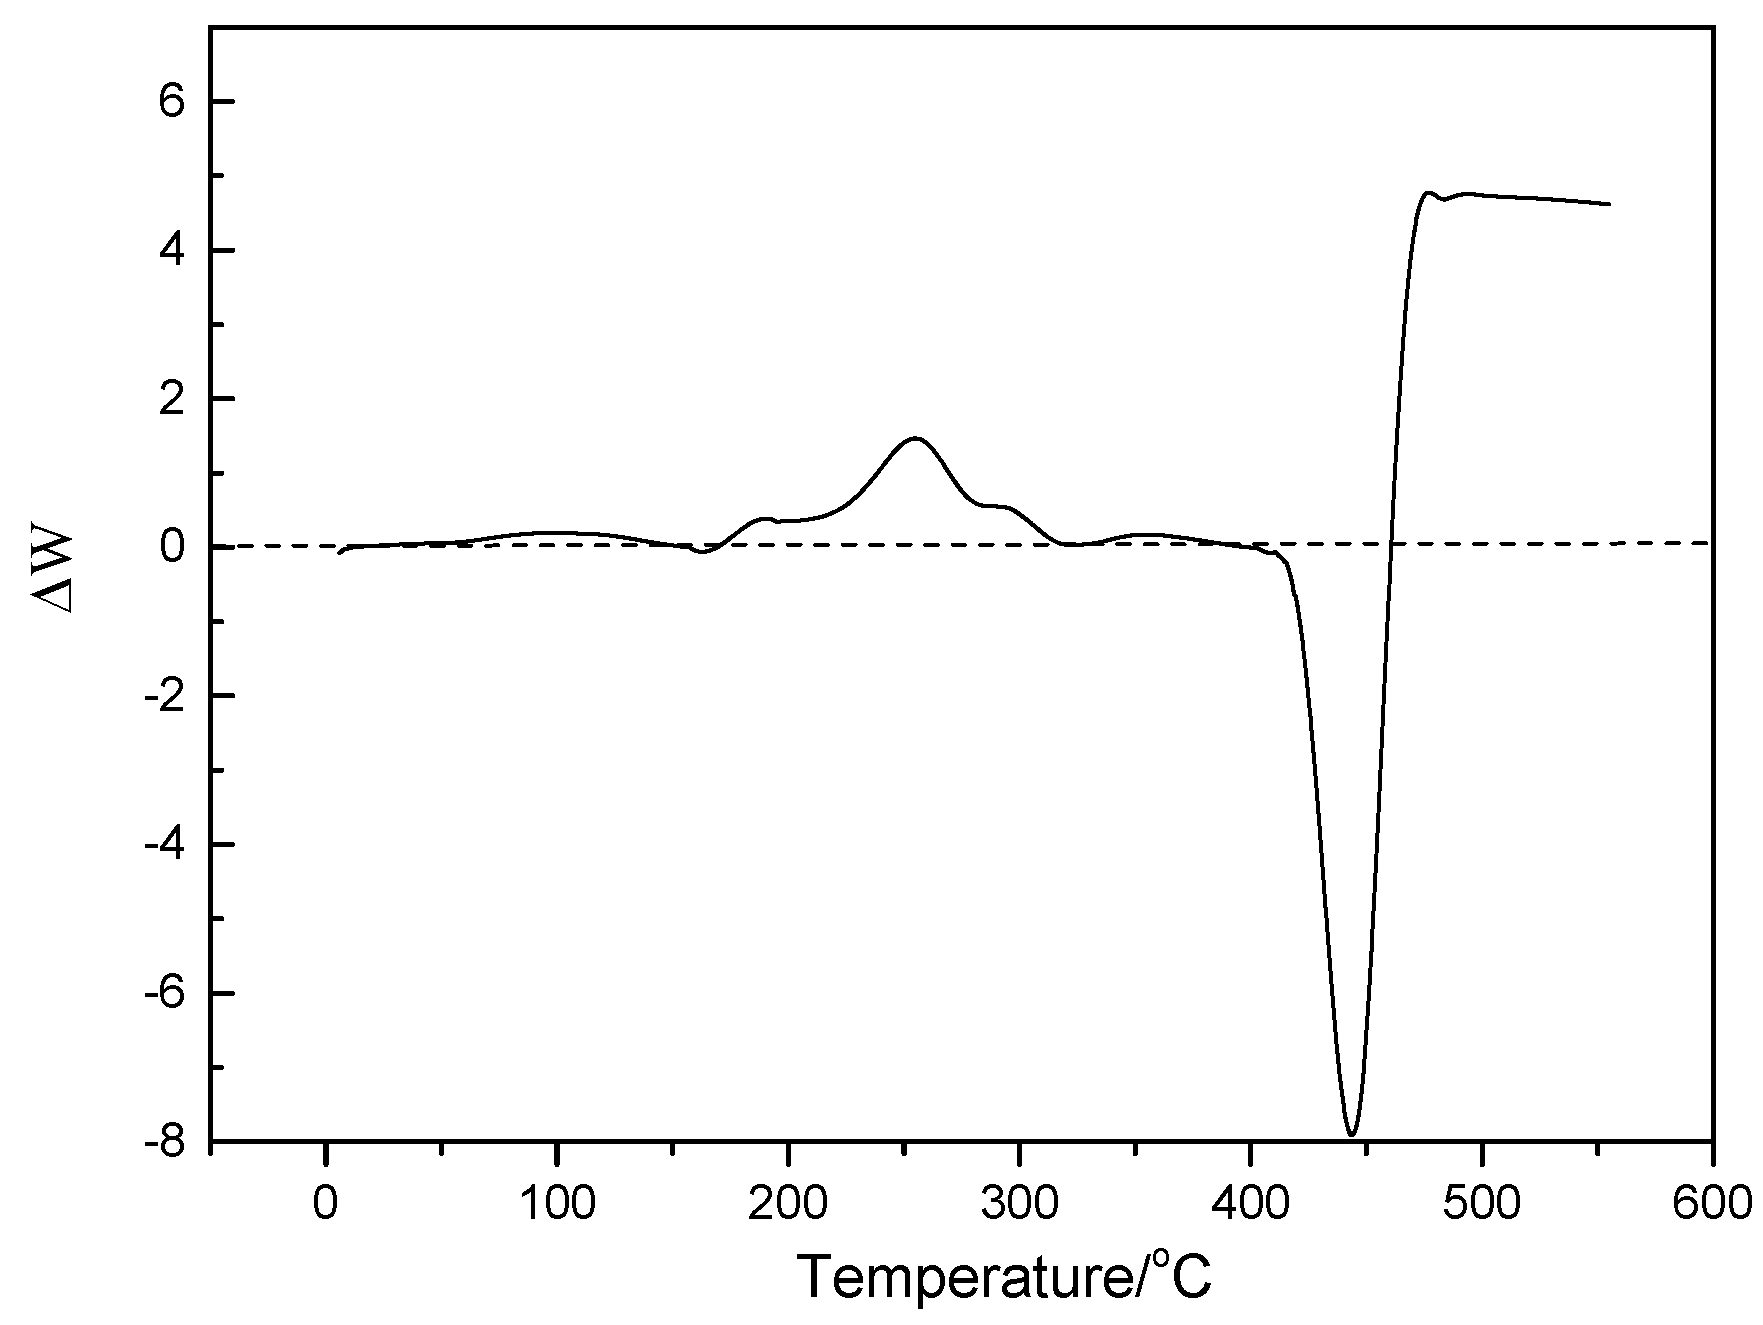
2.1. Preparation of Crude Oil and Thermal Degradation

The effect of PP content on crude oil yield is listed in Table 1. The crude oil yield increased with PP in the range of 0–80 wt. %. The crude oil yield of 43 wt. % was obtained with a mixture of 80 wt. % PP as feedstock, which was 2.0 and 1.3 times that of the cotton straw and PP sample, respectively. The oil yield of the mixture was larger than the weighted sum of PP and cotton straw, indicating there was a synergistic effect between cotton straw and PP, which was contrary to the result reported by Han et al. [42].
Table 1. Effect of PP on oil yield.
PP wt. %02033506780100
127.129.435.839.143.6-
220.022.525.227.329.532.335.4
Note: 1 denotes yield of mixtures of PP/cotton straw; 2 denotes the weighted sum of PP and cotton straw yield.
First, ΔW is defined as an interactive effect parameter and is formulated by Equation (4). Figure 1 shows the variation of ΔW with temperature; ΔW was less than 1% below 180 °C because PP and cotton straw were not decomposed below 180 °C, and there was no synergistic effect. We saw that ΔW was positive at the range of 180–320 °C, which was attributed to the fact that PP was softened at about 180 °C and further heated to produce a plastic state that inhibited the evolution of volatile matter in the cotton straw. Then, ΔW was negative at the range of 380–480 °C. In this stage, cotton straw and PP began to decompose simultaneously in the temperature range, and cotton straw decomposed to form a radical, which can promote PP to degrade, and the weight loss rate of the cotton straw/PP mixture was greater than the weighted average of one obtained from the separate pyrolysis of the sample. The result indicated there was a synergistic effect in the co-pyrolysis of the cotton straw/PP mixture.
Figure 1. Graph shows the ΔW curve of straw and PP mixture.
Catalysts 05 02085 g001
Based on elemental analysis (see Table 2), the calorific value of oil from the pyrolysis of straw was the lowest, which was attributed to the high oxygen content of the product.
Table 2. Elemental analysis of oil.
MaterialsC/%H/%O/%N/%S/%Calorific Value/MJ·kg−1
Cotton straw50.88.7839.80.570.2315.5
PP/cotton straw82.211.36.40.040.0646.9
PP84.714.60.70.000.0049.5
Ratio of PP/cotton straw is 4:1.

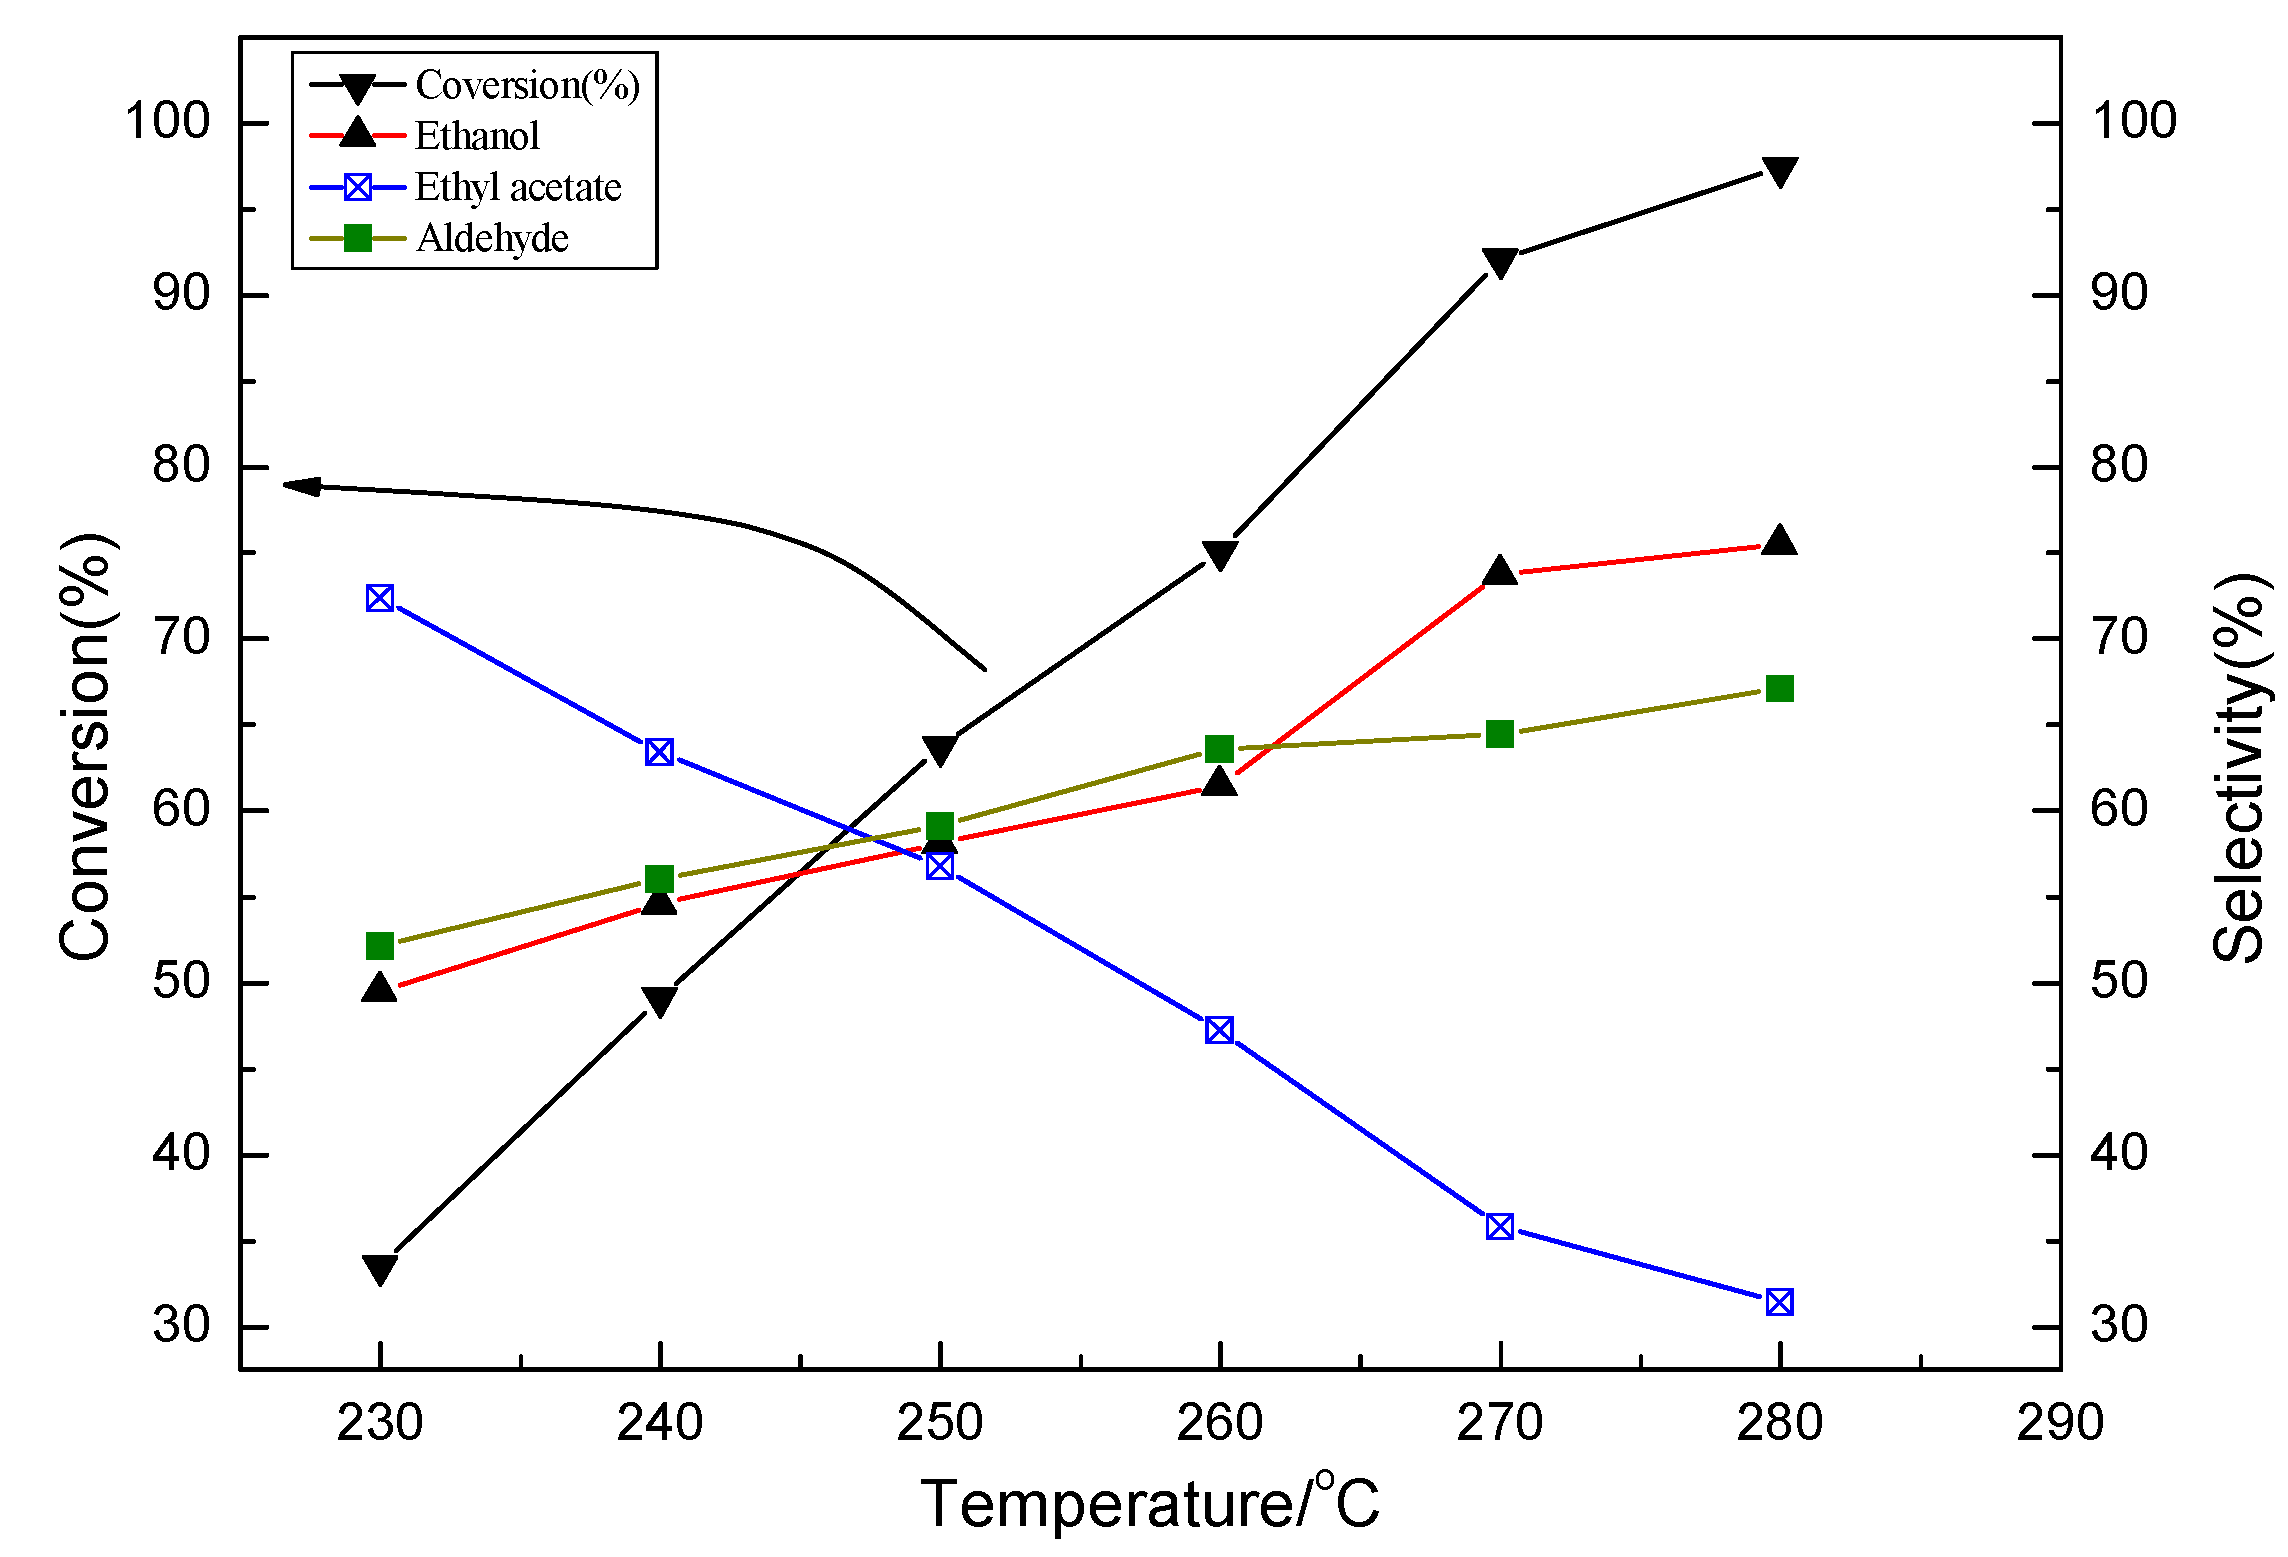
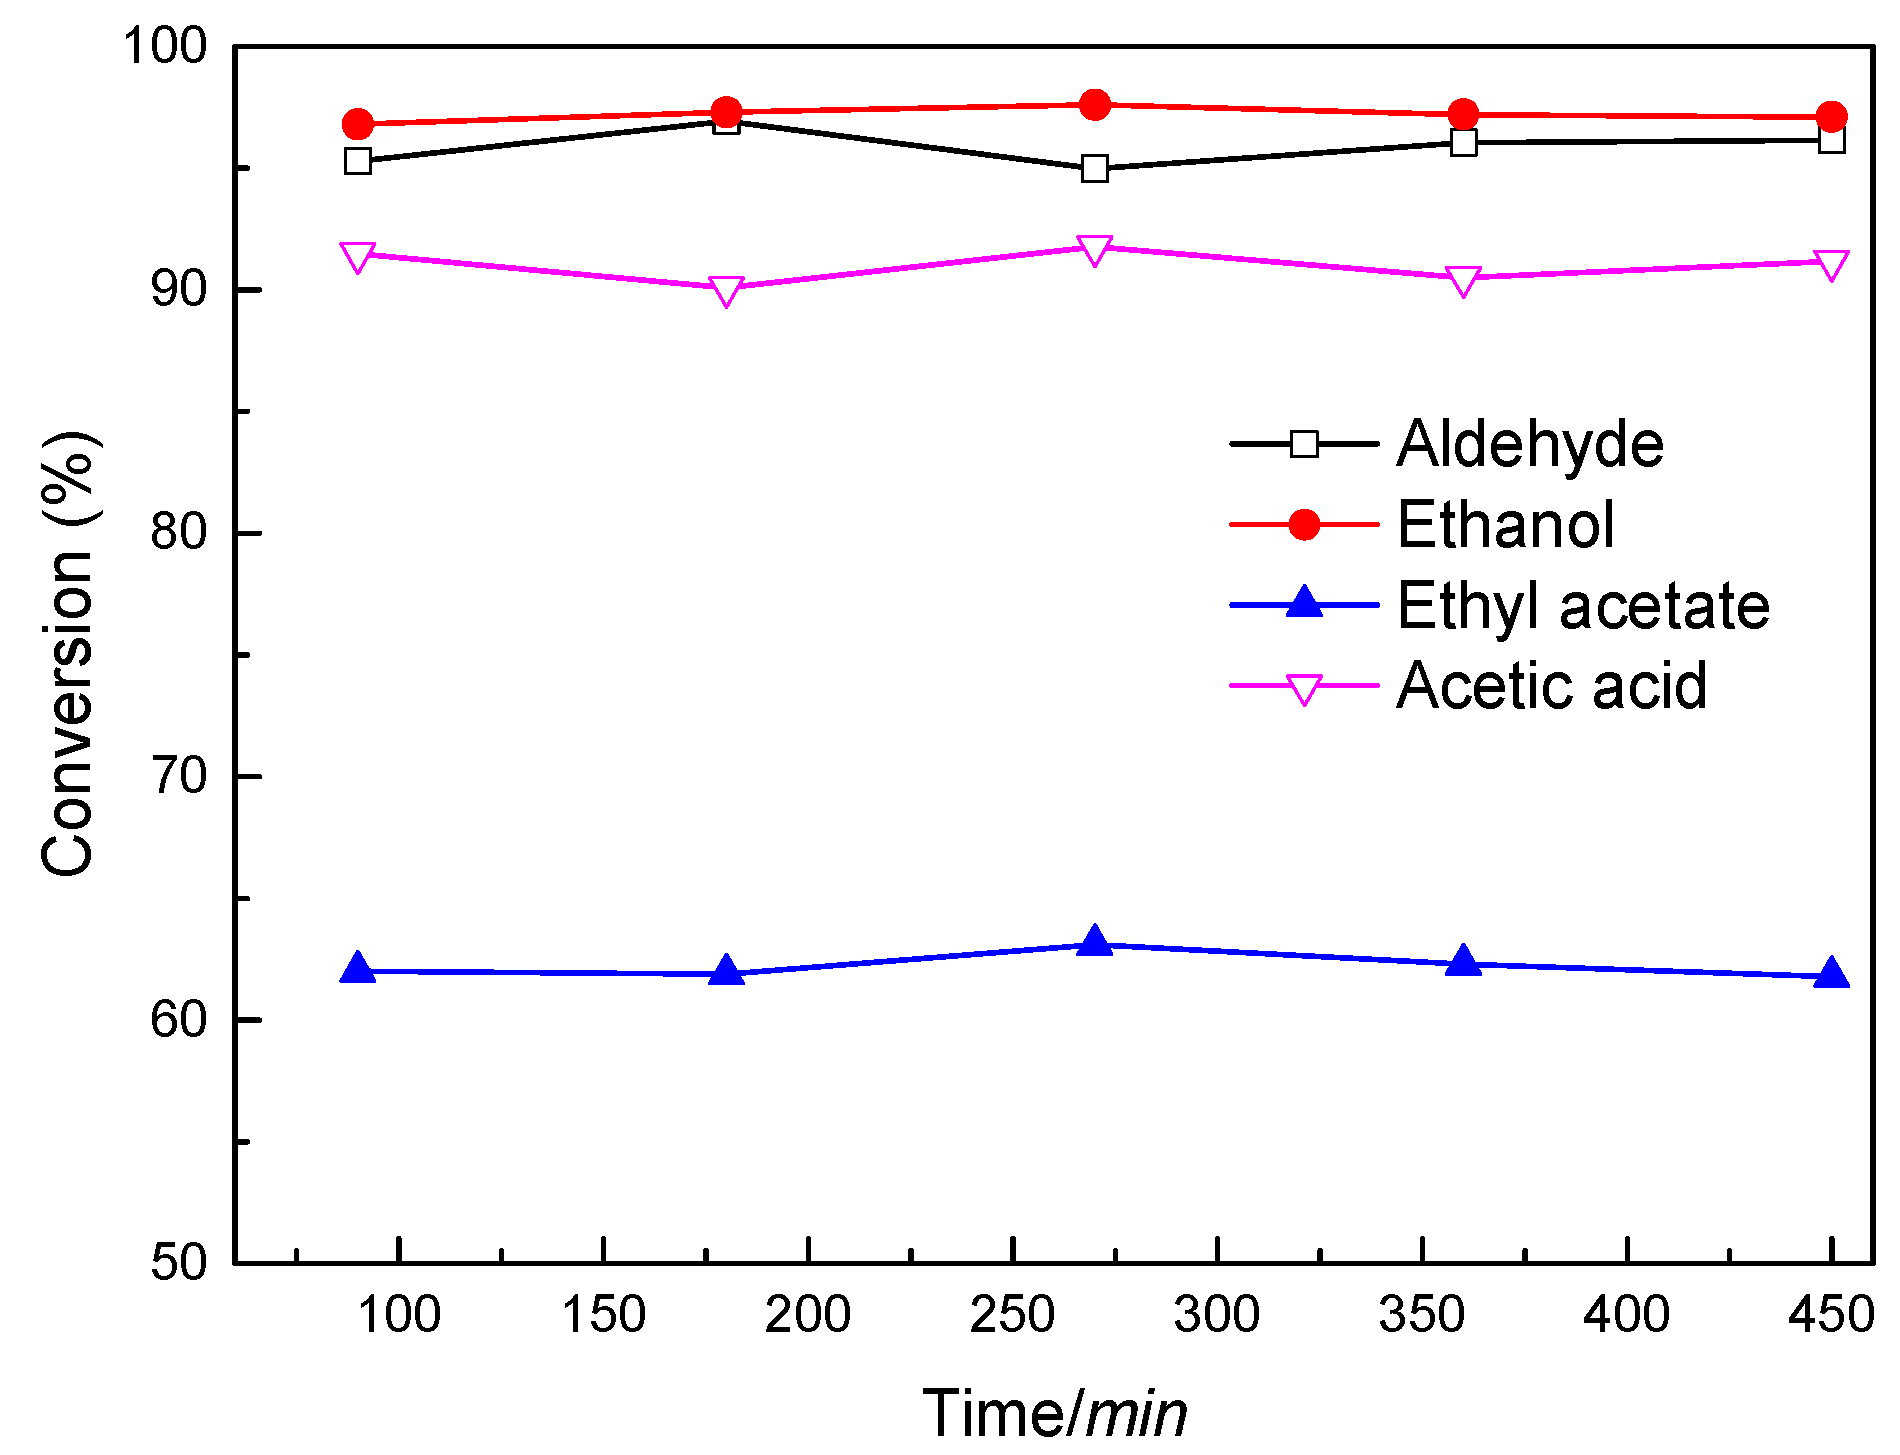
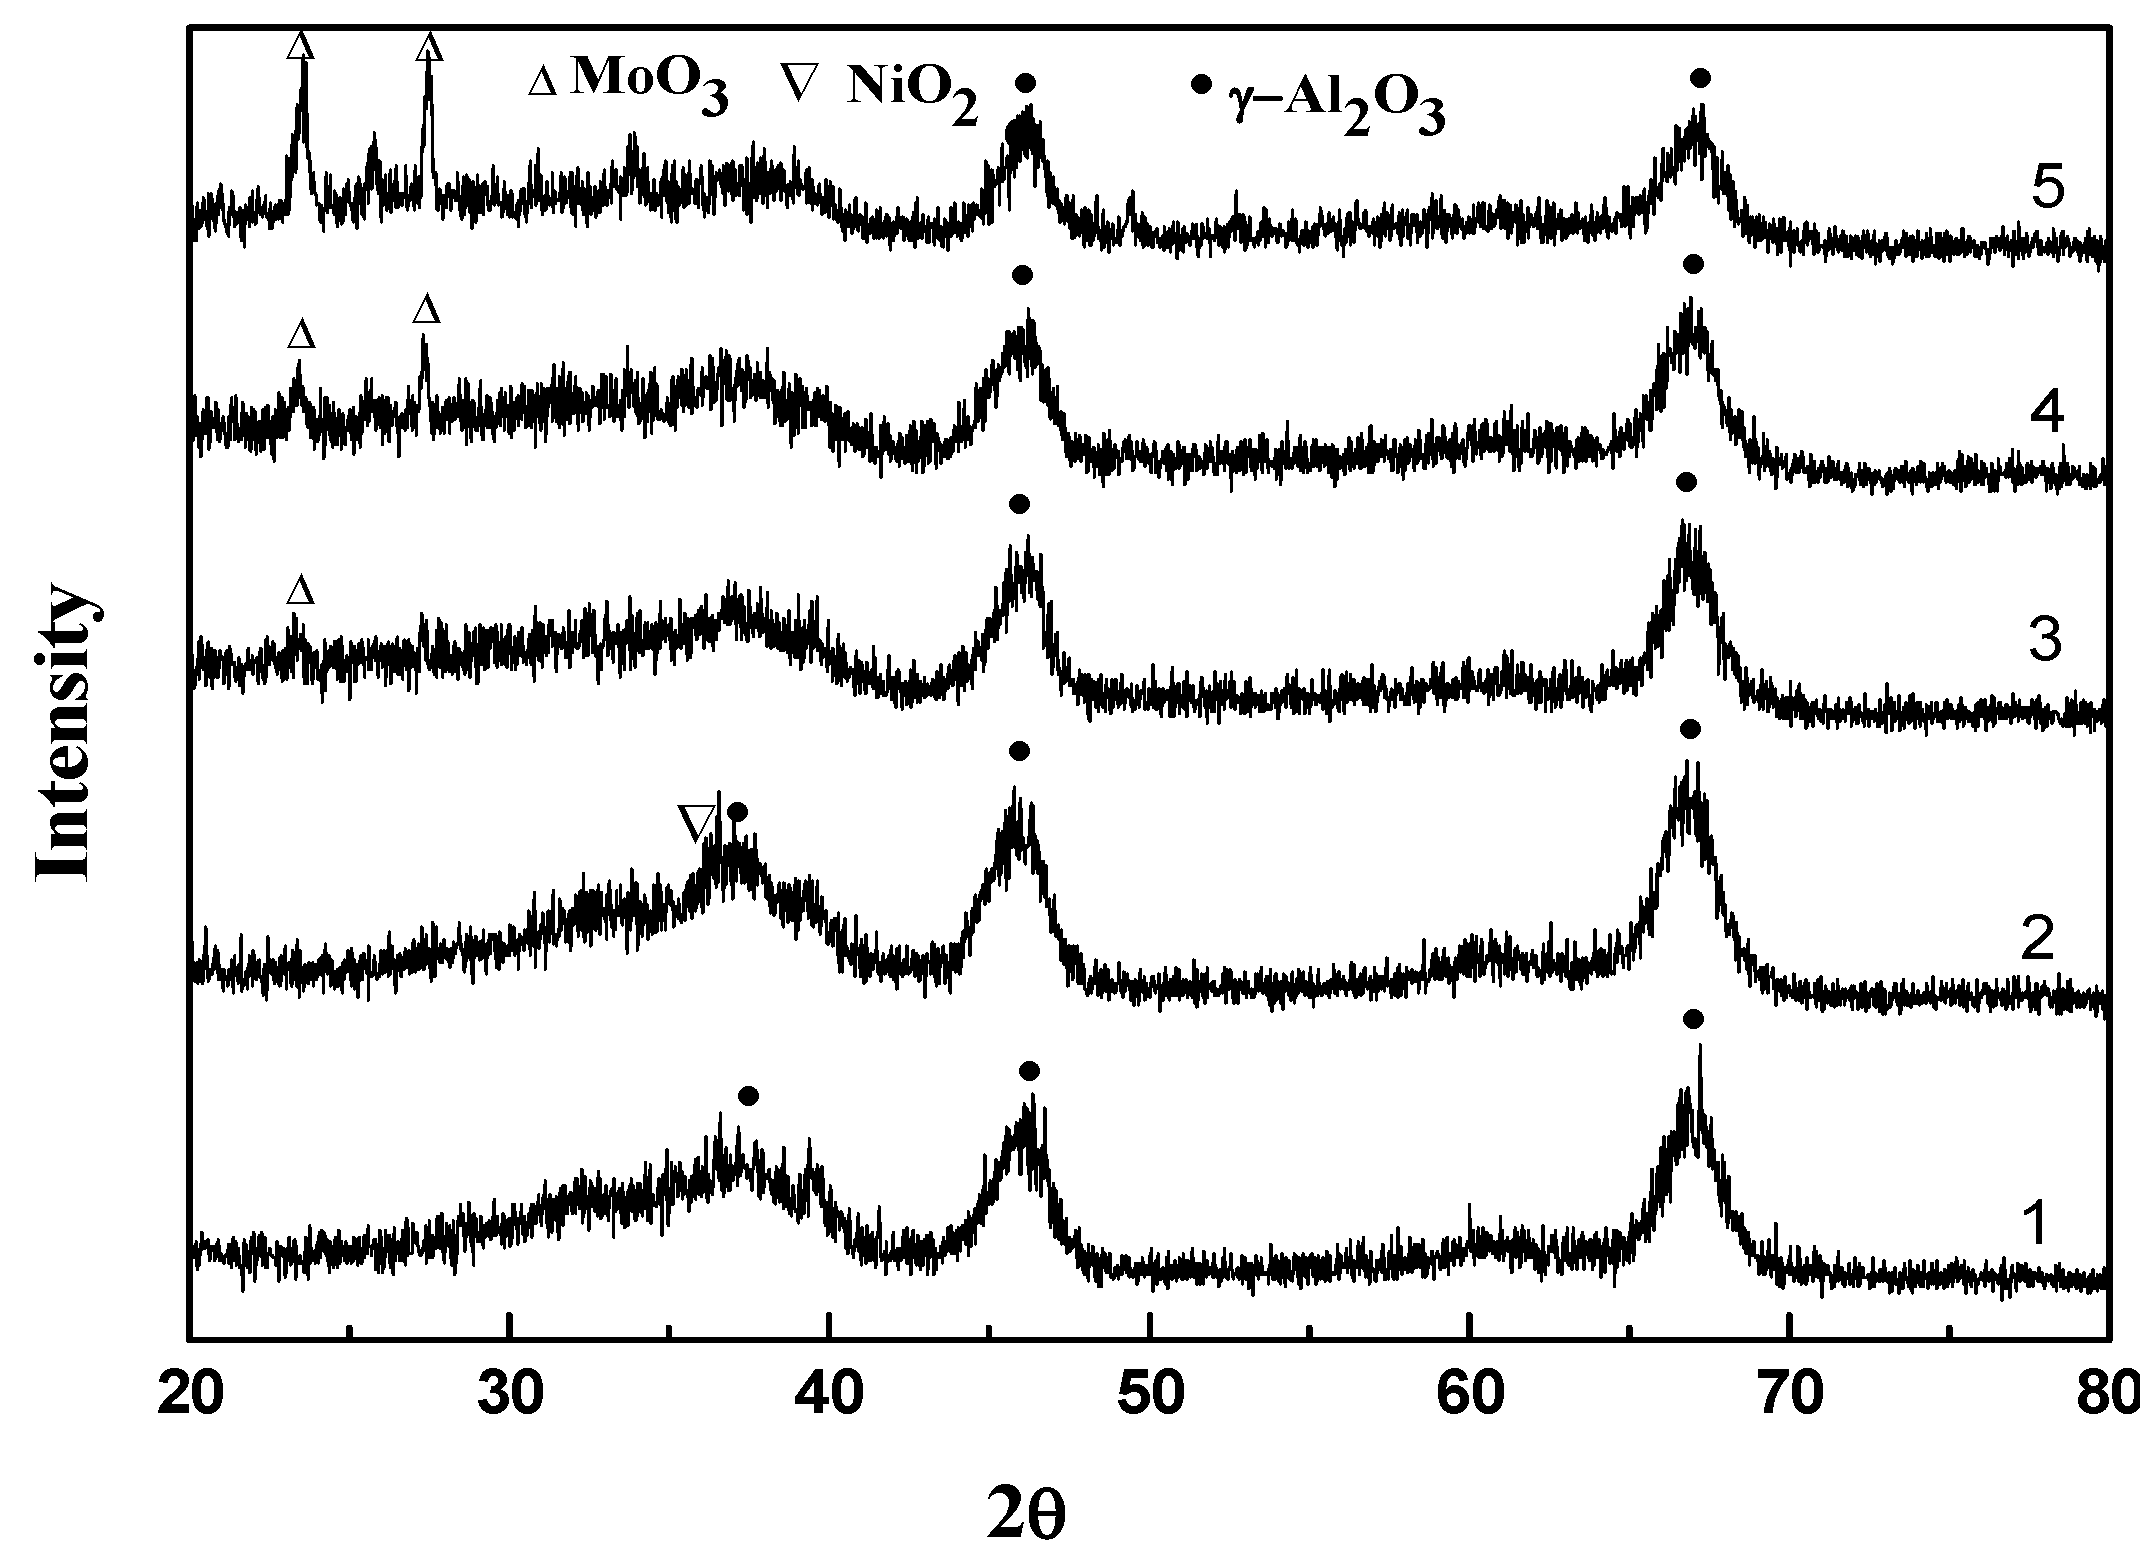
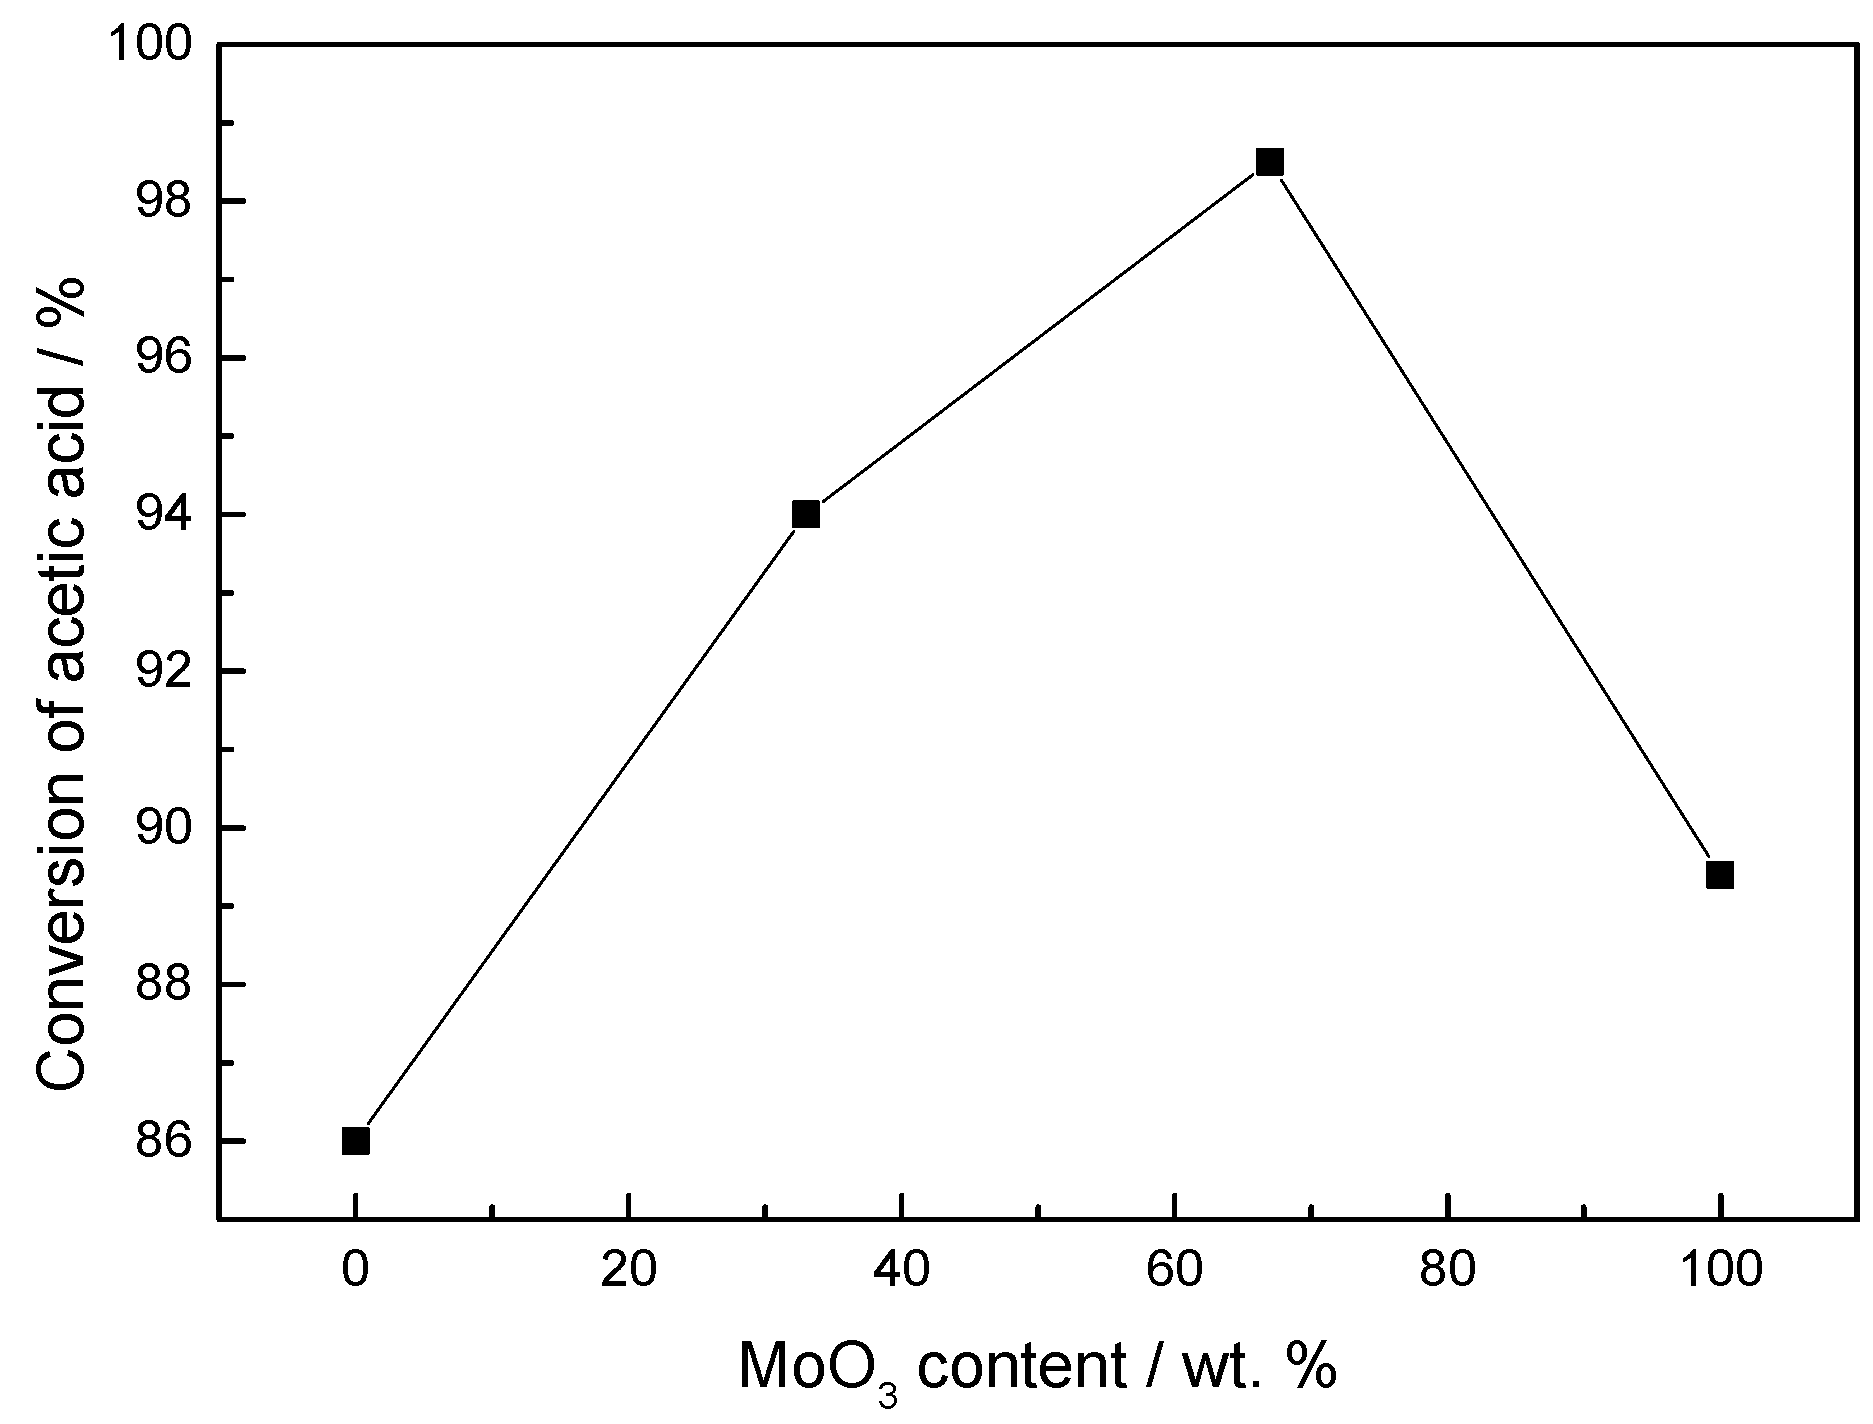
2.2. Characterization and Test of Ni-Mo/Al2O3 Catalyst
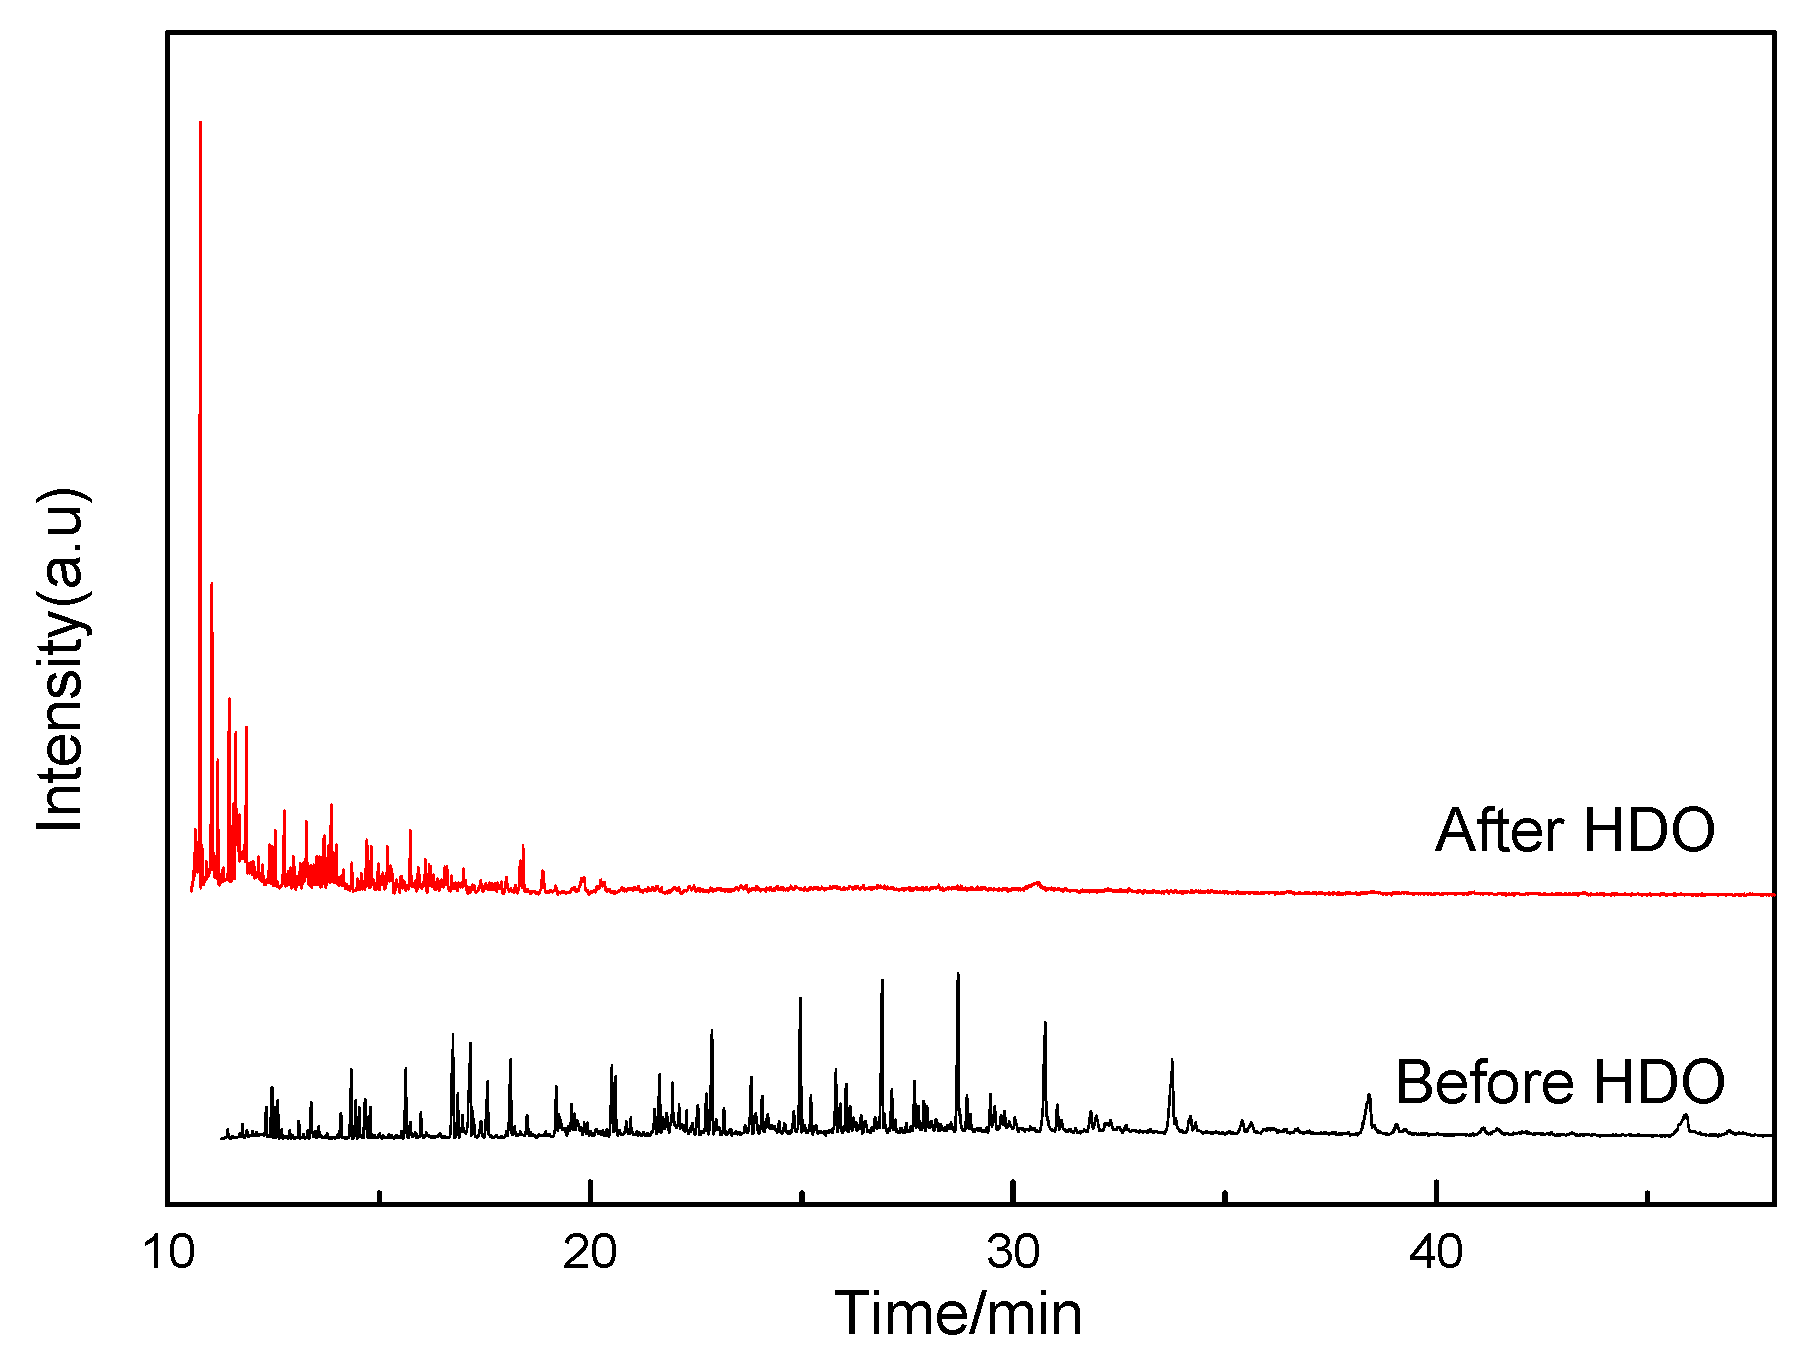
Figure 2 shows XRD patterns of catalysts with different NiMo loadings. The catalyst with low NiMo loadings, such as in Equations (3) and (4), shows no noticeable diffraction peaks. XRD patterns of catalysts with higher NiMo loadings present the evidence of MoO3 and NiMoO4 crystalline phases. The bands at 2θ = 23.3° and 25.7° correspond to crystalline orthorhombic α-MoO3. XRD patterns of catalysts were analogous to that of γ-Al2O3, which was attributed to the good dispersion of NiO and MoO3 on γ-Al2O3. The dispersity of NiO on γ-Al2O3 was better than that of MoO3 on γ-Al2O3. The weak peaks at 2θ = 26.6° and 28.8°, 39.1° correspond to the β- and α-NiMoO4 phase, respectively, and were almost not detected, which indicated that β- and α-NiMoO4 dispersed uniformly on γ-Al2O3. The good dispersion of the active components on support improves the activity.
Figure 2. The XRD pattern of the catalyst: (1) γ-Al2O3, (2) NiO-8 wt. %/γ-Al2O3, (3) NiO-5.4 wt. %/γ-Al2O3 (MoO3-2.6 wt. %), (4) NiO-2.6 wt. %/γ-Al2O3 (MoO3-5.4 wt. %), (5) MoO3-8 wt. % /γ-Al2O3.
Catalysts 05 02085 g002
Acetic acid was selected as a reactant not only because it was known to be rich in the oil phase and aqueous phase from co-pyrolysis products but also because the derived products (ethanol, acetaldehyde, and ethyl acetate) were easily quantified by standard analytical techniques. Figure 3 shows acetic acid as a function of MoO3 content. The conversion of acetic acid increased with MoO3 content, and then decreased. The phenomenon was attributed to the fact that the activity of MoO3 and NiO was different, and the doping of MoO3 favored the dispersion of NiO (see Figure 2). The NiO-2.6 wt. %/γ-Al2O3 (MoO3-5.4 wt. %) catalyst held the highest activity, and it was used as a catalyst in subsequent experiments.
Figure 3. Effect of MoO3 content on the conversion of acetic acid. Reaction conditions: P = 3 MPa, WHSV = 1.5 h−1, H2/feedstock = 400.
Catalysts 05 02085 g003
The catalyst was tested at the range of 230~280 °C and 3 MPa of hydrogen pressure for 2 h. The conversion of acetic acid was neglected over the Al2O3 catalyst at 280 °C and 3 MPa for 2 h. The conversion of acetic acid increased with temperature over the Ni-Mo/γ-Al2O3 catalyst, and a conversion of 98% was obtained at 280 °C, which may be considered a complete conversion. Acetic acid was converted via two paths: (1) hydrogenation and (2) esterification. A main reaction profile is given in Scheme 1. Product distribution also is shown in Figure 4. Selectivity of ethyl acetate decreased with the increase of temperature, and that of ethanol and aldehyde were contrary to that of ethyl acetate. Methane, CO, and CO2 were detected in the outlet stream above 280 °C. The result suggests that decarboxylation of acetic acid occurs under this condition.
Figure 4. Effect of temperature on conversion of acetic acid. Reaction conditions: P = 3 MPa, WHSV = 1.5 h−1, H2/feedstock = 400.
Catalysts 05 02085 g004
Scheme 1. Paths of HDO of acetic acid on Ni-Mo/Al2O3 catalyst.
Catalysts 05 02085 g008
The complex composition of crude oil results in different reactivity in HDO over Ni-MoAl2O3. Therefore, the main strategy to study the upgrade of pyrolysis crude oil was to investigate the model compounds (ethyl acetate, acetic acid, aldehyde, and ethanol) with a different functional group, and four simple model compounds with a different functional group were used to study HDO. Results are shown in Figure 5. The reactivity of the four model compounds was different in HDO, which increased in the following order: ethyl acetate < acetic acid < aldehyde < ethanol. The reactivity of ethyl acetate was lowest because its steric effect was the most outstanding among all the model compounds. The reactivity of the others was different for bond dissociation energy. The bond dissociation energy was greater, and the deoxygenation rate was slower.
Figure 5. Effect of functional group on conversion. Reaction conditions: T = 270 °C, WHSV = 2 h−1, H2/feedstock = 400, P = 4.0 MPa.
Catalysts 05 02085 g005
Crude oil from the co-pyrolysis of the cotton straw/PP mixture contained diverse compounds with the same functional group and different chain lengths. Thus, it was important to study the effect of the chain length of the model compound with an identical functional group on HDO on the Ni-Mo/γ-Al2O3 catalyst. Five model compounds with an identical functional group but different chain lengths were investigated in order to know the effect of chain length on HDO. Results are shown in Figure 6. It was well known that the chain length of the organic compound affected HDO on the Ni-Mo/γ-Al2O3 catalyst. The rate of HDO decreased in the following order: acetic acid > propanoic acid > butyric acid > valeric acid > stearic acid, which depended on the size of R of R-COOH. R of carboxylic acid molecules was larger; steric hindrance was more outstanding, so the rate of HDO decreased with the increase of R.
Figure 6. Effect of chain length of model compounds with the same functional group on conversion. Reaction conditions: T = 270 °C, WHSV = 2 h−1, H2/feedstock = 400, P = 4.0 MPa.
Catalysts 05 02085 g006
The following section was carried out with crude oil at the same conditions (270 °C and 4 MPa). Figure 7 shows the GC-MS profile of crude oil and the upgraded oil. The chromatogram of the upgraded oil showed all compositions separating out before 20 min, and many peaks corresponding to a series of n-alkanes starting at about C11 regularly appeared. The chromatogram of the crude oil showed a longer retention time than that of the upgraded oil. A summary of these results is listed in Table 3. GC-MS analysis showed that the crude oil mainly consisted of high-carbon alcohol, long-chain hydrocarbons (unsaturated and saturated), and fatty acids. Conversely, the upgraded oil mainly consisted of alkanes. Alkane (3-methyldecane) was the richest, but other alkanes from C12 to C20 also were present in the upgraded oil. A principal route to form C11 was the hydrodeoxygenation of carboxylic acid, alcohol, and aldehyde with C11, or decarbonylation and decarboxylation of the oxygenic compounds with more than C11. The composition of crude oil was different to that of the upgraded oil. Crude oil derived from the co-pyrolysis of the mixture mainly consisting of alkane, alkene, alcohol, and ester. Meanwhile, the upgraded oil mainly consisted of alkanes. Based on these results, the most of the oxygen can be removed after hydrotreating, suggesting HDO is feasible to upgrade crude oil.
Table 3. Compositions of oil.
No.Before HDOAfter HDO
Time/minArea%CompositionsTime/minArea%Compositions
112.42.84-methyl-undecane10.715.33-methyldecane
214.33.72-butyl-1-octanol11.012.74,5-diethyloctane
315.63.2Pentatonic acid, 10-undecenyl ester11.12.64-ethyldecane
416.74.82-hexyl-1-octanol11.44.82-methylundecane
517.17.6Z-11-Tetradecen-1-ol propionate11.69.2dodecane
618.14.22-hexyl-1-dodecanol11.88.82,4-dimethylundecane
719.24.05-octadecene12.42.72,4-dimethyldodecane
820.54.42-methyl-1-decanol12.55.52,6,11-trimethyldodecane
921.63.3Z-8-dodecene-1-ol acetate12.72.83-methyltridecane
1022.83.72-hexyl-1-decanol13.24.32,4-dimethylpentadecane
1124.98.41,21-dococadiene13.87.72,6,10-trimethyltetradecane
1226.98.23,7,11,15-tetramethyl-2-hexadecane-1-ol14.75.32-hexadecanol
1328.68.12-methyl hexadecane-1-ol15.73.4Hexadecane
1430.77.31,16-hexadecanediol18.43.72-methyloctadecane
1533.76.4E-3-methyl-8-tridecene-2-ol, acetate---
1638.45.91,19-eicosadiene---
1745.94.7Acetic acid octadecylester---
Note: hydrodeoxygenation (HDO).
Figure 7. GC-MS chromatogram of crude oil.
Catalysts 05 02085 g007

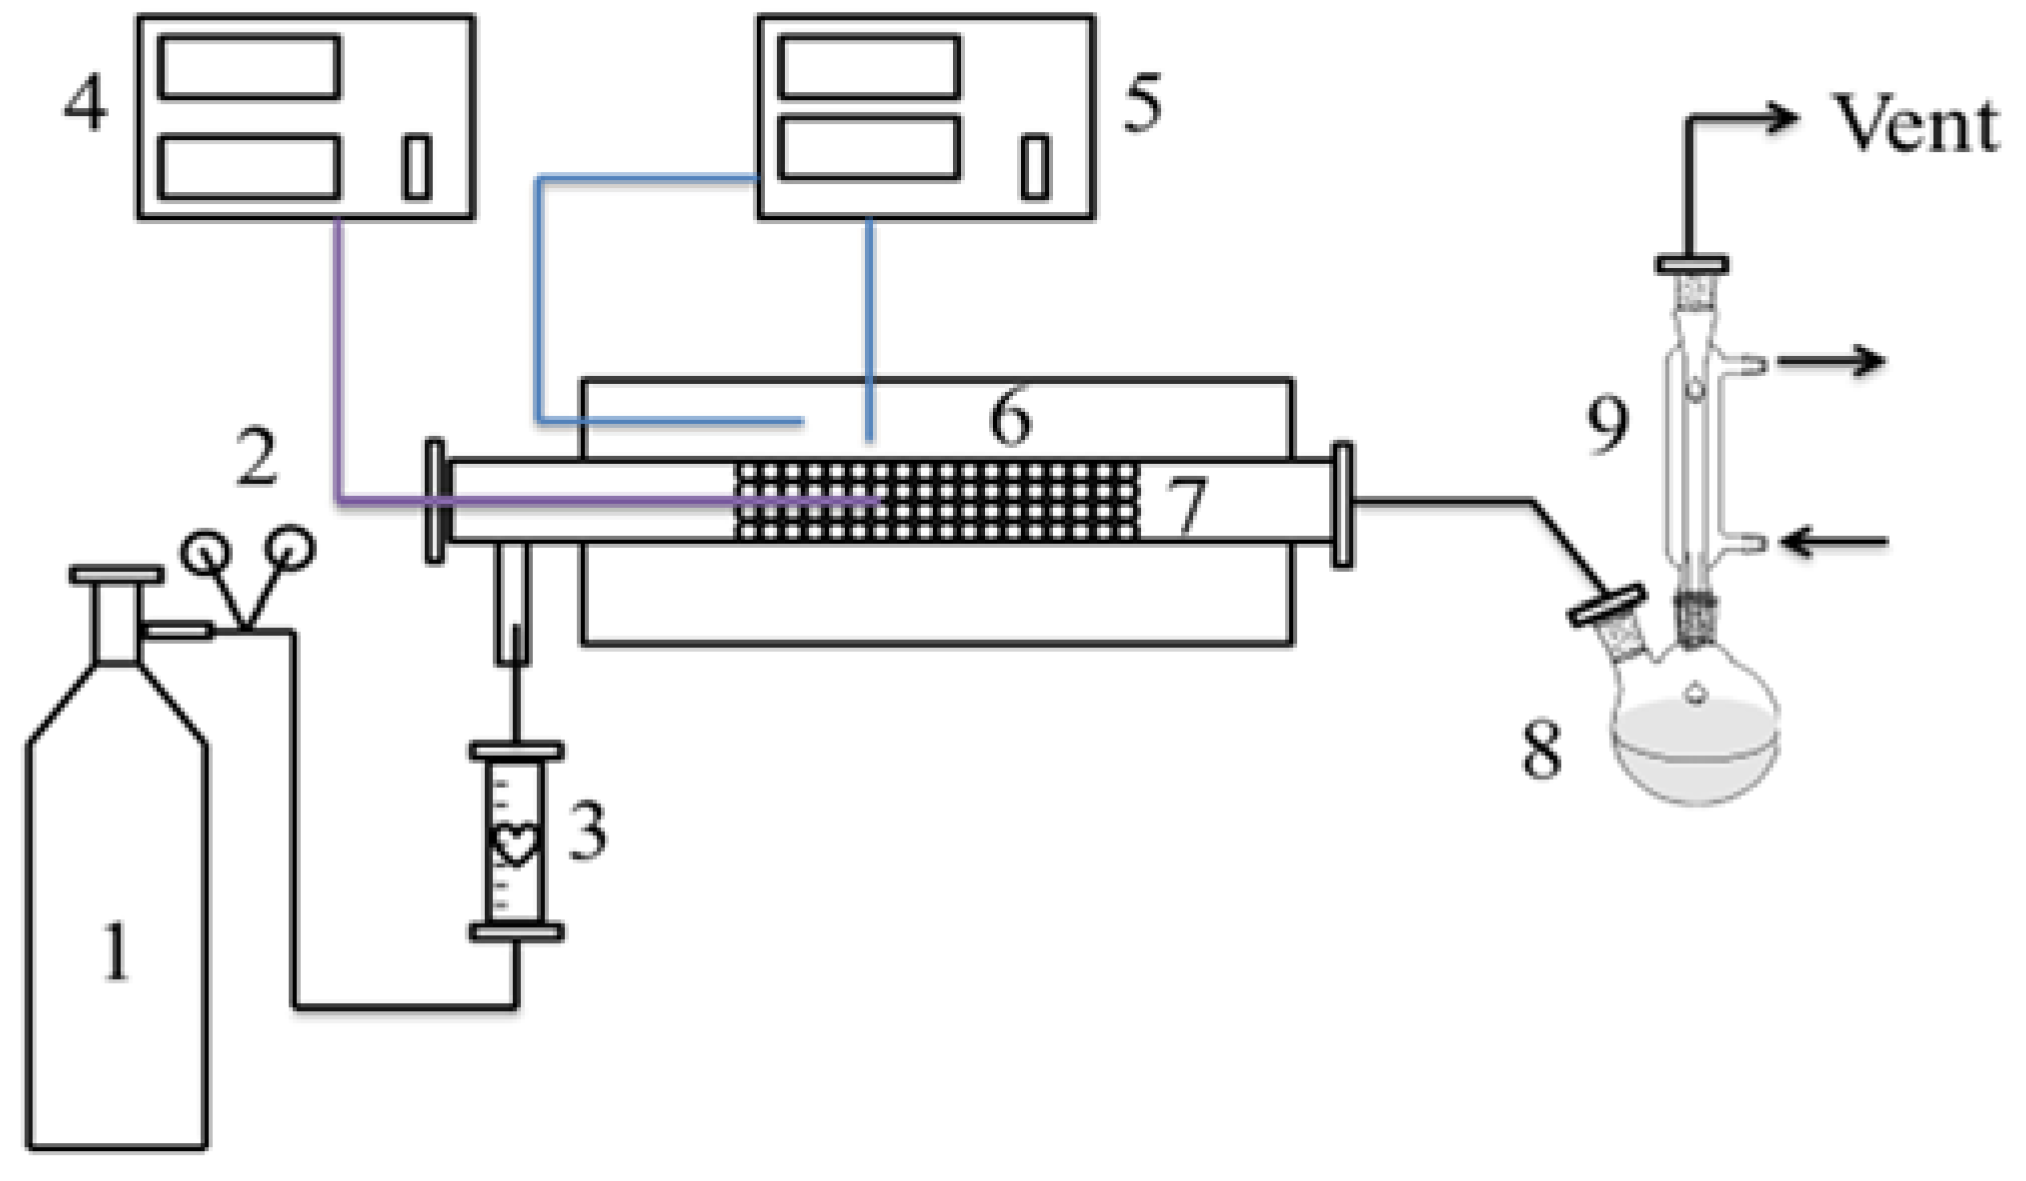
3. Experimental Section

Cotton straw was from the south of China and dried at 100 °C for 5 h, and then ground into ca. 0.23 mm. Polypropylene (PP) is waste plastic from Shanghai Yangli Mechanical and Electrical Technology LTD., Shanghai, China, and was dried, and then ground into ca. 0.23 mm. Elemental analysis of cotton straw and PP is listed in Table 4.
Table 4. Elemental analysis of cotton straw and PP.
SampleC/%H/%O/%N/%S/%
PP83.5813.820-2.60
Cotton straw42.786.0140.351.51-
Note: Polypropylene (PP); O/wt. % is calculated by difference.
Supported Ni-Mo catalyst was prepared by wet co-impregnation of aqueous solutions of Ni(NO3)26H2O and (NH4)6Mo7O244H2O on the support (γ-Al2O3). The loading is 8 wt. %. The atomic ratio of Ni to Mo is 5:4. The catalyst was loaded in a stainless steel tubular reactor (1.5 cm i.d, and 50 cm in length). Before reaction, the catalyst was pretreated at 400 °C for 1 h in H2. Hydrogen and oil were fed to the reactor at a ratio of H2/oil = 400. The liquid products were collected in a trap. GC-MS analysis was carried out on a Trace DSQ GC-MS system with an AB-5MS capillary column (30 m × 0.25 mm i.d, 0.25 μm film thickness). Helium was used as carrier gas, with a flow rate of 1 mL·min−1. The column temperature was programmed from 60 to 300 °C at a rate of 10 °C·min−1 after an initial two-minute isothermal period. Then it was kept at the final temperature for 10 min. The inlet temperature was set to 300 °C, and the split ratio was 1:50. The mass spectrometer was set to an ionizing voltage of 70 eV with a mass range from 35 to 650 amu. Identifying organic compounds was accomplished by comparing the mass spectra of the resolved components using electronic library search routines. Elemental analysis was carried out on Elementar (Frankfurt, German, sensitivity to 0.1 g). C, H, N, and S was analyzed at He atmosphere with O as a combustion improver, and gas flow was 50 mL/min. The atomic ratio of Ni to Mo was measured by ICP-AES (Perkin-Elmer 3300 DV, Fremont, CA, USA). N2 adsorption-desorption isotherms at −196 °C were recorded with a Micromeritics ASAP 2010 automatic sorption analyzer (Micromeritics, Norcross, GA, USA). The detailed data are listed in Table 5. X-ray powder diffraction patterns of catalysts were recorded on a Bruker D8 Advance diffractometer (Bruker, Germany), using CuKa (1.5406 Å) radiation in the range of 10°–60° with a scanning rate of 1°/min.
Table 5. Texture of catalysts.
Ratio of Ni to MoTexture of Catalyst
DPore (nm)VPore (cm3/g)SBet (m2/g)
Support-8.10.43209
Catalyst7:37.70.41200
The amount of cotton straw and PP used throughout all experiments was 10 g. Co-pyrolysis of mixtures was performed in the self-made fixed reactor (300 mm × 20 mm). N2 (flow rate 200 mL·min−1) was used as carrier gas, temperature was programmed from 40 to 600 °C at 100 °C·min−1 and kept for 20 min at 600 °C, then was cooled to room temperature. The above experiment was repeated at least three times. During the process, pyrolysis products were cooled down and collected, and gas was evacuated. Pyrolysis products were placed and delaminated into two layers. The top and bottom layers were oil phase and aqueous phase, respectively (Scheme 2).
Scheme 2. Co-pyrolysis equipment: 1, carrier gas; 2, valve; 3, flowmeter; 4, temperature monitor; 5, temperature controller; 6, furnace; 7, fixed bed reactor; 8, round-bottomed flask; 9, condenser.
Catalysts 05 02085 g009
The pyrolysis of cotton straw/PP mixture was performed on thermogravimetric analyzer (TA Instrument SDT Q600, New Castle, DE, USA) with N2 as carrier gas (60 mL/min), and the temperature was programmed from 20 to 900 °C at 10 °C/min.
The heating value of the products is approximated using Dulong’s equation [43].
Caloricity (MJ·kg−1) = 0.3383C + 1.442 × (H − O/8)
where C, H, and O are the mass percent of carbon, hydrogen, and oxygen, respectively.
The difference of weight loss Δ is defined as a function of the synergistic effect during pyrolysis. The conversion of reactant, crude oil yield, and synergy is calculated with Equations (2)–(4), respectively.
η = ( 1 W t W 0 ) × 100 %
μ = W s W 0 × 100 %
Δ W W b = 1 X 1 W 1 + X 2 W 2 W b
where η and μ are the conversions of the reactant and crude oil yield, respectively. W0, Wt, and Ws are the weight of the reactant, residue, and bio-oil from co-pyrolysis, respectively, and ΔW represents, to a certain degree, the synergistic effect during co-pyrolysis. Wb is the weight loss of mixture of cotton straw and PP. Wi is the weight loss of each material at the same conditions. Xi is the weight fraction of each material in the mixture.
The conversions of model compounds and the product selectivity are calculated by the formulas:
C onversion % = m ( reactant ) in m ( reactant ) o u t m ( reactant ) in × 100 %
Selectivity % = m 1 m 2 × 100 %
where m1 and m2 represent the content of the aimed product and all products obtained from the HDO reaction, respectively.

4. Conclusions

The doping of PP with biomass can improve oil yield and oil quality, which is attributed to the synergy between cotton straw and PP at the range of 380–480 °C. The substrate structure had the determining effect on the HDO reaction over Ni-Mo/Al2O3. The rate of deoxygenation depended on the chain length and functional group of the organic compounds. The upgraded crude oil mainly consisted of C11 alkane from the HDO of carboxylic acid, alcohol, and aldehyde with C11, or decarbonylation and decarboxylation of the oxygenic compounds with more than C11.

Acknowledgments

The authors are grateful for the financial supports from the National Natural Science Foundation of China (No. 21176142, No. 21576155, No. 21376140, and No. 21466001), Research Project of Guangdong Provincial Department of Science and Technology Department (No. 2015B020215004), and Program for Changjiang Scholars and Innovative Research Team in University (No. IRT13026).

Author Contributions

Y.C. and J.L. conceived and designed the experiments; X.L. performed the experiments; M.Y. and W.Y. analyzed the data; W.Y. contributed reagents/materials/analysis tools; D.H. wrote the paper.

Conflicts of Interest

The authors declare no conflict of interest.

References

  1. Demirbas, M.F.; Balat, M. Biomass pyrolysis for liquid fuels and chemicals: A review. J. Sci. Ind. Res. 2007, 66, 797–804. [Google Scholar]
  2. Yaman, S. Pyrolysis of biomass to produce fuels and chemical feedstocks. Energy Convers. Manag. 2004, 45, 651–671. [Google Scholar] [CrossRef]
  3. Stephanidis, S.; Nitsos, C.; Kalogiannis, K.; Iliopoulou, E.F.; Lappas, A.A.; Triantafyllidis, K.S. Catalytic upgrading of lignocellulosic biomass pyrolysis vapours: Effect of hydrothermal pre-treatment of biomass. Catal. Today 2011, 167, 37–45. [Google Scholar] [CrossRef]
  4. Carlson, T.R.; Vispute, T.P.; Huber, G.W. Green Gasoline by Catalytic Fast Pyrolysis of Solid Biomass Derived Compounds. ChemSusChem 2008, 1, 397–400. [Google Scholar] [CrossRef] [PubMed]
  5. Guo, X.; Wang, S.; Wang, Q.; Guo, Z.; Luo, Z. Properties of Bio-oil from Fast Pyrolysis of Rice Husk. Chin. J. Chem. Eng. 2011, 19, 116–121. [Google Scholar] [CrossRef]
  6. Huber, G.W.; Iborra, S.; Corma, A. Synthesis of Transportation Fuels from Biomass: Chemistry, Catalysts, and Engineering. Chem. Rev. 2006, 106, 4044–4098. [Google Scholar] [CrossRef] [PubMed]
  7. Demirbas, A. Progress and recent trends in biodiesel fuels. Energy Convers. Manag. 2009, 50, 14–34. [Google Scholar] [CrossRef]
  8. Sharypov, V.I.; Beregovtsova, N.G.; Kuznetsov, B.N.; Membrado, L.; Cebolla, V.L.; Marin, N.; Weber, J.V. Co-pyrolysis of wood biomass and synthetic polymers mixtures. Part III: Characterisation of heavy products. J. Anal. Appl. Pyrolysis 2003, 67, 325–340. [Google Scholar] [CrossRef]
  9. Marin, N.; Collura, S.; Sharypov, V.I.; Beregovtsova, N.G.; Baryshnikov, S.V.; Kutnetzov, B.N.; Cebolla, V.; Weber, J.V. Copyrolysis of wood biomass and synthetic polymers mixtures. Part II: characterisation of the liquid phases. J. Anal. Appl. Pyrolysis 2002, 65, 41–55. [Google Scholar] [CrossRef]
  10. Jeon, M.J.; Choi, S.; Yoo, K.S.; Ryu, C.; Park, S.; Lee, J.; Jeon, J.K.; Park, Y.K.; Kim, S. Copyrolysis of block polypropylene with waste wood chip. Korean J. Chem. Eng. 2011, 28, 497–501. [Google Scholar] [CrossRef]
  11. Ateş, F. Energy Sources, co-pyrolytic Behaviors of Agricultural Wastes. Part A: Recovery, Utilization, and Environmental Effects; Taylor & Francis: London, UK, 2011; Volume 34, pp. 111–121. [Google Scholar]
  12. Sharypov, V.I.; Beregovtsova, N.G.; Kuznetsov, B.N.; Baryshnikov, S.V.; Cebolla, V.L.; Weber, J.V.; Collura, S.; Finqueneisel, G.; Zimny, T.J. Co-pyrolysis of wood biomass and synthetic polymers mixtures. Part IV: Catalytic pyrolysis of pine wood and polyolefinic polymers mixtures in hydrogen atmosphere. Anal. Appl. Pyrolysis 2006, 76, 265–270. [Google Scholar] [CrossRef]
  13. Jakab, E.; Várhegyi, G.; Faix, O. Thermal decomposition of polypropylene in the presence of wood-derived materials. J. Anal. Appl. Pyrolysis 2000, 56, 273–285. [Google Scholar] [CrossRef]
  14. Bhattacharya, P.; Steele, P.H.; Hassan, E.B.M.; Mitchell, B.; Ingram, L.; Pittman, C.U., Jr. Wood/plastic copyrolysis in an auger reactor: Chemical and physical analysis of the products. Fuel 2009, 88, 1251–1260. [Google Scholar] [CrossRef]
  15. Brebu, M.; Ucar, S.; Vasile, C.; Yanik, J. Co-pyrolysis of pine cone with synthetic polymers. Fuel 2010, 89, 1911–1918. [Google Scholar] [CrossRef]
  16. Cornelissen, T.; Jans, M.; Yperman, J.; Reggers, G.; Schreurs, S.; Carleer, R. Flash co-pyrolysis of biomass with polyhydroxybutyrate. Part 1. Influence on bio-oil yield, water content, heating value and the production of chemicals. Fuel 2008, 87, 2523–2532. [Google Scholar] [CrossRef]
  17. Mercader, F.D.M.; Groeneveld, M.J.; Kersten, S.R.A.; Venderbosch, R.H.; Hogendoorn, J.A. Pyrolysis oil upgrading by high pressure thermal treatment. Fuel 2010, 89, 2829–2837. [Google Scholar] [CrossRef]
  18. Lappas, A.A.; Bezergianni, S.; Vasalos, I.A. Production of biofuels via co-processing in conventional refining processes. Catal. Today 2009, 145, 55–62. [Google Scholar] [CrossRef]
  19. Huber, G.W.; Corma, A. Synergies between Bio- and Oil Refineries for the Production of Fuels from Biomass. Angew. Chem. Int. Ed. 2007, 46, 7184–7201. [Google Scholar] [CrossRef] [PubMed]
  20. Taarning, E.; Osmundsen, C.M.; Yang, X.; Voss, B.; Andersen, S.I.; Christensen, C.H. Zeolite-catalyzed biomass conversion to fuels and chemicals. Energy Environ. Sci. 2011, 4, 793–804. [Google Scholar] [CrossRef]
  21. Wan, H.; Chaudhari, R.; Subramaniam, B. Catalytic Hydroprocessing of p-Cresol: Metal, Solvent and Mass-Transfer Effects. Top. Catal. 2012, 55, 129–139. [Google Scholar] [CrossRef]
  22. Wildschut, J.; Mahfud, F.H.; Venderbosch, R.H.; Heeres, H.J. Hydrotreatment of Fast Pyrolysis Oil Using Heterogeneous Noble-Metal Catalysts. Ind. Eng. Chem. Res. 2009, 48, 10324–10334. [Google Scholar] [CrossRef]
  23. Zhang, X.; Wang, T.; Ma, L.; Zhang, Q.; Jiang, T. Hydrotreatment of bio-oil over Ni-based catalyst. Bioresour. Technol. 2013, 127, 306–311. [Google Scholar] [CrossRef] [PubMed]
  24. Xu, Q.; Zhang, H.; Li, S.; Dai, W.; Jiang, J.; Yan, Y. Bio-Oil Upgrading Over Bi-Functional Catalyst in CO/H2O System. Asian J. Chem. 2013, 25, 3789–3792. [Google Scholar]
  25. Crombie, K.; Mašek, O. Investigating the potential for a self-sustaining slow pyrolysis system under varying operating conditions. Bioresour. Technol. 2014, 162, 148–156. [Google Scholar] [CrossRef] [PubMed]
  26. Pham, T.N.; Shi, D.; Resasco, D.E. Evaluating strategies for catalytic upgrading of pyrolysis oil in liquid phase. Appl. Catal. B 2014, 145, 10–23. [Google Scholar] [CrossRef]
  27. Saidi, M.; Samimi, F.; Karimipourfard, D.; Nimmanwudipong, T.; Gates, B.C.; Rahimpour, M.R. Upgrading of lignin-derived bio-oils by catalytic hydrodeoxygenation. Energy Environ. Sci. 2014, 7, 103–129. [Google Scholar] [CrossRef]
  28. Zhang, X.; Long, J.; Kong, W.; Zhang, Q.; Chen, L.; Wang, T.; Ma, L.; Li, Y. Catalytic Upgrading of Bio-oil over Ni-Based Catalysts Supported on Mixed Oxides. Energy Fuels 2014, 28, 2562–2570. [Google Scholar] [CrossRef]
  29. Mortensen, P.M.; Gardini, D.; de Carvalho, H.W.P.; Damsgaard, C.D.; Grunwaldt, J.D.; Jensen, P.A.; Wagner, J.B.; Jensen, A.D. Stability and resistance of nickel catalysts for hydrodeoxygenation: carbon deposition and effects of sulfur, potassium, and chlorine in the feed. Catal. Sci. Technol. 2014, 4, 3672–3686. [Google Scholar] [CrossRef] [Green Version]
  30. Kandel, K.; Anderegg, J.W.; Nelson, N.C.; Chaudhary, U.; Slowing, I.I. Supported iron nanoparticles for the hydrodeoxygenation of microalgal oil to green diesel. J. Catal. 2014, 314, 142–148. [Google Scholar] [CrossRef]
  31. Hensen, E.J.M.; Brans, H.J.A.; Lardinois, G.M.H.J.; de Beer, V.H.J.; van Veen, J.A.R.; van Santen, R.A. Periodic Trends in Hydrotreating Catalysis: Thiophene Hydrodesulfurization over Carbon-Supported 4d Transition Metal Sulfides. J. Catal. 2000, 192, 98–107. [Google Scholar] [CrossRef]
  32. Eijsbouts, S.; de Beer, V.H.J.; Prins, R. Periodic trends in the hydrodenitrogenation activity of carbon-supported transition metal sulfide catalysts. J. Catal. 1988, 109, 217–220. [Google Scholar] [CrossRef]
  33. Elkasabi, Y.; Mullen, C.A.; Pighinelli, A.L.M.T.; Boateng, A.A. Hydrodeoxygenation of fast-pyrolysis bio-oils from various feedstocks using carbon-supported catalysts. Fuel Proc. Technol. 2014, 123, 11–18. [Google Scholar] [CrossRef]
  34. Priecel, P.; Kubička, D.; Čapek, L.; Bastl, Z.; Ryšánek, P. The role of Ni species in the deoxygenation of rapeseed oil over NiMo-alumina catalysts. Appl. Catal. A 2011, 397, 127–137. [Google Scholar] [CrossRef]
  35. Holmgren, J.; Gosling, C.; Marinangeli, R.; Marker, T.; Faraci, G.; Perego, C. New developments in renewable fuels offer more choices: Vegetable oil-based diesel can offer better integration within crude-oil refineries for fuels blending: Refining Developments. Hydrocarbon Process. Int. Ed. 2007, 86, 67–72. [Google Scholar]
  36. Donnis, B.; Egeberg, R.; Blom, P.; Knudsen, K. Hydroprocessing of Bio-Oils and Oxygenates to Hydrocarbons. Understanding the Reaction Routes. Top. Catal. 2009, 52, 229–240. [Google Scholar] [CrossRef]
  37. Santillan-Jimenez, E.; Morgan, T.; Lacny, J.; Mohapatra, S.; Crocker, M. Catalytic deoxygenation of triglycerides and fatty acids to hydrocarbons over carbon-supported nickel. Fuel 2013, 103, 1010–1017. [Google Scholar] [CrossRef]
  38. Peng, B.; Zhao, C.; Kasakov, S.; Foraita, S.; Lercher, J.A. Manipulating catalytic pathways: Deoxygenation of palmitic acid on multifunctional catalysts. Chem. Eur. J. 2013, 19, 4732–4741. [Google Scholar] [CrossRef] [PubMed]
  39. Jeon, J.K.; Huh, B.; Lee, C.H.; Suh, D.J.; Suh, Y.W.; Heo, H.S.; Park, Y.K. The Hydrodeoxygenation of 2-Methoxyphenol over Ni/Kieselguhr Catalysts as a Model Reaction for Bio-oil Upgrading. In Energy Sources Part A: Recovery Utilization Environmental Effects; Taylor & Francis: London, UK, 2013; Volume 35, pp. 271–277. [Google Scholar]
  40. Hurff, S.J.; Klein, M.T. Reaction pathway analysis of thermal and catalytic lignin fragmentation by use of model compounds. Ind. Eng. Chem. Fundam. 1983, 22, 426–430. [Google Scholar] [CrossRef]
  41. He, L.; Wu, C.; Cheng, H.; Yuab, Y.; Zhao, F. Highly selective and efficient catalytic conversion of ethyl stearate into liquid hydrocarbons over a Ru/TiO2 catalyst under mild conditions. Catal. Sci. Technol. 2012, 2, 1328–1331. [Google Scholar] [CrossRef]
  42. Han, J.; Kim, H.J. Thermochemical liquefaction characteristics of microalgae in sub- and supercritical ethanol. Energy Sources 2009, 31, 364–371. [Google Scholar] [CrossRef]
  43. Huang, H.; Yuan, X.; Zeng, G.; Wang, J.; Li, H.; Zhou, C.; Pei, X.; You, Q.; Chen, L. Pyrolysis Characteristic and Kinetic of Sawdust-Polypropylene Blend. Fuel Process. Technol. 2011, 92, 147–153. [Google Scholar] [CrossRef]

