Article

Novel Mesoporous Carbon Supports for PEMFC Catalysts

1
Department of Chemistry, University of Calgary, 2500 University Drive NW Calgary, AB T2N1N4, Canada
2
Ballard Power Systems, 9000 Glenlyon Parkway, Burnaby, BC V5J 5J8, Canada
3
Microscopy and Imaging Facility, University of Calgary, Health Sciences Centre B159, 3330 Hospital Drive NW, Calgary, AB T2N 4N1, Canada
*
Authors to whom correspondence should be addressed.
These authors contributed equally to this work.
Catalysts 2015, 5(3), 1046-1067; https://doi.org/10.3390/catal5031046
Submission received: 15 May 2015 / Revised: 18 June 2015 / Accepted: 18 June 2015 / Published: 29 June 2015
(This article belongs to the Special Issue Electrocatalysis in Fuel Cells)

Abstract

:
Over the past decade; a significant amount of research has been performed on novel carbon supports for use in proton exchange membrane fuel cells (PEMFCs). Specifically, carbon nanotubes, ordered mesoporous carbon, and colloid imprinted carbons have shown great promise for improving the activity and/or stability of Pt-based nanoparticle catalysts. In this work, a brief overview of these materials is given, followed by an in-depth discussion of our recent work highlighting the importance of carbon wall thickness when designing novel carbon supports for PEMFC applications. Four colloid imprinted carbons (CICs) were synthesized using a silica colloid imprinting method, with the resulting CICs having pores of 15 (CIC-15), 26 (CIC-26), 50 (CIC-50) and 80 (CIC-80) nm. These four CICs were loaded with 10 wt. % Pt and then evaluated as oxygen reduction (ORR) catalysts for use in proton exchange membrane fuel cells. To gain insight into the poorer performance of Pt/CIC-26 vs. the other three Pt/CICs, TEM tomography was performed, indicating that CIC-26 had much thinner walls (0–3 nm) than the other CICs and resulting in a higher resistance (leading to distributed potentials) through the catalyst layer during operation. This explanation for the poorer performance of Pt/CIC-26 was supported by theoretical calculations, suggesting that the internal wall thickness of these nanoporous CICs is critical to the future design of porous carbon supports.

1. Introduction

Proton exchange membrane fuel cells (PEMFCs) are energy conversion devices that are capable of cleanly and efficiently converting the chemical energy of the reactants (typically H2 and O2 from air) directly into electrical energy. PEMFCs operate at relatively low temperatures (60 °C–95 °C), making them ideally suited for transportation and portable power applications, and they are also now being investigated for small-scale distributed stationary power generation [1].
For the hydrogen oxidation (HOR) and the oxygen reduction (ORR) reactions to occur at the PEMFC anode and cathode, respectively, a high surface area Pt catalyst is required. However, the intrinsic ORR kinetics are roughly five orders of magnitude slower than the HOR rate [2], and thus nearly 90% of the Pt in a PEMFC is located at the cathode to increase its activity [3,4]. Therefore, it is crucial to understand and optimize the cathode catalyst layer in order to maximize Pt utilization and eventually decrease the Pt loading at the cathode, thus also lowering PEMFC cost.
Presently, the cathode catalyst layer in a PEMFC consists of 2–6 nm Pt or Pt alloy nanoparticles deposited on a high surface area microporous (< 2 nm diameter pores) carbon support (typically Vulcan carbon XC-72R (VC); Cabot, Alpharetta, GA, USA ) [5,6]. Unfortunately, the pores of VC are too small to accommodate the Pt nanoparticles and therefore they reside primarily on the outer VC surface. As a result, Pt deposition on VC occurs on only a fraction of the total surface area, making it difficult to achieve small, uniformly distributed Pt nanoparticles on conventional VC at high Pt loadings of ≥ 20 wt. % [7]. In addition, any Pt that is deposited into a micropore is expected to experience significant mass transport limitations and thus may hardly be used [7,8].
In an effort to improve Pt distribution and utilization and to reduce mass transport losses through the catalyst layer of PEMFCs, many researchers have been investigating mesoporous carbon support materials (2 nm < d < 50 nm), which have both much larger pore diameters and typically larger surface areas than conventional VC. A high surface area is an important property of any potential catalyst support for PEMFCs, as it is known that average Pt particle size decreases with increasing catalyst support area [9], likely due to an increased number of available nucleation sites. Furthermore, it has been demonstrated that mass transport of reactants and products is greatly improved when using carbon supports with pore diameters of > 3 nm [9]. Specifically, three promising families of mesoporous carbons are: (1) carbon nanotubes (CNTs); (2) ordered mesoporous carbons (OMCs); and (3) colloid imprinted carbons (CICs). Other carbon supports that have been investigated include carbon nanofibres [10,11] and carbon nanocoils [12,13]. Although some promising data has been reported for these additional carbon supports, the largest focus has been on the three main families listed above.
While the importance of carbon support pore diameter is now well understood, recent work by our group [14,15] has helped to elucidate the previously under-emphasized importance of carbon support wall thickness on ORR activity. This finding has been observed for both OMC [14] and CIC [15] catalyst supports in our previous studies.

1.1. Carbon Nanotubes (CNTs)

CNTs offer several advantages over conventional microporous carbons as catalyst supports for PEMFCs. Unlike carbon blacks, CNTs are nearly 100% sp2 hybridized, which provides them with a much higher electronic conductivity than carbon black [16]. This is advantageous when electrons must rapidly transport through the support. Multi-walled CNTs typically have a higher electronic conductivity (but lower surface area) than single wall CNTs, and are therefore the most commonly used CNTs in PEMFC research [9]. The high percentage of sp2 hybridization of CNTs also provides these materials with enhanced corrosion resistance vs. VC [9,17]. Also, CNTs generally have [17] fewer impurities than carbon blacks, such as VC, which often contain organic sulphur species that may poison the Pt catalyst [18].
While the high degree of sp2 hybridization provides CNTs with many benefits, it unfortunately makes Pt deposition very challenging. This is because, unlike VC, there are very few functional groups available to anchor the Pt nanoparticles to the surface [9]. Therefore, CNTs must first be functionalized, often by refluxing in HNO3/H2SO4 solutions at elevated temperatures (90 °C–140 °C) in order to create hydroxyl and carboxylic acid surface groups [9]. However, this lowers the CNT electronic conductivity, as well as making them more susceptible to oxidation under normal PEMFC conditions [9]. Proper design of CNT supports must therefore take into account the trade-offs between high electronic conductivity and corrosion resistance versus Pt dispersion and stability. It has been shown [19,20,21] that nitrogen-doped CNTs have advantages over CNTs in terms of Pt deposition and catalytic activity. Moreover, first principles calculations indicate that Pt should bond more strongly on nitrogen-doped CNTs than on CNTs [22,23], with a higher Pt stability confirmed experimentally [24].

1.2. Ordered Mesoporous Carbons (OMCs)

Joo et al. [25] first reported the use of OMCs for PEMFC applications, using a well-studied ordered mesoporous silica (SBA-15) as a template for OMC synthesis. They filled the pores of SBA-15 with furfuryl alcohol and then heated the sample to 80 °C to induce polymerization of furfuryl alcohol on the acidic sites on the SBA-15 walls. The remaining furfuryl alcohol was then removed under vacuum and the carbon/silica composite was carbonized, followed by removal of the SBA-15 template through refluxing in NaOH. The resulting OMC was composed of hollow tubes, with a pore diameter of 5.9 nm, and 4.2 nm pores between adjacent tubes. It was reported [25] that the outer diameter of the OMC tubes can be controlled by the SBA-15 pore size, while the inner tube diameter can be tuned via the polymerization conditions employed (temperature, time, number of furfuryl alcohol infiltration steps [26]). Importantly, the resultant OMC was found to have a surface area of ca. 2000 m2/g, based on N2 gas sorption measurements. The authors demonstrated that this large OMC surface area, composed of 5.9 and 4.2 nm pores, allowed for much smaller Pt particles to be deposited vs. on a high surface area (1500 m2/g) carbon black. As a result, the Pt/OMC catalyst was found to greatly outperform the Pt-loaded carbon black catalyst.
While this initial work was very promising, subsequent work [8,27,28,29] demonstrated that, similar to microporous VC, the ORR occurring at the Pt/OMC catalysts may become transport limited at high current densities, as reactants and products must rapidly transport to and from active Pt sites deep inside the OMC pores. Specifically, it has been suggested that, while Pt may deposit inside the OMC pores, the Nafion proton conductor may not be able to access them, likely then resulting in proton transport limited currents [9].
In previous work by Ambrosio et al. [8,27], it was demonstrated that Pt/OMC catalysts outperform Pt/VC at low current densities, but quickly succumb to mass transport losses at higher current densities. Similar to Joo et al. [25], they demonstrated that the higher surface area of the OMC support (1080 m2/g) allowed for smaller, more uniform Pt nanoparticles to be deposited vs. similarly loaded VC. While the smaller Pt particle size of the Pt/OMC vs. Pt/VC material did provide the Pt/OMC catalyst with a higher electrochemically active surface area, proposed to be responsible for the higher activity of Pt/OMC at low current densities, a poorer activity of the Pt/OMC catalysts was observed at higher current densities. This was likely due to either a low electronic conductivity through the carbon matrix, or proton diffusion limitations within the ~3.5 nm pores. Based on these recent findings, [25] achieving larger pore diameters in the OMCs appears to be an important next step. Unfortunately, the hard templating approach used in OMC synthesis constrains the OMC pore diameters to <7 nm in diameter [30]. This is because it is very difficult to increase the wall thickness (which eventually becomes the OMC pore diameter) of the silica template while still maintaining the desired porosity.
Recently, our group performed a controlled study to further verify the importance of the OMC support dimensions (as opposed to the pore diameter) on ORR activity of Pt/OMC catalysts [14]. Since OMCs represent an inverse replica of the sacrificial porous silica, we have previously described the final OMC structure as consisting of carbon “nano-strings” (where carbon has filled the worm-hole-shaped pores of the silica) separated by pores (previously occupied by the walls of the SiO2 template) [14]. SiO2 templates with pore diameters ranging from 1.5 to 3.1 nm were prepared, all having wall thicknesses of ~2.3 nm.
OMCs were prepared from these SiO2 templates, and loaded with 20 wt. % Pt. Rotating disc electrode (RDE) testing was used to show that the ORR activity correlated well with the diameter of the solid carbon nano-strings. Specifically, Pt/OMC catalysts with narrower nano-string diameters were shown to have higher ohmic losses, resulting in more pronounced problems due to distributed potentials through the catalyst layer on the RDE surface and thus lower ORR activities, vs. what was seen for Pt/OMC catalysts with larger nano-string diameters. This work was the first to demonstrate the importance of OMC nano-string diameter on the ORR activity of Pt/OMC catalysts, which had not previously been considered an important design parameter for Pt/OMC catalysts.

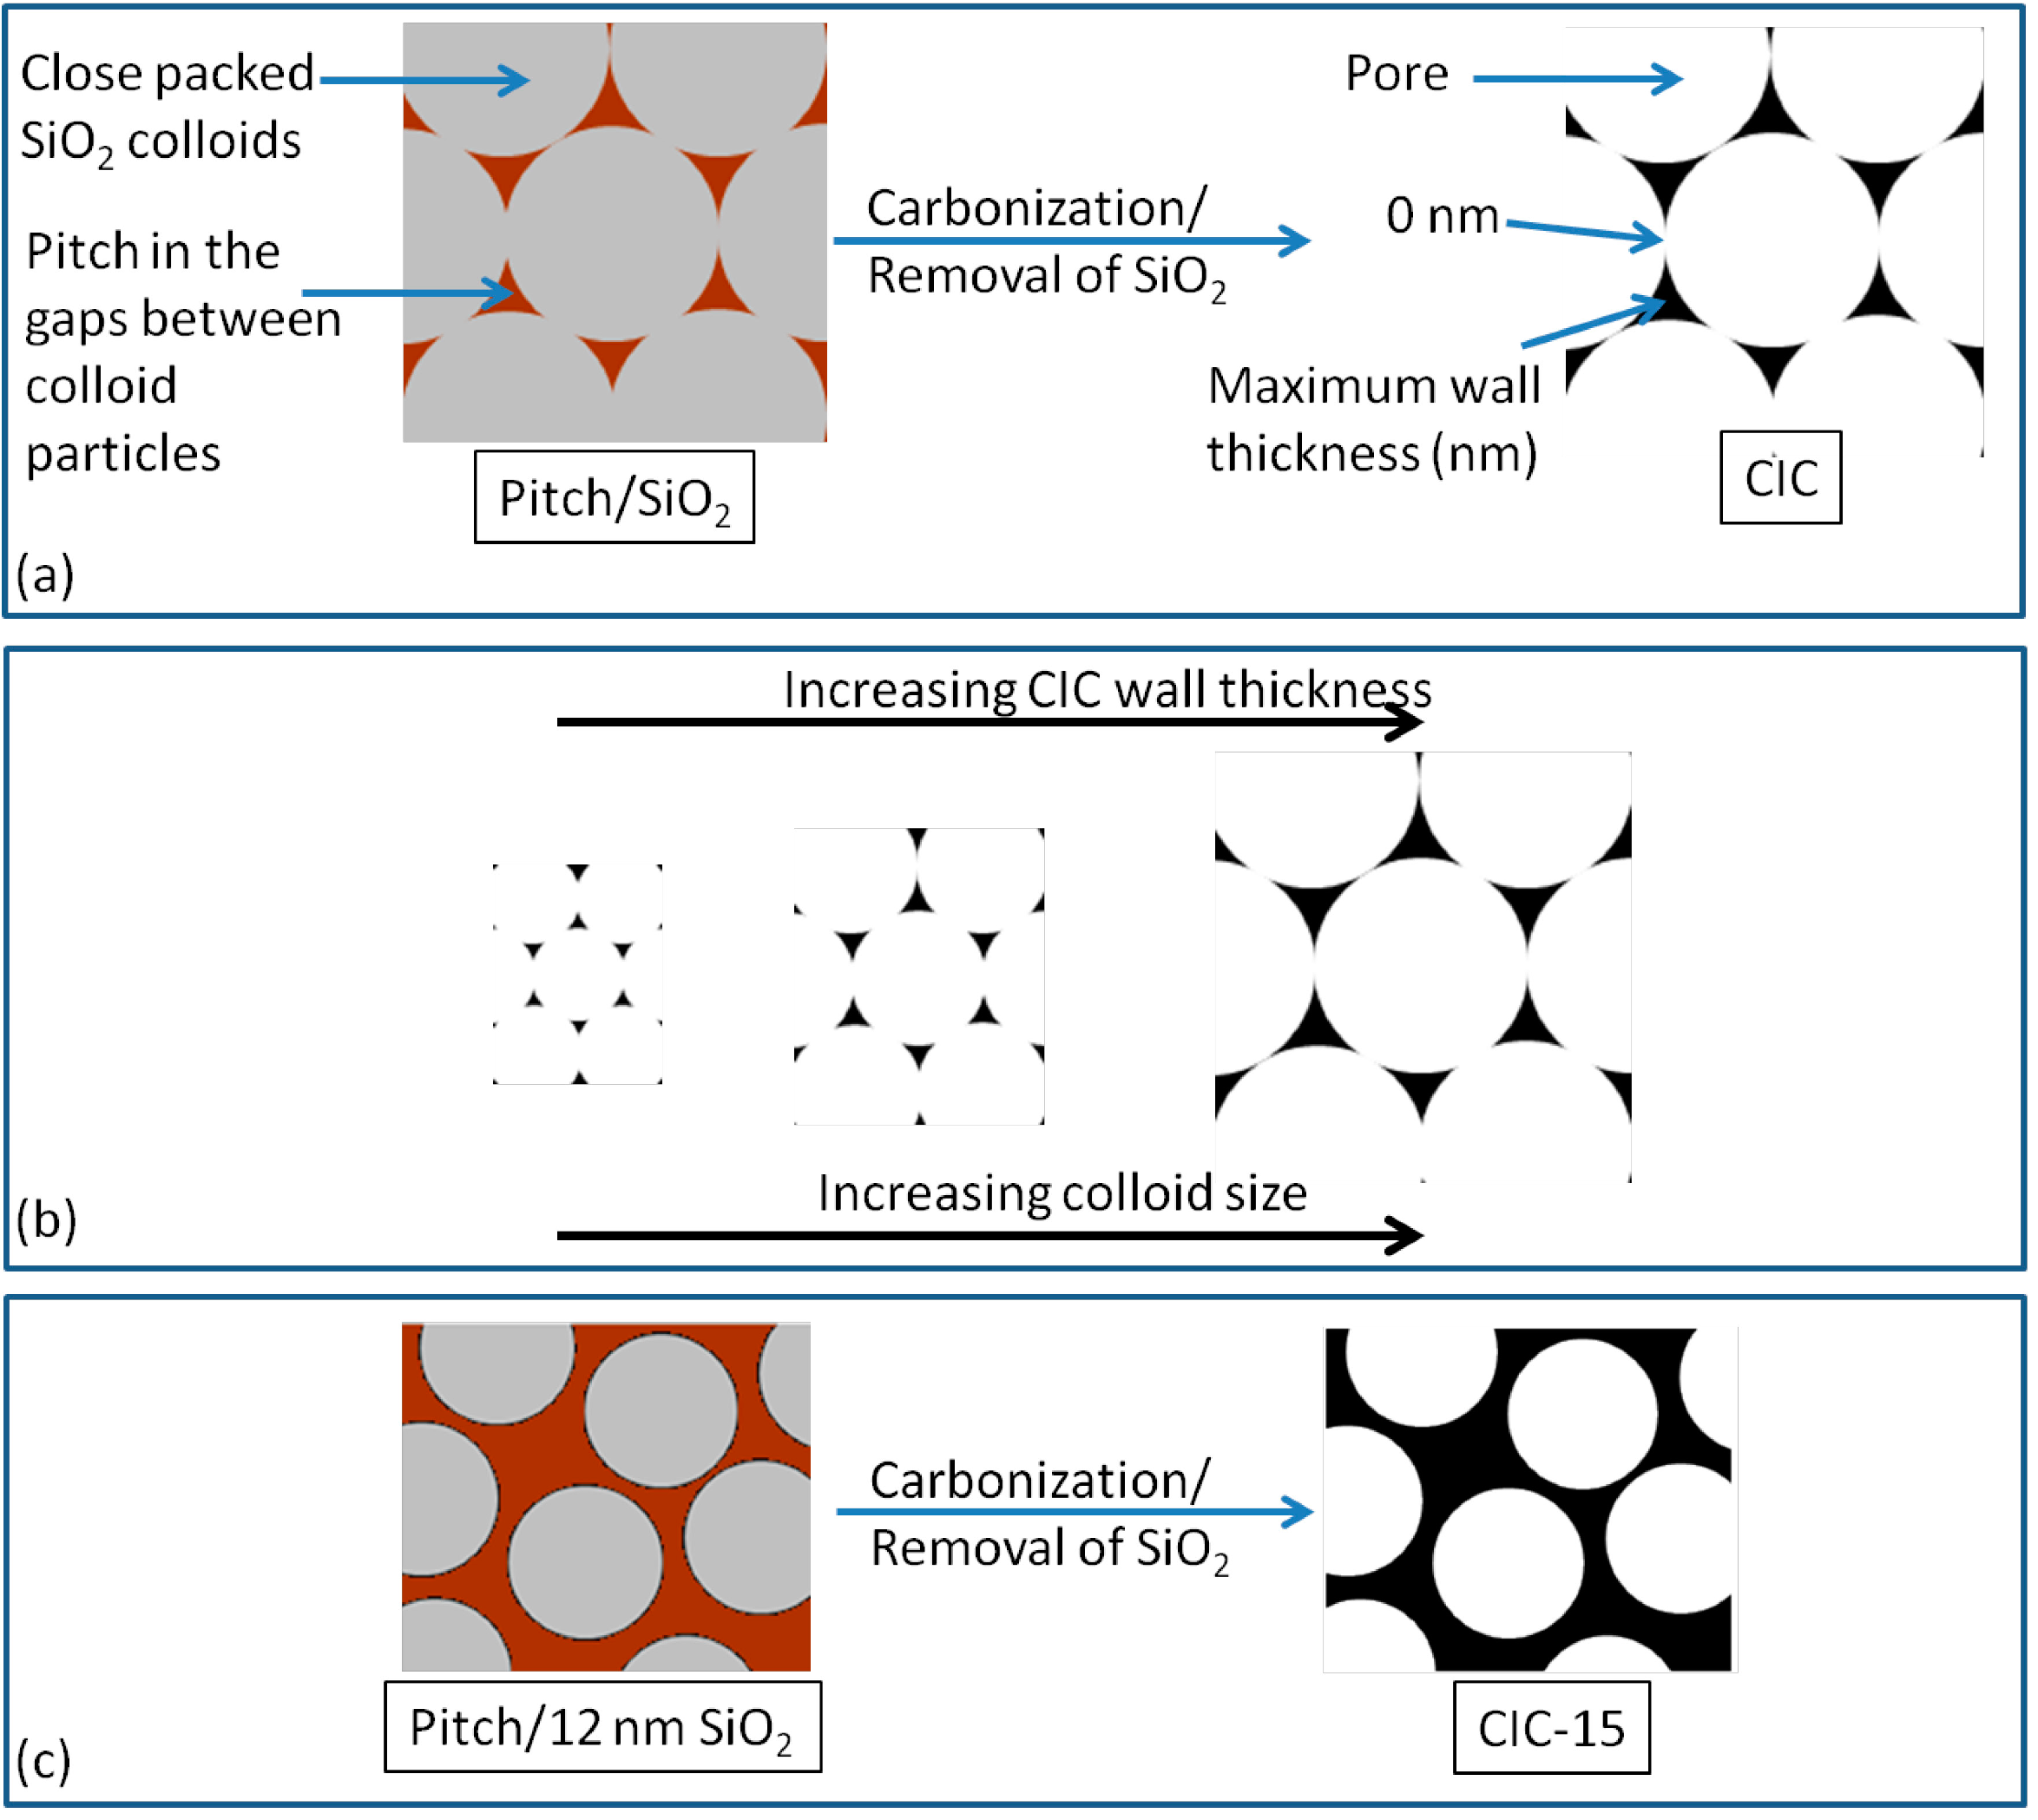
1.3. Colloid Imprinted Carbons (CICs)

It has been previously shown that, while mesoporous carbons can accommodate Pt in their pores, Nafion deposition may prove to be more challenging for pores <40 nm in diameter [9,31,32]. This would result in proton transport limitations to Pt particles that are buried deep within the pores, but are not in direct contact with Nafion. It is thus crucial to develop carbon materials that allow for facile tuning of pore diameter, beyond what is achievable for OMCs, to avoid these problems.
In 2001, Li et al. [30] reported a novel approach to mesoporous carbon design, allowing for control of both pore diameter and length. This synthesis was based on the unique physical properties of a naphthalene-based mesophase pitch precursor, which is a polycyclic aromatic hydrocarbon (PAH) and a common by-product of the petroleum industry. These PAHs interact through long range London dispersion forces and arrange in an ordered, liquid crystalline structure [33]. A synthetic naphthalene-based mesophase pitch (Mitsubishi AR pitch) was chosen by Li et al. [30], as petroleum-based pitches often contain sulphur impurities. The reported softening range of this pitch varies in the literature, with the lower and upper temperatures generally falling between 230 °C and 350 °C [18,30,33].
In their original work, Li et al. [30] demonstrated that SiO2 colloids coated on the surface of AR pitch can be imprinted into its volume by heating to temperatures within its softening range. Importantly, they were able to show that the depth of imprinting of the SiO2 colloids can be controlled based on the imprinting temperature that is used. By subsequently carbonizing the silica/pitch composite and removing the SiO2 colloids by refluxing in NaOH, a porous colloid imprinted carbon (CIC) powder is generated, with pore diameters equal to the size of the SiO2 colloids that are used and pore lengths controlled by the imprinting temperature. While other colloid-based approaches to mesoporous carbon synthesis have been reported, such as colloid infused resorcinol-formaldehyde resins [34], no other reported synthesis allows for control of both pore depth and diameter [27], making the CICs an ideal material for both enhancing PEMFC performance as well as understanding the impact of pore parameters on ORR performance.
Since this discovery, several groups have investigated CICs as potential catalyst supports for PEMFC applications. In a communication by Fang et al. [35], it was shown that, when loaded with 20 wt. % Pt, a fully imprinted CIC, with a pore diameter of 26 nm (CIC-26), outperformed similarly loaded VC as a PEMFC cathode. This was explained by the higher accessible surface area of CIC-26 vs. VC, leading to a more uniform Pt distribution on CIC-26 vs. VC. Also, the measured electronic conductivity of CIC-26 was indicated to be higher than VC, which would serve to minimize ohmic losses, while the larger pore diameter of CIC-26 vs. VC should facilitate mass transport.
The use of CICs as a catalyst support has also been extensively explored by our group [7,15,36]. In previous work, we used 22 nm SiO2 colloids to prepare CICs having a controllable pore diameter of 26 nm, but different pore depths (controlled by varying the imprinting temperature from 250 °C–400 °C) [36]. 3D TEM and TEM tomography were used to demonstrate that Pt had successfully been loaded down the full length of the CIC pores. Importantly, it was shown that the ORR activity of the Pt nanoparticles was independent of their location down the CIC pores. This is likely due to the relatively large (26 nm) pore diameter of these CIC supports, which greatly facilitates mass transport to the Pt nanoparticles inside these pores.
In another study, we demonstrated that a Pt-loaded CIC with 26 nm dia pores (CIC-26) exhibited a lower ORR activity than a similarly loaded CIC with 15 nm pores (CIC-15) [15]. Through the use of TEM tomography, we showed that the poorer ORR activity of Pt/CIC-26 vs. Pt/CIC-15 was likely due to its very thin walls (~1.5 nm) vs. the 5–15 nm walls of Pt/CIC-15. This conclusion is in agreement with our findings on the importance of the diameter of OMC nano-strings on ORR activity [14]. However, only CIC-15 and CIC-26 were evaluated in this initial study [15]. Therefore, the goal of the present work is to verify the importance of carbon wall thickness on the ORR activity of Pt/CIC cathode materials. Control of the CIC wall thickness was achieved by varying the size of the silica colloids used in their synthesis, with larger diameter silica particles (15–80 nm) resulting in larger gaps between adjacent particles, and thus thicker carbon walls. All four CICs (CIC-15, CIC-26, CIC-50, and CIC-80) were loaded with 10 wt. % Pt, and gas sorption, transmission electron microscopy (TEM), and TEM tomography were used to characterize the porous nanostructure of the CICs.
In terms of the observed oxygen reduction (ORR) activity, determined through RDE studies in aerated 0.5 M H2SO4 solutions, it is demonstrated here that the 10 wt. % Pt/CIC-26 catalyst is a much poorer catalyst than all of the other CIC-based materials, due primarily to its notably higher Tafel slope. A theoretical study, based on porous electrode theory, was also carried out, confirming that pore diameter alone cannot be used to predict the performance of these novel Pt-loaded mesoporous carbon catalysts. Overall, this work shows clearly that the internal dimensions, including both pore sizes and wall thicknesses, need to be carefully controlled in the future design of carbon-based catalyst support materials.

2. Results and Discussion

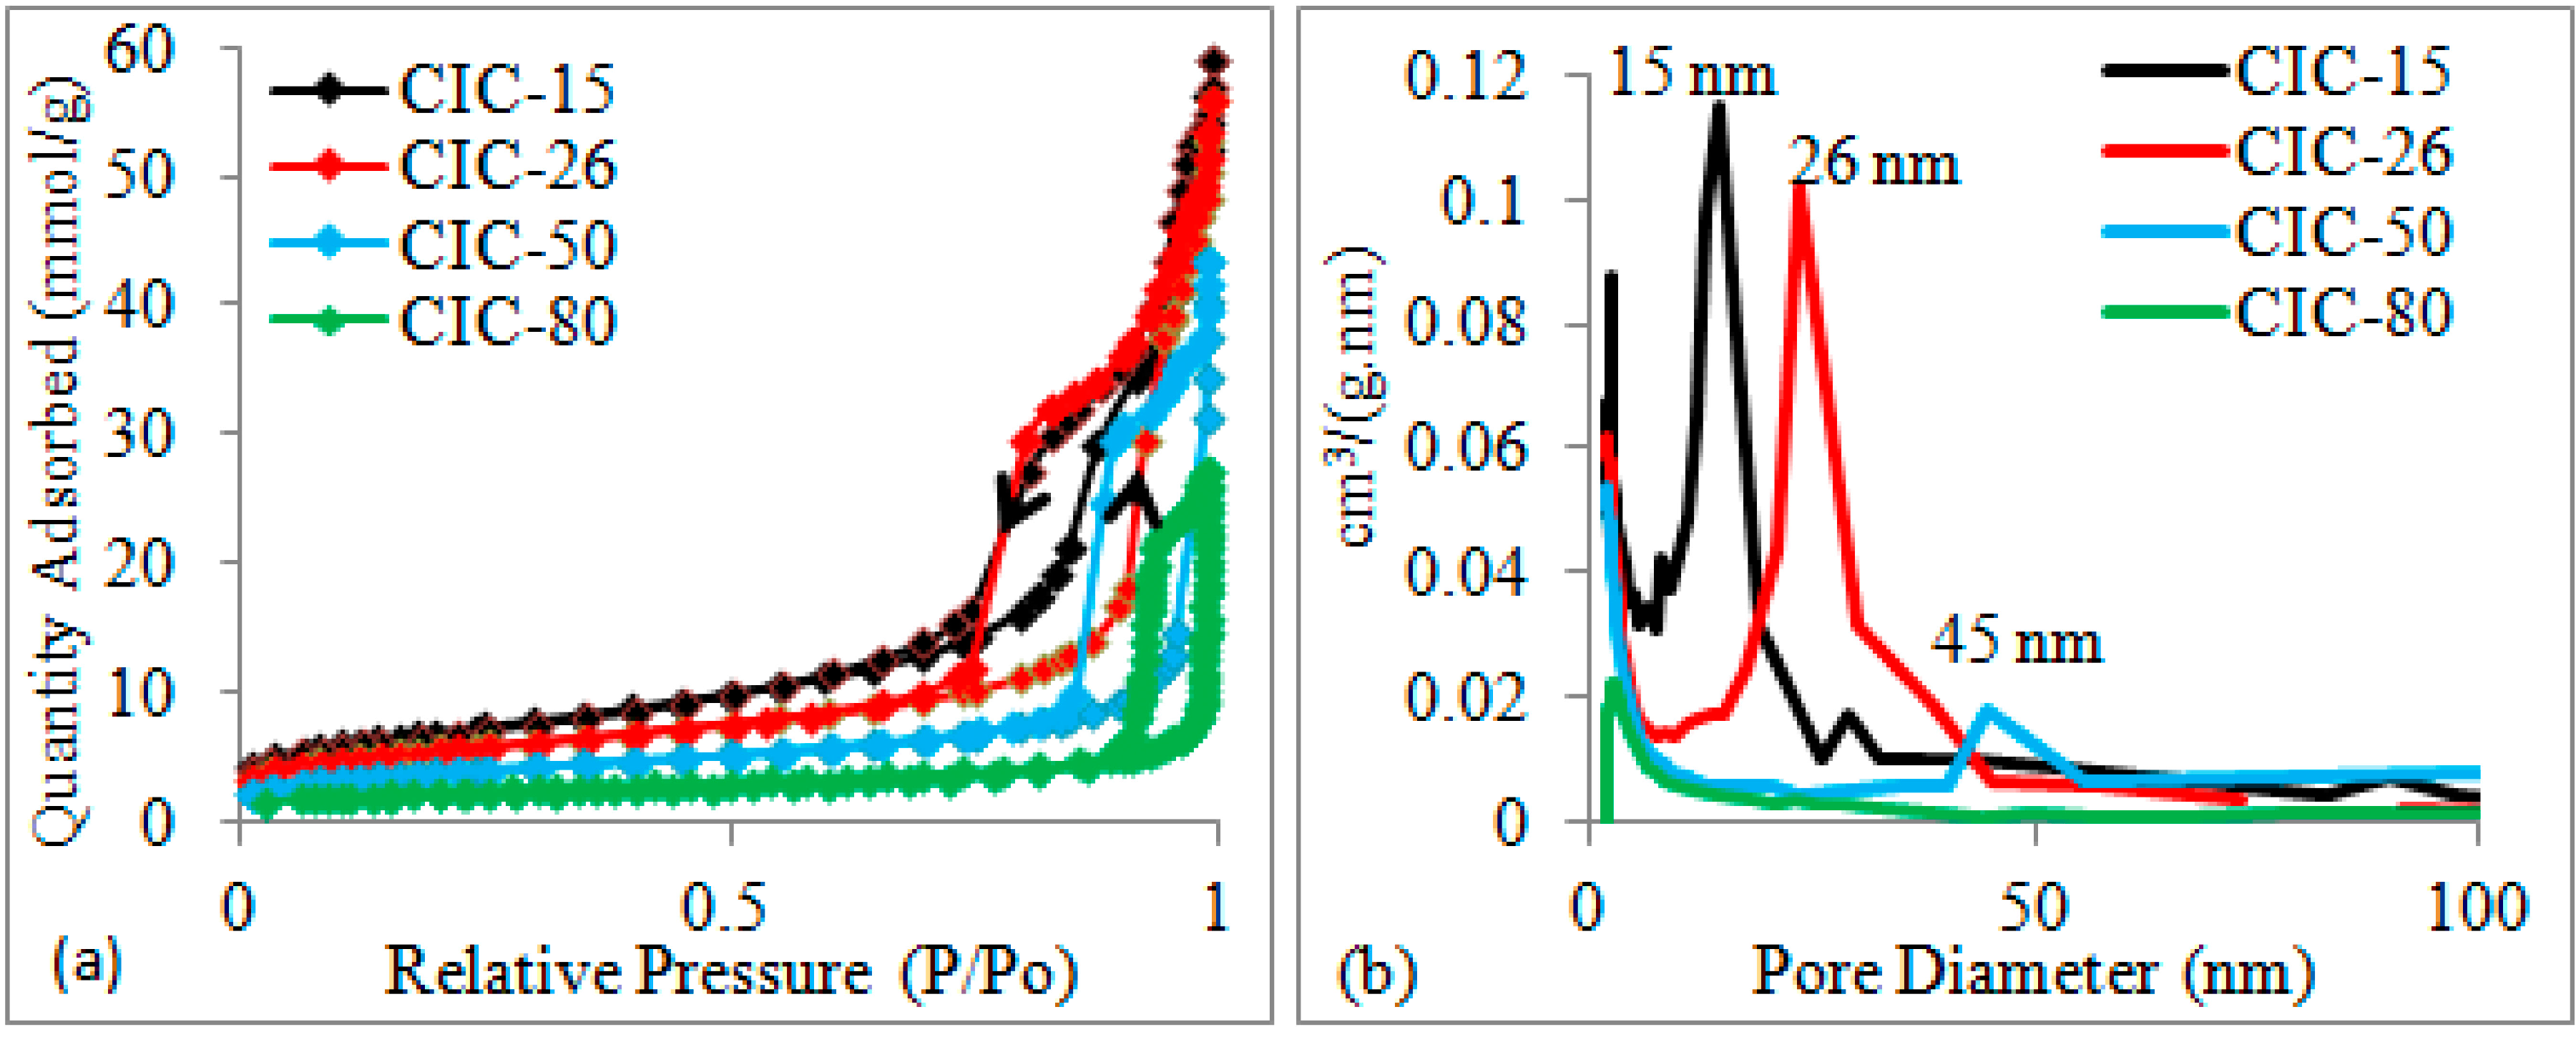
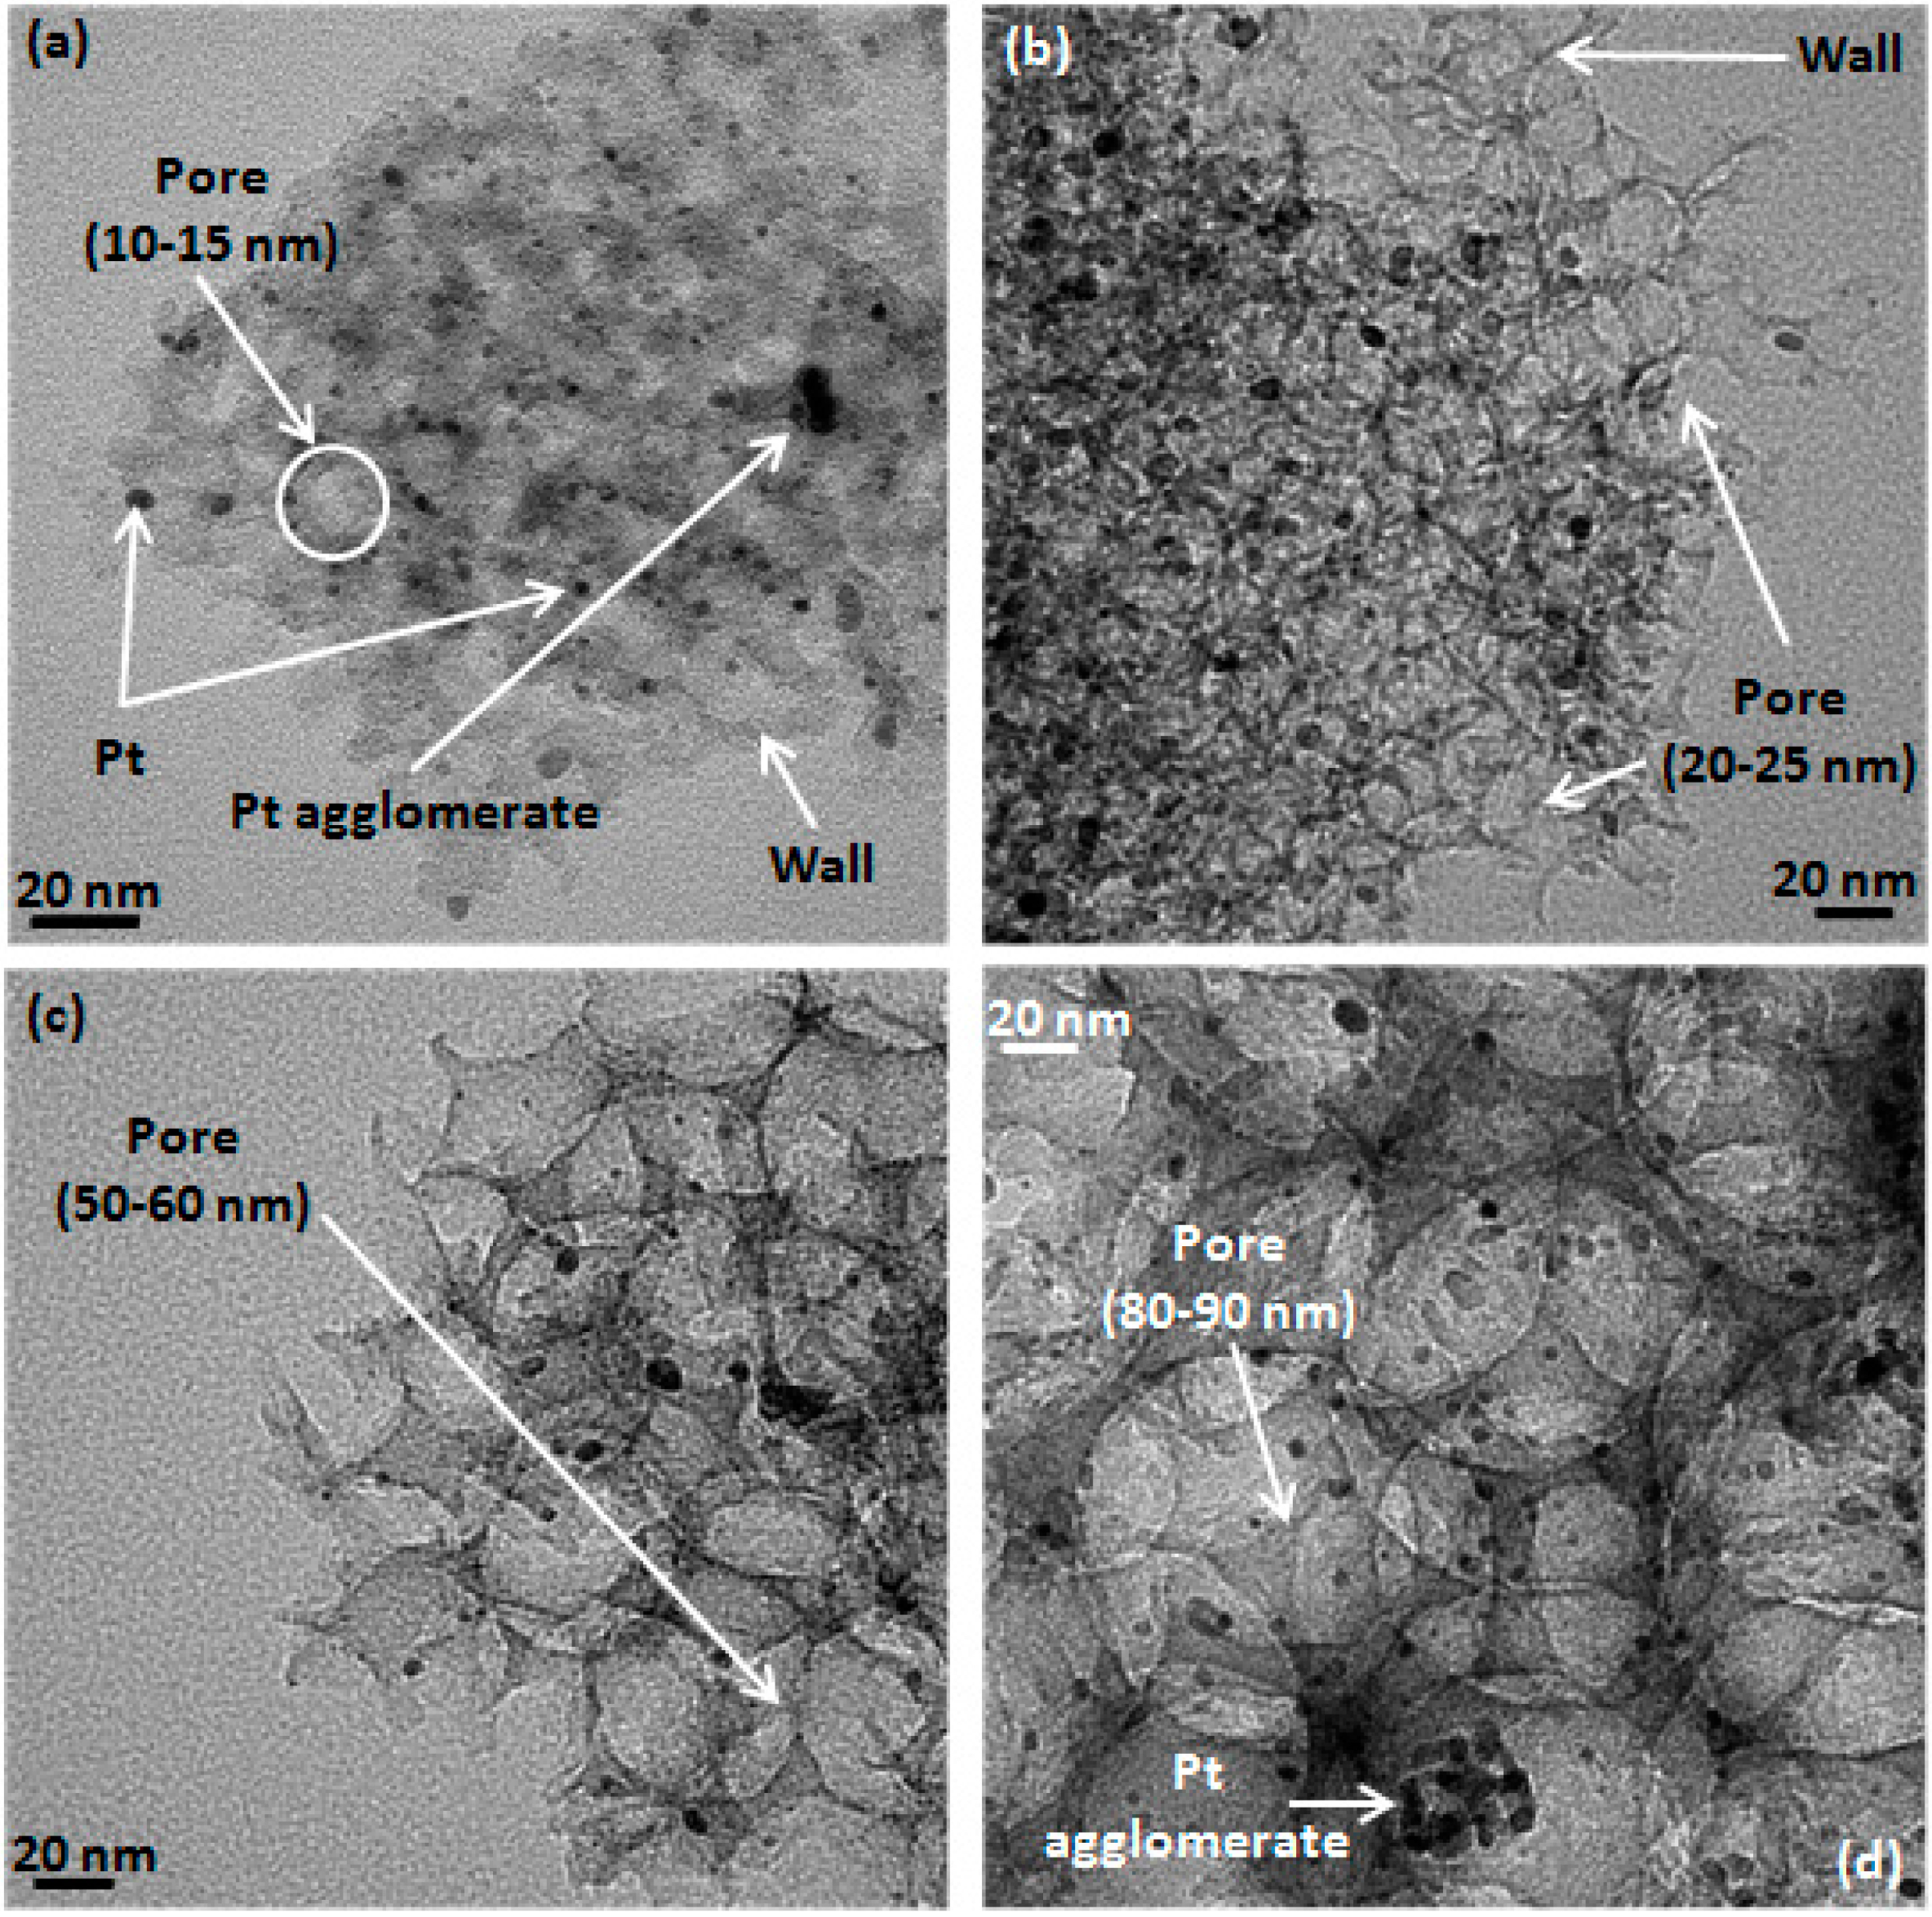
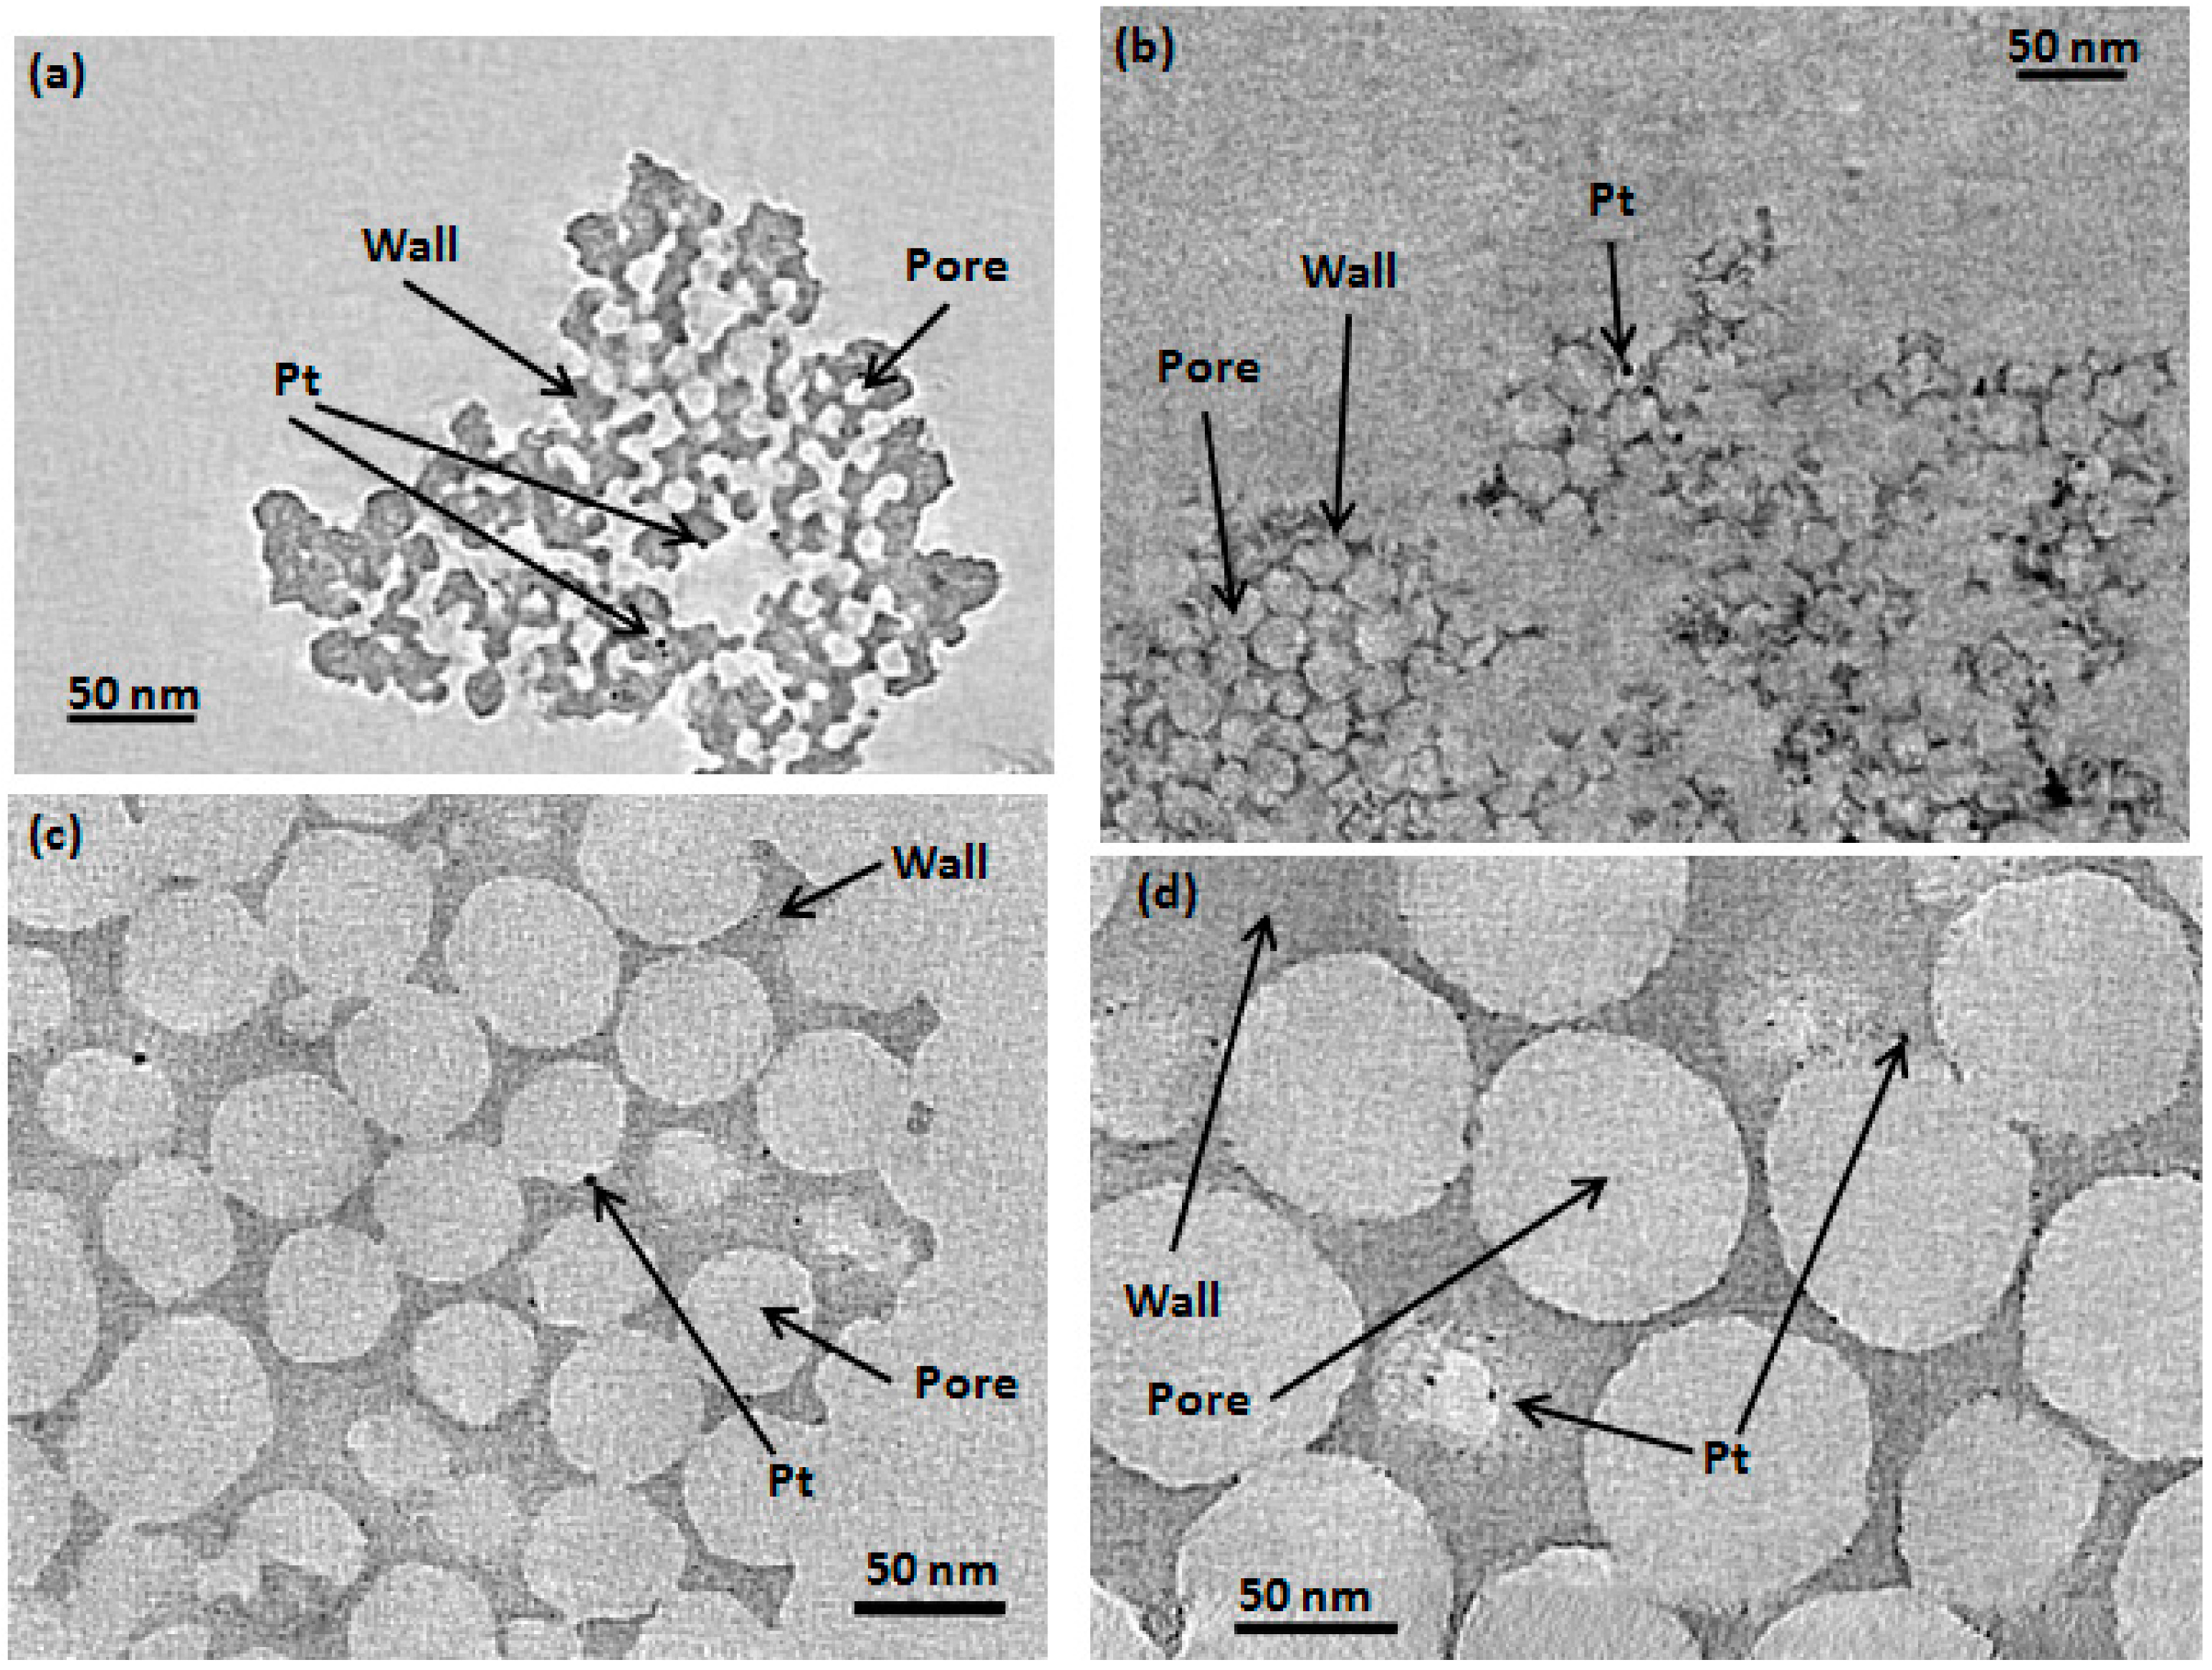
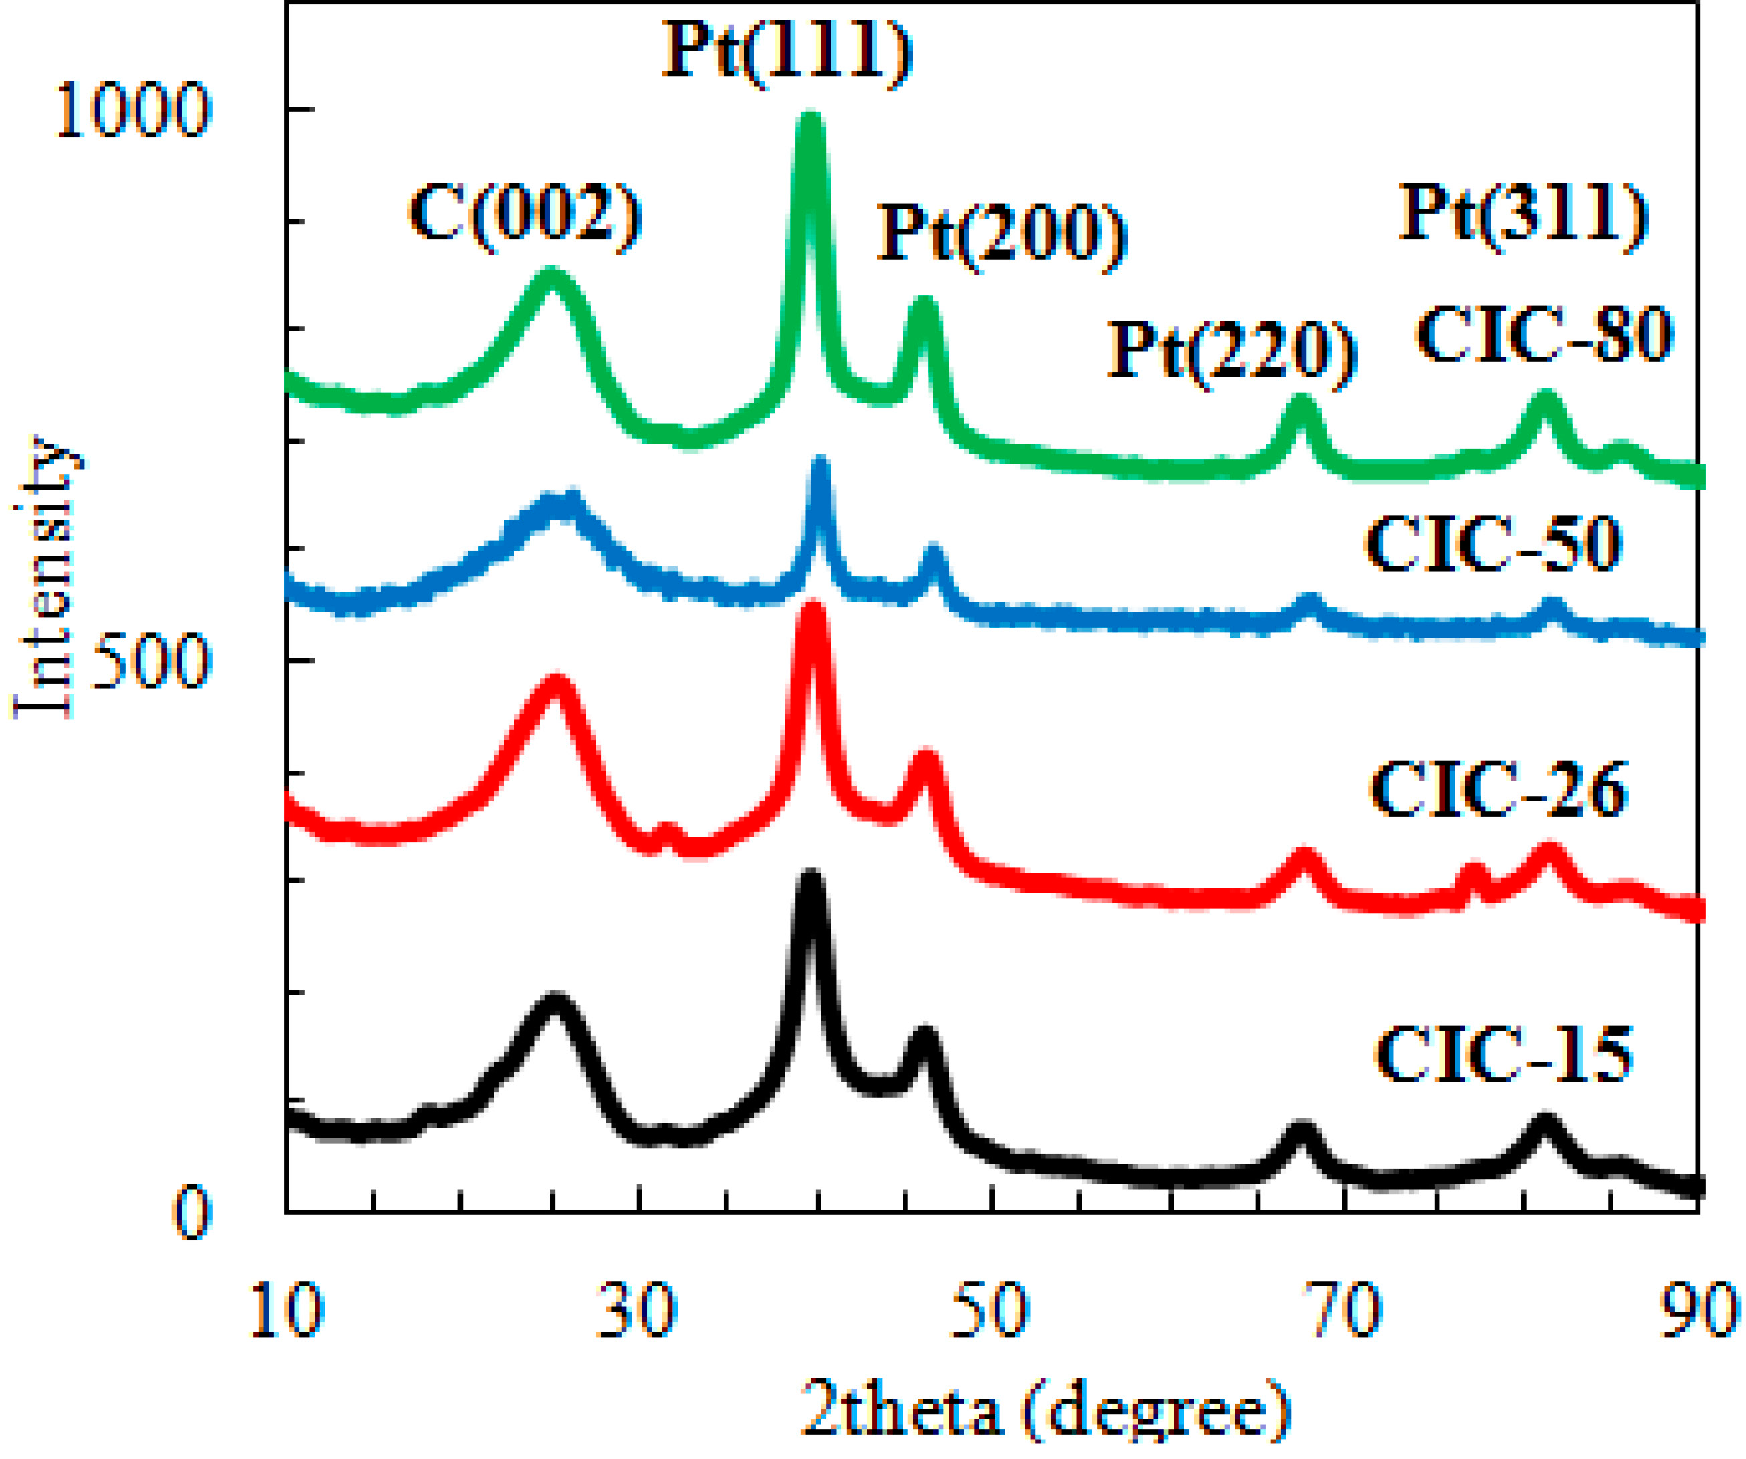
2.1. Determination of CIC Pore Diameter and Pt Nanoparticle Size

The sorption isotherms of the four CICs under study here (expected pore diameters of 15–80 nm) are given in Figure 1a. Each CIC demonstrates a Type IV isotherm with H1 hysteresis, indicative of mesoporous (2 < pore diameter < 50 nm) materials [10,30]. Type H1 hysteresis is associated with uniform diameter and tightly packed spheres, matching well with the synthesis and predicted porous structure of the CICs. Additionally, the steep slopes of the hysteresis branches at P/Po of 0.75-1 reflect a narrow pore size distribution [37]. Thus, the fact that all four CICs demonstrate a sharp uptake of N2 in their hysteresis curves provides evidence that they each have a narrow pore size distribution.
Figure 1. (a) N2 sorption isotherms and (b) pore size distributions obtained from the adsorption branch of the sorption isotherm calculated using the BJH model [37] for the four CIC supports.
Catalysts 05 01046 g001
For both CIC-15 and CIC-26, the pore size distributions (Figure 1b) are centered at slightly larger values than expected, based on the anticipated size of the commercially obtained colloids used in their respective synthesis. This was also found by Li et al. [30] and can be attributed to a distribution in the size of the silica particles, as well as some possible agglomeration during the synthesis. For CIC-50, the pore size distribution is very broad (Figure 1b), while for CIC-80, no clear average pore size can be observed, likely due to limits of the BJH model and the Kelvin equation upon which it is based [37,38] for materials with such large pore diameters. However, the fact that such a well-defined H1 hysteresis was observed for both CIC-50 and CIC-80 strongly suggests that these materials do possess highly uniform pore sizes.
In order to verify the CIC pore diameters, especially for the larger pore sizes, transmission electron microscopy (TEM) characterization was used. TEM analysis was performed on the CICs after Pt loading, as the presence of Pt gives excellent contrast, thus greatly aiding in discerning the structure of the carbon. As is clearly visible in Figure 2a,b, the pore diameters of CIC-15 and CIC-26 match closely with those obtained from the gas sorption data (Table 1). For CIC-50 and CIC-80, the TEM images (Figure 2c,d) show pores of 50–60 and 80–90 nm in diameter, respectively, which match well with the expected values based on the size of the SiO2 colloids used in their respective synthesis.
Figure 2. TEM images of 10 wt. % Pt/ (a) CIC-15; (b) CIC-26; (c) CIC-50; and (d) CIC-80.
Catalysts 05 01046 g002
Table 1. Physical properties of the CICs before and after 10 wt. % Pt-loading.
SamplePore Diameter a (nm)Pt Particle Size b (nm)Graphite Crystallite Size c (nm)BET Surface Area (m2·g−1 ± 10%)Pore Volume (mL·g−1) ± 0.1 dWall Thickness (nm) e
CIC-1515 (10–15)-1.53301.210 ± 5
CIC-2626 (20–25)-1.53801.60–3
CIC-5045 (50–60)-1.52401.40–20
CIC-80N/A (80–90)-1.51501.40–50
Pt/CIC-1594.0 (4.3)-2800.9-
Pt/CIC-26244.0 (4.7)-3601.6-
Pt/CIC-50456.0 (4.4)-2601.6-
Pt/CIC-80N/A4.5 (4.5)-1401.3-
a Pore diameter determined from N2 adsorption isotherm data. The average pore diameter from TEM analysis is given in brackets; b Calculated from Pt(111) XRD peak width using the Scherrer equation. The average particle size obtained from TEM analysis is given in brackets; c Calculated from the graphite (002) peak; d Total pore volume determined at P/Po = ~0.99; e Obtained from TEM tomography; -: This data is not applicable/available.
Importantly, Figure 2 also clearly demonstrates that all four Pt-loaded (10 wt. %) CIC catalysts have very similar Pt nanoparticle sizes, centered at ~ 4.5 nm (Table 1). In the absence of any support effects or any transparent limitations, they should therefore all demonstrate very similar oxygen reduction reaction (ORR) activities. A few large (10–20 nm) agglomerates of Pt are seen for each of the four Pt/CICs (examples are shown in Figure 2a,d). These agglomerates are large enough to have blocked some of the 15 nm pores for the Pt/CIC-15 sample, but would likely not have blocked the entrance of the larger pore diameter CICs.
X-ray diffraction (XRD) was used to determine the size of the Pt particles on the four CIC supports by applying the Scherrer equation to the Pt(111) peak (Figure 3). While the relative intensities of the Pt(111) peaks are not all the same, all of the catalysts show Pt peaks with a similar full width at half maximum, consistent with Pt crystallite sizes of ~4.5 nm, in good agreement with the TEM data (Table 1). By tracking the graphite 002 peak (Table 1), all four CICs were found to have graphite crystallite sizes of ~1.5 nm, similar to what is observed for many conventional carbon blacks [16]. Therefore, the intrinsic resistivity of the four CICs should be similar to each other and to carbon black.
Figure 3. XRD patterns of the four 10 wt. % Pt-loaded CICs.2.1.1. This Is Subsection Heading.
Catalysts 05 01046 g003

2.2. Surface Area of Pt-Free and Pt-Loaded CICs

The BET surface areas and pore volumes of the four CICs are also reported in Table 1. It is seen that, with the exception of CIC-15, the specific surface area (m2/g) decreases with increasing pore radius, while the specific pore volume (cm3/g) remains relatively constant. The trends in these parameters (Table 1) are not surprising, since these should both correlate with the size of the colloids used during the imprinting step. While the specific surface area of a spherical colloidal particle will depend inversely on its radius, the specific volume will be independent of radius, as shown in Equation (1) (r = particle radius, ρ = particle density).
Specified surface area:  m 2 g =   4 π r 2 4 3 π r 3 ρ =   3 γ ρ Specified volume:  m 3 g =   4 3 π r 3 4 3 π r 3 ρ =   1 ρ
While the gas sorption isotherms (Figure 1a), pore size distributions (Figure 1b), and TEM images (Figure 2) all indicate that the synthesis of the four CICs was successful, a comparison of the measured (BET areas reported in Table 1) vs. predicted CIC surface areas allows for further verification of the assumed CIC porous structure. Hexagonal close packing is the most spatially efficient configuration for the packing of spheres, with a packing density of 0.74 [39]. During the solvent evaporation stage of the CIC synthesis, the silica nanoparticles self-assemble into a hexagonally close packed (hcp) configuration in order to maximize their contact with nearest neighbours and reduce their surface energy. Since CICs are inverse replicas of the hcp silica colloids, the maximum theoretical specific surface area (m2/g) of the CICs can be calculated from the surface area of the silica colloids, based on their size, packing arrangement, and the density of the carbon walls (1.6 g/mL). It should be noted that there is a range of carbon density values reported in the literature for carbon materials. For our purposes, we have used the same value reported by Li et al. in their original work with CICs [40]. To increase the accuracy of this calculation, the TEM-measured CIC pore diameters were used (Figure 2 and Table 1), rather than the expected pore diameters, based on the assumed size of the imprinting silica colloids.
Figure 4 clearly shows that, aside from CIC-15, the measured BET surface areas of the CICs match very closely with the expected values based on Equation (1), confirming the assumed hcp configuration of their pores. Importantly, the fact that CIC-15 has a much lower surface area than expected suggests that close packing of the 15 nm silica particles did not occur for CIC-15 and that CIC-15 must have a more disordered porous structure than the other three CICs, consistent with the TEM results (Figure 2).
Looking first at Figure 2a, pores of ~15 nm diameter are present, but they are not arranged in a hcp configuration, as predicted above. This may be due to a disordered arrangement of the 12 nm silica colloids around the mesophase pitch carbon during synthesis or due to the partial collapse of the carbon structure during carbonization, which has been previously suggested to occur for imprinted carbons with pores <50 nm in diameter [41,42]. The fact that the pores of CIC-15 are not tightly packed would produce a lower surface area than expected, thus confirming the results shown in Figure 4. It should also be noted that CIC-15 was synthesized multiple times, with the measured surface area always being lower than expected.
Figure 4. BET-determined and predicted (Equation (1)) surface area of the four CICs vs. their TEM measured pore diameter.
Catalysts 05 01046 g004
A decrease in both the surface area and pore volume of CIC-15 was observed (Table 1) after Pt loading, possibly due to the larger Pt agglomerates (Figure 2) blocking the entrance to some of the pores. However, for the three CIC catalysts with the larger pores, within error, very little change in surface area and pore volume was observed after Pt loading (Table 1), suggesting that the pore mouths remained open.

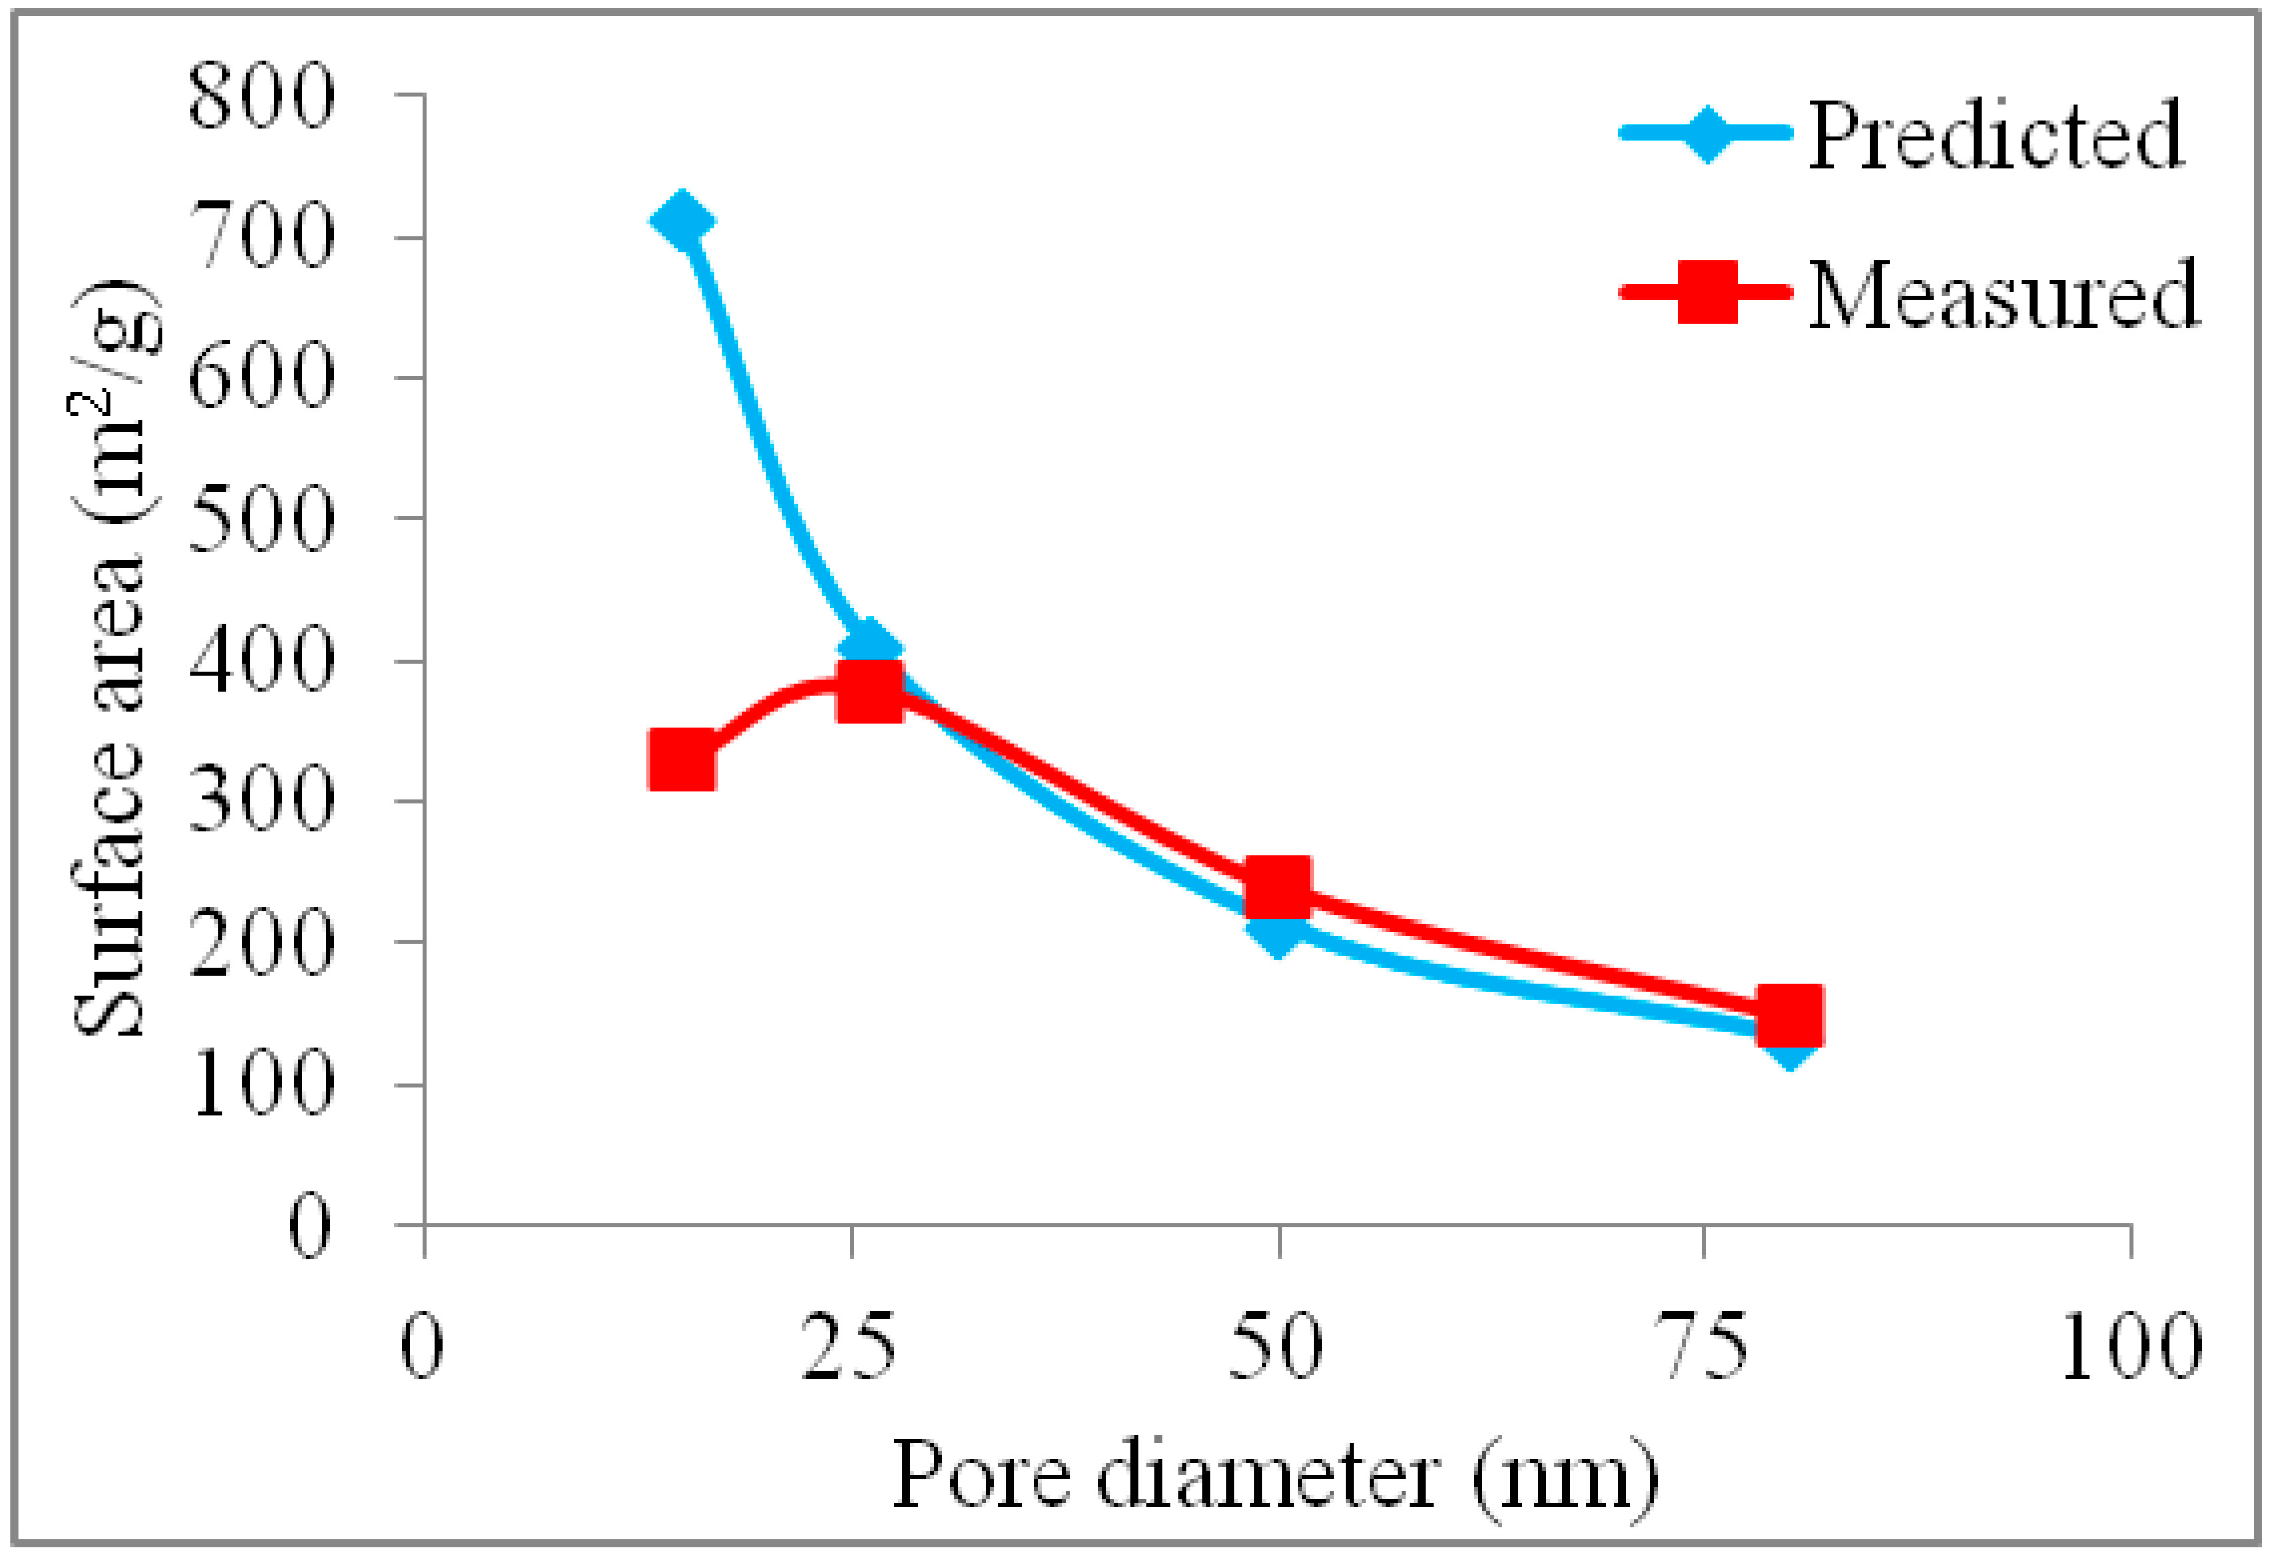
2.3. Wall Thickness of CIC Supports

As one of the main goals of the present work was to investigate how the wall thickness of the Pt-loaded CIC catalyst supports influences their oxygen reduction reaction (ORR) activity, it was critical to accurately determine this variable. Therefore, TEM tomography was used to characterize each of the four Pt/CIC catalysts, with the results shown in Figure 5.
It is seen for the CIC-(26-80) materials that the close packing of their pores (Figure 5b–d) resulted in wall thicknesses ranging from non-existent (reported as 0 nm) to a maximum value, as shown schematically in Figure 6a and also given in Table 1. For an ordered packing of the spherical SiO2 particles around the pitch particles in the first step of CIC synthesis, thicker carbon walls are expected if larger diameter silica colloids are used and then removed (Figure 6b), explaining why CIC-26 (prepared from 22 nm diameter SiO2 colloids) has thinner walls than both CIC-50 and CIC-80, which were prepared using the 50 and 80 nm colloids, respectively. However, the disordered packing of the 12 nm diameter SiO2 particles in CIC-15 (Figure 5a) has led to much thicker walls (~10 nm) than expected, had the 12 nm colloids been tightly packed together. This is because HCP is the most spatially efficient packing of spheres and thus any other arrangement will result in more available space between them. This will result in thicker carbon walls after filling with the mesophase pitch precursor and its subsequent carbonization to form carbon, as is shown schematically in Figure 6c.
Figure 5. TEM tomography image slices of 10 wt. % Pt supported on (a) CIC-15; (b) CIC-26; (c) CIC-50; and (d) CIC-80, with the dark grey areas representing the CIC walls and the light grey regions being the open pores. All four images were obtained roughly halfway through the CIC particles.
Catalysts 05 01046 g005
Figure 6. 2-D cartoon showing (a) the origin of the range of wall thicknesses for CIC-26, CIC-50 and CIC-80 and revealing; (b) how the CIC wall thickness will increase as the silica colloid diameter increases (after removal of SiO2); (c) shows that the disordered packing of the 12 nm colloids results in thicker walls than expected for CIC-15.
Catalysts 05 01046 g006

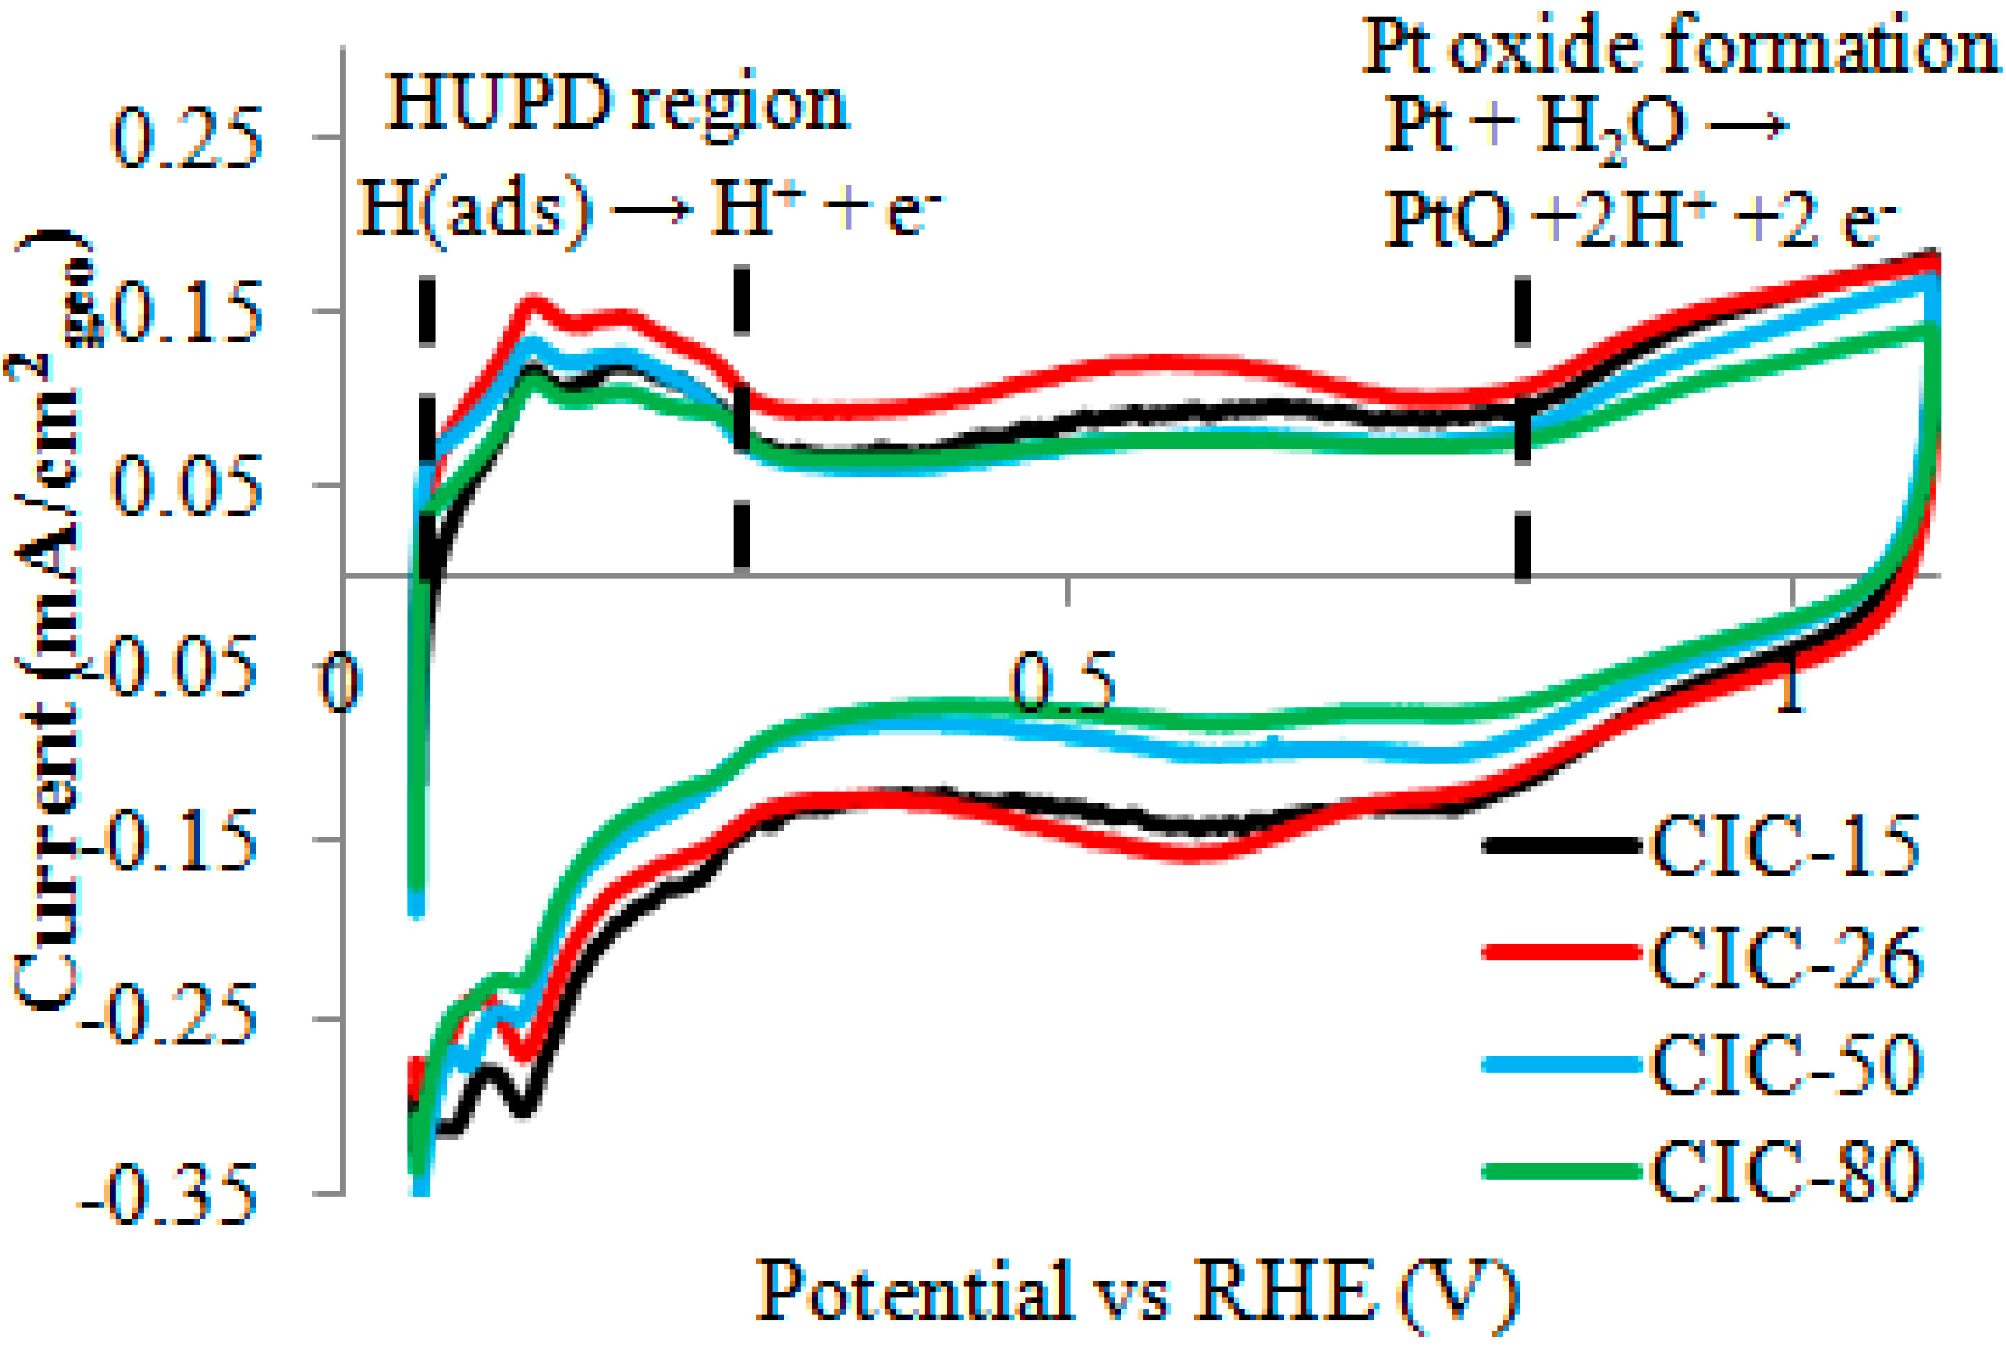
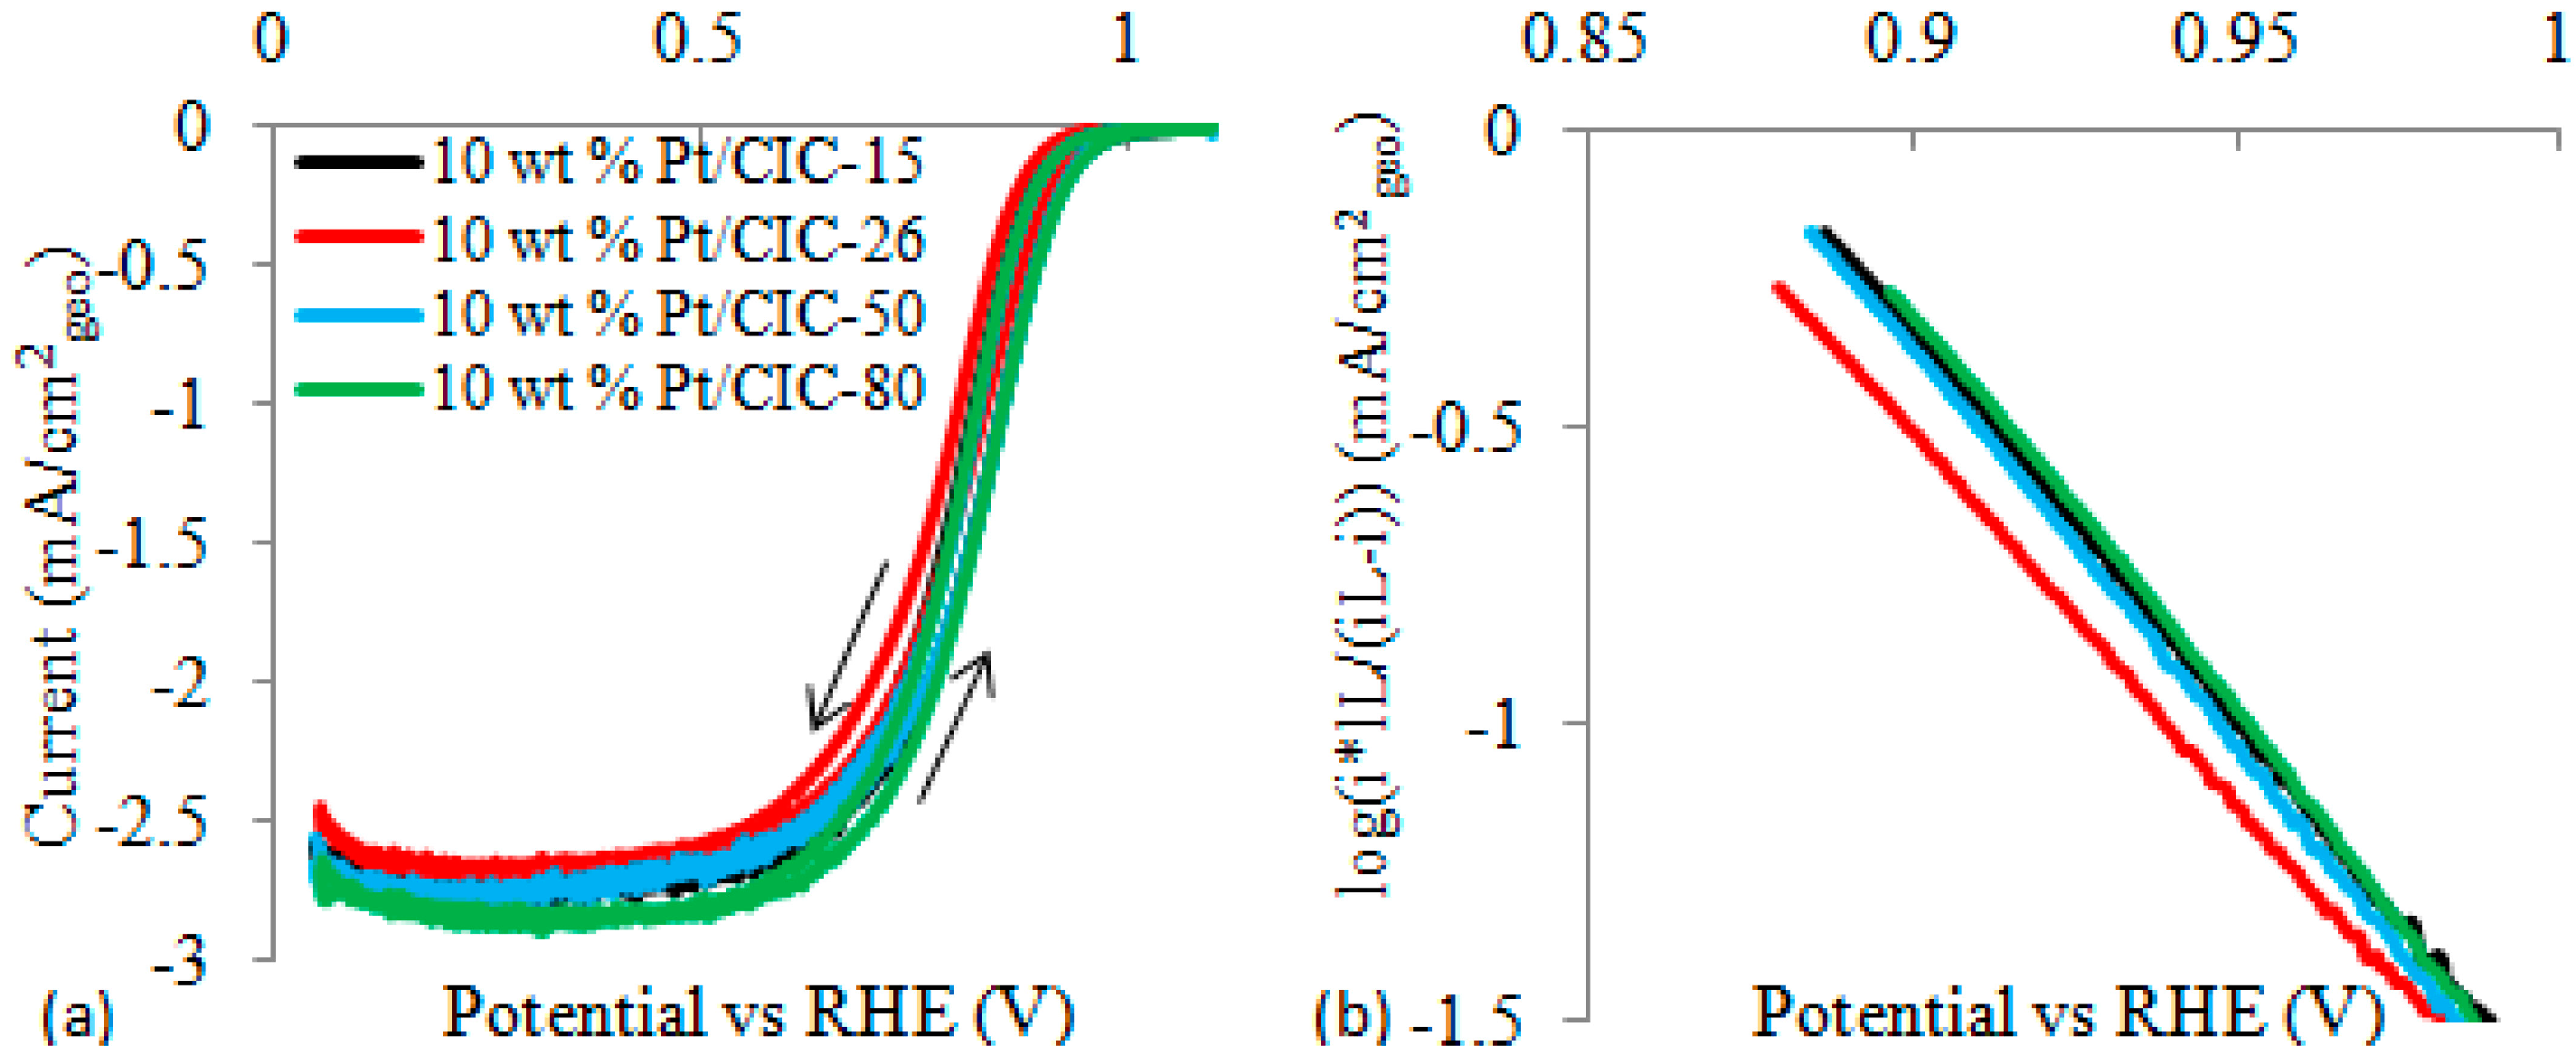
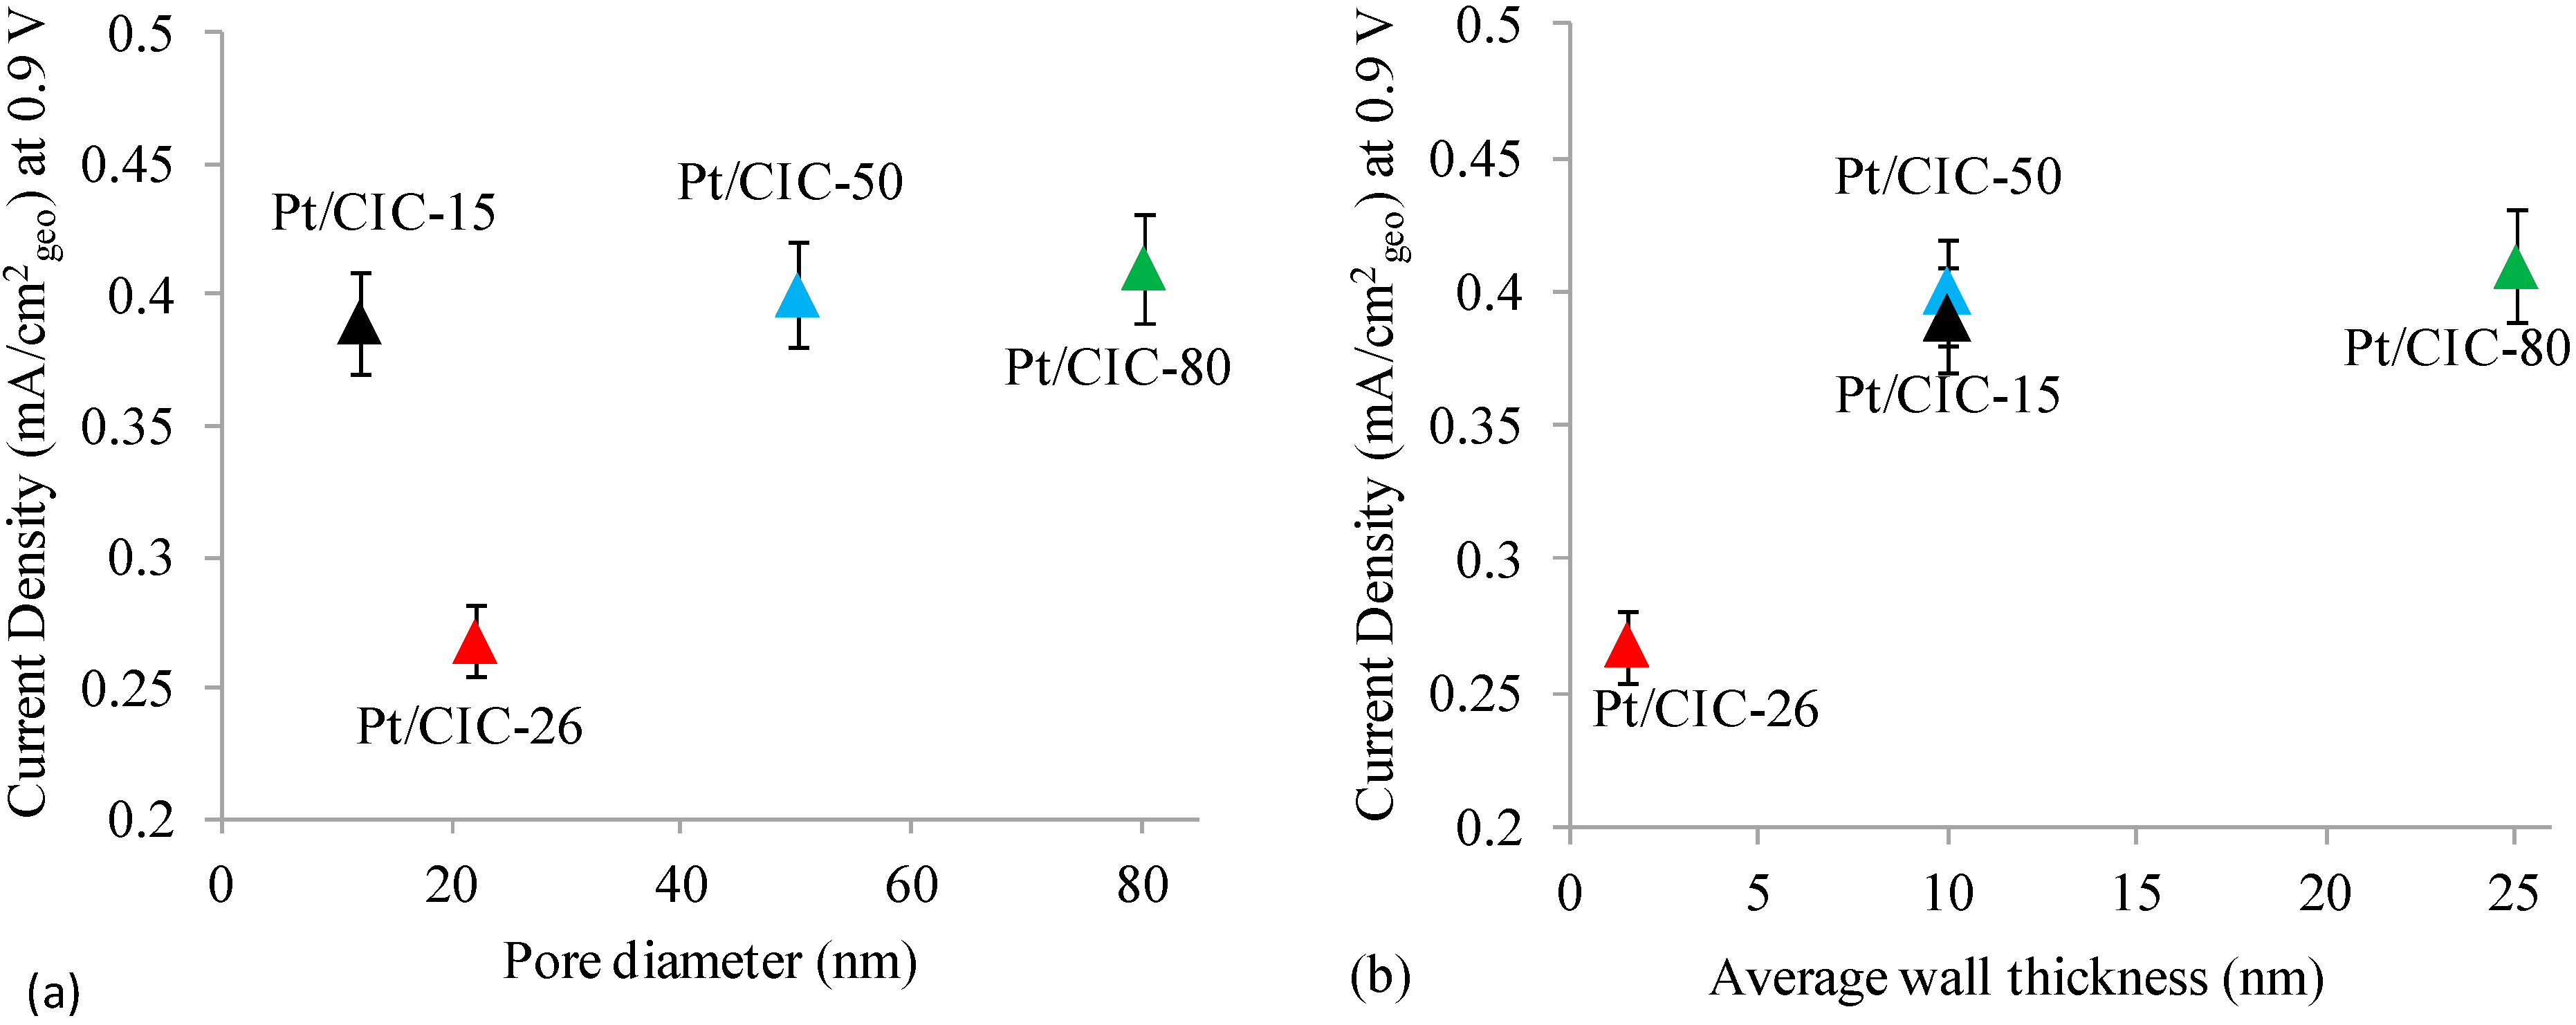
2.4. Effect of CIC Nanostructure on ORR at Pt/CIC Catalysts

Prior to performing the oxygen reduction reaction (ORR) studies, cyclic voltammograms (CVs) of the four 10 wt. % Pt/CIC catalysts were collected under a N2 environment (Figure 7). The electrochemically active Pt surface area (ECSA) was obtained by calculating the total charge passed in the hydrogen underpotential (HUPD) region (0–0.37 V) after subtracting the charging current and assuming a value of 210 µC/cm2 for one monolayer of Hads on Pt [16,43,44]. Importantly, Table 2 shows that all four Pt/CIC catalysts have similar Pt ECSAs and thus should have a very similar activity towards the ORR, assuming that the CIC support or its nanostructure has no additional influence on activity.
Figure 7. CV response (10 mV/s) of the four 10 wt. % Pt/CIC catalysts, cast on the glassy carbon RDE surface, in room temperature, deaerated 0.5 M H2SO4.
Catalysts 05 01046 g007
Figure 8. (a) ORR response at 10 mV/s of the four 10 wt. % Pt/CICs in room temperature 0.5 M H2SO4, all at 1000 rpm; and (b) the corresponding ORR Tafel plots.
Catalysts 05 01046 g008
The ORR responses of the four 10 wt. % Pt-loaded CICs are shown in Figure 8a. The current is seen to be fully kinetically controlled (Butler-Volmer kinetics) at low overpotentials (>0.9 V), as expected, followed by mixed kinetic/diffusion control (0.6–0.9 V) and finally diffusion control at <0.6 V (when the limiting current is reached). The Tafel plots in Figure 8b clearly show that the ORR activity (per geometric area of the electrode) of the 10 wt. % Pt/CIC-26 catalyst is lower than that of the other three 10 wt. % Pt/CICs, as is also shown in Table 2. In fact, while Pt/CIC-15, -50 and -80 all demonstrate the expected ORR Tafel slope (in the anodic sweep) of ~70 mV/dec [45], Pt/CIC-26 exhibits an anomolously high Tafel slope of 85 mV/dec (Table 2). As a difference in the ORR mechanism, or slow step, is not expected at these very similar Pt/C materials, the higher Tafel slope of the Pt/CIC-26 catalyst likely reflects the onset of transport limitations in the CIC-26 material with increasing overpotential [46,47]. However, since CIC-26 should have wider pores than CIC-15, it is highly unlikely that the observed difference in Tafel slope is due to transport limitations of protons or dissolved oxygen through the pores of the CICs.
Table 2. Electrochemical results obtained using the 10 wt. % Pt/CIC catalysts.
SampleECSAa (m2/g) ± 10%ORR Current at 0.9 V b (mA/cm2)Tafel Slope (mV/dec)
10 wt. % Pt/CIC-15450.4070
10 wt. % Pt/CIC-26550.3285
10 wt. % Pt/CIC-50550.4070
10 wt. % Pt/CIC-80450.4070
a Electrochemical surface area (ECSA) calculated from the CV hydrogen underpotential deposition (HUPD) charge, assuming a value of 210 µC/cm2 for one monolayer of adsorbed hydrogen on the Pt surface [16,43,44]. b Obtained in 0.5 M H2SO4 using 10 mV/s, 1000 rpm, and room temperature conditions.
As further evidence of this, Figure 9a shows a plot of ORR activity (current at 0.9 V vs. RHE) vs. pore diameter. If diffusion limitations in the pores were dominating the response, the ORR activity (current) would be expected to increase with increasing CIC pore diameter, which is clearly not the case.
Figure 9. ORR current densities (per geometric area of the catalyst layer deposited on the RDE) at 0.9 V for the four Pt/CIC catalysts vs. (a) CIC pore diameter and (b) average CIC wall thickness.
Catalysts 05 01046 g009
The poor ORR activity of Pt/CIC-26 is therefore proposed to be due to higher ohmic losses through its walls vs. the other three Pt/CIC-X catalysts. As the XRD data (Table 1) provide evidence that the walls of the four CICs are all equally graphitic, their inherent wall conductivity is expected to be the same. However, the very thin walls of CIC-26 (Figure 5) vs. the other three CIC supports, as is clearly visible in Figure 9b (Table 2), is believed to result in high ohmic losses. At a wall thickness of ³10 nm (CIC-15, CIC-50, and CIC-80), there is little difference in the ORR activity of the four CIC catalysts. For CIC-26, with an average wall thickness of 1.5 nm, a significant performance drop is clearly observed. This shows that the ORR activity is significantly compromised when the walls of the carbon support become thinner than 10 nm. This would explain the higher Tafel slope observed for the Pt/CIC-26 catalyst in Figure 8b [48].
The results in Figure 9b clearly show a precipitous drop in ORR activity when the CIC wall thickness is <10 nm, but control of the CIC wall thickness lacks the precision to further study the effect of wall thicknesses between 1.5 and 10 nm. However, in parallel work focused on ordered mesoporous carbons (OMCs, see Section 1.2), we have been able to precisely tune carbon support wall thicknesses (described as “nano-strings”) in this desired range [14]. Consistent with the results in Figure 8b, our earlier results have confirmed that the ORR activity is dramatically lower for carbon nano-string thicknesses of <3 nm [14].

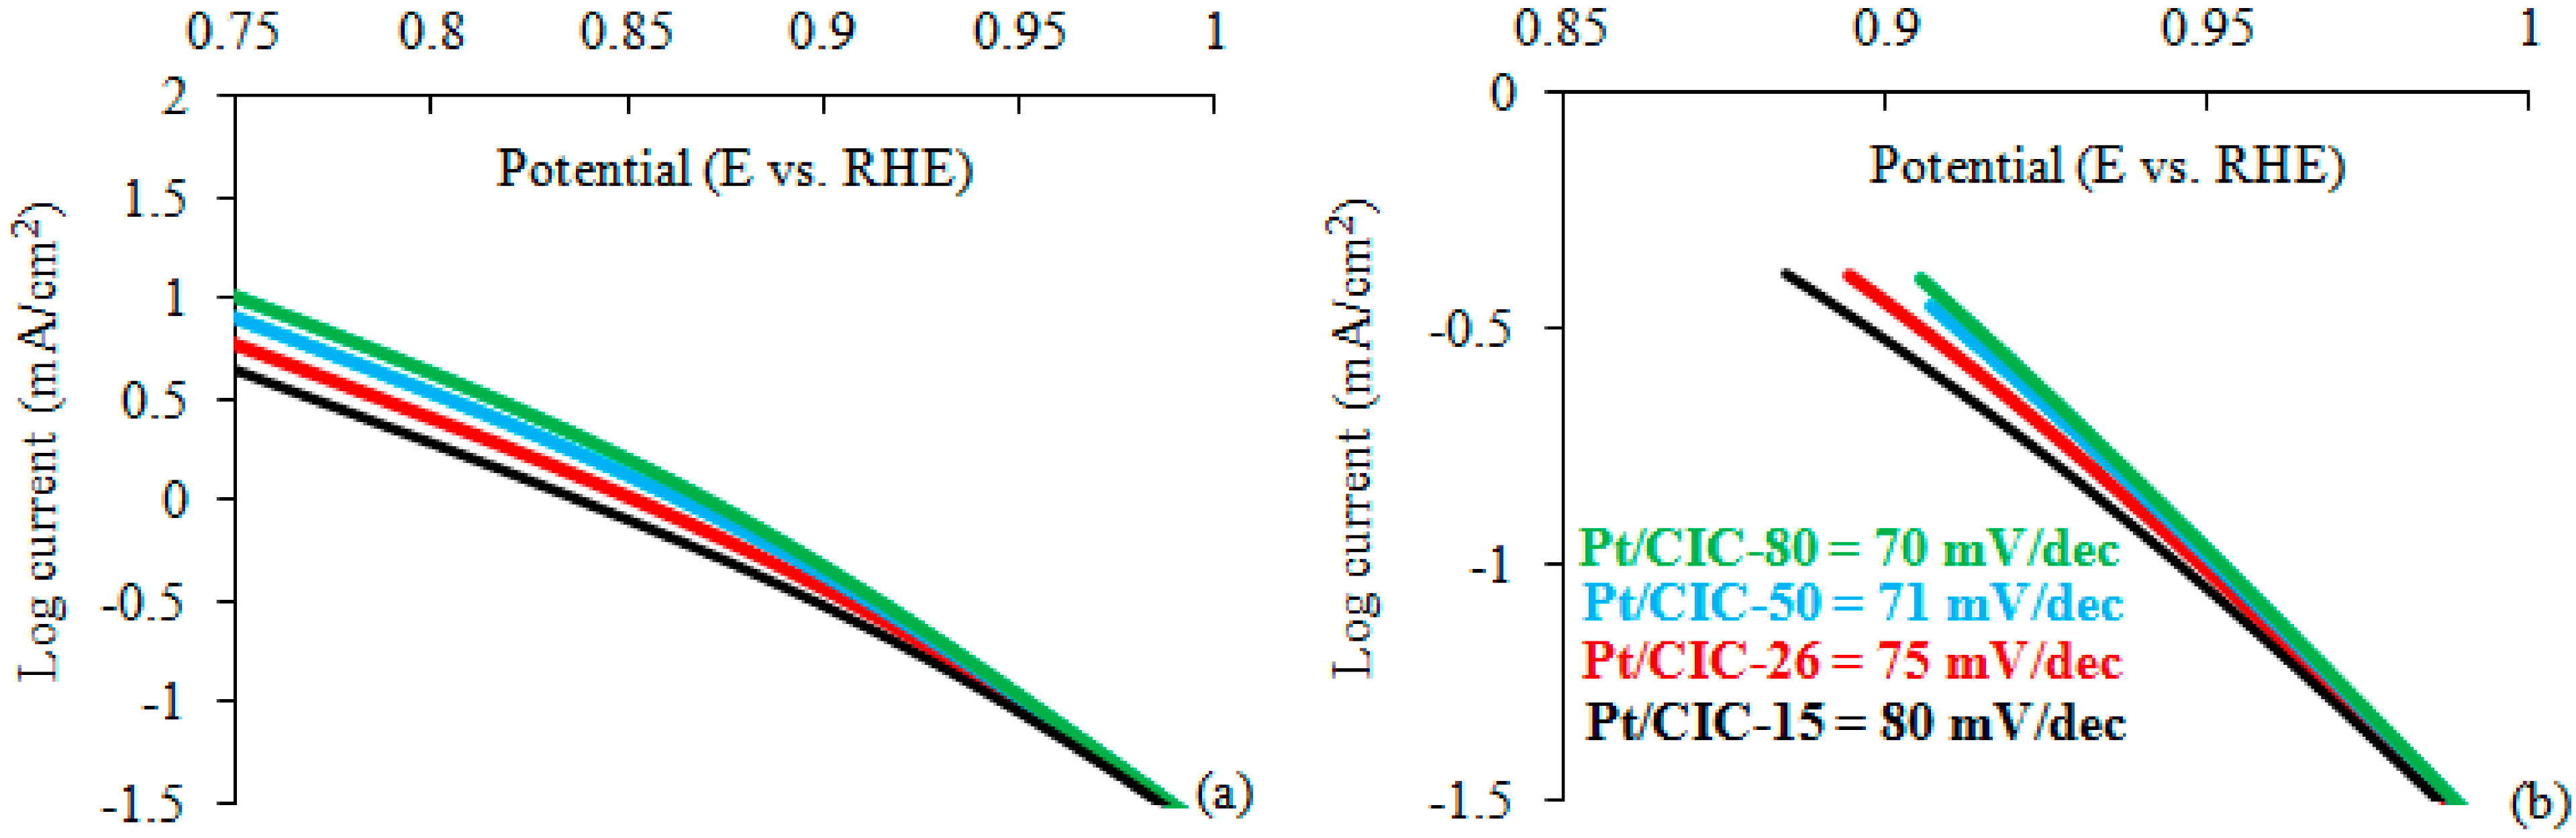
2.5. Verification of Effect of Carbon Wall Thickness on ORR Activity by Theoretical Modeling

As further evidence supporting the role of carbon support wall thickness on the observed ORR activity trends (Figure 9), porous electrode theory [46,48,49,50,51] was used to calculate theoretical Tafel slopes for the ORR at the four Pt/CIC catalysts and then compare them with the experimentally obtained results (Figure 8). Only the limiting case of ohmic (migration control) overpotentials was considered here, neglecting the contributions from diffusion (i.e., concentration overpotentials) [46]. It is known from earlier porous electrode studies and modelling that electrode porosity will have a similar influence on electrochemistry when either migration or diffusion control is present [46,47].
Here, it was assumed that the measured overpotential (ηmeas.) contains contributions only from activation (ηact) and ohmic (ηohm) overpotentials, with the concentration overpotential assumed to be non-existent. The ohmic overpotential will depend on the pore length (L) and pore radius (r) (or the wall length and wall thickness), the electronic or ionic conductivity (κ) of the carbon matrix or electrolyte, respectively, and the exchange current density (io), as shown in Equation (2). The parameter A is given by Equation (3) (where R is the gas constant, F is Faraday’s constant, and T is the temperature) [49,51].
η m e a s u r e d = η a c t + 4 R T F + ln   sec ( A ) η o h m
A =   ( i 0 L 2 F 2 κ R T r ) 1 2 exp ( η a c t F 4 R T )
The current generated down the length of the pore depends on parameter A, as shown in Equation (4) [49], is then:
I =   ( 4 R T κ π r 2 L F ) A tan A
It is important to note that, when using Equations (2) and (4) to predict trends in Tafel data, only relative changes in the magnitude of r, κ, L, and io are important, and thus it was not necessary to know their exact value. In fact, only r (the CIC pore radius) is known with certainty in this work and thus the current and potential scales in Figure 10 are arbitrary. To aid in the comparison of the experimental and theoretical Tafel plots, the calculated Tafel plots were first normalized to the experimental Pt/CIC-80 Tafel plot (Figure 8). The pore radius was then varied to determine the effect on the calculated Tafel slope.
In the approach used here, the average pore length was assumed to be equal to the average thickness of the dried catalyst film. It should be noted that the pores in the catalyst layer are expected to be quite tortuous, resulting in an average length much greater than the average film thickness. However, only relative differences in average pore length will influence the theoretical Tafel plots and the tortuosity factor (assumed to be the same for each film) was assumed to be constant for the four catalyst layers and thus ignored. For the same reason, any increase in the average pore length due to swelling of the catalyst layers after immersion in solution (due at least partly to Nafion hydration) was assumed to be experienced equally by all four catalyst layers, and was therefore also neglected. The average film thickness (3.5 µm) was obtained for three different catalyst layers (on the RDE surface) at 15 different locations using an optical microscope. The conductivity (κ) of the solution in the pores was assumed to be 10 S/m (based on previous measurements of 0.5 M H2SO4) [48]. The same io for the ORR was assumed, as all four CICs have the same 10 wt. % Pt loading and very similar Pt nanoparticle sizes (Table 1).
Figure 10. (a) Theoretical Tafel plots for the ORR at the four 10 wt. % Pt/CICs, with (b) showing the simulated data shown in (a), but over a narrower potential range, also giving the theoretical (from Equations (2) and (4)) Tafel slopes over this range of potential. The parameters used to calculate the theoretical Tafel slope are io = 1 × 10⁻⁵ A/m2, κ = 10 S/m, L = 3.5 µm (the assumed thickness of the catalyst layer), and r (radius of CIC pore) = 15, 26, 50, or 80 nm.
Catalysts 05 01046 g010
To understand what the predicted effect of solution resistance in the CIC pores (impact of pore radius) would be on the Tafel data, theoretical Tafel plots, allowing only r in Equations (3) and (4) to vary, were produced (Figure 10). At low overpotentials, all four Pt/CICs are predicted to show the same activity (Tafel slope of ca. 70 mV) since, at these correspondingly low currents, mass transfer losses would not yet have become significant and thus the pores of all four CICs would be fully utilized for the ORR. As the overpotential is increased, however, the catalyst layers with smaller diameter pores begin to show an increasing Tafel slope, while the Pt/CICs having larger diameter pores are shown to retain the original theoretical 70 mV slope (Figure 10). Thus, if the pore radius were the only factor influencing ORR activity, the experimentally observed activity of the four 10 wt. % Pt/CIC catalysts should increase in the following sequence: CIC-15 < CIC-26 < CIC-50 < CIC-80, which is clearly not observed in the real experimental data shown in Figure 8. These results, as well as the theoretical predictions made in Figure 10, are summarized in Table 3, clearly showing that the experimental data cannot be simulated if only pore diameter effects are considered.
Table 3. Comparison of measured vs. calculated ORR Tafel slope for the four Pt/CIC catalysts.
CatalystsExperimental ORR Tafel Slope (Figure 8) aModelled Tafel Slope b (Figure 10)
10 wt. % Pt/CIC-157080
10 wt. % Pt/CIC-268575
10 wt. % Pt/CIC-507071
10 wt. % Pt/CIC-807070
a Obtained in 0.5 M H2SO4 at 10 mV/s, 1000 rpm, room temperature conditions. b Obtained from Equations (3) and (4), considering only the effects of pore diameter and assuming migrational mass transport limitations.

3. Experimental Section

3.1. Synthesis of Silica Colloid Imprinted Carbons (CICs)

The synthesis of the silica colloid-imprinted carbon (CIC) was based on a previously reported procedure [30]. Briefly, 1 g of a mesophase carbon pitch carbon (Mitsubishi, Tokyo, Japan) was dispersed in 20 mL of EtOH:H2O (60:40 in volume), followed by the drop-wise addition of a colloidal SiO2 suspension (colloid sizes of 12 nm (Ludox-HS-40), 22 nm (Ludux-AS-40; Sigma-Aldrich, St. Louis, MO, USA), 50 nm, and 80 nm (Chemical Products Corporation, Cartersville, GA, USA) with vigorous stirring at room temperature. A mass ratio of 10.4:1 SiO2:carbon was used for the synthesis of the CICs, with the temperature of this mixture then raised to 50 °C to promote solvent evaporation. The SiO2/C composite was then heated to 360 °C for 2 h (the temperature used at this stage determines the final depth of colloid penetration and thus the surface area of the CIC material) [14], followed by carbonization at 900 °C for 2 h, all under N2. The solid product was then refluxed in 3 M NaOH for 24 h at 100 °C to remove the SiO2 from the pores.

3.2. Pt Loading of CIC-X (Where X Defines Pore Diameter) Supports

The CIC samples were loaded with 10 wt. % Pt using wet-impregnation [25], with H2PtCl6 6H2O used as the Pt precursor and H2 as the reducing agent. Briefly, 0.67 g of H2PtCl6 6H2O were dissolved in 10 mL of acetone and added drop-wise to 1 g of carbon (CIC) with vigorous stirring. The Pt/CIC samples were then dried at 60 °C overnight. Reduction of H2PtCl6 6 H2O was achieved by heating the sample under H2 from room temperature (RT) to 300 °C over a period of 2 h. The samples were then kept at 300 °C for 2 h under N2 in order to remove any adsorbed hydrogen and then allowed to cool to RT.

3.3. Electrochemical Evaluation of Oxygen Reduction Activity at Pt/CIC Catalysts

2 mg of the Pt/CIC powder was dispersed into 2 mL of a 80:20 (in weight) H2O:isopropanol mixture. 20 μL of a 5 wt. % Nafion/isopropanol solution was then added to this suspension, followed by sonication for 45 minutes. An Eppendorf pipette was used to deposit 20 μL of the resulting ink onto a 7 mm diameter glassy carbon (GC) rotating disc (RDE) working electrode (WE), followed by drying at room temperature. A second 20 μL aliquot was then deposited onto the GC electrode, followed by air drying, giving a total catalyst (Pt/CIC) loading of ca. 105 μg/cm2.
Electrochemical evaluation of the catalysts was performed in a three-electrode cell containing a platinised Pt mesh counter electrode, a reversible hydrogen reference electrode (RHE), and the 7 mm diameter glassy carbon RDE as the WE, cast with the catalyst film. Cyclic voltammetry (CV) was carried out using an EG&G 173 potentiostat in conjunction with an EG&G PARC 175 function generator. The cell solution was 0.5 M H2SO4, purged with vigorous bubbling of either N2 (Praxair 99%) or O2 (Praxair medical grade).
Prior to evaluation, the catalyst layers were first electrochemically cleaned by scanning between −0.05 V and 1.3 V at 100 mV/s for 14 cycles, followed by CV analysis (0.05 to 1.1 V vs. RHE) in a N2-saturated aqueous solution with no electrode rotation. The ORR electrochemistry was then examined at 10 mV/s in an O2-saturated cell and at a WE rotation rate of 1000 rpm, using a Pine analytical rotor (Model ASR-2; Cisco, San Jose, CA, USA). The baseline CVs in N2-saturated conditions were subtracted from the CVs collected under aerated conditions to remove the non-Faradaic component of the current. Chart 5 by PowerLab (ADInstruments, Colorado Springs, CO, USA) was used for data acquisition.

3.4. Catalyst Characterization

X-ray powder diffraction (XRD) patterns were obtained using CuKα radiation (λ = 0.15406 nm) at 40 kV (20 mA) using a Rigaku Multiflex X-ray diffractometer (Department of Geosciences, University of Calgary, Calgary, Canada), with the data processed using Jade software (Jade 6.5; Softonic, Barcelona, Spain). N2 adsorption-desorption isotherms were obtained at −196 °C (Tristar 3000 Analyzer; Micromeritics, Norcross, GA, USA). Prior to analysis, samples were out-gassed in N2 at 250 °C for 4 h. The specific surface area of the CICs was obtained using the Brunauer-Emmett-Teller (BET) plot (0.05 < P/Po < 0.30), where P and Po are the partial pressure and vapour pressure of the adsorbate gas, respectively. The total pore volume was calculated at P/Po = 0.99, while the pore size distribution curves were determined from the adsorption branch of the isotherm using the Barrett-Joyner-Halenda (BJH) mode.
All Transmission Electron Microscopy (TEM) work was carried out using a Tecnai TF20 G2 FEG-TEM (FEI, Hillsboro, OR, USA) in the Microscopy and Imaging Facility (Health Sciences Centre) at the University of Calgary, with a Fischione 2040 Dual-Axis Tomography Holder (Fischione Instruments, Export, PA, USA). The catalysts were suspended in ethanol and sonicated for 5 minutes. A droplet of this suspension was placed on one side of a TEM Slot Grid that was covered with a 40 nm continuous Formvar film (EMS, Hatfield, PA, USA) and then left to dry for several minutes. In some cases, a Lacey Carbon Grid (EMS) was used. Colloidal Au particles (10 nm diameter, Cell Microscopy Center, University Medical Center Utrecht, Utrecht, The Netherlands) were placed on the opposite side of the grid to serve as fiducial markers. Finally, a thin carbon coating was applied to both sides of the grid for mechanical stabilization and to reduce electrical charging in the microscope. All TEM images were captured on a 1024 × 1024 pixel Gatan GIF 794 CCD (Gatan, Pleasanton, CA, USA). Dual axis tilt images were taken with the SerialEM software [52] at a tilt range from −63° to +63° in 1° increments. Tomographic reconstruction was achieved by weighted back-projection with the IMOD software package [53,54]. The same software was used for visualization and analysis.

4. Conclusions

Significant research over the past decade has focused on the development of novel mesoporous carbons materials for use as Pt supports in proton exchange membrane fuel cell (PEMFC) electrodes. Specifically, carbon nanotubes (CNTs), ordered mesoporous carbons (OMCs), and colloid imprinted carbons (CICs) have all shown promise as possible alternatives to conventional microporous carbons. While the majority of the research efforts in this field have focused on the impact of pore diameter on the oxygen reduction reaction (ORR) activity of Pt/C catalysts, our group has recently highlighted the importance of carbon wall (“nano-string”) diameter in OMCs and carbon wall thickness in CICs on ORR activity.
In the present study, four colloid imprinted carbons (CICs) with pore diameters of 15, 26, 50 or 80 nm in diameter were synthesized and then loaded with 10 wt. % Pt, all showing particle sizes of ~4.5 nm. Through rotating disc electrode studies in fully aerated 0.5 M H2SO4 solutions, it was demonstrated that the CIC wall thickness, as opposed to pore diameter, is the most critical factor in determining the ORR activity of these Pt/CIC catalysts. This was further confirmed through modeling efforts that demonstrated that the experimentally observed Tafel slopes cannot be predicted based on changes in pore diameter alone.
While the majority of the research efforts in designing porous carbon supports have focused on controlling and optimizing pore diameter, our work has again shown that careful considerations of wall thickness must also be made. It is likely that the relative importance of wall thickness vs. pore diameter depends on many factors, including the actual dimensions of the pores and walls and the catalyst layer components (i.e., ionomer content, Pt loading, etc.). However, our experimental and modeling work have clearly demonstrated the significant impact that carbon wall thickness can have on the ORR activity of Pt/carbon catalysts, and the importance of fully characterizing wall thickness when attempting to interpret ORR data obtained at Pt-loaded mesoporous carbon materials.

Acknowledgments

The authors gratefully acknowledge the Natural Sciences and Engineering Research Council of Canada (NSERC) Strategic Research Project Program and Ballard Power Systems for their financial support of this work. We would also like to thank Alberta Ingenuity, now part of Alberta Innovates-Technology Futures, and NSERC for their scholarship support of D.B. Acknowledgements are also made to J. Hill and P. Pereira (University of Calgary) for access to N2 sorption instrumentation. Finally, the authors thank Scott Paulson for many helpful discussions.

Author Contributions

Dustin Banham, Fangxia Feng and Viola Birss conceived and designed the experiments. Tobias Fürstenhaupt performed the TEM imaging and helped in interpreting the data. Katie Pei performed electrochemical and materials science characterization and helped in planning the experiments. Siyu Ye provided guidance on the project and helped in interpreting the data. Dustin Banham and Viola Birss wrote the paper.

Conflicts of Interest

The authors declare no conflict of interest.

References

  1. Barbir, F.; Yazici, S. Status and development of PEM fuel cell technology. Int. J. Energy Res. 2008, 32, 369–378. [Google Scholar] [CrossRef]
  2. Barbir, F. PEM Fuel Cells: Theory and Practice; Elsevier Academic Press: San Diego, CA, USA, 2005. [Google Scholar]
  3. Gasteiger, H.A.; Panels, J.E.; Yan, S.G. Dependence of PEM fuel cell performance on catalyst loading. J. Power Source 2004, 127, 162–171. [Google Scholar] [CrossRef]
  4. Herranz, J.; Jaouen, F.; Lefèvre, M.; Kramm, U.I.; Proietti, E.; Dodelet, J.-P.; Bogdanoff, P.; Fiechter, S.; Abs-Wurmbach, I.; Bertrand, P.; et al. Unveiling N-protonation and anion-binding effects on Fe/N/C catalysts for O2 reduction in proton-exchange-membrane fuel cells. J. Phys. Chem. C 2011, 115, 16087–16097. [Google Scholar] [CrossRef] [PubMed]
  5. Joo, S.H.; Kwon, K.; You, D.J.; Pak, C.; Chang, H.; Kim, J.M. Preparation of high loading Pt nanoparticles on ordered mesoporous carbon with a controlled Pt size and its effects on oxygen reduction and methanol oxidation reactions. Electrochim. Acta 2009, 54, 5746–5753. [Google Scholar] [CrossRef]
  6. Wikander, K.; Ekström, H.; Palmqvist, A.E.C.; Lindbergh, G. On the influence of Pt particle size on the PEMFC cathode performance. Electrochim. Acta 2007, 52, 6848–6855. [Google Scholar] [CrossRef]
  7. Banham, D.; Feng, F.; Fürstenhaupt, T.; Pei, K.; Ye, S.; Birss, V. Effect of Pt-loaded carbon support nanostructure on oxygen reduction catalysis. J. Power Source 2011, 196, 5438–5445. [Google Scholar] [CrossRef]
  8. Ambrosio, E.P.; Francia, C.; Manzoli, M.; Penazzi, N.; Spinelli, P. Platinum catalyst supported on mesoporous carbon for PEMFC. Int. J. Hydrogen Energy 2008, 33, 3142–3145. [Google Scholar] [CrossRef]
  9. Antolini, E. Carbon supports for low-temperature fuel cell catalysts. Appl. Catal. B 2009, 88, 1–24. [Google Scholar] [CrossRef]
  10. Sebastián, D.; Ruíz, A.G.; Suelves, I.; Moliner, R.; Lázaro, M.J.; Baglio, V.; Stassi, A.; Aricò, A.S. Enhanced oxygen reduction activity and durability of Pt catalysts supported on carbon nanofibers. Appl. Catal. B 2012, 115–116, 269–275. [Google Scholar] [CrossRef]
  11. Sebastián, D.; Lázaro, M.J.; Suelves, I.; Moliner, R.; Baglio, V.; Stassi, A.; Aricò, A.S. The influence of carbon nanofiber support properties on the oxygen reduction behavior in proton conducting electrolyte-based direct methanol fuel cells. Int. J. Hydrogen Energy 2012, 37, 6253–6260. [Google Scholar] [CrossRef]
  12. Zhang, J.; Tang, S.; Liao, L.; Yu, W.; Li, J.; Seland, F.; Haarberg, G.M. Improved catalytic activity of mixed platinum catalysts supported on various carbon nanomaterials. J. Power Source 2014, 267, 706–713. [Google Scholar] [CrossRef]
  13. Celorrio, V.; Flórez-Montaño, J.; Moliner, R.; Pastor, E.; Lázaro, M.J. Fuel cell performance of Pt electrocatalysts supported on carbon nanocoils. Int. J. Hydrog. Energy 2014, 39, 5371–5377. [Google Scholar] [CrossRef]
  14. Banham, D.; Feng, F.; Pei, K.; Ye, S.; Birss, V. Effect of carbon support nanostructure on the oxygen reduction activity of Pt/C catalysts. J. Mater. Chem. A 2013, 1, 2812–2820. [Google Scholar] [CrossRef]
  15. Pei, K.; Banham, D.; Feng, F.; Fürstenhaupt, T.; Ye, S.; Birss, V. Oxygen reduction activity dependence on the mesoporous structure of imprinted carbon supports. Electrochem. Commun. 2010, 12, 1666–1669. [Google Scholar] [CrossRef]
  16. Serp, P.; Figueiredo, J.L. Carbon Materials for Catalysis; John Wiley & Sons, Inc.: Hoboken, NJ, USA, 2008. [Google Scholar]
  17. Shao, Y.; Liu, J.; Wang, Y.; Lin, Y. Novel catalyst support materials for PEM fuel cells: Current status and future prospects. J. Mater. Chem. 2009, 19, 46–59. [Google Scholar] [CrossRef]
  18. Shao, Y.; Yin, G.; Wang, J.; Gao, Y.; Shi, P. Multi-walled carbon nanotubes based Pt electrodes prepared with in situ ion exchange method for oxygen reduction. J. Power Source 2006, 161, 47–53. [Google Scholar] [CrossRef]
  19. Saha, M.S.; Li, R.; Sun, X.; Ye, S. 3-D composite electrodes for high performance PEM fuel cells composed of Pt supported on nitrogen-doped carbon nanotubes grown on carbon paper. Electrochem. Commun. 2009, 11, 438–441. [Google Scholar] [CrossRef]
  20. Vijayaraghavan, G.; Stevenson, K.J. Synergistic assembly of dendrimer-templated platinum catalysts on nitrogen-doped carbon nanotube electrodes for oxygen reduction. Langmuir 2007, 23, 5279–5282. [Google Scholar] [CrossRef] [PubMed]
  21. Sun, C.-L.; Chen, L.-C.; Su, M.-C.; Hong, L.-S.; Chyan, O.; Hsu, C.-Y.; Chen, K.-H.; Chang, T.-F.; Chang, L. Ultrafine platinum nanoparticles uniformly dispersed on arrayed CNx nanotubes with high electrochemical activity. Chem. Mater. 2005, 17, 3749–3753. [Google Scholar] [CrossRef]
  22. Li, Y.-H.; Hung, T.-H.; Chen, C.-W. A first-principles study of nitrogen- and boron-assisted platinum adsorption on carbon nanotubes. Carbon 2009, 47, 850–855. [Google Scholar] [CrossRef]
  23. An, W.; Turner, C.H. Chemisorption of transition-metal atoms on boron- and nitrogen-doped carbon nanotubes: Energetics and geometric and electronic structures. J. Phys. Chem. C 2009, 113, 7069–7078. [Google Scholar] [CrossRef]
  24. Chen, Y.; Wang, J.; Liu, H.; Li, R.; Sun, X.; Ye, S.; Knights, S. Enhanced stability of Pt electrocatalysts by nitrogen doping in CNTs for PEM fuel cells. Electrochem. Commun. 2009, 11, 2071–2076. [Google Scholar] [CrossRef]
  25. Joo, S.H.; Choi, S.J.; Oh, I.; Kwak, J.; Liu, Z.; Terasaki, O.; Ryoo, R. Ordered nanoporous arrays of carbon supporting high dispersions of platinum nanoparticles. Nature 2001, 412, 169. [Google Scholar] [CrossRef] [PubMed]
  26. Marie, J.; Berthon-Fabry, S.; Achard, P.; Chatenet, M.; Pradourat, A.; Chainet, E. Highly dispersed platinum on carbon aerogels as supported catalysts for PEM fuel cell-electrodes: Comparison of two different synthesis paths. J. Non-Cryst. Solids 2004, 350, 88–96. [Google Scholar] [CrossRef]
  27. Ambrosio, E.; Francia, C.; Gerbaldi, C.; Penazzi, N.; Spinelli, P.; Manzoli, M.; Ghiotti, G. Mesoporous carbons as low temperature fuel cell platinum catalyst supports. J. Appl. Electrochem. 2008, 38, 1019–1027. [Google Scholar] [CrossRef]
  28. Lebedeva, N.P.; Booij, A.S.; Janssen, G.J. Cathodes for proton-exchange-membrane fuel cells based on ordered mesoporous carbon supports. ECS Trans. 2008, 16, 2083–2092. [Google Scholar]
  29. Su, F.; Poh, C.K.; Tian, Z.; Xu, G.; Koh, G.; Wang, Z.; Liu, Z.; Lin, J. Electrochemical behavior of Pt nanoparticles supported on meso- and microporous carbons for fuel cells. Energy Fuels 2010, 24, 3727–3732. [Google Scholar] [CrossRef]
  30. Li, Z.; Jaroniec, M. Colloidal imprinting: A novel approach to the synthesis of mesoporous carbons. J. Am. Chem. Soc. 2001, 123, 9208–9209. [Google Scholar] [CrossRef] [PubMed]
  31. Uchida, M.; Fukuoka, Y.; Sugawara, Y.; Ohara, H.; Ohta, A. Improved preparation process of very-low-platinum-loading electrodes for polymer electrolyte fuel cells. J. Electrochem. Soc. 1998, 145, 3708–3713. [Google Scholar] [CrossRef]
  32. Uchida, M.; Fukuoka, Y.; Sugawara, Y.; Eda, N.; Ohta, A. Effects of microstructure of carbon support in the catalyst layer on the performance of polymer-electrolyte fuel cells. J. Electrochem. Soc. 1996, 143, 2245–2252. [Google Scholar] [CrossRef]
  33. Hurt, R.; Krammer, G.; Crawford, G.; Jian, K.; Rulison, C. Polyaromatic assembly mechanisms and structure selection in carbon materials. Chem. Mater. 2002, 14, 4558–4565. [Google Scholar] [CrossRef]
  34. Joo, J.B.; Kim, P.; Kim, W.; Yi, J. Preparation of Pt supported on mesoporous carbons for the reduction of oxygen in polymer electrolyte membrane fuel cell (PEMFC). J. Electroceram. 2006, 17, 713–718. [Google Scholar] [CrossRef]
  35. Fang, B.; Kim, J.H.; Yu, J.-S. Colloid-imprinted carbon with superb nanostructure as an efficient cathode electrocatalyst support in proton exchange membrane fuel cell. Electrochem. Commun. 2008, 10, 659–662. [Google Scholar] [CrossRef]
  36. Banham, D.; Feng, F.; Furstenhaupt, T.; Ye, S.; Birss, V. First time investigation of Pt nanocatalysts deposited inside carbon mesopores of controlled length and diameter. J. Mater. Chem. 2012, 22, 7164–7171. [Google Scholar] [CrossRef]
  37. Lowell, S.; Shields, J.E.; Thomas, M.A.; Thommes, M. Characterization of Porous Solids and Powders: Surface Area, Pore Size and Density, 1st ed.; Springer: Dordrecht, The Netherlands, 2006; p. 347. [Google Scholar]
  38. Haynes, J.M. Pore size analysis according to the kelvin equation. Mater. Construct. 1973, 6, 209–213. [Google Scholar] [CrossRef]
  39. Mooney, M. The viscosity of a concentrated suspension of spherical particles. J. Colloid Sci. 1951, 6, 162–170. [Google Scholar] [CrossRef]
  40. Li, Z.; Jaroniec, M. Synthesis and adsorption properties of colloid-imprinted carbons with surface and volume mesoporosity. Chem. Mater. 2003, 15, 1327–1333. [Google Scholar] [CrossRef]
  41. Gierszal, K.P.; Yoon, S.B.; Yu, J.-S.; Jaroniec, M. Adsorption and structural properties of mesoporous carbons obtained from mesophase pitch and phenol-formaldehyde carbon precursors using porous templates prepared from colloidal silica. J. Mater. Chem. 2006, 16, 2819–2823. [Google Scholar] [CrossRef]
  42. Chai, G.S.; Yoon, S.B.; Yu, J.-S.; Choi, J.-H.; Sung, Y.-E. Ordered porous carbons with tunable pore sizes as catalyst supports in direct methanol fuel cell. J. Phys. Chem. B 2004, 108, 7074–7079. [Google Scholar] [CrossRef]
  43. Chen, M.-H.; Jiang, Y.-X.; Chen, S.-R.; Huang, R.; Lin, J.-L.; Chen, S.-P.; Sun, S.-G. Synthesis and durability of highly dispersed platinum nanoparticles supported on ordered mesoporous carbon and their electrocatalytic properties for ethanol oxidation. J. Phys. Chem. C 2010, 114, 19055–19061. [Google Scholar] [CrossRef]
  44. Kimijima, K.; Hayashi, A.; Umemura, S.; Miyamoto, J.; Sekizawa, K.; Yoshida, T.; Yagi, I. Oxygen reduction reactivity of precisely controlled nanostructured model catalysts. J. Phys. Chem. C 2010, 114, 14675–14683. [Google Scholar] [CrossRef]
  45. Shan, J.; Pickup, P.G. Characterization of polymer supported catalysts by cyclic voltammetry and rotating disk voltammetry. Electrochim. Acta 2000, 46, 119–125. [Google Scholar] [CrossRef]
  46. De Levie, R. Electrochemical Response of Porous and Rough Electrodes; John Wiley & Sons: New York, NY, USA, 1967; Volume 6. [Google Scholar]
  47. Perry, M.L.; Newman, J.; Cairns, E.J. Mass transport in gas-diffusion electrodes: A diagnostic tool for fuel-cell cathodes. J. Electrochem. Soc. 1998, 145, 5–15. [Google Scholar] [CrossRef]
  48. Banham, D.W.; Soderberg, J.N.; Birss, V.I. Pt/carbon catalyst layer microstructural effects on measured and predicted tafel slopes for the oxygen reduction reaction. J. Phys. Chem. C 2009, 113, 10103–10111. [Google Scholar] [CrossRef]
  49. Bockris, J.O.M.; Srinivasan, S. Fuel Cells: Their Electrochemistry; McGraw-Hill: New York, NY, USA, 1969. [Google Scholar]
  50. Soderberg, J.N.; Co, A.C.; Sirk, A.H.C.; Birss, V.I. Impact of porous electrode properties on the electrochemical transfer coefficient. J. Phys. Chem. B 2006, 110, 10401–10410. [Google Scholar] [CrossRef] [PubMed]
  51. Srinivasan, S.; Hurwitz, H.D.; Bockris, J.O.M. Fundamental equations of electrochemical kinetics at porous gas-diffusion electrodes. J. Chem. Phys. 1967, 46, 3108–3122. [Google Scholar] [CrossRef]
  52. Mastronarde, D.N. Automated electron microscope tomography using robust prediction of specimen movements. J. Struct. Biol. 2005, 152, 36–51. [Google Scholar] [CrossRef] [PubMed]
  53. Kremer, J.R.; Mastronarde, D.N.; McIntosh, J.R. Computer visualization of three-dimensional image data using imod. J. Struct. Biol. 1996, 116, 71–76. [Google Scholar] [CrossRef] [PubMed]
  54. Mastronarde, D.N. Dual-axis tomography: An approach with alignment methods that preserve resolution. J. Struct. Biol. 1997, 120, 343–352. [Google Scholar] [CrossRef] [PubMed]

