2. Results and Discussion
CsAE
2Ta
3O
10 (AE = Ca, Sr, Ba) layered oxides have the
n = 3 structure of the Dion-Jacobson series of phases.
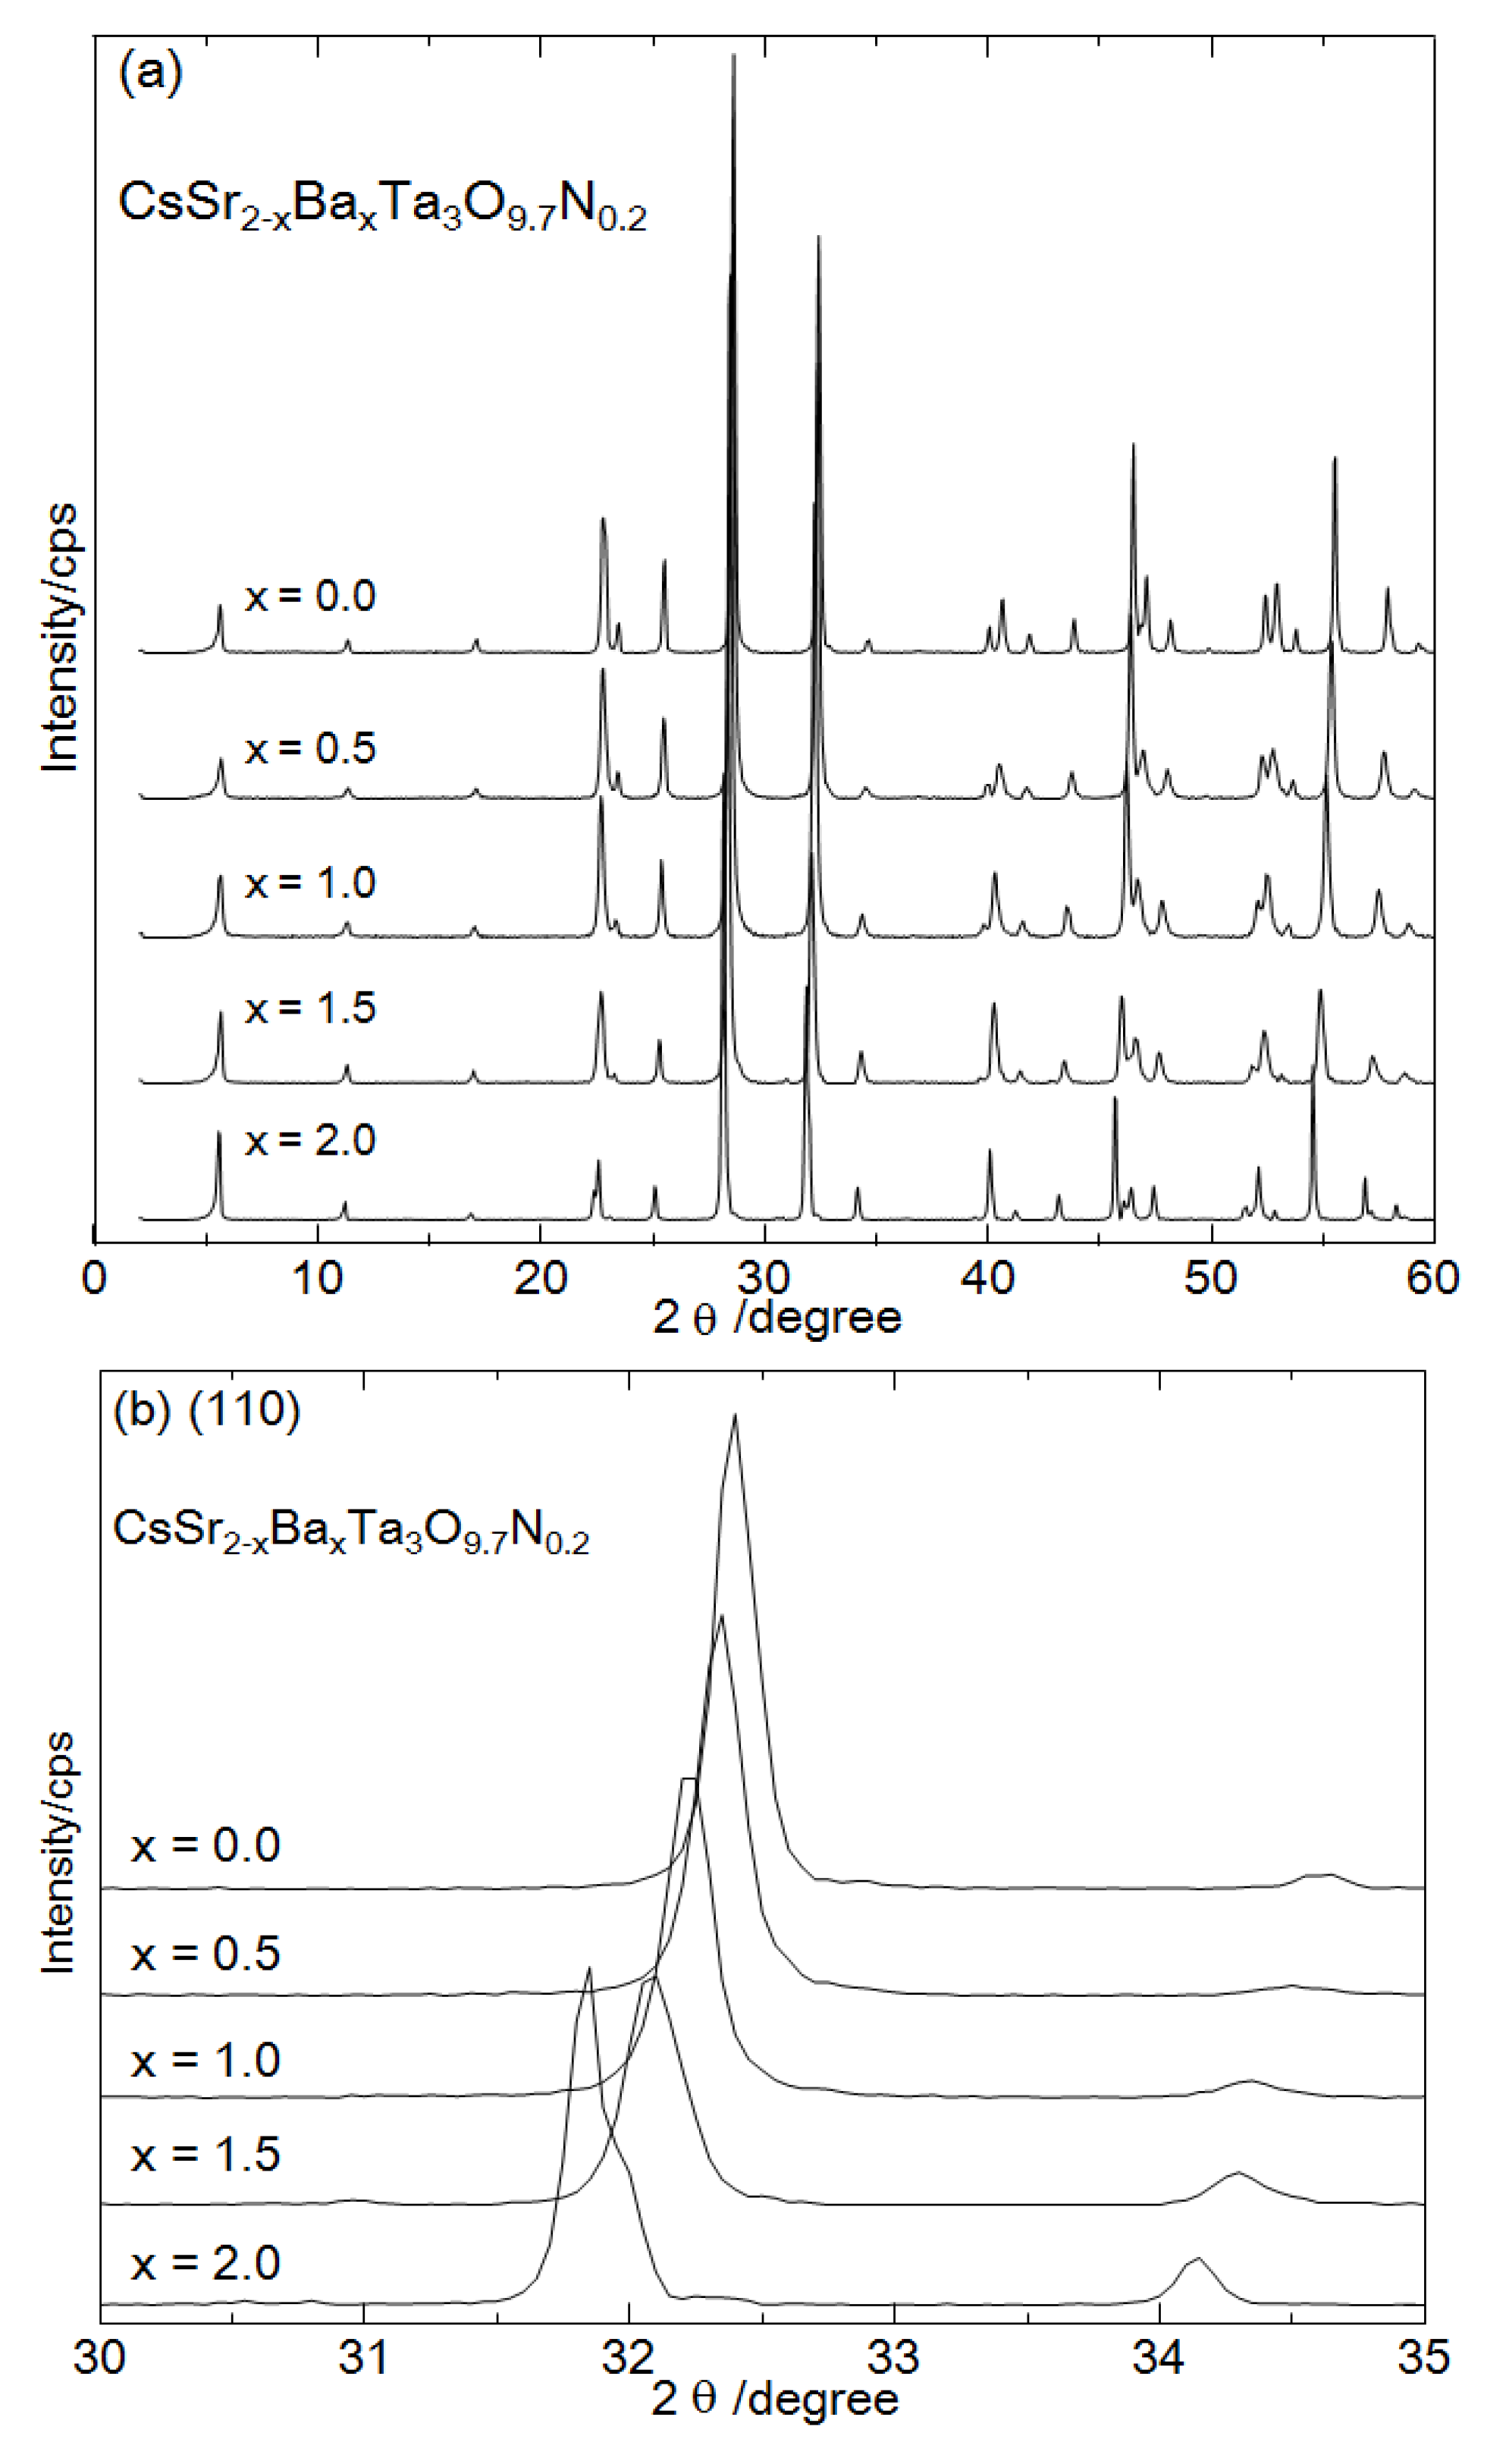
Figure 1a shows XRD patterns of CsSr
2−xBa
xTa
3O
10−yN
z (
x = 0.0, 0.5, 1.0, 1.5, 2.0). The N/O molar ratio of CsSr
2−xBa
xTa
3O
10−yN
z prepared at 800 °C was determined by the HNO analyzer to be approximately 2% (CsSr
2−xBa
xTa
3O
9.7N
0.2). Sr
2+ and Ba
2+ ions occupy A sites in the host perovskite layer and Ta
5+ ions occupy the B sites. The XRD patterns of the CsSr
2−xBa
xTa
3O
9.7N
0.2 corresponded to that of CsSr
2Ta
3O
10 powder, which has tetragonal symmetry with the P4/mmm space group [
20]. There were no other significant differences in the diffraction patterns of the layered compounds before and after calcination in NH
3 at 800 °C, which agrees with the result reported previously [
21]. This indicates that nitrogen partially substituted oxygen in the layered oxide without altering the crystal phase. The peaks ascribed to the (110) were shifted to smaller angles with an increasing amount of Ba, as shown in
Figure 1b. These peak shifts indicate the successful preparation of CsSr
2−xBa
xTa
3O
9.7N
0.2, because the ionic radius of Ba
2+ (0.161 nm) is slightly larger than that of Sr
2+ (0.144 nm).
Nanosheets were prepared by exfoliating the layered perovskite compounds (CsSr2−xBaxTa3O9.7N0.2) via proton exchange and two-step intercalation of ethylamine and tetrabutylammoniumions. The Cs ions in the layered compounds were exchanged with protons by acid exchange. The protonated forms were stirred in ethylamine (EA) aqueous solution to intercalate the EA into the interlayer. The EA-intercalated layered compounds were stirred in tetrabutylammonium hydroxide (TBAOH) aqueous solution to exfoliate into nanosheets. The nanosheets could not be fabricated directly from the protonated forms, since TBA+ ions are not intercalated into the protonated forms without the EA intercalation step. This strongly suggests that EA intercalation is an essential step in nanosheet synthesis. The process of intercalation of amine into the protonated form is commonly understood as an acid base reaction between interlayer protons (Brønsted acid) and amines (Brønsted base). This process generally depends on the size and charge density of the guest species and the hydration state of the layered compounds. A TBA+ ion is a quaternary ammonium ion with four butyl groups attached to a positively charged nitrogen atom at the center. The diameter of a TBA+ ion is 0.8 nm, which is larger than the interlayer distance of H-Sr2−xBaxTa3O9.7N0.2 (around 0.2 nm). This relatively large diameter of TBA+ ion may have been one of the possible reasons for the current finding.
Figure 1.
X-ray diffraction (XRD) patterns of CsSr2−xBaxTa3O9.7N0.2 (x=0.0, 0.5, 1.0, 1.5, 2.0), (a) wide scan (2–60 degree) and (b) narrow scan (30–35 degree).
Figure 1.
X-ray diffraction (XRD) patterns of CsSr2−xBaxTa3O9.7N0.2 (x=0.0, 0.5, 1.0, 1.5, 2.0), (a) wide scan (2–60 degree) and (b) narrow scan (30–35 degree).
Exfoliation of layered compounds to nanosheets was confirmed by AFM observations. The layered compounds (
x = 0, 0.5, 1.0) were exfoliated to nanosheets, whereas the layered compounds (
x = 1.5, 2.0) could not be exfoliated. Organic amines, which were used as exfoliation reagents, were not intercalated into the protonated layered compounds (
x = 1.5, 2.0). The ratio of nitrogen to oxygen in the nanosheet powder was around 2% (Sr
2−xBa
xTa
3O
9.7N
0.2;
x = 0.0, 0.5, 1.0), which was almost the same as that of the parent layered material (2%).
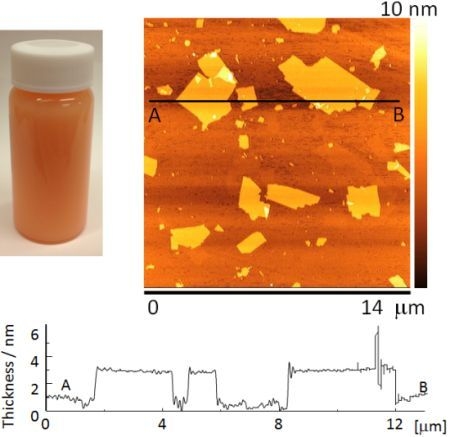
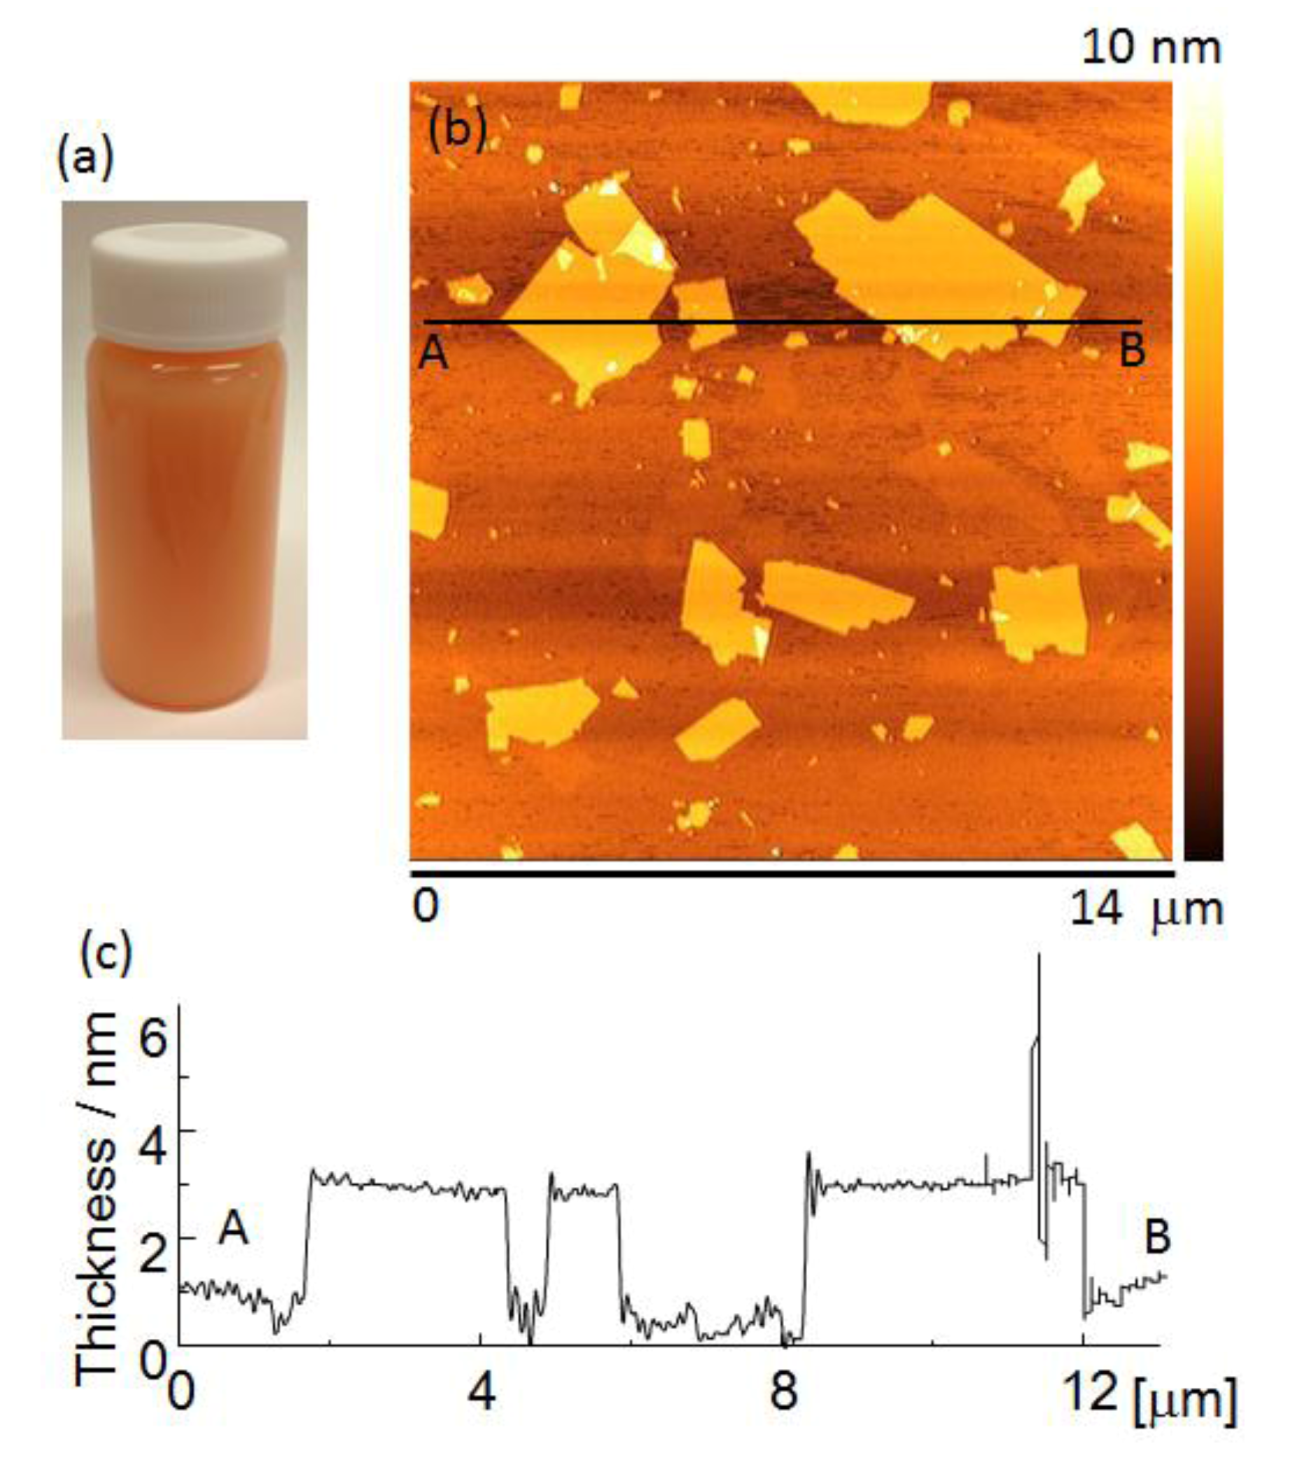
Figure 2a shows the appearance of a Sr
1.5Ba
0.5Ta
3O
10−yN
z suspension. The suspension was orange in color due to nitrogen doping.
Figure 2b shows an AFM image of Sr
2Ta
3O
10−yN
z nanosheets. They had lateral dimensions of about 0.3–5.0 μm.
Figure 2c shows a cross-sectional profile of a nanosheet measured between points A and B in
Figure 2b. The nanosheets were approximately 2.8–3.1 nm thick, which is approximately 1.3 nm thicker than the theoretical perovskite blocks of the parent compound, estimated from crystallographic data. The difference between the nanosheet thickness estimated from AFM observations, and the theoretically calculated thickness is due to the absorption of water and amine [
22]. However, the nanosheet suspension contained bilayer and trilayer nanosheets in addition to monolayer nanosheets.
Figure 2.
(a) The appearance of a nanosheet suspension, (b) atomic force microscopy (AFM) image and (c) cross-sectional profile of mono-layer nanosheet.
Figure 2.
(a) The appearance of a nanosheet suspension, (b) atomic force microscopy (AFM) image and (c) cross-sectional profile of mono-layer nanosheet.
Photocatalytic activities of Sr
2−xBa
xTa
3O
9.7N
0.2 (
x = 0.0, 0.5, 1.0) nanosheets were tested in a water/ethanol system. Methanol was employed as the sacrificial reagent. All samples showed the photocatalytic activity under visible light irradiation as shown in
Table 1. The H
2 production rate under visible light irradiation of Sr
1.5Ba
0.5Ta
3O
9.7N
0.2 (
x = 0.5) nanosheet was the highest (1.44 μM/h) among the Sr
2−xBa
xTa
3O
9.7N
0.2 (
x = 0.0, 0.5, 1.0) nanosheets prepared. Next, the calcination temperature for nitridation was optimized.
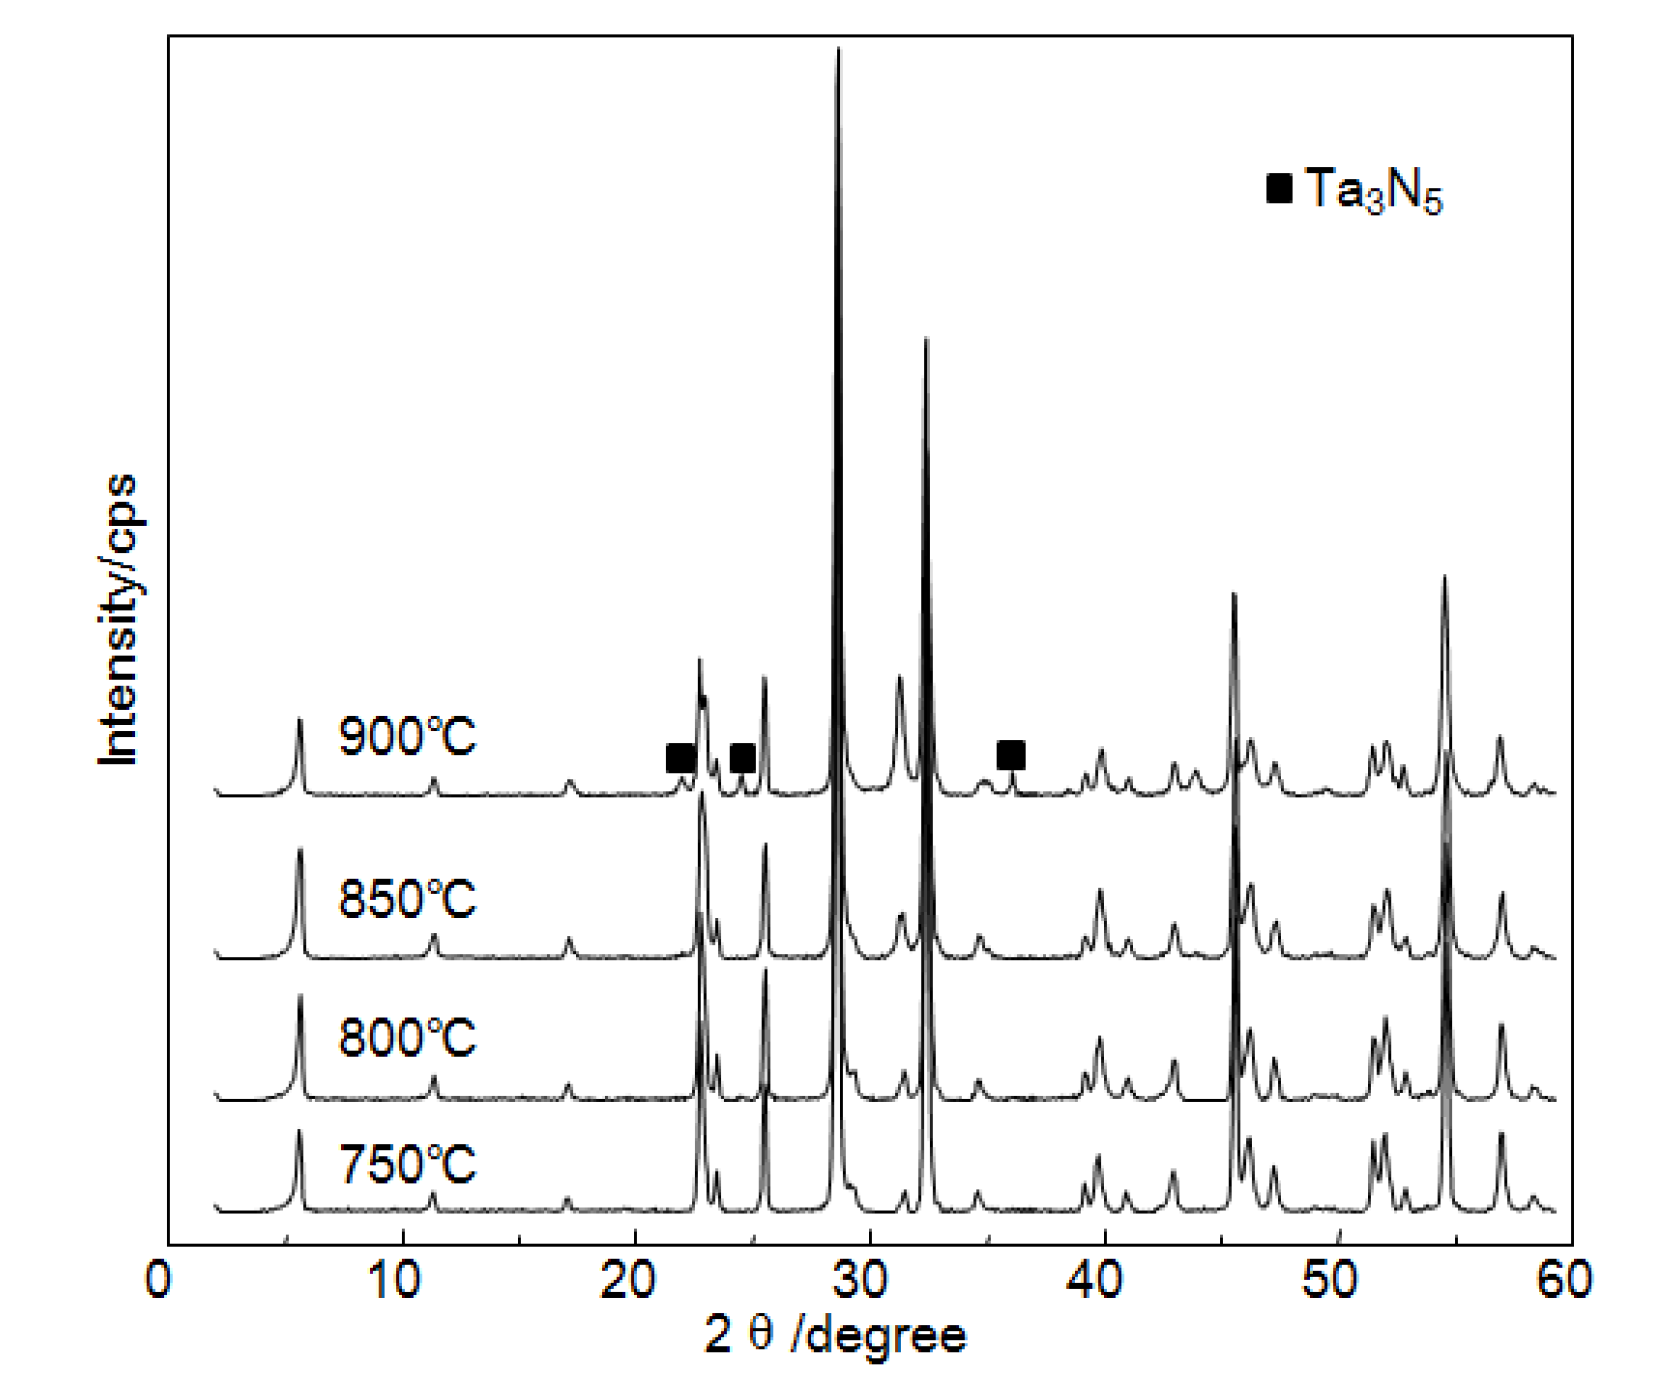
Figure 3 shows XRD patterns of CsSr
1.5Ba
0.5Ta
3O
10−yN
z prepared at 750–900 °C. All XRD patterns of the layered compounds prepared at 750–850 °C corresponded to that of CsSr
2Ta
3O
10 powder, whereas the layered compound prepared at 900 °C had an impurity phase (Ta
3N
5). Therefore, the photocatalytic activity of the nanosheets prepared at 750–850 °C was investigated.
Table 1.
Photocatalytic activities of Sr2−xBaxTa3O9.7N0.2 (x = 0.0, 0.5, 1.0) nanosheets for H2 production from water/ethanol system under irradiation.
Table 1.
Photocatalytic activities of Sr2−xBaxTa3O9.7N0.2 (x = 0.0, 0.5, 1.0) nanosheets for H2 production from water/ethanol system under irradiation.
| A site element | Full arc irradiation | Visible light irradiation |
|---|
| (μmol/h) | (μmol/h) |
|---|
| Sr2 | 302.2 | 0.27 |
| Sr1.5Ba0.5 | 260.6 | 1.44 |
| SrBa | 239.6 | 1.12 |
Figure 3.
XRD patterns of CsSr1.5Ba0.5Ta3O10−yNzprepared at 750–900 °C.
Figure 3.
XRD patterns of CsSr1.5Ba0.5Ta3O10−yNzprepared at 750–900 °C.
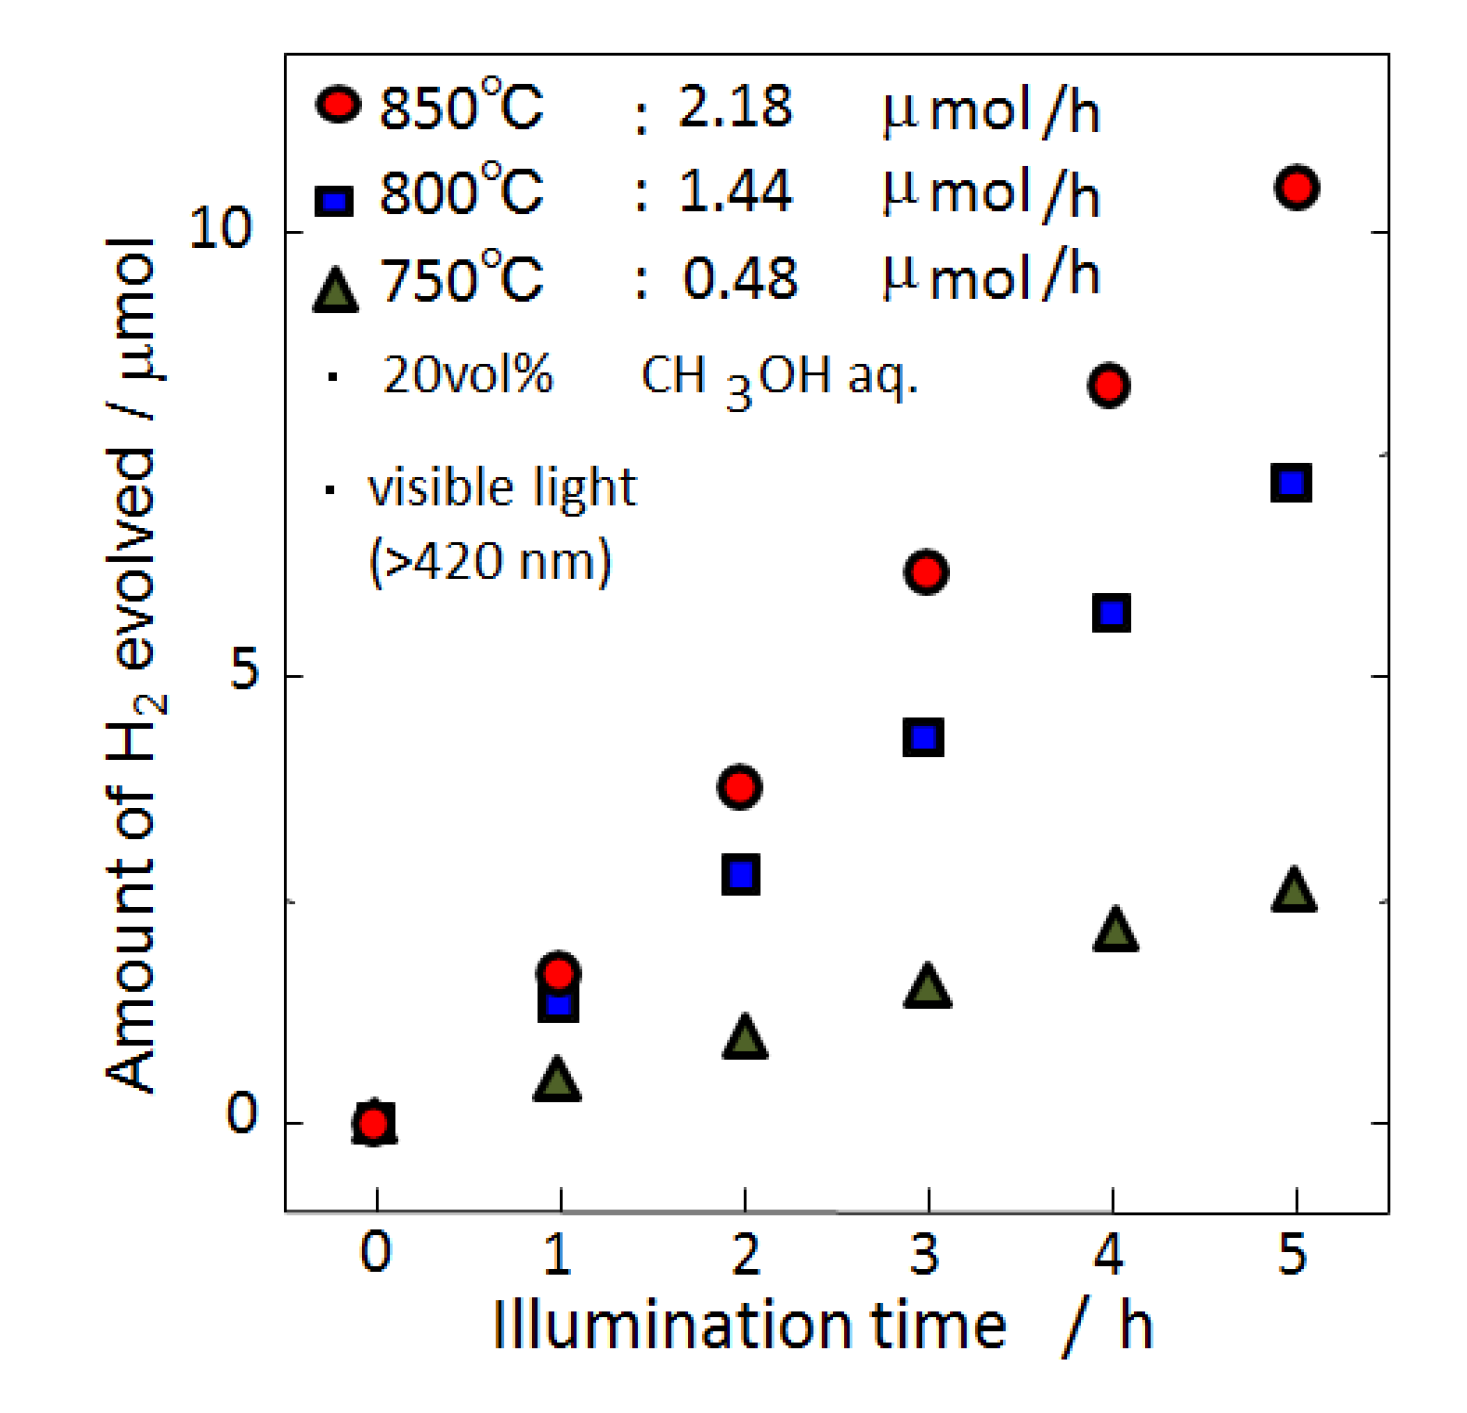
Figure 4 shows the photocatalytic activities for H
2 production in a methanol aqueous solution under visible light irradiation of Sr
1.5Ba
0.5Ta
3O
10−yN
z nanosheets. Rh (0.15 wt.%) was loaded on the nanosheet as a co-catalyst. The amounts of H
2 evolved increased approximately linearly with increasing the irradiation time. The Sr
1.5Ba
0.5Ta
3O
10−yN
z nanosheets prepared from layered compound calcinated at 850 °C showed the highest activity for photocatalytic H
2 production. The H
2 production rate was 2.18 μM/h.
Figure 4.
Photocatalytic activities for H2 production from a system in aqueous 20 vol.% methanol solutions under visible light (>420 nm) irradiation of Rh (0.15 wt.%)-loaded CsSr1.5Ba0.5Ta3O10−yNz nanosheet exfoliated from layered compounds prepared at 750–850 °C. The amount of catalyst: 200 mg, catalyst: 0.15 wt.% Rh-loaded samples.
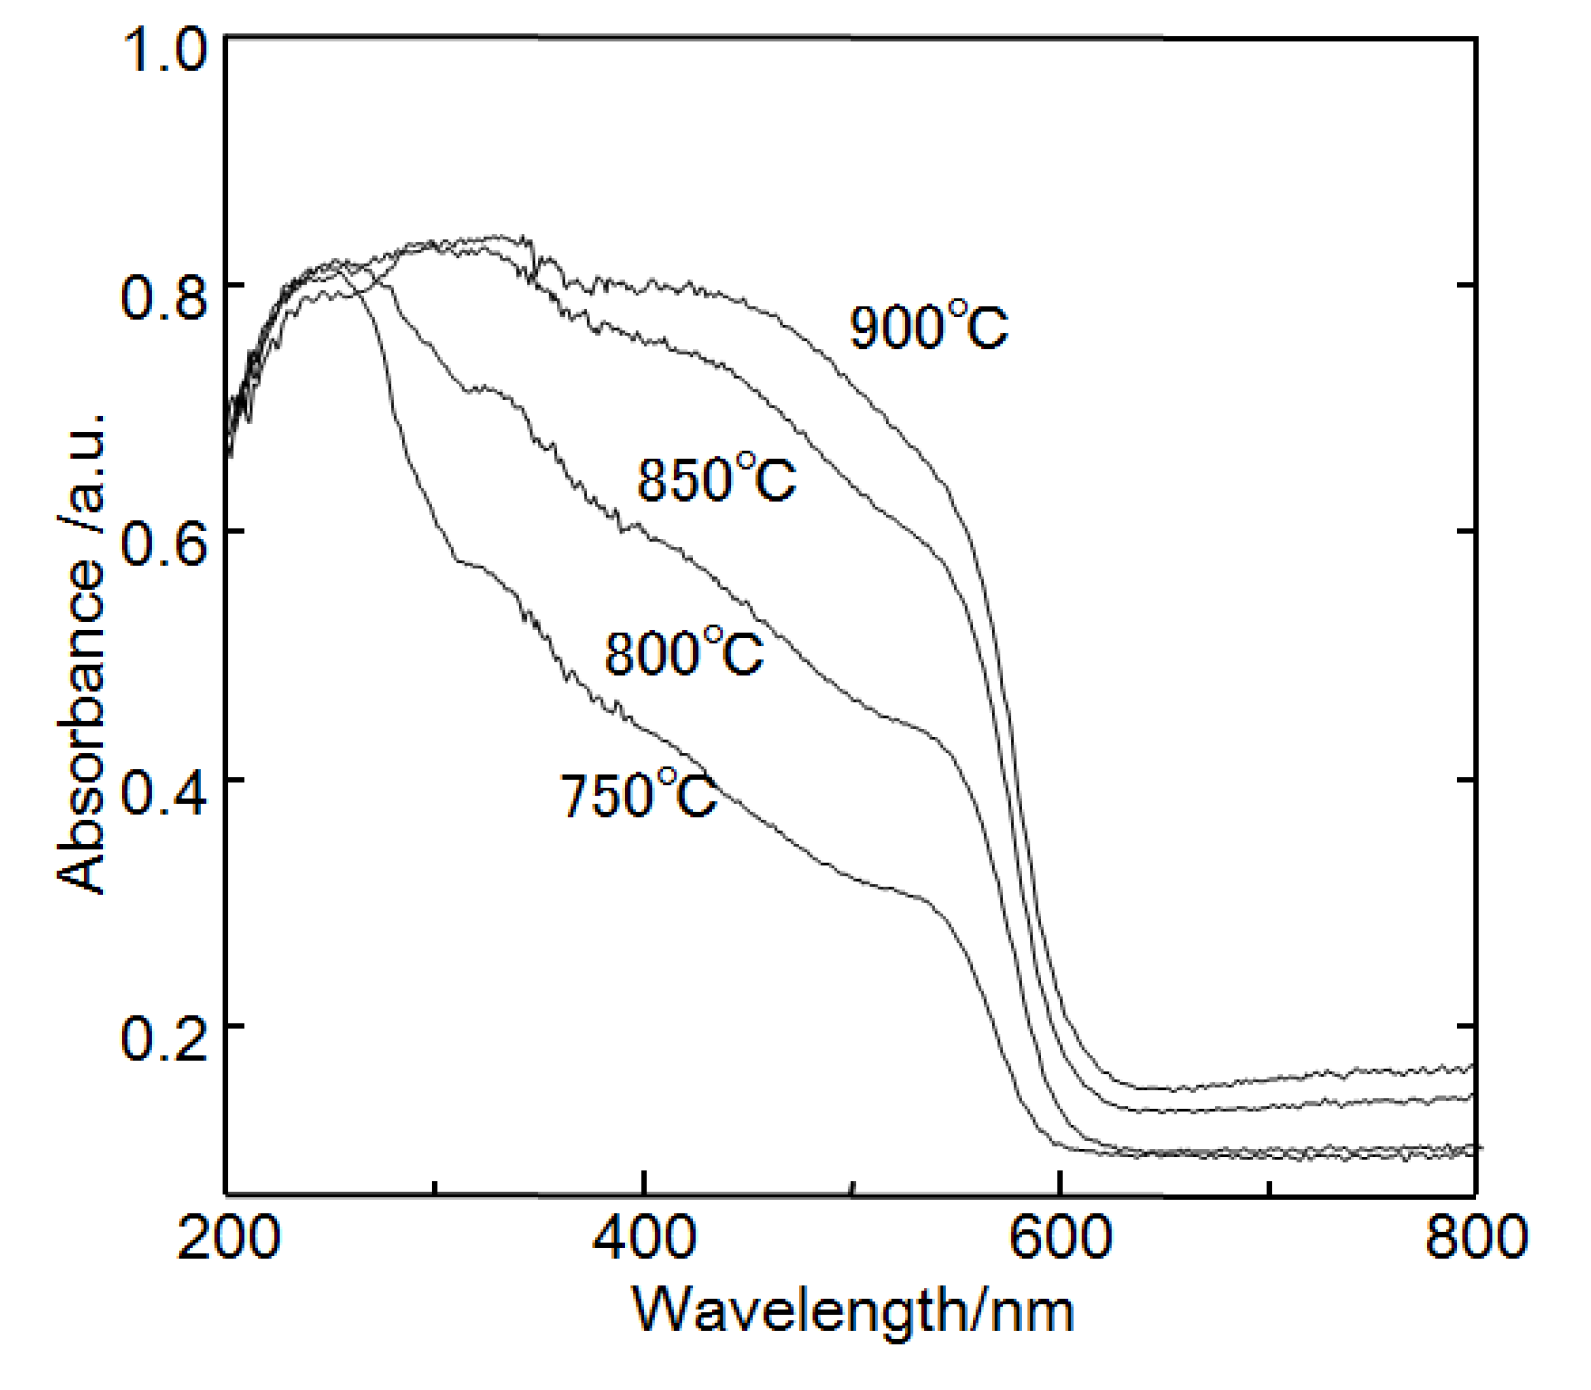
Figure 5 shows diffuse reflectance UV-vis spectra of CsSr
1.5Ba
0.5Ta
3O
10−yN
z prepared at 750–850 °C. They contain two absorption bands: one around 500–600 nm and the other around 300–500 nm. The first absorption is due to excitation from the N 2p orbital to the Ta 5d orbital, while the second absorption band corresponds to excitation from the O 2p orbital to the Ta 5d orbital. CsSr
1.5Ba
0.5Ta
3O
10−yN
z prepared at 850 °C had the strongest absorption band in the visible light region in three samples. The ratio of nitrogen to oxygen in the nanosheet powder was around 3%. The chemical composition was Sr
1.5Ba
0.5Ta
3O
9.6N
0.3. The ratio of nitrogen to oxygen in the nanosheet prepared from the layered compound calcinated at 850 °C was higher than that calcinated at 800 °C. The ratio of nitrogen to oxygen might be related to the photocatalytic activity under visible light irradiation.
Figure 5.
Diffuse reflectance ultra-violet (UV)-vis absorption spectra of CsSr1.5Ba0.5Ta3O10−yNz prepared at 750–900 °C.
Figure 5.
Diffuse reflectance ultra-violet (UV)-vis absorption spectra of CsSr1.5Ba0.5Ta3O10−yNz prepared at 750–900 °C.
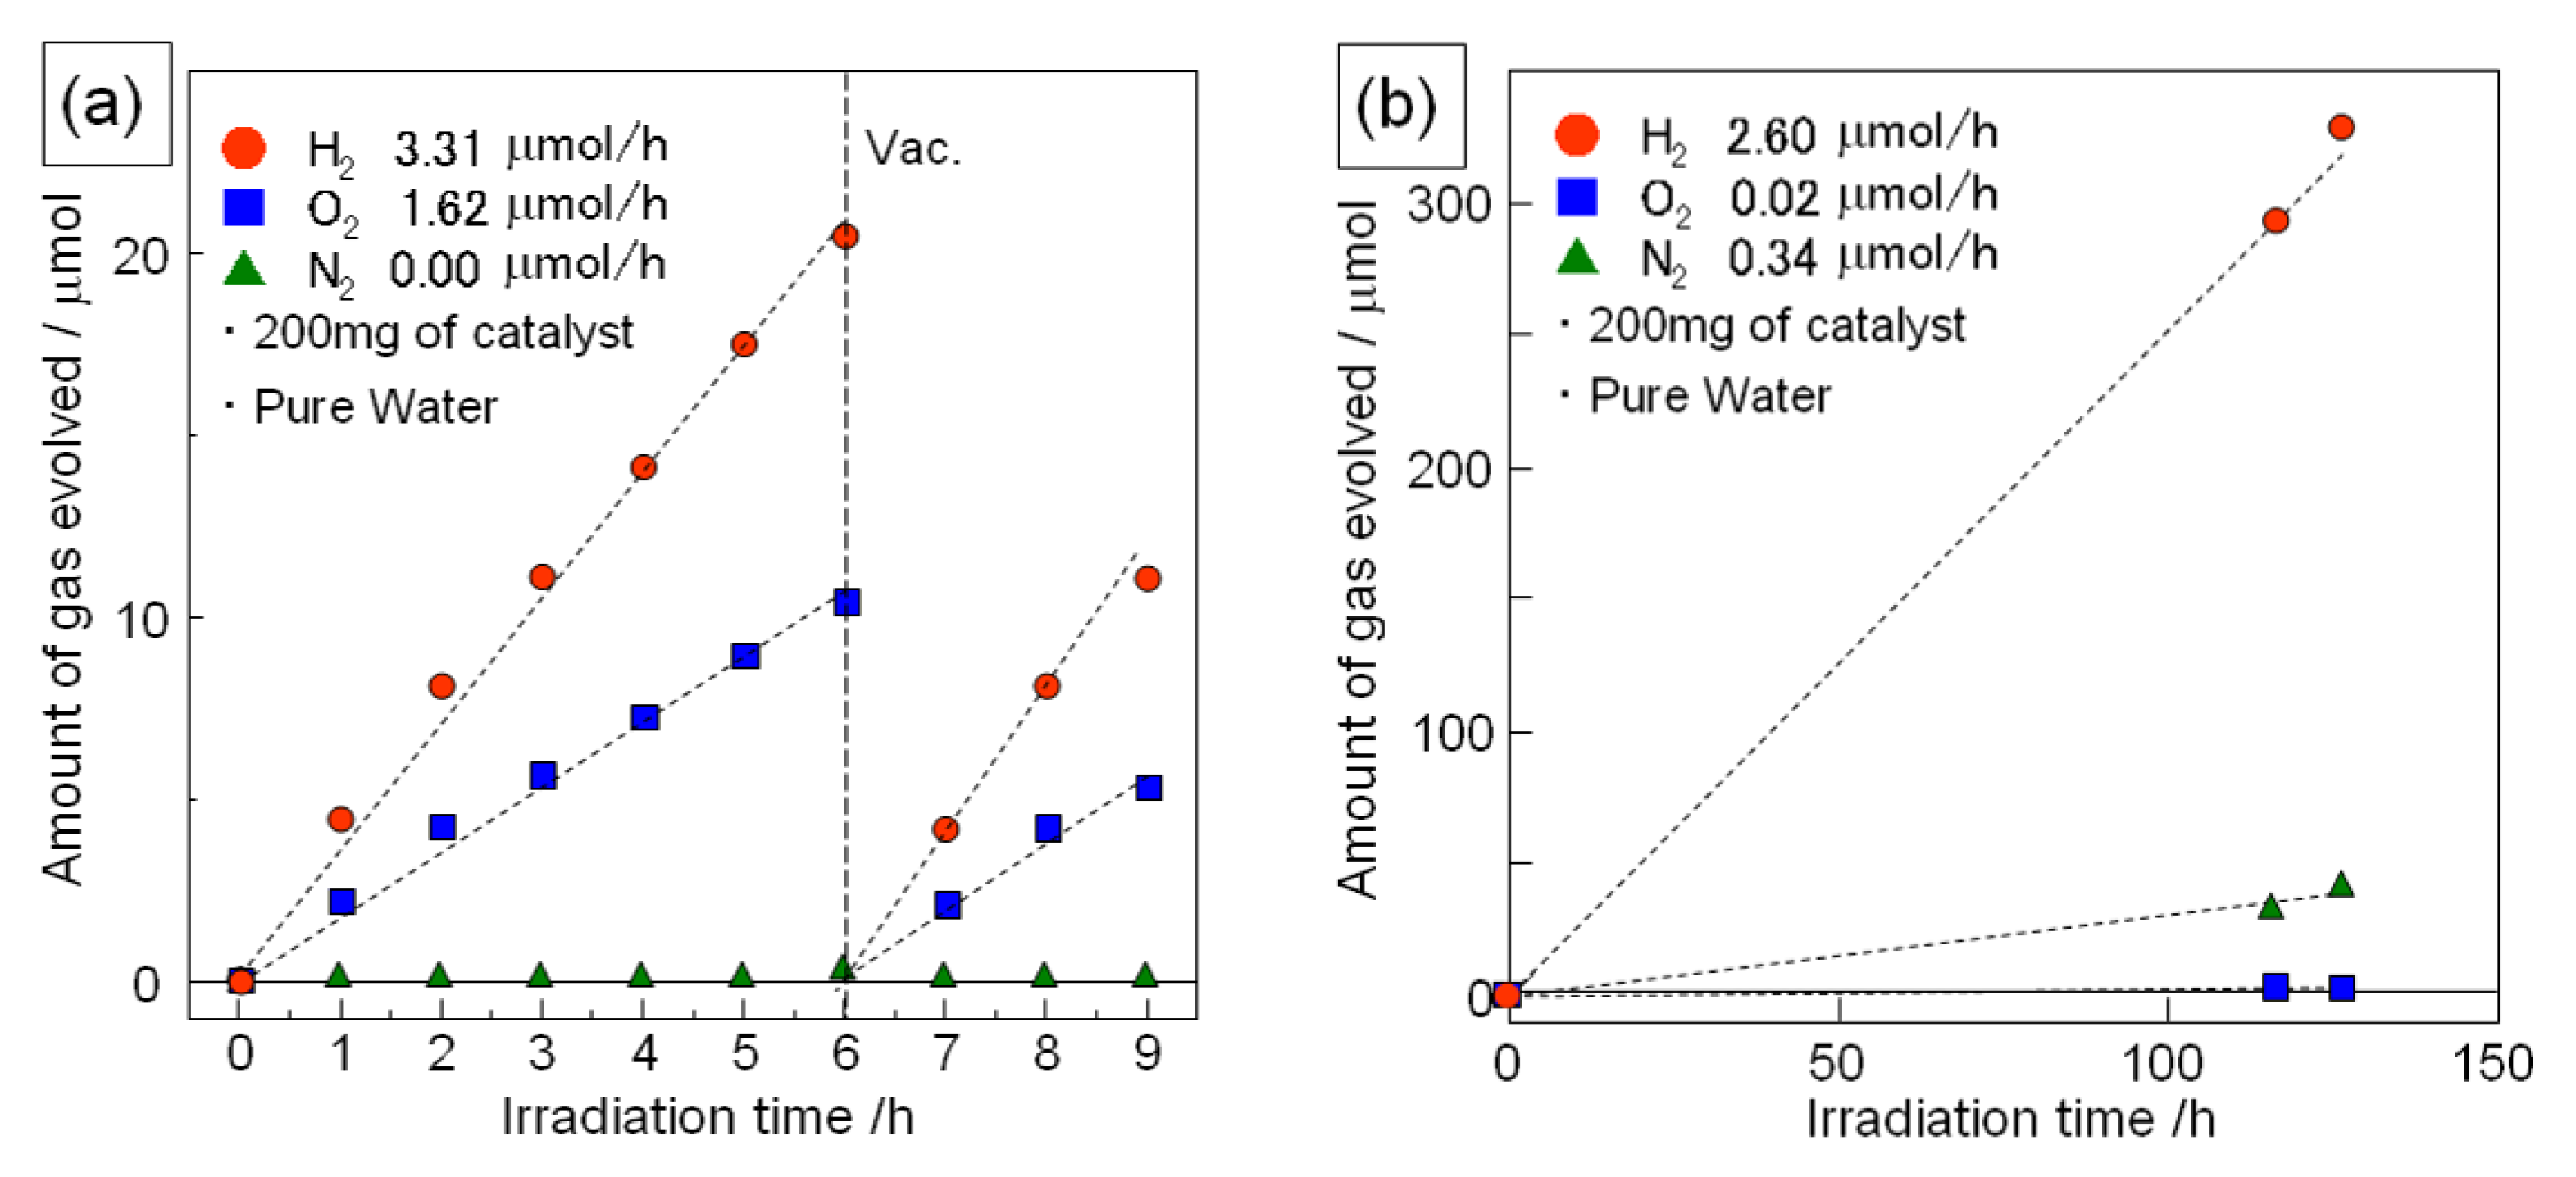
Figure 6 shows the photocatalytic activity for water splitting over Sr
1.5Ba
0.5Ta
3O
9.6N
0.3 (nanosheet) and H-Sr
1.5Ba
0.5Ta
3O
9.6N
0.3 (protonated layered compound)
. The chemical composition of the nanosheet sample was almost the same as that of the protonated layered compound. As the co-catalyst, Rh (0.15 wt.%) was loaded on the catalyst. In the case of the nanosheet sample, both oxygen and hydrogen were generated and the slopes for the amounts of hydrogen and oxygen evolved from the reaction remained constant during the reaction. The ratio of hydrogen to oxygen evolved was around 2:1. These results indicate that the Rh-loaded Sr
1.5Ba
0.5Ta
3O
9.6N
0.3 nanosheet is a potential catalyst for the photocatalytic splitting of water into hydrogen and oxygen. In the case of Rh-loaded H-Sr
1.5Ba
0.5Ta
3O
9.6N
0.3 (protonated layered compound), hydrogen was generated from pure water, however there was no oxygen generated from this system. In contrast, nitrogen was detected from this system. This nitrogen might be due to decomposition of the H-Sr
1.5Ba
0.5Ta
3O
9.6N
0.3 during the photocatalytic reaction, which is currently being investigated.
Figure 6.
Time course of photocatalytic hydrogen and oxygen generation from pure water under irradiation (full arc of 500 W Xe lamp); (a) Rh (0.15wt.%) loaded Ca1.5Ba0.5Ta3O9.6N0.3 nanosheets and (b) Rh (0.15 wt.%) loaded H-Ca1.5Ba0.5Ta3O9.6N0.3.
Figure 6.
Time course of photocatalytic hydrogen and oxygen generation from pure water under irradiation (full arc of 500 W Xe lamp); (a) Rh (0.15wt.%) loaded Ca1.5Ba0.5Ta3O9.6N0.3 nanosheets and (b) Rh (0.15 wt.%) loaded H-Ca1.5Ba0.5Ta3O9.6N0.3.
3. Experimental Section
The parent layered oxides (CsSr
2−xBa
xTa
3O
10) were prepared from CsCO
3 (95.0% Wako), Sr(OOCCH
3)
2·H
2O (99.0% Wako), Ba(OOCCH
3)
2·H
2O (99.0% Wako) and Ta
2O
5 (99.9% Wako), according to the literature [
20]. The mixture of these reagents was calcinated at 1000 °C for 10 h. An excess of alkali metal carbonate (50 mol.%) was added to compensate for the loss due to volatilization of the alkali component. The parent layered oxide prepared was converted into the layered oxynitride, CsSr
2−xBa
xO
10−yN
z by calcination at 800 °C under NH
3 flow (100 mL/min) for 6 h. The Cs ions in the layered compounds were exchanged with protons by acid exchange with 3 M HCl solution for a week. After proton exchange, the powder was washed in several changes of water by centrifugation. The protonated form (1.0 g) was stirred in 100 mL of a 1.0 M ethylamine (EA) aqueous solution to intercalate the EA into the interlayer for 5 days. The EA-intercalated layered compounds (1.0 g) was stirred for one week in 150 mL of a 0.025 M tetrabutylammonium hydroxide (TBAOH) aqueous solution to exfoliate into nanosheets. The separation of unexfoliated power was performed by spontaneous precipitation for 1 day, and the supernatant was used as a nanosheet suspension. The nanosheet concentration was calculated from the powder obtained by drying the nanosheet suspension at 500 °C. The nanosheet suspension had a concentration of about 2.0 g/L.
A photocatalytic reaction was performed using a conventional closed circulation system. A quartz reaction cell was irradiated by light from an external light source. During the reaction, the suspension was mixed using a magnetic stirring bar. Ar gas (initial pressure: 18.3 kPa) was used as the circulating carrier gas. The amounts of H2 and O2 formed were measured by gas chromatography, which was connected to a conventional volumetric circulating line by a vacuum pump. 200 mL of water or 20 vol.% methanol aqueous solution was used as the reaction solution. The amounts of catalyst were 200 or 10 mg. Co-catalysts were photodeposited on nanosheets in 20 vol.% methanol aqueous solution (100 mL of nanosheet suspension, 40 mL of methanol, 30 mL of water) containing RhCl3·3H2O (99.5%, Wako) by irradiation with the 500 W Xe lamp for 12 h. The loading amount was adjusted by changing the amount of RhCl3·3H2O. After loading the co-catalyst, a cellophane tube filled with 0.01 M H2SO4 aqueous solution was immersed in the nanosheet suspension while stirring constantly. This resulted in nanosheet deposition due to proton absorption. The deposited nanosheets were washed in several changes of water by centrifugation to remove residual TBAOH. The nanosheet paste obtained by centrifugation was used without drying for photocatalytic activity evaluations. In the case of the photocatalytic hydrogen evolution test from methanol aqueous solution, the photocatalytic activity was evaluated using the nanosheet suspension used for loading the co-catalyst without any change.
The crystal structure was analyzed by X-ray powder diffraction (Cu Kα radiation; RINT-2500, Rigaku, Tokyo, Japan). The oxygen-to-nitrogen ratio was determined by a HNO analyzer (EMGA-930, Horiba, Kyoto, Japan). UV-vis absorption spectra were obtained by a reflection method using a spectrophotometer (U-3310, HITACHI, Tokyo, Japan) with an integrating sphere. The thickness of the exfoliated nanosheets was measured by atomic force microscopy (AFM) (Nano-cute, Seiko Instruments Inc., Chiba, Japan). The H2, O2 and N2 gases generated in the photocatalytic reaction were measured by a gas chromatography with a thermal conductivity detector (GC-8A, Shimadzu Corp., Kyoto, Japan). 500 W Xe-lamp (SX-UI500XQ, USHIO, Tokyo, Japan) was used as a light source for the photocatalytic reaction.


